Abstract
The high cost of platinum (Pt) catalysts impedes the widespread commercialization of proton exchange membrane fuel cells (PEMFCs). Reducing Pt loading will increase local oxygen transport resistance () and decrease performance. Due to the oxygen transport resistance, the reactants in the cathode catalyst layer (CCL) are not evenly distributed. The gradient structure can cooperate with the unevenly distributed reactants in CL to enhance the Pt utilization. In this work, a one-dimensional gradient CCL model considering is established, and the optimal gradient structure is optimized by combining the artificial neural network (ANN) model and the genetic algorithm (GA). The optimal structure parameters of non-gradient CCL are lCL equal to 8.86 μm, rC equal to 36.82 nm, and I/C equal to 0.48, with the objective of maximum current density (Imax); lCL equal to 4.24 μm, rC equal to 36.60 nm, and I/C equal to 0.76, with the objective of maximum power density (Pmax). For the gradient CCL, the best gradient distribution enables Pt loading to increase from the membrane (MEM) side to the gas diffusion layer (GDL) side and the ionomer volume fraction to decrease from the MEM side to the GDL side.
1. Introduction
Depending on electrochemical reactions between hydrogen as the fuel and oxygen as the oxidant, the proton exchange membrane fuel cell (PEMFC) represents an advanced energy conversion device, exhibiting high energy conversion efficiency, substantial power density, and environment friendly emissions [1,2,3,4,5]. Because of these advantages, its application in the automotive field shows promising prospects [6,7]. The prohibitive cost of platinum (Pt) catalysts presents a critical challenge for PEMFCs’ large-scale market application, prompting studies focusing on optimizing Pt utilization in recent years [8,9,10,11]. However, decreasing Pt loading in the CCL raises local oxygen transport resistance () and creates an oxygen concentration gradient along the thickness of the CCL. The heterogeneity in reactant distribution promotes non-uniform electrochemical activity within the CCL, leading to the underutilization of Pt nanoparticles [12,13,14,15]. In order to address the oxygen concentration gradient within the CCL, the implementation of a gradient-structured design offers a viable approach to optimizing Pt utilization, which enables the reduction of Pt loading and the achievement of cost-effectiveness, without compromising output performance [16,17].
A PEMFC consists of gas channels (GCs), gas diffusion layers (GDLs), catalyst layers (CLs), and a proton exchange membrane (MEM). The CL is the essential component of a PEMFC, which is composed of carbon support, ionomer, pore, and Pt particles [18,19]. In recent years, the combination of the gradient distribution of the ionomer and Pt loading along the through-plane direction of the CL has been proven to compensate for the uneven distribution of the electrochemical reaction rate in the CL [20,21,22,23]. As for the gradient distribution of the ionomer, researchers believe that a higher ionomer near the MEM can reduce the proton conduction resistance, while a lower ionomer (higher porosity) at the GDL can improve the oxygen transport process [24]. Xie et al. [17] found that the maximum current density (Imax) of the three-layer CL (the ionomer content of each layer is 40%/30%/20%, respectively) increased by about 20% compared with the results for the traditional uniformly distributed single-layer CL (30%). Kim et al. [25] found that using a double-layer CL structure (the ionomer content of each layer is 33%/23%) can increase the Imax by about 10%. Shahgaldi et al. [16] found that using the double-layer CL structure can increase the Pmax by 13% and the Pt utilization by 15%. Wang et al. [26] demonstrated that the Pmax of CLs with ionomer content increasing from the GDL side to the MEM side was about 50% higher than that of the reverse gradient distribution.
For the Pt loading gradient, there is no consensus on how the gradient distribution of Pt loading optimizes the transport performance of PEMFCs. Most experimental studies [27,28,29,30,31] have found that more Pt loading on the MEM side can enhance the output performance. However, some numerical simulations [32,33,34] have found that more Pt loading at the GDL side can enhance PEMFC performance. Taylor et al. [29] created a kind of gradient CL structure with a Pt loading gradient in which the higher Pt loading was located near the MEM side. This gradient CL achieved a performance enhancement of about 21.8% compared with that of the traditional CL. Antoine et al. [35] found that when the oxygen diffusivity is dominant, the higher Pt loading close to the GDL side will provide better performance. Once proton transport is predominant, the higher Pt loading close to the MEM side will provide better performance. Matsuda et al. [36] demonstrated that optimal Pt distribution near the GDL involves increasing Pt loading under high relative humidity and decreasing it under low relative humidity.
A gradient structure design integrating gradient distributions of both ionomer content and Pt loading is proposed for enhanced transport properties within CL. Su et al. [18] compared three CLs with different structures, i.e., traditional single layer, traditional double layer (only ionomer content gradient), and novel double layer (both ionomer content and Pt loading gradient). At an operating voltage of 0.6 V, the novel double-layer CL exhibited current density improvements of 35.9% and 24.8%, respectively, compared to the levels for conventional single-layer and double-layer configurations. Chen et al. [21] designed a double-layer CL with double gradient distributions of ionomer content and Pt loading, achieving power density increases of 38.4% and 135.7%, respectively, under high-humidity and low-humidity conditions compared to the results for traditional single-layer structures. Based on numerical studies, Ling et al. [33] demonstrated strong correlation between the optimal gradient distributions of ionomer content and Pt loading in the CL and the operational current density.
Although gradient structures have demonstrated effectiveness in enhancing PEMFC performance, existing research lacks a theoretical basis to guide its design and quantify the structure–performance relationship in gradient CCL. Specifically, the optimal coordination of ionomer content and Pt loading gradients remains unresolved. To elucidate the effects of CL structural parameters on the performance of PEMFCs, we developed a one-dimensional model for gradient CLs that incorporates a local oxygen transport resistance model, enabling a systematic analysis of how structural parameters influence PEMFC performance. The structure–performance relationship is obtained via a data-driven model based on the artificial neural network (ANN) model, and finally, the optimal structural parameters of non-gradient CCL and gradient CCL are determined by a genetic algorithm (GA).
2. Materials and Methods
Figure 1a shows the schematic of a typical PEMFC, including the MEM, AGC/CGC (anode and cathode gas channel), AGDL/CGDL (anode and cathode gas diffusion layer), and ACL/CCL (anode and cathode catalyst layer). In this work, we investigate the structure–performance relationship and optimization of gradient CLs by developing a one-dimensional CCL model that incorporates oxygen transport processes from the CCL/CGDL interface to the Pt surface, while accounting for local oxygen transport resistance. The proton and electron are conducted to the Pt surface by the ionomer film and carbon skeleton, respectively [37,38].
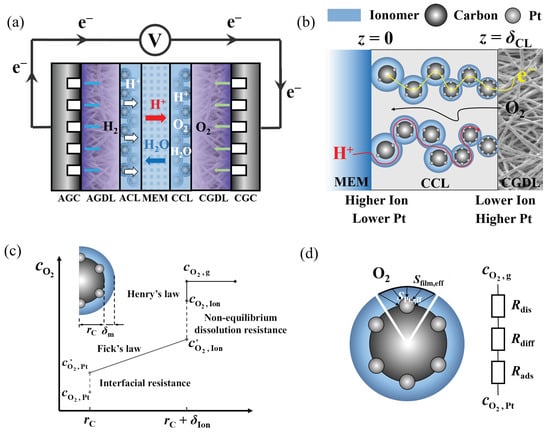
Figure 1.
Schematic of (a) a typical PEMFC; (b) a gradient CCL (including the negative gradient ionomer content and positive Pt loading); (c) the oxygen concentration profile near a catalyst particle; (d) local oxygen transport resistance on a Pt/C particle.
2.1. Assumptions
- The PEMFC is functioning under a steady-state operating condition.
- For oxygen and the electrons, the membrane is impermeable.
- The oxygen is regarded as an ideal gas.
- The Pt nanoparticles demonstrate homogeneous dispersion across the surface of the carbon particles.
- There is no bare carbon particle in CL.
- We neglect the effects of gravity for simplicity.
2.2. Governing Equations
In this work, the RH value of the PEMFC is set below 100%, and we thus ignore the transport of liquid water in the CLs. Given the electronic conductivity’s two-order-of-magnitude superiority over proton conductivity, electron transport resistance can be negligible [39]. Therefore, we only solve two governing equations to obtain the output performance of CLs: the oxygen transport equation and the overpotential equation, which are written as follows:
where (m2 s−1) is the effective diffusivity of oxygen in the CCL; (mol m−3) is the oxygen concentration in the CL pore; κeff (S m−1) is the effective protonic conductivity; η(V) is the overpotential of CCL; F is the Faraday constant (96,485 C mol−1); jc (A m−3) is the volumetric current density, which is determined using the oxygen transport model shown in Figure 1.
As shown in Figure 1b, the MEM/CCL interface is set at z = 0, while the CCL/CGDL interface is set at z = δCL (δCL is the thickness of the catalyst layer.). At z = 0, the oxygen diffuses through the entire cathode CL and participates in the oxygen reduction reaction (ORR). At z = δCL, a constant oxygen concentration of (mol m−3) is obtained; at z = 0, the MEM is impermeable for oxygen, and thus, the boundary conditions are written as follows:
where Icell (A m−2) is the current density of a single cell.
Based on the Butler–Volmer equation, we can deduce the volumetric current density in the source term of the governing equation by combining the following equations:
where kr, (m s−1) is the reaction rate coefficient per unit specific surface area of oxygen reduction reaction (ORR); APt (m2 m−3) is the volumetric catalyst effective reaction area; (mol m−3) is the oxygen concentration on the Pt surface. kr and , respectively, can be calculated by following equation:
where (A m−2) is the reference exchange current density of the cathode; (mol m−3) is the reference oxygen concentration of the cathode; αc is the cathode transfer coefficient; is the distribution coefficient of oxygen in the ionomer; (s m−1) is the local oxygen transport resistance. The oxygen concentration on the surface of the Pt nanoparticles is affected by .
After the overpotential is obtained by solving the governing equation, the output voltage of the PEMFC is calculated using the following equation:
where Ener (V) is the Nernst voltage of the PEMFC; ηohm,MEM (V) is the ohmic loss of the membrane; and ηrev (V) is the reversible loss. For obtaining the relationship between the and CL structure parameters, a local oxygen transport resistance model is established in this work.
2.3. Local Oxygen Transport Resistance Model
Oxygen diffuses from the CL pores to the Pt nanoparticle surfaces, necessitating prior absorption into the ionomer membrane, as shown in Figure 1c. According to Henry’s law, the equilibrium concentration of oxygen in the ionomer is given as follows:
where (mol m−3) is the equilibrium concentration of oxygen in the ionomer. At the pore/ionomer interface, a non-equilibrium dissolution resistance (Rdis) (s m−1) exists due to the restricted oxygen dissolution rate. The process of the dissolution of oxygen into the ionomer film is depicted by following equation:
where (mol m−3) is the non-equilibrium concentration of oxygen in the ionomer, and (mol m−2 s−1) is the oxygen flux in a Pt/C particle (; aC is the area of the ionomer film covered by Pt/C particles per unit volume of the CL).
After the oxygen dissolves into the ionomer film, the oxygen diffusion in the ionomer film is regarded as a one-dimensional Fick’s law process, which can be depicted by the following:
where Rdiff (s m−1) is the oxygen diffusion resistance in the ionomer film, (m2 s−1) is the oxygen diffusivity in the ionomer, δIon(m) is the thickness of the ionomer film, and (mol m−3) is the oxygen concentration near the surface of the Pt nanoparticle.
Due to an adsorption resistance at the ionomer/Pt interface (Rads) (s m−1), the oxygen concentration adsorbed to the surface of the Pt nanoparticle for reaction () is less than . The reason why the Rads exists is that the Pt nanoparticles are adsorbed by sulfonate ions at the Pt/ionomer surface, which will decrease the effective Pt surface electrochemical area and the oxygen permeability. The adsorption process of oxygen can be written as follows:
Combining Equations (9)–(13), we can describe the diffusion of oxygen from the CL pores to the surface of the Pt nanoparticles as follows:
As shown in Figure 1d, the average effective diffusion length should be longer than the thickness of the ionomer film. In addition, the Rads should also be revised as the flux is scaled to the ionomer surface. For revising the diffusion length and the Rads, we define the correction coefficient (β), the ratio of the effective ionomer film area covered by a Pt nanoparticle to the surface area of a Pt nanoparticle, which can be written as follows:
where rC(m) is the radius of the carbon particle, rPt(m) is the radius of a Pt nanoparticle, and nPt is the number of Pt nanoparticles in a Pt/C particle. Therefore, Equation (14) can be revised as follows:
At the limiting current density (I = Imax, ), the oxygen transport resistance of CCL can be obtained by the following:
where (mol m−2 s−1) is the oxygen flux of CCL (). Combining Equations (16) and (17), we can deduce the following equation:
According to the definition of the correction coefficient (β), we derive the relationship between aCδCL and β as follows:
where fPt is roughness factor of Pt (fPt = 10mPtaECSA). Combining Equations (18) and (19), we can deduce the as follows:

Table 1.
Input parameters [40,41,42,43].
Table 2.
Other model parameters [44,45,46,47].
2.4. Gradient Structure
In the CCL, the gradient components can be the Pt loading and the ionomer, as shown in Figure 1b. The gradients of Pt loading (mPt) and the volume fraction of the ionomer (ω) are shown in Equations (21) and (22):
where mPt,avg (kg m−2) is the average Pt loading, ωavg is the average volume fraction of the ionomer, and z’ = z/lCL is the dimensionless position in the CL (ranging from 0 to 1). KPt and KIo are the dimensionless gradient degrees of the Pt and the ionomer. From the above definition, the positive (negative) gradients mean that the values are increasing (decreasing) in the direction from the MEM to GDL.
2.5. Model Validation
To validate the credibility of the model, both PEMFC performance and oxygen transport resistance are compared with the experimental data [48,49,50]. We keep the model parameters consistent with the experimental conditions. For PEMFC performance, the cathode inlet gas maintains fully saturated humidity (100% RH) at an operational temperature of 80 °C and an inlet pressure of 150 kPa. The I/C ratio and MEM thickness are 0.95 and 18 μm, respectively. In the model of this work, the material of the proton exchange membrane is Nafion, but the experimental data used for model verification is based on the Gore membrane. The Gore membrane is a reinforced membrane. As a reinforced membrane, the proton conductivity and membrane water content of the Gore membrane are different from those of the Nafion membrane. To consider the influence produced by the difference between the two, we calculated the water content and proton conductivity of the Gore membrane under the corresponding water activity, according to Equations (23) and (24), as suggested by Ref. [51]:
In this work, MEM is considered as a resistor, with a resistance value of Rmem, and Rmem is calculated by the following equation:
Rmem is considered in the expression of the ohmic loss of the membrane, which is written as follows:
Figure 2a compares the polarization curves of the model against the experimental data from Ref. [48] at three Pt loadings of 0.05, 0.1, and 0.2 mg cm−2, whose maximum error between the model performance and the experimental data is 2.12%, 1.73%, and 1.85%, respectively. For the oxygen transport resistance, the precision of the proposed model across varying Pt loadings is verified using two independent experimental datasets from Kongkanand et al. [49] and Sakai et al. [50], as shown in Figure 2b. The comparisons show a maximum discrepancy of 6.82% between the simulation results and the experimental data. The concordance between the model results and the experimental results validates the accuracy of the developed model.
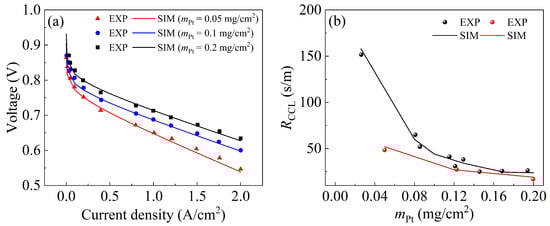
Figure 2.
Validation of the present model. (a) Comparisons of the output performance between the numerical model and experimental data [48]; (b) comparisons of the local oxygen transport resistances with experimental data [49,50].
2.6. Data-Driven Model
The artificial neural network (ANN) model is a data-driven model that can quickly predict performance for different CL structure parameters. In this work, the ANN model and a genetic algorithm (GA) are combined to optimize CCL structure parameters, with the objective of optimization (Imax and Pmax). As shown in Figure 3, different combinations of CCL structural parameters are employed as the populations are imported to the ANN model in order to predict their performance. According to the performance of different individuals in the population, the populations need to go through the process of selection, crossover, and mutation, and new populations are generated until the end of evolution to obtain the optimal result.
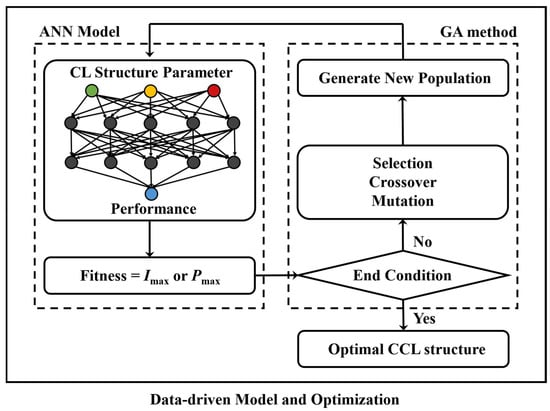
Figure 3.
Schematic of the optimization process combining the artificial neural network (ANN) model and a genetic algorithm (GA).
The dataset used to train the ANN model is divided into a train set and a test set in a 7:3 ratio. The train set is employed to develop the ANN model, while the test set evaluates the model’s predictive performance regarding conditions not included in the train set. The input and output dimensions of the ANN model depend on the optimization requirements. The ANN model comprises two hidden layers with 50 nodes, the model learning rate is 0.01, the optimizer uses an adaptive moment estimation (ADAM) algorithm, the tanh function is used as the activation function, and the loss function uses the mean square error function. The initial population of the GA is 1000, and the evolution ends at 450 generations. The simulated evolutionary genetic algorithm with enhanced elite preservation strategy (SEGA) is specifically employed in this study.
3. Results
In this work, the three non-gradient parameters (lCL, rC, I/C) of the non-gradient CCL are optimized for Imax and Pmax, respectively. In order to improve the performance of the PEMFC at low Pt loading, the Pt loading of the non-gradient CCL is set to 0.05 mg cm−2. Based on the value ranges of the three non-gradient parameters in Table 3, the dataset includes 215 samples, which are divided into a train set and a test set for training the ANN model. For the ANN model, the input dimension is 3, and the output dimension is 1. After 2000 trainings, the error of the ANN model is shown in Figure 4. Figure 4a,b shows the error of the ANN model in the train set, and Figure 4c,d shows its error in the test set, all of which are lower than 5%. Therefore, the ANN model can predict the performance of the PEMFC under the three non-gradient parameters, with reliable accuracy.
Table 3.
The range of three structural parameters.
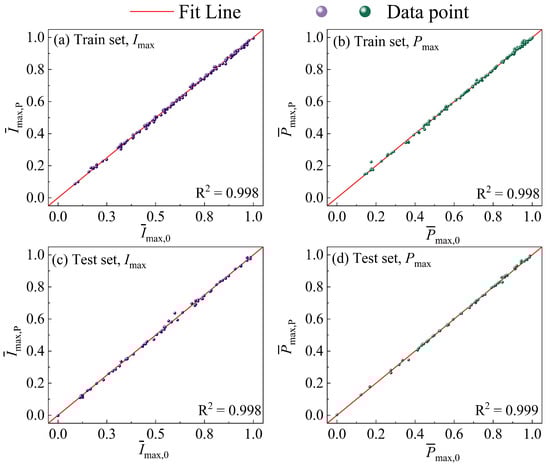
Figure 4.
The comparison of the original data and prediction results in (a) train set, Imax; (b) train set, Pmax; (c) test set, Imax; (d) test set, Pmax.
We combined the ANN model and GA, according to the results of Figure 3, to optimize the non-gradient parameters of the CL, with the objective of obtaining the Imax and Pmax, respectively. During the GA optimization process, the three non-gradient parameters of the populations need to meet the value range in Table 3, along with the porosity constraint. In the genetic algorithm, the parameters of some individuals in the population will cause the CL porosity to be less than 0 in the model. Porosity constraints can avoid this situation. The optimization objectives and constraints are as follows:
where εC is the volume fraction of the carbon particles. By combining the ANN model and the GA, we obtained the optimal non-gradient parameter combinations of the non-gradient CCL targeting Imax and Pmax, respectively, which are listed in Table 4; the corresponding polarization curves are shown in Figure 5. In the optimal parameters for Imax, the thicker CCL holds more pore space to transfer oxygen, and the larger carbon particles and lower I/C result in a thinner ionomer film covering each carbon particle. These will reduce the RCCL, thus increasing the Imax. In the optimal parameters obtained for Pmax, the thinner CCL will shorten the path of proton and oxygen transfer to the surface of the Pt nanoparticles, the smaller carbon particles allow pore space for oxygen transfer, and a relatively high I/C can reduce the ohmic loss of CCL (ηohm,CCL). All of these will reduce the voltage loss of CCL and increase the Pmax.
Table 4.
The optimal results for non-gradient CCL.
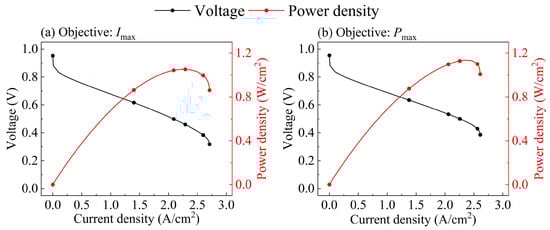
Figure 5.
The polarization curves of optimal non-gradient CCL for (a) Imax and (b) Pmax.
We compare the optimal parameter combination to the typical 60 data points in the dataset. For Imax, the main influence factor related to the three non-gradient parameters (lCL, rC, I/C) is the oxygen transfer resistance. Imax increases and then decreases as the three non-gradient parameters (lCL, rC, I/C) increase, as shown in Figure 6a–c. When the CL becomes thinner, εC and ω are relatively larger, the porosity for oxygen transfer is lower, and the RCCL will increase. When the CL becomes thicker, the oxygen transport distance becomes longer, and the RCCL increases. We use Pt/C to describe the effect of the diameter of the carbon particle more directly, which can be calculated by the following:
where nC is the number of carbon particles. There are approximately 2 × 10²¹ carbon particles per unit volume of CL in this model. Because the Pt loading is fixed and the Pt/C is low, the carbon loading will be higher, thus reducing the CCL porosity. In contrast, there are many Pt nanoparticles on a carbon particle at a higher Pt/C, resulting in a decrease in the oxygen flux allocated to each Pt nanoparticles and an increase in . With the increase in I/C, the proton transport resistance will be large, which affects the proton transfer to the Pt surface. As I/C decreases, the ionomer film covering the surface of the carbon particles is thicker, which increases the . Figure 6d shows that the Imax of the optimal parameter combination is significantly improved by 7.3% compared to the results for the dataset.
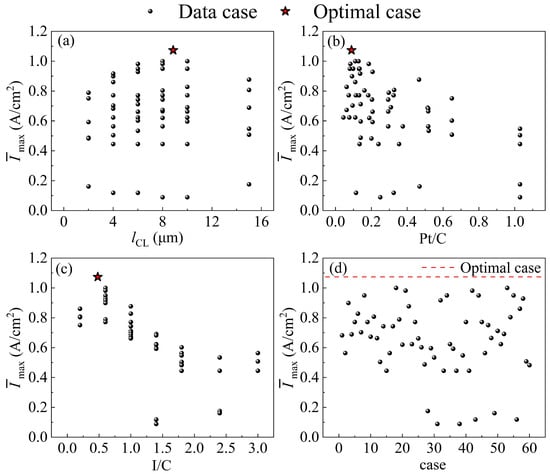
Figure 6.
Comparison of dimensionless Imax at the optimal levels and the dataset for (a) lCL; (b) Pt/C; (c) I/C; (d) case. (Dimensionless Imax: each Imax is divided by the largest Imax in the dataset.).
For Pmax, the main influencing factor related to the three non-gradient parameters (lCL, rC, I/C) is the voltage loss, ηohm,CCL, and the concentration loss, ηconc. Pmax also increases and then decreases as the three non-gradient parameters (lCL, rC, I/C) increase, as shown in Figure 7a–c. With the increase in CL thickness, the CL porosity will decrease, and the ηconc will increase. In contrast, the proton transport distance becomes longer, and the ηohm,CCL increases. The ηconc increases due to the fact that the porosity of CL will be reduced, and the volume fraction of the ionomer will be increased, while the Pt/C is low (the carbon loading is high). When the Pt/C is high (the carbon loading is low), the volume fraction of the ionomer is small, and the ηohm,CCL increases. The effective proton conductivity decreases, the proton transport resistance increases, and the ηohm,CCL increases at a low I/C. If the I/C is high, the ηconc will increase. Figure 7d shows that the Pmax of the optimal parameter combination is significantly improved by 5.4% compared to the results for the dataset.
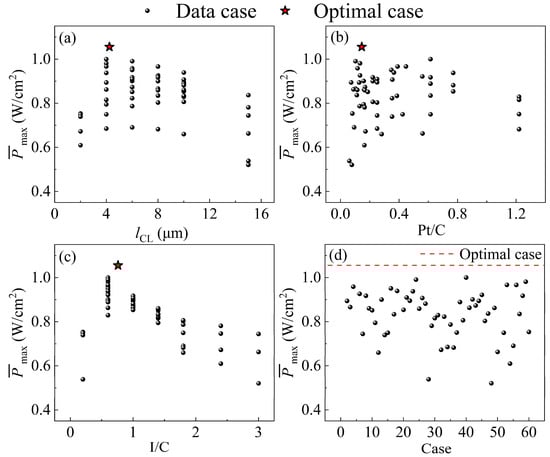
Figure 7.
Comparison of dimensionless Pmax at the optimal levels and the dataset for (a) lCL; (b) Pt/C; (c) I/C; (d) case. (Dimensionless Pmax: each Pmax is divided by the largest Pmax in the dataset.).
Based on the optimal structural parameters of the non-gradient CL obtained by the GA, the gradient parameters of the CL were optimized. In order to study the effect of gradient on performance improvement under different Pt loadings, we created three groups with Pt loadings of 0.05, 0.1, and 0.2 mg cm−2. The gradient CL parameters (KPt, KIo) under these Pt loadings were optimized. Based on the value ranges of the gradient parameters under the three Pt loadings shown in Table 5, 81 sets of data were calculated for each Pt loading to train the ANN model, whose input dimension is 2, and the output dimension is 1. The ANN model and the GA are used to obtain the optimal gradient parameter targeting Imax and Pmax under three Pt loadings, which are listed in Table 6 and Table 7, respectively.
Table 5.
The value range of two gradient parameters.
Table 6.
Comparison of the Imax of the optimal gradient CL and the non-gradient CL under three Pt loadings (0.05, 0.1, 0.2 mg cm−2).
Table 7.
Comparison of the Pmax of the optimal gradient CL and the non-gradient CL under three Pt loadings (0.05, 0.1, 0.2 mg cm−2).
The comparison of the polarization curves of the optimal gradient CL and the non-gradient CL targeting Imax is shown in Figure 8a–c. In Table 4, the optimal gradient distributions under the three Pt loadings show that the Pt loading should have a positive gradient distribution, and the ionomer should have a negative gradient distribution. The Pt loadings uniformly increase from the MEM side to the GDL side, which shortens the oxygen transport distance and reduces the oxygen transport resistance. The ω uniformly decreases from the MEM side to the GDL side, which covers the carbon particles near the GDL side with a thinner ionomer film and reduces the . If the KPt increases, the excess distribution of Pt nanoparticles near the GDL will increase the ohmic loss of CL at low I/C (I/C = 0.55). In contrast, the oxygen transport resistance will increase, while the KPt decreases. With the decrease in KIo, the GDL side, where a large number of Pt nanoparticles are distributed, will lack the necessary ionomers. If the KIo increases, the δIon, covering the carbon particles on the GDL, side increases, leading to an increase in . From Table 6 and Figure 8d, it can be found that although the performance will increase with the increase in mPt, the effect of the gradient CL on the performance improvement will decrease, indicating that the gradient structure has a more significant effect on the improvement in Imax with low mPt.
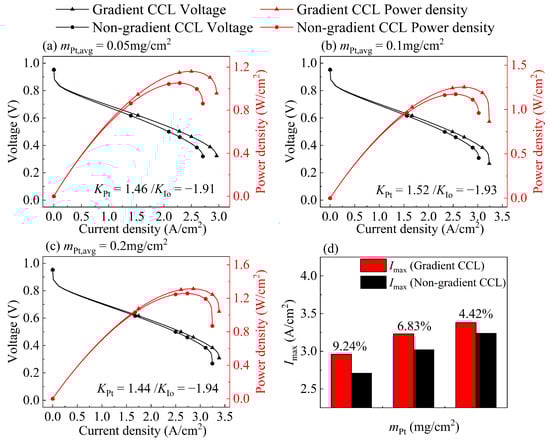
Figure 8.
Comparison between the polarization curve of non-gradient CCL and optimal gradient CCL targeting Imax at (a) mPt, avg = 0.05 mg/cm2, (b) mPt, avg = 0.1 mg/cm2, and (c) mPt, avg = 0.2 mg/cm2; (d) comparison of Imax between non-gradient CCL and optimal gradient CCL at three Pt loadings.
For the optimization results targeting Pmax, the optimal gradient direction in Table 5 under the three Pt loadings is the same as that for the results targeting Imax as shown in Figure 9, but the KPt value is higher than that for the results targeting Imax. This is because the optimal non-gradient parameter targeting Pmax has a higher I/C (I/C = 0.9), which increases the effective proton conductivity, and more Pt nanoparticles can distribute near the GDL side. When there are more ionomers (high I/C) in CL, the ηohm,CCL is relatively small, and the ηconc is dominant. When I/C is high, the proton conductivity is high, and the local oxygen transport resistance is high. Therefore, the ohmic loss is low, and the concentration loss dominates, and vice versa. Consequently, better performance can be obtained by reducing the oxygen transport resistance. If the ηohm,CCL is dominant, decreasing the proton transport resistance is an effective method to improve the performance.
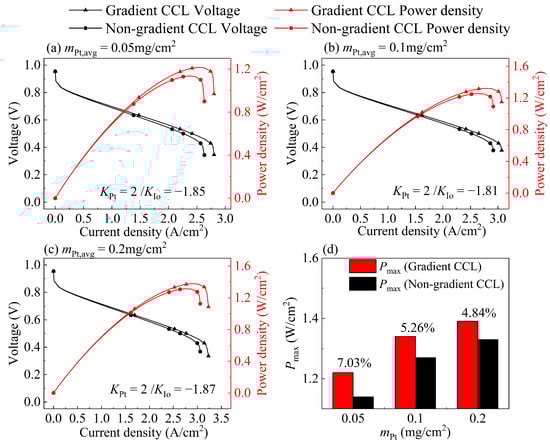
Figure 9.
Comparison between the polarization curve of non-gradient CCL and optimal gradient CCL targeting Pmax at (a) mPt, avg = 0.05 mg/cm2, (b) mPt, avg = 0.1 mg/cm2, and (c) mPt, avg = 0.2 mg/cm2; (d) comparison of Pmax between non-gradient CCL and optimal gradient CCL at three Pt loadings.
The model assumes a continuously variable Pt gradient in the CCL, which is an idealization. In reality, Pt loading gradients are typically discrete (e.g., stepwise changes between layers) due to fabrication constraints. This simplification may overestimate the electrochemically active surface area (ECSA) and underestimate local oxygen transport resistances at the interfaces between discrete Pt regions.
Although it is impossible to prepare continuously distributed gradient CLs in the experiment due to the above reasons, the simulation results in this paper can be used as the design target for gradient catalytic layers. In the future, we can approach theoretical results through advanced manufacturing technologies. In addition, the results of this work not only provide the values of the optimal structural parameters, but also offer theoretical design principles for the gradient CL. When Imax and Pmax are the targets, respectively, we obtain the optimal distribution trends of the Pt gradient and the ionomer gradient. In future work, we will also optimize the CL with multi-layer gradients to determine the optimal parameter combination that is closer to the actual situation.
The optimization results of this work provide theoretical foundations for engineering CCLs and their gradient structure in PEMFC design. Specifically, the developed models enable predictive analysis and enhance overall PEMFC efficiency. In addition to CCL, there are already some studies [52,53,54] demonstrating that the gradient structures of MPL and GDL can enhance performance by improving the expulsion of products and the transport of reactants. Regarding future working directions, we will optimize the structure of other components of PEMFCs. Meanwhile, there are studies [55,56,57,58] indicating that the gradient distribution of mPt and rPt in the CCL can enhance the durability of PEMFCs. Therefore, optimizing the gradient CCL structure, with the objective of durability, by combining ANN models and the GA is also one of our future research goals.
4. Conclusions
In this work, a one-dimensional PEMFC model is constructed to systematically investigate the structure–performance correlations and optimize both the non-gradient structure and the gradient designs of the CCL so as to coordinate these with the proton and oxygen transport processes in fuel cells to achieve the best performance. With the combination of the ANN model and a GA, the following pivotal conclusions are derived:
- The optimal structure of the non-gradient CCL is as follows: lCL equal to 8.86 μm, rC equal to 36.82 nm, and I/C equal to 0.48 to achieve Imax, improving the Imax by 7.3%; lCL equal to 4.24 μm, rC equal to 36.60 nm, and I/C equal to 0.76 to achieve Pmax, improving the Pmax by 5.4%.
- On the basis of the non-gradient optimal structure, the structures of the Pt loading and the ionomer gradient under three Pt loadings are optimized. We find that the optimal gradient distribution to achieve Imax and Pmax is to increase Pt loading from the MEM side to the GDL side and to decrease the ionomer from the MEM side to the GDL side.
- When the mPt is low (0.05 mg cm−2), the gradient CL demonstrates a more significant performance enhancement effect, i.e., Imax increased by 9.24%, and Pmax increased by 7.07%. As mPt increases, the performance improvement in the gradient CCL gradually decreases. Therefore, the gradient design of the CCL is effective in reducing Pt loading for PEMFCs.
Author Contributions
Conceptualization, G.-R.Z. and W.-Z.F.; methodology, G.-R.Z. and W.-Z.F.; software, G.-R.Z., Z.-H.X., and W.-Z.F.; validation, G.-R.Z. and Z.-H.X.; formal analysis, G.-R.Z.; investigation, G.-R.Z. and W.-Z.F.; resources, W.-Z.F. and W.-Q.T.; data curation, G.-R.Z. and W.-Z.F.; writing—original draft preparation, G.-R.Z.; writing—review and editing, G.-R.Z. and W.-Z.F.; visualization, G.-R.Z.; supervision, W.-Z.F. and W.-Q.T.; project administration, W.-Z.F. and W.-Q.T.; funding acquisition, W.-Z.F. and W.-Q.T. All authors have read and agreed to the published version of the manuscript.
Funding
This research was funded by the National Natural Science Foundation of China, grant number No. 52206110.
Data Availability Statement
The original contributions presented in the study are included in the article; further inquiries can be directed to the corresponding author.
Conflicts of Interest
The authors declare no conflicts of interest.
Abbreviations
The following abbreviations are used in this manuscript:
| A | volumetric catalyst effective reaction area, m2 m−3 |
| aECSA | electrochemically active surface area, m2 g−1 |
| c | oxygen concentration, mol m−3 |
| D | diffusivity, m2 s−1 |
| Ener | Nernst voltage of the PEMFC, V |
| F | Faraday constant, 96,485 C mol−1 |
| f | roughness factor |
| I | current density, A m−2 |
| I/C | mass ratio of ionomer to carbon |
| i | current density, A m−2 |
| j | volumetric current density, A m−3 |
| K | distribution coefficient |
| kr | reaction rate coefficient per unit specific surface area, m s−1 |
| l | thickness, m |
| m | mass loading, mg cm−2 |
| N | oxygen molar flux, mol m−2 s−1 |
| n | number |
| Pt/C | mass ratio of platinum to carbon |
| P | power density, W m−2 |
| R | transport resistance, s m−1 or universal gas constant, 8.314 J mol−1 K−1 |
| RH | relative humidity |
| r | radius, m |
| S | area, m2 |
| T | temperature, K |
| Vcell | cell output voltage, V |
| z | z direction |
| Greek | |
| α | charge transfer coefficient |
| β | correction factor |
| δ | thickness, m |
| ε | porosity |
| ρ | density, kg m−3 |
| η | overpotential, V |
| κ | protonic conductivity, S m−1 |
| Superscripts and Subscripts | |
| ads | adsorption |
| C | carbon particle |
| CL | catalyst layer |
| c | cathode |
| diff | diffusion |
| dis | dissolution |
| eq | equivalent |
| eff | effective |
| film | ionomer film |
| g | gas |
| Ion | ionomer |
| O2 | oxygen |
| ohm | ohmic |
| Pt | platinum |
| ref | reference |
| rev | reversible |
References
- Wang, Y.; Chen, K.S.; Mishler, J.; Cho, S.C.; Adroher, X.C. A review of polymer electrolyte membrane fuel cells: Technology, applications, and needs on fundamental research. Appl. Energy 2011, 88, 981–1007. [Google Scholar] [CrossRef]
- Debe, M.K. Electrocatalyst approaches and challenges for automotive fuel cells. Nature 2012, 486, 43–51. [Google Scholar] [CrossRef] [PubMed]
- Jiao, K.; Xuan, J.; Du, Q.; Bao, Z.; Xie, B.; Wang, B.; Zhao, Y.; Fan, L.; Wang, H.; Hou, Z.; et al. Designing the next generation of proton-exchange membrane fuel cells. Nature 2021, 595, 361–369. [Google Scholar] [CrossRef] [PubMed]
- Sun, Y.; Polani, S.; Luo, F.; Ott, S.; Strasser, P.; Dionigi, F. Advancements in cathode catalyst and cathode layer design for proton exchange membrane fuel cells. Nat. Commun. 2021, 12, 5984. [Google Scholar] [CrossRef] [PubMed]
- Shang, Z.; Hossain, M.M.; Wycisk, R.; Pintauro, P.N. Poly(phenylene sulfonic acid)-expanded polytetrafluoroethylene composite membrane for low relative humidity operation in hydrogen fuel cells. J. Power Sources 2022, 535, 231375. [Google Scholar] [CrossRef]
- Seselj, N.; Alfaro, S.M.; Bompolaki, E.; Cleemann, L.N.; Torres, T.; Azizi, K. Catalyst Development for High-Temperature Polymer Electrolyte Membrane Fuel Cell (HT-PEMFC) Applications. Adv. Mater. 2023, 35, 2302207. [Google Scholar] [CrossRef]
- Wee, J.-H. Applications of proton exchange membrane fuel cell systems. Renew. Sustain. Energy Rev. 2007, 11, 1720–1738. [Google Scholar] [CrossRef]
- Yin, P.; Niu, X.; Li, S.-B.; Chen, K.; Zhang, X.; Zuo, M.; Zhang, L.; Liang, H.-W. Machine-learning-accelerated design of high-performance platinum intermetallic nanoparticle fuel cell catalysts. Nat. Commun. 2024, 15, 415. [Google Scholar] [CrossRef]
- Kodama, K.; Nagai, T.; Kuwaki, A.; Jinnouchi, R.; Morimoto, Y. Challenges in applying highly active Pt-based nanostructured catalysts for oxygen reduction reactions to fuel cell vehicles. Nat. Nanotechnol. 2021, 16, 140–147. [Google Scholar] [CrossRef]
- Guerrero Moreno, N.; Cisneros Molina, M.; Gervasio, D.; Pérez Robles, J.F. Approaches to polymer electrolyte membrane fuel cells (PEMFCs) and their cost. Renew. Sustain. Energy Rev. 2015, 52, 897–906. [Google Scholar] [CrossRef]
- Zhang, J.; Wang, B.; Jin, J.; Yang, S.; Li, G. A review of the microporous layer in proton exchange membrane fuel cells: Materials and structural designs based on water transport mechanism. Renew. Sustain. Energy Rev. 2022, 156, 111998. [Google Scholar] [CrossRef]
- Chen, Q.; Zhang, G.; Zhang, X.; Sun, C.; Jiao, K.; Wang, Y. Thermal management of polymer electrolyte membrane fuel cells: A review of cooling methods, material properties, and durability. Appl. Energy 2021, 286, 116496. [Google Scholar] [CrossRef]
- Xing, L.; Shi, W.; Su, H.; Xu, Q.; Das, P.K.; Mao, B.; Scott, K. Membrane electrode assemblies for PEM fuel cells: A review of functional graded design and optimization. Energy 2019, 177, 445–464. [Google Scholar] [CrossRef]
- Weber, A.Z.; Kusoglu, A. Unexplained transport resistances for low-loaded fuel-cell catalyst layers. J. Mater. Chem. A 2014, 2, 17207–17211. [Google Scholar] [CrossRef]
- Conde, J.J.; Folgado, M.A.; Ferreira-Aparicio, P.; Chaparro, A.M.; Chowdhury, A.; Kusoglu, A.; Cullen, D.; Weber, A.Z. Mass-transport properties of electrosprayed Pt/C catalyst layers for polymer-electrolyte fuel cells. J. Power Sources 2019, 427, 250–259. [Google Scholar] [CrossRef]
- Shahgaldi, S.; Ozden, A.; Li, X.; Hamdullahpur, F. Cathode catalyst layer design with gradients of ionomer distribution for proton exchange membrane fuel cells. Energy Convers. Manag. 2018, 171, 1476–1486. [Google Scholar] [CrossRef]
- Xie, Z.; Navessin, T.; Shi, K.; Chow, R.; Wang, Q.; Song, D.; Andreaus, B.; Eikerling, M.; Liu, Z.; Holdcroft, S. Functionally Graded Cathode Catalyst Layers for Polymer Electrolyte Fuel Cells: II. Experimental Study of the Effect of Nafion Distribution. J. Electrochem. Soc. 2005, 152, A1171–A1179. [Google Scholar] [CrossRef]
- Su, H.-N.; Liao, S.-J.; Wu, Y.-N. Significant improvement in cathode performance for proton exchange membrane fuel cell by a novel double catalyst layer design. J. Power Sources 2010, 195, 3477–3480. [Google Scholar] [CrossRef]
- Fan, J.; Chen, M.; Zhao, Z.; Zhang, Z.; Ye, S.; Xu, S.; Wang, H.; Li, H. Bridging the gap between highly active oxygen reduction reaction catalysts and effective catalyst layers for proton exchange membrane fuel cells. Nat. Energy 2021, 6, 475–486. [Google Scholar] [CrossRef]
- Lin, R.; Wang, H.; Zhu, Y. Optimizing the structural design of cathode catalyst layer for PEM fuel cells for improving mass-specific power density. Energy 2021, 221, 119909. [Google Scholar] [CrossRef]
- Chen, G.-Y.; Wang, C.; Lei, Y.-J.; Zhang, J.; Mao, Z.; Mao, Z.-Q.; Guo, J.-W.; Li, J.; Ouyang, M. Gradient design of Pt/C ratio and Nafion content in cathode catalyst layer of PEMFCs. Int. J. Hydrogen Energy 2017, 42, 29960–29965. [Google Scholar] [CrossRef]
- Yu, R.J.; Guo, H.; Ye, F.; Chen, H. Multi-parameter optimization of stepwise distribution of parameters of gas diffusion layer and catalyst layer for PEMFC peak power density. Appl. Energy 2022, 324, 119764. [Google Scholar] [CrossRef]
- Baricci, A.; Bonanomi, M.; Yu, H.; Guetaz, L.; Maric, R.; Casalegno, A. Modelling analysis of low platinum polymer fuel cell degradation under voltage cycling: Gradient catalyst layers with improved durability. J. Power Sources 2018, 405, 89–100. [Google Scholar] [CrossRef]
- Xuan, Z.-H.; Fang, W.-Z.; Zhao, G.-R.; Tao, W.-Q. Optimal gradient designs of catalyst layers for boosting performance: A data-driven-assisted model. Appl. Energy 2025, 377, 124756. [Google Scholar] [CrossRef]
- Kim, K.; Kim, H.; Lee, K.; Jang, J.; Lee, S.; Cho, E.; Oh, I.; Lim, T. Effect of Nafion® gradient in dual catalyst layer on proton exchange membrane fuel cell performance. Int. J. Hydrogen Energy 2008, 33, 2783–2789. [Google Scholar] [CrossRef]
- Wang, Y.; Liu, T.; Sun, H.; He, W.; Fan, Y.; Wang, S. Investigation of dry ionomer volume fraction in cathode catalyst layer under different relative humilities and nonuniform ionomer-gradient distributions for PEM fuel cells. Electrochim. Acta 2020, 353, 136491. [Google Scholar] [CrossRef]
- Kongstein, O.E.; Berning, T.; Børresen, B.; Seland, F.; Tunold, R. Polymer electrolyte fuel cells based on phosphoric acid doped polybenzimidazole (PBI) membranes. Energy 2007, 32, 418–422. [Google Scholar] [CrossRef]
- Su, H.-N.; Zeng, Q.; Liao, S.-J.; Wu, Y.-N. High performance membrane electrode assembly with ultra-low platinum loading prepared by a novel multi catalyst layer technique. Int. J. Hydrogen Energy 2010, 35, 10430–10436. [Google Scholar] [CrossRef]
- Taylor, A.D.; Kim, E.Y.; Humes, V.P.; Kizuka, J.; Thompson, L.T. Inkjet printing of carbon supported platinum 3-D catalyst layers for use in fuel cells. J. Power Sources 2007, 171, 101–106. [Google Scholar] [CrossRef]
- Qiu, Y.; Zhang, H.; Zhong, H.; Zhang, F. A novel cathode structure with double catalyst layers and low Pt loading for proton exchange membrane fuel cells. Int. J. Hydrogen Energy 2013, 38, 5836–5844. [Google Scholar] [CrossRef]
- Ye, L.; Gao, Y.; Zhu, S.; Zheng, J.; Li, P.; Zheng, J.P. A Pt content and pore structure gradient distributed catalyst layer to improve the PEMFC performance. Int. J. Hydrogen Energy 2017, 42, 7241–7245. [Google Scholar] [CrossRef]
- Roshandel, R.; Ahmadi, F. Effects of catalyst loading gradient in catalyst layers on performance of polymer electrolyte membrane fuel cells. Renew. Energy 2013, 50, 921–931. [Google Scholar] [CrossRef]
- Xing, L.; Shi, W.; Das, P.K.; Scott, K. Inhomogeneous distribution of platinum and ionomer in the porous cathode to maximize the performance of a PEM fuel cell. AIChE J. 2017, 63, 4895–4910. [Google Scholar] [CrossRef]
- Darling, R.M. A Hierarchical Model for Oxygen Transport in Agglomerates in the Cathode Catalyst Layer of a Polymer-Electrolyte Fuel Cell. J. Electrochem. Soc. 2018, 165, F571–F580. [Google Scholar] [CrossRef]
- Antoine, O.; Bultel, Y.; Ozil, P.; Durand, R. Catalyst gradient for cathode active layer of proton exchange membrane fuel cell. Electrochim. Acta 2000, 45, 4493–4500. [Google Scholar] [CrossRef]
- Matsuda, H.; Fushinobu, K.; Ohma, A.; Okazaki, K. Structural Effect of Cathode Catalyst Layer on the Performance of PEFC. J. Therm. Sci. Technol. 2011, 6, 154–163. [Google Scholar] [CrossRef]
- Khajeh-Hosseini-Dalasm, N.; Fesanghary, M.; Fushinobu, K.; Okazaki, K. A study of the agglomerate catalyst layer for the cathode side of a proton exchange membrane fuel cell: Modeling and optimization. Electrochim. Acta 2012, 60, 55–65. [Google Scholar] [CrossRef]
- Nam, J.H.; Lee, K.-J.; Hwang, G.-S.; Kim, C.-J.; Kaviany, M. Microporous layer for water morphology control in PEMFC. Int. J. Heat Mass Transf. 2009, 52, 2779–2791. [Google Scholar] [CrossRef]
- Chen, L.; Wu, G.; Holby, E.F.; Zelenay, P.; Tao, W.-Q.; Kang, Q. Lattice Boltzmann Pore-Scale Investigation of Coupled Physical-electrochemical Processes in C/Pt and Non-Precious Metal Cathode Catalyst Layers in Proton Exchange Membrane Fuel Cells. Electrochim. Acta 2015, 158, 175–186. [Google Scholar] [CrossRef]
- Wu, K.; Du, Q.; Zu, B.; Wang, Y.; Cai, J.; Gu, X.; Xuan, J.; Jiao, K. Enabling real-time optimization of dynamic processes of proton exchange membrane fuel cell: Data-driven approach with semi-recurrent sliding window method. Appl. Energy 2021, 303, 117659. [Google Scholar] [CrossRef]
- Ramaswamy, N.; Gu, W.; Ziegelbauer, J.M.; Kumaraguru, S. Carbon Support Microstructure Impact on High Current Density Transport Resistances in PEMFC Cathode. J. Electrochem. Soc. 2020, 167, 064515. [Google Scholar] [CrossRef]
- Wang, N.; Qu, Z.G.; Jiang, Z.Y.; Zhang, G.B. A unified catalyst layer design classification criterion on proton exchange membrane fuel cell performance based on a modified agglomerate model. Chem. Eng. J. 2022, 447, 137489. [Google Scholar] [CrossRef]
- Wikander, K.; Ekström, H.; Palmqvist, A.E.C.; Lindbergh, G. On the influence of Pt particle size on the PEMFC cathode performance. Electrochim. Acta 2007, 52, 6848–6855. [Google Scholar] [CrossRef]
- Hao, L.; Moriyama, K.; Gu, W.; Wang, C.-Y. Modeling and Experimental Validation of Pt Loading and Electrode Composition Effects in PEM Fuel Cells. J. Electrochem. Soc. 2015, 162, F854–F867. [Google Scholar] [CrossRef]
- Kudo, K.; Jinnouchi, R.; Morimoto, Y. Humidity and Temperature Dependences of Oxygen Transport Resistance of Nafion Thin Film on Platinum Electrode. Electrochim. Acta 2016, 209, 682–690. [Google Scholar] [CrossRef]
- Mu, Y.-T.; Yang, S.-R.; He, P.; Tao, W.-Q. Mesoscopic modeling impacts of liquid water saturation, and platinum distribution on gas transport resistances in a PEMFC catalyst layer. Electrochim. Acta 2021, 388, 138659. [Google Scholar] [CrossRef]
- Liang, J.; Li, Y.; Wang, R.; Jiang, J. Cross-dimensional model of the oxygen transport behavior in low-Pt proton exchange membrane fuel cells. Chem. Eng. J. 2020, 400, 125796. [Google Scholar] [CrossRef]
- Owejan, J.P.; Owejan, J.E.; Gu, W. Impact of Platinum Loading and Catalyst Layer Structure on PEMFC Performance. J. Electrochem. Soc. 2013, 160, F824–F833. [Google Scholar] [CrossRef]
- Kongkanand, A.; Mathias, M.F. The Priority and Challenge of High-Power Performance of Low-Platinum Proton-Exchange Membrane Fuel Cells. J. Phys. Chem. Lett. 2016, 7, 1127–1137. [Google Scholar] [CrossRef]
- Sakai, K.; Sato, K.; Mashio, T.; Ohma, A.; Yamaguchi, K.; Shinohara, K. Analysis of Reactant Gas Transport in Catalyst Layers; Effect of Pt-loadings. ECS Trans. 2009, 25, 1193–1201. [Google Scholar]
- Lou, J.; Lu, Y.; Yang, D.; Pan, X.; Li, B.; Ming, P. Experimental and model refinement of water content and membrane conductivity in reinforced composite proton exchange membranes. Int. J. Hydrogen Energy 2024, 94, 756–764. [Google Scholar] [CrossRef]
- Tang, H.; Wang, S.; Pan, M.; Yuan, R. Porosity-graded micro-porous layers for polymer electrolyte membrane fuel cells. J. Power Sources 2007, 166, 41–46. [Google Scholar] [CrossRef]
- Ko, D.; Doh, S.; Park, H.S.; Kim, M.H. The effect of through plane pore gradient GDL on the water distribution of PEMFC. Int. J. Hydrogen Energy 2018, 43, 2369–2380. [Google Scholar] [CrossRef]
- Nam, J.H.; Kaviany, M. Effective diffusivity and water-saturation distribution in single- and two-layer PEMFC diffusion medium. Int. J. Heat Mass Transf. 2003, 46, 4595–4611. [Google Scholar] [CrossRef]
- Yu, H.; Baricci, A.; Bisello, A.; Casalegno, A.; Guetaz, L.; Bonville, L.; Maric, R. Strategies to mitigate Pt dissolution in low Pt loading proton exchange membrane fuel cell: I. A gradient Pt particle size design. Electrochim. Acta 2017, 247, 1155–1168. [Google Scholar] [CrossRef]
- Yu, H.; Baricci, A.; Casalegno, A.; Guetaz, L.; Bonville, L.; Maric, R. Strategies to mitigate Pt dissolution in low Pt loading proton exchange membrane fuel cell: II. A gradient Pt loading design. Electrochim. Acta 2017, 247, 1169–1179. [Google Scholar] [CrossRef]
- Zheng, Z.; Luo, L.; Zhu, F.; Cheng, X.; Yang, F.; Shen, S.; Wei, G.; Zhang, J. Degradation of core-shell Pt3Co catalysts in proton exchange membrane fuel cells (PEMFCs) studied by mathematical modeling. Electrochim. Acta 2019, 323, 134751. [Google Scholar] [CrossRef]
- Zheng, Z.; Yang, F.; Lin, C.; Zhu, F.; Shen, S.; Wei, G.; Zhang, J. Design of gradient cathode catalyst layer (CCL) structure for mitigating Pt degradation in proton exchange membrane fuel cells (PEMFCs) using mathematical method. J. Power Sources 2020, 451, 227729. [Google Scholar] [CrossRef]
Disclaimer/Publisher’s Note: The statements, opinions and data contained in all publications are solely those of the individual author(s) and contributor(s) and not of MDPI and/or the editor(s). MDPI and/or the editor(s) disclaim responsibility for any injury to people or property resulting from any ideas, methods, instructions or products referred to in the content. |
© 2025 by the authors. Licensee MDPI, Basel, Switzerland. This article is an open access article distributed under the terms and conditions of the Creative Commons Attribution (CC BY) license (https://creativecommons.org/licenses/by/4.0/).