4.1. General Statistics and Descriptive Statistics
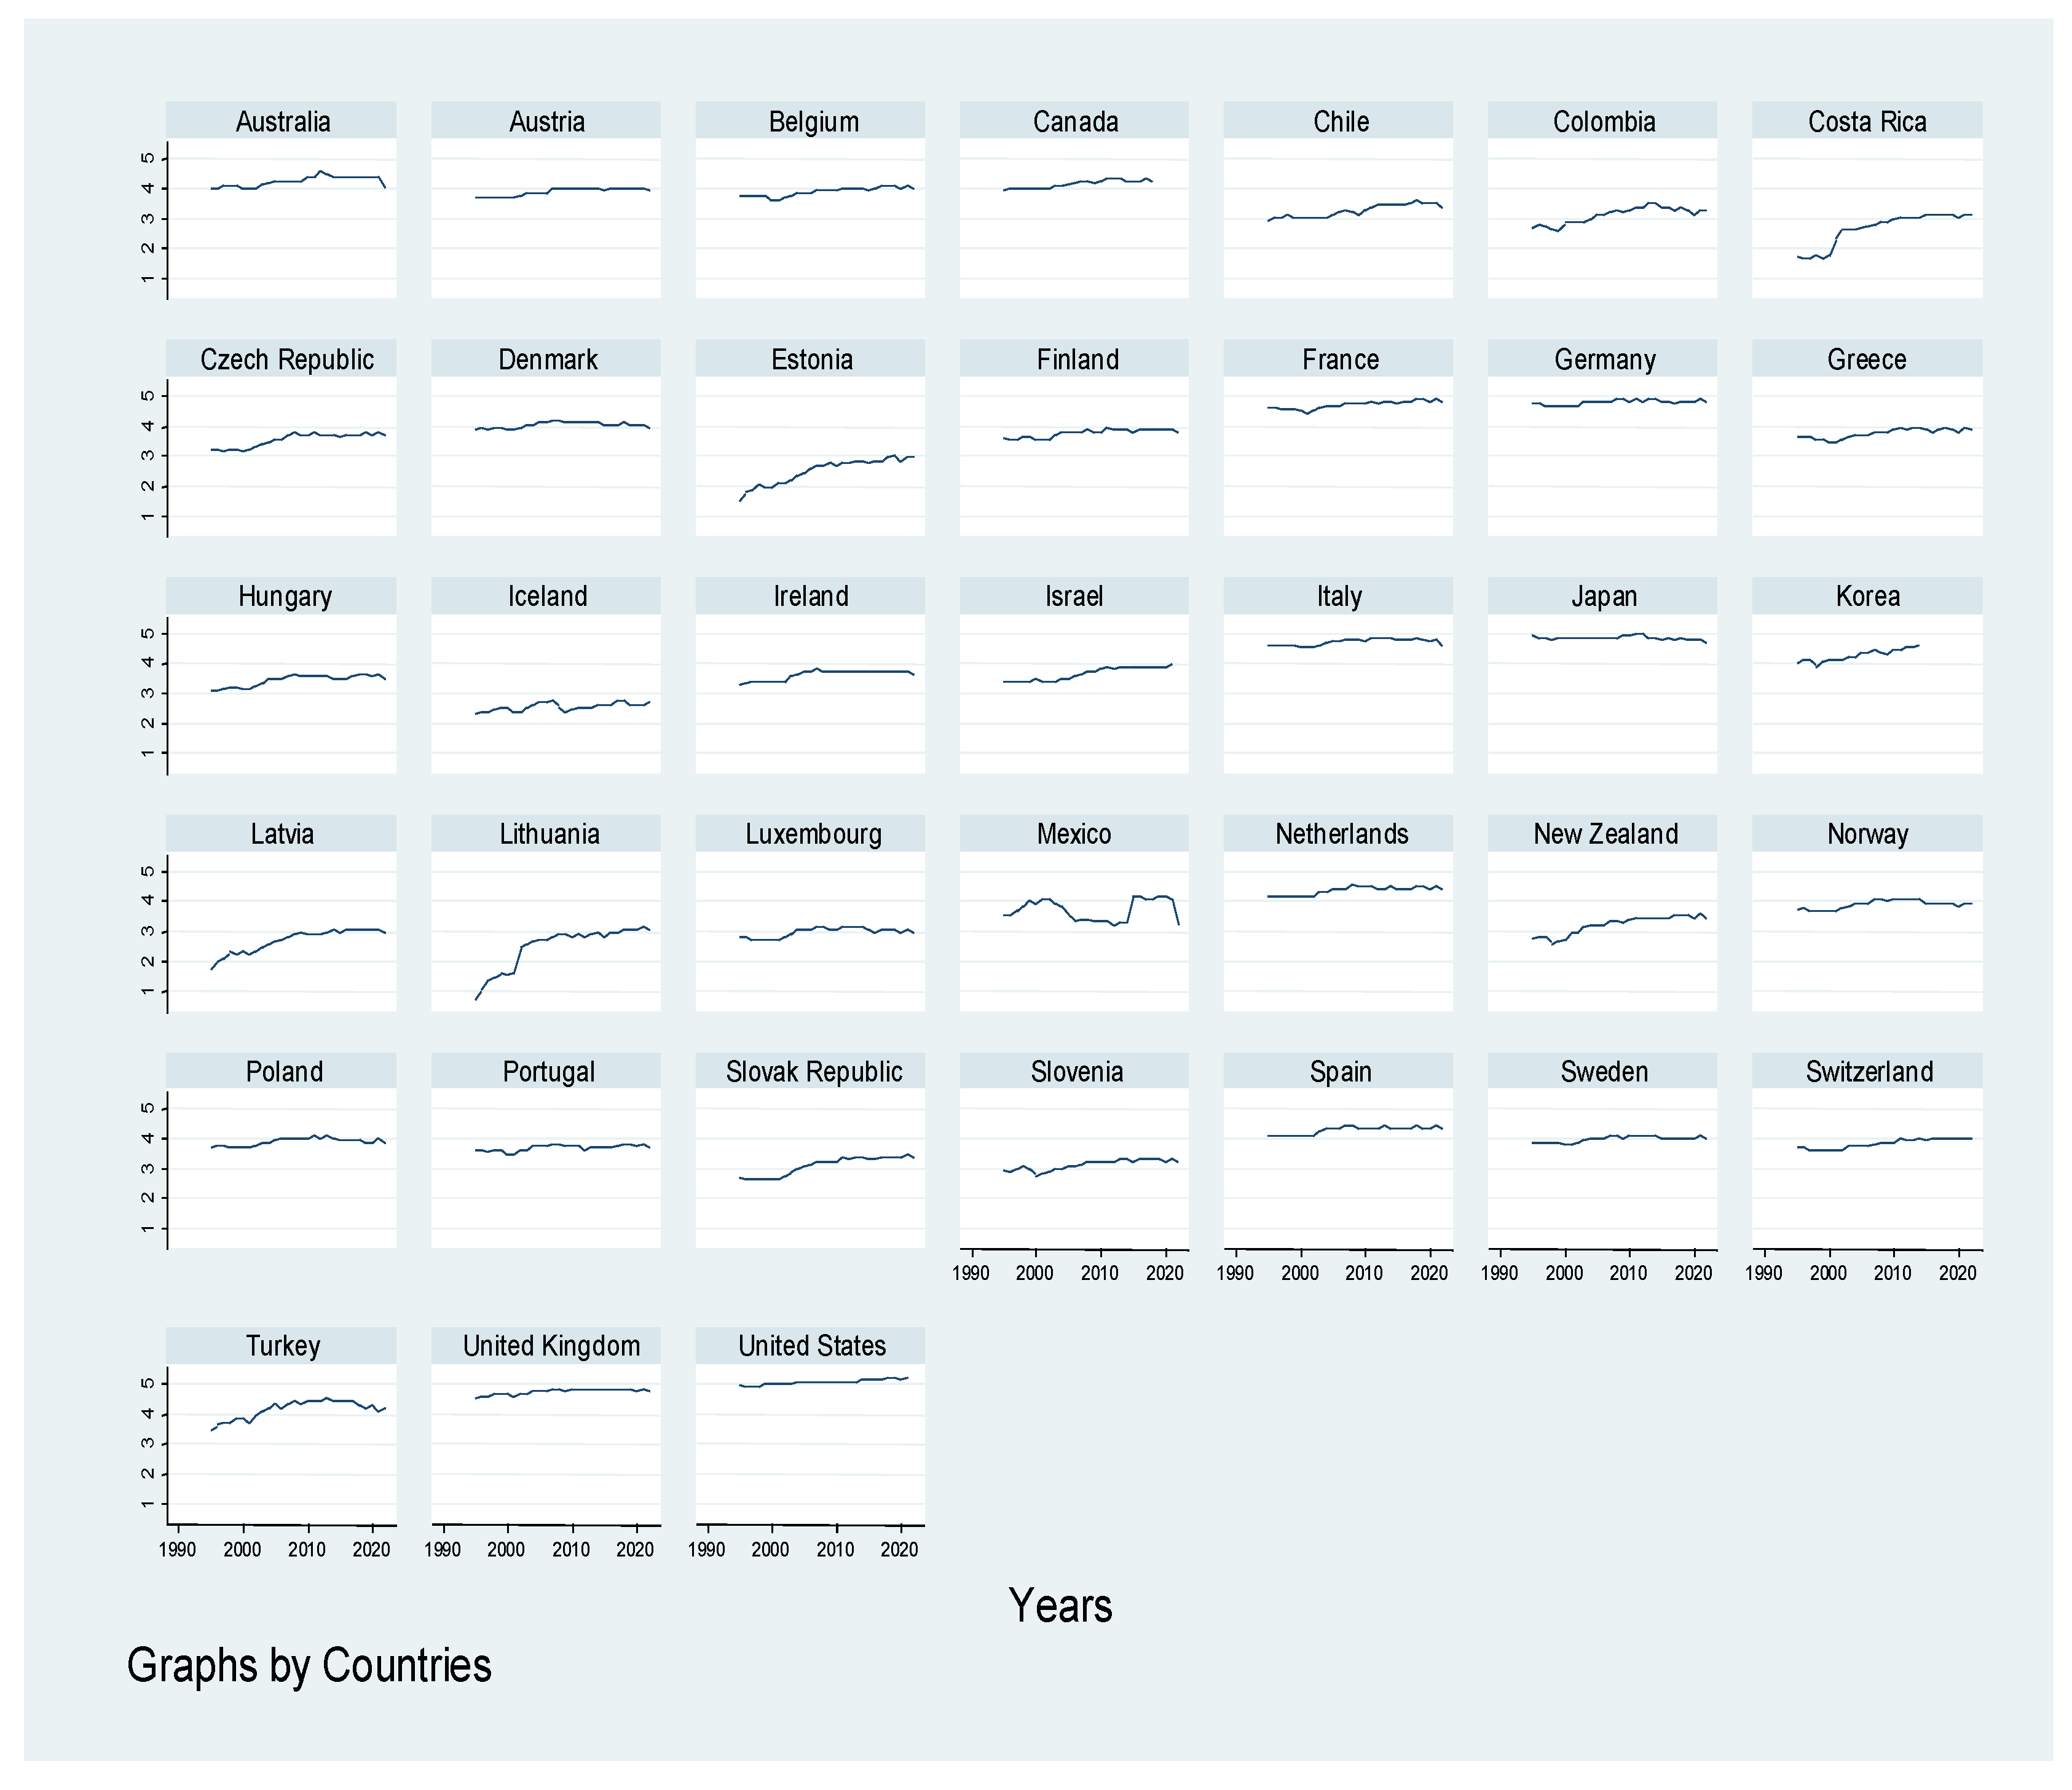
Figure 1 shows the distribution of carbon dioxide emissions for the 38 OECD countries in logarithmic form. According to the World Bank dataset, the countries with the highest carbon dioxide emissions are Canada, France, Germany, Italy, Japan, Korea, Mexico, Poland, Turkey, the United Kingdom, and the United States.
In
Table 2, we can view the descriptive statistics of the variables under study. The variables under study, income per capita (LogGDP) and environmental taxes (LogENTAXES), present the highest maximum values. Furthermore, it should be noted that kurtosis shows a positive tendency for all variables and asymmetric negative values, namely, environmental taxes (LogENTAXES) and renewable energy (LogREW).
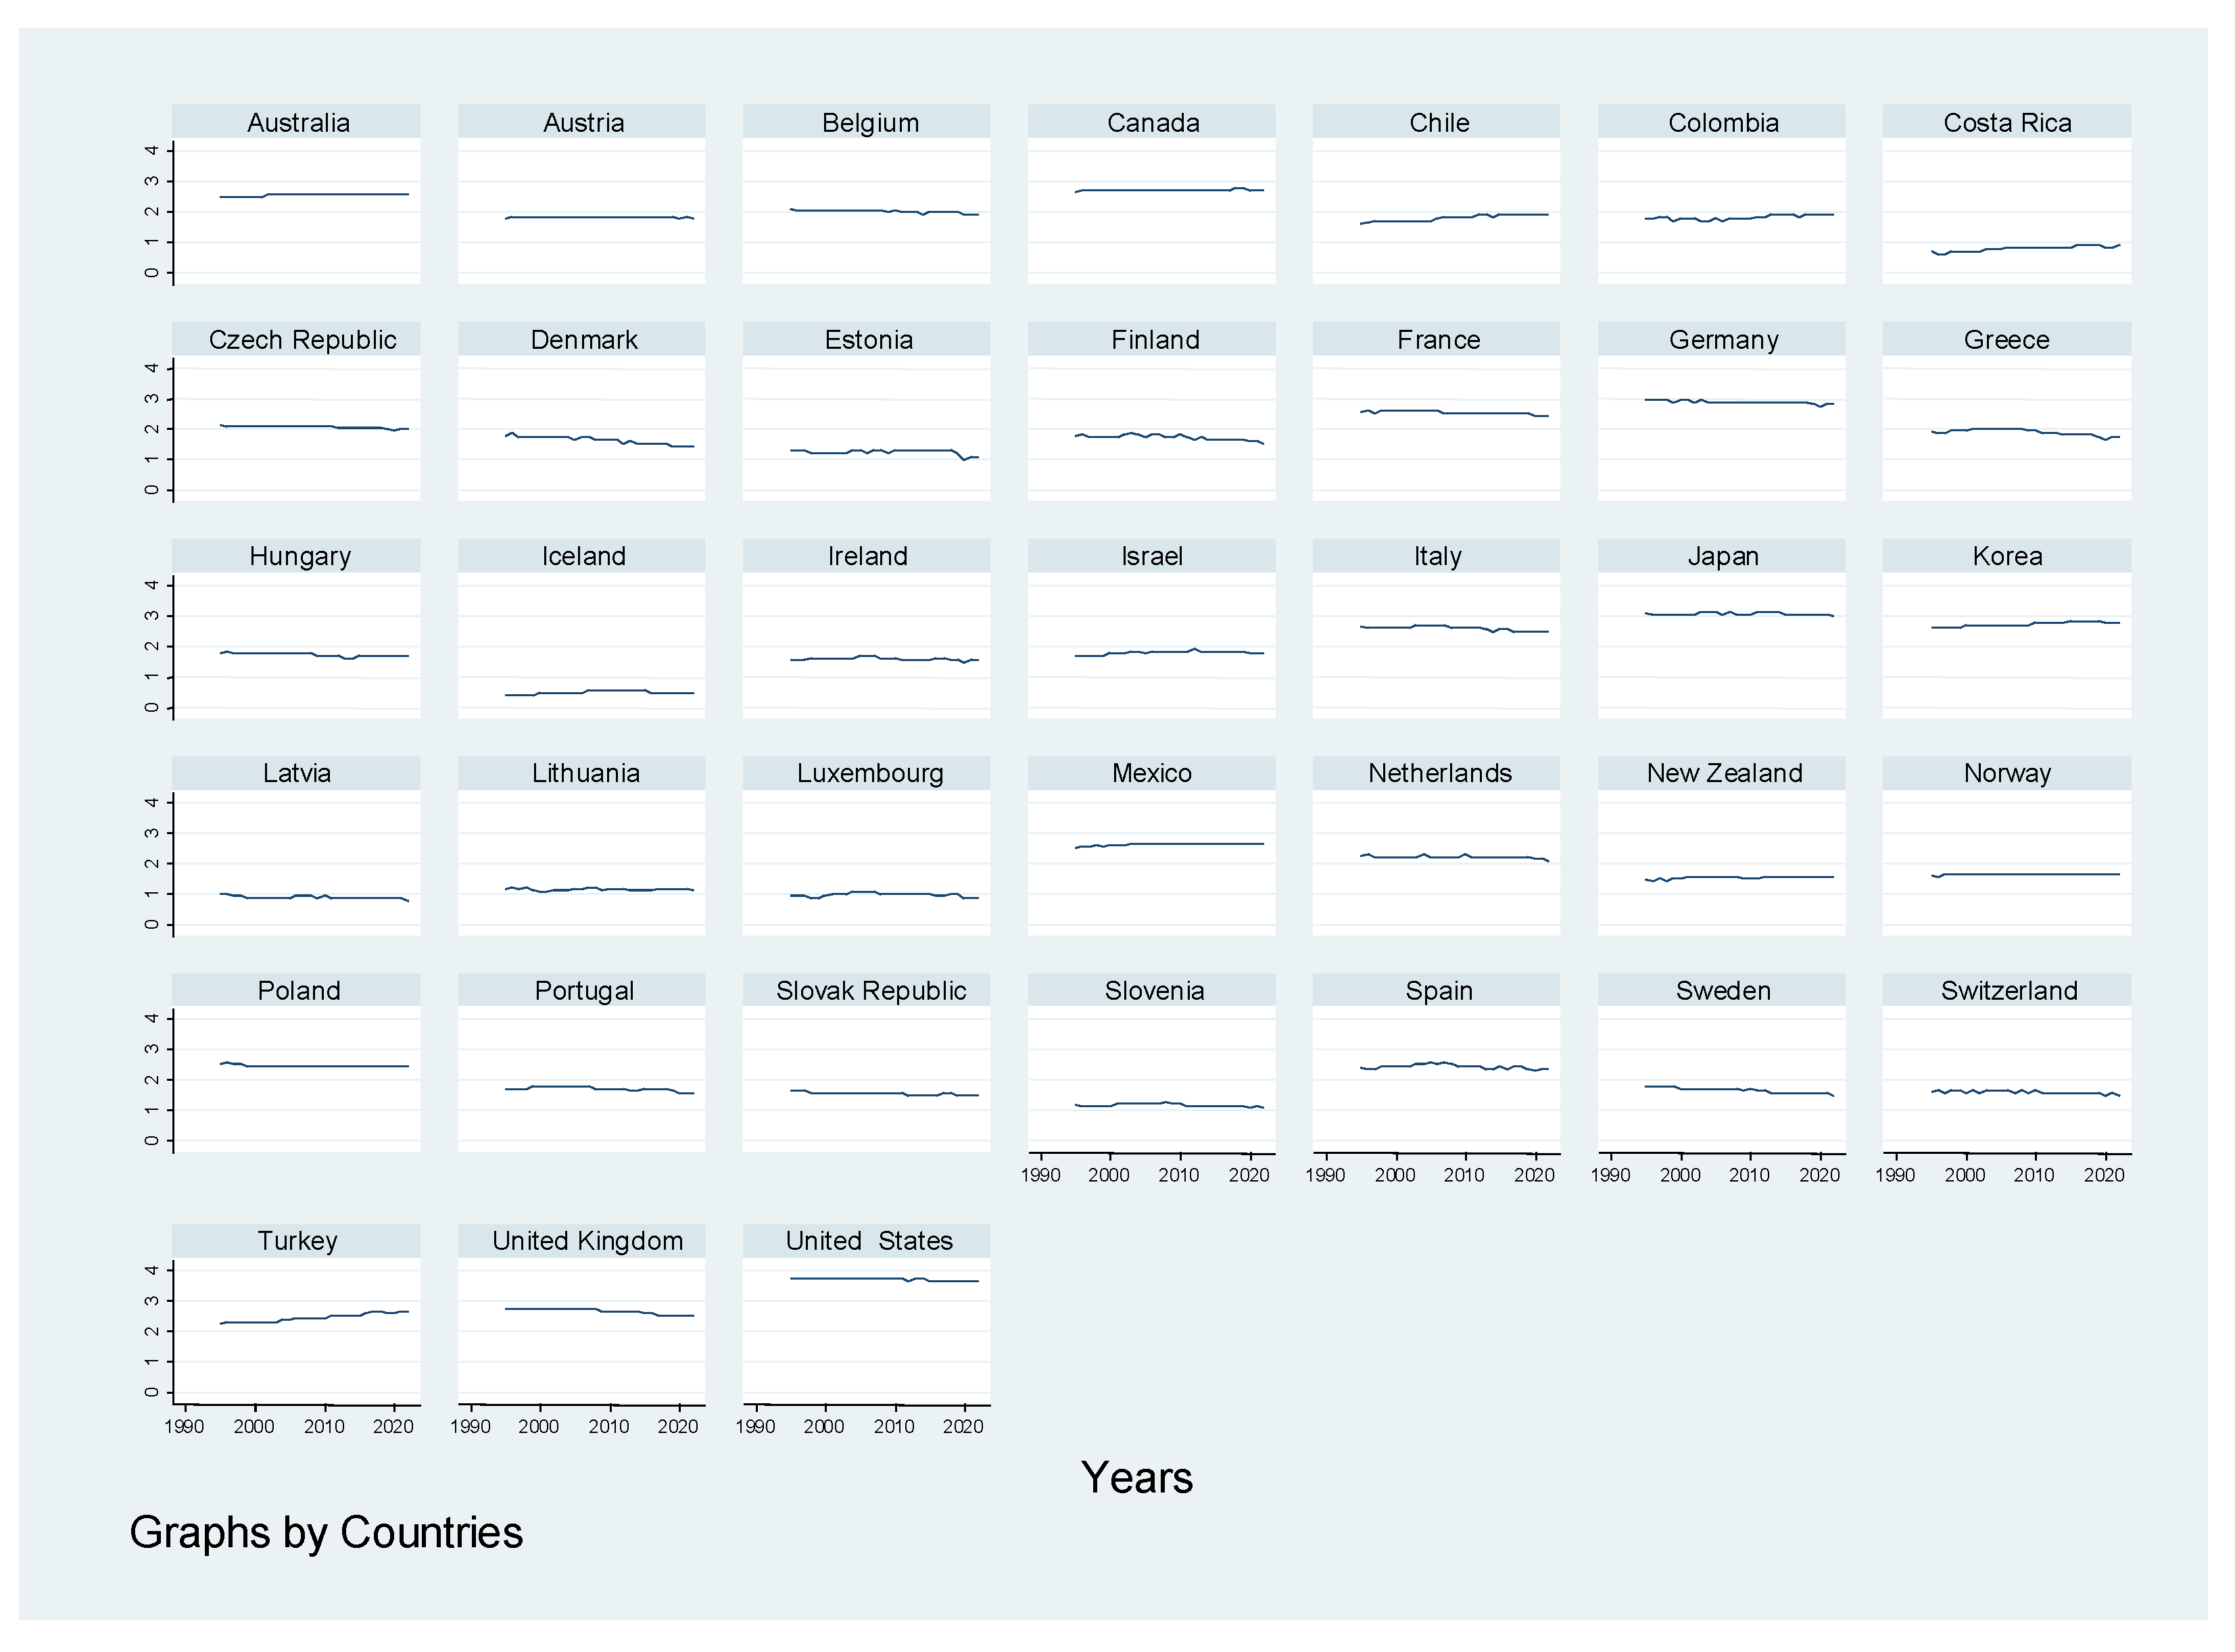
Figure 2 presents the distribution of environmental taxes for the 38 OECD countries in logarithmic form. According to the OECD dataset, the countries with the highest environmental tax are Australia, France, Germany, Italy, Japan, Korea, Netherlands, Poland, Turkey, the United Kingdom, and the United States.
The variance inflation test is presented in
Table 3. It is possible to conclude that the income per capita (LogGDP), environmental taxes (LogENTAXES), renewable energy (LogREW), and openness to trade (LogTRADE) do not have problems of multicollinearity between them.
Table 4 presents the unit root test using the criterion of Im, Pesaran, and Shin [
41]. All variables considered in this research are stationary in first differences. In the next step, we will consider the cointegration test.
The Pedroni [
48] cointegration test is considered in
Table 5. The results show statistical significance at within-dimensional and between-dimensional levels, revealing cointegration among the variables applied in this investigation.
The cross-section test is considered in
Table 6. The results show statistical significance at a 1% level using Pesaran [
42], demonstrating that the variables in this research have cross-dependence. Then, according to these results, the second-generation unit root panel test must be applied.
Table 7 presents the results for stationarity using the second-generation criterion (CIPS test), including constant and trend. The variables of carbon dioxide emissions (LogCO
2), economic growth (LogGDP), environmental taxes (LogENTAXES), renewable energy (LogREW), and openness to trade (LogTRADE) are stationary according to critical values of reference.
4.2. Econometric Results and Interpretation
Table 8 reports the econometric results using the panel cointegration FMOLS—Fully Modified Least Squares—and DOLS—Dynamic Least Squares. The results between these estimators are similar.
The coefficient of economic growth (LogGDP) is statistically significant at a 1% level and positively affects carbon dioxide emissions. This result reveals that economic growth is associated with greenhouse gas emissions and climate change. The empirical studies of Savranlar et al. [
8], Dogan et al. [
9] and Sultana et al. [
10] also found a positive effect of economic growth on carbon dioxide emissions.
Regarding the effect of environmental taxes (LogENTAXES) on carbon dioxide emissions, we observe a positive impact of environmental taxes on pollution emissions, and the variable is statistically significant at the 1% and 10% levels, respectively. This result is explained by negative externality, showing that fiscal policy increases carbon dioxide emissions. This result has support from previous studies such as Maté et al. [
1], Özmen and Mutascu [
2], and Ibe et al. [
4].
Several studies (e.g., Dogan et al. [
9]; Tran [
33]) demonstrate that the consumption of renewable energy allows achieving environmental improvements and air quality. Our results are along these lines. The coefficient of renewable energy (LogREW) hurts carbon dioxide emissions and is statistically significant at the 1% level. Studies by Leitão [
31] and Matenda et al. [
34] found the same trend.
The variable of openness to trade (LogTRADE) reduces carbon dioxide emissions, with statistics significant at 1%. This result is described by innovation and product differentiation of goods and services and aims to decrease pollution emissions (e.g., Gürtzgen and Rauscher [
25]; Haupt [
26]; Echazu and Heintzelman [
27]; Mehra and Kohli [
28]. The previous empirical studies of Leitão and Balogh [
29] and Roy [
30]) also defend this argument.
Table 9 presents the estimates obtained using quantile regression (QR) from 25%, 50%, 75%, and 90% for each coefficient.
The per capita income variable (LogGDP) presents statistical significance at 10% and 1% in the quartiles, 50%, 75%, and 90%. In the 75% and 90% quartiles, the variable positively affects carbon dioxide emissions, demonstrating that the OECD countries and their economic activities are associated with greenhouse gas emissions. The studies by Savranlar et al. [
8], Dogan et al. [
9], Sultana et al. [
10], and Leitão [
31] also found the same trend.
Regarding environmental taxes (LogENTAXES), the econometric results positively affect pollution emissions, reflecting a negative externality. The variable is statistically significant at 1% across the all-quantile regressions in the analysis. The empirical studies of Maté et al. [
1], Özmen and Mutascu [
2], and Ibe et al. [
4] also found similar results. Furthermore, the result is in line with the theses of Pigou [
18] and Sinn [
19], which highlight that environmental taxes can have an undesirable effect compared to what was expected.
The studies by Sultana et al. [
10], Matenda et al. [
34], Leitão [
49], and Balsalobre et al. [
50] demonstrate that renewable energy reduces carbon dioxide emissions and improves environmental quality. Our results find this effect across the quantile regressions. The coefficient is statistically significant at a 1% level in the quartile regression for 25%, 50%, and 75%, respectively.
The coefficient of international trade (LogTRADE) has a negative effect, with statistical significance at 1% for all quartiles. Based on our results, global trade is explained by innovation and product differentiation, and trade aims to decrease environmental and ecological problems. Therefore, Leitão and Balogh [
29], Roy [
30], and Leitão [
31] found a negative effect of trade on carbon dioxide emissions, and they give support to our result.
Next, we present the econometric results using the dynamic panel, allowing us to assess the adjustment capacity of OECD economies in the face of carbon dioxide emissions. Thus, the GMM system will enable us to observe whether the OECD economies follow a smooth adjustment of carbon dioxide emissions or whether, on the contrary, the adjustment of the economies is associated with the increase in carbon dioxide emissions and the issues of asymmetries between the economies.
Table 10 shows the impact of economic growth, environmental taxes, renewable energy, and trade on carbon dioxide emissions using dynamic panel data (GMM system).
The lagged variable of carbon dioxide emissions (LogCO
2t−1) aims to evaluate the long-run effects. According to our results, in the long run, carbon dioxide emissions and pollution emissions will increase. The studies of Maté et al. [
1], Shammre et al. [
5], Wang et al. [
36], Leitão and Balsolobre-Lorente [
51] and Jiang and Khan [
52] also found a positive sign.
The coefficient of economic growth (LogGDP) positively affects carbon dioxide emissions, reflecting that economic activities stimulate climate change and pollution emissions. This result supports Ibe et al. [
4] and Leitão and Balsolobre-Lorente’s [
51] studies.
The coefficient of environmental taxes (LogENTAXES) demonstrates that fiscal policy stimulates negative externalities. The variable presents statistically significant at a 1% level. As we referred, the studies of Maté et al. [
1], Ibe et al. [
4], and Özmen and Mutascu [
2] also present a positive effect of environmental taxes on carbon dioxide emissions.
According to previous studies, the renewable energy variable (LogREW) stimulates the improvement of environmental damage.
The coefficient of international trade (LogTRADE) negatively affects carbon dioxide emissions. According to international trade theories, this result reveals innovations and product differentiation that aim to decrease pollution emissions.
Finally, Arellano-Bond’s [
53] serial correlation tests do not present autocorrelation problems (AR2—second order). Also, the Sargan test allows us to infer that the instruments used are adequate.
In the next step, we present the bidirectional and unidirectional causality between the variables considered in this investigation based on the methodology of Dumitrescu and Hurlin [
43]. The recent studies of Zhou et al. [
32], Li and Ayub [
54], and Georgescu et al. [
55] used this methodology.
Table 11 shows a bidirectional relationship between environmental taxes (LogENTAXES) and carbon dioxide emissions (LogCO
2). The empirical study of Zhou et al. [
32] also found some conclusions. We also observe a bidirectional relationship between openness to trade (LogTRADE) and renewable energy (LogREW).
The results demonstrate a unidirectional relationship between carbon dioxide emissions (LogCO
2) and economic growth (LogGDP). Georgescu et al. [
55] also found the exact relationship between the variables.
Furthermore, we observe a unidirectional causality between carbon dioxide emissions (LogCO2) and renewable energy (LogREW). The openness to trade (LogTRADE) presents a unidirectional relationship between carbon dioxide emissions (LogCO2) and economic growth (LogGDP).
Finally, we observe a unidirectional relationship between renewable energy (LogREW) and environmental taxes (LogENTAXES). There is a unidirectional relationship between openness to trade (LogTRADE) and environmental taxes (LogENTAXES).
Next, we present the conclusions section of this investigation, which highlights the results and recommendations for policymakers. Moreover, we refer to some contributions for future work.


