Ever More Frequent Negative Electricity Prices: A New Reality and Challenges for Photovoltaics and Wind Power in a Changing Energy Market—Threat or Opportunity, and Where Are the Limits of Sustainability?


Abstract
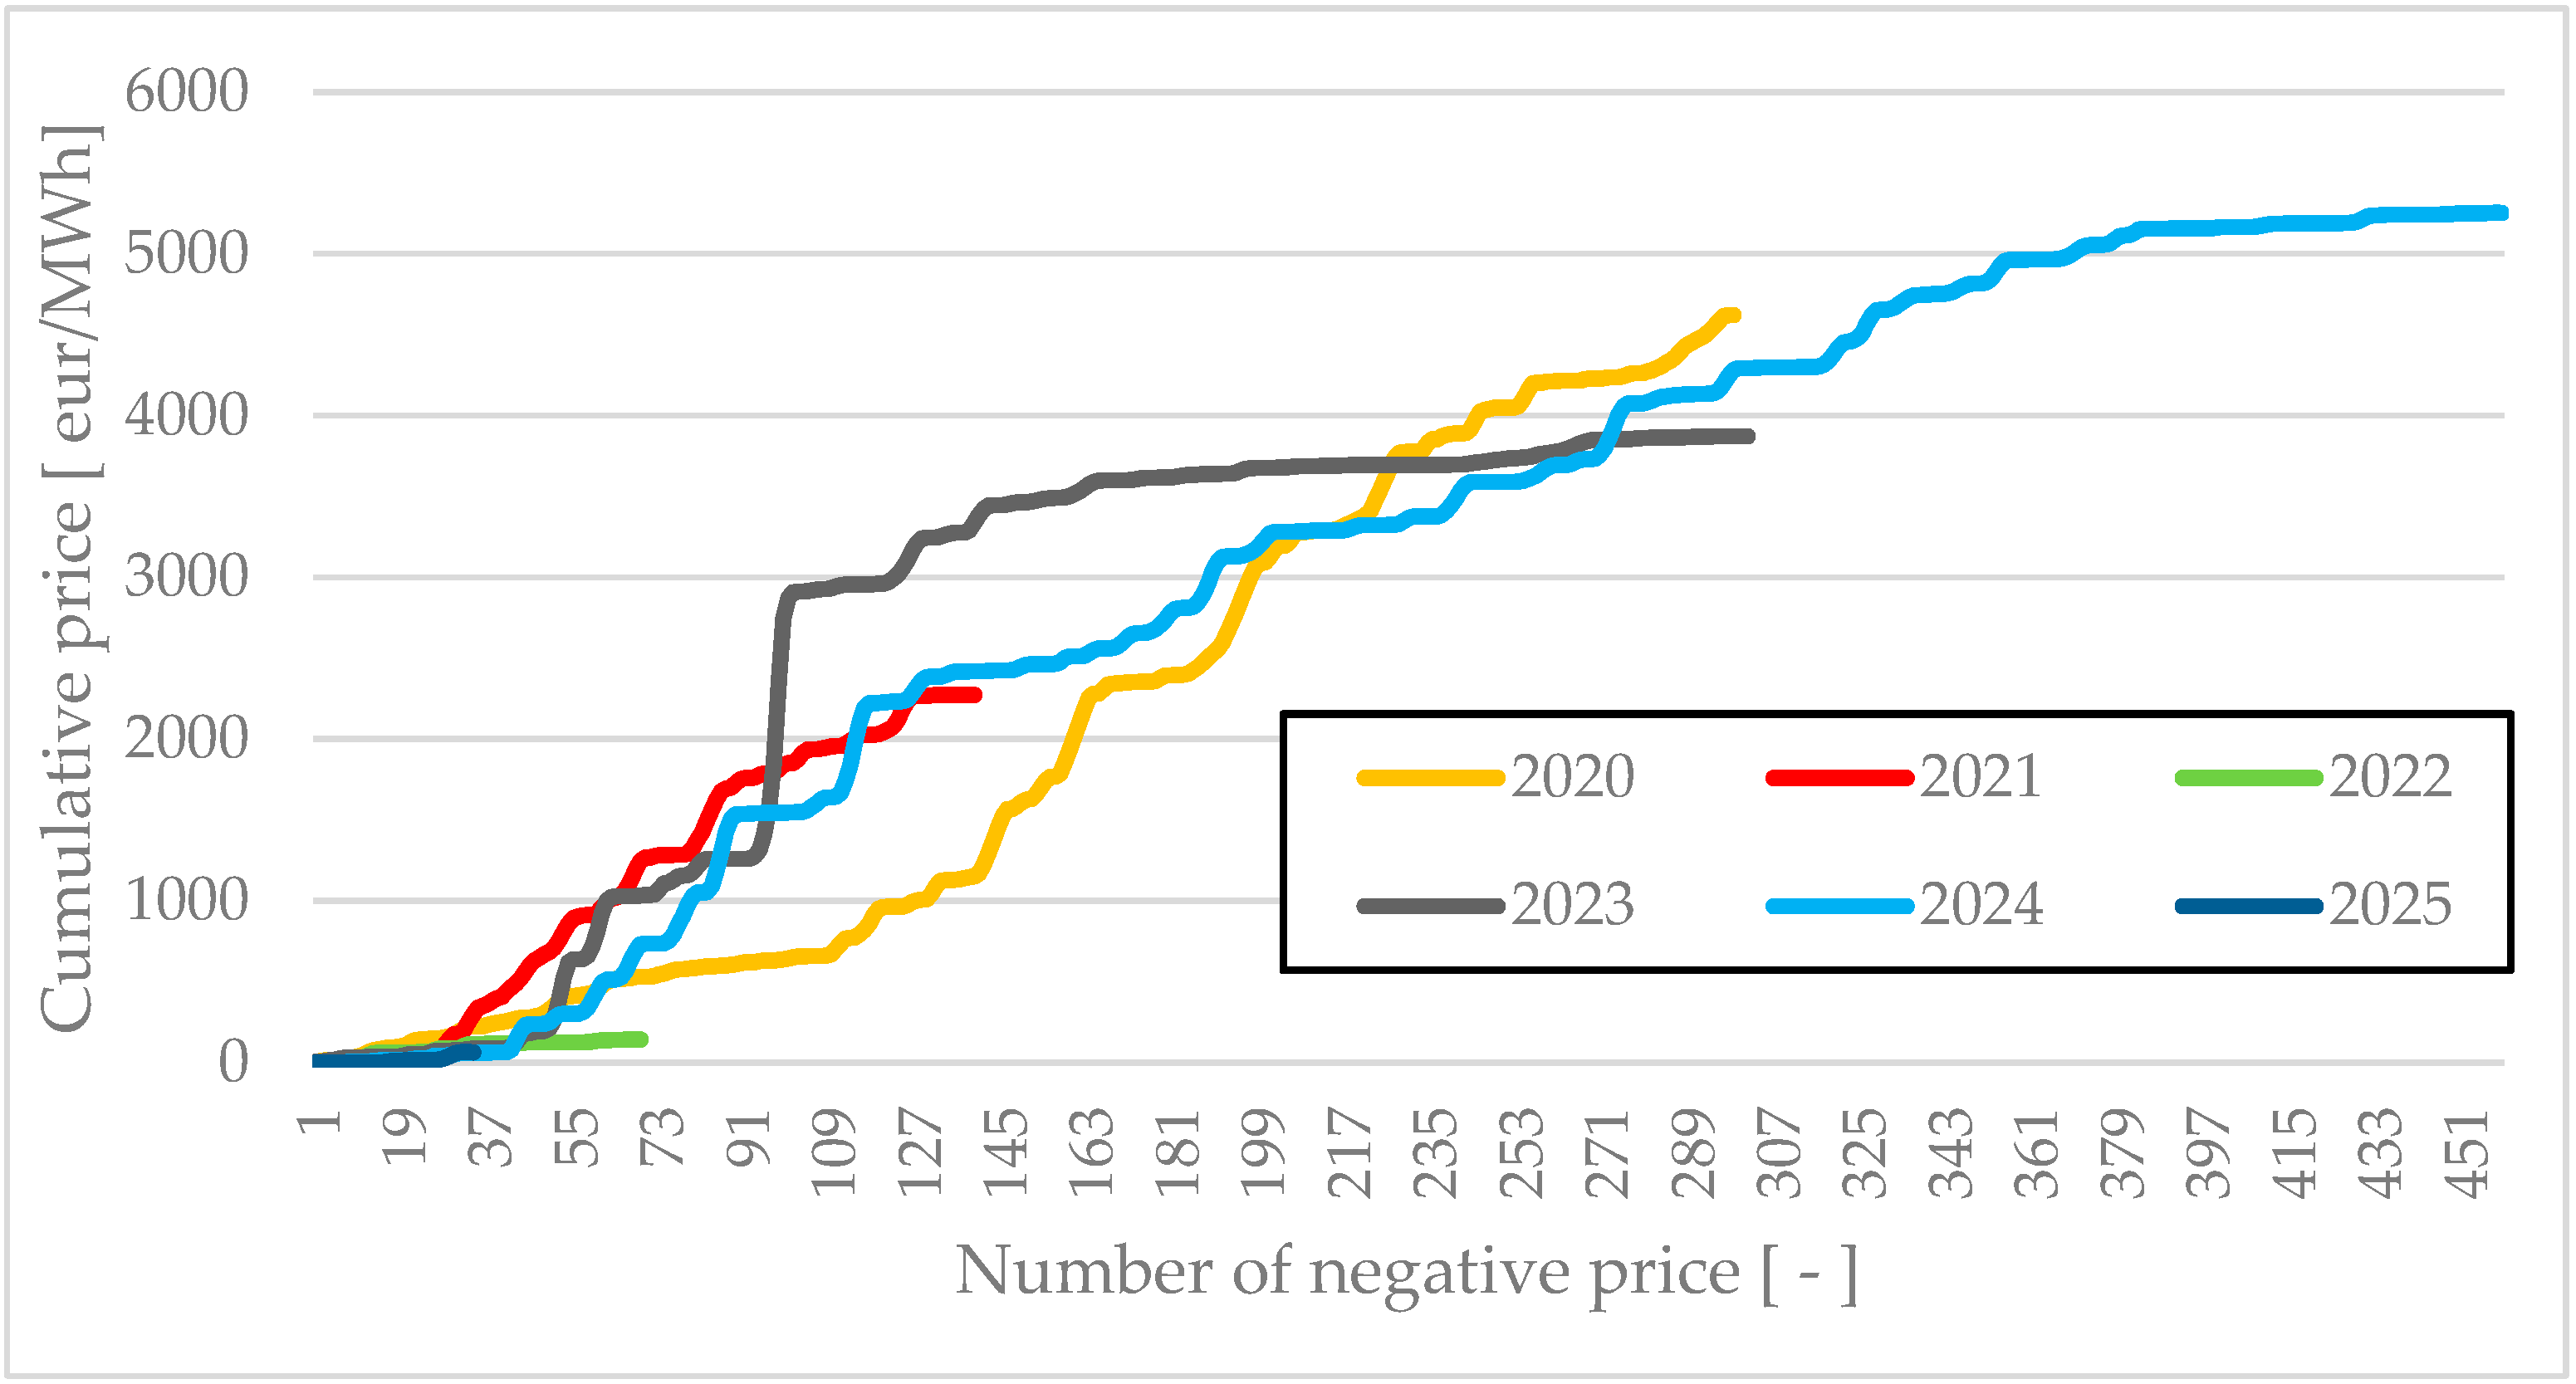
1. Introduction
- Capture rate < 100%—The producer sells electricity at a price lower than the market average (typical for solar and wind sources, as they generate power during times of surplus, causing prices to fall).
- Capture rate = 100%—The producer receives exactly the market average price.
- Capture rate > 100%—The producer sells electricity at a price higher than the market average (less common, may occur with flexible sources such as hydropower).
- Vietnam: USD 15 trillion;
- China: USD 205 trillion;
- India: USD 110 trillion;
- Spain: USD 8 trillion;
- France: USD 104 trillion;
- United Kingdom: USD 49 trillion.
2. Conclusions
- –
- How can market design be optimized to better reflect renewable variability?
- –
- Which technologies (e.g., AI, predictive control, adaptive pricing) can mitigate the impact of energy surpluses?
- –
- What are the social and economic implications of prolonged negative prices for small- and medium-sized producers?
Funding
Data Availability Statement
Conflicts of Interest
References
- Global Energy Review; International Energy Agency: Paris, France, 2025.
- Chudo, S.B.; Terdik, G. Modeling and Forecasting Time-Series Data with Multiple Seasonal Periods Using Periodograms. Econometrics 2025, 13, 14. [Google Scholar] [CrossRef]
- Seel, J.; Millstein, D.; Mills, A.; Bolinger, M.; Wiser, R. Plentiful electricity turns wholesale prices negative. Adv. Appl. Energy 2021, 4, 100073. [Google Scholar] [CrossRef]
- Biber, A.; Felder, M.; Wieland Ch Spliethoff, H. Negative price spiral caused by renewables? Electricity price prediction on the German market for 2030. Electr. J. 2022, 35, 107188. [Google Scholar] [CrossRef]
- Aust, B.; Horsch, A. Negative market prices on power exchanges: Evidence and policy implications from Germany. Electr. J. 2020, 33, 106716. [Google Scholar] [CrossRef]
- Ela, E.; Milligan, M.; Bloom, A.; Botterud, A.; Townsend, A.; Levin, T. Evolution of Wholesale Electricity Market Design with Increasing Levels of Renewable Generation. Available online: https://research-hub.nrel.gov/en/publications/evolution-of-wholesale-electricity-market-design-with-increasing- (accessed on 1 May 2025).
- NREL/TP-5D00-61765; National Renewable Energy Laboratory: Golden, CO, USA, 2014.
- Hogan, W.W. Electricity Market Design and Zero-Marginal Cost Generation. Curr. Sustain. Renew. Energy Rep. 2022, 9, 15–26. [Google Scholar] [CrossRef]
- Rudolph, M.; Damien, P. The Impact of Renewable Energy Tax Incentives on Electricity Pricing in Texas. Appl. Sci. 2023, 13, 8532. [Google Scholar] [CrossRef]
- Mohammad Reza, M.; Hossein, A.; Akram, M. Wholesale electricity price forecasting by Quantile Regression and Kalman Filter method. Energy 2024, 290, 129925. [Google Scholar] [CrossRef]
- Adom, P.K.; Minlah, M.K.; Adams, S. Impact of renewable energy (hydro) on electricity prices in Ghana: A tale of the short- and long-run. Energy Strategy Rev. 2018, 20, 163–178. [Google Scholar] [CrossRef]
- Building the Future Transmission Grid, Strategies to Navigate Supply Chain Challenges; International Energy Agency: Paris, France, 2025.
- Farren-Price, B.; Fulwood, M.; Henderson, J.; Meidan, M.; Sharples, J.; Economou, A.; Fattouh, B. Key Themes for the Global Energy Economy in 2025, The Oxford Institute for Energy Studies. Available online: https://www.oxfordenergy.org/publications/key-themes-for-the-global-energy-economy-in-2025/ (accessed on 1 May 2025).
- Pavlík, M.; Bereš, M.; Kurimský, F. Analyzing the Impact of Volatile Electricity Prices on Solar Energy Capture Rates in Central Europe: A Comparative Study. Appl. Sci. 2024, 14, 6396. [Google Scholar] [CrossRef]


| Number of Negative Electricity Price | |||||||||||
|---|---|---|---|---|---|---|---|---|---|---|---|
| Month | 2015 | 2016 | 2017 | 2018 | 2019 | 2020 | 2021 | 2022 | 2023 | 2024 | 2025 |
| January | 12 | 5 | 3 | 44 | 34 | 3 | 0 | 4 | 14 | 16 | 14 |
| February | 8 | 14 | 5 | 5 | 9 | 84 | 9 | 4 | 0 | 4 | 0 |
| March | 14 | 6 | 0 | 21 | 46 | 41 | 27 | 6 | 9 | 12 | 20 |
| April | 14 | 0 | 16 | 3 | 18 | 40 | 22 | 5 | 11 | 50 | 0 |
| May | 17 | 21 | 17 | 31 | 9 | 36 | 38 | 16 | 33 | 78 | 0 |
| June | 0 | 0 | 0 | 0 | 26 | 8 | 9 | 3 | 20 | 66 | 0 |
| July | 3 | 2 | 7 | 0 | 0 | 24 | 11 | 2 | 56 | 81 | 0 |
| August | 0 | 0 | 8 | 0 | 11 | 4 | 11 | 0 | 23 | 68 | 0 |
| September | 13 | 0 | 8 | 3 | 15 | 6 | 0 | 0 | 22 | 40 | 0 |
| October | 0 | 0 | 39 | 6 | 5 | 18 | 7 | 0 | 38 | 25 | 0 |
| November | 18 | 14 | 1 | 0 | 0 | 9 | 0 | 0 | 3 | 11 | 0 |
| December | 11 | 35 | 42 | 21 | 38 | 25 | 5 | 29 | 72 | 8 | 0 |
| Sum | 110 | 97 | 146 | 134 | 211 | 298 | 139 | 69 | 301 | 459 | 34 |
Disclaimer/Publisher’s Note: The statements, opinions and data contained in all publications are solely those of the individual author(s) and contributor(s) and not of MDPI and/or the editor(s). MDPI and/or the editor(s) disclaim responsibility for any injury to people or property resulting from any ideas, methods, instructions or products referred to in the content. |
© 2025 by the author. Licensee MDPI, Basel, Switzerland. This article is an open access article distributed under the terms and conditions of the Creative Commons Attribution (CC BY) license (https://creativecommons.org/licenses/by/4.0/).
Share and Cite
Pavlík, M. Ever More Frequent Negative Electricity Prices: A New Reality and Challenges for Photovoltaics and Wind Power in a Changing Energy Market—Threat or Opportunity, and Where Are the Limits of Sustainability? Energies 2025, 18, 2498. https://doi.org/10.3390/en18102498
Pavlík M. Ever More Frequent Negative Electricity Prices: A New Reality and Challenges for Photovoltaics and Wind Power in a Changing Energy Market—Threat or Opportunity, and Where Are the Limits of Sustainability? Energies. 2025; 18(10):2498. https://doi.org/10.3390/en18102498
Chicago/Turabian StylePavlík, Marek. 2025. "Ever More Frequent Negative Electricity Prices: A New Reality and Challenges for Photovoltaics and Wind Power in a Changing Energy Market—Threat or Opportunity, and Where Are the Limits of Sustainability?" Energies 18, no. 10: 2498. https://doi.org/10.3390/en18102498
APA StylePavlík, M. (2025). Ever More Frequent Negative Electricity Prices: A New Reality and Challenges for Photovoltaics and Wind Power in a Changing Energy Market—Threat or Opportunity, and Where Are the Limits of Sustainability? Energies, 18(10), 2498. https://doi.org/10.3390/en18102498