Article

Kinetic Analysis of Construction, Renovation, and Demolition (CRD) Wood Pyrolysis Using Model-Fitting and Model-Free Methods via Thermogravimetric Analysis

1
Institut d’Innovations en Écomatériaux, Écoproduits et Écoénergies, Pavillon CIPP, Université du Québec à Trois-Rivières, Boul. des Forges, Trois-Rivières, QC G8Z 4M3, Canada
2
Innofibre—Centre d’Innovation des Produits Cellulosiques, 3351, Boul. des Forges C.P.97, Trois-Rivières, QC G9A 5E6, Canada
*
Authors to whom correspondence should be addressed.
Energies 2025, 18(10), 2496; https://doi.org/10.3390/en18102496
Submission received: 11 April 2025 / Revised: 2 May 2025 / Accepted: 9 May 2025 / Published: 12 May 2025

Abstract

:
The pyrolysis of non-recyclable construction, renovation, and demolition (CRD) wood waste is a complex thermochemical process involving devolatilization, diffusion, phase transitions, and char formation. CRD wood, a low-ash biomass containing 24–32% lignin, includes both hardwood and softwood components, making it a viable heterogeneous feedstock for bioenergy production. Thermogravimetric analysis (TGA) of CRD wood residues was conducted at heating rates of 10, 20, 30, and 40 °C/min up to 900 °C, employing model-fitting (Coats–Redfern (CR)) and model-free (Ozawa–Flynn–Wall (OFW), Kissinger–Akahira–Sunose (KAS), and Friedman (FM)) approaches to determine kinetic and thermodynamic parameters. The degradation process exhibited three stages, with peak weight loss occurring at 350–400 °C. The Coats–Redfern method identified diffusion and phase interfacial models as highly correlated (R2 > 0.99), with peak activation energy (Ea) at 30 °C/min reaching 114.96 kJ/mol. Model-free methods yielded Ea values between 172 and 196 kJ/mol across conversion rates (α) of 0.2–0.8. Thermodynamic parameters showed enthalpy (ΔH) of 179–192 kJ/mol, Gibbs free energy (ΔG) of 215–275 kJ/mol, and entropy (ΔS) between −60 and −130 J/mol·K, indicating an endothermic, non-spontaneous process. These results support CRD wood’s potential for biochar production through controlled pyrolysis.

1. Introduction

Construction, renovation, and demolition (CRD) activities generate huge volumes of waste. Particularly, countries where the construction of residential, commercial, and industrial spaces utilizes substantial quantities of wood fall under this case. According to [1] over 500 million tons (Mt) of CRD waste was generated annually across Canada, the USA, and Europe. The management and disposal of CRD wood residues create numerous environmental and economic challenges. This also includes furniture parts that are organically contaminated wood fibers without a promising scope for reuse [2]. Such wood contains treated, tinted, or composite materials infused with chemicals like polyaromatic hydrocarbons (PAHs), heavy metals, paints, lubricants, and resins, making them non-recyclable and deteriorating in quality [3]. Especially, chromated copper arsenate (CCA) remnants in CRD wood waste disposal could face major hurdles in terms of disposal due to rising restrictions [4]. A common, non-advisable practice followed for their disposal is usually landfilling, which causes problems when these toxic substances from CRD wood waste leach into the surrounding soil and groundwater, posing serious risks to human and ecosystem health. The anaerobic decomposition of organic fractions in wood waste within landfills can produce harmful greenhouse gases (GHGs) like methane and carbon dioxide, contributing to the climate crisis [5]. Inadequate monitoring, a lack of public awareness, the absence of strict regulations for landfilling, and the economic/technological burden inflicted on recycling technologies for CRD wood allow handlers to look for easy disposal methods. Even simple sorting is complicated due to the large variability in wood composition with geography and provincial sourcing practices. These externalities exacerbate an already growing strain on limited landfill spaces. Hence, alternative waste management technologies are needed to pave the way for valorizing CRD wood residues to bioenergy, biochemicals, and bioproducts.
Waste forest wood, whether sequestered directly from the forests or sourced from CRD sites, is typically a low-value feedstock with a scarce probability of being reused or recycled. The economic value of such wastes could be improved using efficient thermochemical conversion technologies such as torrefaction, gasification, or pyrolysis [6]. Pyrolysis has immense potential in serving as a recovery pathway for refused wood residues, mainly due to its distinct product stream, moderate operation conditions, and relatively simpler operation/instrumentation than gasification [7]. Upon depolymerization of biomass in low or no oxygen, the transformation yields three major products with high energy and oxygen content: solid biochar, liquid pyrolysis oil or biooil, and pyrolysis gas [8]. Depending upon the application under focus, pyrolysis can either be carried out at low or high temperatures. For instance, low-temperature pyrolysis (<500 °C) produces cyclic, stable aromatics as in biochar, whereas temperatures > 600 °C produce pyrolysis gases that are partly condensable into bio-oil [9]. Bio-oil can serve as a foundation for producing platform chemicals or can be upgraded to fuel intermediates [10]. Pyrolysis gas, commonly referred to as energy-rich syngas, made of CO, CO2, H2, and other light C1–C3, can also serve as a base for liquid synfuels or can be combusted in boilers/furnaces for energy generation, surrounding it from a resource recovery perspective [11]. Biochar may serve as a partial substitute for fossil coal and carbon black in hard-to-abate industrial sectors such as metallurgy, automobiles, construction, agriculture, soil remediation, biogas production, air and water purification [12,13,14,15]. For a complex feedstock like CRD wood, pyrolysis may even trap all inherent hazardous components and immobilize them within the biochar product. But these biochars can eventually cause toxicity concerns because they may contain original PAHs from the wood feed, as well as volatile organic compounds (VOCs), dioxins, and free radicals that are persistent [16].
For safe pyrolysis, other non-wood contaminants like nails, plastics, concrete, glass, and rubber have to be removed without fail during the pre-treatment stages to avoid complications with reactor operation and efficient biomass conversion. On this note, for smooth conversion, CRD wood biomass has to be uniformly size-treated via shredding, grinding, or milling to reduce the particle size so that heat transfer, bulk density, and energy density limitations are subdued [17]. Whenever biochar is leveraged to address environmental or industrial challenges, its stability determines the resistance toward chemical, thermal, or microbial degradation while enabling it to act as a carbon sink [18]. The nature of feedstock and pyrolysis parameters like temperature, heating rate, and biomass residence time (BRT) govern this stability factor through the physicochemical properties of biochar, as understood from research by [19]. The final quality and intended applications depend on how the biomass feedstock is pre-treated, what the process optimization steps are, and the scale of production.
Biopolymers in biomass, such as cellulose, hemicellulose (together called holocellulose), and lignin contents, have specific decomposition pathways that take place at different temperatures and different stages. Solid-gas phase reactions involving multiple reactive species make the prediction of pyrolysis reaction modeling cumbersome [20]. To understand what pyrolysis does to CRD wood biomass, getting to know the kinetics and thermodynamics is beneficial. Kinetics describes the nature and type of chemical reactions occurring during pyrolysis and the energy required to form intermediate complexes and products, whereas thermodynamics describes how energy enters and leaves a system during these chemical reactions. Usually, pyrolysis may contain single-step reactions proceeding individually or multiple competitive biomass breakdown reactions that proceed simultaneously or sequentially, underscoring the intricacies of this process [21]. Yield; ion exchange capacities; and influence of ash, pore size, volatile content, and carbon arrangement in biochar are invariably dictated by the thermal degradation profiles too. Therefore, careful consideration of the various temperatures, heating rates, conversion rates, and selecting appropriate kinetic models is very important to forecast pyrolysis behavior. Thermogravimetric analysis (TGA) is a systematic and structured method used to study the chemical kinetics of biomass pyrolysis. According to [22], for fitting experimental data, assumptions based on different theoretical models are used via model-fitting methods, whereas the biomass conversion rate with the associated temperature required for that conversion at different heating rates is applied to the experimental TGA data via model-free or isoconversional methods (used interchangeably). Kinetic parameters such as activation energy and thermodynamic parameters like enthalpy (ΔH), entropy (ΔS), and Gibbs free energy (ΔG), can be calculated at each heating rate employed to study the influence of pyrolysis process parameters on biomass decomposition [23].
To the best of our knowledge, there has not been a detailed study on the reaction kinetics and thermodynamics of CRD wood waste pyrolysis. Hence, two unique aspects are undercovered here. The first novelty element in this work surrounds the utilization of an underexplored, heterogeneous, and real-world biomass feedstock in the form of CRD wood rejects, laden with organic and inorganic contaminants, to disseminate practical findings on its thermal degradation behavior. The second novel element focuses on extracting kinetic and thermodynamic parameters from the CRD wood TGA weight loss data under multiple heating rates, comparing the results yielded from different models. So, this dual emphasis on feedstock physicochemical/biochemical composition and robust pyrolysis modeling framework could result in meaningful contributions to the field of sustainable waste material management.
To assist in answering these questions, the objectives of our study will be to (a) succinctly explain the theory behind model-fitting and model-free techniques with necessary equations along with the benefits and drawbacks of adapting to these methods; (b) investigate the physicochemical characteristics of biomass, and understand its surface chemical make-up; and (c) analyze the thermochemical degradation reactions via TGA at different heating rates and calculate kinetic and thermodynamic parameters. These measures would facilitate understanding of a robust pyrolysis processes using CRD wood as a substrate for biochar production.
To engage with the aforesaid objectives, the idea behind each model is explored initially, followed by carrying out a compositional, proximate, ultimate, and metal analysis of the CRD wood waste to understand the physicochemical properties of the feedstock. Next, the surface chemistry of CRD wood was also studied using Fourier Transform Infrared (FTIR) spectroscopy to project its composition and structural framework. Subsequently, TGA experiments using CRD wood biomass at four different heating rates—10, 20, 30, and 40 °C/min—were carried out, and the data were cleaned and curated for analysis according to the methods under consideration. Firstly, regarding model-fitting methods, the Coats–Redfern (CR) approximation was utilized. For isoconversional methods, the Ozawa–Flynn–Wall (OFW), Kissinger–Akahira–Sunose (KAS), and Friedman (FM) models were used. Based on the computed activation energy, pre-exponential factor, and other constants, the thermodynamic parameters were calculated. Finally, a prognosis of matching suitable reaction models to specific biomass conversion rates was also attempted.

2. Theory, Materials, and Methods

All analysis were performed using the same CRD wood waste, instrumentation, methods, and by the same technician, like what was elucidated by [3]. The characterization techniques are explained here again for clarity.

2.1. Foundational Derivation

Different biomass sources exhibit different reactions due to variability in composition [24]. Therefore, an exact determination of reaction kinetics during biomass thermal decomposition is almost impossible [25]. To understand the pyrolytic conversion of CRD wood into biochar, TGA of this biomass is carried out at same or different heating rates in the presence of nitrogen as an inert carrier gas. An effective TGA test can mimick crucial process conditions such as the temperature, BRT, heating rate, and feed particle size, which are usually interdependent operational factors in a pyrolysis process that help in critically determining the composition of resulting products [26]. Through a kinetic study, the activation energy of a feedstock can be computed to evaluate its reactivity, estimate its conversion efficiency, and assist in scale-up considerations to larger pyrolyzers during the design phase [27].
Rate of reaction for biomass in an isothermal condition is given as
d α d t = k f ( α )
Here, k is the reaction rate constant, which is temperature-dependent; dα/dt is the change in mass of biomass taken for the analysis with respect to time (also referred to as biomass conversion rate); and f(α) is a differential function representing reaction models and governed by different reaction schemes presented in Table 1.
k = ( d α d t f α )
In the above equation, α, which represents a fractional change in mass of biomass reactant, can be represented as
α = ( x o x t ) ( x o x f )
Here, xo is the initial mass of biomass sample used for the kinetic study by TGA, xf is the final mass of sample at the end of TGA, and xt is the mass of sample in the TGA cycle at a given time t. Decomposition rate of biomass as a function of temperature can be construed using the Arrhenius equation as follows:
k = A exp ( E a R T )
In the above expression, A is the pre-exponential or frequency factor (s−1 or min−1), which represents the extent of molecular collisions in the wake of thermal decomposition at a given time and temperature; Ea is the activation energy required to cleave the bonds between feedstock biopolymers, namely cellulose, hemicellulose, and lignin (J/mol); R is the universal gas constant (8.3145 J/mol·K); and T is the temperature at which a particular stage of conversion proceeds (K). Upon substituting the reaction rate constant k from Equation (2) within the global one-step Arrhenius expression in Equation (4), we arrive at
d α d t = A exp E a R T f ( α )
For a specific heating rate (K/min or K/s adopted during TGA, the temperature of the system is ramped up with respect to time and is, hence, a non-isothermal process. Note: K/min is also the same as °C/min due to the same magnitude with respect to a common time frame. An increase in K by one unit is identical to an increase in °C by one unit.
β = d T d t   ( or )   d t = d T β
By inserting the above heat rate expression and substituting for dt in Equation (5), we arrive at
β d α d T = A exp E a R T f ( α )
Equation (7) can be re-written as
d α d T = ( A β ) exp E a R T f ( α )
This serves as the basic expression that could be leveraged for model-fitting and model-free methods to be built further.

2.2. Model-Fitting and Model-Free TGA Methods Rooting from Foundational Equations

Generally, to perform a kinetic analysis and calculate corresponding parameters, TGA can incorporate two approaches: model-fitting and model-free methods, which can detail a thermal decomposition process [28].

2.2.1. Model-Fitting Methods

As the name suggests, model-fitting method assumes that the experimental data obtained from any thermal decomposition reaction should fit into a pre-theorized model [29]. This is where the predicted term f(α) as in the aforementioned equations comes into play: to describe the relationship between the degree of biomass conversion or α and the overall rate of reaction, where only a single heating rate is sufficient. As outlined in Table 1, various forms of f(α) can take shape according to the type of reaction mechanism chosen for analysis that provide the output values of Ea and A [25,26,27,30].
Chemical reactions can be classified into first, second, and third order based on how the reaction rate relates to the concentrations of reactants. First-order reactions are reliant on the concentration of a single reactant, second-order reactions involve two reactants, and third-order reactions may include combinations of three reactants or elevated powers of one reactant. In biomass pyrolysis, biopolymers such as cellulose and lignin act as reactants, enabling numerous simultaneous reactions within the biomass. This study emphasizes these three orders, as higher-order reactions are uncommon and necessitate substantial energy to surpass activation energy barriers for multiple reactants to effectively collide. Furthermore, the diffusion mechanism pertains to the rate-limiting step regarding the movement of reactants, intermediates, and products through a medium [31] which can be characterized as one-dimensional, two-dimensional, or three-dimensional diffusion. One-dimensional diffusion occurs in a singular direction, like within linear, constrained porous channels. Two-dimensional diffusion takes place at surfaces or boundaries, while three-dimensional diffusion involves movement in all spatial directions, typical of bulk solid regions. In systems related to biomass pyrolysis, mass and heat transfer are affected by these types of diffusion, which are influenced by reaction time, residence time, and temperature. Phase interfacial reactions occur at the junctions between solids and liquids or gases, influenced by aspects such as adsorption, diffusion, and desorption processes [32]. The rate of these reactions depends on factors such as surface area, composition, particle size, residence time, temperature, and the presence of reactive atmospheres. In the process of converting biomass to biochar, heat transfer mechanisms, namely, convection from the carrier gas and conduction from the surrounding biomass, are crucial. This conversion can result in the creation of secondary char and pyrolytic volatiles through random nucleation and growth mechanisms, where surface superstructures evolve into new phases that may display isotropic or anisotropic qualities [33]. This transformation might depend on how long surface clusters remain on the biochar and the temperature conditions that facilitate repolymerization and polycondensation reactions, akin to the processes seen in hydrothermal carbonization (HTC)-derived biochar [34]. Given its carbonaceous nature, biochar remains inherently reactive and continues to undergo various phase interfacial reactions even after its production, which is evident by its tendency to self-ignite when exposed to heat or air adsorption.
Table 1. Probable reaction mechanisms exhibited (non-exhaustive) during biomass pyrolysis. Adapted from equations in [25,26,27,35]. Here, g(α) is the integral function of f(α).
Reaction ModelType/MechanismDenotationf(α)g(α)
ChemicalFirst-orderF11 − α−ln(1 − α)
Second-orderF2(1 − α)2(1 − α)−1 − 1
Third-orderF3(1 − α)3[(1 − α)−2 − 1]/2
DiffusionOne-dimensionalD10.5αα2
Two-dimensionalD2[−ln(1 − α)]−1(1 − α)ln(1 − α) + α
Three-dimensional Jander (J)D31.5(1 − α)2/3[1 − (1 − α)1/3]−1[1 − (1 − α)1/3]2
Three-dimensional Ginstling-Brounshtein (GB)D41.5[(1 − α)−1/3 − 1]−1(1 − 2α/3) − (1 − α)2/3
Interfacial PhaseOne-dimensionalR11α
Two-dimensionalR22(1 − α)1/21 − (1 − α)1/2
Three-dimensionalR33(1 − α)2/31 − (1 − α)1/3
Nucleation and growthTwo-dimensionalA22(1 − α)[-ln(1 − α)]1/2[−ln(1 − α)]1/2
Three-dimensionalA33(1 − α)[−ln(1 − α)]2/3[−ln(1 − α)]1/3

Arrhenius Model

As seen in Equation (8), it is important to note that heating rate is brought in here and matters mostly when the temperature profile, as a function of time, is combined with the Arrhenius expression during non-isothermal reactions. This can be seen in complex reaction models to theoretically simulate real-world thermal depolymerization processes like pyrolysis, gasification, or combustion, where how much time a sample is subjected to a particular temperature can alter the conversion rate. Such models also introduce the element of non-equilibrium dynamics, such as complex heat-transfer mechanisms. On the other hand, the standalone Arrhenius equation assumes a steady-state reaction where the temperature during a conversion process is held constant (isothermal) with negligible changes. Even though this model assumes a system under equilibrium, it is not used here to imply that pyrolysis by itself, is a reversible process. However, it is highlighted here just as a relative empirical approximation that could be used to discern the critical role of heating rate as in a non-isothermal and non-equilibrium system and also to arrive at a comparison between kinetic parameters derived from the two cases. Equation (8) is simplified as
d α d t f ( α ) = A exp E a R T
Here, by applying the natural logarithms on both sides, we conclude with the expression of the basic Arrhenius model:
l n d α d t f ( α ) = l n A + 1 T E a R   ( or )   l n k = l n A + 1 T E a R
Plotting l n d α d t f ( α ) or ln(k) versus (1/T) results in a straight line with a negative slope of (−Ea/R), while the y-axis intercept can be used to directly calculate A [36]. With respect to l n d α d t f ( α ) , different reaction models and the equations for calculating their corresponding f(α) are described in Table 1.

Coats-Redfern (CR) Model

The CR method is a model-fitting technique used in chemical kinetics to study thermal decomposition of solid biomass matter, irrespective of woody or non-woody nature [37]. It is widely used by researchers for analyzing the pyrolysis of lignocellulosic materials. The CR model functions as an integral of Equation (1). To understand how we land at the CR expression and for calculation clarity, [26] state that a primary model function for biomass pyrolysis kinetics can be interpreted as
f α = ( 1 α ) n
where n is the order of reaction (1, 2, 3, …, n). Also, unlike the Arrhenius model, the CR model does not assume a steady-state or isothermal model and can function effectively by following different heating rates (β). So, by substituting Equation (11) in Equation (8),
d α d T = A β exp E a R T ( 1 α ) n
Upon rearranging this equation, it can be formulated as
d α ( 1 α ) n = A β exp E a R T d T
Now, introduction of the term g(α), i.e., the integral conversion of f(α) linking the extent of reaction to temperature and time, takes precedence, which is based on a specific reaction mechanism encountered by biomass during pyrolysis. Integrating within the limits of α = 0 and α = α at T = 0 and T = T, respectively [35,38] generates the following:
g α = 0 α d α ( 1 α ) n = 0 T A β exp E a R T d T
After integrating Equation (14) on the LHS first,
1 ( 1 α ) 1 n 1 n = A β T 0 T exp E a R T d T
Following the recommendations by [35], after integration on RHS, Equation (15) becomes
1 ( 1 α ) 1 n 1 n = A R T 2 β E a 1 2 R T E a exp E a R T
Rearranging Equation (16),
1 ( 1 α ) 1 n T 2 ( 1 n ) = A R β E a 1 2 R T E a exp E a R T
As shown by [38], assuming that 1 2 R T E a 1 and can be neglected, Equation (17) can be reframed as
1 T 2 1 ( 1 α ) 1 n ( 1 n ) = A R β E a exp E a R T
Applying natural logarithms on both sides of Equation (18), we get
l n 1 T 2 1 ( 1 α ) 1 n ( 1 n ) = l n A R β E a + 1 T E a R
Albeit, the above equation is valid for n≠1. According to [39], pyrolysis of lignin-based solids is a first-order reaction, where n = 1. Moreover, according to [40], CR method adopts the basis of a single-stage first-order reaction during thermochemical breakdown of a solid fuel. Thus, Equation (19) becomes
l n l n ( 1 α ) T 2 = l n A R β E a + 1 T E a R
By inserting the integral function once again in Equation (20), we can simplify the expression as
l n g ( α ) T 2 = l n A R β E a + 1 T E a R
For different reaction models (chemical reaction, diffusion, phase interfacial, nucleation, and growth) and associated mechanisms, the corresponding value of g(α) can be used from Table 1 to calculate kinetic parameters. Plotting l n g ( α ) T 2 versus 1 T gives a straight line with a negative slope equivalent to E a R . With the known value of Ea, it is possible to calculate A using the y-axis intercept l n A R β E a .
Four key shortcomings of model-fitting methods are as follows: (a) the value of Ea is subjected to heavily depend on the reaction model assumed, when in reality, there is significant possibility of a process to manifest itself via several other models; (b) secondly, if the wrong model is chosen, the reliability of the measured kinetic parameter value can be questionable; (c) thirdly, a model-fitting method like CR may function harmoniously only at one specific heating rate at a given time where different reaction mechanisms can be tested under one roof for satisfactoriness rather than several heating rates simultaneously, as in iso-conversional models; (d) fourthly, despite providing an overview of Ea under many assumed models, it is a highly time-consuming method. Henceforth, while using model-fitting methods, it is advisable to assume as many reaction models as possible to help in quantitative analysis of Ea from more than a single perspective. In fact, it may be safe to say that convoluted processes such as pyrolysis can exhibit a myriad of simultaneous (parallel), sequential or both types of reactions at once. When using this approach, it could be possible to also narrow down on the ideal model using correlation coefficient (R2) and simple cross-comparison.

2.2.2. Model-Free or Iso-Conversional Methods

Model-free kinetic methods do not assume that a chemical reaction progresses as per a pre-selected model under only a single heating rate. It considers the possibility of addressing complex chemical reactions at multiple heating and conversion rates [41]. Here, different values of α (in the range of 0–1) are used to calculate Ea without the necessity for g(α) intervention, thereby offering greater flexibility for the method [42]. It is here that common slow pyrolysis heating rates are employed (10–40 °C/min in our case) in the presence of nitrogen to detect variations in Ea at each stage of α. Different values of α are obtained in different phases of pyrolysis, due to which kinetic parameters under variable heating rates need to be compared and fitted separately one after the other [39]. In other words, we will be plotting for one α value (e.g., α = 0.1) at all four heating rates (10, 20, 30, and 40 °C/min), proceed to the next conversion value (e.g., α = 0.2) at the four heating rates, and so on till α = 1. Variations in extracted Ea, for instance, may indicate that biomass decomposition in a pyrolysis-like setting encompasses an interplay of many different reaction mechanisms and not just one that improves overall dependability and robustness of the derived values of Ea. Although it is not necessary to use g(α) to calculate Ea, model-free methods need this function to calculate A and still depend upon a specific reaction model and mechanism. This is, without a doubt, a notable drawback of model-free methods that accentuates a limitation in fully characterizing both kinetic parameters without the role of assumptions. Also, model-free methods are criticised since they are too simplistic and general in describing a complex process like pyrolysis [26].
There are different model-free methods used in practice of approximating Ea of pyrolysis reactions, like FM, KAS, OFW, Vyazovkin (VZ), and distributed activation energy model (DAEM), that offer high simplicity during calculations. Among these, FM, KAS, and OFW are used in this study as representative methods. They are able to analyze complex reactions as a function of biomass conversion value, α. Using the expressions studied by [43,44], the following Table 2 illustrates the expression for these methods, values of constants/variables, and the procedure for plotting to evaluate kinetic parameters.

2.3. Thermodynamic Study

During pyrolysis, thermodynamic parameters such as ΔH, ΔS, and ΔG are calculated using the following equations adapted from [45].
H = E a R T m
G = E a R T m l n K B × T m h A
S = H G T m
In the above equations, Tm is the maximum thermal decomposition temperature of CRD wood biomass that was obtained from DTG curves at each heating rate (10–40 °C/min). Ea is the activation energy derived using isoconversional models of OFW, KAS, and FM at each heating rate and conversion stage. Pre-exponential factor, A, was also calculated from the respective plot using the intercept. KB is the Boltzmann constant of 1.381 × 10⁻²³ J/K, and h is the Plank constant, 6.626 × 10⁻³⁴ J/s.
Equation (25) is however, a general and simplified expression that could be used to calculate the thermodynamic parameters, and it may not cover all intricacies posed by multi-step biomass pyrolysis reactions. Rather, it conservatively represents a general overview of the wood matrix decomposition. If over-simplification of pyrolysis occurs, especially by neglecting critical energy barriers, activation energy calculations could be erroneous, inevitably influencing entropies since they are very small.

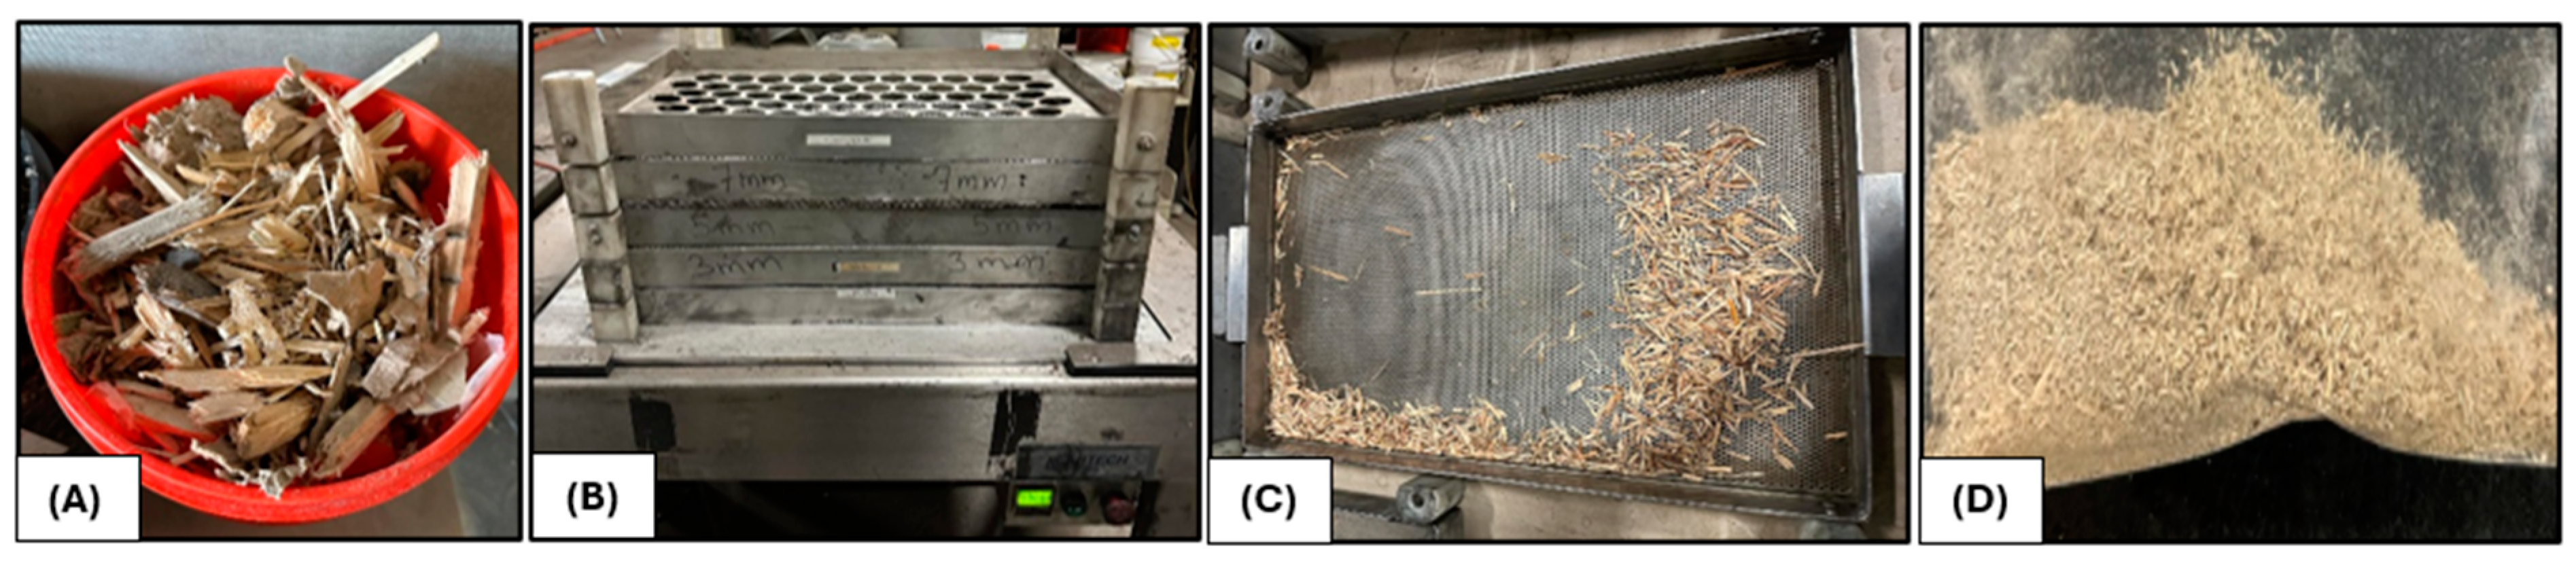
2.4. CRD Wood Biomass Sample Preparation for Characterization and Kinetic Analysis

Non-recyclable CRD wood sourced from “BRQ Fibre et Broyure” in Trois-Rivières, Québec, was delivered in pails to the Innofibre facility Figure 1A. After collecting, the CRD wood underwent mechanical sieving using a Labtech vibrational sieving unit to separate it into different particle sizes (>4.5 cm till >0.3 cm) after screening and removal of contaminants (Figure 1B). In fact, no washing was carried out due to the risk of creating contaminated wastewater from the leaching of impurities present in the CRD wood. Once the size separation was completed, the selected biomass fraction in Figure 1C was dried for an entire night at 105 °C. Given that sieving only led to particle sizes of up to 0.3 cm, it was necessary to mill the CRD wood further. A Retsch SM300 mill (3 kW motor and 100–3000 rpm), featuring a high-speed tungsten carbide rotor and screens with openings as small as 500 µm, or a Thomas Wiley mill with a similar mesh size, was utilized to produce fine particles, as shown in Figure 1D, from the biomass for subsequent analysis.

2.5. Physicochemical Characterization

Proximate analysis was employed to evaluate ash content, volatile carbon (VC), and fixed carbon (FC) in biomass. For the ash measurement, 1 g of dry biomass fines was placed into a crucible and heated in a muffle furnace. Beginning at room temperature, the sample was heated to 106 °C at a rate of 5 °C/min and maintained at this temperature for 1 h to ensure that most residual moisture is removed. Then, the temperature was increased at the same rate from 106 °C to 550 °C to decompose labile extractives and organics under controlled heat transfer. At 550 °C, the wood sample was held for a duration of 4–6 h for further degradation of any combustible biomass components. The sample was then allowed to cool to room temperature in a desiccator to prevent any hygroscopic effects, after which the ash was weighed to ascertain the proportion of biomass remaining. For volatile carbon, 1 g of dry biomass fines was subjected to heating at 900 °C for 7 min in a sealed crucible, after which it was cooled and weighed to quantify the carbon lost. VC is utilized in certain contexts in this study to specifically refer to labile carbon, distinguishing it from other volatile components. FC was calculated using the relation FC = 100 − (VC + ash) as weight percent dry basis (wt%DB), where VC and ash are also represented as wt%DB [46].
For the ultimate analysis, an Elementar Vario Macro Cube examined 1–200 mg of dry biomass fines for elements such as carbon, hydrogen, nitrogen, and sulfur, utilizing helium (purity > 99.996%) as the carrier gas and oxygen (purity > 99.996%) for combustion up to 1200 °C. The oxygen content was determined by calculating the difference from 100%, using the percentages of all individual elements and ash, as given in [ o x y g e n = 100 ( c a r b o n + h y d r o g e n + n i t r o g e n + s u l f u r + a s h ) ] . It is derived from [47].
The higher heating value (HHV) of CRD wood biomass was determined using a similar approach outlined by [48]. This approach correlated the calorific value with elemental composition obtained from ultimate analysis of the biomass sample. For metal detection in biomass, an Agilent Technologies 4210 Microwave Plasma Atomic Emission Spectrometer (MP-AES) was utilized, which featured a nitrogen fuel source and an SPS 4 autosampler. This apparatus allowed for the simultaneous analysis of multiple elements by aerosolizing the biomass sample into a nitrogen plasma to produce monoatomic ions. The device guaranteed accurate measurements of the inorganic content by completely digesting the organic materials found in the biomass.

2.6. Composition Analysis

The presence of extractives, structural carbohydrates, and lignin in CRD wood biomass were analyzed according to National Renewable Energy Laboratory (NREL, United States of America Department of Energy) procedures as described in [49,50] respectively.

2.7. FTIR

The distribution of surface functional groups in biomass was examined using an Agilent Technologies Cary 630 spectroscope, with Microlab 5.8 and Microlab Expert 1.3 for operation. About 1 g of dry biomass fines was placed on a diamond crystal surface that was regularly cleaned with ethanol. The analysis was performed in transmittance mode over a spectral range of 500–4000 cm⁻1 to determine the chemical bonds present in the material. Baseline and peak corrections were applied to the obtained spectra, followed by signal smoothing.

2.8. TGA

In order to examine the weight loss pattern of biomass in relation to temperature, a PerkinElmer TGA 8000 analyzer was utilized. This device was also able to assess proximate analysis parameters such as moisture, VC, FC, and ash. Only 8 mg of biomass fines in their original, non-dried state were needed per vial for the analyzer. Since TGA was leveraged to analyze the pyrolysis kinetics of CRD wood, the process gas used during heating was compressed nitrogen with a purity level exceeding 99.996%. The system was capable of accurately reaching temperatures up to 1200 °C with adjustable heating rates. For this research, 10, 20, 30, and 40 °C/min were employed, reaching a maximum temperature of 900 °C to investigate the transformation of biomass to biochar. Differential thermogravimetric (DTG) curves were generated by differentiating the weight loss features from the original thermogram in relation to time and plotting them against temperature. This led to the identification of different peaks indicating the points of maximum weight loss or melting of the sample during TGA, along with the corresponding temperatures, providing insights into biomass chemical composition and hydrocarbon structure.

3. Results and Discussion

3.1. Physicochemical Properties of CRD Wood—Comparative Analysis with Other Biomass Feedstock

The proximate and ultimate analysis parameters of CRD wood biomass were analyzed, as shown in Table 3. The elemental composition, particularly carbon content in CRD wood, resembled hardwoods like beech and poplar, reaching 49–50% despite containing softwood residues in the bale. In terms of carbon content, MSW outperformed all the feedstocks, with a carbon content of 76.26% due to a heterogeneous composition involving plastics and other hydrocarbon-rich residues. Oxygen (41.74%) and hydrogen (6.12%) were also equivalent to the ranges in hardwood species. These bolster the role of CRD wood biomass in bioenergy applications for the production of biofuels, biochemicals, and bioproducts. Low sulfur (from gypsum dust, if any) and nitrogen content in CRD wood also means that the release of NOx and SOx could be starved during pyrolysis. For proximate parameters, CRD wood is a low-ash biomass at 1.17% relative to high-ash agricultural residues like rice husk at 14.20% or medium-ash sources like MSW (8.26%).
However, as delineated in Figure 2, the metal content in CRD wood, mainly alkaline and alkaline earth metals (AAEM) (86–87%), was very high which may result in secondary reactions by acting as indirect catalysts, leading to excess loss of carbon or technical snags in reactor equipment through slagging, fouling, or bed agglomeration [62,63]. However, among AAEM, alkaline earth metals like Ca, Ba, and Mg constituted 59.96%, whereas alkaline metals made up just 27.03%. So, there could be a possibility where the melting of ash may be pushed toward relatively higher temperatures since the presence of divalent species dominated this AAEM fraction. On the contrary, the other possibility with high AAEM could be secondary char formation [64]. AAEM, when present with woody biomass under pyrolysis temperatures of 350–750 °C, may increase the yield of biochar through secondary reactions [65]. This holds true for an AAEM-rich feedstock like CRD wood. Additionally, CRD wood contains some heavy metallic contaminants like Cu, Cr, and mild levels of As. Other heavy metals detected were mainly Zn and Pb. All these metals are part of preservatives, paints, varnishes, roofings, and surface coatings in conditioned CRD wood that are usually part of residential buildings, electricity poles, and handrails dating back to the 1960s–1990s. The VC in CRD wood (82.35%) matches VC in poplar (83.60%) and beech (84.87%), confirming highly decomposable fractions. Also, due to high volatiles and low ash, woody biomass could produce biochar product with high FC [66]. Also, due to the lower ash content that minimizes the presence of non-combustible materials, the HHV of CRD wood biomass is relatively high, at 20.28 MJ/kg, rendering it suitable for bioenergy applications [67]. On the contrary, a high ash rice husk had a low HHV at 14.09 MJ/kg. Wheat straw with moderate ash also had a low HHV of 15.29 MJ/kg. Another pattern observed is that as volatiles increase, HHV decreases due to the non-availability of stable carbon. This was true for MSW (51.13%) and pinewood (64.37%) relative to CRD wood (82.35%), where the increase in volatiles decreased HHV from 29.70 MJ/kg, 22.33 MJ/kg, and 20.28%, respectively.

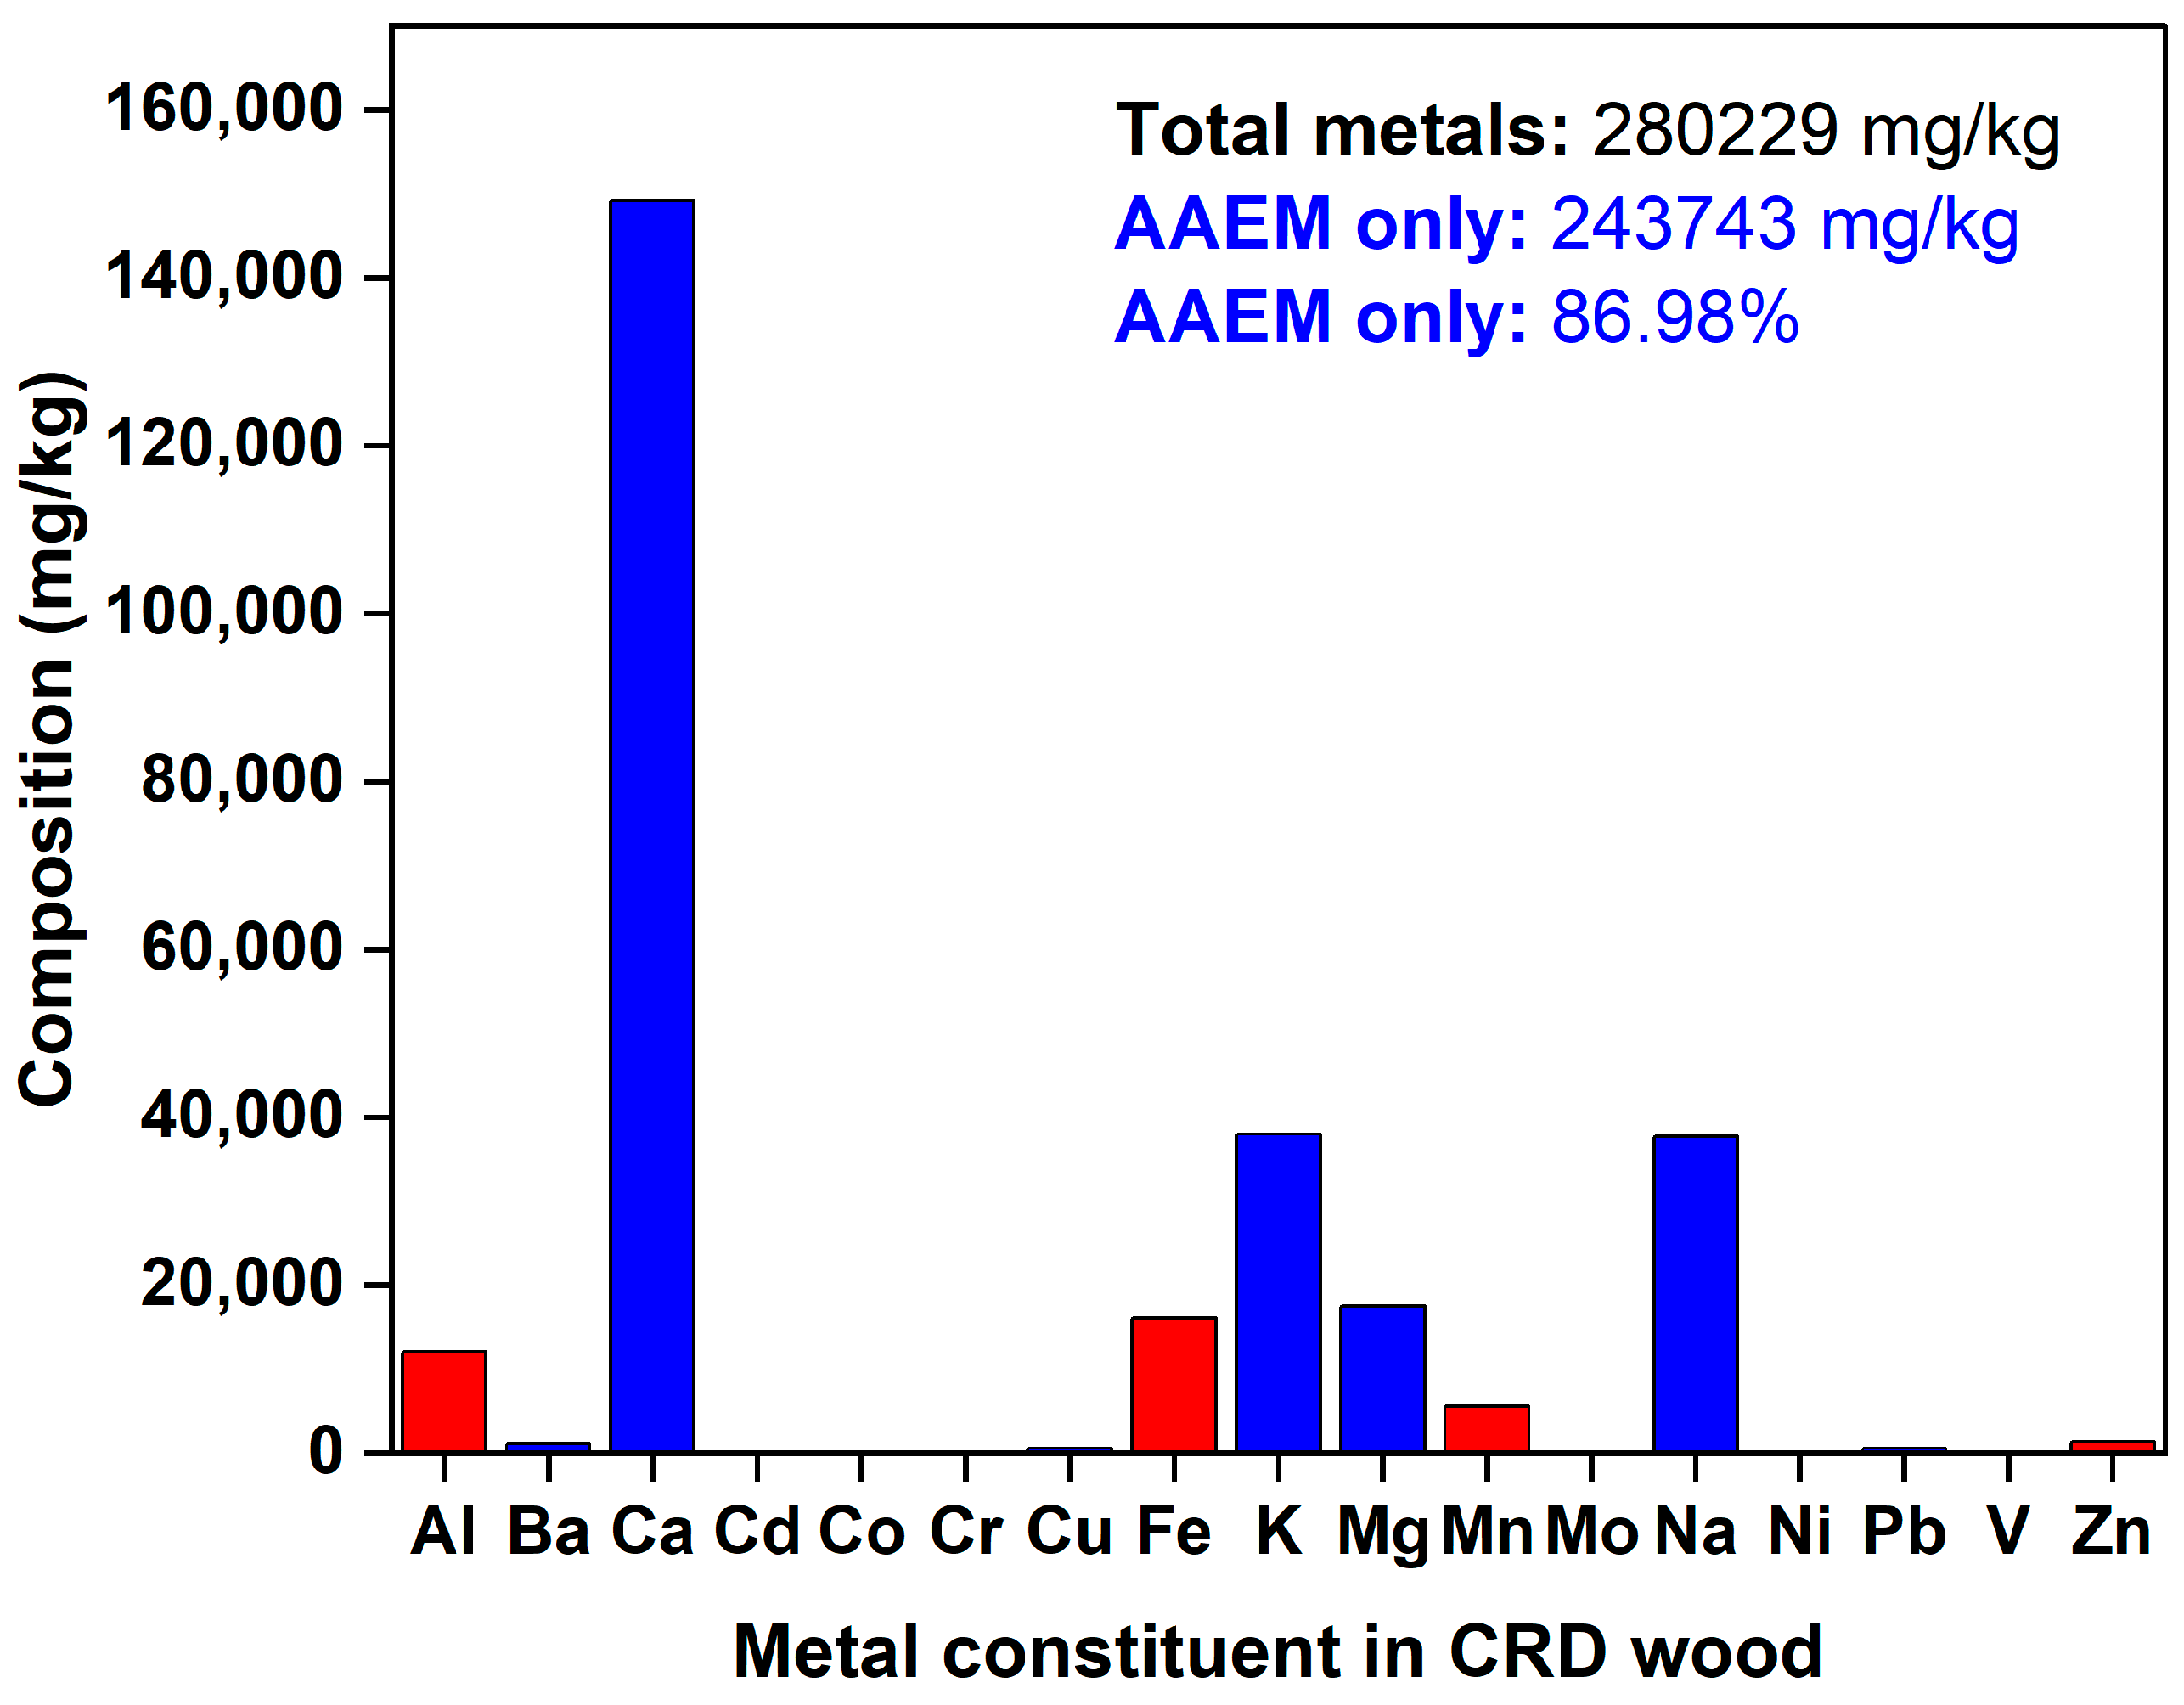
3.2. CRD Wood Compositional Analysis

To achieve a representative and robust analysis of CRD wood biomass received, samples from four different sections of the pail, post-sample preparation steps, were subjected to compositional analysis. Percentages of extractives, holocellulose, and lignin are listed in Table 4, which may explain the nature of biomass transformation to biochar. Extractives soluble in hot water and ethanol ranged from 2 to 3.5% and 2.5 to 4%, respectively, which are usually eliminated as volatiles. Since total lignin varied from 24 to 31%, it is conclusive that CRD wood is composed of both hard and softwood and may be called "wood waste" that has a comparable lignin content, recorded at 28.9%, as shown by [68]. As shown by [69], biochar produced from agriculture wastes like buckwheat husk (holocellulose: 73.72%, lignin: 24.73%), spent coffee grounds (holocellulose: 31.58%, lignin: 23.65%), hazelnut shell (holocellulose: 62.31%, lignin: 28.30%), and waste grass biomass like hemp (holocellulose: 25.81%, lignin: 20.69%) and miscanthus (holocellulose: 63.11%. lignin: 25.48%) were also compared. The greater the lignin, the greater the structural complexity due to the presence of aromatics, and the greater the biochar yields [70]. However, the lignin content in biochar is not a solely conclusive indicator of the mechanical strength/integrity and yield of biochar [71,72]. However, in lignin, if softened and melted to form condensed aromatic structures, the overall bulk density and resistance to breakage may increase [62]. The carbon content and stability of biochar could be largely conserved as well. The total holocellulose content in CRD wood varied from 68 to 77%. With six-carbon sugars like glucose (44–54%), galactose (0.5–2.5%), and mannose (2–10%), and five-carbon sugars like xylose (8–24%) and arabinose (0–1.5%), hemicellulose decomposition in CRD wood to pyrolysis gases at lower temperatures is plausible. The overall contribution to char formation is low for hemicellulose. Cellulose decomposition could favor both condensed volatiles and intermediates (high temperatures) and some char (lower temperatures) formation. This is determined by the temperature, BRT, and heating rate employed during the process [73].

3.3. FTIR Spectroscopy Analysis

The FTIR spectral distribution of the CRD wood biomass is shown in Figure 3. A high concentration of specific functional groups in the CRD wood biomass feed is denoted by strong transmittance peaks of infrared light through the sample, which demonstrate specific vibrational patterns: stretching or bending. Spectral band assignments from [74,75] were used to match the transmittance peaks in CRD wood biomass to relevant functionalities. Firstly, the distinct peak at 3320 cm−1 indicates O-H stretching vibrations, as in moisture, carboxylic acids, alcohols, and phenols. Secondly, the distinct peak at 2892 cm−1 could signify C-H stretching in aliphatic hydrocarbons, as in alkanes that are subunits of most biomass polymers. Thirdly, the spectral band at 2003 cm−1 highlights stretching vibrations in alkynes (C≡C) that may be ascribed to polyaromatics with maximal carbon condensation. Next, a carbonyl stretch (C=O) in aldehydes, ketones, esters, and carboxylic acids appears around 1730 cm−1, which stems from hemicellulose in CRD wood. This contributes to the loss of biomass carbon as CO and CO2 during the onset of pyrolysis. A subdued peak at 1503 cm−1 and 1265 cm−1 means there are faint aromatic C-C and aromatic C-O ring stretching actions, respectively, amidst the biomass carbon skeleton. Methyl, methylene, or methoxy groups of biomass lignin also exhibit these vibrations owing to the presence of dense organic residues in biomass. A sharp band at 1022 cm−1 may be due to C-O stretching in aliphatic ethers (C-O-R) and alcohols (C-O-H) that are key building blocks of carbohydrates/polysaccharides. The 799 cm−1 band could be an extractive in biomass, showcasing the C-H bend in alkynes, phenyl rings, or aromatics, followed by the band at 664 cm−1 stemming from C-H vibrations in alkenes.

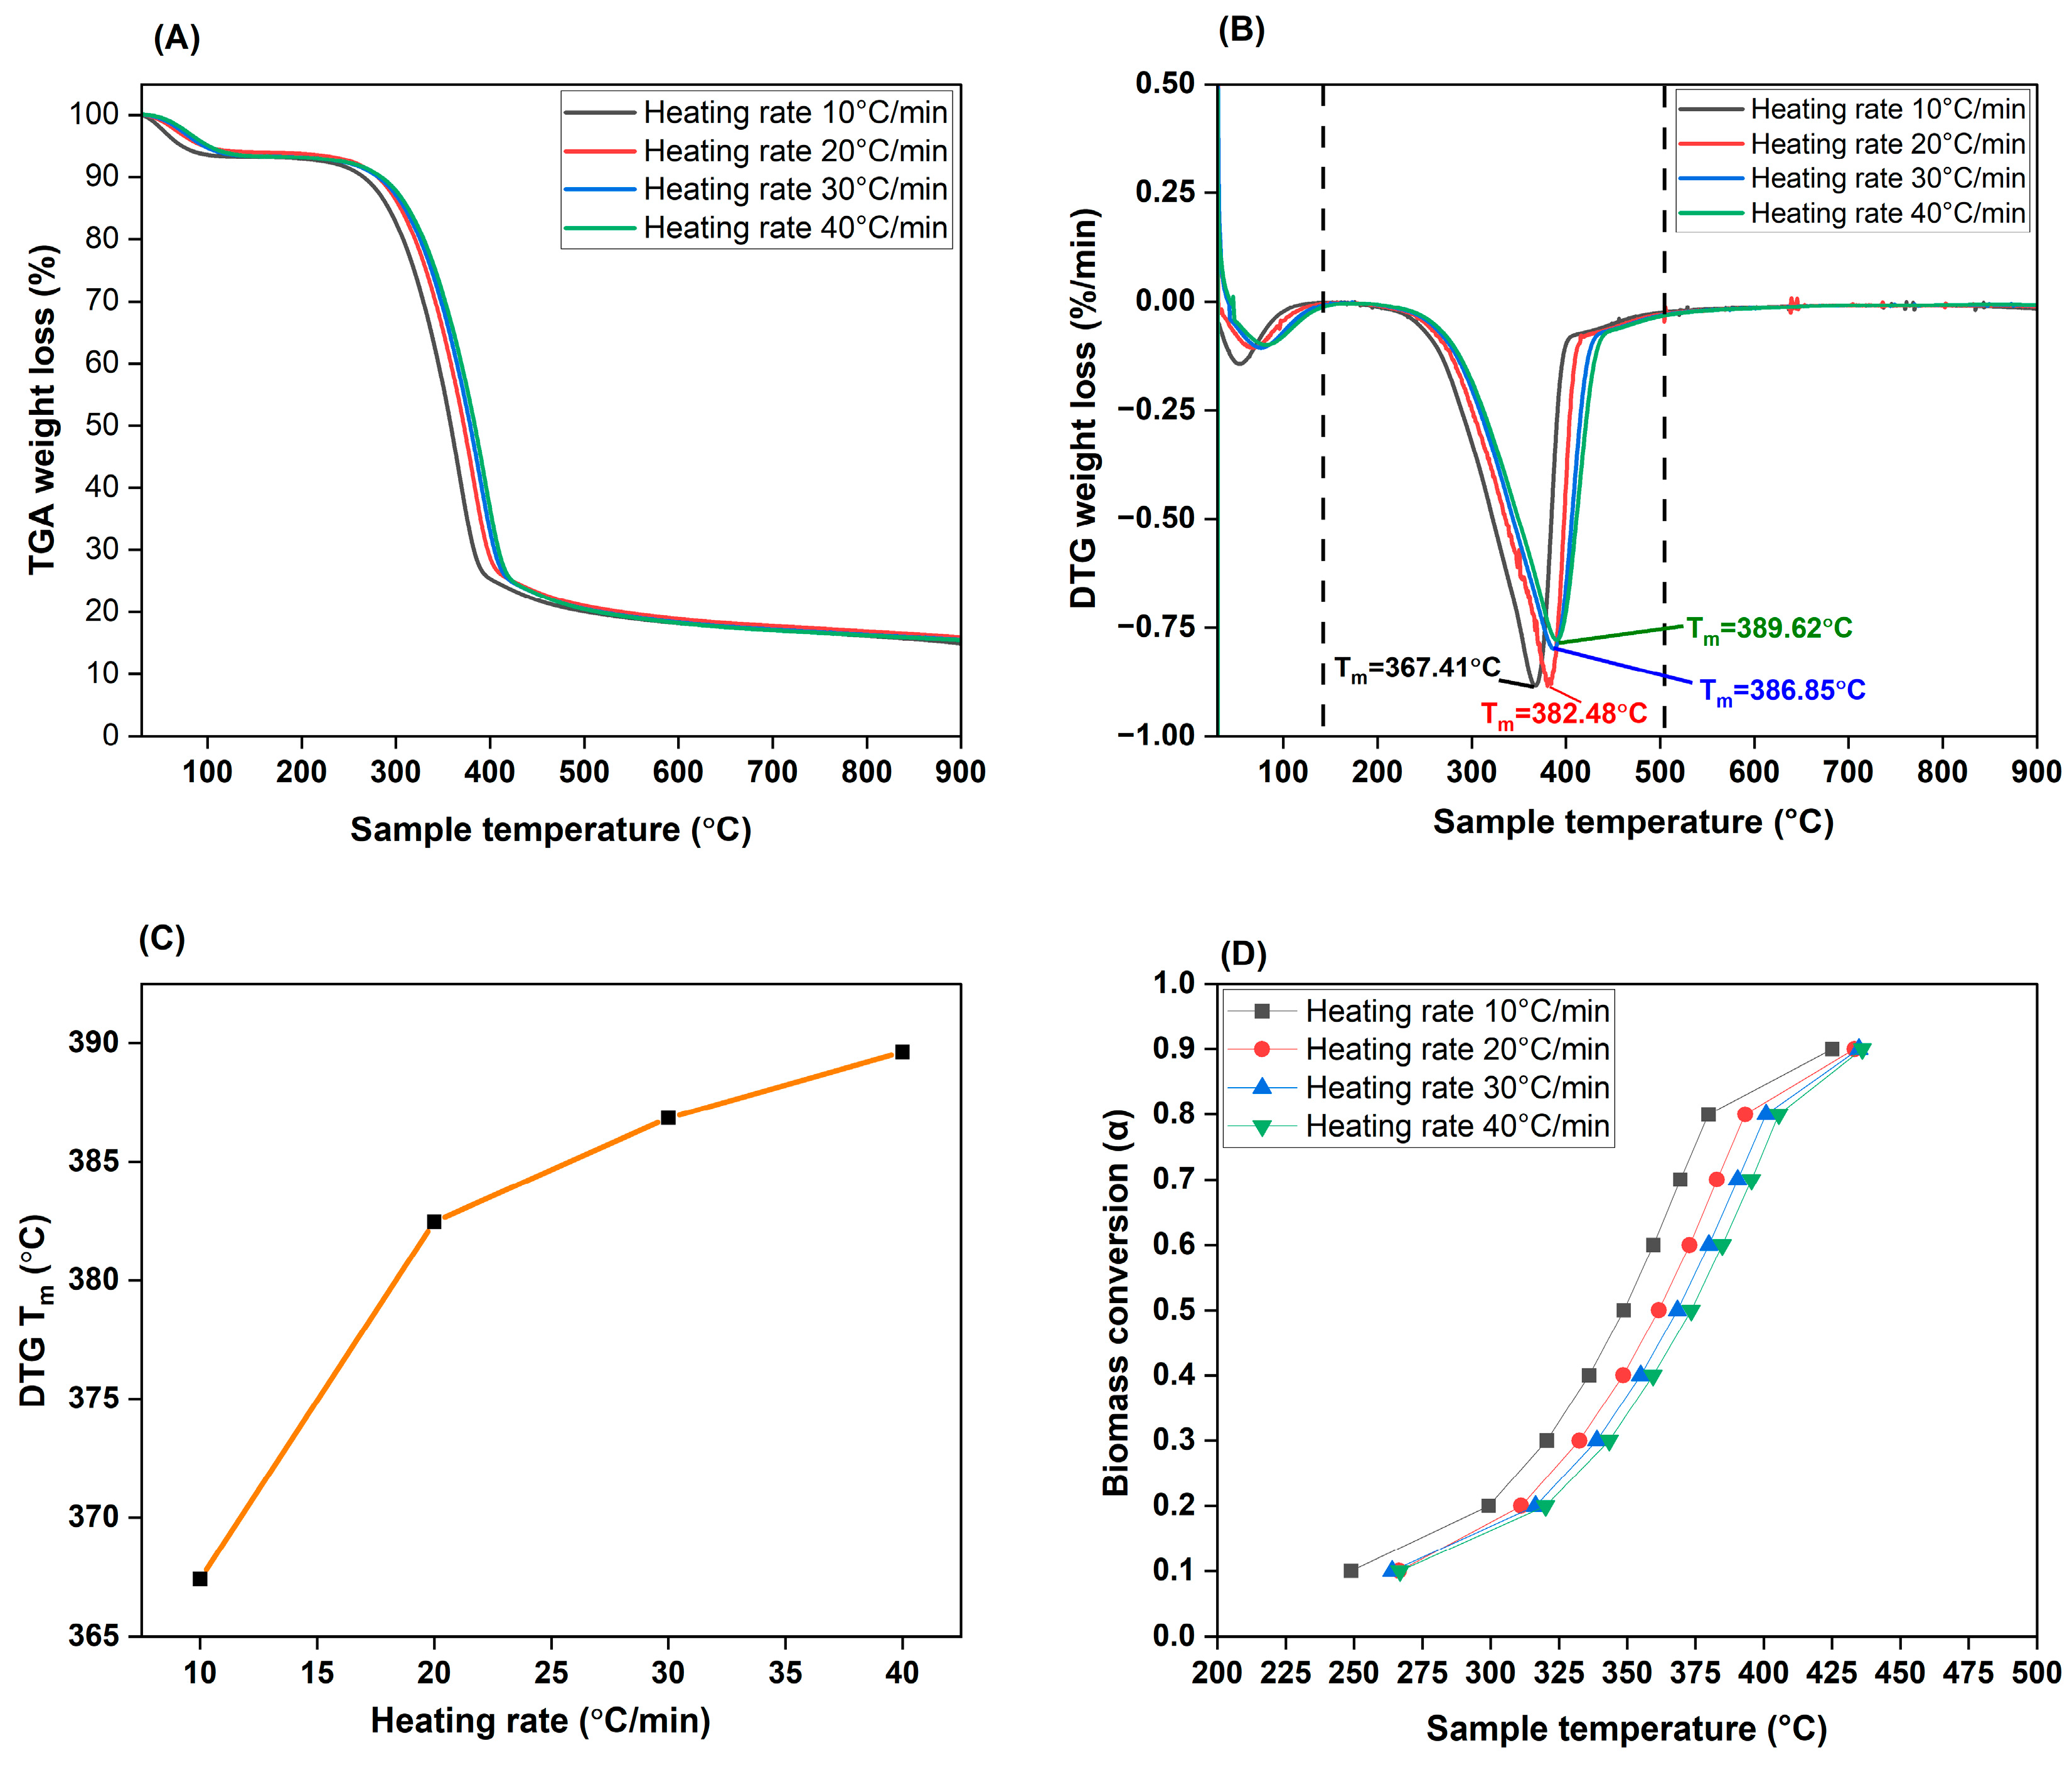
3.4. TGA Analysis and Effect of Heating Rate

The thermal stability of CRD wood biomass was verified by TGA and DTG curves. The weight loss exhibited by biomass under four different heating rates, 10, 20, 30, and 40 °C/min, along with their stages of thermal degradation under an inert nitrogen atmosphere mimicking pyrolysis, were studied, as shown in Figure 4. In the TGA plot in Figure 4A, it is evident that an increase in the heating rate pushes the degradation temperature slightly higher (to the right), as reported by [76]. This is because an increase in the heating rate means that there is less time for heat to permeate from the surface to the core of the biomass particle, and that too, only non-linearly. So, the weight loss encountered is restricted as a surface effect rather than occurring throughout the particle and is hence low. At a lower heating rate, an inverse phenomenon, where there is gradual heat transfer that devolatilizes biomass constituents to fruition over an ample time frame, is clear. The biomass’s outer layer and the core inside reach almost similar temperatures, allowing a linear thermal behavior. This is validated by the maximum weight loss (72.73%) between 200 and 400 °C for the heating rate of 10 °C/min, followed by 69.45%, 64.95%, and 60.85% for the heating rates of 20, 30, and 40 °C/min, respectively. However, despite an increase in the heating rate by every 10 °C/min, the profile for degradation curves is unchanged, as concurred by [77].
If we look more closely at the DTG peaks for these heating rates, weight loss happens in three stages. The first stage occurs < 150 °C, where evaporation of moisture and other surface-bound volatiles occurs [78]. Around 5–7% weight loss happened here. As seen in Figure 4B,C, within the second stage from 200 to 400 °C, the melting temperatures of biomass (Tm) for each heating rate was observed to increase with an increase in the heating rate (367.41 °C for 10 °C/min to 389.62 °C for 40 °C/min), validating our earlier finding that greater BRT at that specific temperature means that there is adequate time for biomass to experience loss of structural integrity by efficiently exposing its biopolymers for cleavage, signifying an ongoing pyrolysis process [79]. This region encompasses extractives, VOCs, hemicellulose, and cellulose breakdown, respectively, with peak decomposition mainly between 350 and 400 °C. Since cellulose is a straight-chain, crystalline polymer, it needs greater energy to collapse and, hence, disintegrates after relatively less stable hemicellulose degrades to a large extent. Biomass carbon (e.g., carbon loss via CO2 and CO) and heteroatom (e.g., H2S, SO2, and NH3) rejection reactions from holocellulose, followed by the simultaneous heat uptake to initiate destabilization of lignin aromatics (e.g., phenols), are key reactions that increase the yield of gas and condensible volatiles. In the conversion (α) plot in Figure 4D, we can see that 80% (α = 0.8) is completed around 400 °C. In this second stage, profound mass loss of 60–73% took place. Beyond this point, the third stage of decomposition is rather slow and proceeds well-spaced out due to complex lignin fractions and other high-molecular-weight compounds. Moreover, since CRD wood contains noticeable AAEM and other metals/inorganics in its ash fraction, it could be stable up to a certain level and delay breakdown. This is when char generation peaks due to both primary and secondary pyrolysis reactions. It is safe to say that no additional peaks were observed, which means that significant degradation of inorganic material may not be accounted for. At the end of the process, about 20% of the initial mass of CRD wood remains. All in all, there was another interesting observation. At higher heating rates of 30 and 40 °C/min, decomposition peaks appear to overlap, which indicates that the degradation of biomass polymers may not be completely separated processes and could occur sharply within a narrow temperature range and as synchronous steps. As concluded by [76,80], the thermal decomposition patterns remained fairly consistent across all the heating rates tested.

3.5. Kinetic Analysis of CRD Wood Pyrolysis

3.5.1. Model-Fitting Method

Being a model-fitting technique, the CR method fits TGA data of biomass pyrolysis to various kinetic models used for calculating the activation energies and pre-exponential factors. The calculations in Table 5 surrounded all models for the four different heating rates, i.e., 10–40 °C/min. The correlation factor (R2) was used to judge the probability of each reaction model being interplayed. No marked increase in activation energy existed between different heating rates, although it was maximum for 30 °C/min, as shown in Figure 5.
For chemical reaction models (F1, F2, and F3), an increase in reactants necessitated either higher temperature or reaction time because of a high activation energy demand. This is to overcome any heat or mass transfer limitations during pyrolysis, which is mainly attributed to the rampant molecular collisions within CRD wood biomass contributing to complex, overlapping reactions. It ranged from 65–68 kJ/mol for F1 to 129–133 kJ/mol for F3 as the heating rate increased, indicating energy-intensive heterogeneous structures competing in the reaction. This is supported by a concomitant increase in the pre-exponential factor as well. However, the average R2 is between 0.92 and 0.98, suggesting a relatively lower correlation of these reaction models w.r.t. their counterparts. Due to the highest activation energies recorded for F3 (more than any other reaction model tested), it may be possible to assign its role for higher conversion stages (α > 0.6), where a thorough rearrangement of biochar’s chemical structure is probable, as concluded by [81].
For the diffusion model, activation energies collectively ranged from 98 to 129 kJ/mol, with a dominant effect from linear (D1), planar (D2), and spherical (D3) diffusion mechanisms. These models dominate the thermochemical data of CRD wood, as extrapolated in the findings by [82]. The average R2 is > 0.99, highlighting their pivotal part in thermal decomposition, where the migration of volatiles and pyrolysis products could happen through porous channels and at the boundary layers. Diffusion was deemed suitable for coconut shell feedstock with a comparable activation energy of 68.9 kJ/mol, granting an appreciable bioenergy potential [83]. A high correlation factor for the diffusion model was also shown for feedstocks like wood sawdust and wheat straw [84]. In the case of any energy applications for CRD wood, D1, D2, and D3 models may govern the diffusion of ambient air/oxygen and volatile matter that initiate ignition and proceed till final combustion. This concept was also proposed by [85]. As in [86], the D3 model showed the highest activation energy for pyrolysis of MSW, which could contain easily decomposable constituents. Meanwhile, in the CRD wood D3 model (125–129 kJ/mol with R2 > 0.99), it corresponded to a high activation energy for carrying forward diffusion within constricted spaces, especially upon clogging of porous channels with residual tar. This may also mean that surface-based diffusion has lower resistance and takes place more freely until an intermediate or product layer forms that impedes any progress. Due to high activation energies overall, F3, D1, D2, and D3 models can be attributed to the second (200–400 °C) and third (400–600 °C) stages of the TGA cycle, where the majority of disintegration reactions happen for CRD wood pyrolysis. An average activation energy of up to 84 kJ/mol was obtained by [87] for almond shell pyrolysis using the CR method, where the decomposition reactions occur in the range of 150–550 °C as well. All these results were commensurate with CRD wood.
The occurrence of phase interfacial reactions (R1, R2, and R3) are also explainable due to a high correlation of >0.99. The results here are comparable to [88], where D3 and R3 majorly drove the biomass decomposition along with F1, F2, …Fn. This means that decomposition of biomass could begin from the surface toward the less-reacted, unconverted core. As a result of constant interaction between reactants and products at an interphase, product layers are formed and sequentially shift from the outside to the inside of the biomass particle. This is why biochar production is favored at lower heating rates since it allows sufficient time for this gradual conversion. The activation energy here was lower than chemical reaction and diffusion models, at 43–60 kJ/mol. Finally, less energy (15–30 kJ/mol) was needed for secondary pyrolytic intermediates and product formation through A2 and A3 nucleation mechanisms (R2 = 0.97–0.99). For this mechanism, inherent AAEM and other inorganics may have coincidentally aided in secondary charring and volatile formation by behaving as catalysts.
As depicted in Figure 5, a notable difference in activation energies existed only at a heating rate of 30 °C/min, which may signify maximum conversion at this point, unlike the ideal TGA curves, where thermal decomposition temperatures increased closely (367–390 °C) with a step-wise increase in the heating rate owing to a reduced depolymerization time, especially near the less conductive core. The same trends were observed for all other models, too. [77] reported a similar finding, where activation energies increased till a specific heating rate, after which they stabilized or dropped. However, this could be the case only till the maximum conversion is attained, after which activation energies may decrease. This was also concurred with by [35]. On the whole, since each reaction model has a different but reasonably high correlation factor (R2 ≥ 0.92) and variable activation energies, it is difficult to assign the most suitable pathway, mainly because the pyrolytic decomposition of biomass could be viewed as a simultaneous process rather than being assumed as an individualistic system. This was exactly proved by [37].

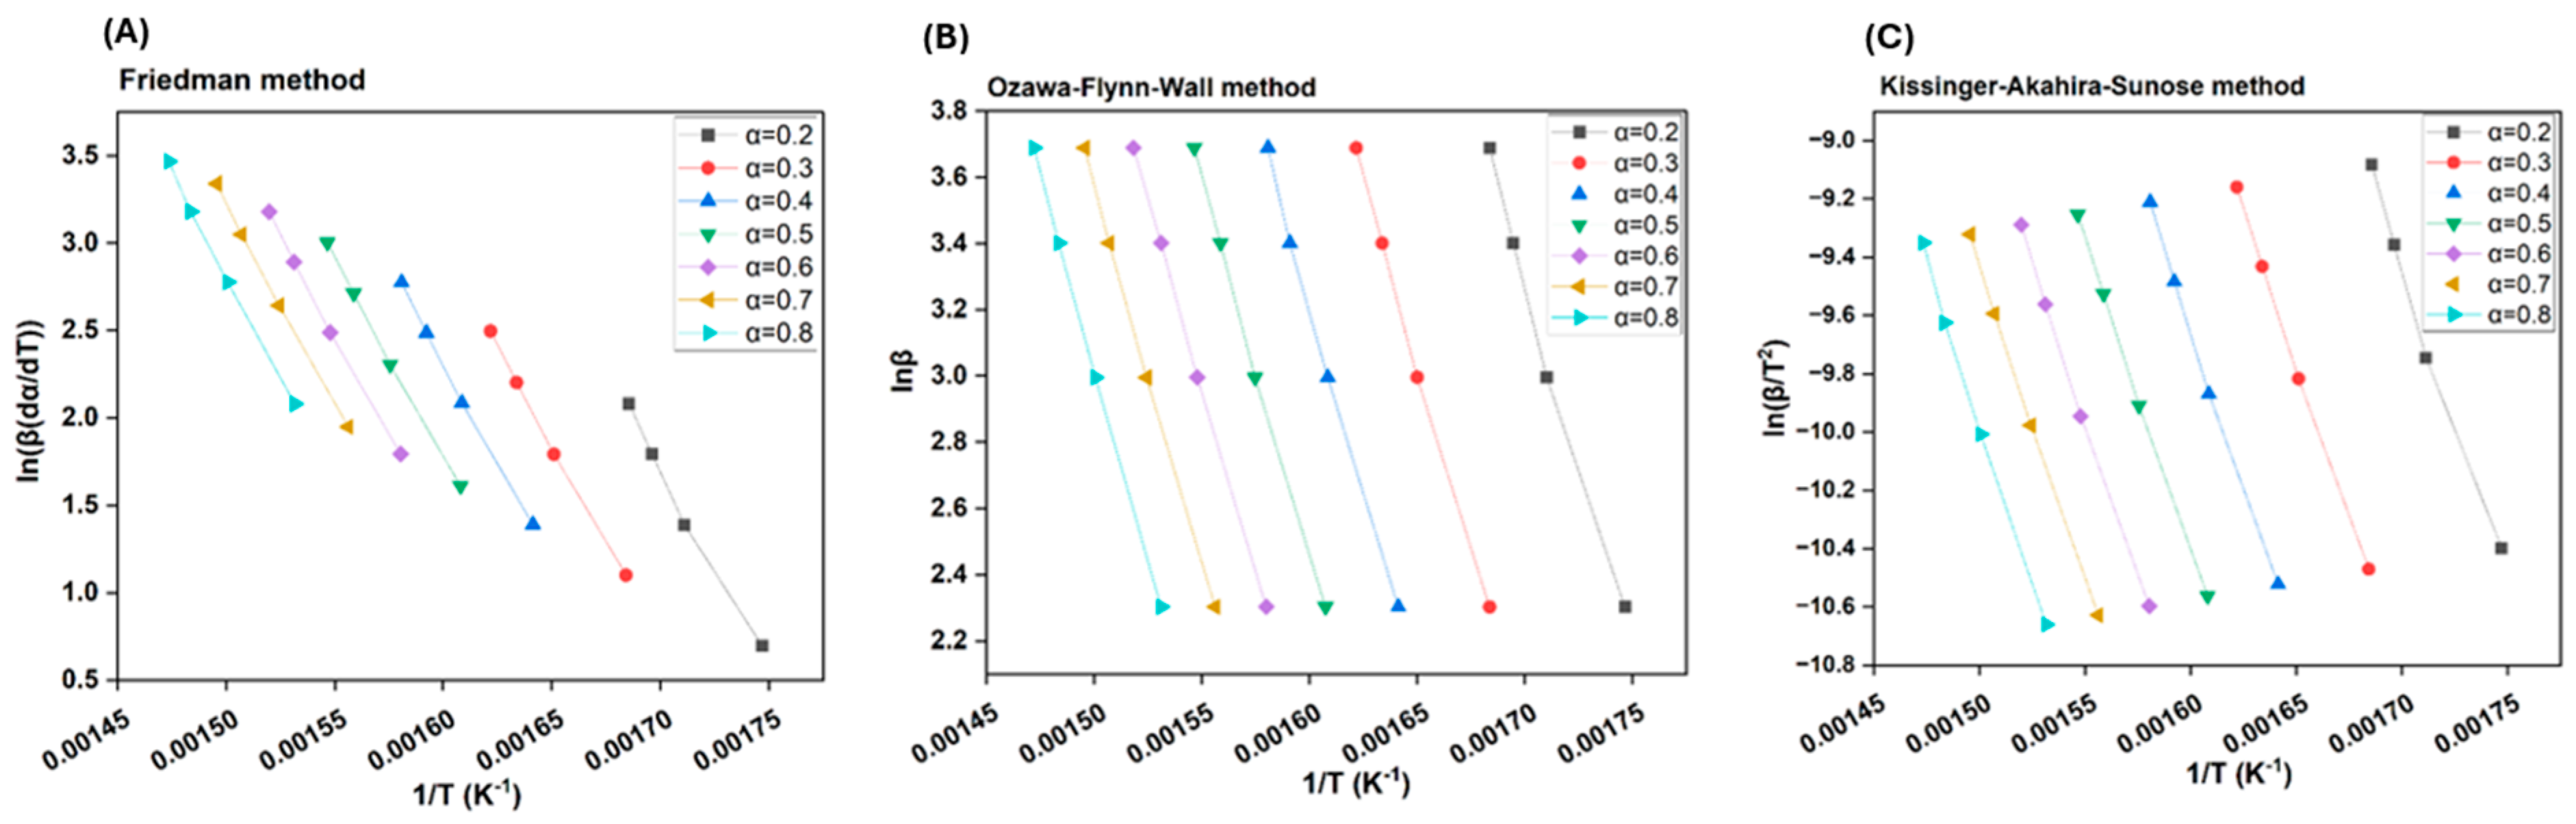
3.5.2. Model-Free Methods

Model-free or isoconversional methods like OFW, KAS, and FM did not rely on any pre-determined reaction models for computing the variable activation energies of biomass pyrolysis reactions [55]. Instead, the biomass conversion rate, or α, was relied upon for thermal degradation studies. However, as outlined by [89], isoconversional models have limitations wherein they assume only a single-step reaction and could neglect the role of competing reactions. On the other hand, the kinetic analysis of CRD wood using the CR method proved that competing reaction models are plausible for a thermochemical process like pyrolysis. A kinetic analysis, whether performed using model-fitting or model-free methods, considers biomass particles that weigh between 6 and 8 mg, i.e., very small. Henceforth, the temperature on the surface can reach the center of the same particle within a short time frame, disregarding any heat transfer limitations. However, in actual pyrolysis reactors, the particle sizes of biomass can increase from a few cm to several inches, and even to logs. This is where the importance of heat conductivity is compromised, but in reality, the temperature requirements rise drastically to satiate high activation energies for biomass conversion. Thus, a TGA-based study may mostly function depending upon kinetics only and could often overlook the particle size, heating rate, composition of biomass (the percentages of holocellulose and lignin), and the externalities caused by them. In Figure 6A,B, KAS and OFW plots together seem to slightly differ from the FM plot.
For reference, the calculated kinetic parameters with the model correlation for each conversion stage are listed in Table 6. For this tabulation, α > 0.8 and α < 0.2 were not considered due to relatively low R2 (0.41–0.64 for α = 0.1; 0.90–0.93 for α = 0.9) and non-linearity. For other conversion rates, R2 is >0.99, except for α = 0.2, under KAS and FM methods (R2 = 0.98). A high correlation means that activation energies derived at these conversion rates using the three methods are accurate and dependable. The activation energies under OFW, KAS, and FM methods for α = 0.2–0.8 ranged from 172 to 185 kJ/mol, 176 to 186 kJ/mol, and 185 to 197 kJ/mol, respectively. This work discovered very minimal differences between overall activation energy requirements, along with an increase in heating and conversion rates, which may suggest fairly quick chemical reactions for the formation of activated intermediates, as stated by [90]. An α = 0.8 showed the highest activation energy since the decomposition in this phase may have occurred against highly stable aromatics in lignin and resolute inorganics/AAEM in ash.
FC in CRD wood biomass at 16–17% could also be targeted for decomposition during this stage. A significant difference in activation energy between each conversion rate was not observed since they varied very narrowly, just like the TGA curves. Moreover, there was no defined increase in activation energy, and it more or less adopted a partly sinusoidal pattern. These fluctuations could be due to complex multi-step reactions, as discussed by [27]. We may, hence, infer that 82–83% of VC in CRD wood biomass’s holocellulose component could be targeted from α = 0.2–0.7. A momentary jump in Ea could indicate that the VC in biomass was either from heavier lignin bridges or was part of an organo-metallic linkage (e.g., Fe-O-C; AAEM-O-C), which demands high energy for cleavage. These are confirmed by FTIR and SEM analyses, which show the presence of a myriad of functional groups and metal content co-existing with biomass carbon and manifesting different degradation behaviors. Since the activation energy crosses 170 kJ/mol even at an initial conversion rate of 0.2, we may conclude that the overall rate of the reaction was slow. A summary plot of all isoconversional methods for conversion rates between 0.2 and 0.8 is shown in Figure 7.
CRD wood may, thus, be an ineffective direct fuel source because it needs a high amount of energy to start reacting. Converting it into biochar will help ease conductivity and heat transfer issues, resulting in faster reaction times.

3.6. Thermodynamic Parameters

For thermodynamic parameters, α < 0.2 and α > 0.8 are not considered because of low correlation factors encountered during the calculation of activation energies. As tabulated in Table 7, for OFW, KAS, and FM methods, ΔH did not vary largely with heating rates. Likewise, a lower influence of increasing conversion rates on ΔH also meant that the difference in energy requirement between reactants and the intermediates is lower, which can aid in faster formation of activated complexes. Concomitantly, positive values of ΔH indicated endothermic (exothermic if ΔH < 0) reaction steps with heat absorption for biomass conversion, which is in agreement with the findings by [91]. ΔH was 179–180 kJ/mol, 179–181 kJ/mol, and 190–192 kJ/mol for OFW, KAS, and FM methods. This is in line with the findings for another woody biomass (Ficus Nitida), as discussed by [92]. ΔG, which describes the spontaneity of a reaction or a system, indicated a minor increasing trend with positive values for all heating rates, conversion rates, and methods. This means that the process was not spontaneous (only if ΔG < 0) and needed an external energy source to drive all parallel, sequential, and competing reactions. A ΔG of 215–230 kJ/mol was observed for both OFW and KAS methods between 0.2 and 0.8 conversion rates, which represented consistent results. However, for the FM method, ΔG ranged a bit higher, from 250 to 275 kJ/mol. This is in agreement with the studies mentioned by [93].
A chemical reaction like pyrolysis usually supports greater disorderliness and randomness, represented by the system’s entropy (ΔS > 0), where a solid biomass material breaks down into volatiles, gases, and oil, which are relatively fluid and harbor greater molecular freedom. On the contrary, as shown in Table 7, the ΔS values for OFW (−60 to −80 J/mol·K), KAS (−60 to −85 J/mol·K), and FM (−110 to −130 J/mol·K) non-isothermal methods are largely negative (ΔS < 0), which may mean that biomass samples under consideration could have lower molecular freedom and need more energy to embrace further structural transformations during pyrolysis, as reflected by [2]. Low ΔS could also hint that biomass may have undergone very gradual physical/chemical transformations, consistent with [45]. On the thermodynamic forefront, negative ΔS could arise from the formation of a more ordered or stable activated complex when some decomposition reactions unfolded, as indicated by [94], who used a heterogeneous and moderate-ash biomass feedstock (wheat straw). In other words, structural rearrangements of biomass in its intermediate state could have introduced a certain degree of resistance to degradation. Given the highly heterogeneous nature of CRD wood feedstock, composed of variable lignin percentages and painted or treated surfaces laden with diverse organic and inorganic constituents, localized chemical reordering could be plausible. This could lead to a limited molecular motion and thus, negative ΔS. Interestingly, negativity in ΔS decreases with an increase in α till a certain point, signifying growing randomness in the system, before it increases yet again at higher α—possibly due to the influence of ash matter or the formation of stable metal–organic carbon complexes under high-temperature decomposition.

3.7. Summary

To summarize, the kinetic analysis of CRD wood pyrolysis utilizing model-fitting and model-free methods provided notable insights into the topic of the thermochemical decomposition of complex heterogeneous biomass. This work revealed that a reasonable lignin content and low ash content make waste CRD wood a promising feedstock for pyrolytic biochar production. The decomposition process exhibited three distinctive breakdown phases: till 150 °C, 200–400 °C, and 400–600 °C, during which where peak weight loss occurred between 350 and 400 °C. Under the four different heating rates (10–40 °C/min) tested, the model-fitting CR method derived activation energies ranging from 65 to 133 kJ/mol for the chemical reaction models (F1, F2, and F3), 98 to 129 kJ/mol for the diffusion reaction models (D1, D2, D3, and D4), 43 to 60 kJ/mol for phase interfacial reaction models (R1, R2, and R3), and 15 to 29 kJ/mol for random nucleation and growth reaction models (A2, A3). A peak in activation energy was seen, especially at 30 °C/min, for all schemes. Model-free or isoconversional OFW, KAS, and FM methods yielded activation energies between 172 and 196 kJ/mol for the conversion rates of 0.2–0.8. Thermodynamic evaluations indicated positive values of ΔH and ΔG, signifying an endothermic and non-spontaneous pyrolysis process.
Subsequent work in the domain of CRD wood pyrolysis kinetics and thermodynamics proffers understated research gaps. Firstly, CRD wood from different regions could be tested to understand the effect of feedstock variability with geography, demolition practices, and pre-processing/pre-treatment steps on thermal decomposition behavior. Secondly, different heating rates under 10 °C/min can be experimented with to discriminate TGA over significantly slower pyrolysis conditions and their role in intrinsic heat transfer for a given biomass particle size. Another interesting area of work could be to estimate the kinetic and thermodynamic behavior of CRD wood co-pyrolysis with other organic substrates. On the whole, the present manuscript is important for readers since it addresses the pressing issue of CRD wood waste management and also offers a viable valorization pathway via pyrolysis. Through the kinetic and thermodynamic analysis, this work contributes to some nascent knowledge on the interplay of pyrolysis-independent variables, like the heating rate and temperature, the biochemical composition of CRD wood, and their synergistic influence on its strucutral breakdown.

4. Conclusions

TGA was employed to assess the thermal stability and kinetic behavior of CRD wood biomass under pyrolysis conditions. Different heating rates were utilized to analyze its thermochemical decomposition, revealing that the degradation is very complex, harbors multiple reaction steps, and could be jointly influenced by the feedstock’s biochemical and surface chemical composition. To calculate the kinetic parameters of pyrolysis, the weight loss data from TGA were ascribed to model-fitting and model-free/isoconversional methods, which enabled the calculation of activation energies: the former method dependent on specific assumptions pertaining to different reaction models, while the latter method without any assumptions of such reaction schemes and only functioning on the basis of biomass conversion levels (α). The CR method’s perspective ranked pyrolytic transformation based on the degree of fit or correlation obtained by ascribing TGA data to each model equation. The highest R2 (consistently >0.99) was, however, only achieved for the diffusion and phase interfacial models, thereby bolstering their criticality in biomass pyrolysis. Higher heating rates during TGA also shifted the peak melting temperatures of biomass constituents to higher temperatures, necessitating optimization toward the direction of slow pyrolysis with low heating rates and long BRT. This could make sure there is gradual yet steady heat transfer from the surface to the core of every biomass particle, aiding complete conversion. On the other hand, the model-free OFW, KAS, and FM methods offered simple and time-effective calculations of pyrolysis kinetic parameters. Simple and straightforward estimations could be drawn for most biomass conversion stages (α = 0.2–0.8), where the highest R2 (mostly >0.99) was obtained. Extrapolating activation energies to specific energy demands across the pyrolytic transformation of CRD wood was possible and also corroborated with findings from similar works. Overall, despite a detailed outlook, experimental TGA data were well-aligned with kinetic models. Even thermodynamically speaking, these TGA tests that mimicked pyrolysis-like conditions proved that CRD wood thermal degradation is an energy-intensive process. The TGA results could be crucial for scaling up the pyrolysis of CRD wood since they offer inputs on the decomposition kinetics of a biomass material within thermochemical settings. Moreover, insights on the stability, reactivity, and disintegration of biomass polymers at specific conditions of temperature, heating rate, and BRT could be obtained, which are essential for designing pyrolysis systems.
As much as the benefits of TGA-based kinetic parameter approximations have been discussed, acknowledging their limitations also remains vital. Firstly, these tests were conducted with meagre amounts of feedstock (8–10 mg) under controlled laboratory settings that may not represent pilot, demonstration, or industrial-scale settings that are largely dynamic environments. Secondly, the particle size of biomass and the role of heat transfer within the particle differ largely between such settings. Thirdly, nuances in larger pyrolysis systems, such as the residence and eventual settling of volatiles on biomass, the cracking of volatiles and their role in carbon polymerization to PAHs, and the interplay of any vacuum/suction effects across the reactor, may not be achieved within TGA set-ups. Lastly, based on the different methods used to calculate kinetic parameters, especially model-fitting methods like CR, there could be inaccuracies posted due to the selection of wrong reaction models, assumptions, and corresponding findings derived that may fail to capture some intricacies of pyrolysis at higher scales.

Author Contributions

Conceptualization, methodology, validation, formal analysis, investigation, data curation, writing—original draft preparation, editing, and visualization—A.G. Supervision and mentorship—S.B. Supervision, review, and mentorship—S.L. Supervision, review, editing, and mentorship—O.R. Supervision, review, editing, and mentorship—Y.B. Project administration—C.B. All authors have read and agreed to the published version of the manuscript.

Funding

This research was funded by MITACS (MITACS: IT40901), through Escouade Energie, Citeq, and supported by Innofibre, and I2E3—UQTR, Québec, Canada. The work was conducted at Innofibre—Centre d’Innovation des Produits Cellulosiques, Trois-Rivières, and at the Institute for Innovation in Ecomaterials, Ecoproducts, and Ecoenergies (I2E3), the University of Québec Trois-Rivières (UQTR), Québec, Canada.

Data Availability Statement

Data will be shared upon request.

Acknowledgments

Due credit is given to the technicians, researchers, and colleagues who were a critical part of this work.

Conflicts of Interest

The authors declare no conflict of interest. The funders had no role in the design of the study; in the collection, analyses, or interpretation of data; in the writing of the manuscript; or in the decision to publish the results.

Abbreviations

AAEMAlkaline and alkaline earth metal.
BRTBiomass residence time.
CCACopper, chromium, and arsenic.
CRCoats–Redfern.
CRDConstruction, renovation, and demolition.
DBDry basis.
DTGDifferential thermogram.
FCFixed carbon.
FMFriedman.
FTIRFourier Transform Infrared.
GHGsGreenhouse gases.
HHVHigher heating value.
HTCHydrothermal carbonization.
KASKissinger–Akahira–Sunose.
MP-AESMicrowave Plasma Atomic Emission Spectrometer.
MtMillion tons.
OFWOzawa–Flynn–Wall.
PAHPolyaromatic hydrocarbon.
TGAThermogravimetric analysis.
VCVolatile carbon.
Wt%Weight percent (used interchangeably with %).

References

  1. Laadila, M.A.; LeBihan, Y.; Caron, R.F.; Vaneeckhaute, C. Construction, renovation and demolition (CRD) wastes contaminated by gypsum residues: Characterization, treatment and valorization. Waste Manag. 2021, 120, 125–135. [Google Scholar] [CrossRef] [PubMed]
  2. Kumar, I.; Tirlangi, S.; Kathiresan, K.; Sharma, V.; Madhu, P.; Sathish, T.; Ağbulut, Ü.; Murugan, P. Co-pyrolysis of furniture wood with mixed plastics and waste tyres: Assessment of synergistic effect on biofuel yield and product characterization under different blend ratio. Sci. Rep. 2024, 14, 24584. [Google Scholar] [CrossRef] [PubMed]
  3. Ganesan, A.; Rezazgui, O.; Langlois, S.; Boussabbeh, C.; Barnabé, S. Pyrolytic conversion of construction, renovation, and demolition (CRD) wood wastes in Québec to biochar: Production, characterization, and identifying relevant stability indices for carbon sequestration. Sci. Total Environ. 2025, 965, 178650. [Google Scholar] [CrossRef] [PubMed]
  4. Gmar, M.; Bouafif, H.; Bouslimi, B.; Braghiroli, F.L.; Koubaa, A. Pyrolysis of chromated copper arsenate-treated wood: Investigation of temperature, granulometry, biochar yield, and metal pathways. Energies 2022, 15, 5071. [Google Scholar] [CrossRef]
  5. O’Dwyer, J.; Walshe, D.; Byrne, K.A. Wood waste decomposition in landfills: An assessment of current knowledge and implications for emissions reporting. Waste Manag. 2018, 73, 181–188. [Google Scholar] [CrossRef]
  6. Kizha, A.R.; Han, H.S. Processing and sorting forest residues: Cost, productivity and managerial impacts. Biomass Bioenergy 2016, 93, 97–106. [Google Scholar] [CrossRef]
  7. Ganesan, A.; Rezazgui, O.; Burgos, J.B.; Mangin, P.J.; Barnabé, S. Valorization of lignocellulosic biomass forest residues in quebec via the integrated hydropyrolysis and hydroconversion (IH2) technology: A review. Biomass Bioenergy 2025, 193, 107516. [Google Scholar] [CrossRef]
  8. Rao, Y.K.; Dhanalakshmi, C.S.; Vairavel, D.K.; Surakasi, R.; Kaliappan, S.; Patil, P.P.; Socrates, S.; Lalvani, J.I.J. Investigation on forestry wood wastes: Pyrolysis and thermal characteristics of Ficus religiosa for energy recovery system. Adv. Mater. Sci. Eng. 2022, 2022, 3314606. [Google Scholar] [CrossRef]
  9. Zhang, Y.; Liang, Y.; Li, S.; Yuan, Y.; Zhang, D.; Wu, Y.; Xie, H.; Brindhadevi, K.; Pugazhendhi, A.; Xia, C. A review of biomass pyrolysis gas: Forming mechanisms, influencing parameters, and product application upgrades. Fuel 2023, 347, 128461. [Google Scholar] [CrossRef]
  10. Guedes, R.E.; Luna, A.S.; Torres, A.R. Operating parameters for bio-oil production in biomass pyrolysis: A review. J. Anal. Appl. Pyrolysis 2018, 129, 134–149. [Google Scholar] [CrossRef]
  11. Mouneir, S.M.; El-Shamy, A.M. A review on harnessing the energy potential of pyrolysis gas from scrap tires: Challenges and opportunities for sustainable energy recovery. J. Anal. Appl. Pyrolysis 2024, 177, 106302. [Google Scholar] [CrossRef]
  12. Peters, J.F.; Iribarren, D.; Dufour, J. Biomass pyrolysis for biochar or energy applications? A life cycle assessment. Environ. Sci. Technol. 2015, 49, 5195–5202. [Google Scholar] [CrossRef]
  13. Ibitoye, S.E.; Loha, C.; Mahamood, R.M.; Jen, T.C.; Alam, M.; Sarkar, I.; Das, P.; Akinlabi, E.T. An overview of biochar production techniques and application in iron and steel industries. Bioresour. Bioprocess. 2024, 11, 65. [Google Scholar] [CrossRef]
  14. Hasan, M.; Chakma, S.; Liang, X.; Sutradhar, S.; Kozinski, J.; Kang, K. Engineered Biochar for Metal Recycling and Repurposed Applications. Energies 2024, 17, 4674. [Google Scholar] [CrossRef]
  15. Legan, M.; Gotvajn, A.Ž.; Zupan, K. Potential of biochar use in building materials. J. Environ. Manag. 2022, 309, 114704. [Google Scholar] [CrossRef]
  16. Han, H.; Buss, W.; Zheng, Y.; Song, P.; Rafiq, M.K.; Liu, P.; Mašek, O.; Li, X. Contaminants in biochar and suggested mitigation measures–a review. Chem. Eng. J. 2022, 429, 132287. [Google Scholar] [CrossRef]
  17. Mlonka-Mędrala, A.; Magdziarz, A.; Dziok, T.; Sieradzka, M.; Nowak, W. Laboratory studies on the influence of biomass particle size on pyrolysis and combustion using TG GC/MS. Fuel 2019, 252, 635–645. [Google Scholar] [CrossRef]
  18. Adhikari, S.; Moon, E.; Paz-Ferreiro, J.; Timms, W. Comparative analysis of biochar carbon stability methods and implications for carbon credits. Sci. Total Environ. 2024, 914, 169607. [Google Scholar] [CrossRef]
  19. Altıkat, A.; Alma, M.H.; Altıkat, A.; Bilgili, M.E.; Altıkat, S. A Comprehensive Study of Biochar Yield and Quality Concerning Pyrolysis Conditions: A Multifaceted Approach. Sustainability 2024, 16, 937. [Google Scholar] [CrossRef]
  20. Ranzi, E.; Debiagi, P.E.A.; Frassoldati, A. Mathematical modeling of fast biomass pyrolysis and bio-oil formation. Note I: Kinetic mechanism of biomass pyrolysis. ACS Sustain. Chem. Eng. 2017, 5, 2867–2881. [Google Scholar] [CrossRef]
  21. Silva, J.; Teixeira, S.; Teixeira, J. A review of biomass thermal analysis, kinetics and product distribution for combustion modeling: From the micro to macro perspective. Energies 2023, 16, 6705. [Google Scholar] [CrossRef]
  22. Branca, C.; Galgano, A. Kinetic Modelling of Biomass Pyrolysis Processes. Processes 2024, 12, 706. [Google Scholar] [CrossRef]
  23. Thejaswini, N.; Annapureddy, P.K.R.; Rammohan, D.; Kishore, N. Kinetics and thermodynamics of non-isothermal pyrolysis of Terminalia chebula branches at different heating rates. Int. J. Chem. Kinet. 2023, 55, 673–687. [Google Scholar] [CrossRef]
  24. Zhong, Y.; Ding, Y.; Lu, K.; Mao, S.; Li, C. Kinetic parameters and reaction mechanism study of biomass pyrolysis by combined kinetics coupled with a heuristic optimization algorithm. Fuel 2023, 334, 126622. [Google Scholar] [CrossRef]
  25. Rambhatla, N.; Panicker, T.F.; Mishra, R.K.; Manjeshwar, S.K.; Sharma, A. Biomass pyrolysis for biochar production: Study of kinetics parameters and effect of temperature on biochar yield and its physicochemical properties. Results Eng. 2024, 25, 103679. [Google Scholar] [CrossRef]
  26. Fanezouné, C.K.; Dhahak, A.; Peixinho, J.; El Bari, H. Thermogravimetric analysis and kinetic modeling for empty fruit bunch date palm pyrolysis. Bioresour. Technol. Rep. 2024, 27, 101916. [Google Scholar] [CrossRef]
  27. Patidar, K.; Singathia, A.; Vashishtha, M.; Sangal, V.K.; Upadhyaya, S. Investigation of kinetic and thermodynamic parameters approaches to non-isothermal pyrolysis of mustard stalk using model-free and master plots methods. Mater. Sci. Energy Technol. 2022, 5, 6–14. [Google Scholar] [CrossRef]
  28. Zsinka, V.; Tarcsay, B.L.; Miskolczi, N. Determination of Kinetic and Thermodynamic Parameters of Biomass Gasification with TG-FTIR and Regression Model Fitting. Energies 2024, 17, 1875. [Google Scholar] [CrossRef]
  29. Arenas, C.N.; Navarro, M.V.; Martínez, J.D. Pyrolysis kinetics of biomass wastes using isoconversional methods and the distributed activation energy model. Bioresour. Technol. 2019, 288, 121485. [Google Scholar] [CrossRef]
  30. Postawa, K.; Fałtynowicz, H.; Szczygieł, J.; Beran, E.; Kułażyński, M. Analyzing the kinetics of waste plant biomass pyrolysis via thermogravimetry modeling and semi-statistical methods. Bioresour. Technol. 2022, 344, 126181. [Google Scholar] [CrossRef]
  31. White, J.E.; Catallo, W.J.; Legendre, B.L. Biomass pyrolysis kinetics: A comparative critical review with relevant agricultural residue case studies. J. Anal. Appl. Pyrolysis 2011, 91, 1–33. [Google Scholar] [CrossRef]
  32. Pecha, M.B.; Arbelaez, J.I.M.; Garcia-Perez, M.; Chejne, F.; Ciesielski, P.N. Progress in understanding the four dominant intra-particle phenomena of lignocellulose pyrolysis: Chemical reactions, heat transfer, mass transfer, and phase change. Green Chem. 2019, 21, 2868–2898. [Google Scholar] [CrossRef]
  33. Zhang, X.; Chen, C.; Tang, C.; Wang, Y. Morphological control of biochar with emerging functionalities by thermodynamic and kinetic approaches. Acc. Mater. Res. 2022, 3, 525–539. [Google Scholar] [CrossRef]
  34. Pfersich, J.; Arauzo, P.J.; Modugno, P.; Titirici, M.M.; Kruse, A. Evaluation of the Char Formation During the Hydrothermal Treatment of Wooden Balls. Glob. Chall. 2023, 7, 2300169. [Google Scholar] [CrossRef]
  35. Mishra, R.K.; Mohanty, K. Pyrolysis kinetics and thermal behavior of waste sawdust biomass using thermogravimetric analysis. Bioresour. Technol. 2018, 251, 63–74. [Google Scholar] [CrossRef]
  36. Mahmood, H.; Shakeel, A.; Abdullah, A.; Khan, M.I.; Moniruzzaman, M. A comparative study on suitability of model-free and model-fitting kinetic methods to non-isothermal degradation of lignocellulosic materials. Polymers 2021, 13, 2504. [Google Scholar] [CrossRef]
  37. Mian, I.; Li, X.; Jian, Y.; Dacres, O.D.; Zhong, M.; Liu, J.; Ma, F.; Rahman, N. Kinetic study of biomass pellet pyrolysis by using distributed activation energy model and Coats Redfern methods and their comparison. Bioresour. Technol. 2019, 294, 122099. [Google Scholar] [CrossRef]
  38. Wang, L.; Lei, H.; Liu, J.; Bu, Q. Thermal decomposition behavior and kinetics for pyrolysis and catalytic pyrolysis of Douglas fir. RSC Adv. 2018, 8, 2196–2202. [Google Scholar] [CrossRef]
  39. Chen, L.; Hu, J.; Han, Q.; Xie, A.; Zhou, Z.; Yang, J.; Tang, Q.; Mi, B.; Wu, F. Application of distributed activation energy model and Coats-Redfern integration method in the study of industrial lignin pyrolysis kinetics. Biomass Convers. Biorefinery 2022, 1–11. [Google Scholar] [CrossRef]
  40. Altynbaeva, D.; Astafev, A.; Tabakaev, R. Kinetics of biomass low-temperature pyrolysis by coats–redfern method. In MATEC Web of Conferences; EDP Sciences: Les Ulis, France, 2018; Volume 194, p. 01058. [Google Scholar]
  41. Emiola-Sadiq, T.; Zhang, L.; Dalai, A.K. Thermal and kinetic studies on biomass degradation via thermogravimetric analysis: A combination of model-fitting and model-free approach. ACS Omega 2021, 6, 22233–22247. [Google Scholar] [CrossRef]
  42. Najafi, H.; Golrokh Sani, A.; Sobati, M.A. Thermogravimetric and thermo-kinetic analysis of sugarcane bagasse pith: A comparative evaluation with other sugarcane residues. Sci. Rep. 2024, 14, 2076. [Google Scholar] [CrossRef] [PubMed]
  43. Mishra, R.K.; Mohanty, K.; Wang, X. Pyrolysis kinetic behavior and Py-GC–MS analysis of waste dahlia flowers into renewable fuel and value-added chemicals. Fuel 2020, 260, 116338. [Google Scholar] [CrossRef]
  44. Li, J.; Shang, Y.; Wei, W.; Liu, Z.; Qiao, Y.; Qin, S.; Tian, Y. Comparative study on pyrolysis kinetics behavior and high-temperature fast pyrolysis product analysis of coastal zone and land biomasses. ACS Omega 2022, 7, 10144–10155. [Google Scholar] [CrossRef] [PubMed]
  45. Singh, R.K.; Patil, T.; Pandey, D.; Sawarkar, A.N. Pyrolysis of mustard oil residue: A kinetic and thermodynamic study. Bioresour. Technol. 2021, 339, 125631. [Google Scholar]
  46. Armynah, B.; Tahir, D.; Tandilayuk, M.; Djafar, Z.; Piarah, W.H. Potentials of biochars derived from bamboo leaf biomass as energy sources: Effect of temperature and time of heating. Int. J. Biomater. 2019, 2019, 3526145. [Google Scholar] [CrossRef]
  47. Nzediegwu, C.; Naeth, M.A.; Chang, S.X. Elemental composition of biochars is affected by methods used for its determination. J. Anal. Appl. Pyrolysis 2021, 156, 105174. [Google Scholar] [CrossRef]
  48. Channiwala, S.A.; Parikh, P.P. A unified correlation for estimating HHV of solid, liquid and gaseous fuels. Fuel 2002, 81, 1051–1063. [Google Scholar] [CrossRef]
  49. Sluiter, A.; Ruiz, R.; Scarlata, C.; Sluiter, J.; Templeton, D. Determination of Extractives in Biomass: Laboratory Analytical Procedure (LAP); National Renewable Energy Laboratory: Golden, CO, USA, 2008. Available online: https://docs.nrel.gov/docs/gen/fy08/42619.pdf (accessed on 1 May 2025).
  50. Sluiter, A.; Hames, B.; Ruiz, R.; Scarlata, C.; Sluiter, J.; Templeton, D.; Crocker, D. Determination of Structural Carbohydrates and Lignin in Biomass: Laboratory Analytical Procedure (LAP); National Renewable Energy Laboratory: Golden, CO, USA, 2008. Available online: https://docs.nrel.gov/docs/gen/fy13/42618.pdf (accessed on 1 May 2025).
  51. Maaoui, A.; Trabelsi, A.B.H.; Abdallah, A.B.; Chagtmi, R.; Lopez, G.; Cortazar, M.; Olazar, M. Assessment of pine wood biomass wastes valorization by pyrolysis with focus on fast pyrolysis biochar production. J. Energy Inst. 2023, 108, 101242. [Google Scholar] [CrossRef]
  52. Chakravarty, K.H.; Sadi, M.; Chakravarty, H.; Andersen, J.; Choudhury, B.; Howard, T.J.; Arabkoohsar, A. Pyrolysis kinetics and potential utilization analysis of cereal biomass by-products; an experimental analysis for cleaner energy productions in India. Chemosphere 2024, 353, 141420. [Google Scholar] [CrossRef]
  53. Giglio, E.; Vitaali, G.; Lanzini, A.; Santarelli, M. Integration between biomass gasification and high-temperature electrolysis for synthetic methane production. Biomass Bioenergy 2021, 148, 106017. [Google Scholar] [CrossRef]
  54. Radojević, M.; Janković, B.; Jovanović, V.; Stojiljković, D.; Manić, N. Comparative pyrolysis kinetics of various biomasses based on model-free and DAEM approaches improved with numerical optimization procedure. PLoS ONE 2018, 13, e0206657. [Google Scholar] [CrossRef] [PubMed]
  55. Fischer, O.; Lemaire, R.; Bensakhria, A. Thermogravimetric analysis and kinetic modeling of the pyrolysis of different biomass types by means of model-fitting, model-free and network modeling approaches. J. Therm. Anal. Calorim. 2024, 149, 10941–10963. [Google Scholar] [CrossRef] [PubMed]
  56. Szufa, S.; Piersa, P.; Adrian, Ł.; Czerwińska, J.; Lewandowski, A.; Lewandowska, W.; Sielski, J.; Dzikuć, M.; Wróbel, M.; Jewiarz, M.; et al. Sustainable drying and torrefaction processes of miscanthus for use as a pelletized solid biofuel and biocarbon-carrier for fertilizers. Molecules 2021, 26, 1014. [Google Scholar] [CrossRef]
  57. Thiru, S.; Kola, R.; Thimmaraju, M.K.; Dhanalakshmi, C.S.; Sharma, V.; Sakthi, P.; Maguluri, L.P.; Ranganathan, L.; Lalvani, J.I.J. An analytical characterization study on biofuel obtained from pyrolysis of Madhuca longifolia residues. Sci. Rep. 2024, 14, 14745. [Google Scholar] [CrossRef]
  58. Paredes, R.; Castells, B.; Tascón, A. Thermogravimetric Assessment of Biomass: Unravelling Kinetic, Chemical Composition and Combustion Profiles. Fire 2024, 7, 396. [Google Scholar] [CrossRef]
  59. Punsuwan, N.; Tangsathitkulchai, C. Product Characterization and Kinetics of Biomass Pyrolysis in a Three-Zone Free-Fall Reactor. Int. J. Chem. Eng. 2014, 2014, 986719. [Google Scholar] [CrossRef]
  60. Gani, A.; Desvita, H.; Munawar, E.; Mamat, R.; Nizar, M.; Darnas, Y.; Sarjono, R.E. Comparative analysis of HHV and LHV values of biocoke fuel from palm oil mill solid waste. Case Stud. Chem. Environ. Eng. 2024, 9, 100581. [Google Scholar] [CrossRef]
  61. Uwaoma, R.C.; Schröer, B.J.; Strydom, C.A.; Bunt, J.R.; Matjie, R.H.; Mphahlele, K.; Meyer, J.A. Kinetics, thermodynamics, and thermal decomposition characteristics of co-pyrolysis of municipality solid waste residue hydrochar and <1.5 g/cm3 fraction of South African discarded fine coal. Bioresour. Technol. Rep. 2022, 18, 100998. [Google Scholar]
  62. Wang, W.; Lemaire, R.; Bensakhria, A.; Luart, D. Analysis of the catalytic effects induced by alkali and alkaline earth metals (AAEMs) on the pyrolysis of beech wood and corncob. Catalysts 2022, 12, 1505. [Google Scholar] [CrossRef]
  63. Cao, J.; Yu, Y.; Wu, H. Primary release and transformation of inorganic and organic sodium during fast pyrolysis of sodium-loaded lignin. Proc. Combust. Inst. 2023, 39, 3439–3446. [Google Scholar] [CrossRef]
  64. Liu, N.; Huang, H.; Feng, J.; Li, R.; Huang, X.; Wu, Y. Effects of alkali and alkaline earth metals in biomass on co-pyrolysis characteristics and product distribution of coal and biomass. Fuel 2025, 389, 134551. [Google Scholar] [CrossRef]
  65. Grafmüller, J.; Böhm, A.; Zhuang, Y.; Spahr, S.; Müller, P.; Otto, T.N.; Bucheli, T.D.; Leifeld, J.; Giger, R.; Tobler, M.; et al. Wood ash as an additive in biomass pyrolysis: Effects on biochar yield, properties, and agricultural performance. ACS Sustain. Chem. Eng. 2022, 10, 2720–2729. [Google Scholar] [CrossRef]
  66. Elhenawy, Y.; Fouad, K.; Mansi, A.; Bassyouni, M.; Gadalla, M.; Ashour, F.; Majozi, T. Experimental analysis and numerical simulation of biomass pyrolysis. J. Therm. Anal. Calorim. 2024, 149, 10369–10383. [Google Scholar] [CrossRef]
  67. Nhuchhen, D.R.; Afzal, M.T. HHV predicting correlations for torrefied biomass using proximate and ultimate analyses. Bioengineering 2017, 4, 7. [Google Scholar] [CrossRef]
  68. Li, J.; Sun, W.; Lichtfouse, E.; Maurer, C.; Liu, H. Life cycle assessment of biochar for sustainable agricultural application: A review. Sci. Total Environ. 2024, 951, 175448. [Google Scholar] [CrossRef]
  69. Yildiz, M.J.; Wurzer, C.; Robinson, T.; Wietecha, J.; Mašek, O. Biochar from pellets: Influence of binders and pyrolysis temperature on physical properties of pyrolyzed pellets. Sustain. Mater. Technol. 2025, 43, e01327. [Google Scholar]
  70. Dhyani, V.; Bhaskar, T. A comprehensive review on the pyrolysis of lignocellulosic biomass. Renew. Energy 2018, 129, 695–716. [Google Scholar] [CrossRef]
  71. Gurtner, D.; Kresta, M.; Hupfauf, B.; Götz, P.; Nussbaumer, R.; Hofmann, A.; Pfeifer, C. Mechanical strength characterisation of pyrolysis biochar from woody biomass. Energy 2023, 285, 129366. [Google Scholar] [CrossRef]
  72. Dufourny, A.; Van De Steene, L.; Humbert, G.; Guibal, D.; Martin, L.; Blin, J. Influence of pyrolysis conditions and the nature of the wood on the quality of charcoal as a reducing agent. J. Anal. Appl. Pyrolysis 2019, 137, 1–13. [Google Scholar] [CrossRef]
  73. Xia, C.; Cai, L.; Zhang, H.; Zuo, L.; Shi, S.Q.; Lam, S.S. A review on the modeling and validation of biomass pyrolysis with a focus on product yield and composition. Biofuel Res. J. 2021, 29, 1296–1315. [Google Scholar] [CrossRef]
  74. Johnston, C.T. 18 Biochar analysis by Fourier-transform infra-red spectroscopy. In Biochar: A Guide to Analytical Methods; CRC Press: Boca Raton, FL, USA, 2017; p. 199. [Google Scholar]
  75. Nanda, S.; Mohanty, P.; Pant, K.K.; Naik, S.; Kozinski, J.A.; Dalai, A.K. Characterization of North American lignocellulosic biomass and biochars in terms of their candidacy for alternate renewable fuels. Bioenergy Res. 2013, 6, 663–677. [Google Scholar] [CrossRef]
  76. Mukherjee, A.; Okolie, J.A.; Tyagi, R.; Dalai, A.K.; Niu, C. Pyrolysis kinetics and activation thermodynamic parameters of exhausted coffee residue and coffee husk using thermogravimetric analysis. Can. J. Chem. Eng. 2021, 99, 1683–1695. [Google Scholar] [CrossRef]
  77. Raza, M.; Abu-Jdayil, B.; Inayat, A. Pyrolytic kinetics and thermodynamic analyses of date seeds at different heating rates using the Coats–Redfern method. Fuel 2023, 342, 127799. [Google Scholar] [CrossRef]
  78. Almusafir, R.; Smith, J.D. Thermal Decomposition and Kinetic Parameters of Three Biomass Feedstocks for the Performance of the Gasification Process Using a Thermogravimetric Analyzer. Energies 2024, 17, 396. [Google Scholar] [CrossRef]
  79. Apaydın Varol, E.; Mutlu, Ü. TGA-FTIR analysis of biomass samples based on the thermal decomposition behavior of hemicellulose, cellulose, and lignin. Energies 2023, 16, 3674. [Google Scholar] [CrossRef]
  80. Gonzalez-Aguilar, A.M.; Cabrera-Madera, V.P.; Vera-Rozo, J.R.; Riesco-Ávila, J.M. Effects of heating rate and temperature on the thermal pyrolysis of expanded polystyrene post-industrial waste. Polymers 2022, 14, 4957. [Google Scholar] [CrossRef]
  81. Călin, C.; Sîrbu, E.E.; Tănase, M.; Győrgy, R.; Popovici, D.R.; Banu, I. A Thermogravimetric Analysis of Biomass Conversion to Biochar: Experimental and Kinetic Modeling. Appl. Sci. 2024, 14, 9856. [Google Scholar] [CrossRef]
  82. Dhaundiyal, A.; Singh, S.B.; Hanon, M.M.; Rawat, R. Determination of kinetic parameters for the thermal decomposition of parthenium hysterophorus. Environ. Clim. Technol. 2018, 22, 5–21. [Google Scholar] [CrossRef]
  83. Monir, M.U.; Shovon, S.M.; Akash, F.A.; Habib, M.A.; Techato, K.; Abd Aziz, A.; Chowdhury, S.; Prasetya, T.A.E. Comprehensive characterization and kinetic analysis of coconut shell thermal degradation: Energy potential evaluated via the Coats-Redfern method. Case Stud. Therm. Eng. 2024, 55, 104186. [Google Scholar] [CrossRef]
  84. Saleem, M.; Bahadar, A. In-Depth Study on Synergic Interactions and Thermo-Kinetic Analysis of (Wheat Straw and Woody Sawdust) Biomass Co-Pyrolysis over Mussel Shell-Derived CaO Catalyst Using Coats–Redfern Method. Catalysts 2024, 14, 655. [Google Scholar] [CrossRef]
  85. Hadey, C.; Malika, A.; Mohammed, A.; Fatima, B. A study on the biomass wastes’ combustion process and their biochar. Res. Sq. 2020. [Google Scholar] [CrossRef]
  86. Hassan, A.M.M.; Asif, M.; Hussain, T.; Sajjad, R.; Yasmin, F.; Khandaker, M.U. Pyrolysis of municipal solid waste: Kinetics and thermodynamic parameters via Coats-Redfern method. Appl. Chem. Eng. 2024, 7, 1872. [Google Scholar] [CrossRef]
  87. Tariq, R.; Saeed, S.; Riaz, M.; Saeed, S. Kinetic and thermodynamic evaluation of almond shells pyrolytic behavior using Coats–Redfern and pyrolysis product distribution model. Energy Sources Part A Recovery Util. Environ. Eff. 2023, 45, 4446–4462. [Google Scholar] [CrossRef]
  88. Sobek, S.; Werle, S. Kinetic modelling of waste wood devolatilization during pyrolysis based on thermogravimetric data and solar pyrolysis reactor performance. Fuel 2020, 261, 116459. [Google Scholar] [CrossRef]
  89. Shrivastava, D.K.; Singh, A.K.; Chakraborty, J.P. Model-free isoconversional methods to determine the intrinsic kinetics and thermodynamic parameters during pyrolysis of boiled banana peel: Influence of inorganic species. Bioresour. Technol. Rep. 2023, 24, 101676. [Google Scholar] [CrossRef]
  90. Bisen, D.; Chouhan, A.P.S.; Sarma, A.K.; Rajamohan, S.; Elumalai, P.V.; Balasubramanian, D.; Cherie, A. Thermogravimetric analysis of rice husk and low-density polyethylene co-pyrolysis: Kinetic and thermodynamic parameters. Sci. Rep. 2024, 14, 31798. [Google Scholar] [CrossRef]
  91. Shagali, A.A.; Hu, S.; Li, H.; Chi, H.; Qing, H.; Xu, J.; Jiang, L.; Wang, Y.; Su, S.; Xiang, J. Thermal behavior, synergistic effect and thermodynamic parameter evaluations of biomass/plastics co–pyrolysis in a concentrating photothermal TGA. Fuel 2023, 331, 125724. [Google Scholar] [CrossRef]
  92. Tabal, A.; Barakat, A.; Aboulkas, A. Pyrolysis of ficus nitida wood: Determination of kinetic and thermodynamic parameters. Fuel 2021, 283, 119253. [Google Scholar] [CrossRef]
  93. Patil, Y.; Ku, X.; Vasudev, V. Pyrolysis characteristics and determination of kinetic and thermodynamic parameters of raw and torrefied Chinese fir. ACS Omega 2023, 8, 34938–34947. [Google Scholar] [CrossRef]
  94. Lei, J.; Ye, X.; Wang, H.; Zhao, D. Insights into pyrolysis kinetics, thermodynamics, and the reaction mechanism of wheat straw for its resource utilization. Sustainability 2023, 15, 12536. [Google Scholar] [CrossRef]
Figure 1. CRD wood sample conditioning and preparation: (A) CRD wood waste sourced in pails from the local provider; (B) vibrational sieving of CRD wood; (C) contaminant separated CRD wood of relevant particle size (<5mm and >3 mm); (D) milled CRD wood fines used for characterization and TGA experimentation.
Energies 18 02496 g001
Figure 2. Metal constituents in CRD wood. Blue bars represent AAEM in CRD wood, and red bars denote other metals.
Energies 18 02496 g002
Figure 3. FTIR spectral distribution of CRD wood with functional group attributes.
Energies 18 02496 g003
Figure 4. TGA and biomass conversion analysis. (A) TGA weight loss data of CRD wood for 10, 20, 30, and 40°C/min; (B) corresponding DTG profile; (C) Variation of peak melting temperature (Tm) with heating rate; (D) Variation of CRD wood conversion (α) with heating rate. The difference between ash measured by proximate analysis and ash in the TGA curve may be due to slower conversion due to the heating rates chosen. The ash levels in (A) may match the proximate analysis results if a test with heating rates < 10 °C/min is chosen to allow for sufficient depolymerization time, considering the complexity of the feedstock.
Energies 18 02496 g004
Figure 5. Dominant effect of heating rate only expressed at 30 °C/min for all reaction models assumed in the CR method: (A) chemical model; (B) diffusion model; (C) phase-interfacial model; and (D) nucleation and growth model.
Energies 18 02496 g005
Figure 6. Variation in activation energies between OFW, KAS, and FM methods: (A) for α = 0.1–1.0; (B) for α = 0.2–0.8 only.
Energies 18 02496 g006
Figure 7. (A) Friedman (FM) method; (B) Ozawa–Flynn–Wall (OFW) method; (C) Kissinger–Akahira–Sunose (KAS) method—plots for α = 0.2–0.8.
Energies 18 02496 g007
Table 2. Model-free or isoconversional methods.
Model-Free MethodEquationProcedure for Plotting
OFW l n β = l n A E a R g ( α ) 2.315 0.457 E a R T (1)Plot l n β versus 1 T to obtain a straight line with a negative slope of 0.457 E a R to calculate Ea. Using this and an assumed reaction model/mechanism for g(α), A can be calculated from the y-axis intercept, l n A E a R g ( α ) .
KAS l n β T 2 = l n A E a R g ( α ) E a R T (2)Plot l n β T 2 versus 1 T to obtain a straight line with a negative slope of E a R to calculate Ea. Using this and an assumed reaction model/mechanism for g(α), A can be calculated from the y-axis intercept, l n A E a R g ( α ) .
FM l n β d α d T = l n ( A f ( α ) ) n E a R T
(or)
l n d α d t = l n ( A f ( α ) ) n E a R T
(3)Plot l n β d α d T or l n d α d t versus 1 T to obtain a straight line with a negative slope of E a R to calculate Ea. Using this and an assumed reaction model/mechanism for f(α), A can be calculated from the y-axis intercept, l n ( A f ( α ) ) n .
Table 3. Physicochemical properties of CRD wood in comparison with different biomass sources. References are mentioned below the characterization results in the table.
BiomassPinewoodRice HuskBeechWheat StrawMiscanthus *Madhuca LongifoliaPoplar Sawdust *Palm Kernel *MSWCRD Wood *
Proximate analysis
Moisture (wt%)4.0110.1015.2011.63---5.98------2.75---
Volatiles (wt%)64.3752.3084.8765.3283.3071.2683.6079.6851.1382.35
FC (wt%)24.8923.4014.5315.1714.4018.2415.4016.7837.8616.48
Ash (wt%)6.7314.200.607.882.304.501.003.548.261.17
Ultimate analysis
C (wt%)54.5334.9949.3844.1247.5047.2049.4743.8476.2649.88
H (wt%)6.564.586.176.346.105.905.896.136.886.12
S (wt%)0.09---0.01---0.101.200.050.060.280.10
N (wt%)0.941.950.280.631.003.601.403.113.320.99
O (wt%)31.1434.1843.5539.9945.3042.1043.1246.8613.2541.74
Van-Krevelen parameters
H/C1.441.571.501.721.541.501.431.681.071.47
O/C0.430.730.660.680.720.670.650.800.130.63
Calorific value
HHV (MJ/kg)22.3314.0919.315.2915.82---19.5016.8329.7020.28
Reference[51][52][53][54][55,56][57][58][59,60][61]Present study
* Expressed in wt%DB.
Table 4. Biochemical composition of CRD wood lots from the same bale.
Biomass ConstituentsLot 1Lot 2Lot 3Lot 4
Hot Water Extractives (wt%)3.22.03.12.7
Ethanol Extractives (wt%)3.73.02.84.0
Total extractives (wt%)6.95.05.96.7
Insoluble Lignin (wt%)19.720.526.125.3
Total Lignin (wt%)24.926.230.229.7
Glucan (wt%)50.944.246.953.1
Xylan (wt%)19.223.28.010.1
Arabinan (wt%)0.00.10.91.3
Galactan (wt%)0.60.82.52.4
Mannan (wt%)2.02.39.710.0
Total holocellulose (wt%)72.770.668.076.9
Table 5. Activation energy (Ea), pre-exponential factor (A), and model correlation (R2) of different pyrolysis reaction models (albeit, non-exhaustive list) evaluated using the CR method.
Reaction ModelType/MechanismHeating Rate = 10 °C/minHeating Rate = 20 °C/minHeating Rate = 30 °C/minHeating Rate = 40 °C/min
Activation Energy, Ea
(kJ/mol)
Pre-Exponential Factor, A (min−1)R2 from PlotActivation Energy, Ea
(kJ/mol)
Pre-Exponential Factor, A (min−1)R2 from PlotActivation Energy, Ea
(kJ/mol)
Pre-Exponential Factor, A (min−1)R2 from PlotActivation Energy, Ea
(kJ/mol)
Pre-Exponential Factor, A (min−1)R2 from Plot
ChemicalFirst-order (F1)65.825.0873 × 1040.988267.341.0329 × 1050.988866.401.0953 × 1050.988166.401.3118 × 1050.9864
Second-order (F2)94.623.0881 × 1070.955994.626.1763 × 1070.956396.899.7105 × 1070.956395.556.9599 × 1070.9524
Third-order (F3)129.706.4717 × 10100.9217129.701.29434 × 10110.9219132.902.1212 × 10110.9219131.051.2162 × 10110.9172
DiffusionOne-dimensional (D1)98.061.2944 × 1070.999298.062.5889 × 1070.9993100.223.9199 × 1070.999399.072.8758 × 1070.9997
Two-dimensional (D2)110.511.0282 × 1080.9993110.512.0565 × 1080.9996112.973.1433 × 1080.9996111.672.1457 × 1080.9992
Three-dimensional J (D3)125.696.4219 × 1080.9958125.691.2844 × 1090.9963128.541.9907 × 1090.9963127.041.2459 × 1090.9949
Three-dimensional GB (D4)115.526.8969 × 1070.9986115.521.3794 × 1080.9989118.122.1179 × 1080.9989116.751.4021 × 1080.9981
Phase interfacialOne-dimensional (R1)43.953.3309 × 1020.999043.956.6618 × 1020.999044.939.9444 × 1020.999044.269.6170 × 1020.9995
Two-dimensional (R2)54.031.7353 × 1030.997754.033.4705 × 1030.997755.255.2249 × 1030.998254.564.7584 × 1030.9970
Three-dimensional (R3)57.762.7237 × 1030.995357.765.4473 × 1030.995359.088.2295 × 1030.995858.247.3348 × 1030.9943
Nucleation and growthTwo-dimensional (A2)27.8316.1390.984527.833.2278 × 1010.984528.4848.3600.985327.9249.8060.9819
Three-dimensional (A3)15.170.7990.978415.171.59840.978415.532.38290.979515.142.62050.9739
Table 6. Kinetic parameters of CRD wood pyrolysis computed using OFW, KAS, and FM isoconversional methods.
Conversion Rate, αOFW MethodKAS MethodFM Method
Activation Energy, Ea (kJ/mol)Pre-Exponential Factor, A (min−1)R2 from PlotActivation Energy, Ea (kJ/mol)Pre-Exponential Factor, A (min−1)R2 from PlotActivation Energy, Ea (kJ/mol)Pre-Exponential Factor, A (min−1)R2 from Plot
0.18.8549.510051460.414135.062.08822 × 10120.599144.092.9616 × 10140.637
0.2172.878.40043 × 10140.990176.051.6275 × 10150.987185.712.15137 × 10170.988
0.3176.617.47933 × 10140.997174.124.35321 × 10140.998185.278.42214 × 10160.998
0.4178.656.27054 × 10140.996179.286.85439 × 10140.996189.541.17277 × 10170.997
0.5179.774.95313 × 10140.997177.022.79223 × 10140.999188.266.43149 × 10160.999
0.6178.332.6664 × 10140.999178.912.85704 × 10140.997189.776.86145 × 10160.998
0.7179.972.79517 × 10140.999178.441.98226 × 10140.998189.926.3583 × 10160.998
0.8184.865.32708 × 10140.999185.415.66593 × 10140.997196.472.06678 × 10170.997
0.9522.387.94663 × 10390.927470.584.06828 × 10350.901482.381.04521 × 10380.905
Table 7. ΔH, ΔG, and ΔS calculated for each heating rate according to every isoconversional method.
Ea and A Estimated from OFW Method
Conversion Rate, αHeating Rate = 10 °C/min
Tm = 367.41
Heating Rate = 20 °C/min
Tm = 382.48
Heating Rate = 30 °C/min
Tm = 386.85
Heating Rate = 40 °C/min
Tm = 389.62
ΔH (kJ/mol)ΔG (kJ/mol)ΔS (J/mol·K)ΔH (kJ/mol)ΔG (kJ/mol)ΔS (J/mol·K)ΔH (kJ/mol)ΔG (kJ/mol)ΔS (J/mol·K)ΔH (kJ/mol)ΔG (kJ/mol)ΔS (J/mol·K)
0.13.52−109.52176.483.40−112.44176.683.36−113.28176.733.34−113.82175.99
0.2167.54216.73−76.79167.42217.64−76.60167.38217.90−76.55167.36218.07−76.23
0.3171.28219.86−75.83171.16220.75−75.64171.12221.00−75.58171.10221.17−75.26
0.4173.32220.96−74.36173.20221.82−74.17173.16222.08−74.11173.14222.23−73.80
0.5174.44220.82−72.40174.32221.66−72.21174.28221.90−72.15174.26222.05−71.85
0.6173.00216.08−67.25172.88216.85−67.06172.84217.07−67.00172.82217.20−66.72
0.7174.64217.97−67.65174.52218.74−67.45174.48218.96−67.40174.46219.10−67.12
0.8179.53226.30−73.01179.40227.14−72.81179.37227.39−72.76179.35227.54−72.45
0.9517.05872.53−554.95516.93880.64−554.76516.89883.00−554.71516.87884.49−552.39
Ea and A Estimated from KAS Method
Conversion Rate, αHeating Rate = 10 °C/min
Tm = 367.41
Heating Rate = 20 °C/min
Tm = 382.48
Heating Rate = 30 °C/min
Tm = 386.85
Heating Rate = 40 °C/min
Tm = 389.62
ΔH (kJ/mol)ΔG (kJ/mol)ΔS (J/mol·K)ΔH (kJ/mol)ΔG (kJ/mol)ΔS (J/mol·K)ΔH (kJ/mol)ΔG (kJ/mol)ΔS (J/mol·K)ΔH (kJ/mol)ΔG (kJ/mol)ΔS (J/mol·K)
0.1129.73146.98−26.93129.61147.14−26.31129.57147.18−26.14129.55147.21−26.03
0.2170.72223.44−82.29170.60224.43−80.40170.56224.71−79.87170.54224.89−79.54
0.3168.79214.48−71.33168.66215.30−69.69168.63215.54−69.23168.61215.69−68.94
0.4173.95222.06−75.10173.83222.94−73.38173.79223.19−72.89173.77223.36−72.59
0.5171.70215.02−67.64171.57215.79−66.08171.54216.01−65.64171.51216.15−65.37
0.6173.58217.03−67.83173.46217.80−66.27173.42218.02−65.83173.40218.17−65.55
0.7173.11214.61−64.79172.98215.33−63.30172.95215.54−62.88172.93215.68−62.62
0.8180.08227.18−73.52179.96228.03−71.83179.92228.28−71.35179.90228.44−71.06
0.9465.26768.12−472.81465.13774.99−461.94465.10776.98−458.88465.07778.25−456.96
Ea and A Estimated from FM Method
Conversion Rate, αHeating Rate = 10 °C/min
Tm = 367.41
Heating Rate = 20 °C/min
Tm = 382.48
Heating Rate = 30 °C/min
Tm = 386.85
Heating Rate = 40 °C/min
Tm = 389.62
ΔH (kJ/mol)ΔG (kJ/mol)ΔS (J/mol·K)ΔH (kJ/mol)ΔG (kJ/mol)ΔS (J/mol·K)ΔH (kJ/mol)ΔG (kJ/mol)ΔS (J/mol·K)ΔH (kJ/mol)ΔG (kJ/mol)ΔS (J/mol·K)
0.1138.76182.40−68.13138.64183.18−67.93138.60183.40−67.88138.58183.54−67.59
0.2180.38259.11−122.90180.26260.71−122.71180.22261.17−122.65180.20261.47−122.14
0.3179.94253.67−115.11179.81255.15−114.91179.78255.58−114.86179.75255.86−114.38
0.4184.22259.71−117.86184.09261.24−117.67184.06261.68−117.61184.03261.96−117.12
0.5182.94255.23−112.86182.81256.68−112.67182.77257.10−112.62182.75257.37−112.14
0.6184.44257.08−113.40184.32258.54−113.21184.28258.96−113.15184.26259.23−112.68
0.7184.60256.83−112.77184.47258.28−112.58184.44258.70−112.52184.41258.97−112.05
0.8191.14269.65−122.57191.01271.25−122.38190.98271.71−122.32190.95272.00−121.81
0.9477.05809.47−518.94476.93817.04−518.75476.89819.23−518.69476.87820.62−516.53
Disclaimer/Publisher’s Note: The statements, opinions and data contained in all publications are solely those of the individual author(s) and contributor(s) and not of MDPI and/or the editor(s). MDPI and/or the editor(s) disclaim responsibility for any injury to people or property resulting from any ideas, methods, instructions or products referred to in the content.

