


Onshore Power Supply in Multi-Terminal Maritime Ports

 ,
,  , ,
, ,  and
and 
Abstract
1. Introduction
- Technical applications concerning energy supply and parameters: a previous case study highlights that the joint coordination between authorities and port operators enhances energy independence, system efficiency, operational reliability, and the profitability of the microgrid [46].
- Installation and retrofitting costs for ships, as well as potential subsidies: there is evidence supporting emission reductions when auxiliary engines are powered by the electrical grid [47].
- Uncertainties regarding investment recovery in decarbonization projects: the cost of electricity is less volatile than that of fuel supply, making OPS a lower-risk alternative [48].
- Finally, despite a variety of publications relating to the use of alternative fuels for emissions decarbonization, current global production cannot meet the necessary demand [49].

| Criteria | Sub-Criteria | Description |
|---|---|---|
| Technical application | Matching of the port and ship power supply |
|
| Direct power supply from the grid |
| |
| Power supply quality |
| |
| Technical standard |
| |
| Additional power capacity |
| |
| Coordination between the ship and the power supply |
| |
| Economic | Retrofit costs |
|
| Operating costs |
| |
| Maintenance costs |
| |
| Lack of economic benefits |
| |
| Other | Policies and supporting systems |
|
| Subsidy/incentive |
|
2. Materials and Methods
- Centrifugal pumps for liquid products of the oil and petrochemical industry in the LBT;
- Centrifugal pumps for petrochemical products of different viscosities and densities in the PCT;
- Cryogenic pumps for natural gas liquids at low temperatures in the NGT;
- Electric rubber-tired gantries (RTGs) and rail-mounted gantries (RMGs) in the SCT.
- Em: emissions due to the activity (tCO2eq);
- E: energy (MWh);
- EF: emission factor (tCO2eq/MWh).
- Passenger locator form (PLF)—entry;
- Anchoring;
- Suspending;
- Berthing;
- PLF—exit;
- Others.
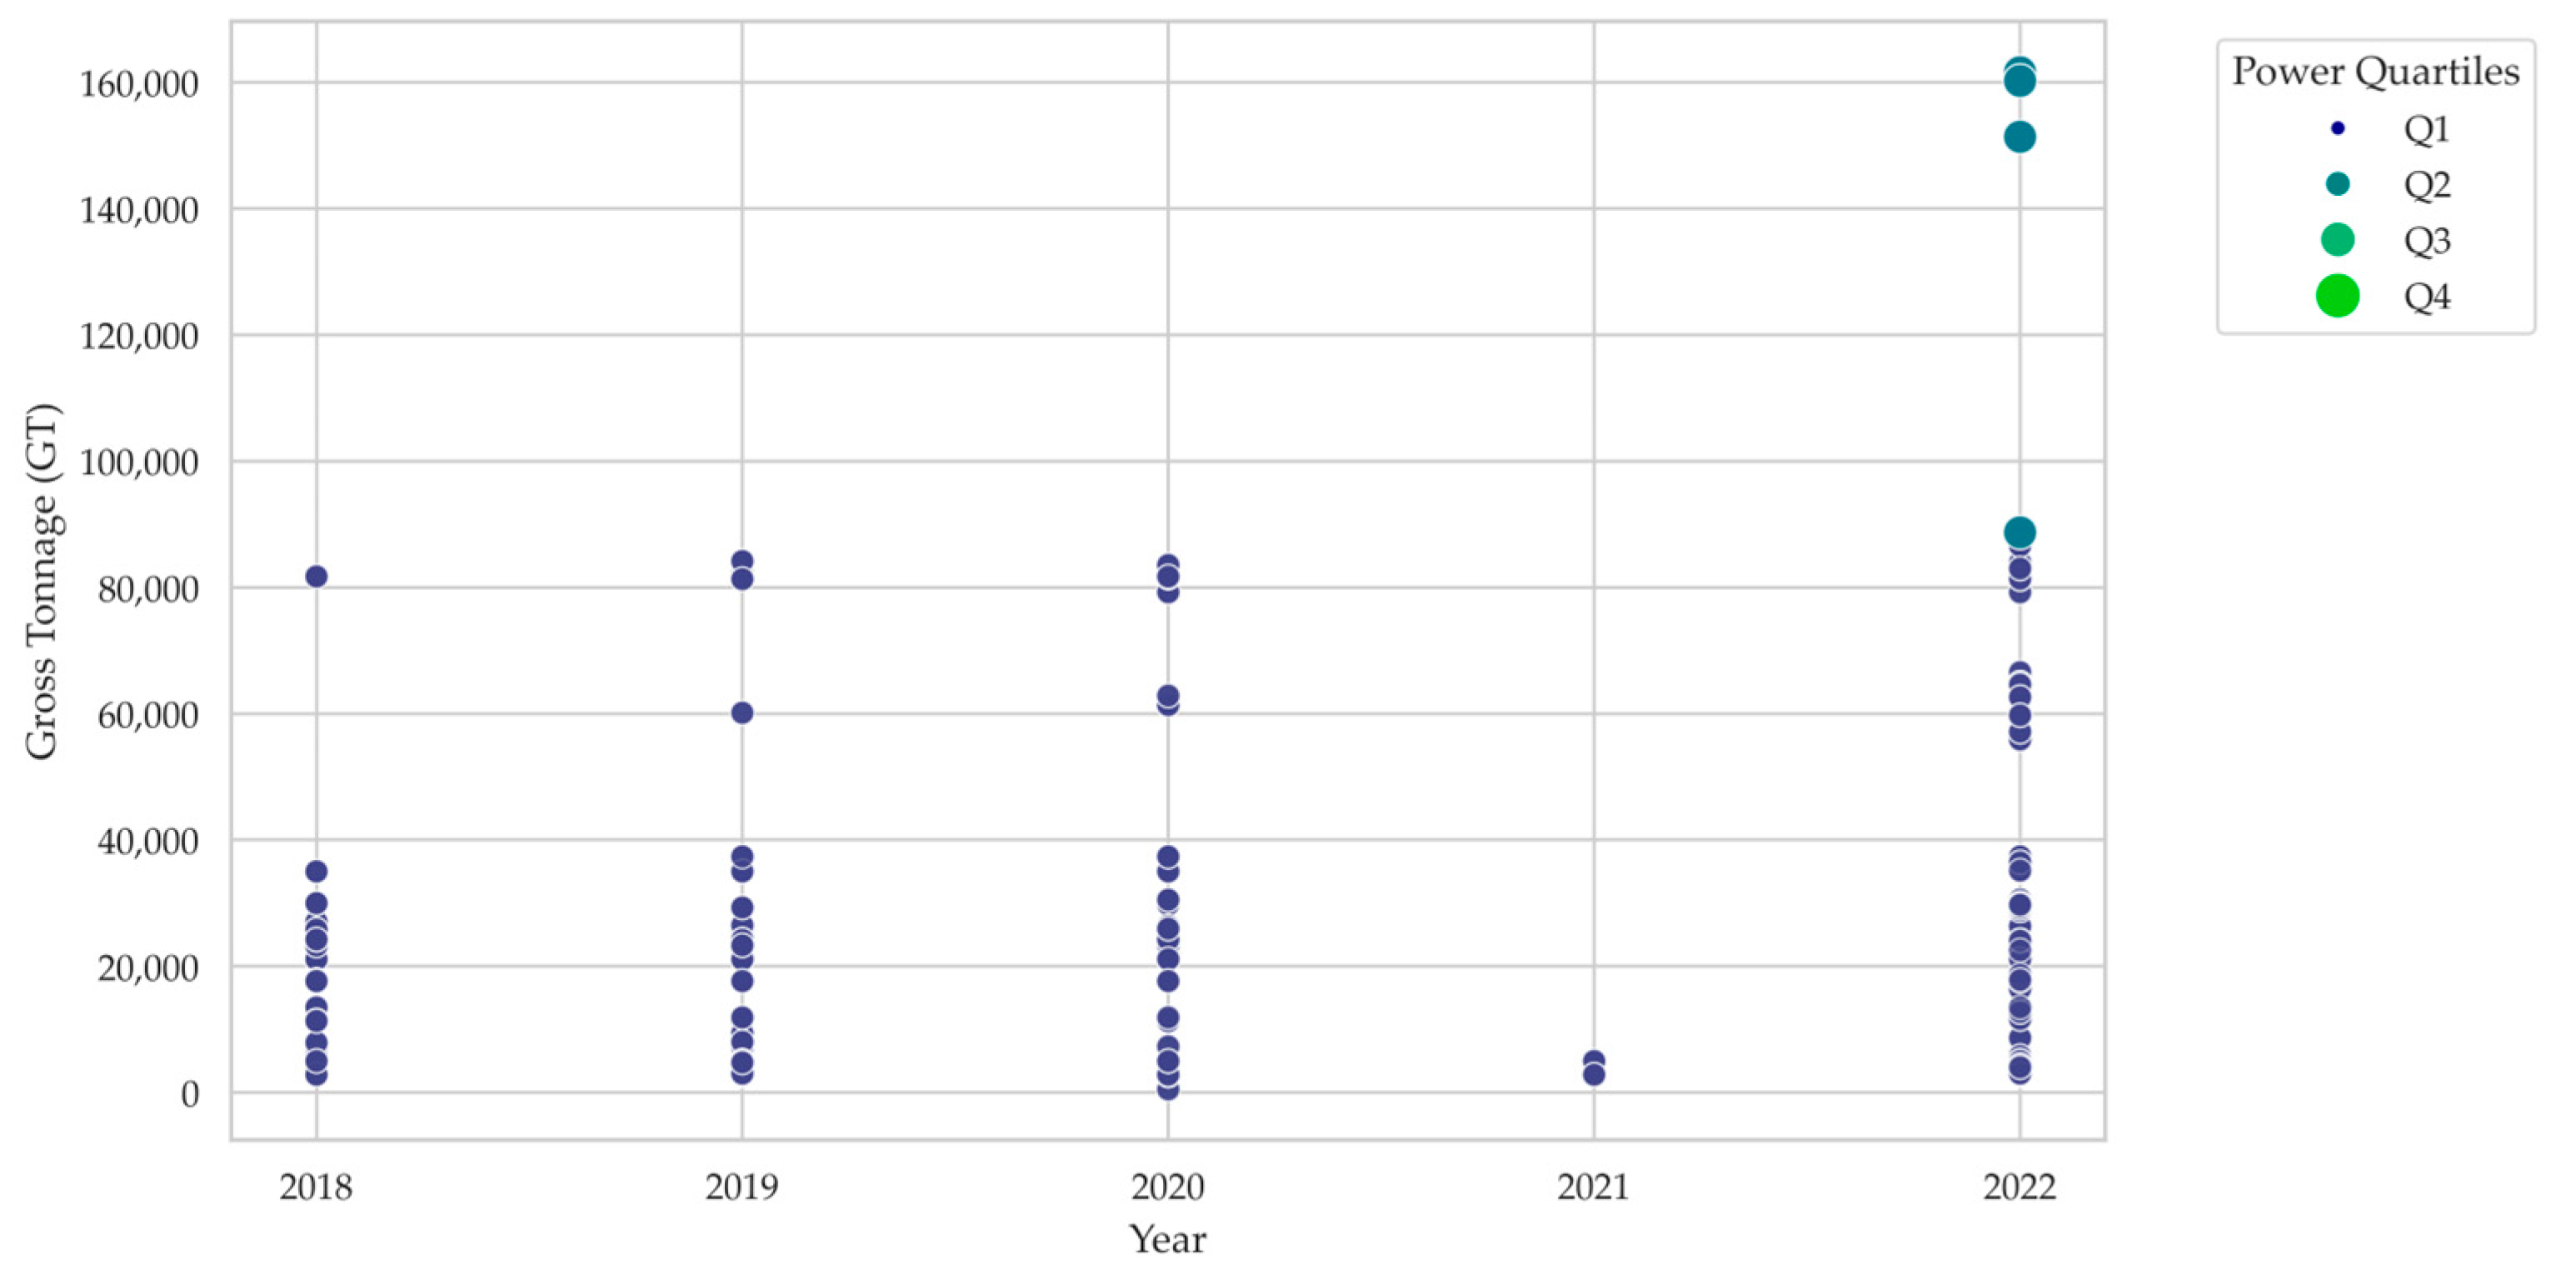
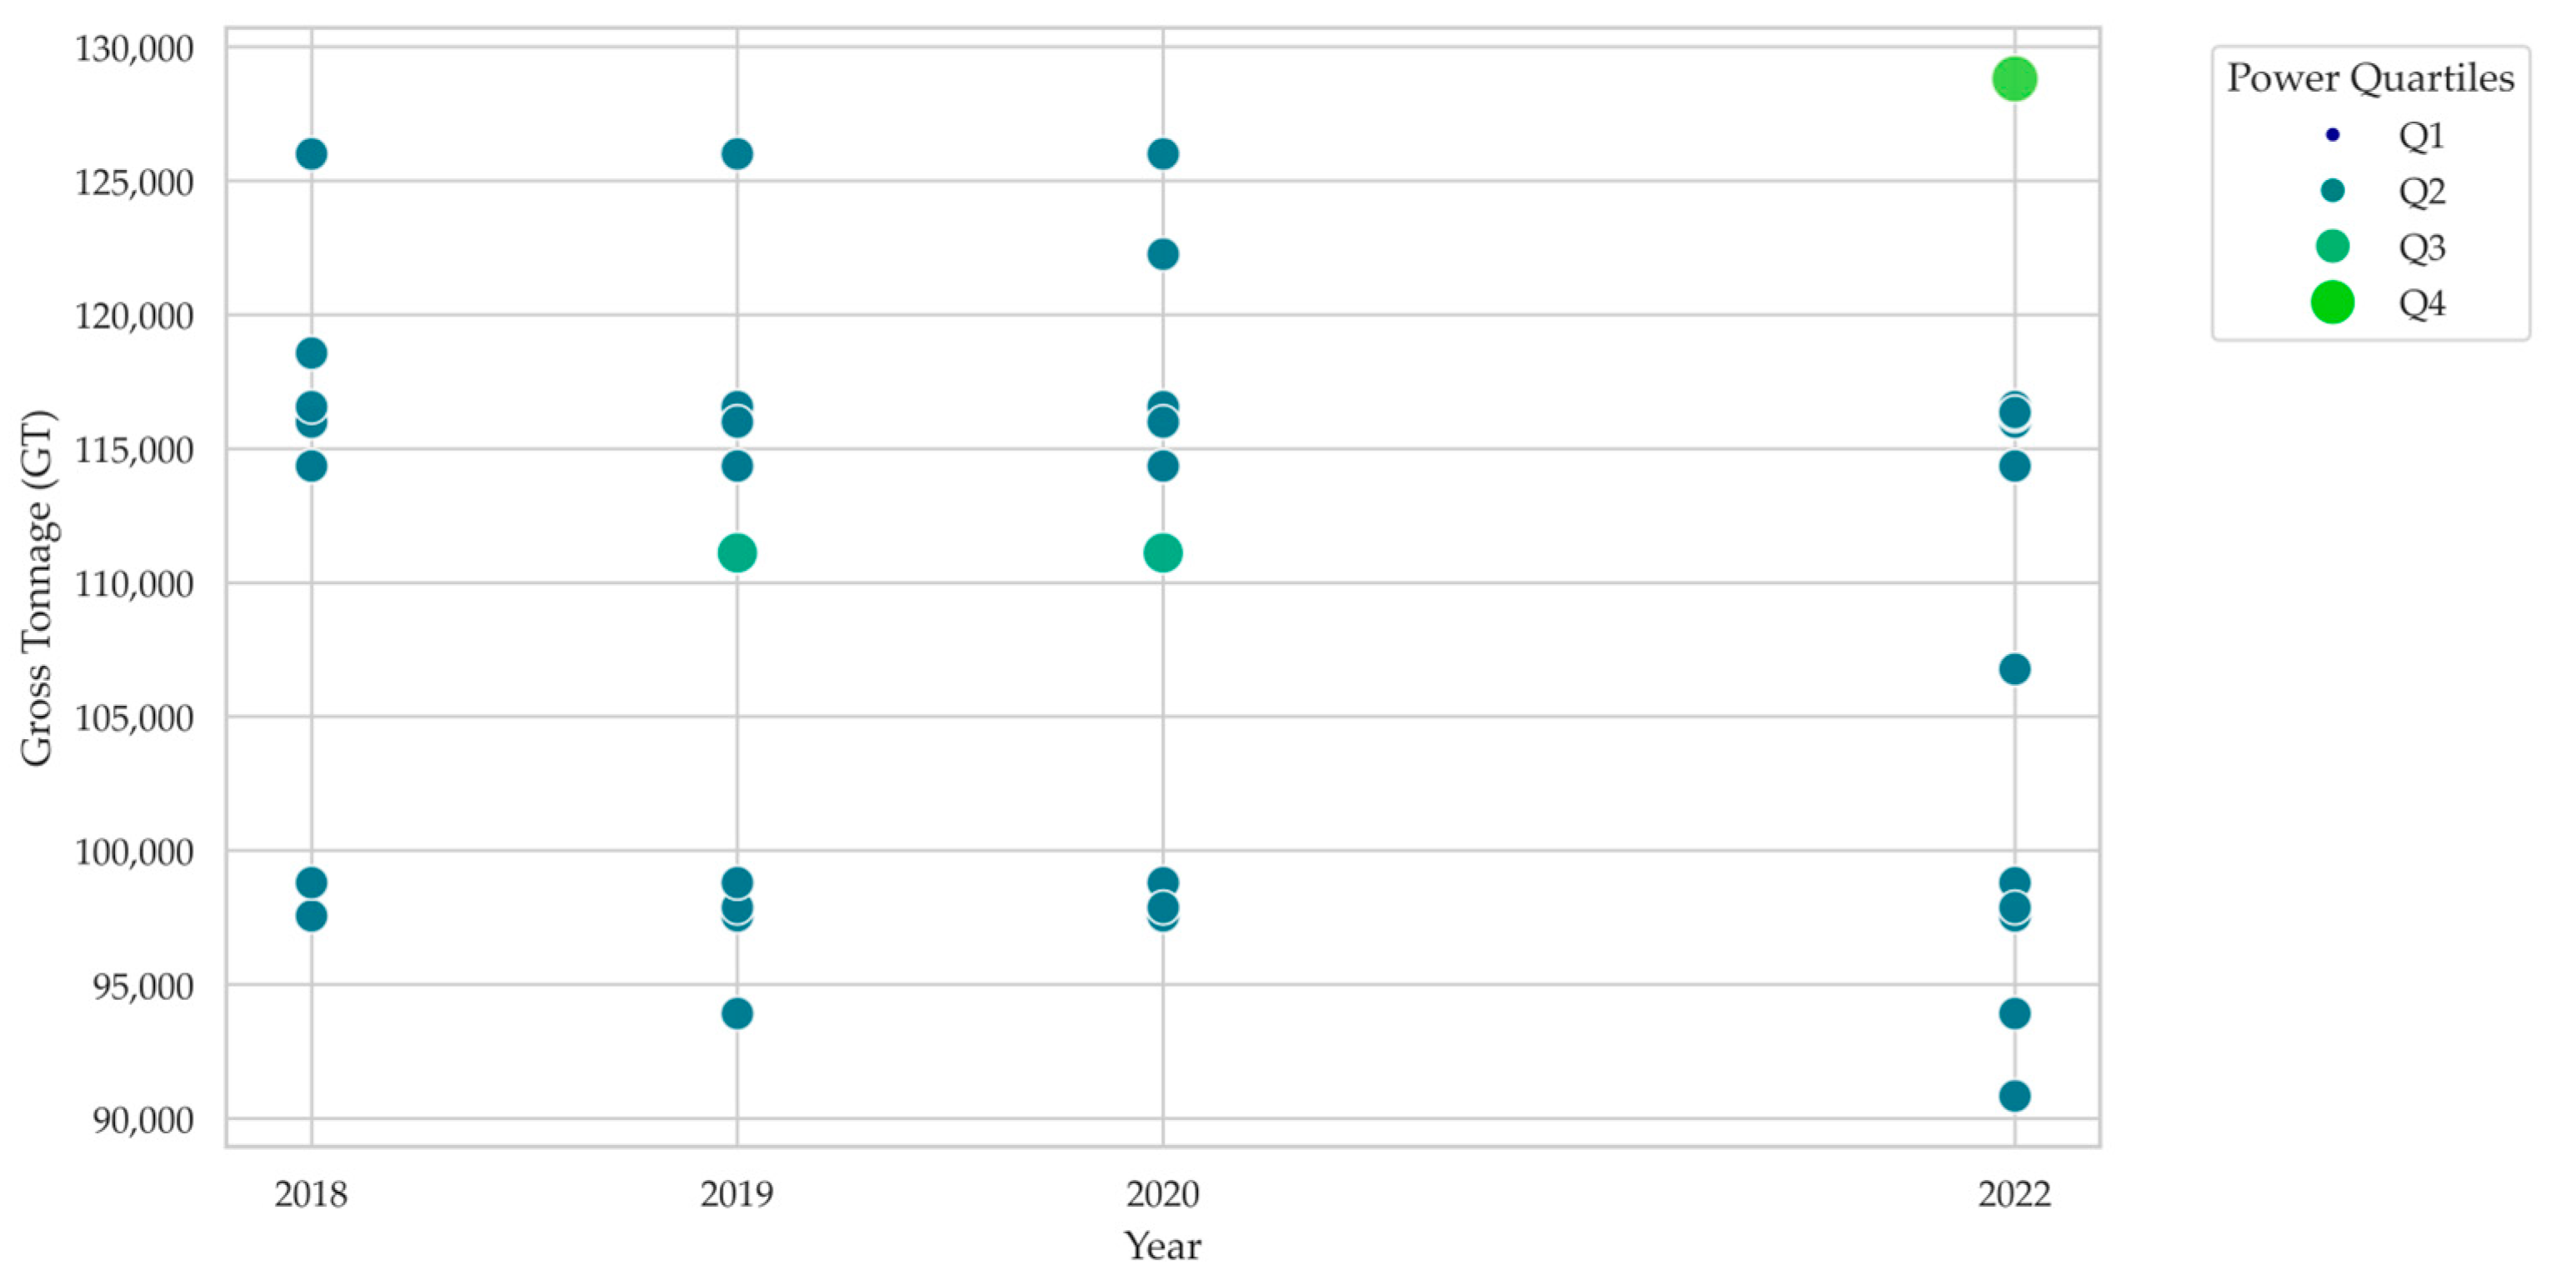
3. Results and Discussion
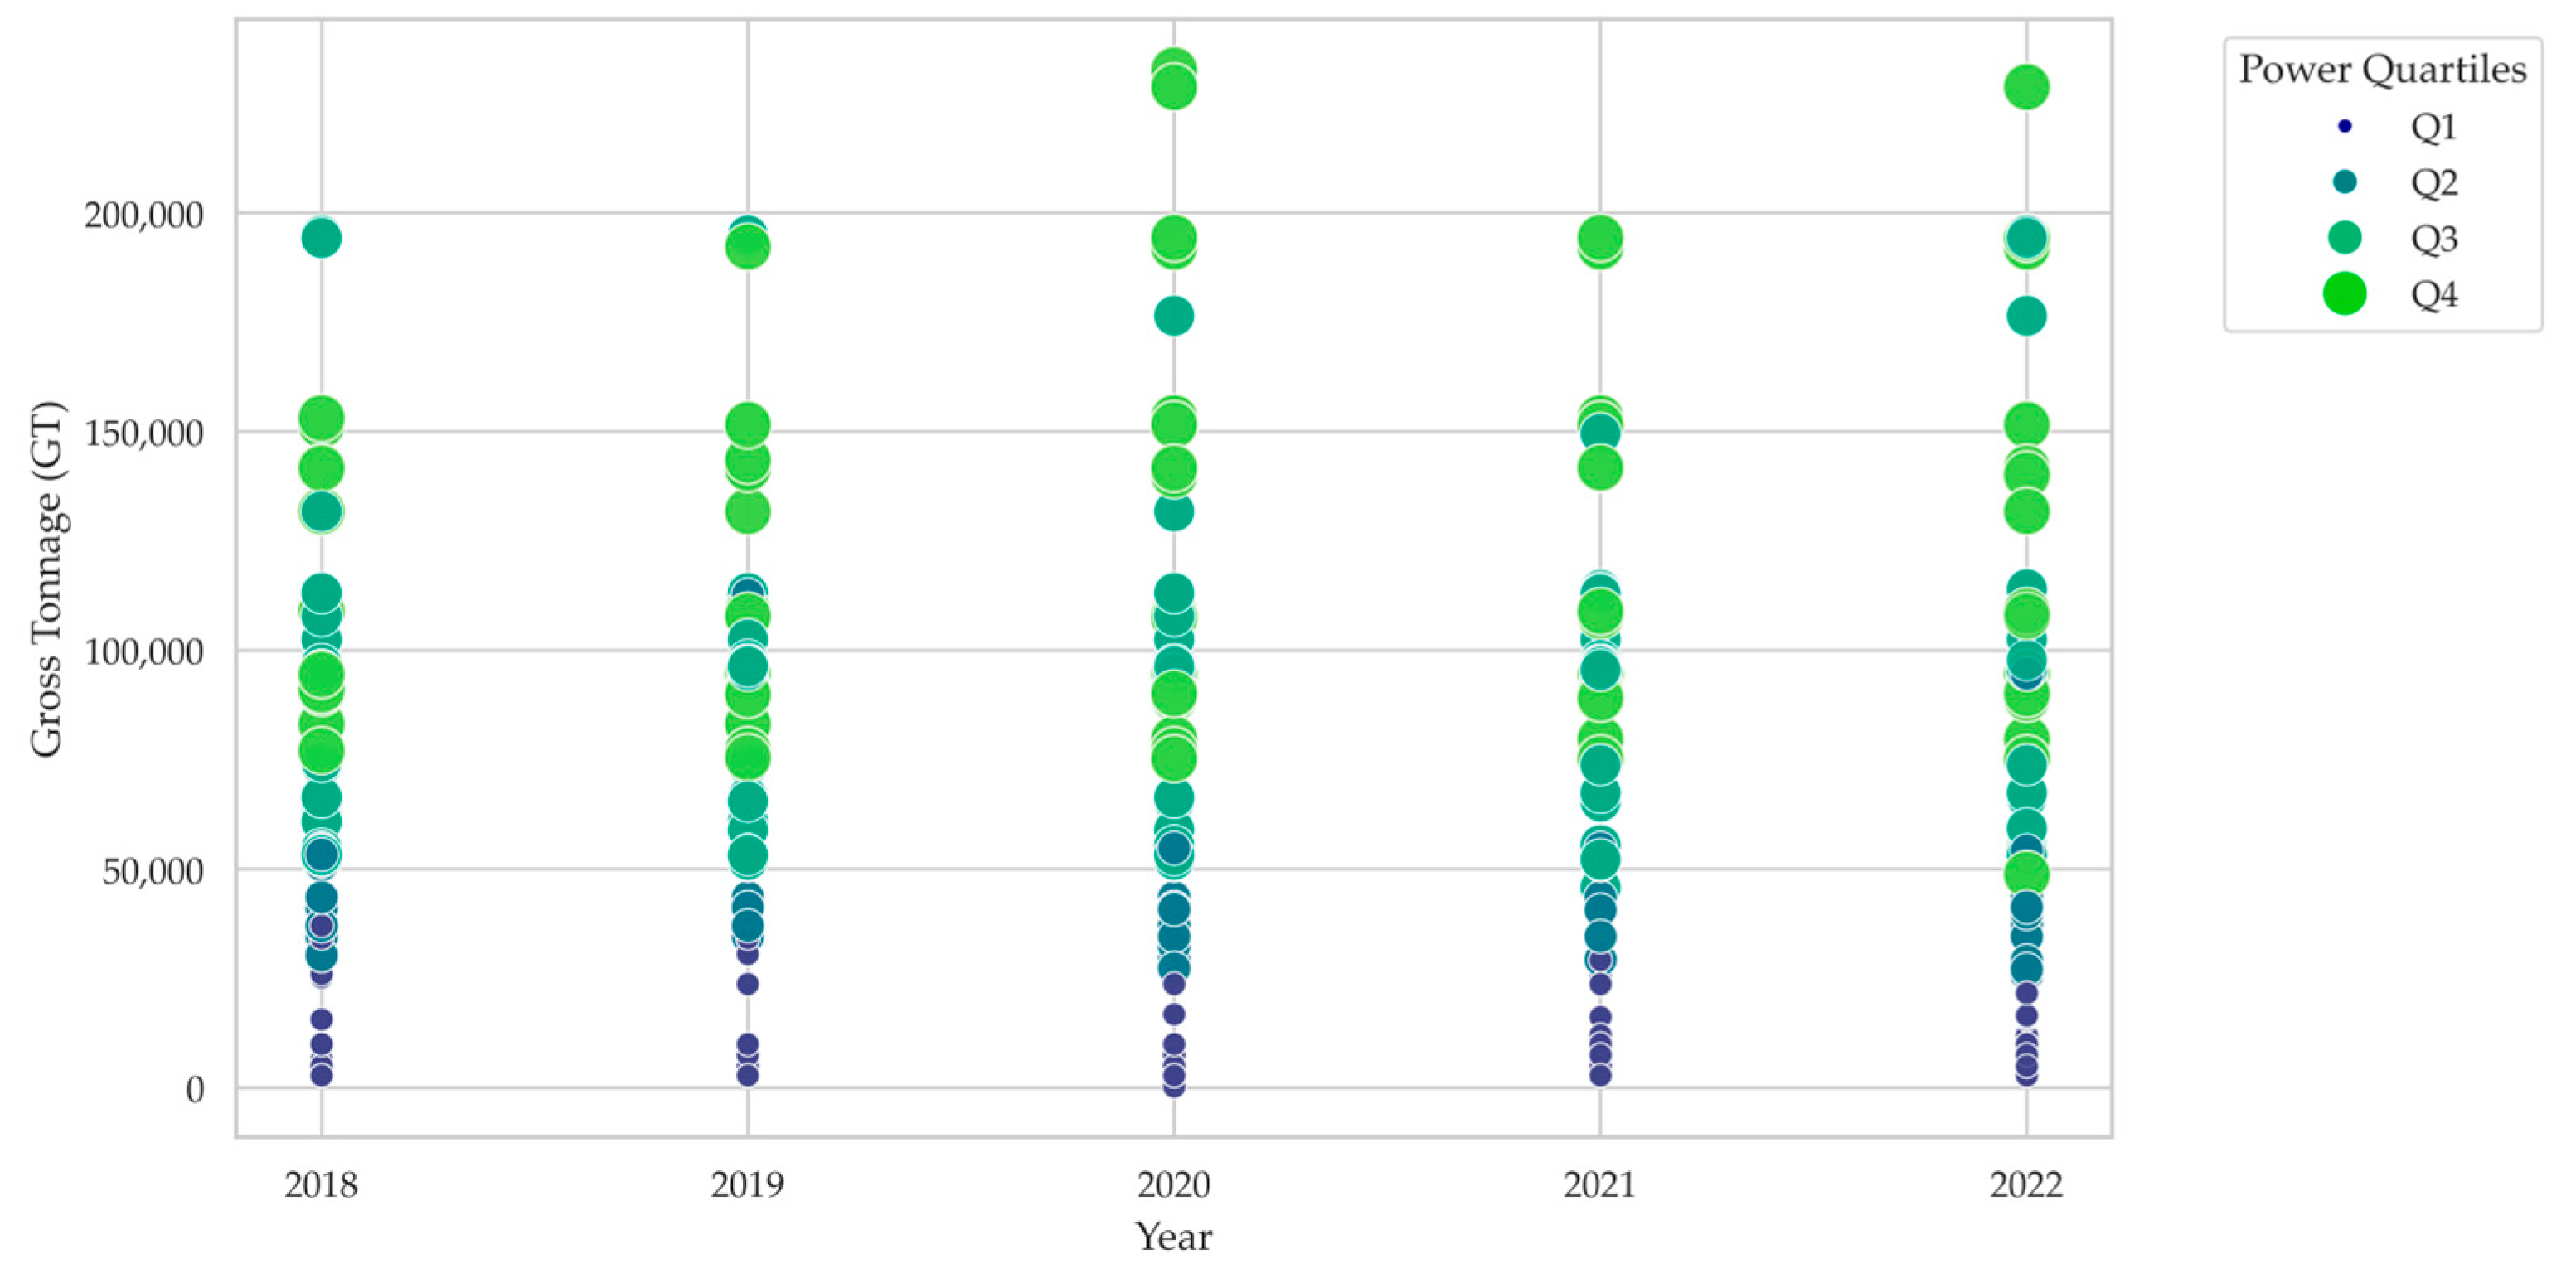
- In 2022, there was a significant increase in the ME power and GT in the LBT.
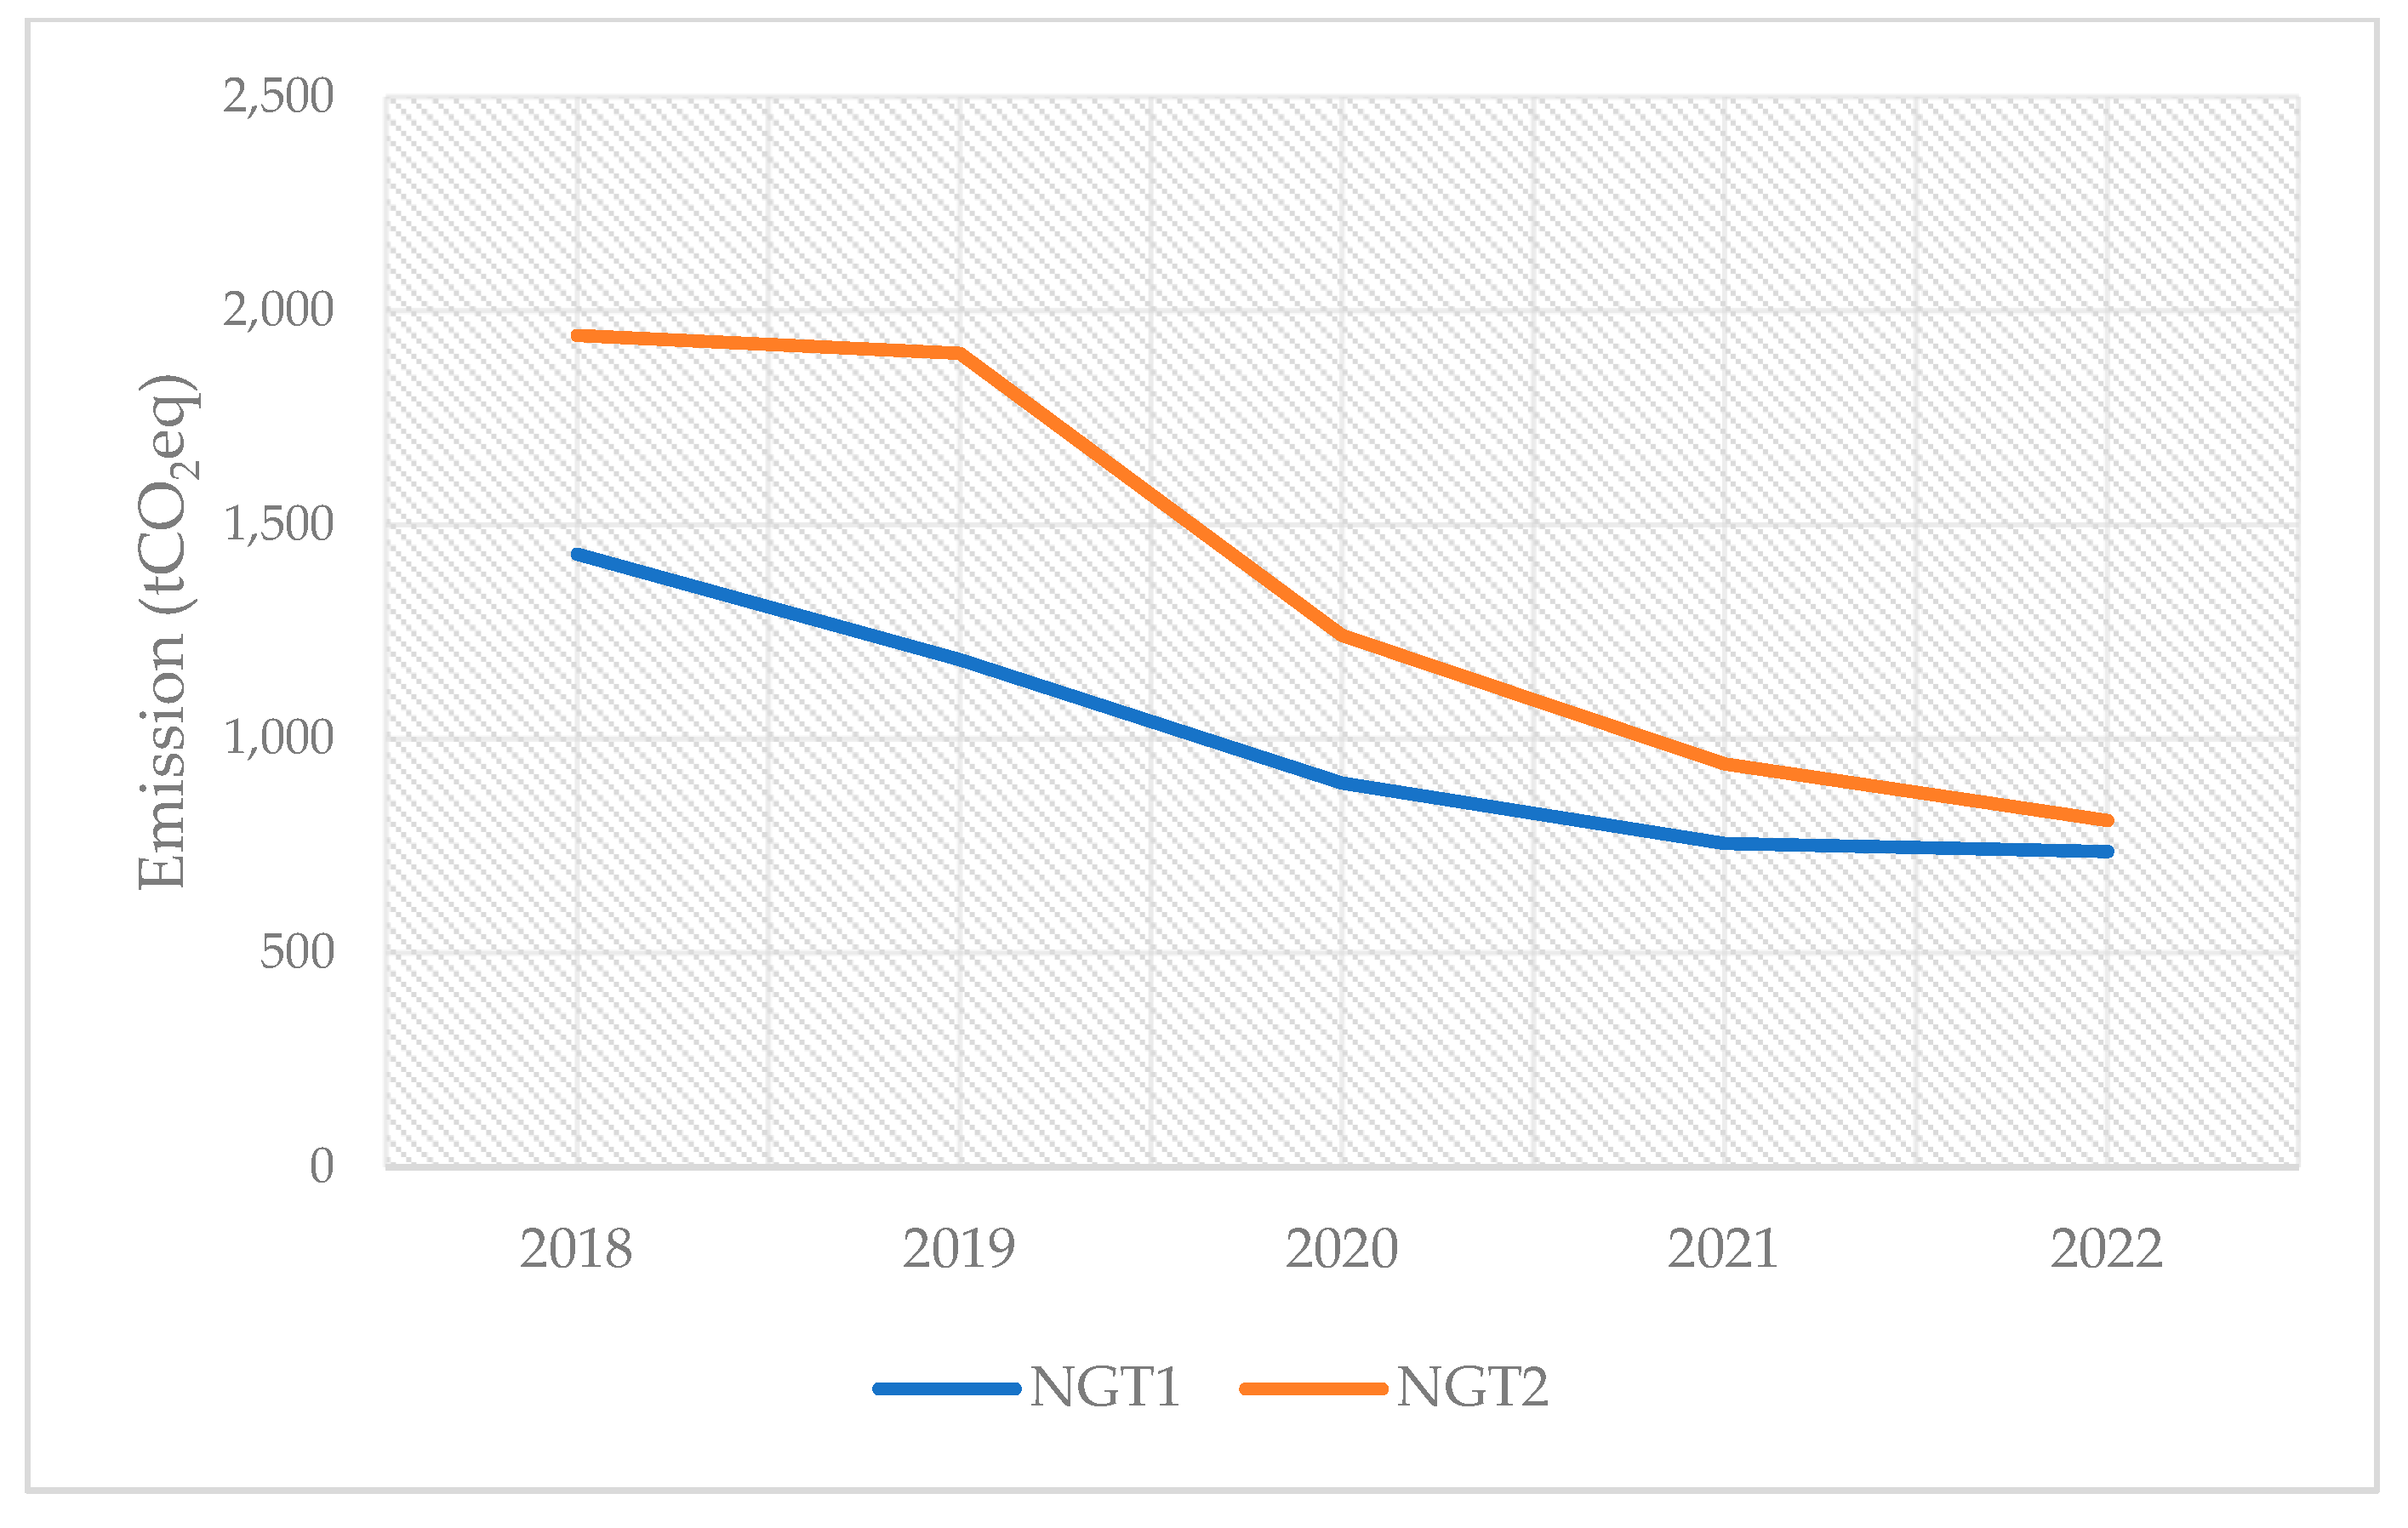
- Starting in 2019, the NGT managed ships with ME power in the third quartile (Q3). However, it was not until 2022 that it began to handle ships from this quartile with higher GT.
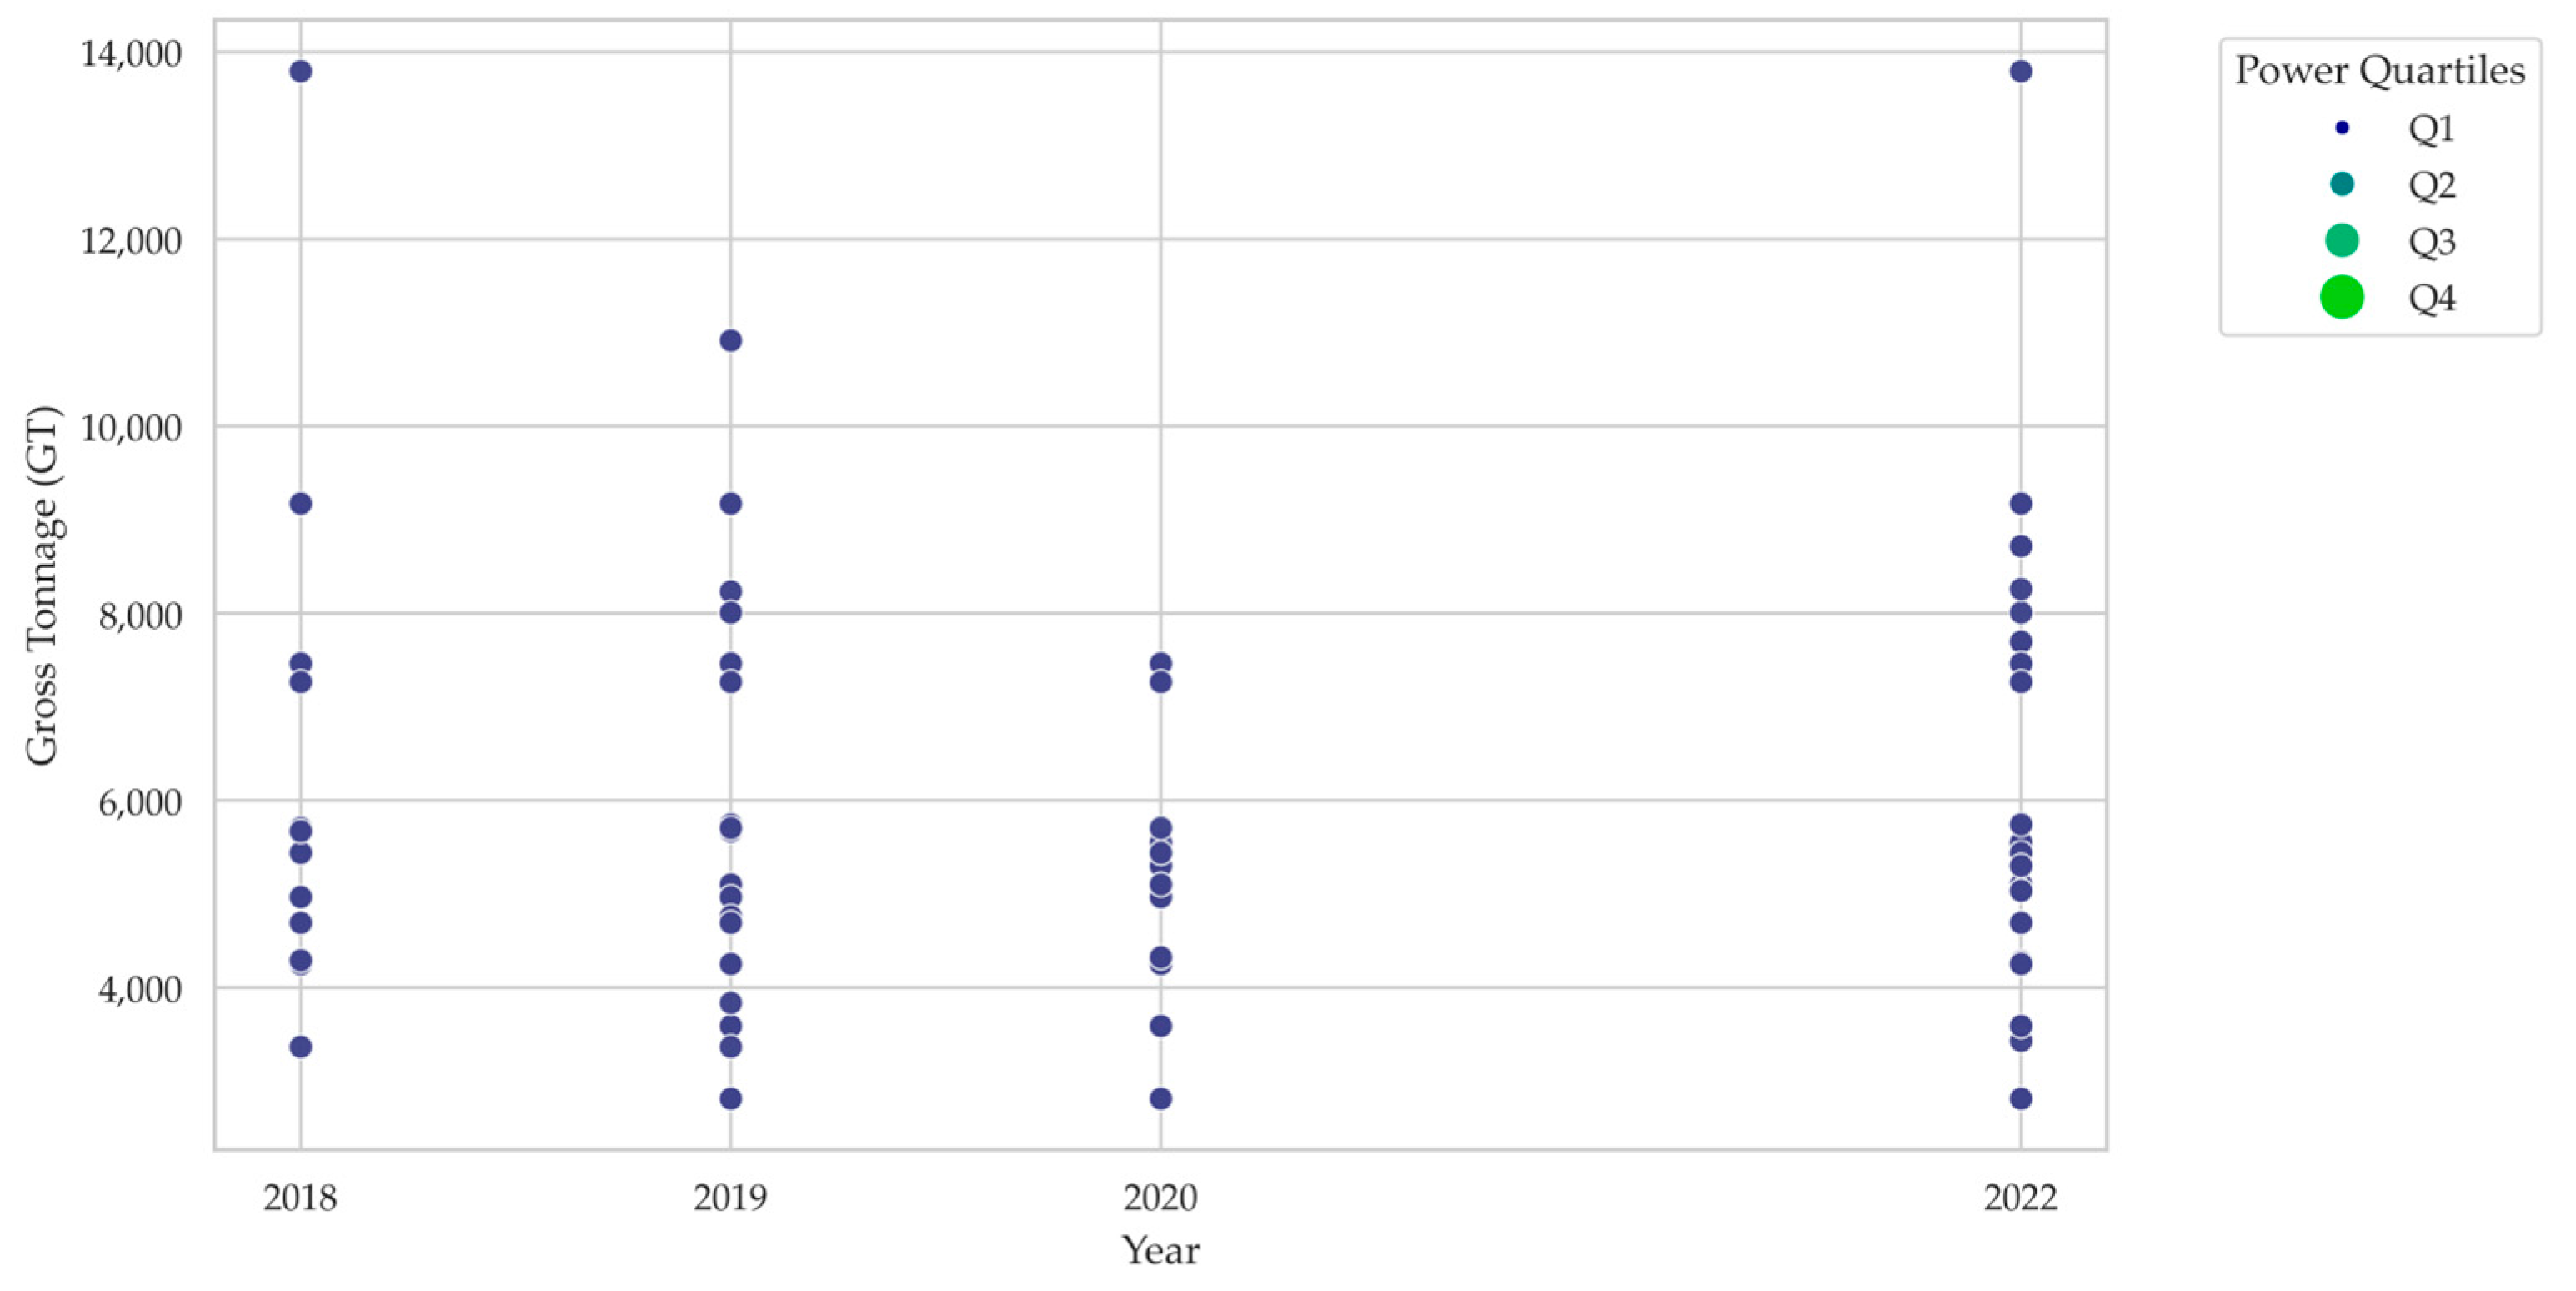
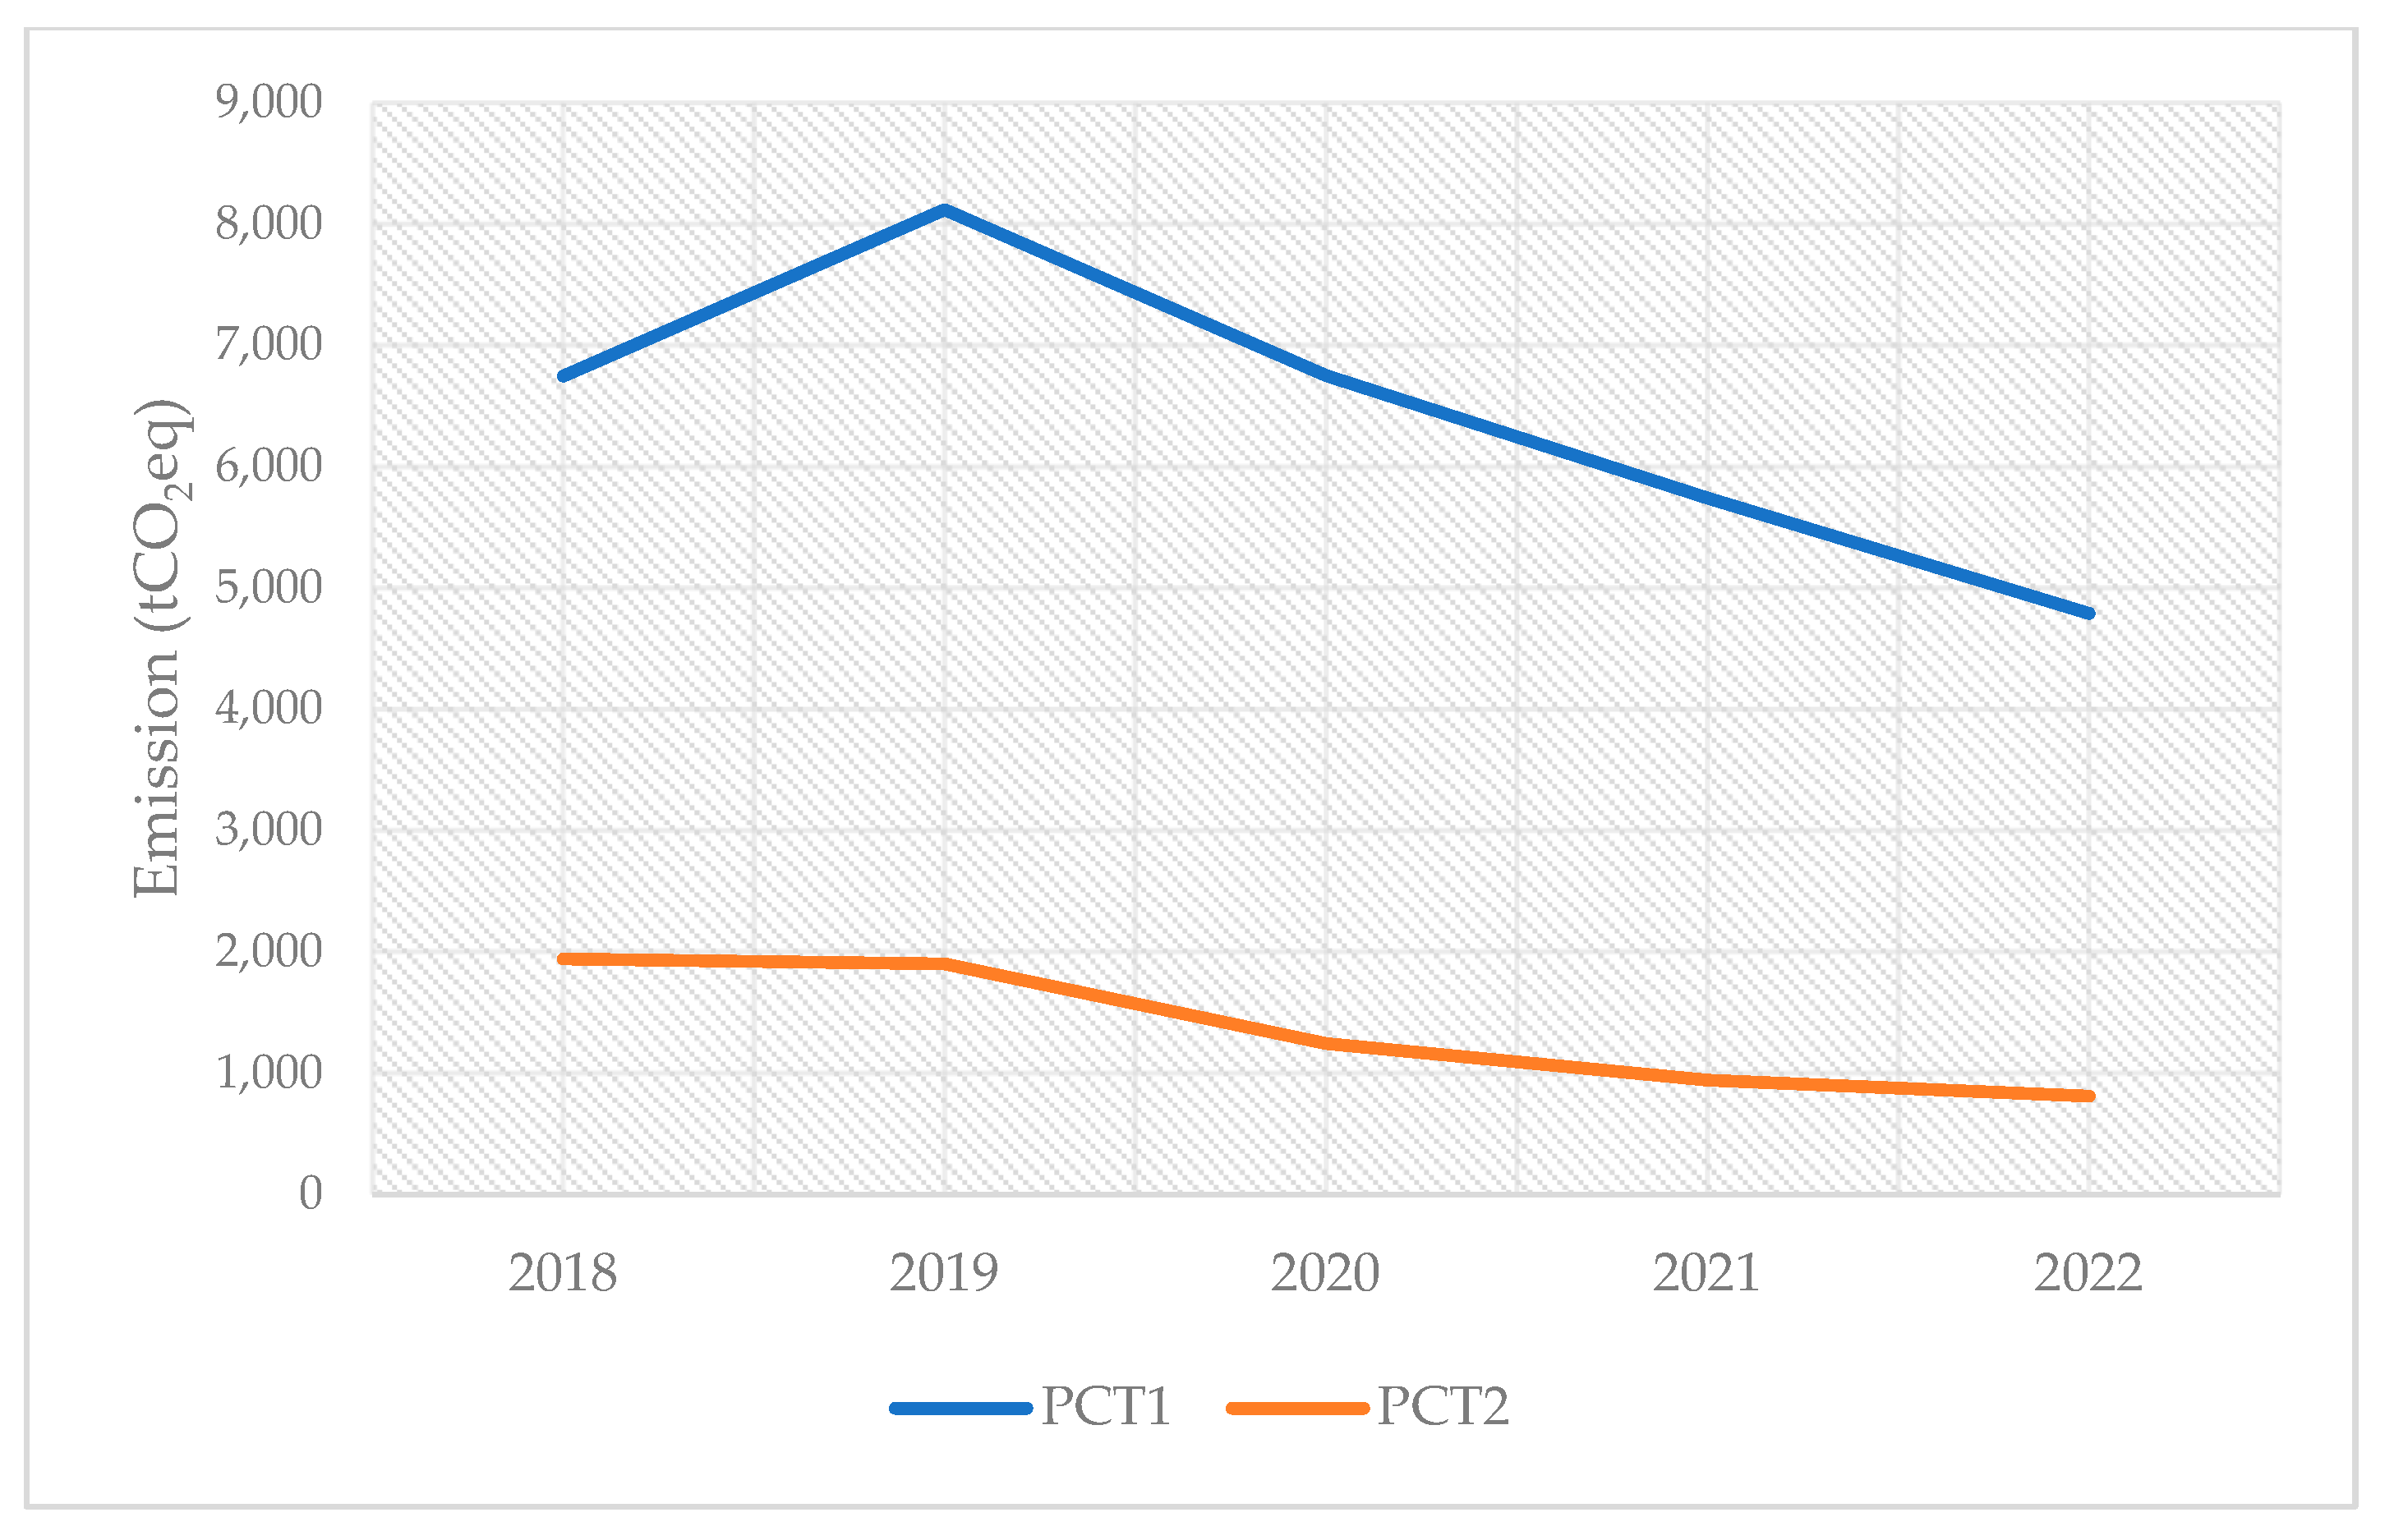
- Throughout the analyzed years, ships with ME power across all quartiles were observed. The only exception was the PCT, which during the same period, exclusively handled ships from the first quartile (Q1), regardless of GT.
4. Conclusions
Author Contributions
Funding
Data Availability Statement
Acknowledgments
Conflicts of Interest
Abbreviations
| AE | Auxiliary engine |
| AJAPS | Port of Sines jurisdiction area |
| AMP | Alternative maritime power |
| APA | Portuguese Environment Agency |
| CI | Coil ironing |
| dwt | Dead weight tons |
| EEA | European Environment Agency |
| EE | Electrical energy |
| ESS | Energy storage system |
| GCT | General cargo terminal |
| GHG | Greenhouse gas |
| GT | Gross tonnage |
| HVSC | High-voltage shore connection |
| IMO | International Maritime Organization |
| JUL | Logistics Single Window |
| JUP | Single Port Window |
| LBT | Liquid bulk terminal |
| LNG | Liquefied natural gas |
| LPG | Liquefied petroleum gas |
| LVSC | Low-voltage shore connection |
| MARPOL | International Convention for the Prevention of Pollution from Ships |
| ME | Main engine |
| MEPC | Marine Environment Protection Committee |
| MSP | Maritime spatial planning |
| NGT | Natural gas terminal |
| OILPOL | Convention for the Prevention of Pollution of the Sea by Oil |
| OPS | Onshore power supply |
| PCT | Petrochemical terminal |
| PLF | Passenger locator form |
| PM | Particulate material |
| RESs | Renewable energy sources |
| RMGs | Rail-mounted gantries |
| RTGs | Rubber-tired gantries |
| ro_ro | Roll-on/roll-off |
| SCT | Container terminal |
| SP | Shore power |
| SSE | Shore-side electricity |
| SSP | Shore-to-ship power |
| TEU | Twenty-foot equivalent unit |
| THSs | Total hydrocarbons |
| TPs | Transformation points |
| VOCs | Volatile organic compounds |
References
- Archer, D.; Martin, P.; Buffett, B.; Brovkin, V.; Rahmstorf, S.; Ganapolski, A. The importance of ocean temperature to global biogeochemistry. Earth Planet. Sci. Lett. 2004, 222, 333–348. [Google Scholar] [CrossRef]
- Ma, D.; Zhao, F.; Zhu, L.; Li, X.; Wei, J.; Chen, X.; Hou, L.; Li, E.; Liu, M. Deep learning reveals hotspots of global oceanic oxygen changes from 2003 to 2020. Int. J. Appl. Earth Obs. Geoinf. 2025, 136, 104363. [Google Scholar] [CrossRef]
- Drufrénot, G.; Ginn, W.; Pourroy, M. Climate pattern effects on global economic conditions. Econ. Model. 2024, 141, 106920. [Google Scholar] [CrossRef]
- Trueb, L.; Gacutan, J.; Phaphotjanaporn, T.; Alarcon, M.; Milligan, B. Identifying the institutional modalities for commencing Environmental-Economic Accounting for the ocean. Mar. Policy 2024, 170, 106410. [Google Scholar] [CrossRef]
- Calado, H.; Cervera-Núnez, C.; Gutierrez, D.; Stojanovic, I. Forging ahead: Climate-smart maritime spatial planning for the future. Mar. Policy 2025, 171, 106503. [Google Scholar] [CrossRef]
- Calado, H.; Santos, C.F.; Quintela, A.; Fonseca, C.; Gutierrez, D. The ups and downs of maritime spatial planning in Portugal. Mar. Policy 2023, 154, 105984. [Google Scholar] [CrossRef]
- Cheng, J.; Choi, J.; Seo, Y. Environmental efficiency assessment of coastal ports in China: Implications for sustainable port management. Mar. Pollut. Bull. 2025, 211, 117436. [Google Scholar] [CrossRef]
- UNCTAD. UN Trade&Devolopment. Available online: https://unctad.org/topic/transport-and-trade-logistics/review-of-maritime-transport (accessed on 9 December 2024).
- STATISTA. Statista. 2024. Available online: https://www.statista.com/topics/1728/ocean-shipping/#topicOverview (accessed on 9 December 2024).
- UN Trade&Devolopment, Maritime Transport. Data Insights. 2024. Available online: https://unctadstat.unctad.org/insights/theme/45 (accessed on 9 December 2024).
- UN. Climate Action. 2015. Available online: https://www.un.org/en/climatechange/paris-agreement (accessed on 9 December 2024).
- EUR-Lex. Communication from the Commission to the European Parliament, the European Council, the Council, the European Economic and Social Committee and the Committee of the Regions REPowerEU Plan. Document 52022DC0230. 2022. Available online: https://eur-lex.europa.eu/legal-content/EN/TXT/?uri=COM%3A2022%3A230%3AFIN (accessed on 16 December 2024).
- Igliński, B.; Pietrzak, M. Renewable and Sustainable Energy—Current State and Prospects. Energies 2025, 18, 797. [Google Scholar] [CrossRef]
- EUR-Lex. ‘Fit for 55’: Delivering the EU’s 2030 Climate Target on the Way to Climate Neutrality. 2021. Available online: https://eur-lex.europa.eu/legal-content/EN/TXT/?uri=CELEX%3A52021DC0550 (accessed on 16 December 2024).
- UN. International Convention (with Annexes) for the Prevention of Pollution of the Sea by Oil 1954 No. 4714. Available online: https://treaties.un.org/doc/Publication/UNTS/Volume%20600/volume-600-I-4714-English.pdf (accessed on 16 December 2024).
- IMO. Final Act the International Conference on Marine Pollution. 1973. Available online: https://www.imo.org/en/KnowledgeCentre/ConferencesMeetings/Pages/MP_CONF_1973-Default.aspx (accessed on 17 December 2024).
- IMO/MEPC. Resolution MEPC.304(72). Initial IMO Strategy on Reduction of GHG Emissions from Ships. 2018. Available online: https://wwwcdn.imo.org/localresources/en/KnowledgeCentre/IndexofIMOResolutions/MEPCDocuments/MEPC.304(72).pdf (accessed on 17 December 2024).
- IMO/MEPC. Resolution MEPC.377(80). 2023 IMO Strategy on Reduction of GHG Emissions from Ships. 2023. Available online: https://wwwcdn.imo.org/localresources/en/MediaCentre/PressBriefings/Documents/Resolution%20MEPC.377(80).pdf (accessed on 17 December 2024).
- Kizielewicz, J. Onshore power supply–trends in research studies. Front. Energy Res. 2024, 12, 1383142. [Google Scholar] [CrossRef]
- Su, P.; Hao, Y.; Qian, Z.; Zhang, W.; Chen, J.; Zhang, F.; Yin, F.; Feng, F.; Chen, D.; Li, Y. Emissions of intermediate volatility organic compound from waste cooking oil biodiesel and marine gas oil on a ship auxiliary engine. J. Environ. Sci. 2020, 91, 262–270. [Google Scholar] [CrossRef]
- Zhou, S.; Sun, A.; Lou, C.; Zhou, P.; Xi, H.; Shreka, M.; Wang, H.; Zhu, Y.; Feng, Y. Gaseous and particulate pollutant emissions from ocean-going tankers in the context of carbon reduction: Main engine, auxiliary engine, and auxiliary boiler. Energy 2024, 313, 133831. [Google Scholar] [CrossRef]
- ISO 8217:2024; Products from Petroleum, Synthetic and Renewable Sources—Fuels (Class F)—Specifications of Marine Fuels. ISO: Geneva, Switzerland, 2024. Available online: https://www.iso.org/standard/80579.html (accessed on 18 December 2024).
- Gao, X.; Yu, Q.; Dai, W.; Chen, Q. Examining the influence of port ship activities on pollutant emissions in port environments. Heliyon 2025, 11, e41208. Available online: https://www.cell.com/heliyon/fulltext/S2405-8440(24)17239-8?uuid=uuid%3A7c4d4b3e-e3a0-4441-8245-cb6d91da76ea (accessed on 18 December 2024). [CrossRef] [PubMed]
- Nunes, R.; Alvim-Ferraz, M.; Martins, F.; Sousa, S. Local mortality and costs from ship-related emissions in three major Portugueses ports. Urban Clim. 2024, 53, 101780. [Google Scholar] [CrossRef]
- Manqele, N.; Moolha, R.; Frost, L. The health and economic impacts of exposure to marine mobile emissions from ships in Durban port, South Africa. Atmos. Environ. X 2024, 23, 100277. [Google Scholar] [CrossRef]
- Boikos, C.; Rapkos, N.; Ioannidis, G.; Oppo, S.; Armengaud, A.; Siamidis, P.; Tsegas, G.; Ntziachristos, L. Factors affecting pedestrian-level ship pollution in port areas: CFD in the service of policy-making. Build. Environ. 2024, 258, 111594. [Google Scholar] [CrossRef]
- Nguyen, P.; Woo, S.; Kim, H. Ship emissions in hotelling phase and loading/unloading in Southeast Asia ports. Transp. Res. Part D Transp. Environ. 2022, 105, 103223. [Google Scholar] [CrossRef]
- Yu, D.; Li, D.; Sha, M.; Zhang, D. Production, Manufacturing, Transportation and Logistics Carbon-efficient deployment of electric rubber-tyred gantry cranes in container terminals with workload uncertainty. Eur. J. Oper. Res. 2019, 275, 552–569. [Google Scholar] [CrossRef]
- Wang, J.; Li, H.; Yang, H.; Ge, Y. Shore power for reduction of shipping emission in port: A bibliometric analysis. Transp. Res. Part E Logist. Transp. Rev. 2024, 188, 103639. [Google Scholar] [CrossRef]
- Tan, Z.; Sheng, D.; Yin, Y. Shore-power capacity allocation in a container shipping network under ships’ strategic behaviors. Transp. Res. Part B Methodol. 2025, 192, 103151. [Google Scholar] [CrossRef]
- Ling-Chin, J.; Roskilly, A. Investigating the implications of a new-build hybrid power system for Roll-on/Roll-off cargo ships from a sustainability perspective—A life cycle assessment case study. Appl. Energy 2016, 181, 416–434. [Google Scholar] [CrossRef]
- Abu, N.; Bazmohammadi, N.; Vasquez, J. Electrification of onshore power systems in maritime transportation towards decarbonization of ports: A review of the cold ironing technology. Renew. Sustain. Energy Rev. 2023, 178, 113243. [Google Scholar] [CrossRef]
- Wang, Q. Charting a greener course: China’s recent legal strategies in shore power promotion for achieving maritime emission targets. Mar. Policy 2024, 170, 106386. [Google Scholar] [CrossRef]
- Sheng, J.; Tang, L.; Yang, Z.; Yu, M.; Liu, X. Strategies of stakeholders’ selection of shore-to-ship power in China. Transp. Res. Part D Transp. Environ. 2023, 119, 103729. [Google Scholar] [CrossRef]
- Yue, M.; Wang, Y.; Guo, S.; Dai, L.; Hu, H. A multi-objective optimization study of berth scheduling considering shore side electricity supply. Ocean Coast. Manag. 2025, 261, 107500. [Google Scholar] [CrossRef]
- Prenc, R.; Vucetic, D.; Cuculic, A. High Voltage Shore Connection in Croatia: Network configurations and formation of the connection point to the Utility power grid. Electr. Power Syst. Res. 2018, 157, 106–117. [Google Scholar] [CrossRef]
- Wang, W.; Liu, K.; Peng, Y.; Yu, Q.; Guo, J.; Yu, T. Investigating relationships between shore power utilization and characteristics of ships and berths. Transp. Res. Part D 2024, 136, 104446. [Google Scholar] [CrossRef]
- Herrero, A.; Ortega, A.; Díaz-Ruíz-Navamuel, E.; Gutierrez, M.; López-Diaz, A. Influence of the Implantation of the Onshore Power Supply (OPS) System in Spanish Medium-Sized Ports on the Reduction in CO2 Emissions: The Case of the Port of Santander (Spain). J. Mar. Sci. Eng. 2022, 10, 1446. [Google Scholar] [CrossRef]
- Kim, A.; Seo, J.; Seo, Y. Key barriers to adopting onshore power supply to reduce port air pollution: Policy implications for the maritime industry in South Korea. Mar. Policy 2023, 157, 105866. [Google Scholar] [CrossRef]
- Mahdi, H.; Hoff, B.; Ostrem, T. A Review of Power Converters for Ships Electrification. IEEE Trans. Power Electron. 2023, 38, 4680–4697. [Google Scholar] [CrossRef]
- IEC/IEEE International Standard 80005-1-2019; Utility Connections in Port—Part 1: High Voltage Shore Connection (HVSC) Systems—General Requirements. IEC/IEEE: Piscataway, NJ, USA, 2019. Available online: https://ieeexplore.ieee.org/document/8666180 (accessed on 6 January 2025).
- Zhu, X.; Wang, K.; Yang, J.; Huang, L.; Shen, B.; Sun, M. Research on the control strategy of grid connection between shore power supply and ship power grid. Energy Rep. 2022, 8, 638–647. [Google Scholar] [CrossRef]
- Xiang, Z.; Xin, X.; Zhang, T.; Chen, K.; Liu, M. Asia-Europe liner shipping network design model considering Arctic route and black carbon tax. Ocean Coast. Manag. 2025, 261, 107492. [Google Scholar] [CrossRef]
- Gutierrez-Romero, J.; Esteves-Pérez, J.; Zamora, B. Implementing Onshore Power Supply from renewable energy sources for requirements of ships at berth. Appl. Energy 2019, 255, 113883. [Google Scholar] [CrossRef]
- Pivetta, D.; Armi, C.; Sandrin, P.; Bogar, M.; Taccani, R. The role of hydrogen as enabler of industrial port area decarbonization. Renew. Sustain. Energy Rev. 2024, 189, 113912. [Google Scholar] [CrossRef]
- Zhang, Y.; Liang, C.; Shi, J.; Lim, G.; Wu, Y. Optimal Port Microgrid Scheduling Incorporating Onshore Power Supply and Berth Allocation Under Uncertainty. Appl. Energy 2022, 313, 118856. [Google Scholar] [CrossRef]
- Albo-Lopez, A.; Carrillo, C.; Díaz-Dorado, E. Contribution of Onshore Power Supply (OPS) and Batteries in Reducing Emissions from Ro-Ro Ships in Ports. J. Mar. Sci. Eng. 2024, 12, 1833. [Google Scholar] [CrossRef]
- Amaral, M.; Amanor, N.; Arsénio, P. Methodology for Assessing Power Needs for Onshore Power Supply in Maritime Ports. Sustainability 2023, 15, 16670. [Google Scholar] [CrossRef]
- Manuel-López, F.; Diáz-Gutierrez, D.; Camero-Orive, A.; Parra-Santiago, J. Iberian Ports as a Funnel for Regulations on the Decarbonization of Maritime Transport. Sustainability 2024, 6, 862. [Google Scholar] [CrossRef]
- Chen, J.; Zheng, T.; Garg, A.; Xu, L.; Li, S.; Fei, Y. Alternative Maritime Power application as a green port strategy: Barriers in China. J. Clean. Prod. 2019, 213, 825–837. [Google Scholar] [CrossRef]
- Yin, M.; Wang, Y.; Zhang, Q. Policy Implementation Barriers and Economic Analysis of Shore Power Promotion in China. Transp. Res. Part D Transp. Environ. 2020, 87, 102506. [Google Scholar] [CrossRef]
- Wang, N.; Mu, W.; Ma, R. A Systematic understanding of the risk development process for port authority. Mar. Policy 2024, 167, 106243. [Google Scholar] [CrossRef]
- Costa, P.; Agreira, C.F.; Pestana, R.; Cao, Y. European Ports Transition—A new Approached of a8 Load Model, Consumption Integration of Renewable Energy Sources and Energy Storage Systems Profiles. In Proceedings of the IEEE Conference on Vehicle Power and Propulsion (VPPC) 2024, Washington, DC, USA, 7–10 October 2024. [Google Scholar] [CrossRef]
- Uzun, D.; Okumus, D.; Canbulat, O.; Gunbeyaz, S.; Karamperidis, S.; Hudson, D.; Turan, O.; Allan, R. Port energy demand model for implementing onshore power supply and alternative fuels. Transp. Res. Part D Transp. Environ. 2024, 136, 104432. [Google Scholar] [CrossRef]
- Khan, R.; Yin, J.; Mustafa, F.; Shi, E. Factor assessment of hazardous cargo ship berthing accidents using and ordered logit regression model. Ocean Eng. 2023, 284, 115211. [Google Scholar] [CrossRef]
- Lecue, M.; Darbra, R. Accidents in European ports involving chemical substances: Characteristics and trends. Saf. Sci. 2019, 115, 278–284. [Google Scholar] [CrossRef]
- Ronza, A.; Carol, S.; Espejo, V.; Vilchez, J.; Arnaldos, J. A quantitative risk analysis approach to port hydrocarbon logistics. J. Hazard. Mater. 2006, 128, 10–24. [Google Scholar] [CrossRef]
- Lalla-Ruiz, E.; López-Plata, I.; Expósito-Izquierdo, C.; Barrios-Fleitas, Y.; González-Ramírez, R. Greening container terminals through optimization: Through optimization: A systematic review on recent advances. Curr. Opin. Environ. Sustain. 2024, 71, 101490. [Google Scholar] [CrossRef]
- Styhre, L.; Winnes, H.; Black, J.; Lee, J.; Le-Griffin, H. Greenhouse gas emissions from ships in ports—Case studies in four continents. Transp. Res. Part D 2017, 54, 212–224. [Google Scholar] [CrossRef]
- Romero-Faz, D.; Camarero-Orive, A. Risk assessment of critical infrastructures—News parameters for commercial ports. Int. J. Crit. Infraestruct. Prot. 2017, 18, 50–57. [Google Scholar] [CrossRef]
- Rao, P.; Raghavan, K. Hazard and risk potential of chemical handling at ports. J. Loss Prev. Process Ind. 1996, 9, 199–204. [Google Scholar] [CrossRef]
- Steen, M.; Ystmark, K.; Hansen, L.; Seter, H. Implementing decarbonisation measures in Norwegian ports. Transp. Res. Interdiscip. Perspect. 2024, 23, 100993. [Google Scholar] [CrossRef]
- Hoang, A.; Foley, A.; Nizetik, S.; Huang, Z.; Ong, H.; Olcer, A.; Pham, V.; Nguyen, X. Energy-related approach for reduction of CO2 emissions: A critical strategy on the port-to-ship pathway. J. Clean. Prod. 2022, 355, 131772. [Google Scholar] [CrossRef]
- Christiansen, M.; Fagerholt, K.; Pisinger, D. Fifty years on maritime transportation. EURO J. Transp. Logist. 2025, 14, 100148. [Google Scholar] [CrossRef]
- APA. Fator de Emissão de Gases de Efeito de Estufa para a Eletricidade Produzida em Portugal. Available online: https://apambiente.pt/clima/fator-de-emissao-de-gases-de-efeito-de-estufa-para-eletricidade-produzida-em-portugal (accessed on 7 January 2025).
- Lopes, D.; Graca, D.; Rafael, S.; Rosa, M.; Relvas, H.; Ferreira, J.; Reis, J.; Lopes, M. An exploratory approach to estimate point emission sources. Atmos. Environ. 2023, 312, 120026. [Google Scholar] [CrossRef]
- Chen, J.; Chen, H.; Shi, J.; Shi, M.; Xu, J.; Jiang, H.; Xiang, J.; Liu, X.; Chen, H. AIS data-driven assessment of shore side electricity’s emission reduction potential in China. Transp. Policy 2025, 167, 130–144. [Google Scholar] [CrossRef]
- PGDLISBOA.PT. Ministério Público de Portugal. 2019. Available online: https://www.pgdlisboa.pt/leis/lei_mostra_articulado.php?nid=3188&tabela=leis&ficha=1&pagina=1&so_miolo (accessed on 8 January 2025).
- Santos, S.; Lima, L.; Castelo, M. Corporate sustainability of Portuguese seaports. J. Clean. Prod. 2022, 380, 136057. [Google Scholar] [CrossRef]
- Gil, R.; Borges, R.; Maritna, A.; Macebo, B.; Teixeira, L. A Simulation Tool to Forecast the Behaviour of a New Smart Pre-Gate at the Sines Container Terminal. Sustainability 2025, 17, 163. [Google Scholar] [CrossRef]
- EEA. EEA Report No 13/2019. EMEP/EEA Air Pollutant Emission Inventory Guidebook 2019. Technical Guidance to Prepare National Emission Inventories. Available online: https://www.eea.europa.eu/en/analysis/publications/emep-eea-guidebook-2019 (accessed on 16 January 2025).
- EEA. EMEP/EEA Air Pollutant Emission Inventory Guidebook 2023. Available online: https://www.eea.europa.eu/en/analysis/publications/emep-eea-guidebook-2023 (accessed on 16 January 2025).
- EEA. European Maritime Transport Environmental Report. 2021. Available online: https://www.eea.europa.eu/en/analysis/publications/maritime-transport#:~:text=This%20report%20provides%20a%20factual%20analysis%20of%20the,to%20reduce%20the%20sector%27s%20impact%20on%20our%20environment (accessed on 16 January 2025).
- Run, S.; Abouarghoub, W.; Demir, E. Enhancing data quality in maritime transportation: Apractical method for imputing missing ship static data. Ocean Eng. 2025, 315, 119722. [Google Scholar] [CrossRef]
- Abramowski, T.; Cepowski, T.; Zvolenský, P. Determination of regression formulas for key design characteristics of container ships at preliminary design stage. New Trends Prod. Eng. 2018, 1, 247–257. [Google Scholar] [CrossRef]
- Cepowski, T. Regression Formulas for the Estimation of Engine Total Power for Tankers, Container Ships and Bulk Carriers on the Basis of Cargo Capacity and Design Speed. Pol. Marit. Res. 2019, 26, 82–94. [Google Scholar] [CrossRef]
- Batista, T.; Vásquez, C.; Ramírez-Pisco, R.; Marinho, L.; Borges, F.; Araujo, J. Energy Consumption and Carbon Footprint of the Port of Sines: Contribution to Maritime Transport Sustainability. Sustainability 2025, 17, 3382. [Google Scholar] [CrossRef]
- Baldi, F.; Larsen, U.; Gabreilii, C.; Andersson, K. Analysis of the influence of the engine, propeller and auxiliary generation interaction on the energy efficiency of controllable pitch propeller ships. In Proceedings of the International Conference of Maritime Technology, Glasgow, UK, 7–9 July 2014. Available online: https://core.ac.uk/download/pdf/70610846.pdf (accessed on 18 January 2025).
- Pamik, M.; Nuran, M. Increasing ship energy efficiency and emission reduction with diesel electric propulsion system. World J. Environ. Res. 2020, 10, 50–60. [Google Scholar] [CrossRef]
- Kolios, A. Retrofitting Technologies for Eco-Friendly Ship Structures: A Risk Analysis Perspective. J. Mar. Sci. Eng. 2024, 12, 679. [Google Scholar] [CrossRef]
- Lozano, J.; Pérez-Baez, S.; Leon-Zerpa, F.; Mendieta-Pino, C.A. Alternatives for the Optimization and Reduction in the Carbon Footprint in Island Electricity Systems (IESs). Sustainability 2024, 16, 1214. [Google Scholar] [CrossRef]
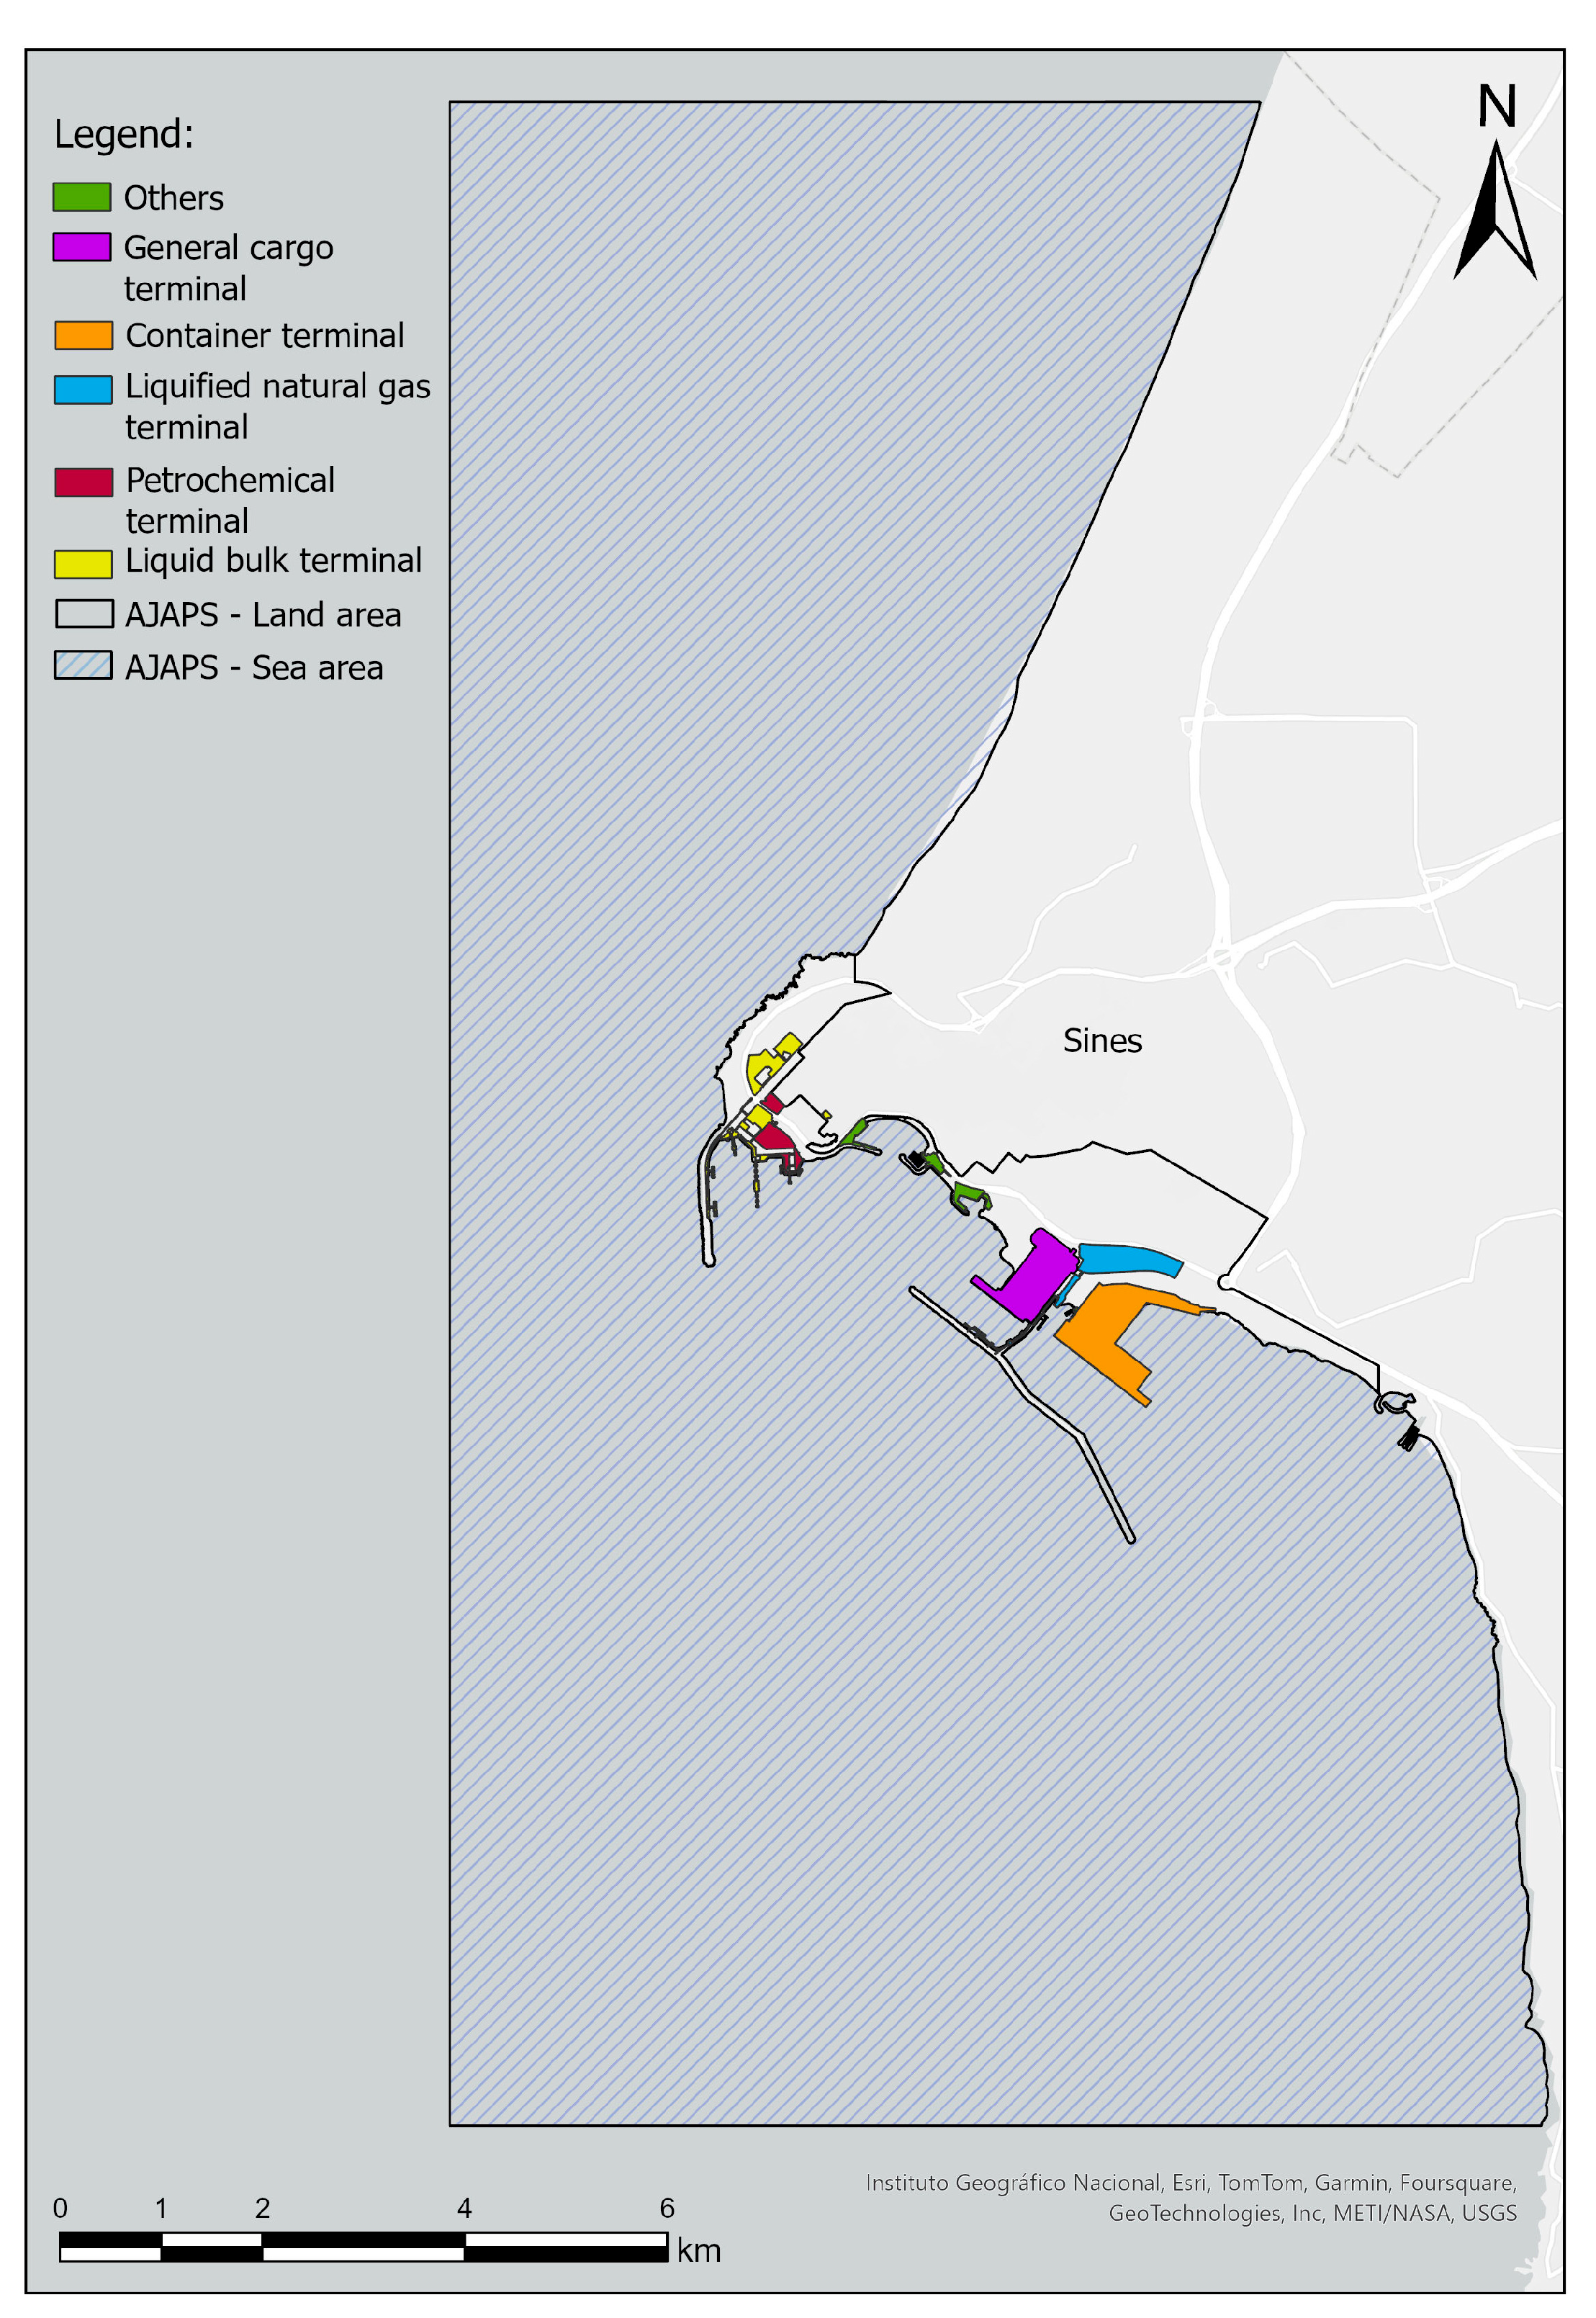


| Terminal | Identification | Depth (m) | Cargo Type |
|---|---|---|---|
| Containerized cargo | SCT | 17 | Container |
| Liquid bulks | LBT | 28 | Crude oil, refined oil, liquefied petroleum gas (LPG), methanol, and chemical naphtha. |
| Liquefied natural gas | NGT | 15 | LNG |
| Petrochemical | PCT | 12 | Propylene, ethylene, butadiene, ethyl tertiary butyl ether, ethanol, methyl tertiary butyl ether, aromatic mixtures, and methanol |
| General cargo | GCT | 18 | Dry bulk, general cargo, and ro_ro |
| Others | Others | -- | Sports and fishing port, tugboat service, and other services |
| Terminal | 2018 | 2019 | 2020 | 2021 | 2022 | Total |
|---|---|---|---|---|---|---|
| LBT | 564 | 611 | 495 | 187 | 857 | 2714 |
| NGT | 23 | 29 | 20 | -- | 55 | 127 |
| SCT | 649 | 672 | 791 | 540 | 644 | 3296 |
| PCT | 51 | 96 | 55 | -- | 96 | 298 |
| Total | 1287 | 1408 | 1361 | 727 | 1652 | 6435 |
| Terminal | 2018 | 2019 | 2020 | 2021 | 2022 | Average |
|---|---|---|---|---|---|---|
| LBT | 16.03 | 17.54 | 16.25 | 10.27 | 19.06 | 15.83 |
| NGT | 23.52 | 23.28 | 23.61 | -- | 22.33 | 23.19 |
| SCT | 16.37 | 14.80 | 15.34 | 19.04 | 23.36 | 17.78 |
| PCT | 26.15 | 23.66 | 24.62 | -- | 24.27 | 24.68 |
| Terminal | 2018 | 2019 | 2020 | 2021 | 2022 | Average |
|---|---|---|---|---|---|---|
| LBT | 9.59 | 12.41 | 11.54 | 4.00 | 16.61 | 10.83 |
| NGT | 93.27 | 98.52 | 89.46 | -- | 84.29 | 91.39 |
| SCT | 48.22 | 42.53 | 46.78 | 58.34 | 73.49 | 53.87 |
| PCT | 16.79 | 14.53 | 12.33 | -- | 13.09 | 14.19 |
Disclaimer/Publisher’s Note: The statements, opinions and data contained in all publications are solely those of the individual author(s) and contributor(s) and not of MDPI and/or the editor(s). MDPI and/or the editor(s) disclaim responsibility for any injury to people or property resulting from any ideas, methods, instructions or products referred to in the content. |
© 2025 by the authors. Licensee MDPI, Basel, Switzerland. This article is an open access article distributed under the terms and conditions of the Creative Commons Attribution (CC BY) license (https://creativecommons.org/licenses/by/4.0/).
Share and Cite
Vásquez, C.L.; Borges, F.A.; Marinho, L.; Hernández, J.C.; Batista, T. Onshore Power Supply in Multi-Terminal Maritime Ports. Energies 2025, 18, 2489. https://doi.org/10.3390/en18102489
Vásquez CL, Borges FA, Marinho L, Hernández JC, Batista T. Onshore Power Supply in Multi-Terminal Maritime Ports. Energies. 2025; 18(10):2489. https://doi.org/10.3390/en18102489
Chicago/Turabian StyleVásquez, Carmen Luisa, Francisco António Borges, Lucas Marinho, Jesús C. Hernández, and Teresa Batista. 2025. "Onshore Power Supply in Multi-Terminal Maritime Ports" Energies 18, no. 10: 2489. https://doi.org/10.3390/en18102489
APA StyleVásquez, C. L., Borges, F. A., Marinho, L., Hernández, J. C., & Batista, T. (2025). Onshore Power Supply in Multi-Terminal Maritime Ports. Energies, 18(10), 2489. https://doi.org/10.3390/en18102489