1. Introduction
Climate change is widely recognised as one of today’s main challenges, affecting ecosystems and societies around the world. This phenomenon is largely due to the increase in greenhouse gas (GHG) concentrations in the atmosphere, which intensifies the global warming effect and promotes significant environmental imbalances. Among the GHGs, carbon dioxide (CO
2) is often singled out as the biggest culprit due to its significant volume of emissions, mainly from the burning of fossil fuels [
1]. However, other gases, such as methane (CH
4) and nitrous oxide (N
2O), also play a crucial role due to their high global warming potential.
With the creation of the United Nations’ (UN’s) Sustainable Development Goals (SDGs) in 2015, companies’ interest in quantifying their GHG emissions often stems from a customer requirement. As the consequences of climate change become more evident, companies face increasing pressure to adopt more sustainable practices and reduce their environmental footprint, which can lead to commercial advantages by presenting an environmental and sustainable stance [
2]. The textile industry plays a critical role in global supply chains, yet its environmental impact, particularly in terms of GHG emissions, remains underexplored in the scientific literature. A focused search conducted on the Scopus database, using the terms “textile industry”, “carbon footprint”, “GHG”, and “CO
2 emissions”, while restricting results to peer-reviewed journals and science and engineering articles, revealed a surprisingly low number of publications (24). This highlights a significant gap in the scientific exploration of this industry’s contribution to climate change and underlines the importance of further research in this domain.
Research into the carbon footprint of the textile industry faces significant challenges, including the uncertainty and incompatibility of accounting results due to different models and evaluation limits. The division of the stages of the life cycle of textile products and the analysis of the origin of emissions are still superficial, making it difficult to conduct accurate studies. Furthermore, the lack of evaluation of the impact of the carbon footprint compromises its use as a tool for sustainable development, limiting the formulation of effective strategies to reduce emissions and energy consumption in textile production [
3].
Calculating the carbon footprint is an essential tool in this context, making it possible to quantify environmental impacts and identify opportunities for continuous improvement. “The current definition of the textile industry’s carbon footprint is the amount of greenhouse gas emissions directly and indirectly caused by textiles during the industrial processing stage” [
4]. The lack of comprehensive tools tailored to this industry limits the ability to accurately quantify its carbon footprint and hinders the development of effective mitigation strategies. Therefore, the objective of this study is to develop a calculator for a specific company, adaptable to other companies in this sector, to measure the carbon footprint and GHG emissions. This includes both the primary footprint, which directly monitors carbon emissions from energy consumption—such as the burning of fossil fuels for electricity, heating, and transportation—and the secondary footprint, which accounts for indirect emissions associated with the life cycle of products and overall sustainability practices [
5]. This would allow a company to obtain data on GHG emissions, facilitating more precise analysis based on international standards such as the Greenhouse Gas Protocol. Based on the analysis of existing carbon footprint calculators, we adopted a similar structured framework to quantify not only the global emissions in kilograms of CO
2 equivalent (kg CO
2e), but also to provide a more detailed assessment of key emission sources, enabling targeted mitigation strategies [
6]. Furthermore, the solid waste produced is also key to analyse the company’s current state, identifying areas for improvement. With these insights, companies can implement measures to minimise waste, promote material reuse, and adopt more effective recycling practices. Research has shown that reuse and recycling could significantly reduce the environmental impact [
7].
This project, therefore, seeks to contribute to filling the existing gap by providing an innovative and adaptable tool that allows companies to measure, analyse, and optimise their environmental impact. By enabling a more accurate understanding of emissions and waste generation, the calculator serves as a crucial instrument for companies aiming to adopt more sustainable practices while maintaining competitiveness in the market.
2. Conceptual Background
The concept of a carbon footprint has been in use for several decades but was previously known as the life cycle impact category indicator of global warming potential. This approach integrates direct and indirect emissions, applying recognized international standards such as the Greenhouse Gas Protocol and verified conversion factors. Wiedmann and Minx defined the carbon footprint as a measure of the exclusive total amount of carbon dioxide emissions that is directly and indirectly caused by an activity or is accumulated over the life stages of a product [
8]. However, new studies and methods for carbon footprint calculation suggest including other GHG as well, such as methane (CH
4) and nitrous oxide (N
2O), ensuring a comprehensive and precise assessment [
9,
10]. With this in mind, it was decided to include these three types of GHG in the analysis. As climate change issues gained prominence on political and corporate agendas, companies began to recognize their responsibility to act against global warming [
11].
Building upon the discussion of GHG emissions and their impact on climate change, it is essential to explore the role of renewable energy in mitigating these effects, which exhibits significantly lower GHG emissions over their entire lifecycles compared to fossil fuel-based systems. This is well-documented in the IPCC Fifth Assessment Report (2014), which evaluates the scientific, technological, environmental, economic, and social aspects of climate change mitigation [
12].
A meta-analysis by Nugent and Sovacool critically examined 153 lifecycle studies on wind and solar photovoltaic (PV) electricity generation technologies. The study found that wind energy emits between 0.4 and 364.8 g of CO
2 equivalent per kilowatt-hour (g CO
2e/kWh), with a mean of 34.11 g CO
2e/kWh, while solar PV emits between 1 and 135 g CO
2e/kWh, with a mean of 47.3 g CO
2e/kWh. These findings demonstrate that renewable energy sources are far less carbon-intensive throughout their lifecycles compared to fossil fuel-based systems [
13].
This comparison highlights the substantial increase in carbon footprint associated with reliance on non-renewable energy sources. Upstream emissions, including extraction, processing, and combustion of fossil fuels, contribute significantly to overall emissions. Lifecycle studies indicate that coal power emits approximately 820 gCO
2e/kWh, compared to 41 gCO
2e/kWh for solar photovoltaic systems. These disparities underscore the need for industries to integrate renewable energy sources into their operations to minimize environmental impact. The National Renewable Energy Laboratory (NREL) further supports this perspective, noting that total lifecycle GHG emissions from solar PV systems are substantially lower than those from coal-fired power plants, with values ranging from 10 to 36 g CO
2e/kWh compared to 820 g CO
2e/kWh for coal [
14].
Beyond energy considerations, optimizing logistics plays a crucial role in reducing the environmental impact of industrial operations. Studies emphasize the importance of selecting energy-efficient transport routes and modes to minimize emissions [
15]. By leveraging real-time data and advanced route planning systems, companies can reduce fuel consumption, avoid congestion, and shorten delivery distances. These strategies not only lower emissions but also enhance operational efficiency and cost-effectiveness.
A comparative analysis of transportation methods reveals that rail transport offers significant advantages in reducing CO2 emissions, particularly for long distances and heavy cargo loads. Rail transport is inherently more energy-efficient due to reduced fuel consumption per tonne-kilometre and its ability to move substantial cargo volumes with minimal environmental impact. Consequently, experts advocate for a strategic shift towards rail-based logistics, particularly for transporting materials with high environmental costs, such as those used in the textile industry. The recommendation to maximize rail transport aligns with broader sustainability objectives by significantly reducing transport-related emissions.
For shorter distances, transitioning to low- or zero-emission vehicles, such as electric trucks, presents a viable alternative. Research highlights the importance of assessing the potential of electric vehicles and their supporting infrastructure, exploring sustainable biofuels and hydrogen as alternatives to fossil fuels, and evaluating how urban design can contribute to reducing transport emissions [
16]. While challenges such as infrastructure costs persist, integrating these approaches into logistics systems can substantially reduce the carbon footprint and align companies with broader environmental goals.
Complementing energy and logistics strategies, effective waste management presents another opportunity for reducing the environmental impact of the textile industry. The reuse of solid waste from textile production is a promising solution, as integrating recycled materials into the manufacturing processes significantly reduces GHG emissions by decreasing the need for energy-intensive raw material production. This shift supports the transition to a circular economy, addressing the growing concerns associated with textile waste. Beyond environmental benefits, reusing materials also provides economic advantages, such as cost savings on raw inputs and opportunities to create value-added products from waste. This approach addresses a pressing global issue: the limited capacity of the existing waste disposal infrastructure [
17].
Additionally, anaerobic digestion emerges as an effective method for managing organic waste, particularly in environments where land availability and environmental constraints present challenges. Unlike aerobic digestion, anaerobic digestion operates without oxygen, making it more space-efficient and adaptable to industrial applications. This process not only minimizes the physical footprint of waste management systems but also delivers substantial environmental benefits by capturing methane emissions—one of the most potent greenhouse gases—and converting them into biogas. This renewable energy source can serve as a cleaner alternative to fossil fuels, directly contributing to energy transition goals. Additionally, the by-products of anaerobic digestion, such as nutrient-rich digestate, can be utilized in agriculture, creating further value from waste and supporting sustainable farming practices [
18].
The integration of renewable energy sources, sustainable logistics, and efficient waste management practices presents a comprehensive strategy for reducing the carbon footprint of the textile industry. These measures complement the efforts outlined in the initial discussion on GHG emissions quantification and mitigation. The development of a carbon footprint calculator tailored to the textile industry, as proposed in the initial study, will further enhance these efforts by providing accurate data to drive continuous improvement and environmental responsibility.
3. Materials and Methods
This chapter discusses the case study methodology used to develop this research. The case study methodology was selected because it allows for an in-depth exploration of complex phenomena within specific contexts [
19]. As the literature related to the calculation of GHG emissions in the textile industry is scarce, developing an exploratory case study allows for gaining new insights and understanding its context [
20].
The company selected for this study operates in the technical textile sector, supplying specialised fabrics for the automotive industry, such as reinforcement textiles for tyres and knitted fabrics used in synthetic leather applications. Its operations combine traditional textile expertise with the high-performance, traceability, and sustainability demands of the automotive sector. These characteristics position the company as a good representative of the wider technical textile industry, particularly in the context of decarbonisation challenges, making it a relevant case for this type of analysis.
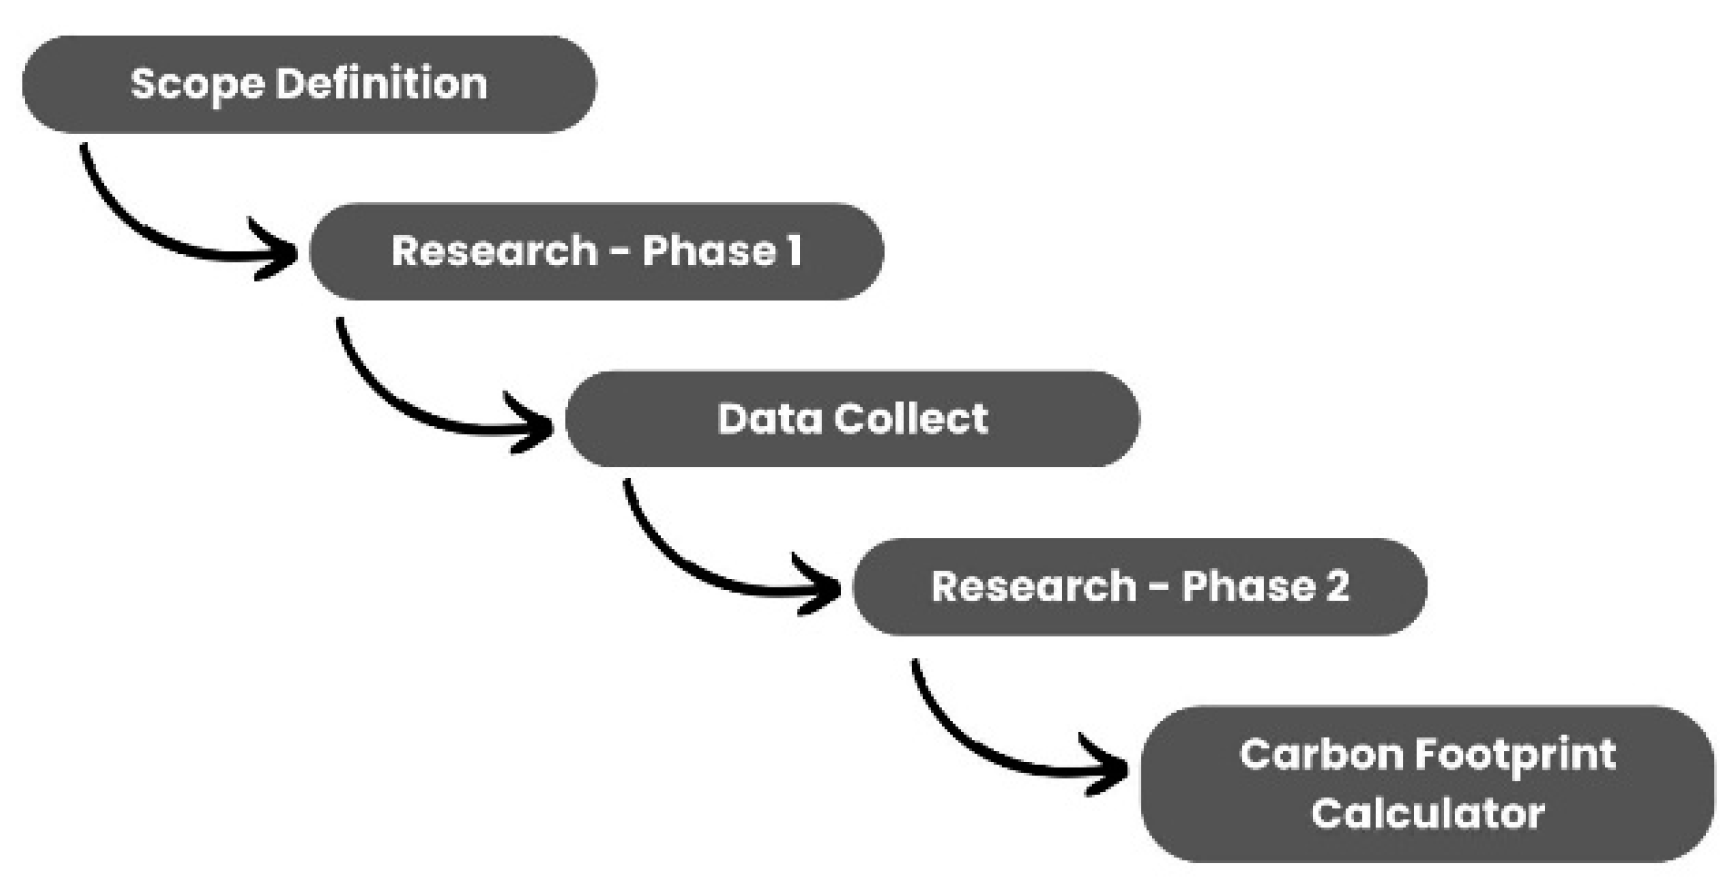
During the case study, by adapting the recommendations found in the literature [
20], a set of conceptual principles and calculation methods were selected. This was followed by a phase of data collection from the company. Subsequently, additional steps were taken to refine the process, leading to the development of the final version of a carbon footprint calculator. This process is illustrated by
Figure 1.
Firstly, the scope of the research was defined. Based on it, the variables were determined, along with any relevant information the company needed to provide. Next, based on the information provided, emissions were calculated using conversion factors. Lastly, using Excel, the data were analysed in a more visual and structured way to facilitate interpretation and future scalability.
3.1. Scope Definition
Defining the scope is the first step in calculating the carbon footprint. Based on BCSD Portugal Protocolo de Gases com Efeito de Estufa [
21], these frameworks defined which emissions must be considered to ensure an accurate carbon footprint assessment.
It was concluded that Scope 1 concerns direct emissions resulting from activities carried out in the company, namely stationary combustion (e.g., boilers and furnaces), the manufacture or processing of materials, the escape of emissions, and the transport of materials, products, waste, and employees. Scope 2 is related to indirect emissions from purchased electricity, which is then used in the company’s operations and equipment. Finally, Scope 3 can be associated with various activities, for example, the extraction and production of purchased materials and fuels, and activities related to the transport and treatment of solid waste [
22]. All Global Warming Potential (GWP) values considered in this study are based on 2024 emission factors from the UK Government, which are primarily derived from the National Atmospheric Emissions Inventory (NAEI), which is compiled in accordance with the 2006 Guidelines of the Intergovernmental Panel on Climate Change (IPCC).
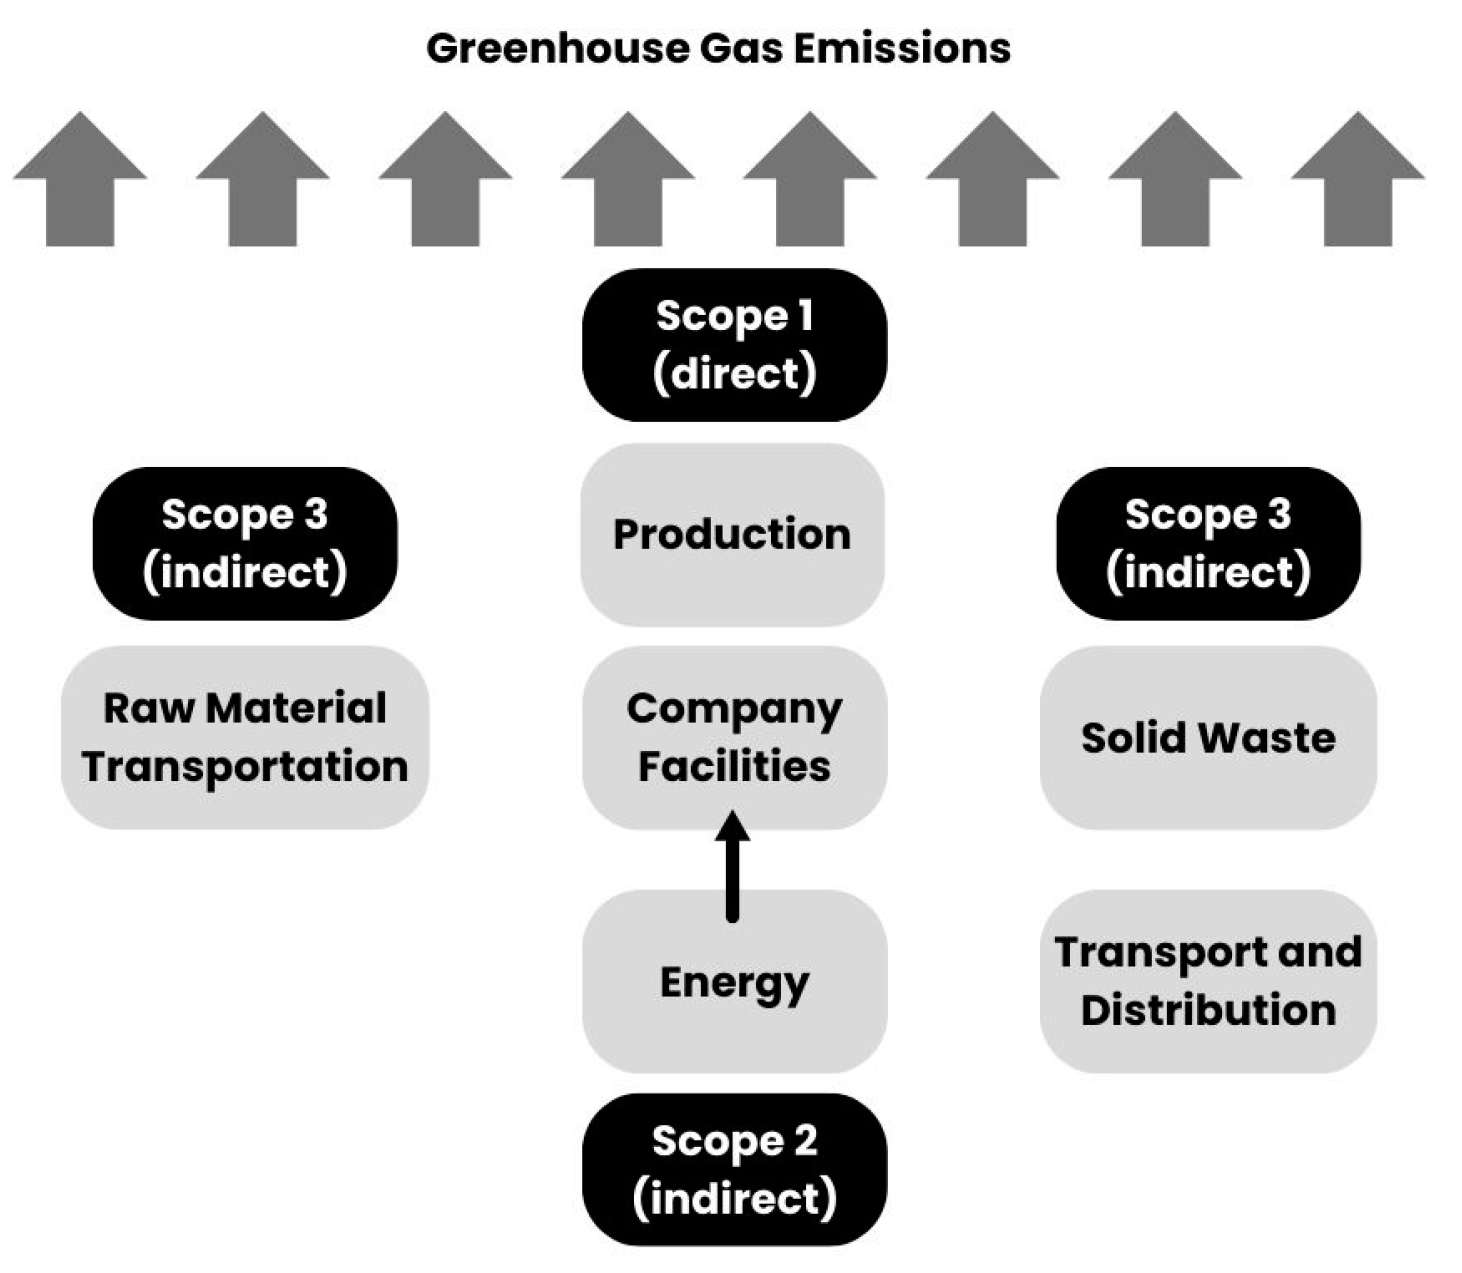
Figure 2 illustrates the definition of the GHG scope for the calculations in this case study. Scope 1 covers the production and the company facilities, such as the electric and combustion machines and the company building. Although Scope 1 generally includes emissions related to the transport of raw materials and finished products when these are directly managed or owned by the company, in this case such activities are classified under Scope 3. This decision is because the company neither owns the transport fleet nor has direct operational control over these logistics processes, since they are subcontracted to third-party companies. According to [
21], emissions from subcontracted transport services are typically accounted for under Scope 3 and not Scope 1. Scope 2 corresponds to the electricity purchased to supply the company, while Scope 3, as mentioned, includes the transport of raw materials and finished products and the treatment of solid waste. The value of private vehicles at the company’s expense will not be deemed, as there are only two electric ones, therefore they don’t have a significant impact on the results of the carbon footprint calculation.
3.2. Research: Phase 1
Thorough research was conducted to gain a clear understanding of the topic before requesting information from the company under study. Although carbon footprint is a very familiar topic, it is not often explored in depth. Therefore, a general analysis was made of what a company’s carbon footprint actually is and the methods used to calculate it. During the research, it was found that the analysis of the results could include more than one type of GHG, and not just carbon dioxide, which is more common. Thus, when only CO
2 is included, the unit is kg CO
2. However, if other GHG are included the unit is kg CO
2e, expressing the mass of CO
2-equivalents. The six greenhouse gases identified by the Kyoto Protocol are included in the analysis: carbon dioxide (CO
2), methane (CH
4), nitrous oxide (N
2O), hydrofluorocarbons (HFC), perfluorocarbons (PFC), and sulphur hexafluoride (SF
6) [
2]. Therefore, it was necessary to find a way to calculate the total tonnes of CO
2 (tCO
2) emissions associated with purchased electricity, electrical machinery, and electronic equipment. In addition, the Excel supplied made it possible to obtain the formulas for calculating the total CO
2 and CO
2e emissions from stationary combustion and mobile combustion. It was also possible to consult the emission factors used for the different GHGs, as well as the annual electricity emission factors for the years 2010 to 2021. It was also important to look for information on calculating the carbon footprint of solid waste, such as cardboard, plastics, and chemicals used in the textile industry, as this is an essential factor for the objective of this work. This would make it possible to identify the company’s emissions in relation to this type of waste, allowing for the identification of waste, which would be a fundamental step in starting to address the problem, since waste management is a key challenge in the fight against energy consumption and greenhouse gas emissions [
23].
3.3. Data Collection
The systematic and detailed collection of data to calculate the carbon footprint plays a key role in understanding and mitigating the impact of human activities on climate change. According to the Intergovernmental Panel on Climate Change (IPCC), reducing greenhouse gas (GHG) emissions is key to limiting global warming to sustainable levels. That said, a clear understanding of the sources of emissions is necessary, allowing to contribute to slowing down a global warming of 1.5 °C for the environment, which would lead to serious consequences [
24].
In addition, environmental regulations and international standards, such as the Greenhouse Gas Protocol, underline the importance of collecting accurate data, as the principles are intended to underpin all aspects of GHG accounting and reporting. Their application will ensure that the GHG inventory constitutes a true and fair representation of the company’s GHG emissions [
22]. In this way, reliable and transparent measurements are key to setting meaningful emission reduction targets and effectively monitoring progress.
This collection involved specific variables that allowed for a precise and comprehensive analysis of the different sources of CO2 emissions, with a focus on operations carried out throughout 2023. The data used in this study were only provided by the company. Although an independent external audit was not carried out, meetings were held with representatives of the company in order to help clarify uncertainties and validate the figures reported.
To obtain these variables, a meeting with the company was essential for the process. This allowed for the clear and objective exchange of information, as well as the resolution of many existing questions. Initially, the company was asked to provide data on electricity purchases in megawatt hours (MWh). The data were collected monthly, enabling the quantification of electricity consumption. During the meeting, it was clarified that the electricity came from renewable sources and that the company holds renewable energy certificates, ensuring the verification of this information and confirming the renewable origin of the electricity used.
Next, as for the electrical machines, it was necessary to identify the source of the energy used, their power in kilowatts (kW), the number of hours in operation per year, and the section where they were allocated. These data are essential for calculating the amount of energy consumed by each machine and, consequently, the emissions associated with each section of production.
For stationary combustion, it was essential to define the type of fuel used, which turned out to be natural gas. For each combustion source, the name of the source, the power, the number of annual operating hours and the section where the combustion took place were identified. Additionally, to incorporate the transportation of raw materials and final products into the carbon footprint calculation, the types of vehicles used by the company were identified, being only truck and boat, the distances travelled, and the number of trips made throughout the year. The load capacity of the vehicles was also relevant in determining the intensity of emissions per unit of load transported. With the data on the quantities of material transported per trip and per country, it becomes possible to calculate the company’s specific carbon footprint rather than that of the entire truck or boat. Regarding mobile combustion, emissions from vehicles used by company members could also be considered. However, the company owns only two vehicles, both of which are electric, resulting in a negligible impact on the overall carbon footprint calculation.
Finally, for solid waste, the total quantities of waste in kilograms (kg) produced by the company were named.
3.4. Research: Phase 2
As a result, it was necessary to develop a new calculator in order to estimate the carbon footprint specifically for this company. Consequently, the calculator was expanded to include new sections, such as solid waste, and updated methodologies were introduced to evaluate additional greenhouse gases, including methane (CH
4) and nitrous oxide (N
2O), enabling a more comprehensive assessment of emissions. To ensure accuracy, recognised emission factors from the UK Government were employed, specifically for mobile combustion, stationary combustion, and solid waste [
25].
It is worth noting that the data utilised for this study predominantly correspond to 2023. However, the figures for converting electricity consumption into CO
2 emissions are based on 2022 data specific to Portugal, as this was the most recent year for which such information was available. These data were sourced from [
26].
It is important to highlight that the UK government’s emission factors were chosen because of their detailed methodologies and reliable sources of information. Although priority was given to country-specific data for Portugal, in cases where this information was not available or lacked sufficient granularity, the UK factors were used as a reference, ensuring compatibility with the Portuguese context.
Regarding mobile combustion, it was considered that transport vehicles, such as trucks and boats, could operate with partial load capacity, potentially ranging between 25% and 50%. In certain export destinations, according to the information provided by the company, there were cases in which the volume of goods shipped was not enough to fully load a truck whenever it was necessary to take that route. In these cases, the company only filled half of the truck’s capacity or even less. Due to the lack of specific data on emissions in scenarios where the truck was used by the company at, for example, only 10% of its capacity, a default assumption of 25% was adopted, as this was the most reliable information available at the time of the investigation. With regard to transportation by boat, the existing emission factors relate to emissions per container, per km. Since the company always filled only one container, the only variable is the distance travelled. This approach ensures that the calculations reflect conditions as closely as possible to what happens in reality.
Certain variables were excluded from the final calculations due to insufficient company data. These include the energy consumed by electronic devices used by employees and by the company’s refrigeration systems. These omissions were justified as their impact on the overall carbon footprint was considered negligible, representing a minimal fraction of the total emissions.
3.5. Carbon Footprint Calculator
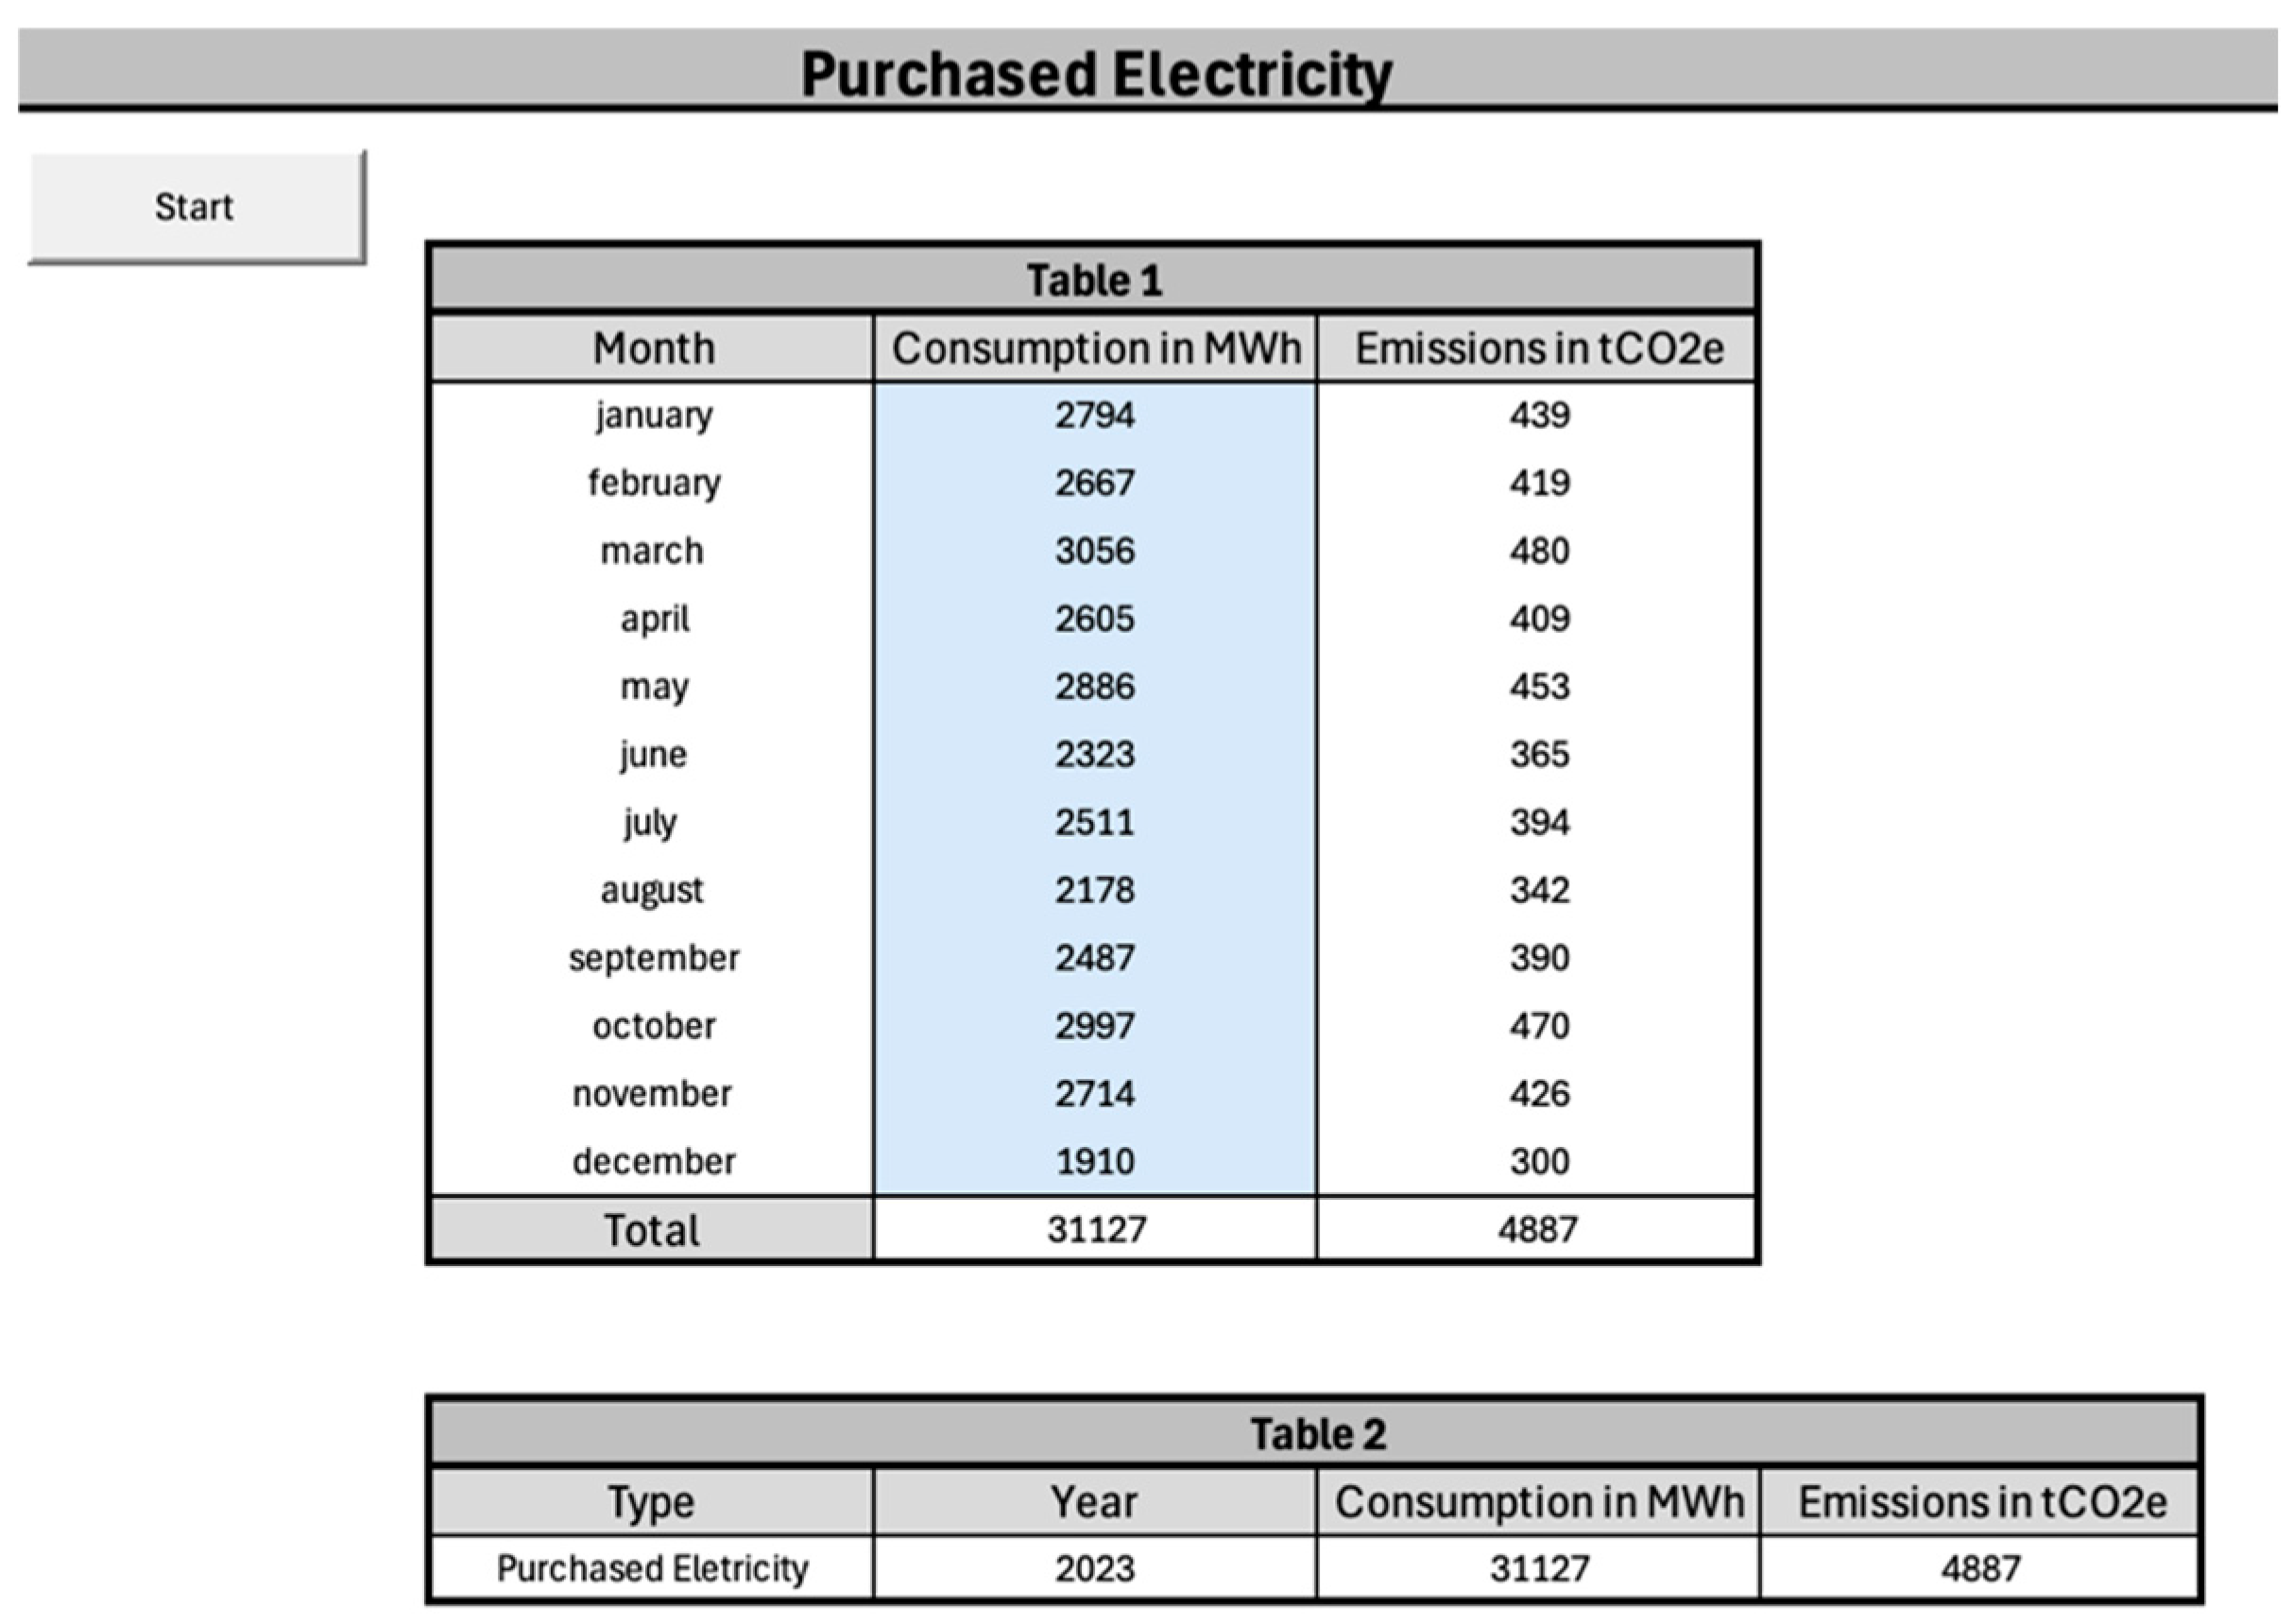
To begin developing the carbon footprint calculator several sheets were created, beginning with the “start” sheet, which gives an overview of the work and allows the users to switch to the desired sheet, namely, purchased electricity, electrical machines, stationary combustion, mobile combustion, solid waste, graphics, and information. In addition, instructions on operating the entire calculator have also been provided on this initial sheet. The first sheet, Purchased Electricity, as the name suggests, will calculate the CO
2e emissions from the quantity of electricity purchased. In the first table of
Figure 3, the monthly energy consumption in MWh should be entered in the light orange column. These values will then be converted to show the CO
2e emissions in tonnes. The final consumption figures are shown in
Figure 3.
Within the electricity purchased, it is important to establish which machines consume the most energy. Thus, it will be possible, in the future, to think of alternatives for them, so that they perform the same load but emit less CO2.
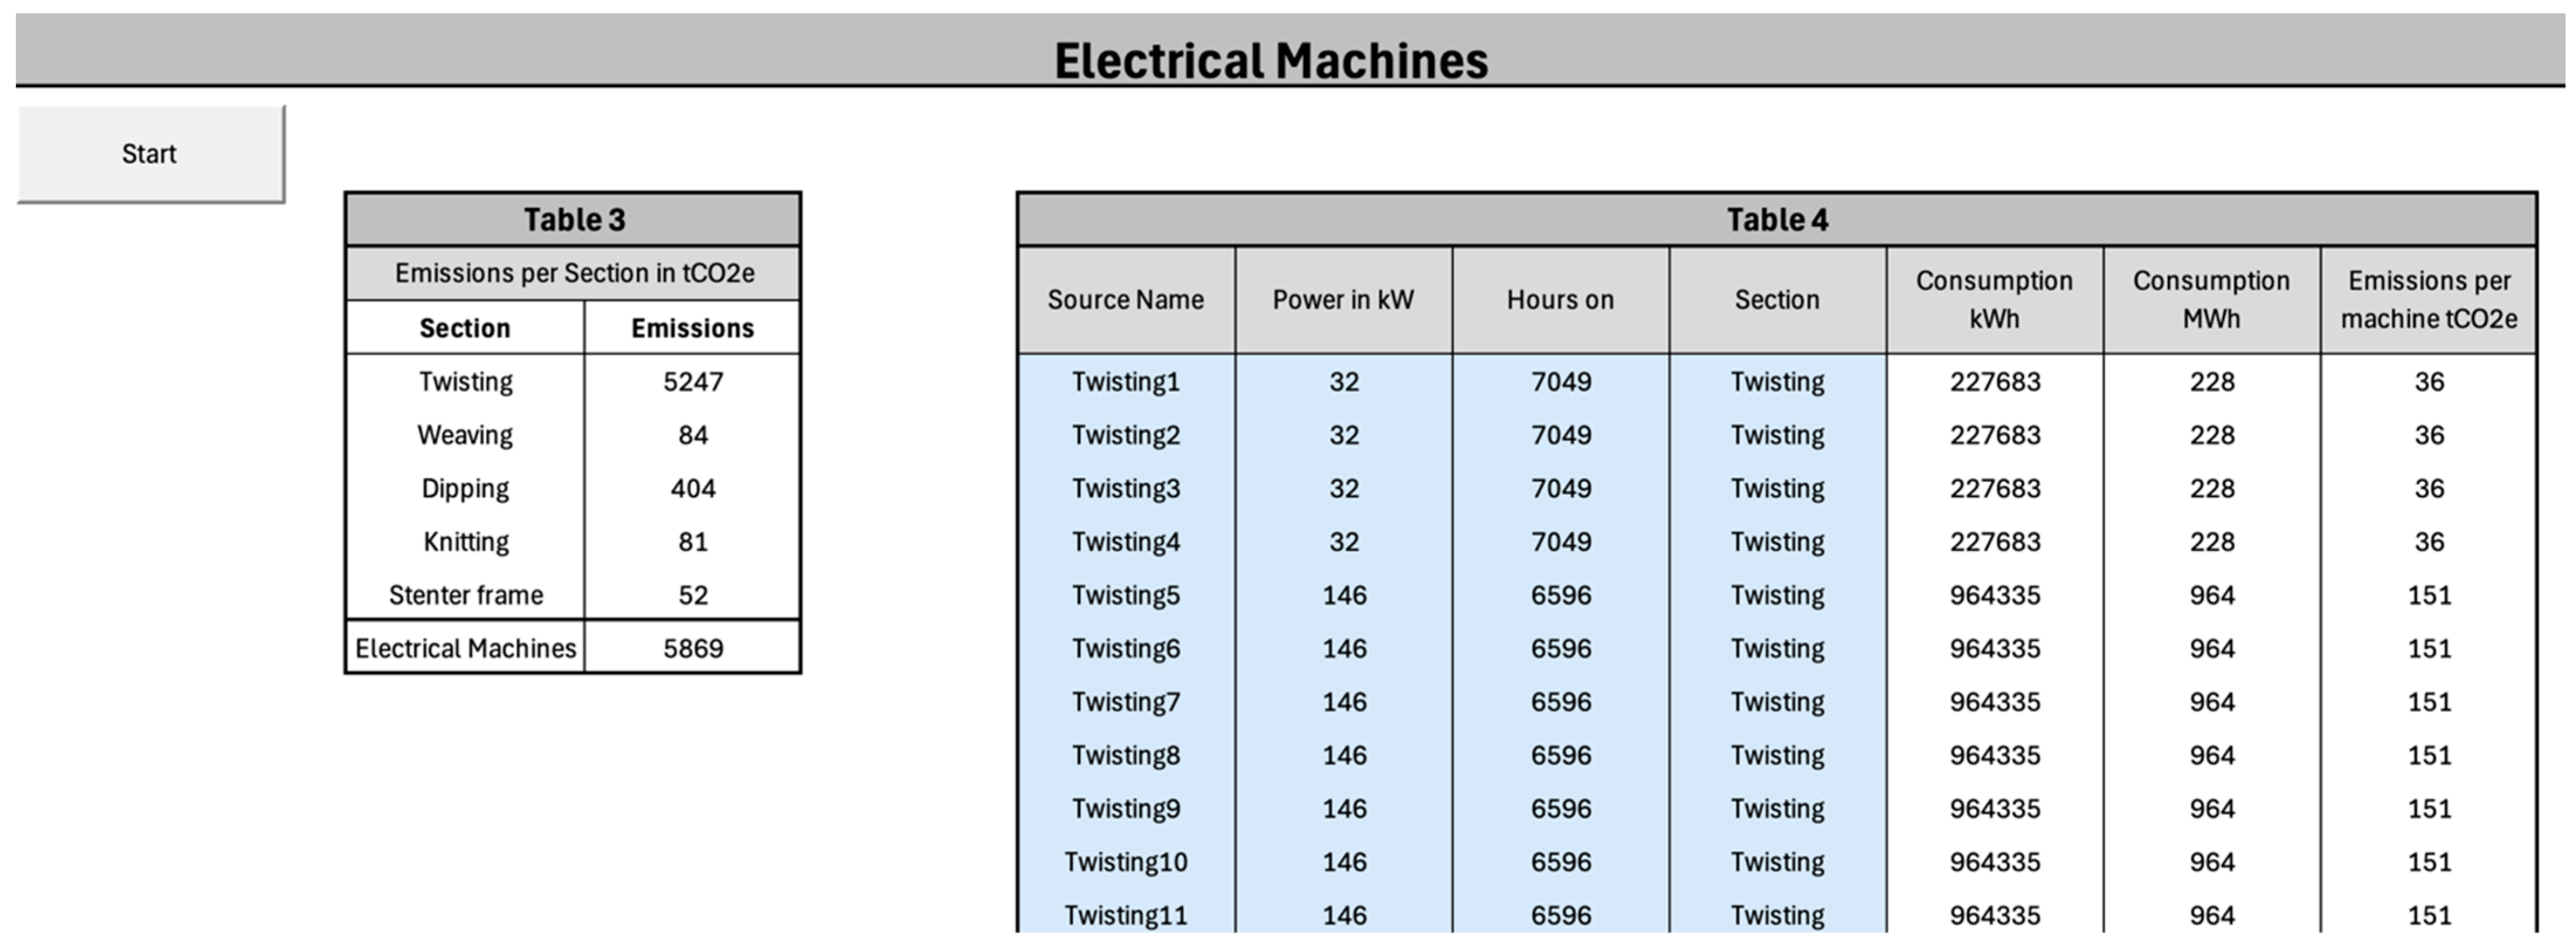
As a result, the second spreadsheet “Electrical Machines” was created, where Table 3 (
Figure 4) shows the tCO
2e emissions per section and the total for all the machines. To arrive at this outcome, it was necessary to build Table 4 (
Figure 4). To do this, data such as the name of the source, its power in kW, hours on, and the corresponding section must be entered in the light orange columns. These values are automatically converted into kWh and MWh consumption as well as into tCO
2e emissions per machine.
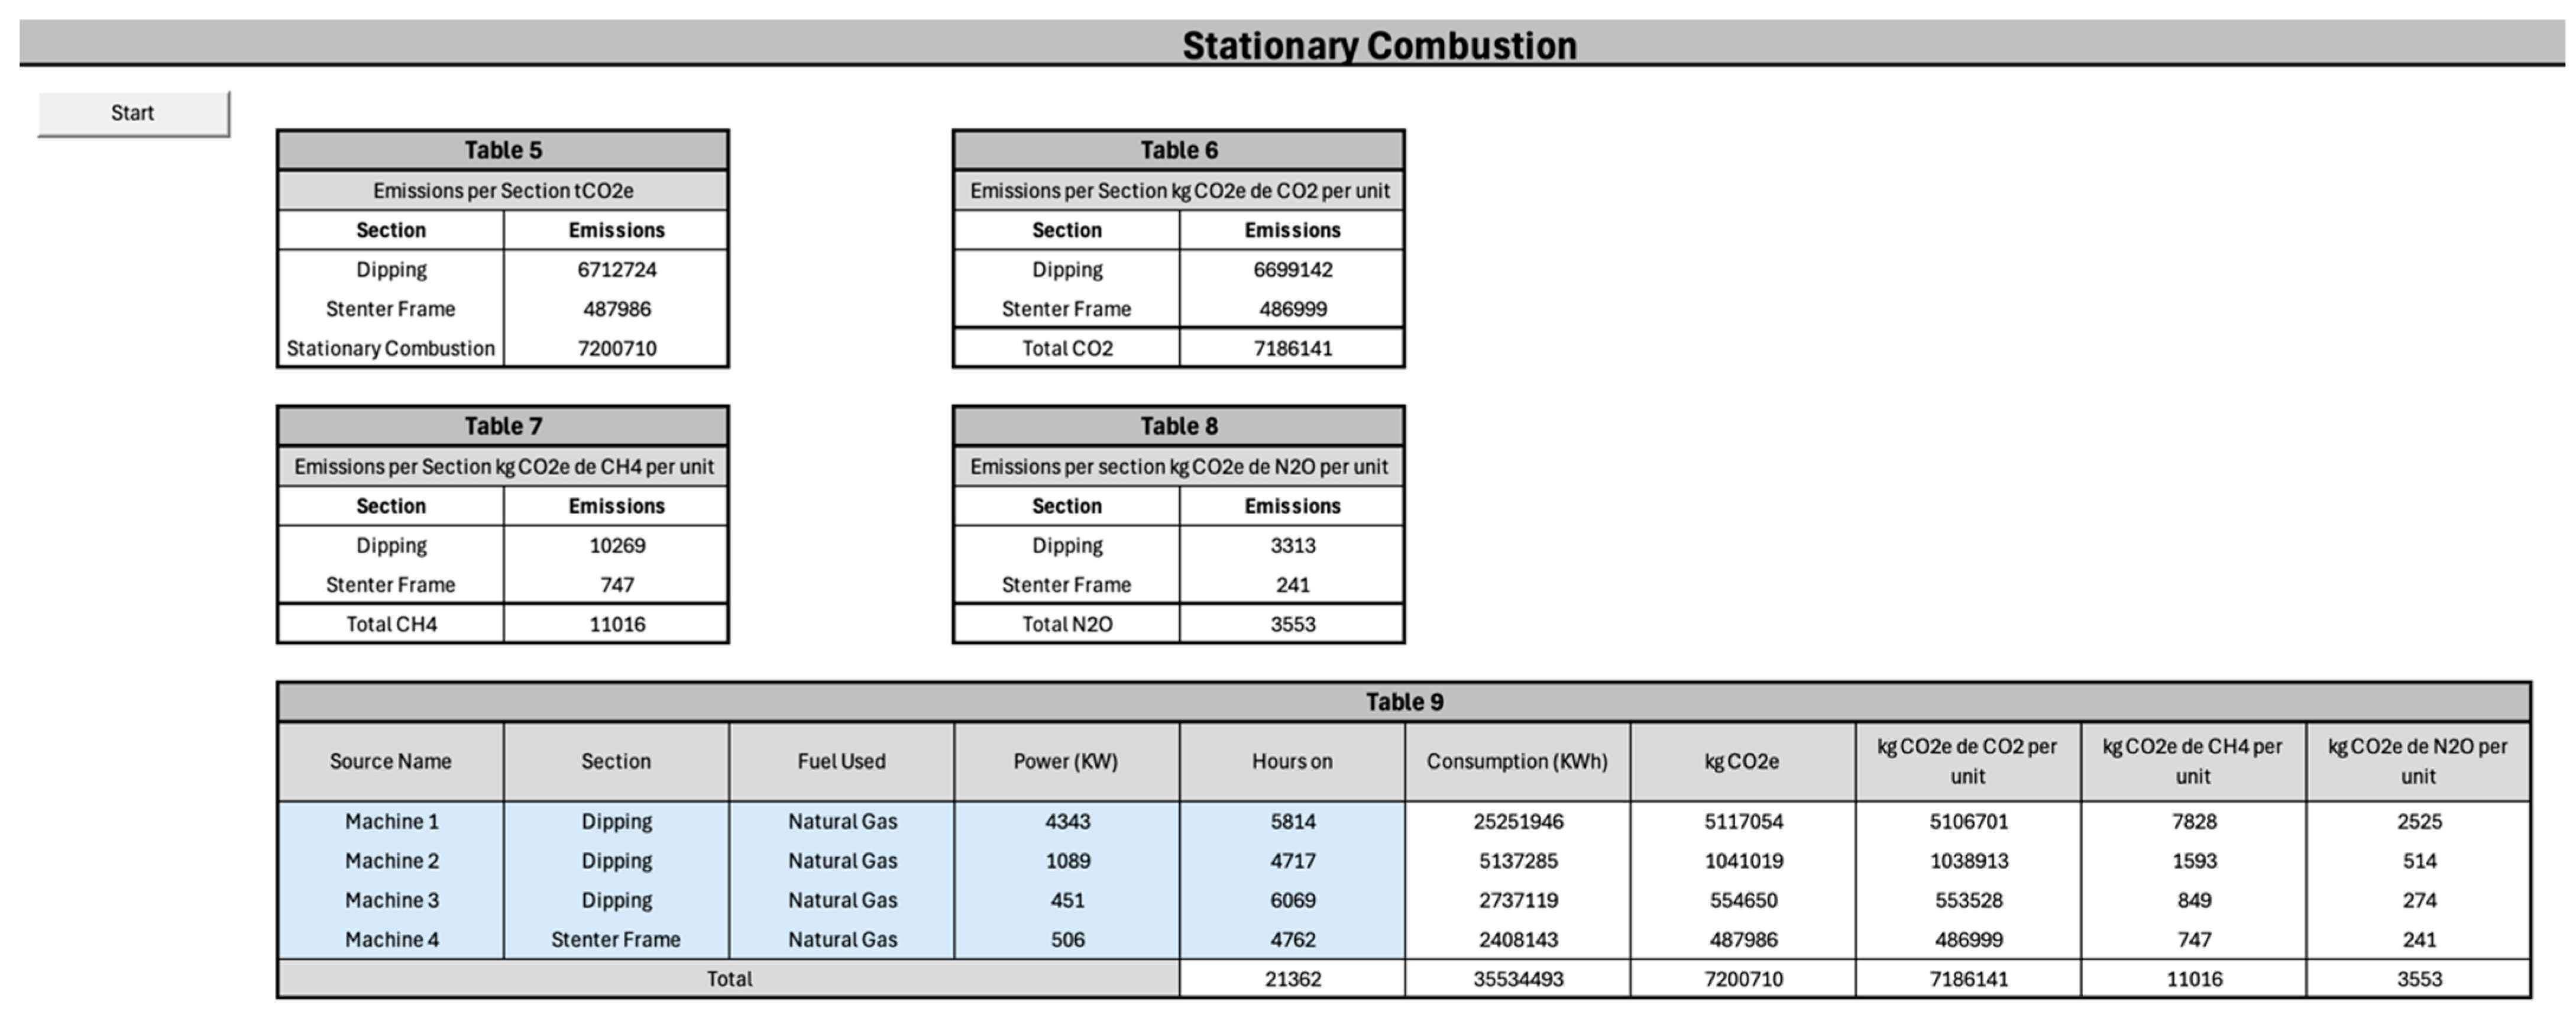
The “Stationary Combustion” sheet contains a table where the name of the source or machine, the section where it is located, and the type of fuel it uses, as well as the power in kW and hours on must be entered. This calculation table converts the data provided by the user into consumption per kWh, CO
2e emissions in kg, as well as its three different components, i.e., CO
2, CH
4, and N
2O. This results in CO
2e emissions by section, as well as CO
2, CH
4, and N
2O emissions (
Figure 5).
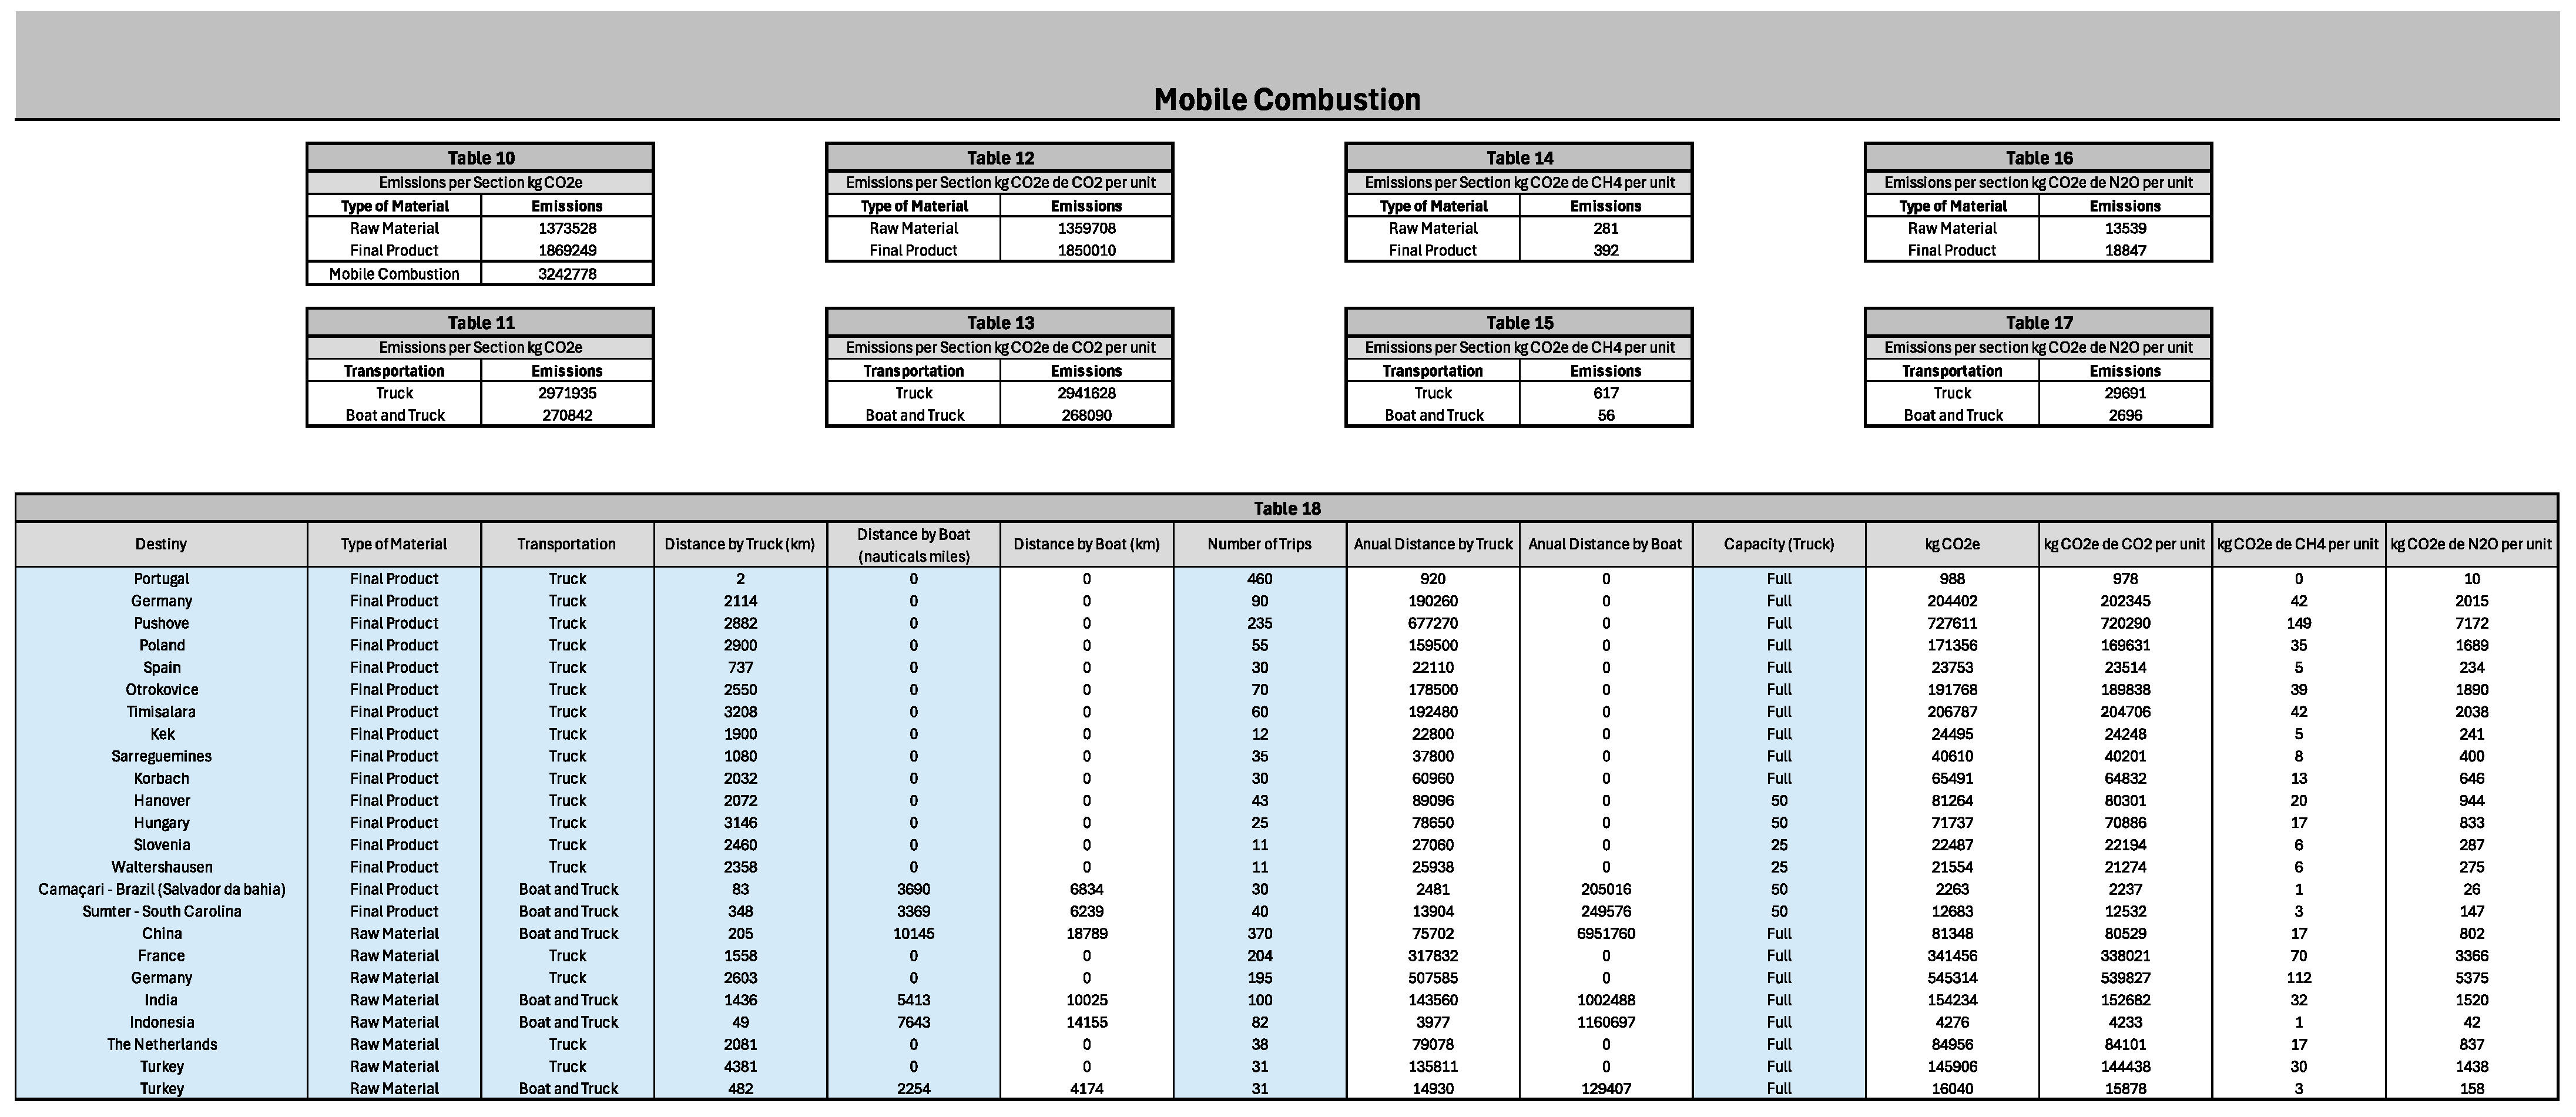
Regarding the mobile combustion sheet (
Figure 6), it provides information on the amount of CO
2 emitted in connection with the transportation of raw materials and finished products. The user only needs to enter information in the light blue cells, namely distance by truck, distance by boat, number of trips, capacity (truck), and other non-numerical information such as destiny, type of material, and transportation. With this information, the calculator will determine the amount of CO
2e, CO
2e of CO
2, CO
2e of CH
4, and CO
2e of N
2O in kilograms. In addition, the total values divided by type of material and transportation for each type of gas emitted are also presented.
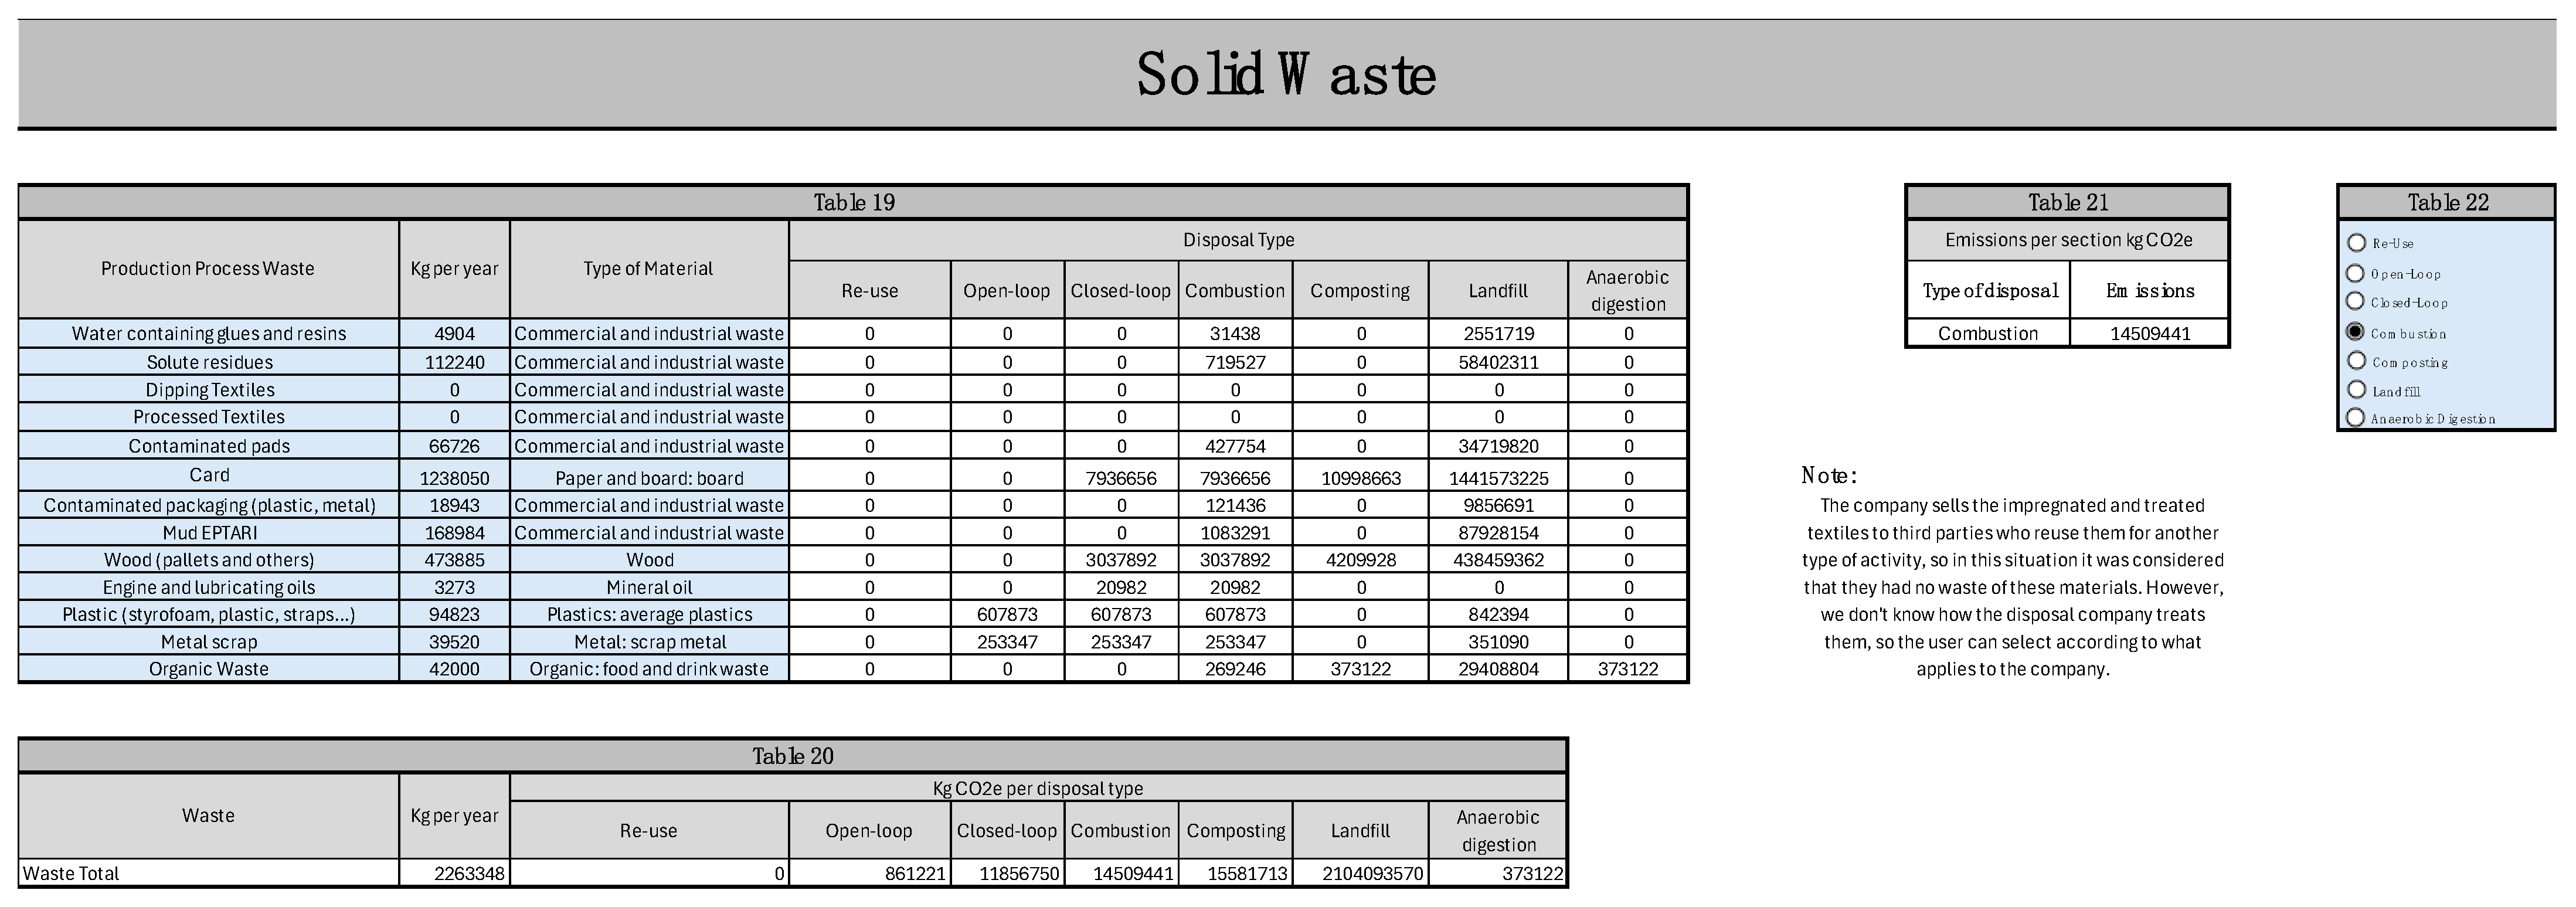
The next sheet contains the details of solid waste (
Figure 7). The user must enter a name for the production process waste, the quantity in kilograms produced per year and associate it with the type of material already available for the calculator to choose from. In addition, since there are various ways of treating solid waste, the user can also choose the form of treatment, and the calculator will show the total value in kilograms of CO
2e. This allows a quick comparison between the different ways of treating solid waste and shows their large discrepancies in terms of CO
2e emissions. However, it is important to note that although the calculator shows different treatment options, this decision is not made by the company, but by the waste treatment contractor. It is therefore up to them, in accordance with the laws and regulations imposed in Portugal, to carry out the waste treatment. Since it was not possible to contact them to obtain more information about waste treatment and the restrictions of this specific case, we have chosen to list the various possibilities.
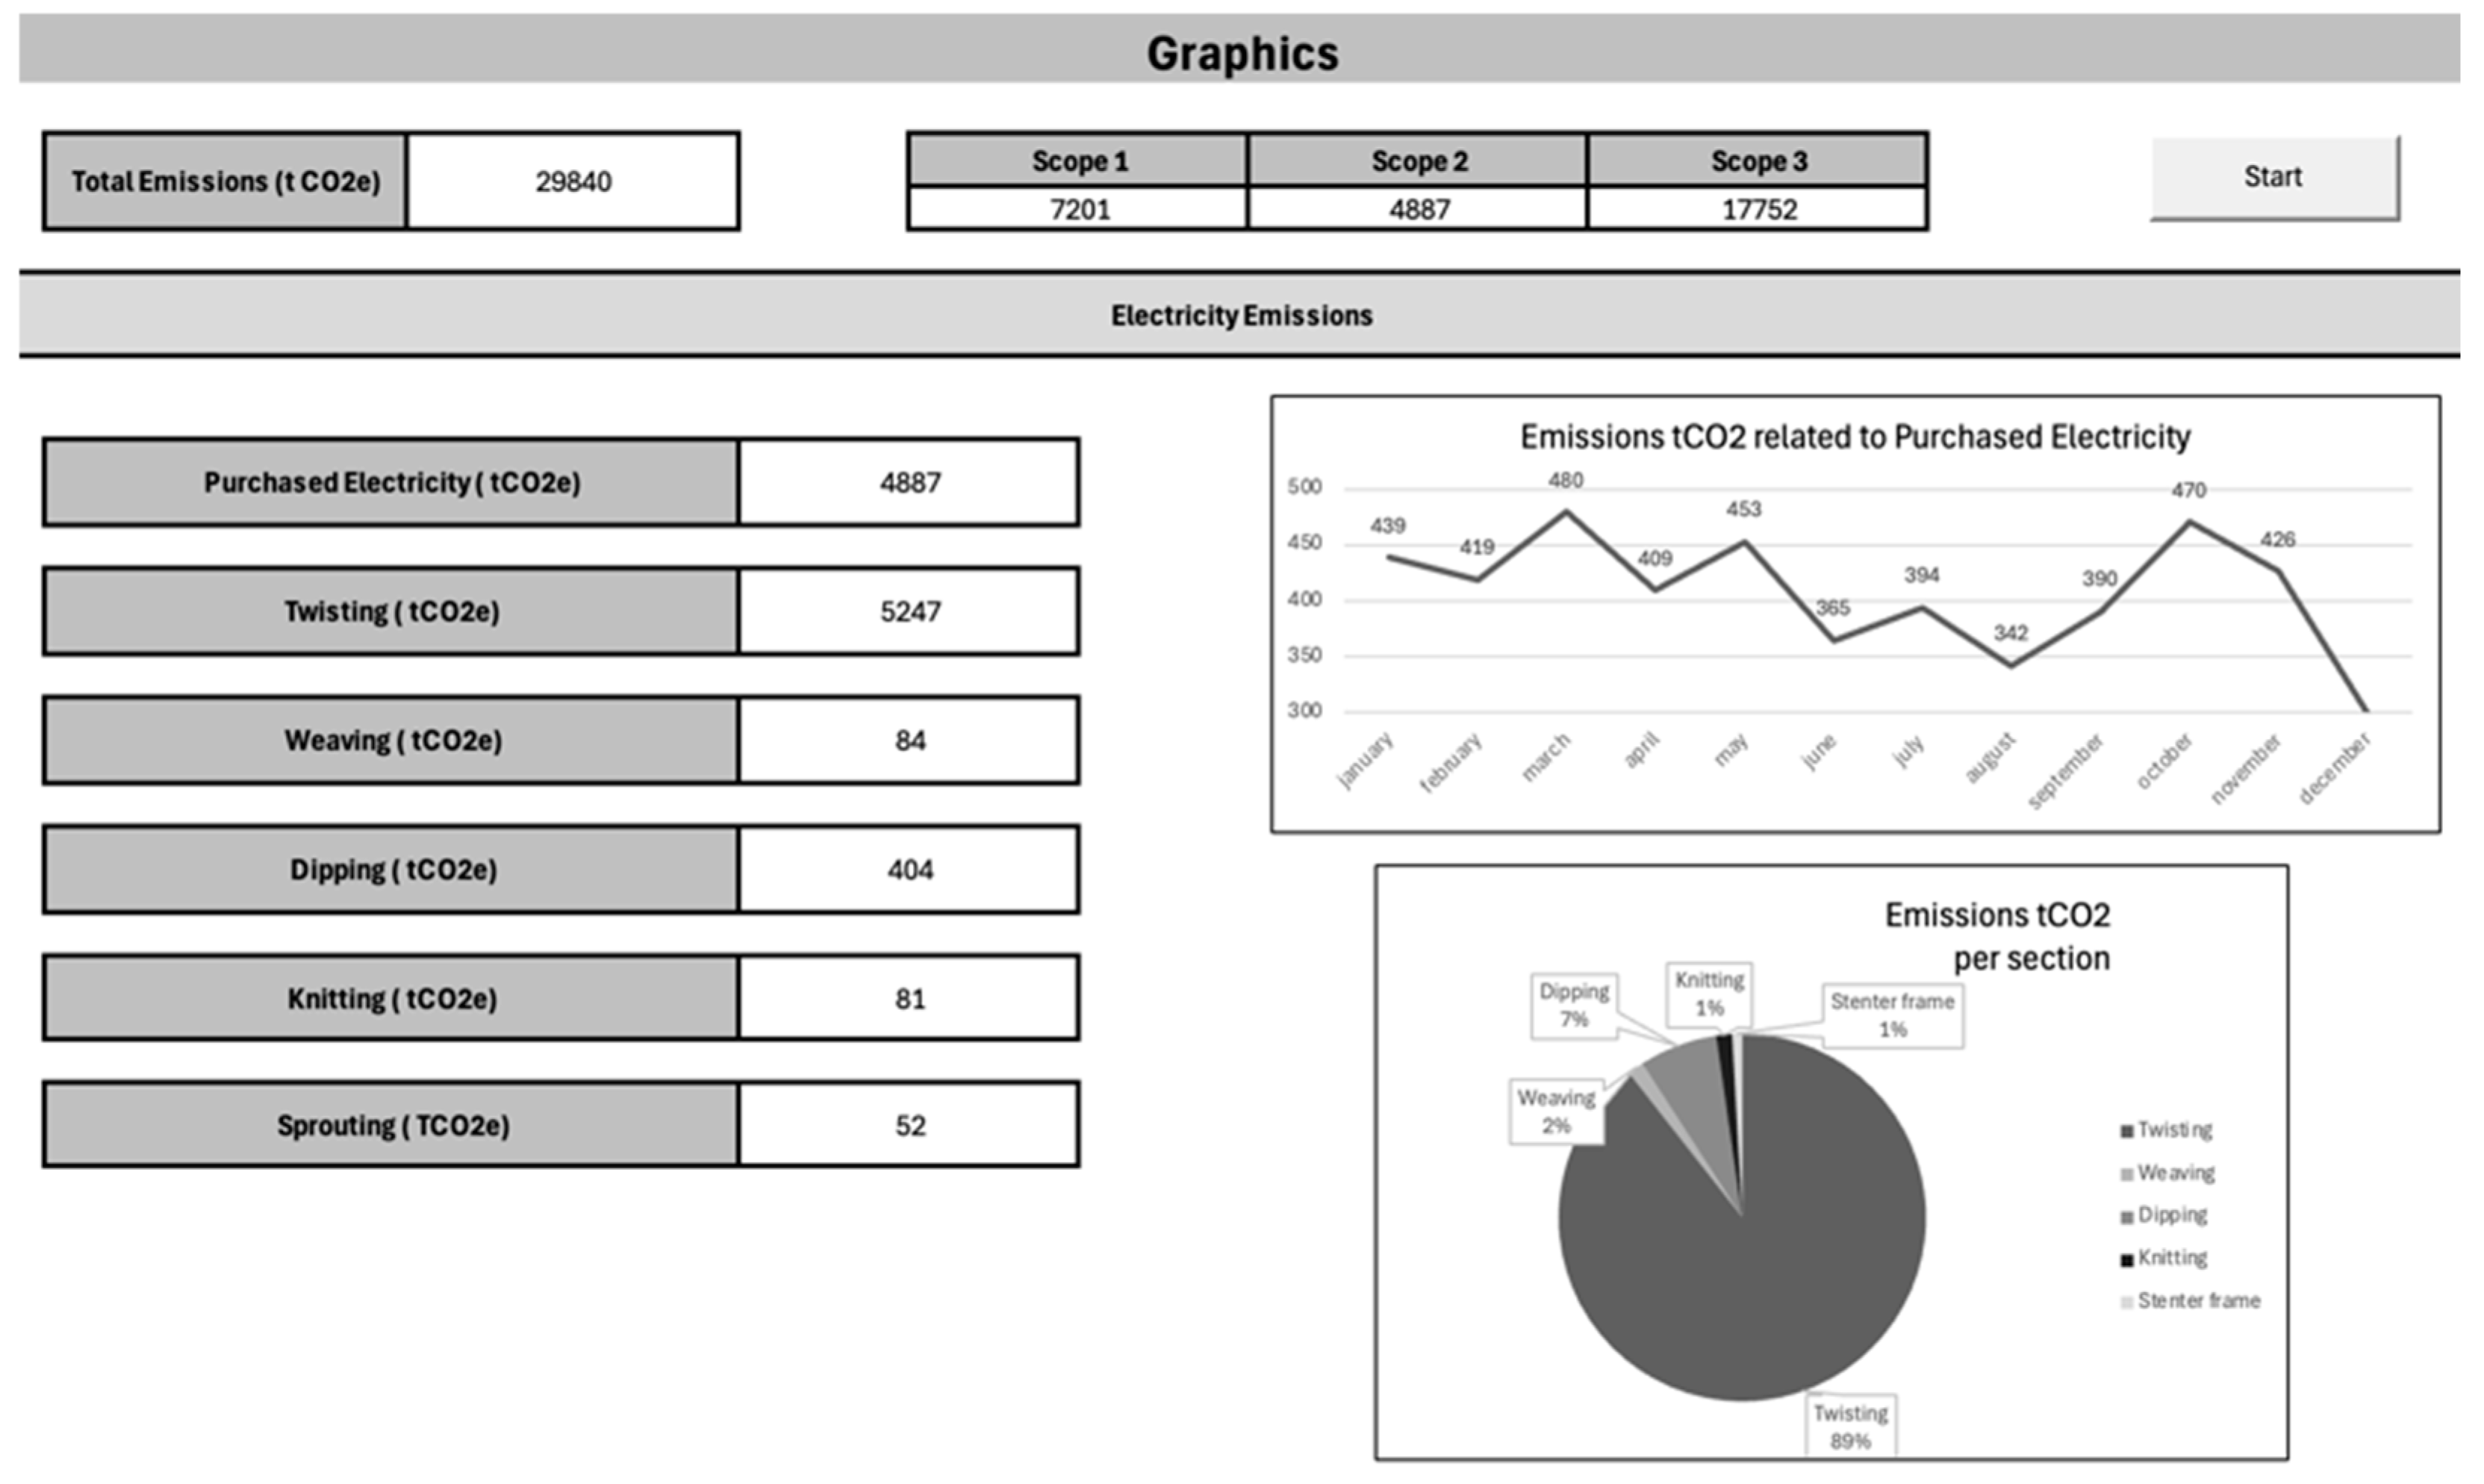
Furthermore, a sheet was created to display all the results obtained in the previous sheets, as well as auxiliary graphs to complement the studies carried out (
Figure 8). At the very beginning of the sheet, you can see the company’s total emissions and the total by scope. You can also find data on the company’s electricity, combustion, solid waste, and CO
2 emissions.
Finally, the sheet information contains all the values used to transform the information and data into CO2e emissions. Alongside each table is the reference from which the information was taken, so that if the values are out of date, it’s quick and easy to update them. There is also a table for conversions, which for now only shows values for converting nautical miles to km.
This calculator is easy to use and allows one to calculate a company’s carbon footprint with very little information. It should be noted that it differs from other calculators on the market in that it provides information on emissions of CO
2e of CO
2, CO
2e of CH
4, and CO
2e of N
2O and allows the calculation of different forms of waste treatment. From a cradle-to-gate perspective, wool yarn production using the worsted processing method exhibited the highest global warming potential, with emissions reaching 95.70 kg CO
2 equivalent per kilogram. This was closely followed by silk fabric, which accounted for 80.90 kg CO
2 equivalent per kilogram. When extending the assessment to a cradle-to-grave boundary, polyester textiles demonstrated the highest climate change impact, with a potential emission of 40.28 kg CO
2 equivalent per kilogram, according to [
27]. Comparing the values with the company’s emissions data shown in
Figure 8, the Twisting process has a high CO
2e emission value. This high impact may be related to excessive energy consumption, suggesting an opportunity for improvement.
4. Results
The calculator is intended to define the sources of your carbon footprint; for this reason it is essential to analyse it in detail to identify potential places for improvement with the aim of reducing the carbon footprint. Therefore, using the calculation tool explained above and the data provided, an exhaustive analysis of the carbon footprint associated with this study’s case company was carried out. The aim of this section is to evaluate the variables identified, focusing on the sources of emissions and their respective quantification.
It should be noted that, regarding solid waste, combustion was considered as the disposal method by the waste treatment company, as it was impossible to establish contact with them. On the other hand, since the company under study guarantees the purchase of electricity from renewable sources, the associated emissions were excluded from the total calculation, since renewable energies have almost zero emissions [
28].
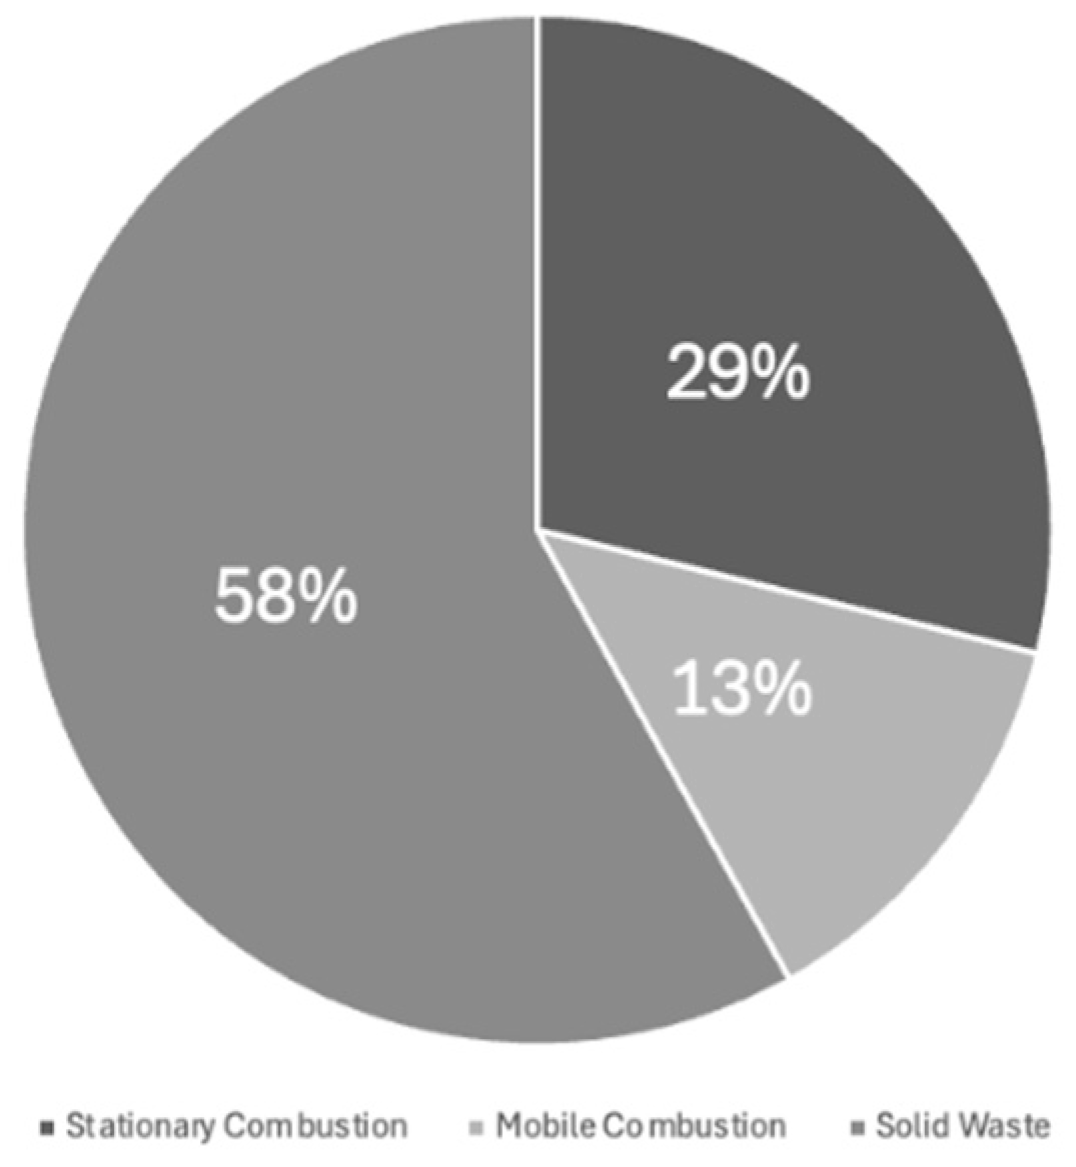
Thus, the company’s emissions total approximately 18 thousand tonnes of CO
2e, which result from the sum of combustion emissions, stationary and mobile, and solid waste.
Figure 9 illustrates the contribution of various sources to the company’s emissions, highlighting stationary combustion, which accounts for 58% of the total emissions.
However, to raise awareness in companies to the need to reduce their carbon footprint and solid waste production, the following emissions analysis considered electricity purchased from non-renewable sources to assess its impact on the carbon footprint.
A scenario was therefore created assuming electricity from non-renewable sources, which led to a total of approximately 23 thousand tonnes of CO2e. This represents a significant difference of 5 thousand tonnes of CO2e, which is considered a substantial impact. This calculation does not consider the energy used by the electrical machines, as this is included in the electricity purchased. The subsequent analysis will concentrate on a detailed evaluation of the contributions from various sources in a scenario that excludes the use of renewable energy sources.
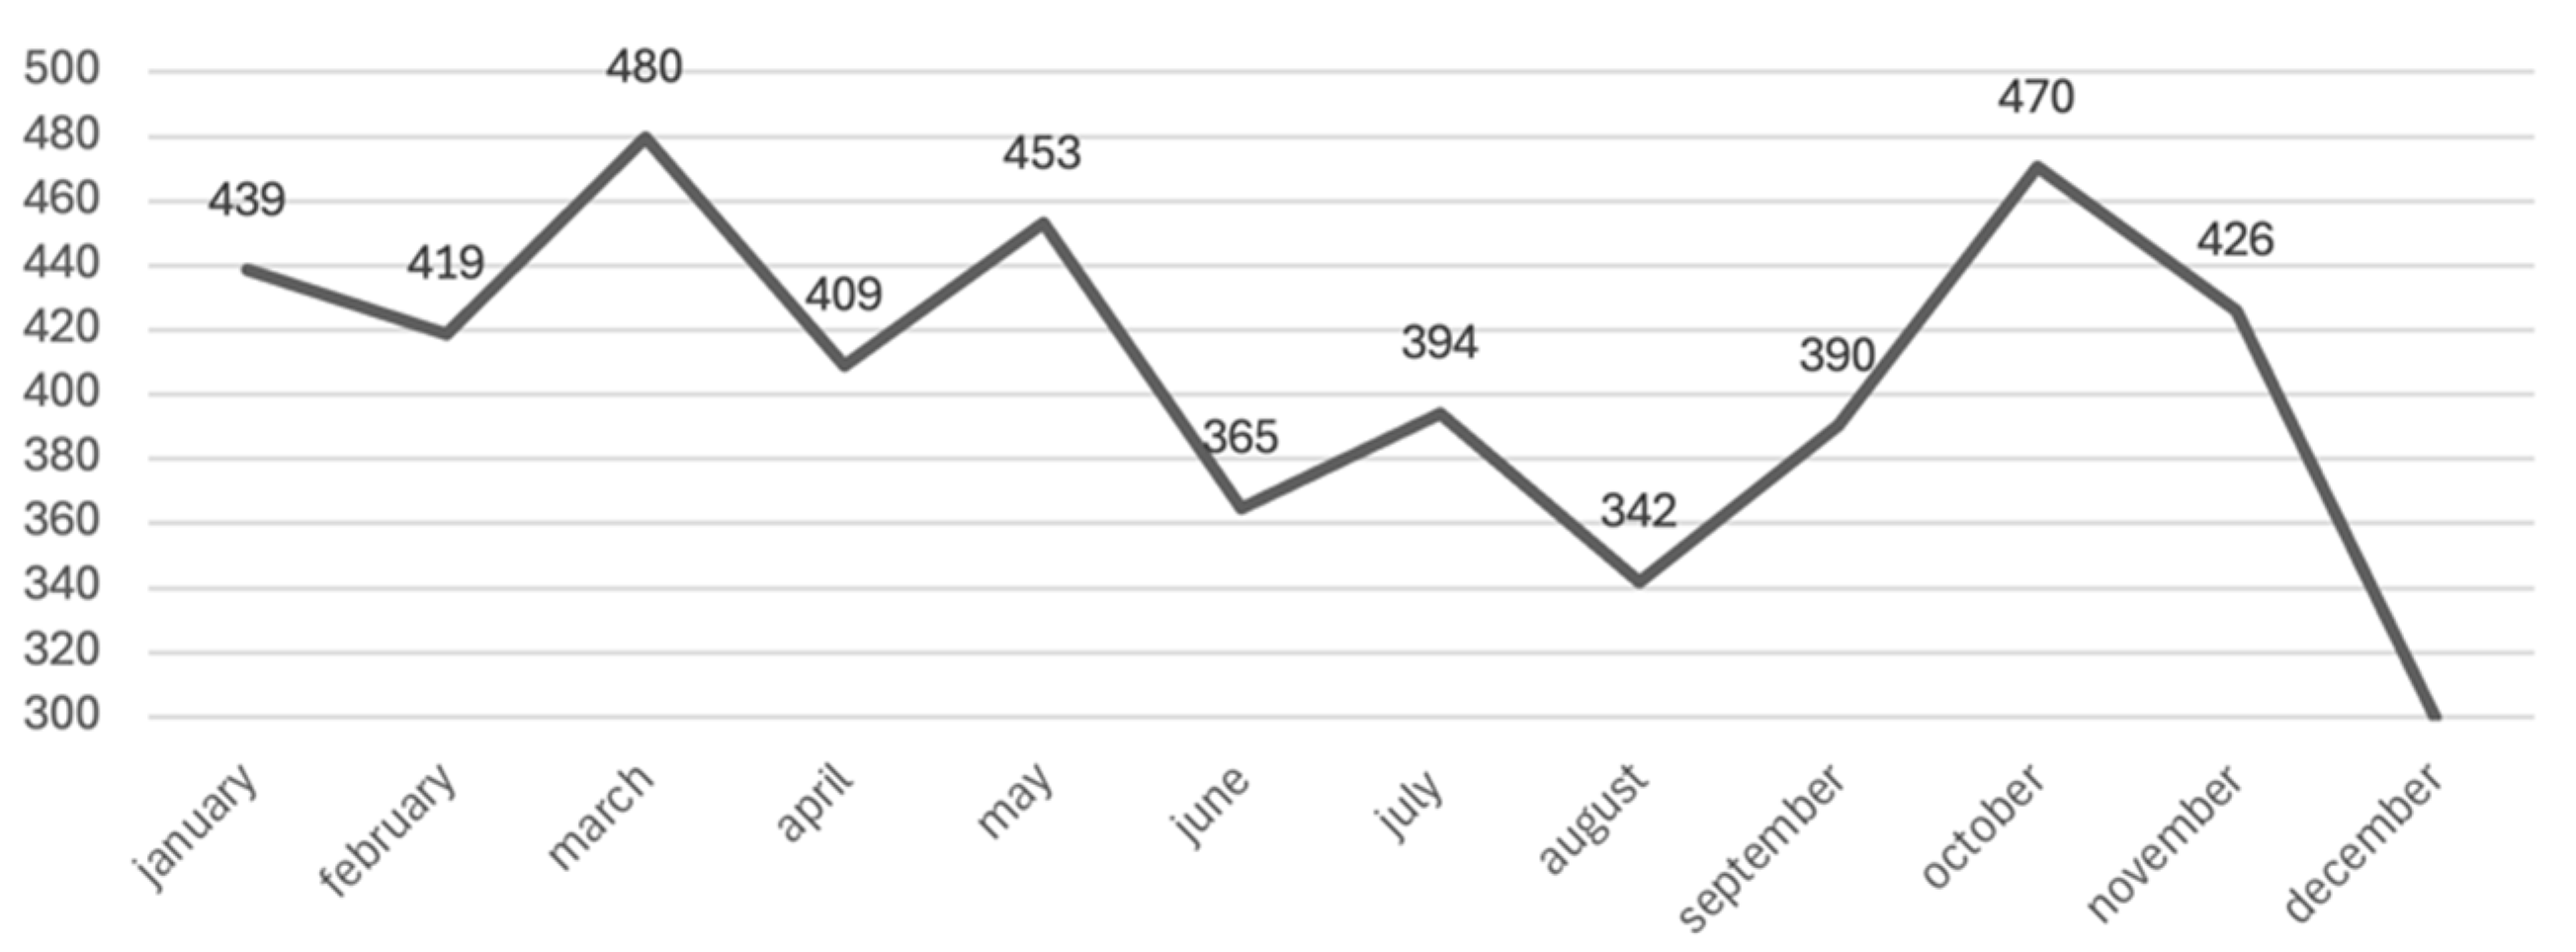
Regarding emissions from purchased electricity, it can be concluded that the company consumes an average of 31 thousand MWh per year, which corresponds to roughly 5 thousand tonnes of CO
2e, with the months of March, May, October, and November consuming the most electricity and consequently releasing the most CO
2e. It is also noticeable that the months of August and December consume the least energy, which is to be expected given that the company is on holiday during these months. This situation is shown in
Figure 10.
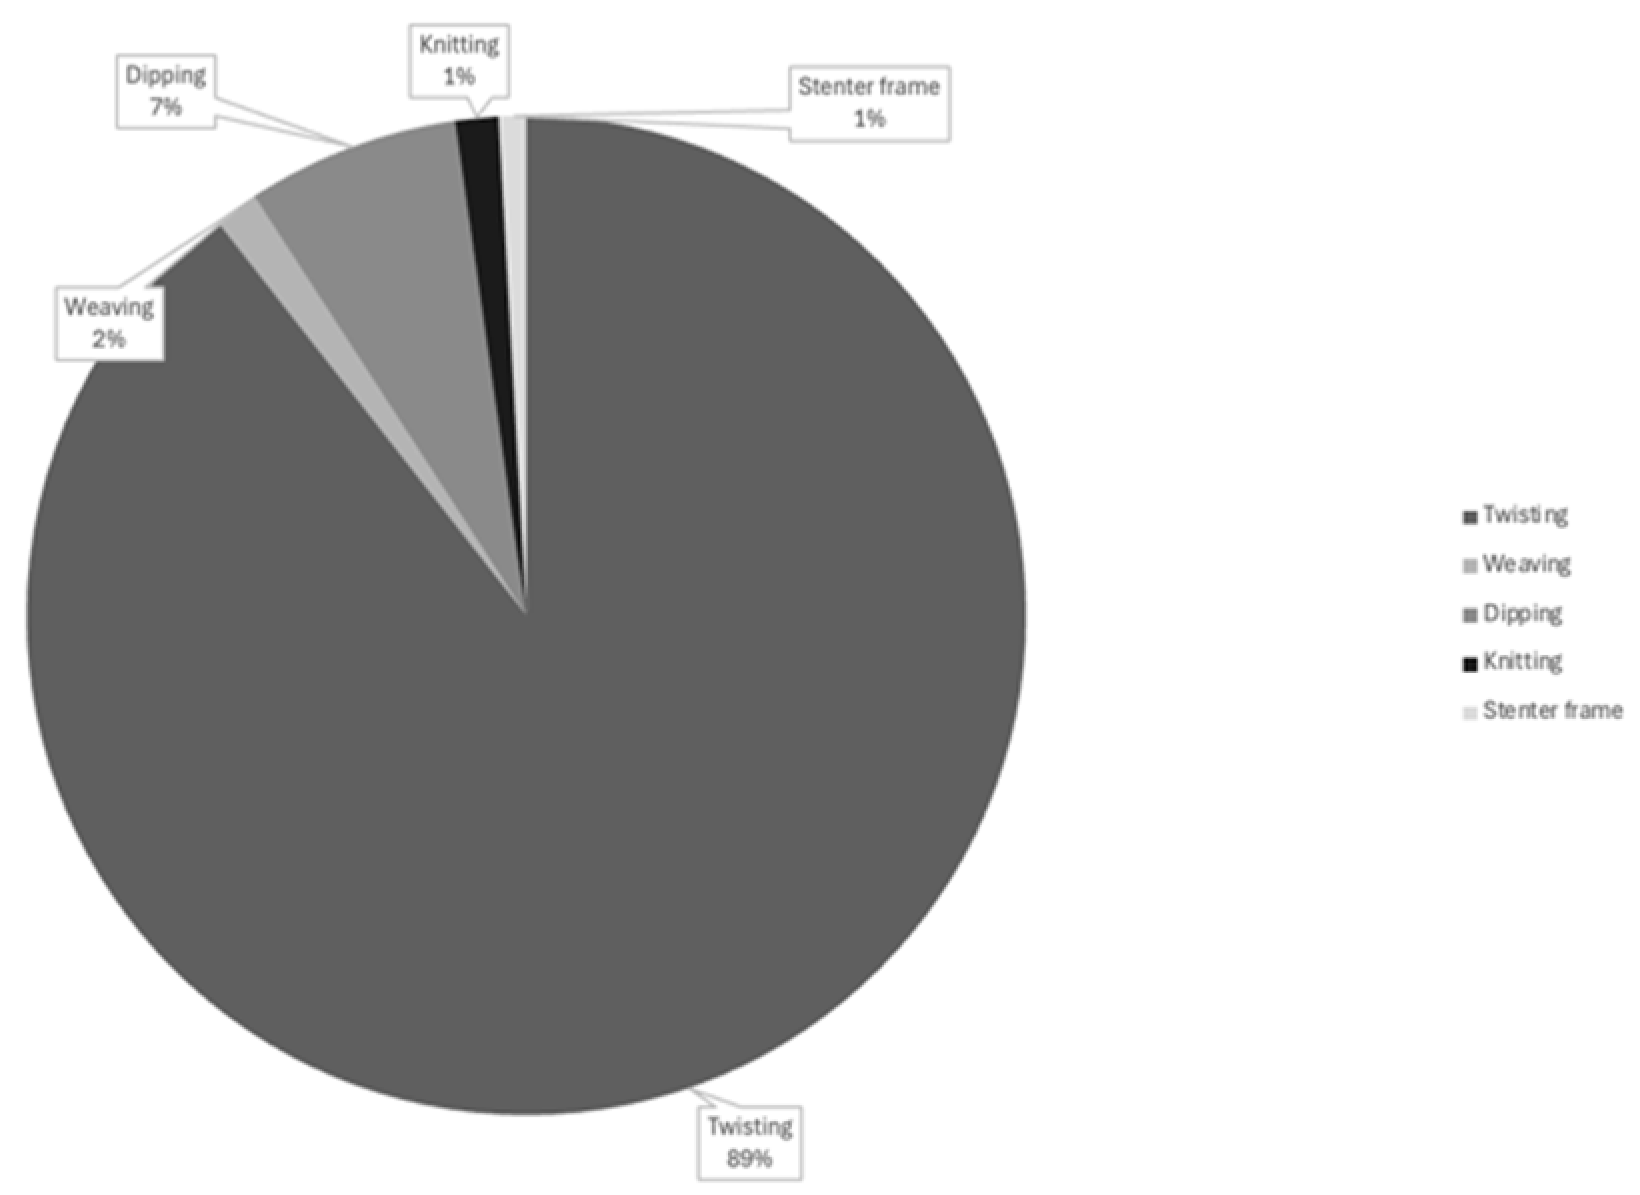
As mentioned above, the company belongs to the textile industry. Therefore, to identify which of the company’s five areas (Twisting, Weaving, Dipping, Knitting, and Stanter Frame) releases the most tonnes of CO
2e,
Figure 11 was created. This graph identifies the Twisting as the one that consumes the most electricity, around 89%, and consequently the one that releases the most greenhouse gases.
The explanation for this is the fact that this is the bottleneck of the process, requiring a greater number of machines in order to fulfil the company’s objectives. Consequently, it becomes the area that consumes the most energy due to the intense use of the equipment. It is therefore believed that identifying improvements either in the process or in the energy used would be essential to mitigate its impact on the company’s carbon footprint.
Dipping is second, with a percentage of 7 per cent, followed by weaving, knitting, and stenter frame. In total, the machines release around 7 thousand tonnes of CO2e, a value higher than the electricity purchased, which is to be expected given that they consume both energies, purchased and produced by the company.
According to the Environmental Protection Agency (EPA), “CO
2 accounts for the majority of GHG emissions from stationary combustion sources” [
29]. On this basis, the company’s stationary combustion data were evaluated. The company currently has four combustion sources, all linked to natural gas. Analysing
Figure 12, it becomes clear that the Dipping area emits the most stationary combustion gases, which is to be expected as three of the four sources are associated with it.
“Emissions from mobile combustion mainly result from the transport and distribution of materials in the supply chain, both on-site and off-site, by means such as ships, lorries and trains”, says the Coalition on Materials Emissions Transparency (COMET) [
30].
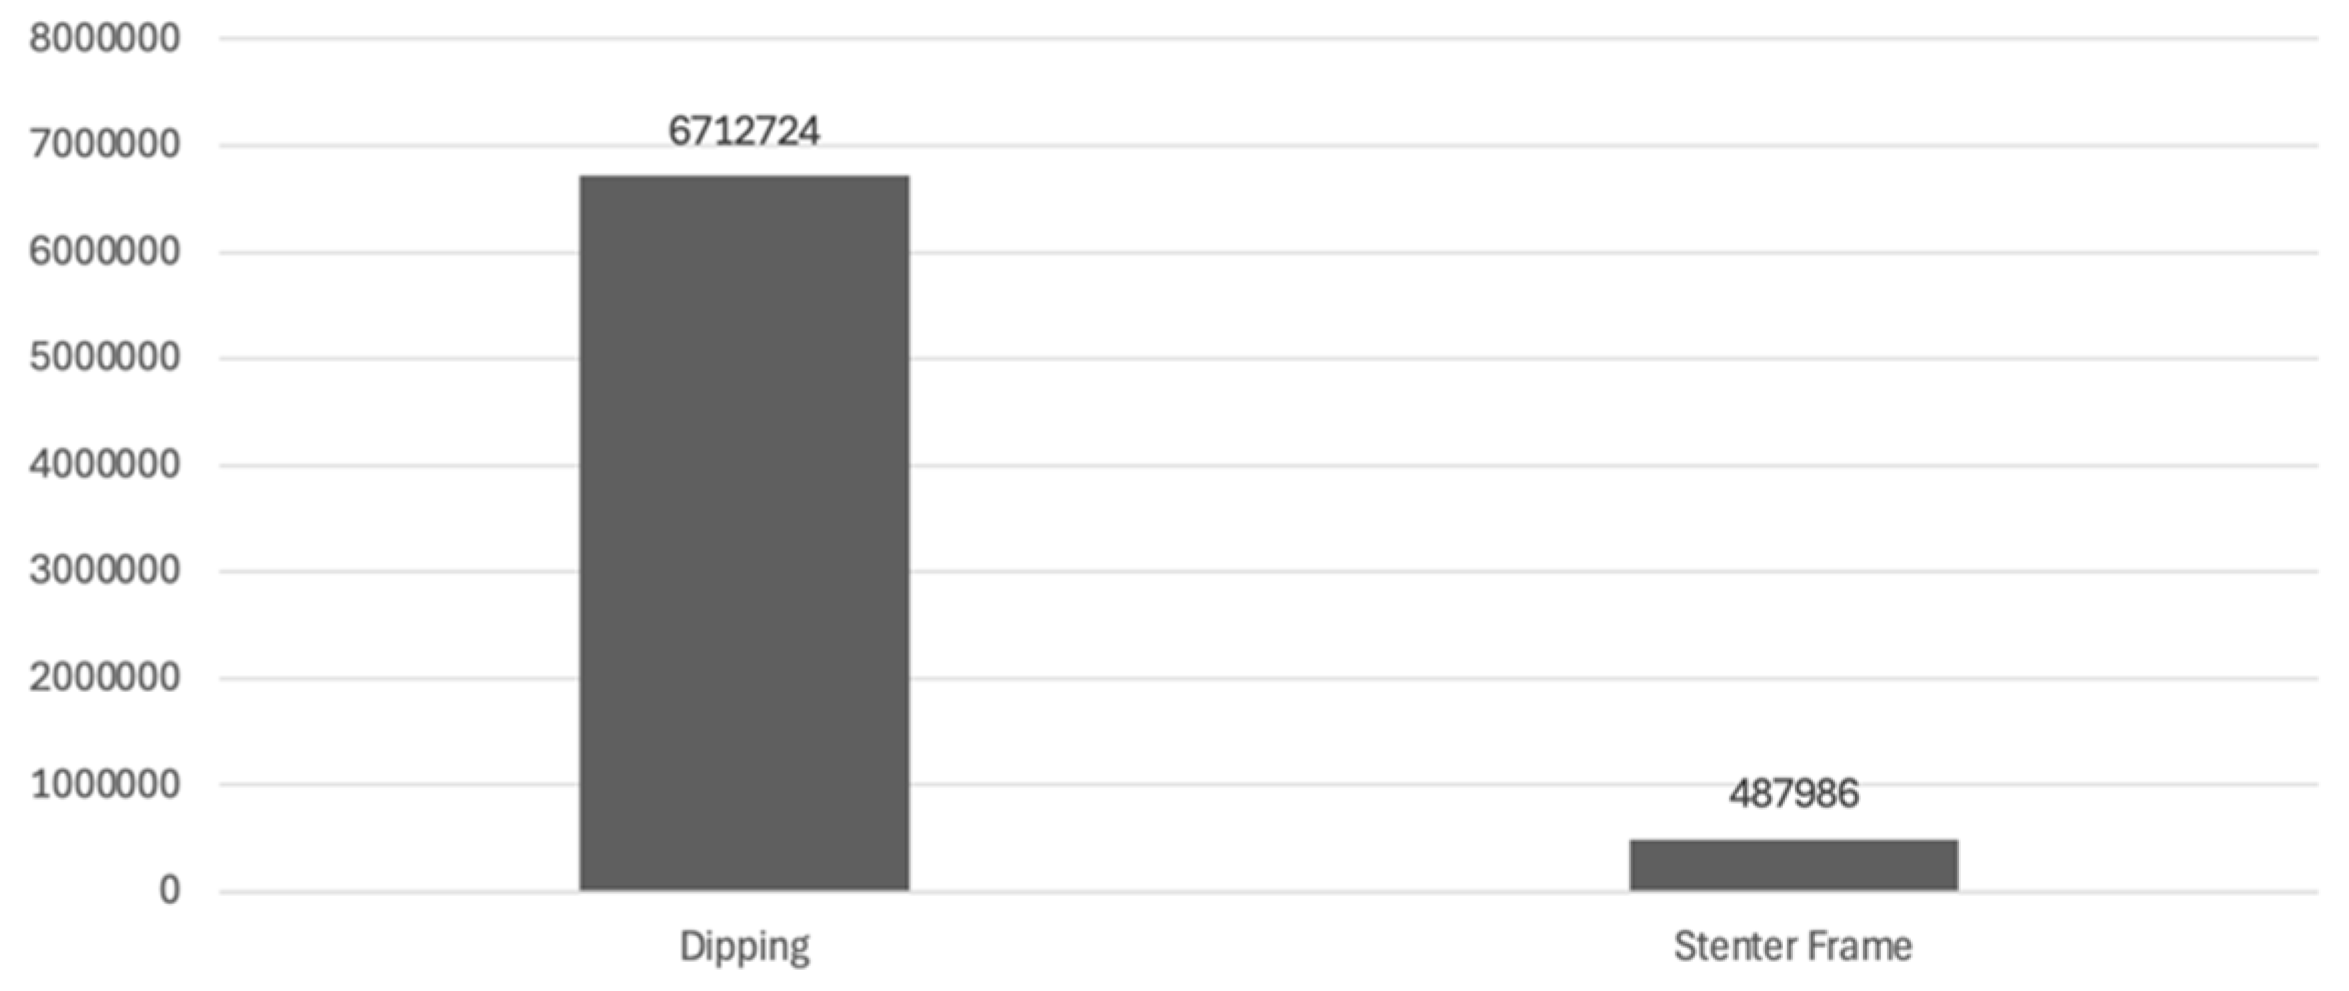
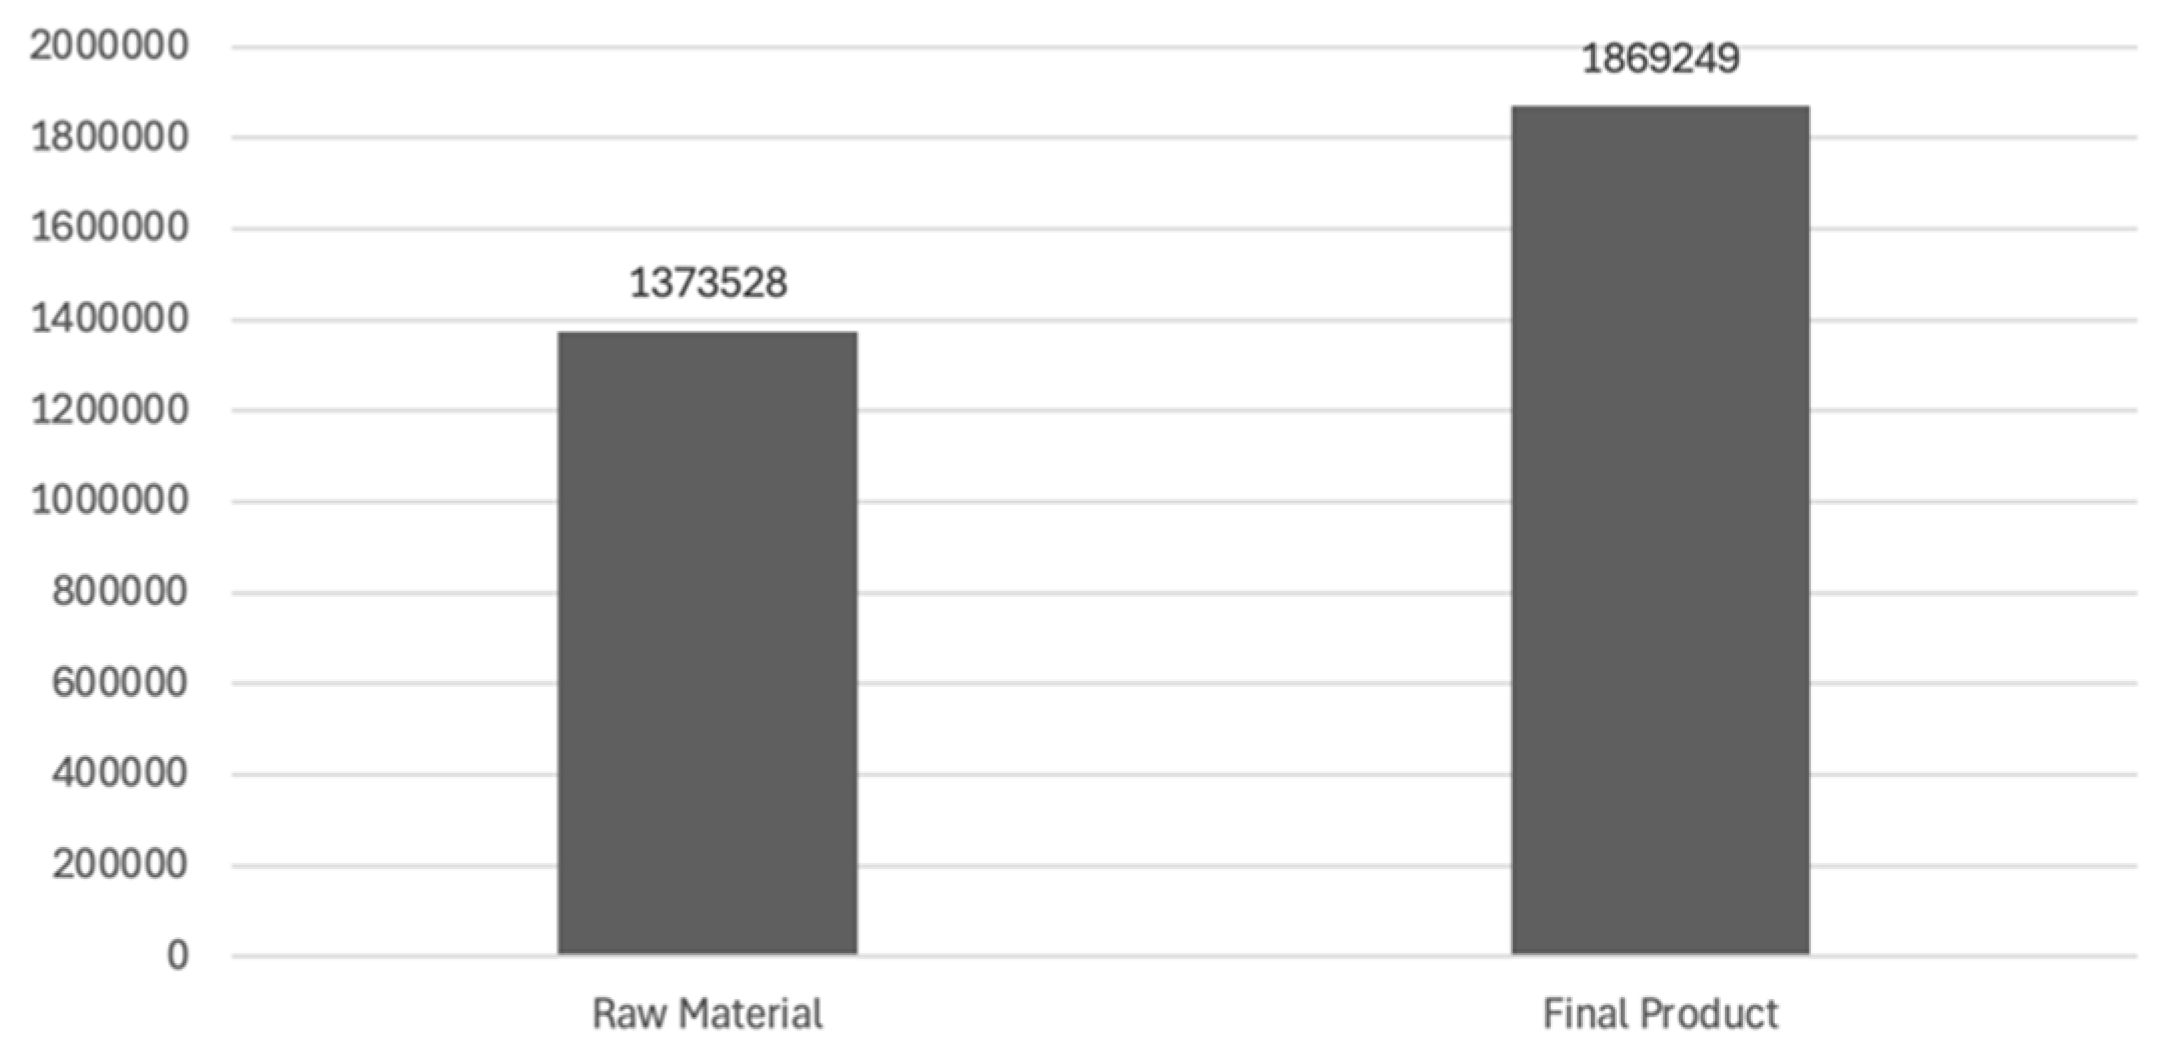
Therefore, mobile combustion also encompasses data related to the transport of raw materials and finished products. Comparing these two scenarios, the emissions associated with the transport of raw materials amount to 1373 million tonnes of CO
2e, while the transport of the finished product generates 1869 million tonnes of CO
2e (
Figure 13). Consequently, the transport of finished products results in substantially higher CO
2e emissions than the transport of raw materials.
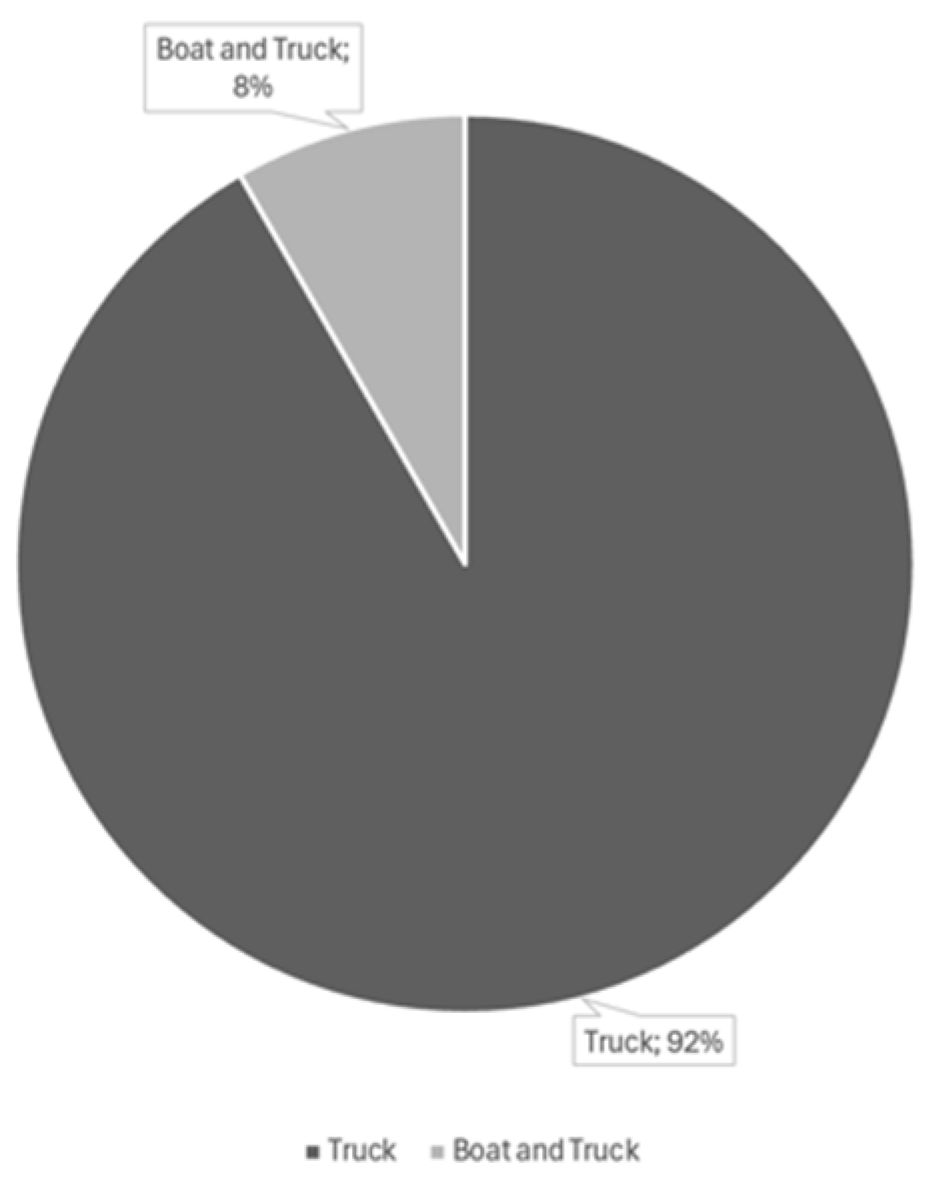
In the same way that the emissions corresponding to the types of materials transported were analysed, it was found that a large part of the total emissions from mobile combustion are attributed to transport by truck, corresponding to a percentage of more than 90%. This result was to be anticipated given that the company under study makes most of its journeys using this means of transport, both for the transport of raw materials and the final product, as can be seen in
Figure 14.
In mainland Portugal, solid waste was responsible for 10% of total greenhouse gas emissions in 2022, which is explained by the increase in waste production [
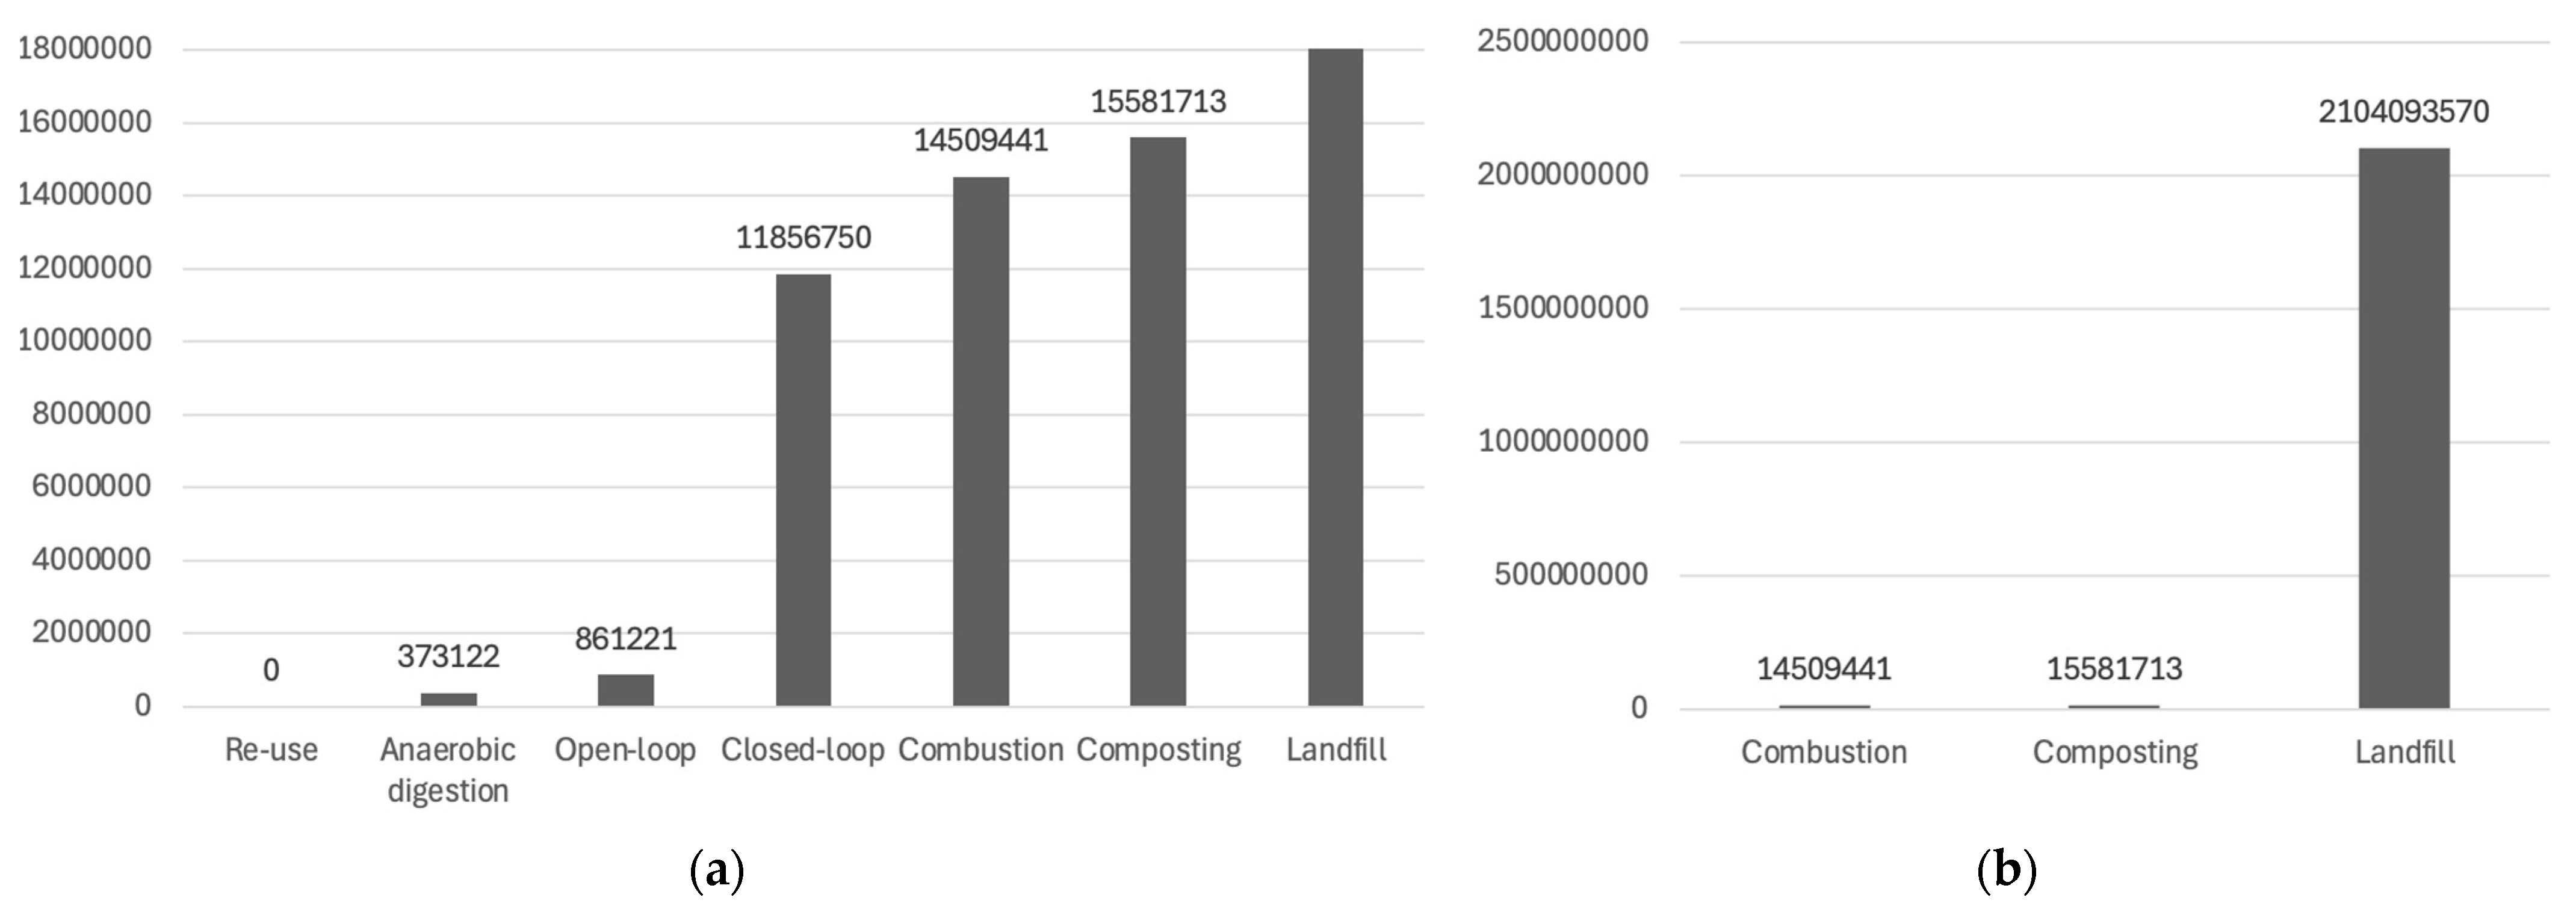
31]. Considering that the industrial sector also produces waste, an analysis was conducted on the amount and type of waste generated by the company. To obtain a more comprehensive analysis, these figures were applied to the various types of waste treatment available in the tool, giving rise to
Figure 15.
The
Figure 15 shows that treating waste through landfill is the most environmentally damaging option, as it results in incredibly high greenhouse gas emissions. This disparity arises because landfills generate methane (CH
4)—a gas 28–36 times more potent than CO
2—during anaerobic decomposition of organic waste, such as the company’s 42,000 kg/year of food waste. Conversely, anaerobic digestion captures CH
4 for energy conversion, reducing net emissions [
18]. Combustion, while emitting CO
2 from materials like cardboard (1,238,050 kg), lacks carbon capture in this case. Recycling minimizes emissions by avoiding raw material extraction, though energy costs for processing (e.g., closed-loop plastic recycling) explain residual emissions. This analysis reinforces the need to identify alternatives that reduce the impact of emissions on the environment. On the other hand, reuse and anaerobic digestion stand out among the various treatment methods analysed as the options that release the least gases, thus showing their reduced impact on the environment.
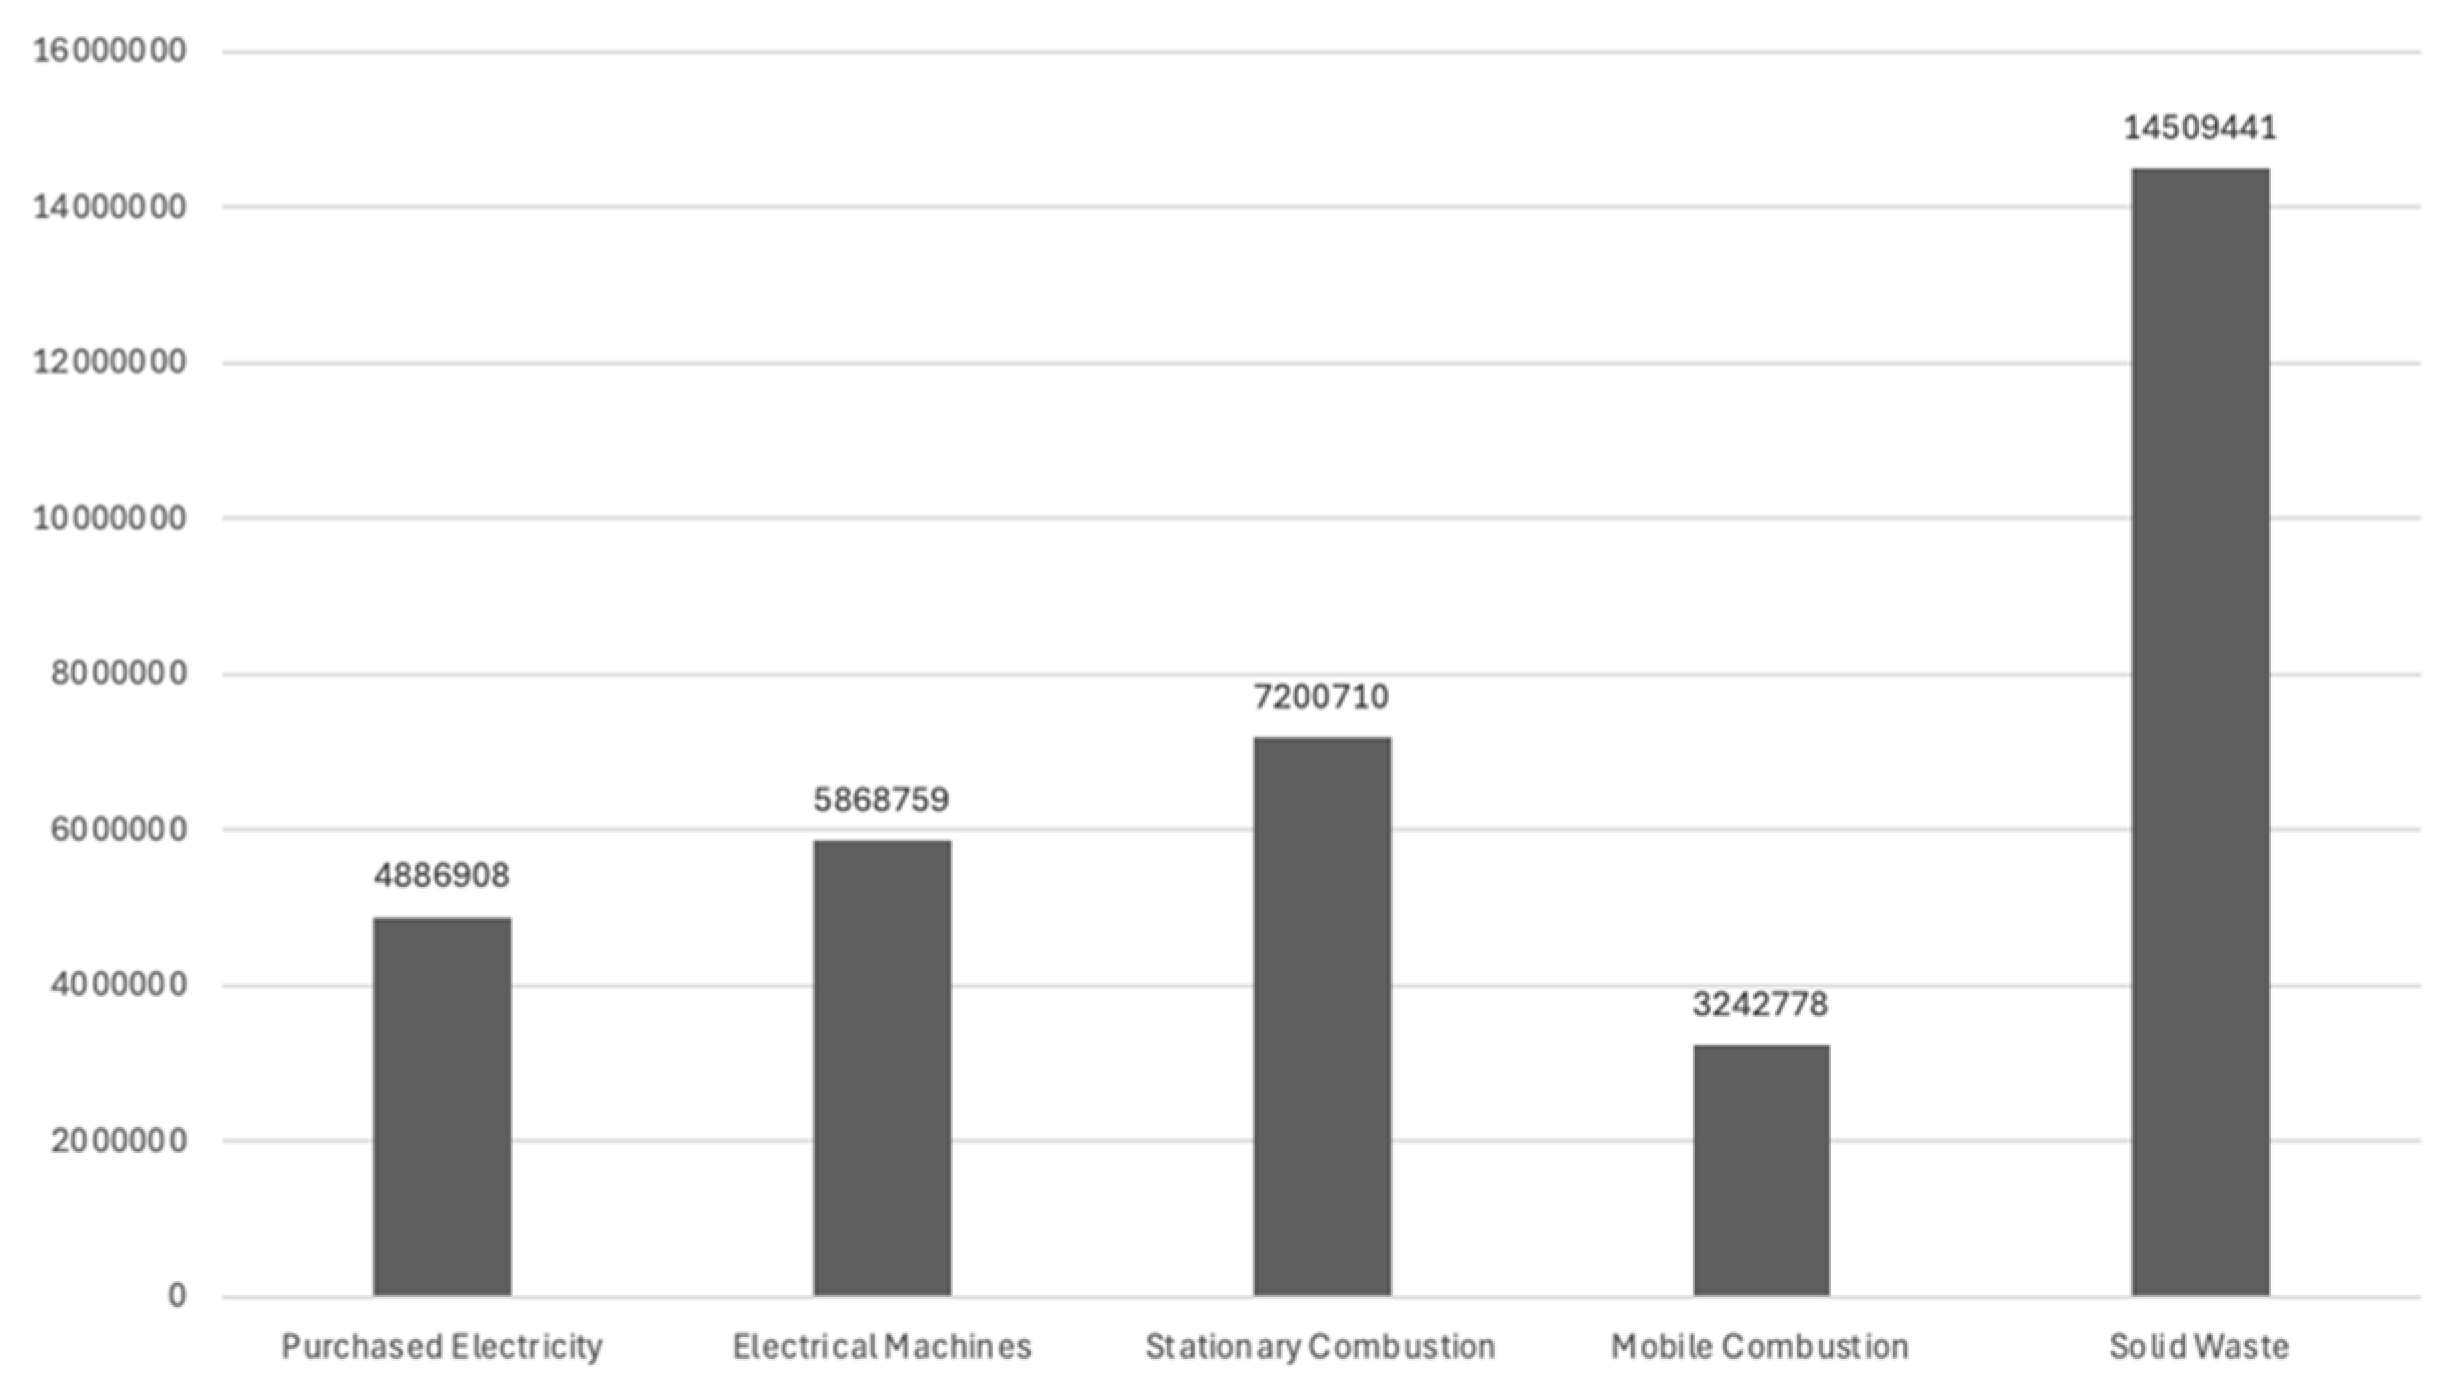
Finally, it was analysed which variables have the most significant impact on the environment as a result of the company emitting more greenhouse gases.
Figure 16 highlights that stationary combustion and solid waste are the most impactful variables on the environment, in contrast to electricity, electric machines, and mobile combustion. These results show that the company must now focus on applying potential alternatives or solutions that allow it to reduce its carbon footprint through both stationary combustion and the decomposition of solid waste.
5. Discussion
Bearing in mind the research objectives, the results obtained were analysed to identify possible areas and methods of improvement. Nevertheless, it is important to emphasise that there are limitations to the study carried out, namely factors that can influence the emissions released by the company. Demand, for example, affects both the emissions released by electricity and transportation, insofar as if there is an increase in demand, and in order to respond to customer needs, the company will need to produce more, leading to an increase in the use of machinery, and consequently energy consumption. On the other hand, depending on where the order is placed, the number of journeys made to obtain the materials needed for production and to deliver the final product may increase. In addition, it is crucial to have real-time, reliable data so that the analysis is as accurate as possible and does not jeopardise decision-making. Another constraint is the type of treatment carried out on the waste, which, as seen above, greatly affects the carbon footprint values. Given that different approaches to waste treatment emit different amounts of gases into the atmosphere, it is essential to know how waste is handled. With this in mind, some measures that can be taken to reduce companies’ carbon footprint will be discussed.
Regarding electricity, it was realised that this is a key variable in determining the carbon footprint [
32], especially when the energy used comes from non-renewable sources. The twisting process is identified as the principal source of emissions within the production sector, representing 89% of the total sectoral emissions, as depicted in
Figure 11. This process is estimated to generate 12.9 million kg CO
2e, based on data derived from stationary combustion and electricity consumption, as illustrated in
Figure 16. Consequently, this singular operation surpasses the aggregate emissions of all other production areas.
The significance of electricity in the carbon footprint of the company analysed in [
33] reinforces the necessity of investing in renewable energy sources. This strategy has already been adopted by the pulp and paper sector, where biomass is increasingly utilized to reduce dependence on fossil fuels. Similarly, the cement industry has demonstrated that the partial replacement of fossil fuels with biomass can significantly reduce CO
2 emissions. Additionally, in the transportation sector, fleet electrification has been widely promoted as a sustainable alternative, suggesting that the company could explore greener transportation options to mitigate its environmental impact.
In the case of this company, the difference was quantified at around 5 thousand tonnes. This discrepancy underscores the importance of transitioning to renewable energy sources, reinforcing the company’s strategic decision to invest in more sustainable energy solutions. The company’s use of renewable energy, such as solar panels, is a practical example of how industries can reduce their carbon footprint while maintaining operational efficiency. In fact, studies have shown that solar solutions can significantly reduce carbon footprints in industries with high energy demands, such as textiles [
34] Furthermore, integrating solar power into textile manufacturing can lead to substantial operational cost savings.
Incorporating examples from similar industries that have successfully implemented solar energy solutions, such as the study published in the journal Energies [
34], on solar thermal systems in cotton-based textile industries, would further enhance the discussion. This research demonstrated significant economic advantages and a reduction in greenhouse gas emissions when integrating solar energy into textile manufacturing processes. The findings illustrated both short-term financial benefits, in terms of energy cost savings, and long-term sustainability improvements, offering valuable insights into how such technologies could be applied within textile manufacturing.
Stationary combustion, one of the main contributors to emissions in industrial operations, also demands intervention. Although there are no significant differences between the variables, stationary combustion stands out in
Figure 16, because it releases more gas in comparison to the remaining variables. Transitioning from natural gas combustion systems to electric alternatives presents a compelling pathway for reducing the carbon footprint. According to Schoeneberger et al. [
35], electric boilers have a significant advantage in terms of carbon footprint, but only when the electricity used comes from renewable sources, which is the case for the company under study. This article shows that only in a scenario where the electricity grid is dominated by renewable energies is possible to reduce GHG emissions. By decreasing the use of electricity from coal and natural gas, it is possible to save around 3% of emissions from the US industrial sector (609 MMmtCO
2e), which is equivalent to 19 million metric tonnes of CO
2 equivalent (MMmtCO
2e). Similarly, there is a reduction of 7 MMmtCO
2e when fuels derived from by-products are excluded, thereby ensuring a high penetration of renewables. This shift aligns with broader decarbonisation trends in the industrial sector, particularly as renewable energy capacity expands globally. The company’s recent acquisition of an electric boiler is a proactive step in this direction. If the equipment proves capable of matching or exceeding the performance of existing machinery, scaling its use across operations will not only reinforce the company’s environmental commitments but also position it as a leader in industrial innovation. By integrating renewable-powered technologies, the company can create a ripple effect across its supply chain, encouraging other stakeholders to adopt similarly sustainable practices.
Transitioning from natural gas combustion systems to electric alternatives presents a compelling pathway for reducing the carbon footprint. According to [
36], the transition to lower-carbon fuels and the adoption of advanced combustion technologies can substantially reduce greenhouse gas emissions. In line with this strategy, the use of electric boilers—especially when powered by renewable energy—eliminates direct CH
4 and N
2O emissions while also decreasing indirect CO
2 emissions.
A preliminary analysis of the company’s operations initially suggested that transportation had a relatively minor impact on greenhouse gas emissions. However, a more detailed analysis, focused on identifying emission reduction strategies, revealed that trucks and freight transport represent a significant environmental footprint, as shown in
Figure 14. Thus, the high emissions associated with the transportation of finished products, also featured in the study, underscore the critical need for more sustainable logistics. A comprehensive analysis of logistical emissions indicates that road transport represents the principal source of mobile combustion emissions within the organization, comprising 92% of the overall total, as illustrated in
Figure 14. This predominance leads to considerable environmental repercussions, with each category of cargo (raw materials and finished products) producing approximately 1.37 million kg of CO
2e annually, as demonstrated in
Figure 13. In fact, road transport constitutes the largest share of emissions from mobile combustion sources, responsible for about a quarter of the EU’s total CO
2 emissions in 2019, of which 71.7% came from road transportation, according to a report from the European Environment Agency [
37].
In the study from the Environmental Protection Agency (EPA), as stated on page five of the article, medium- and heavy-duty trucks represent the vehicle type with the highest CO
2 emission factor [
38]. This highlights their significant contribution to greenhouse gas emissions within the transportation sector.
Finally, and considering the graphs obtained in the study (
Figure 15), it was observed that there is a reduced range of treatment types for solid waste that results in low levels of gas emissions, such as reuse and aerobic digestion.
The waste treatment analysis uncovers significant disparities in the impacts of emissions. Landfill operations produce approximately 2.1 billion kg of CO
2e—around 145 times greater than the emissions generated from waste combustion (14.5 million kg of CO
2e) and 5600 times greater than those resulting from anaerobic digestion (373,000 kg of CO
2e), as illustrated in
Figure 15. This substantial difference in emission levels underscores the urgency of phasing out landfill operations and transitioning to circular treatment methods as a critical operational priority.
However, transitioning to these methods requires addressing economic and logistical barriers. For anaerobic digestion, upfront costs for infrastructure (e.g., digesters, biogas capture systems) and operational challenges (e.g., maintaining consistent feedstock quality, regulatory compliance) may hinder adoption. Wilkie (2005) estimates that industrial-scale anaerobic digestion systems achieve cost recovery within 5–10 years, contingent on feedstock availability and energy market conditions [
18]. In the textile sector, such systems face additional complexities due to heterogeneous waste streams, as highlighted in case studies by Violano and Cannaviello (2023), which emphasize the need for pre-treatment processes to standardize waste inputs [
17]. Material reuse, while environmentally favourable, demands investments in closed-loop supply chains and partnerships with specialized recycling firms. For instance, integrating recycled textiles into automotive components—a niche market—requires collaboration with certified recyclers and adjustments to production standards. Regulatory incentives, such as EU subsidies for circular practices (e.g., the Circular Economy Action Plan), could offset initial costs [
23]. However, the company’s geographic location in Portugal, where waste management infrastructure for industrial textiles is underdeveloped, adds logistical challenges. A tailored feasibility analysis—considering the company’s waste composition, production scale, and regional infrastructure—is critical to align these strategies with operational capabilities. For example, pilot projects could assess the viability of anaerobic digestion for organic waste streams (e.g., 42,000 kg/year of food waste) or partnerships with local recyclers for cardboard and plastics. Such steps would provide actionable insights while mitigating financial risks.
This reinforces the need to adopt more sustainable waste management practices, such as anaerobic digestion or material reuse, to reduce the environmental impact of industrial operations. To systematically minimise emissions associated with solid waste, the company should adopt a multi-faceted approach. First, prioritising the reduction of disposable and easily substitutable materials—such as single-use plastics, cardboard, and metals—can deliver immediate results. These materials often have well-established recycling pathways and replacements, making their reduction a feasible and impactful first step. Second, forming strategic partnerships with organisations that specialise in innovative waste management techniques, such as advanced recycling, chemical depolymerisation, or waste-to-energy technologies, can unlock longer-term benefits. These collaborations can facilitate access to cutting-edge disposal methods, ensuring that waste streams are handled in a way that aligns with the company’s sustainability goals.
These measures, when implemented holistically, can significantly reduce the environmental impact of the company’s operations. They reflect a commitment to aligning with global sustainability targets while fostering innovation and resilience in a rapidly evolving industrial landscape.
6. Conclusions
The analysis of the company’s carbon footprint highlights the importance of accurately calculating greenhouse gas emissions in an industrial context. Through the implementation of a customized calculator, the main sources of emissions were identified. These results underline the importance of a detailed approach to understanding and mitigating environmental impact, as it allows one to see which areas need immediate change.
The results showed that the dipping area releases the most greenhouse gases in the stationary combustion sector, and as a result the source currently used, natural gas, should be changed. Furthermore, it was concluded that the transportation of the final product generates more emissions than the transportation of raw materials, with trucks accounting for most of the impact, as they have a higher emission factor than boats. Waste management also proved to be crucial, and it is possible to see the different impacts by changing the waste treatment method.
Based on these results, strategies are proposed to reduce emissions, such as replacing natural gas combustion sources with electric alternatives and reducing waste, especially recyclable waste. These actions, combined with more sustainable choices in transportation (e.g., railway), can align the company with global sustainability objectives and improve its competitiveness in the market.
In addition to this specific case study, the carbon footprint calculator developed in this research has the potential to be applied to other companies in the textile sector and as a scalable tool for broader industrial applications. The methodology can be adapted to various industries with similar energy consumption patterns, production processes, and logistics operations, including automotive, chemical, and food processing sectors, among others. By applying this structured, data-driven approach, businesses can not only quantify their emissions but also develop tailored strategies for emission reduction, supporting regulatory compliance and corporate sustainability goals. Moreover, as future work, it will be relevant to compare this tool with other existing tools or methodologies.
Furthermore, the insights gained from this study can guide the development of sector-specific adaptations of the tool, ensuring that its application remains relevant across different industrial landscapes. This initiative not only promotes environmental awareness within the company but also serves as a reference for industry-wide sustainability practices, reinforcing the commitment to mitigating climate change and fostering a more sustainable economy.


 and
and 