Author Contributions
Conceptualization, A.H., M.N., X.W., E.F., W.H., M.A.H., E.G. and P.A.H.; Methodology, A.H., M.N., X.W., E.F., W.H., M.A.H., E.G. and P.A.H.; Software, A.H., M.N., X.W., E.F., W.H., M.A.H., E.G. and P.A.H.; Validation, A.H., M.N., X.W., E.F., W.H., M.A.H., E.G. and P.A.H.; Formal analysis, A.H., M.N., X.W., E.F., W.H., M.A.H., E.G. and P.A.H.; Investigation, A.H., M.N., X.W., E.F., W.H., M.A.H., E.G. and P.A.H.; Resources, A.H., M.N., X.W., E.F., W.H., M.A.H., E.G. and P.A.H.; Data curation, A.H., M.N., X.W., E.F., W.H., M.A.H., E.G. and P.A.H.; Writing—original draft, A.H., M.N., X.W., E.F., W.H., M.A.H., E.G. and P.A.H.; Writing—review & editing, A.H., M.N., X.W., E.F., W.H., M.A.H., E.G. and P.A.H.; Visualization, A.H., M.N., X.W., E.F., W.H., M.A.H., E.G. and P.A.H.; Supervision, M.N., X.W., E.F., W.H., M.A.H., E.G. and P.A.H.; Project administration, M.N., X.W., E.F., W.H., M.A.H., E.G. and P.A.H.; Funding acquisition, M.N., X.W., E.F., W.H., M.A.H., E.G. and P.A.H. All authors have read and agreed to the published version of the manuscript.
Figure 1.
A model of a DC MG structure suitable for offshore settings.
Figure 1.
A model of a DC MG structure suitable for offshore settings.
Figure 2.
Circuit diagram of a basic DC MG.
Figure 2.
Circuit diagram of a basic DC MG.
Figure 3.
Cascaded control structure for DC-DC bidirectional converter.
Figure 3.
Cascaded control structure for DC-DC bidirectional converter.
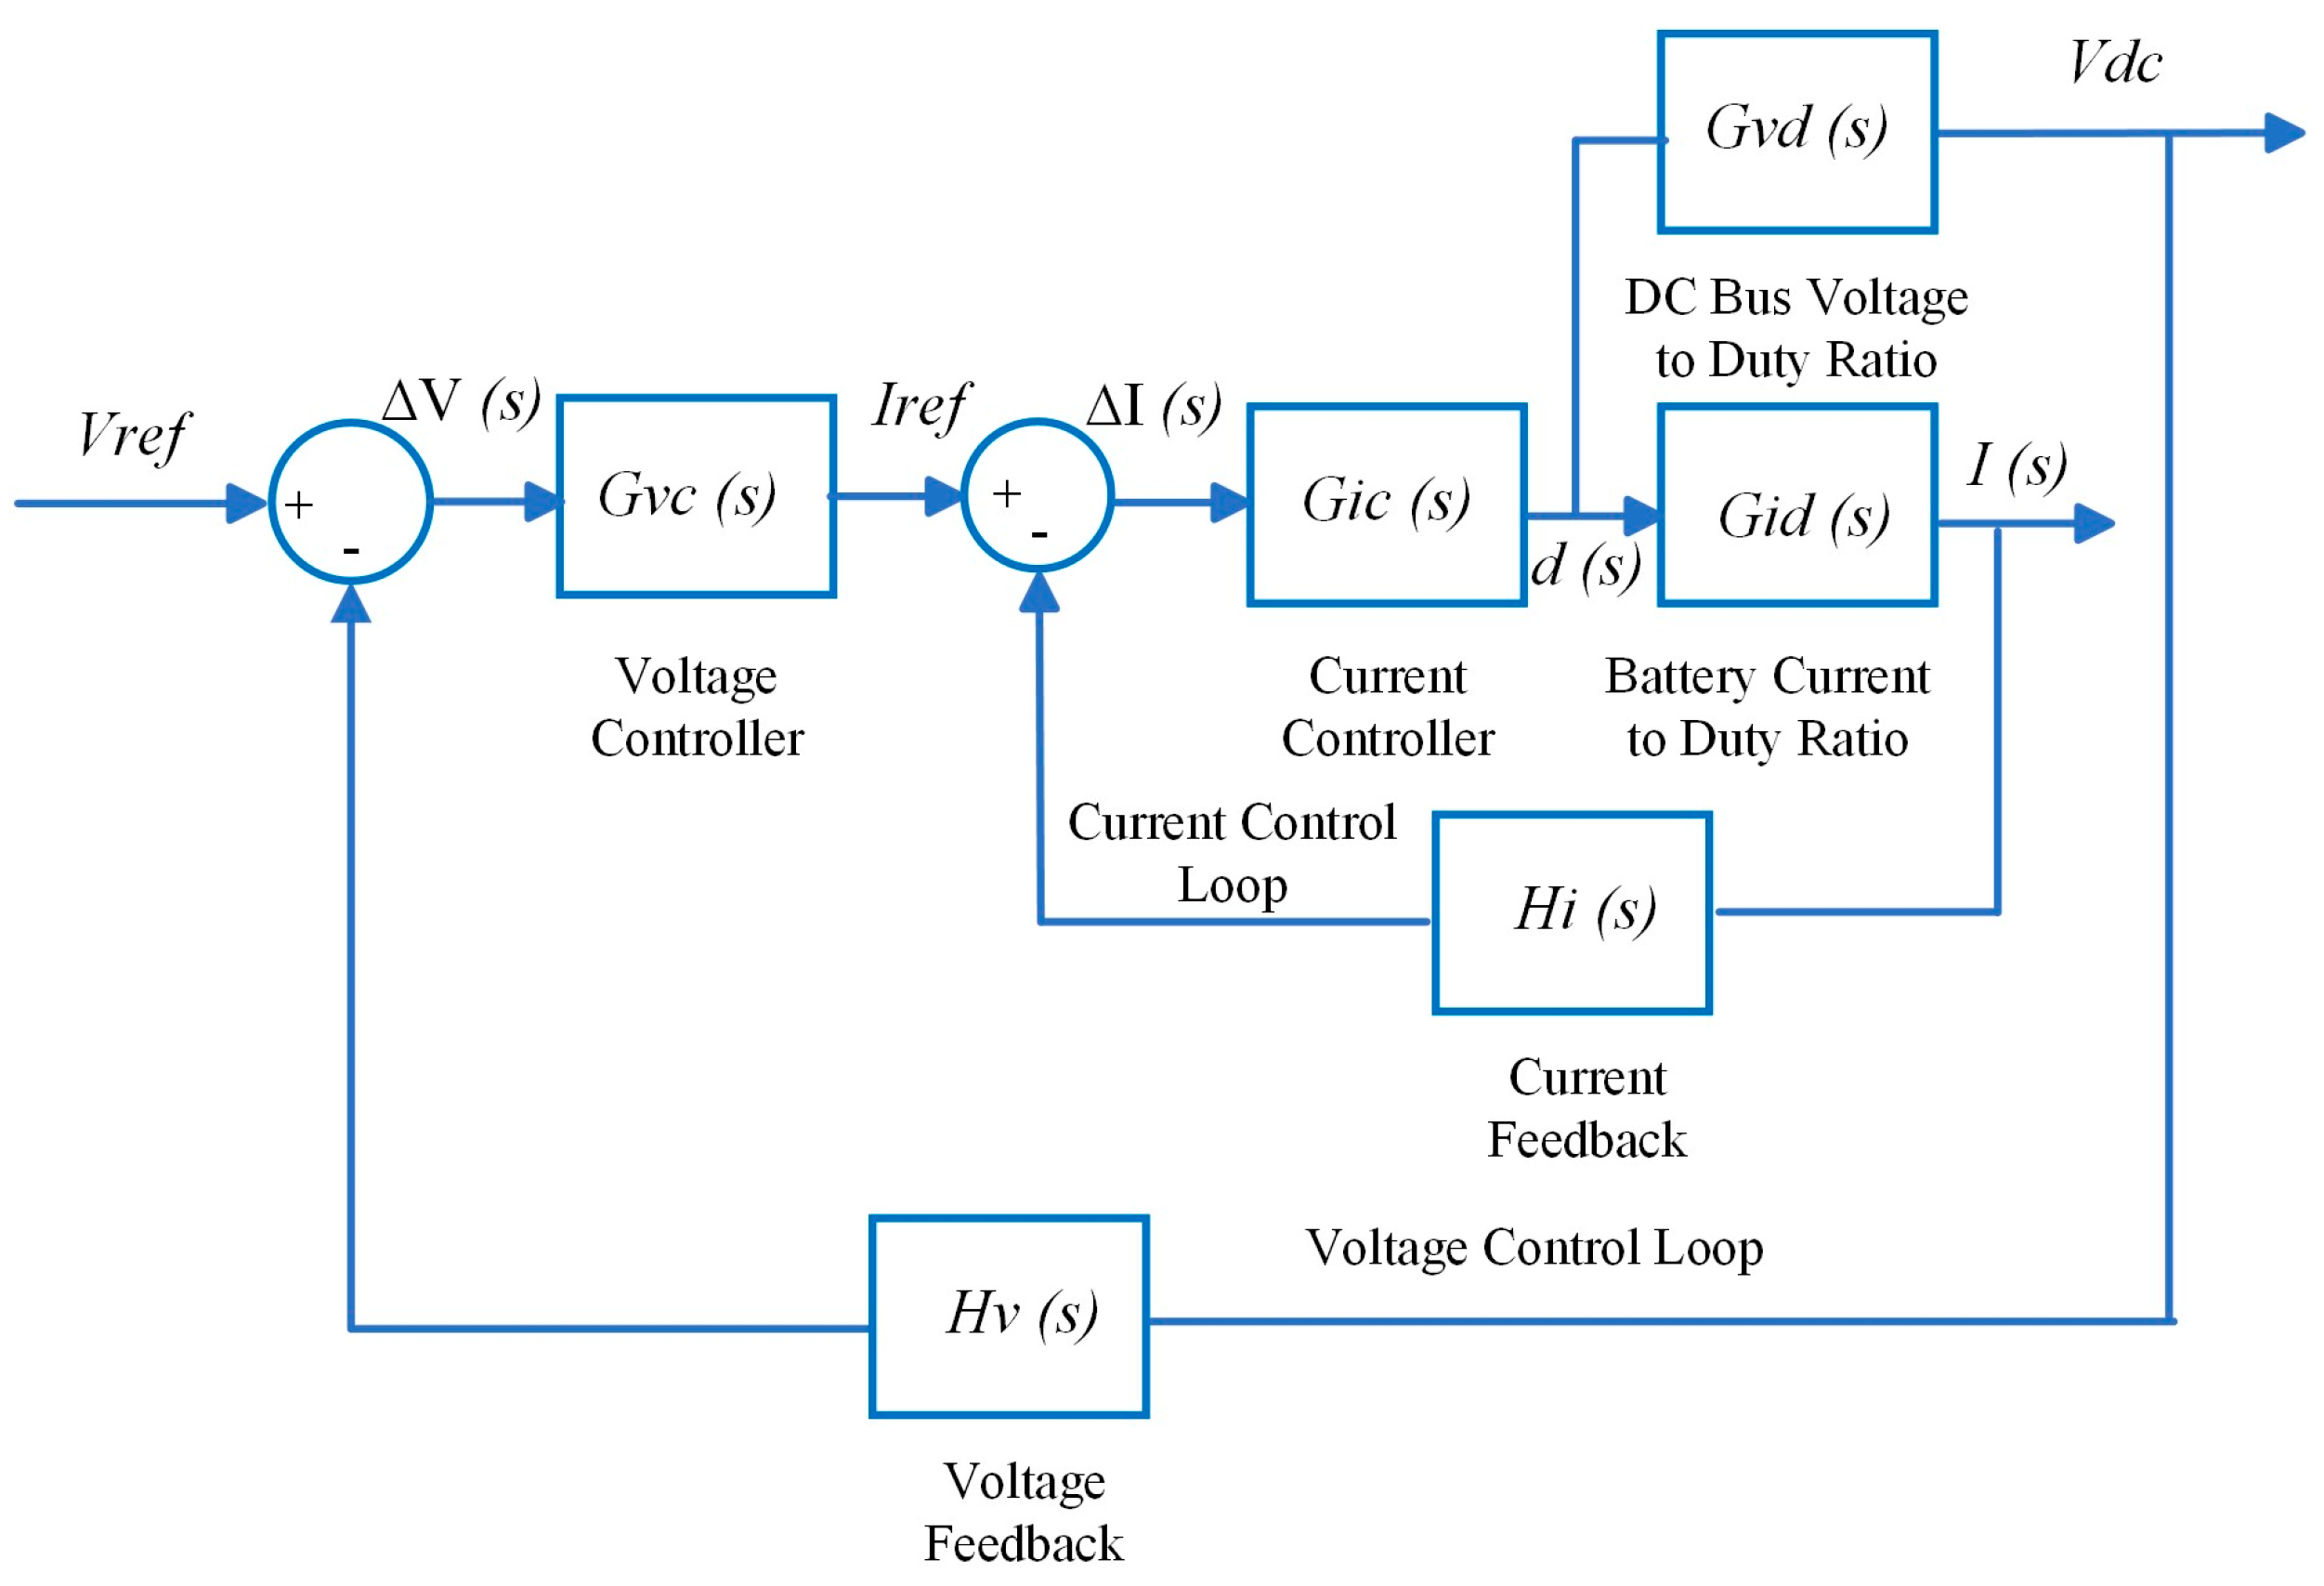
Figure 4.
Modified cascaded control structure.
Figure 4.
Modified cascaded control structure.
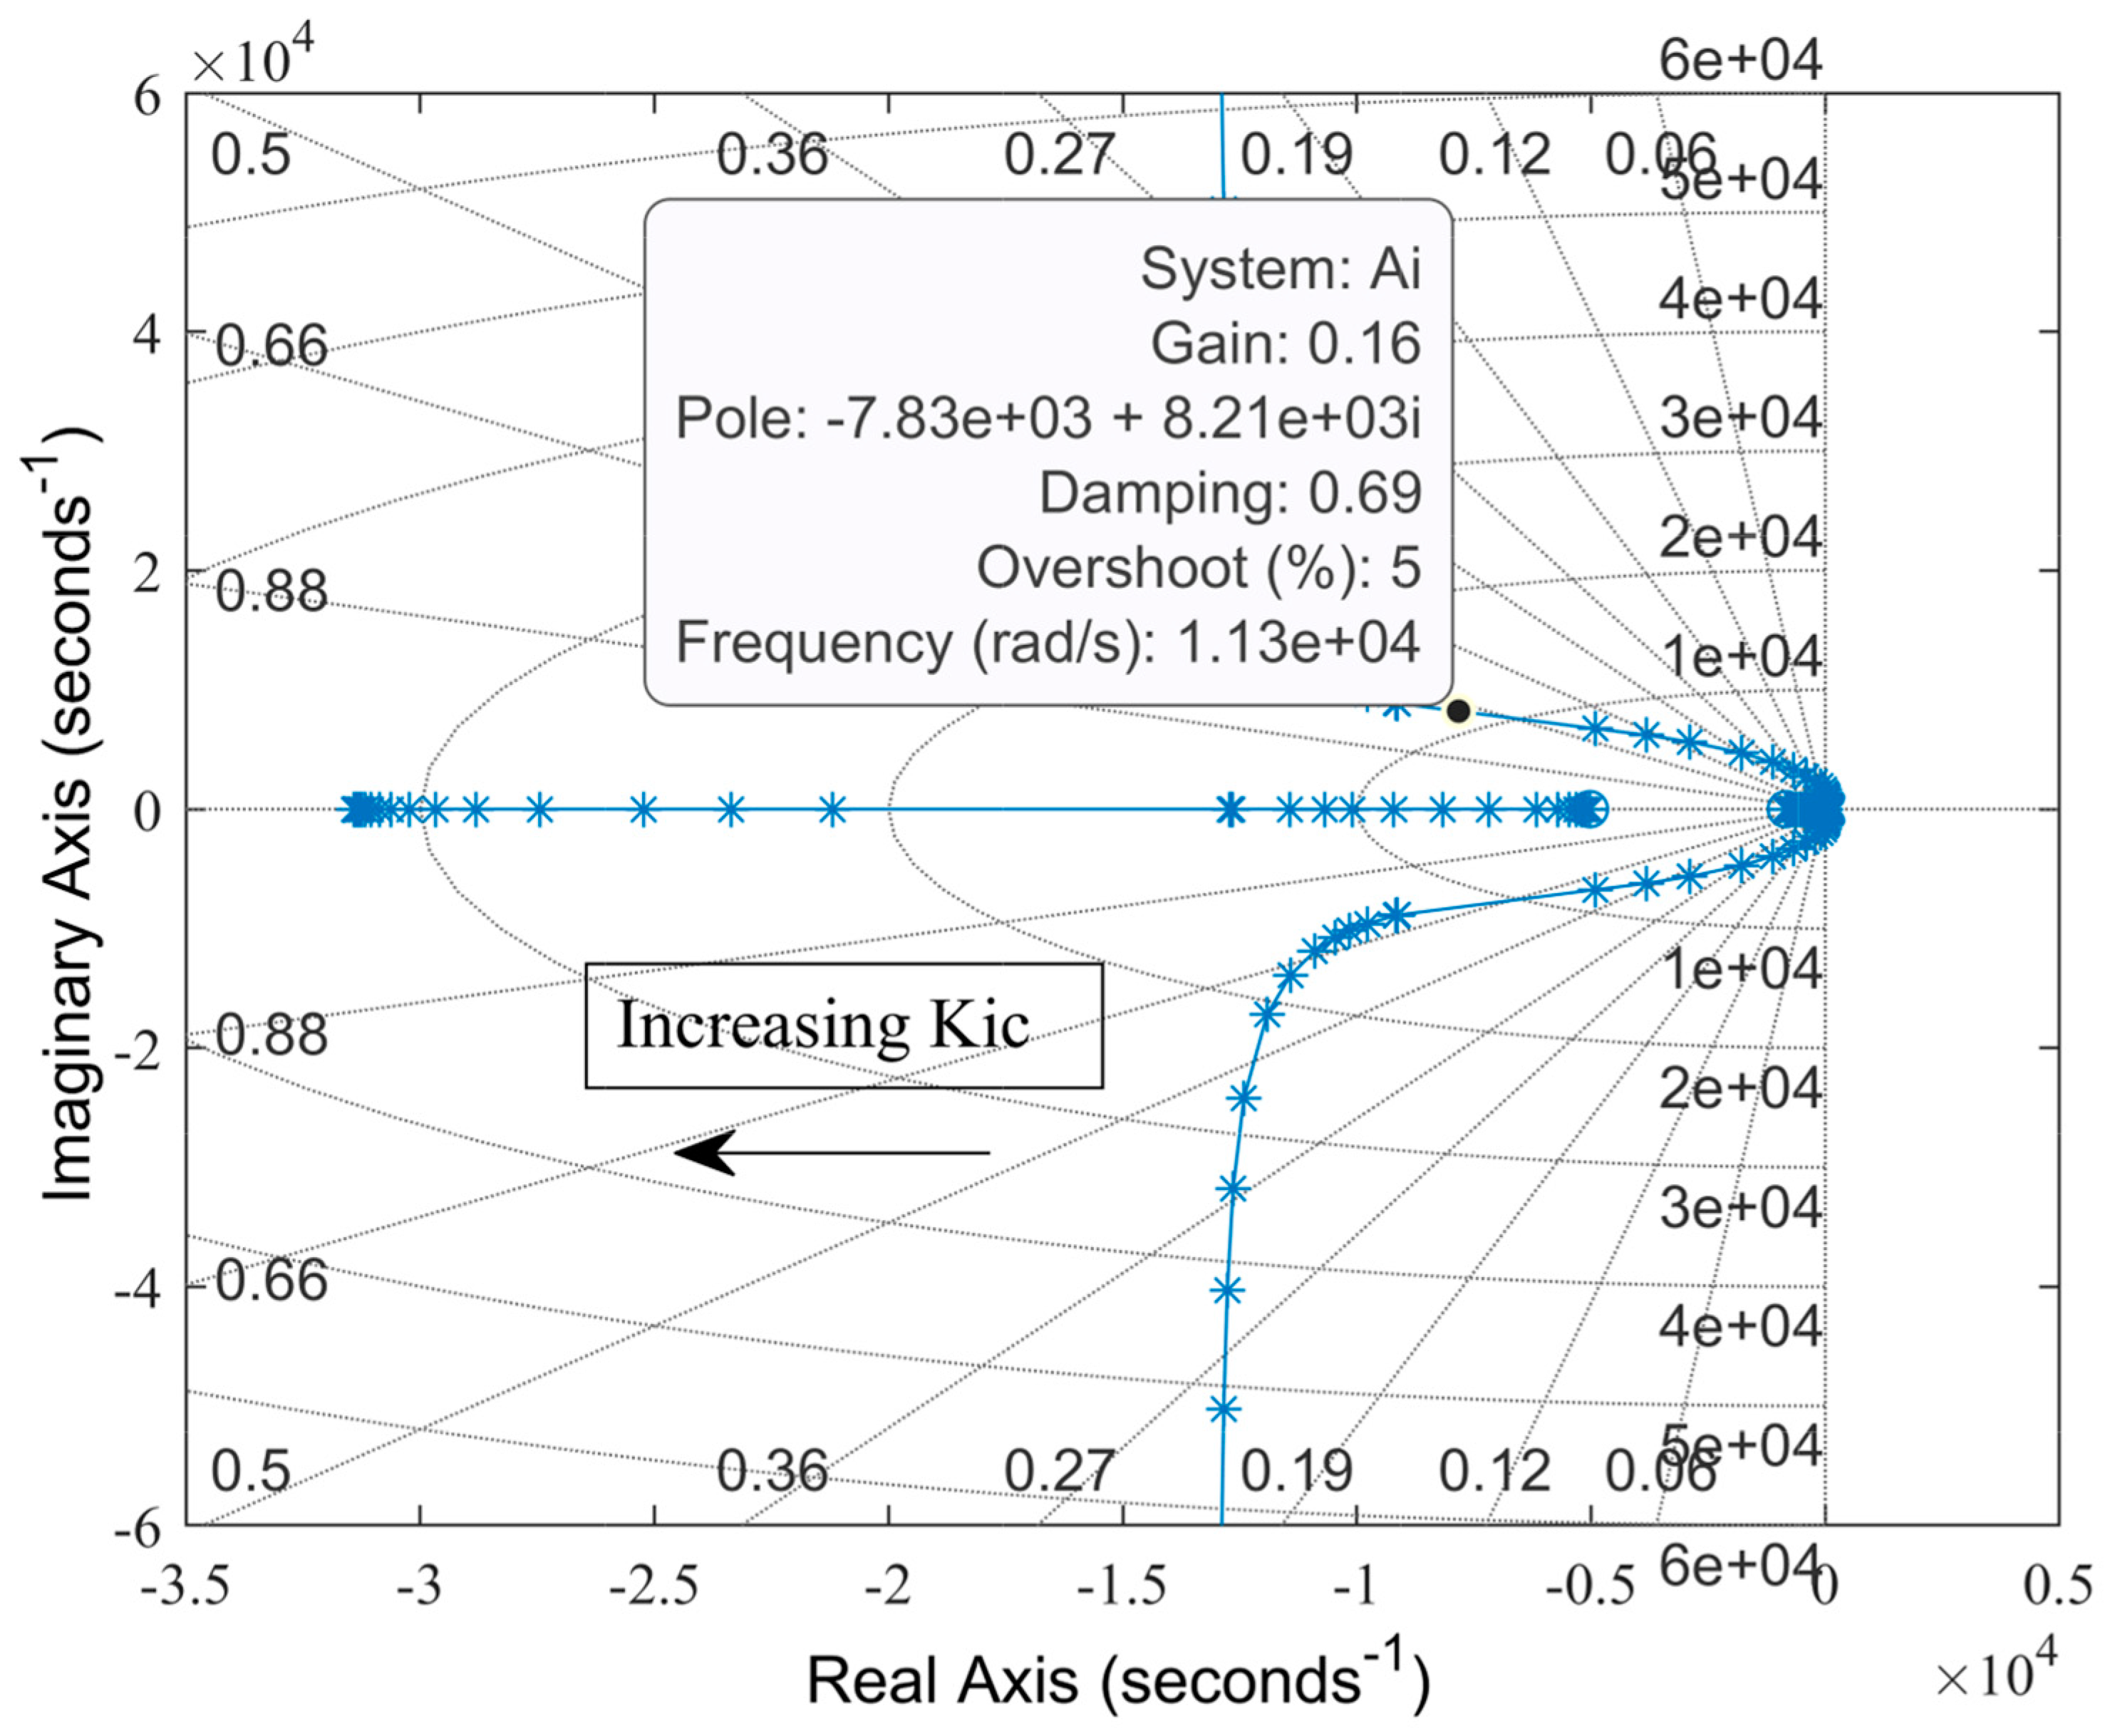
Figure 5.
Root locus for varying current controller gain, Kic.
Figure 5.
Root locus for varying current controller gain, Kic.
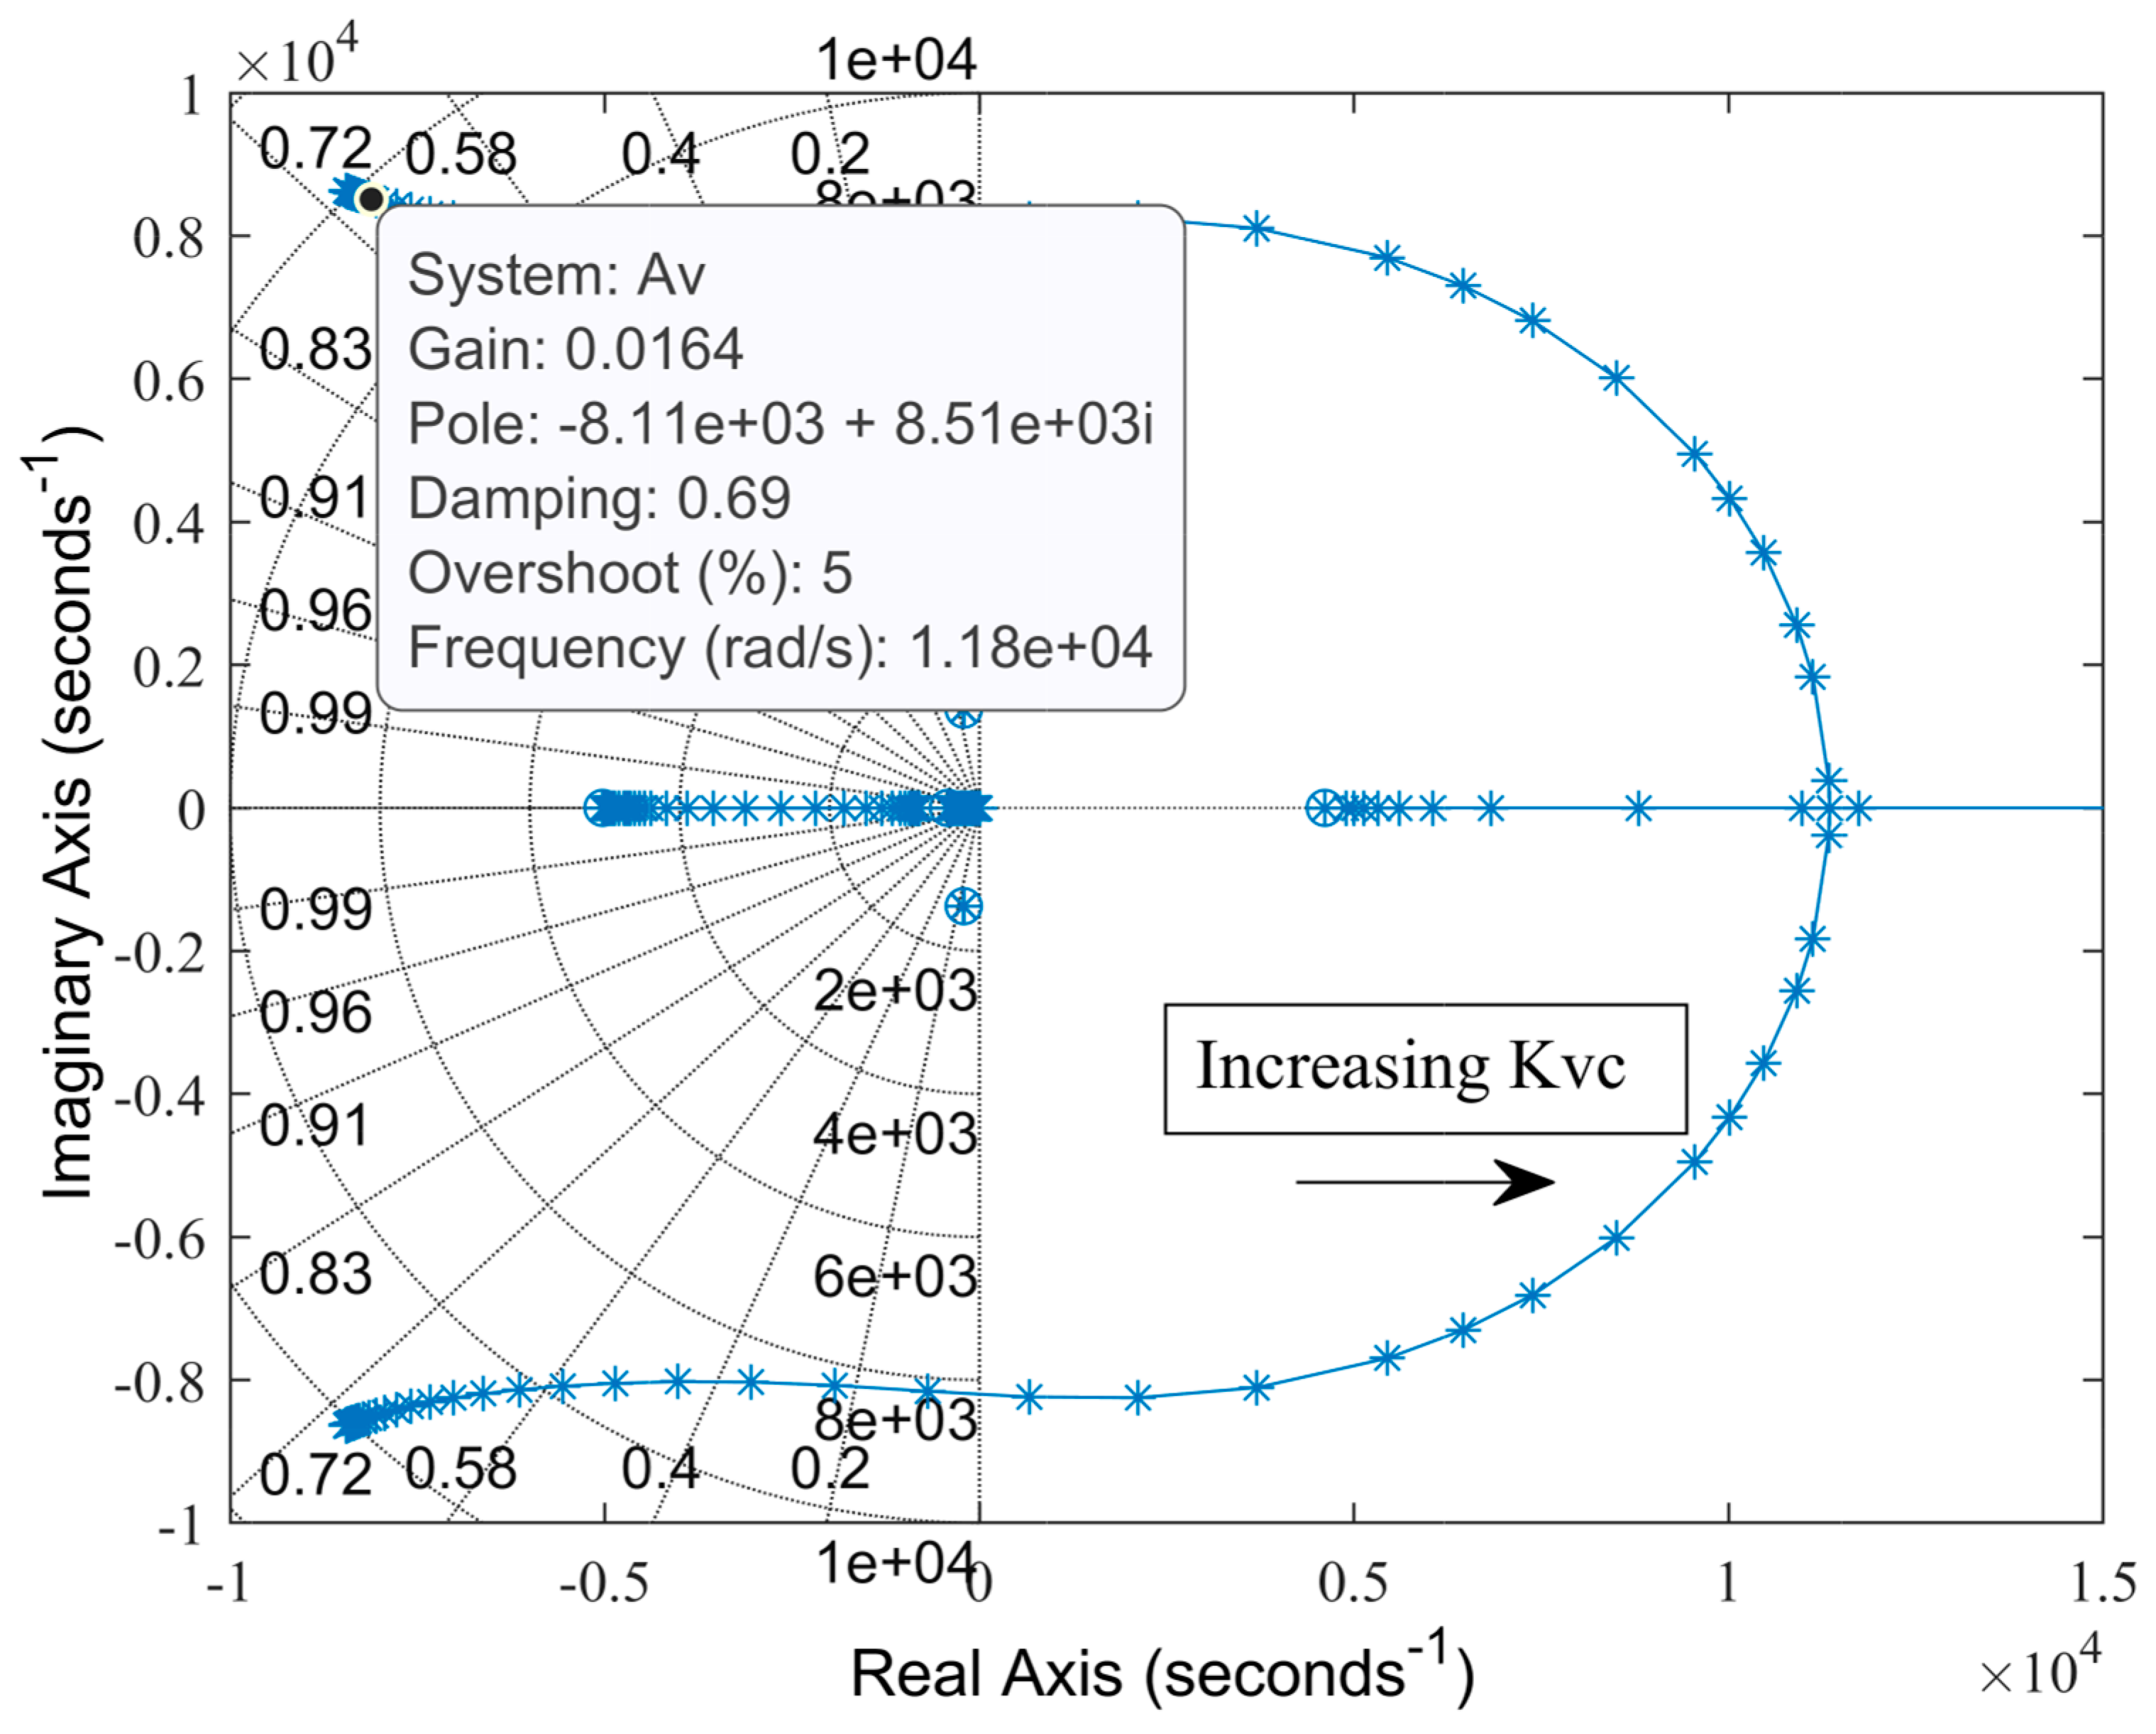
Figure 6.
Root locus for varying voltage controller gain, Kvc.
Figure 6.
Root locus for varying voltage controller gain, Kvc.
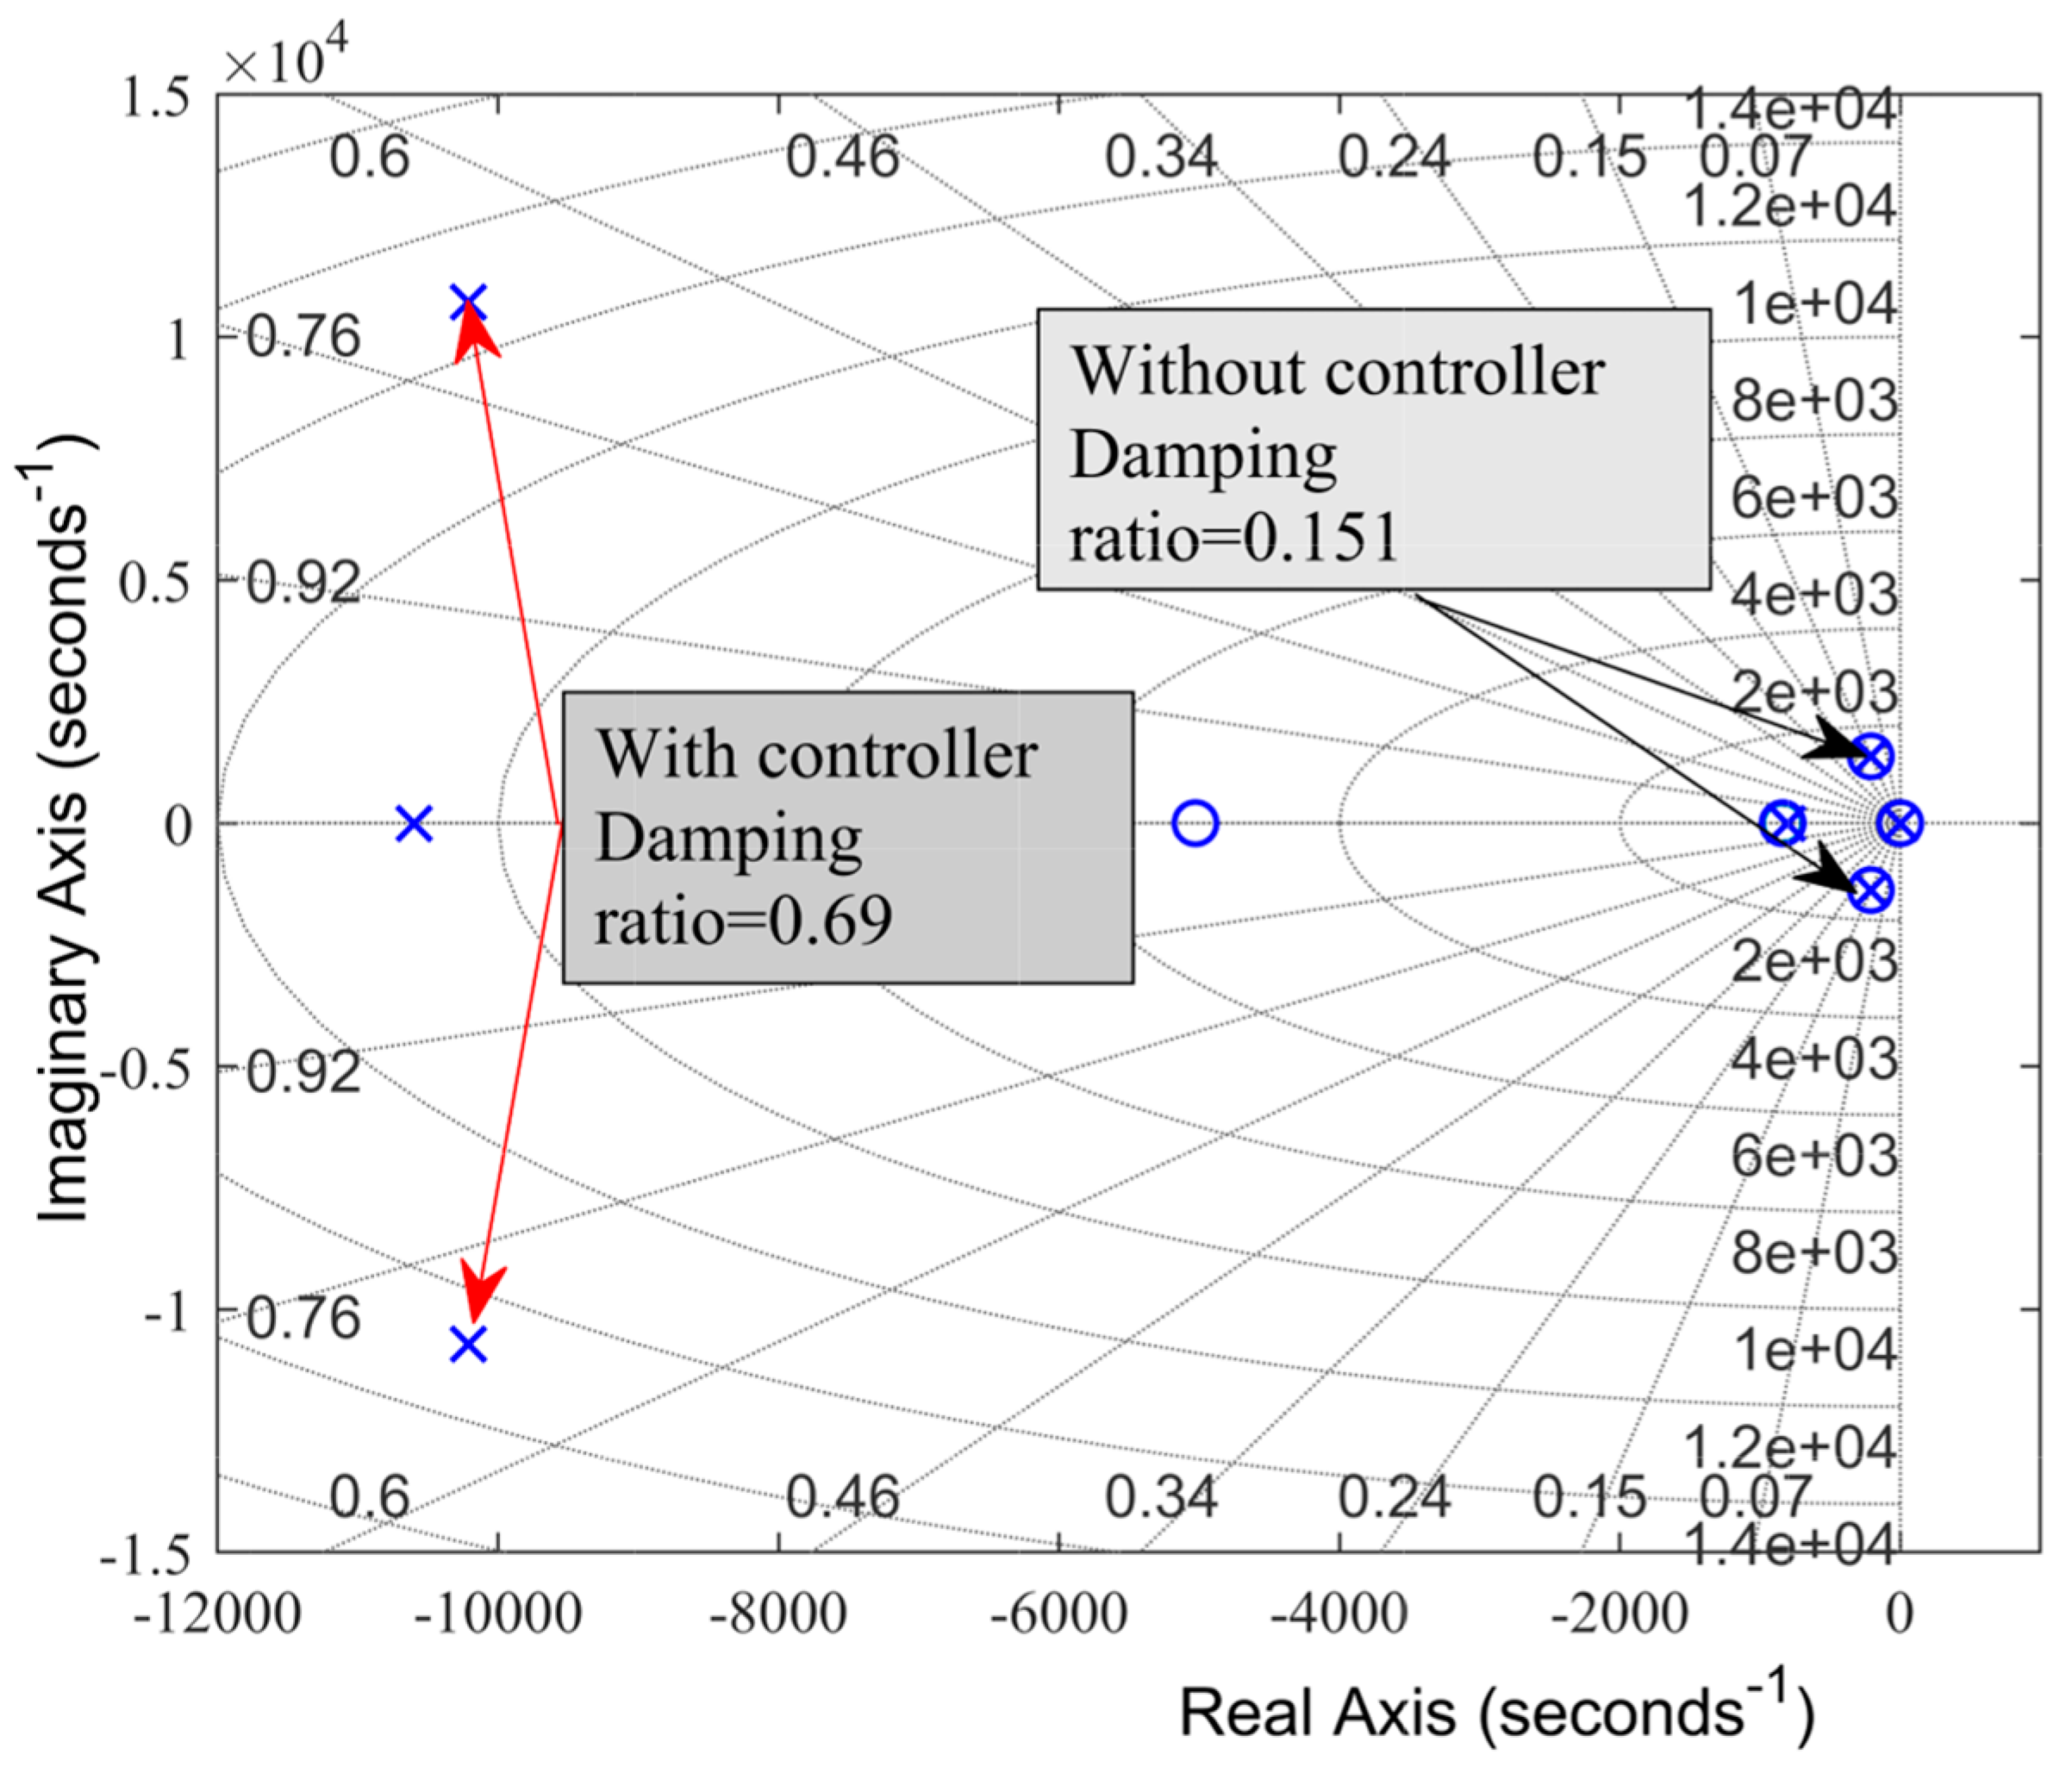
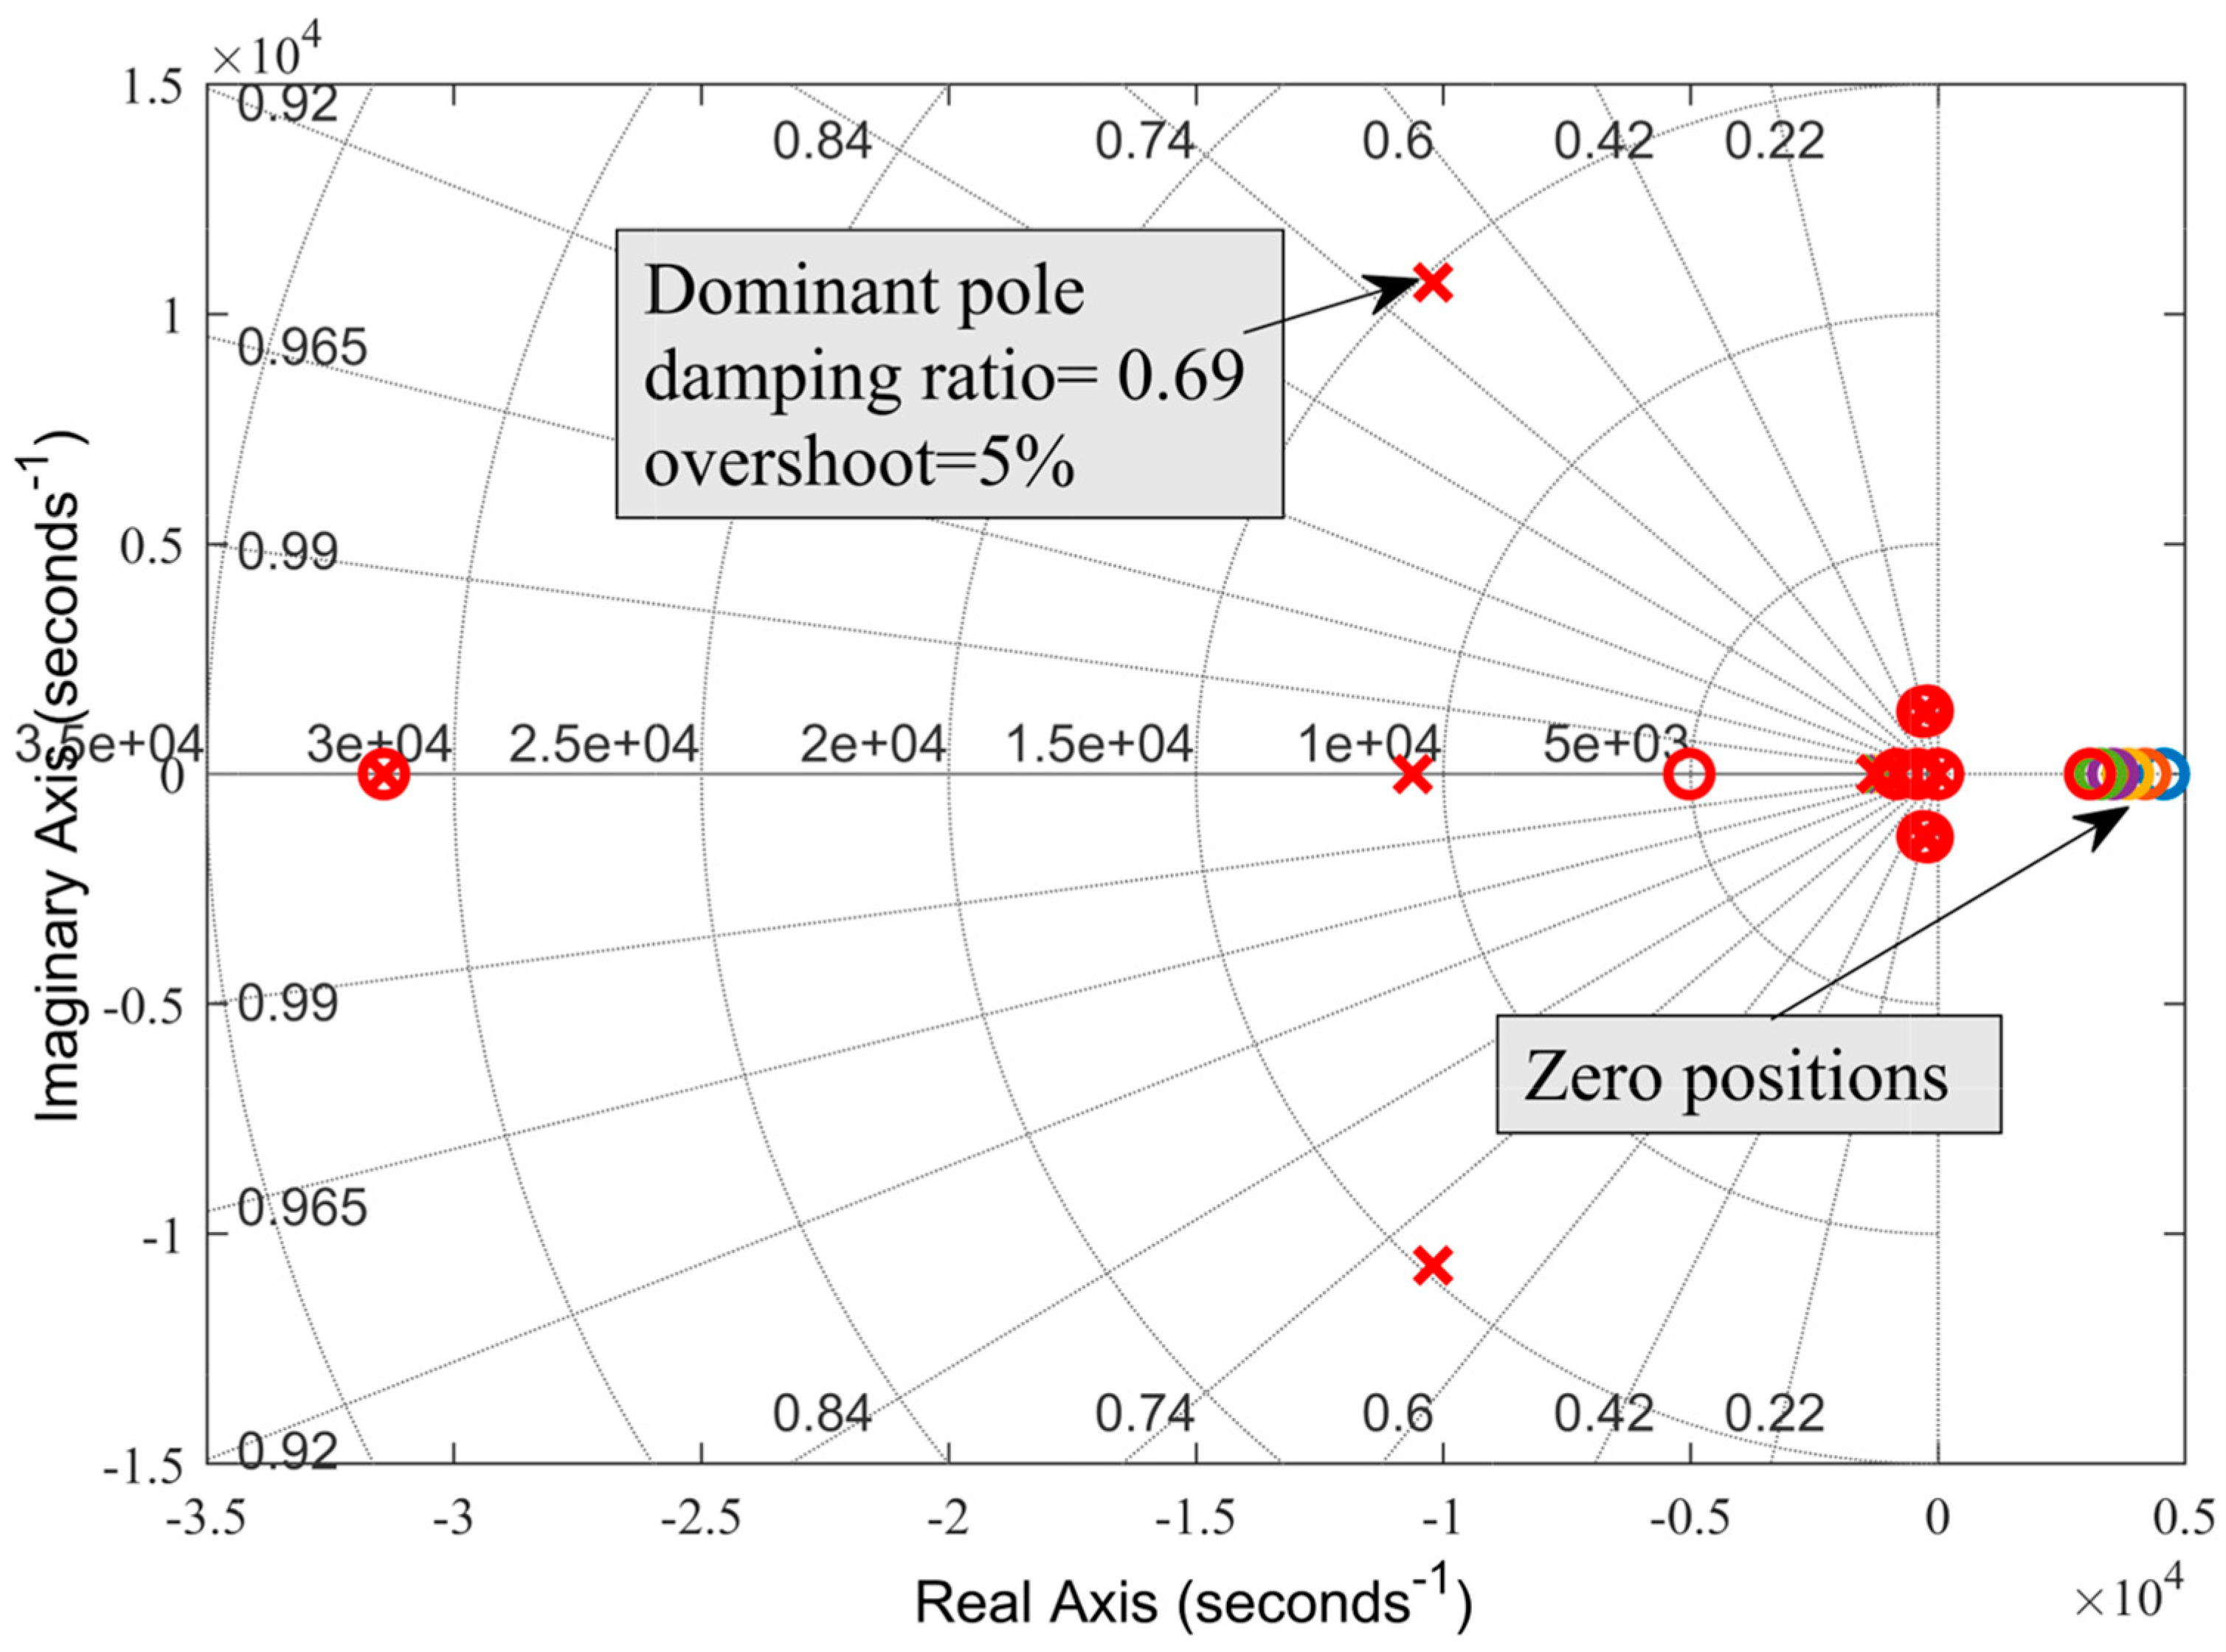
Figure 7.
Locations of dominant poles.
Figure 7.
Locations of dominant poles.
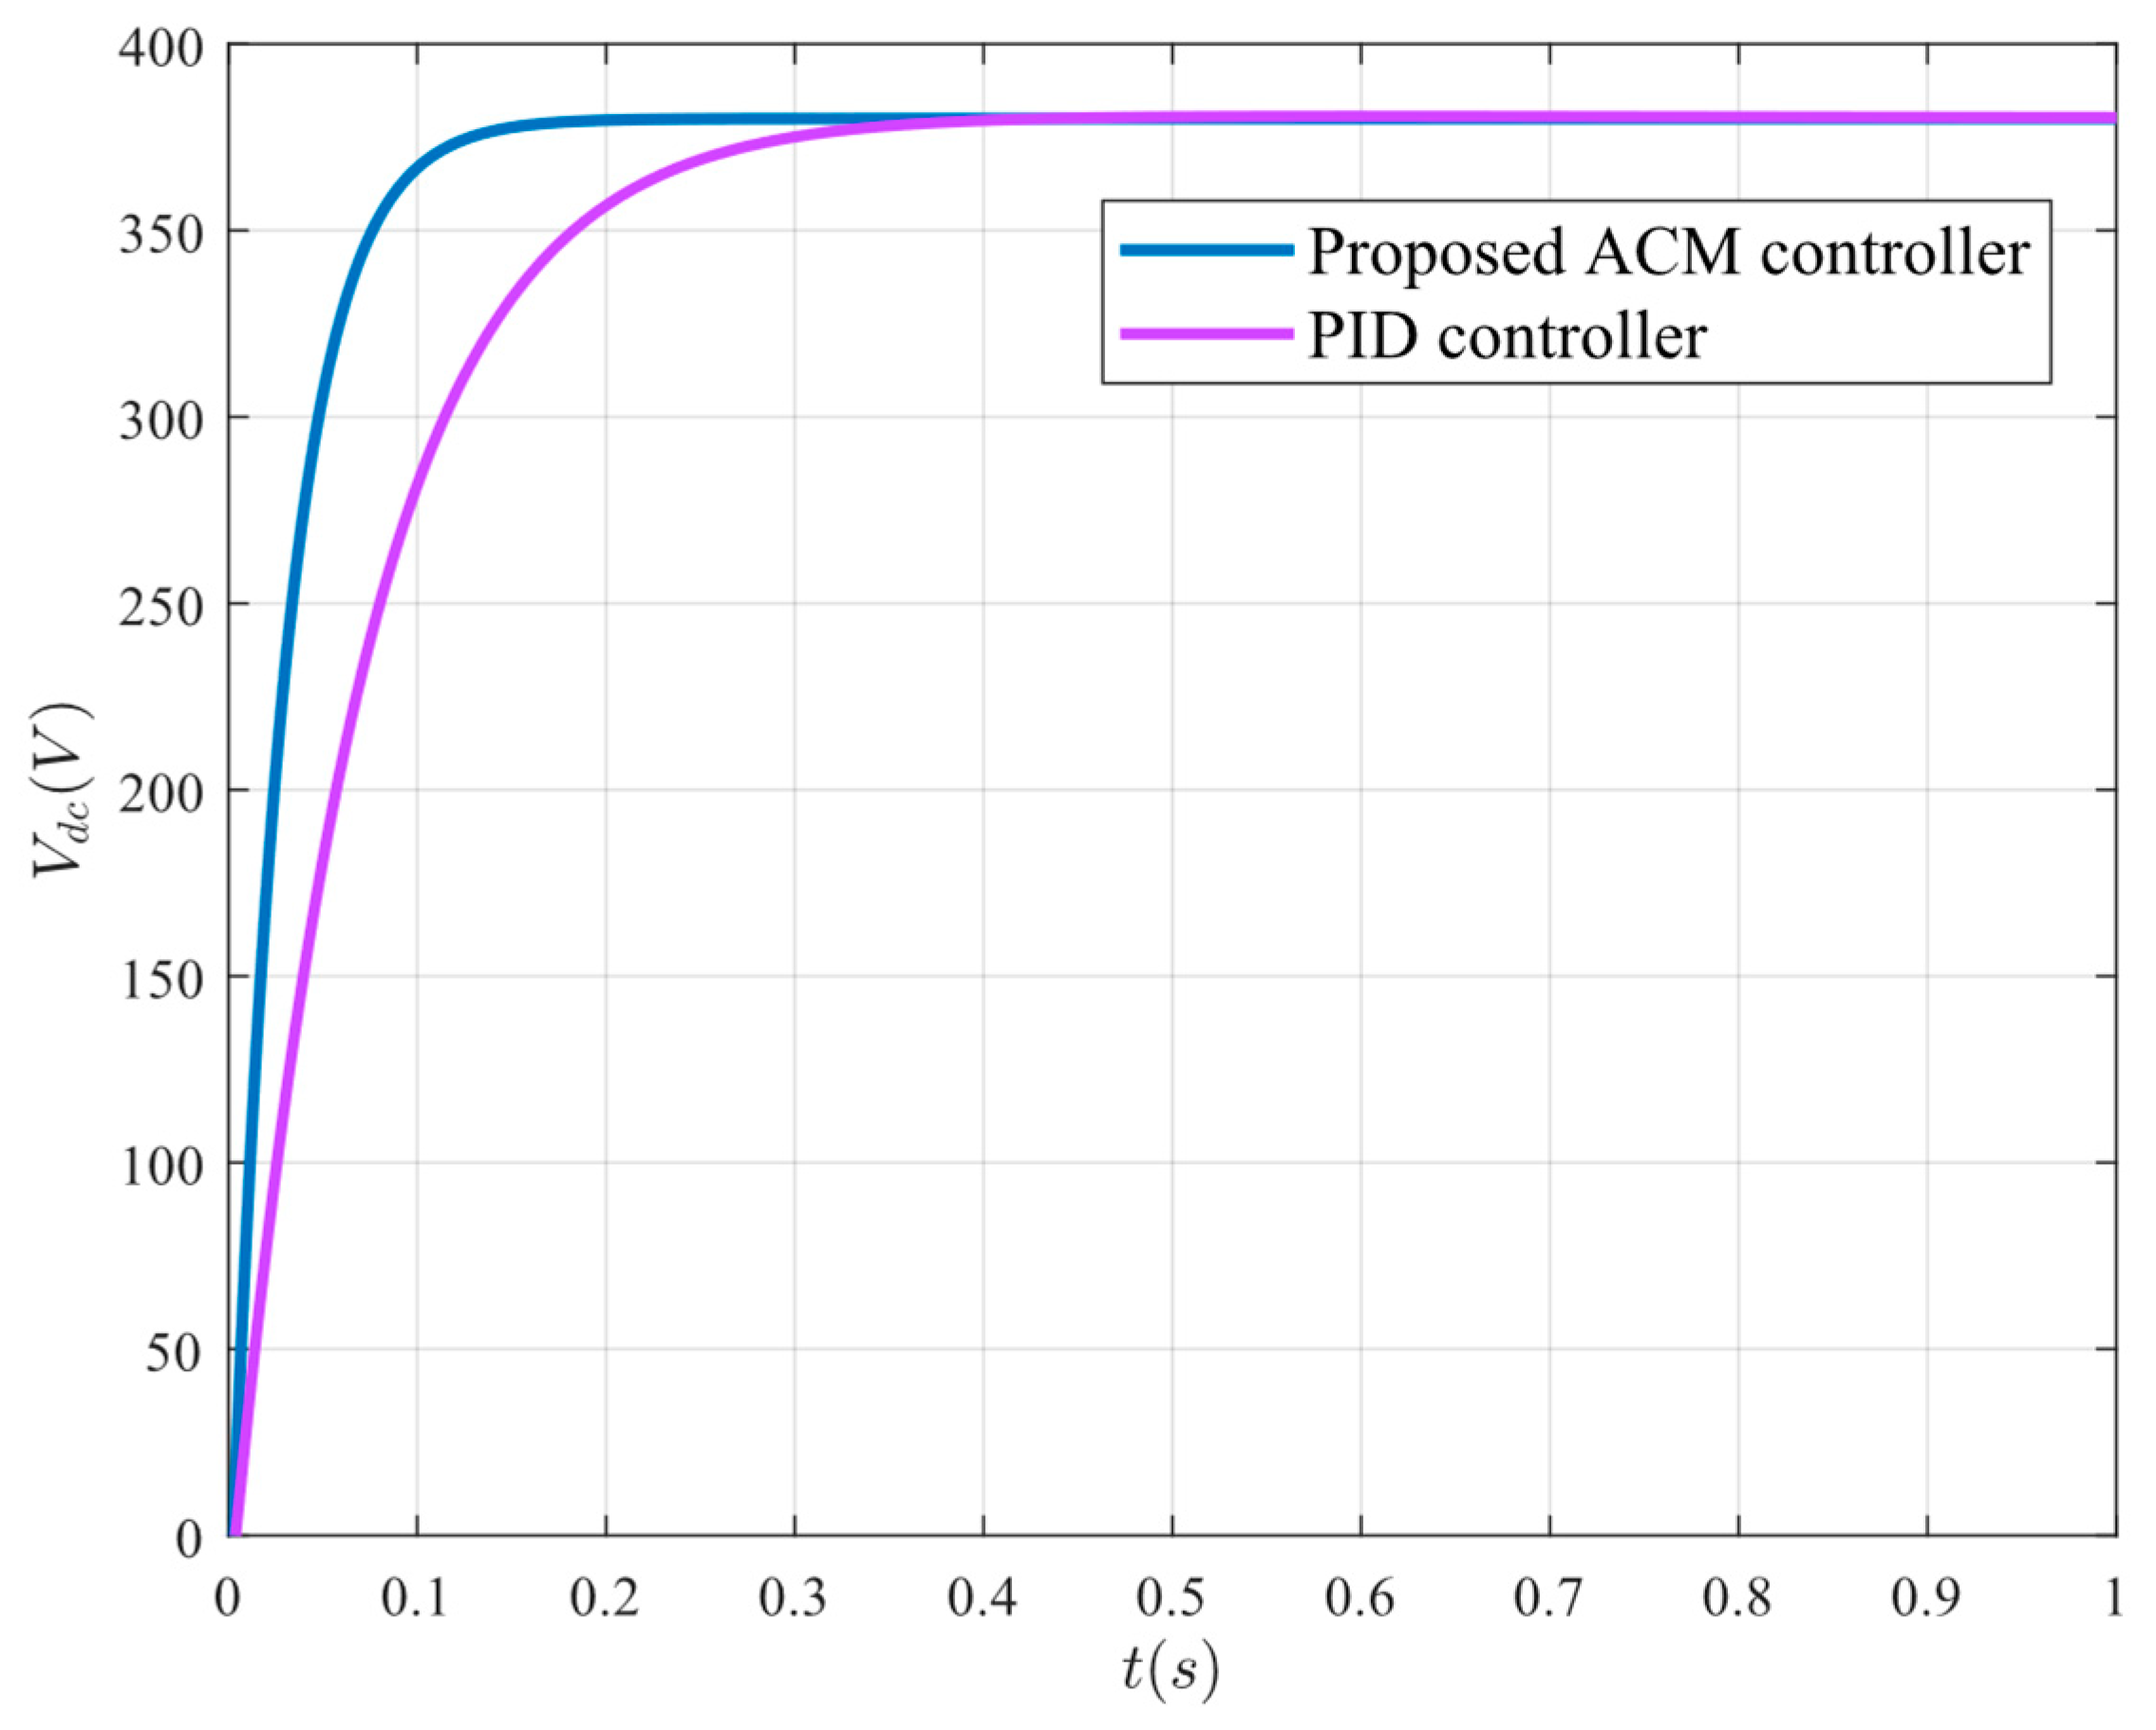
Figure 8.
Transient response comparison between ACM and PID controllers.
Figure 8.
Transient response comparison between ACM and PID controllers.
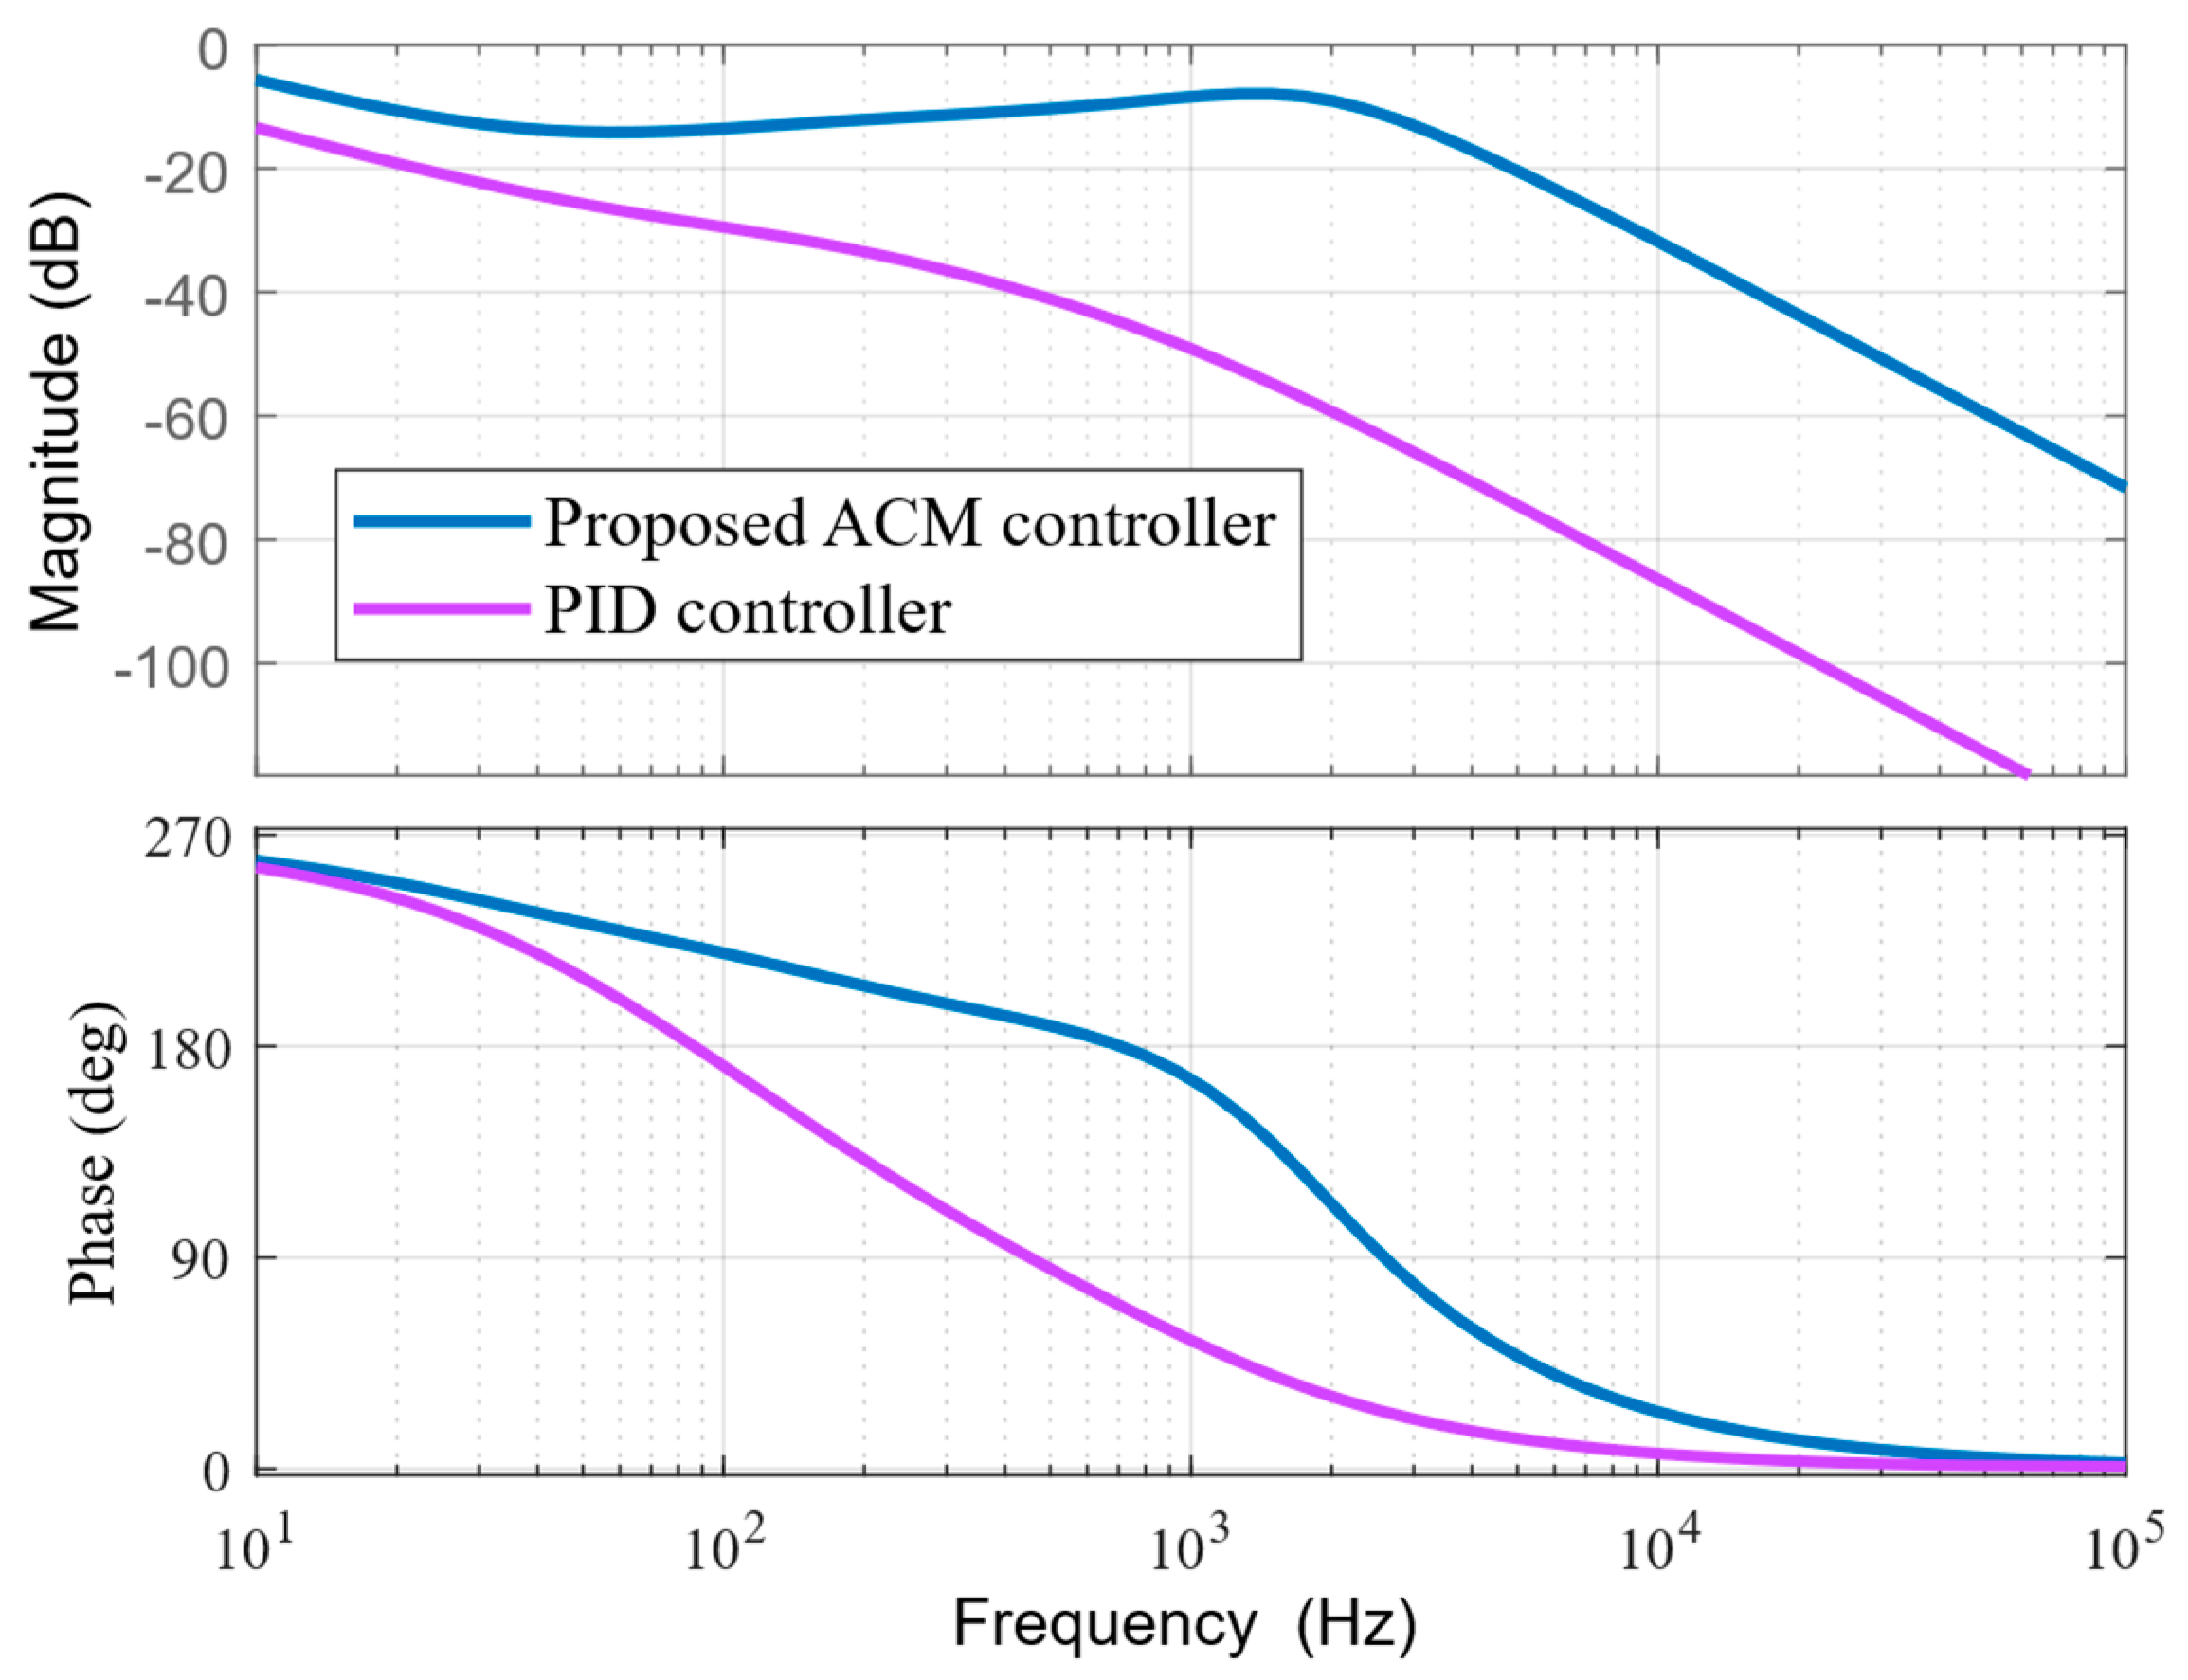
Figure 9.
Frequency response comparison between ACM and PID controllers.
Figure 9.
Frequency response comparison between ACM and PID controllers.
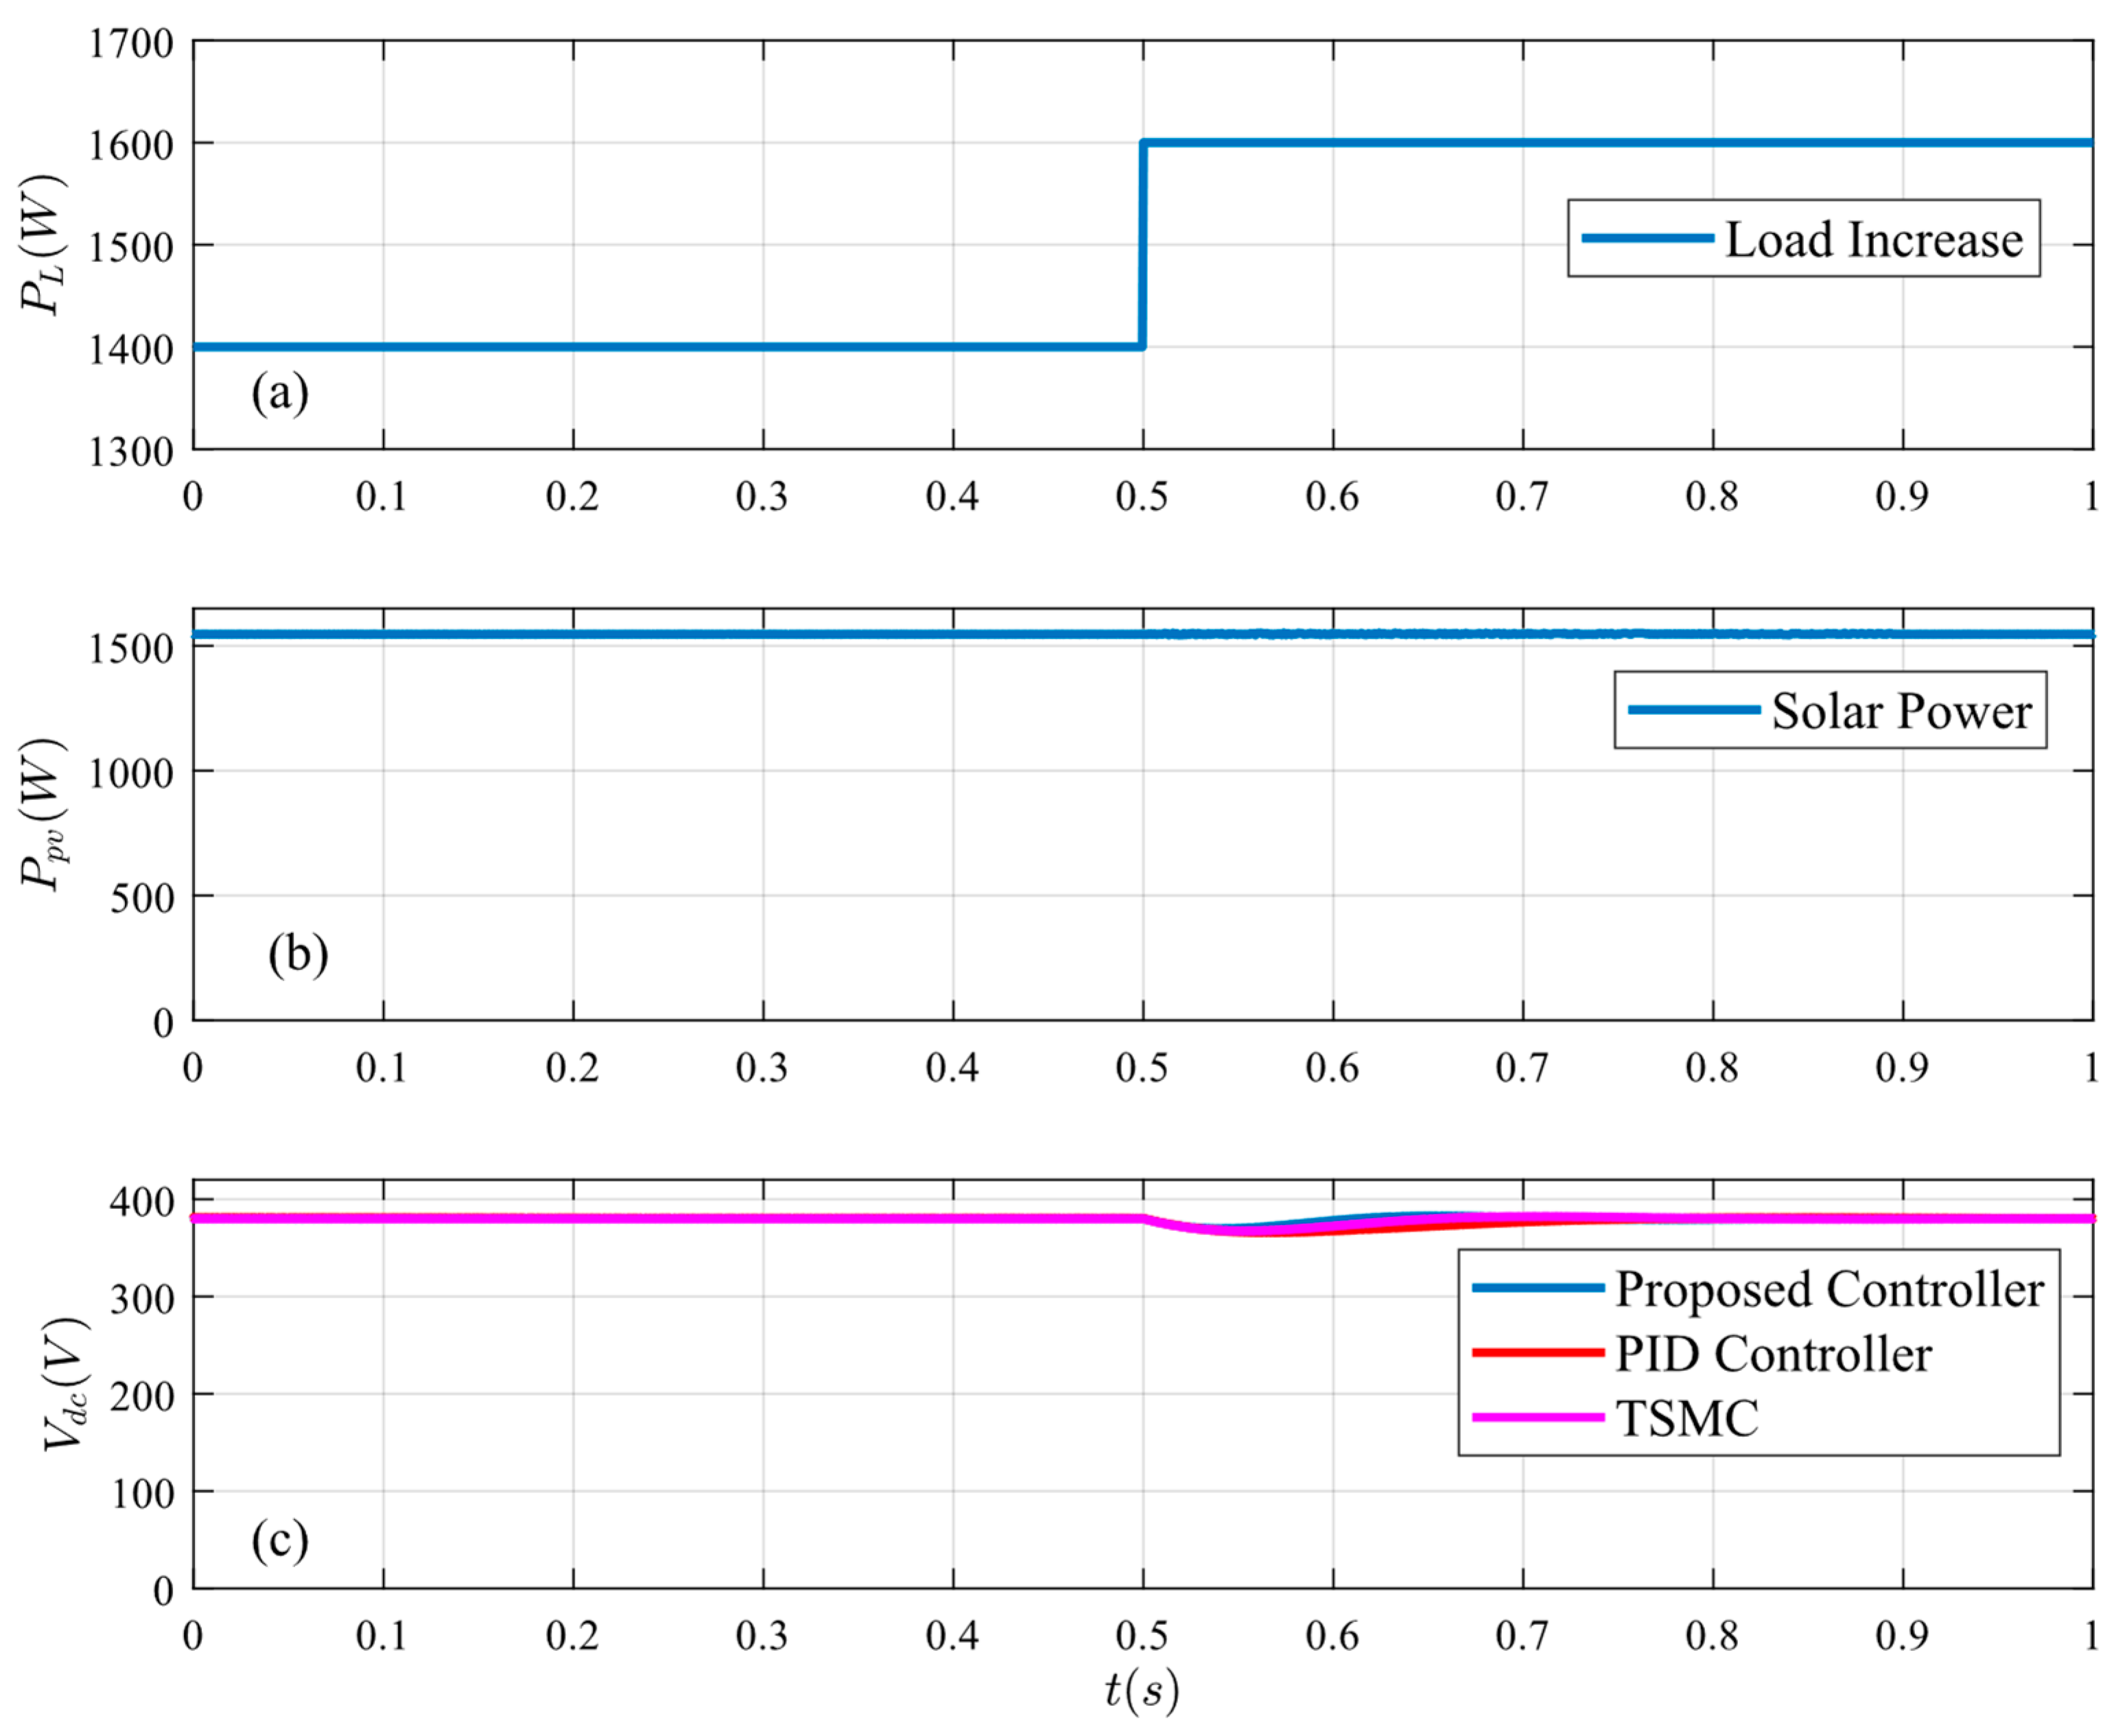
Figure 10.
System response under load increase: (a) load power, (b) PV power, and (c) bus voltage.
Figure 10.
System response under load increase: (a) load power, (b) PV power, and (c) bus voltage.
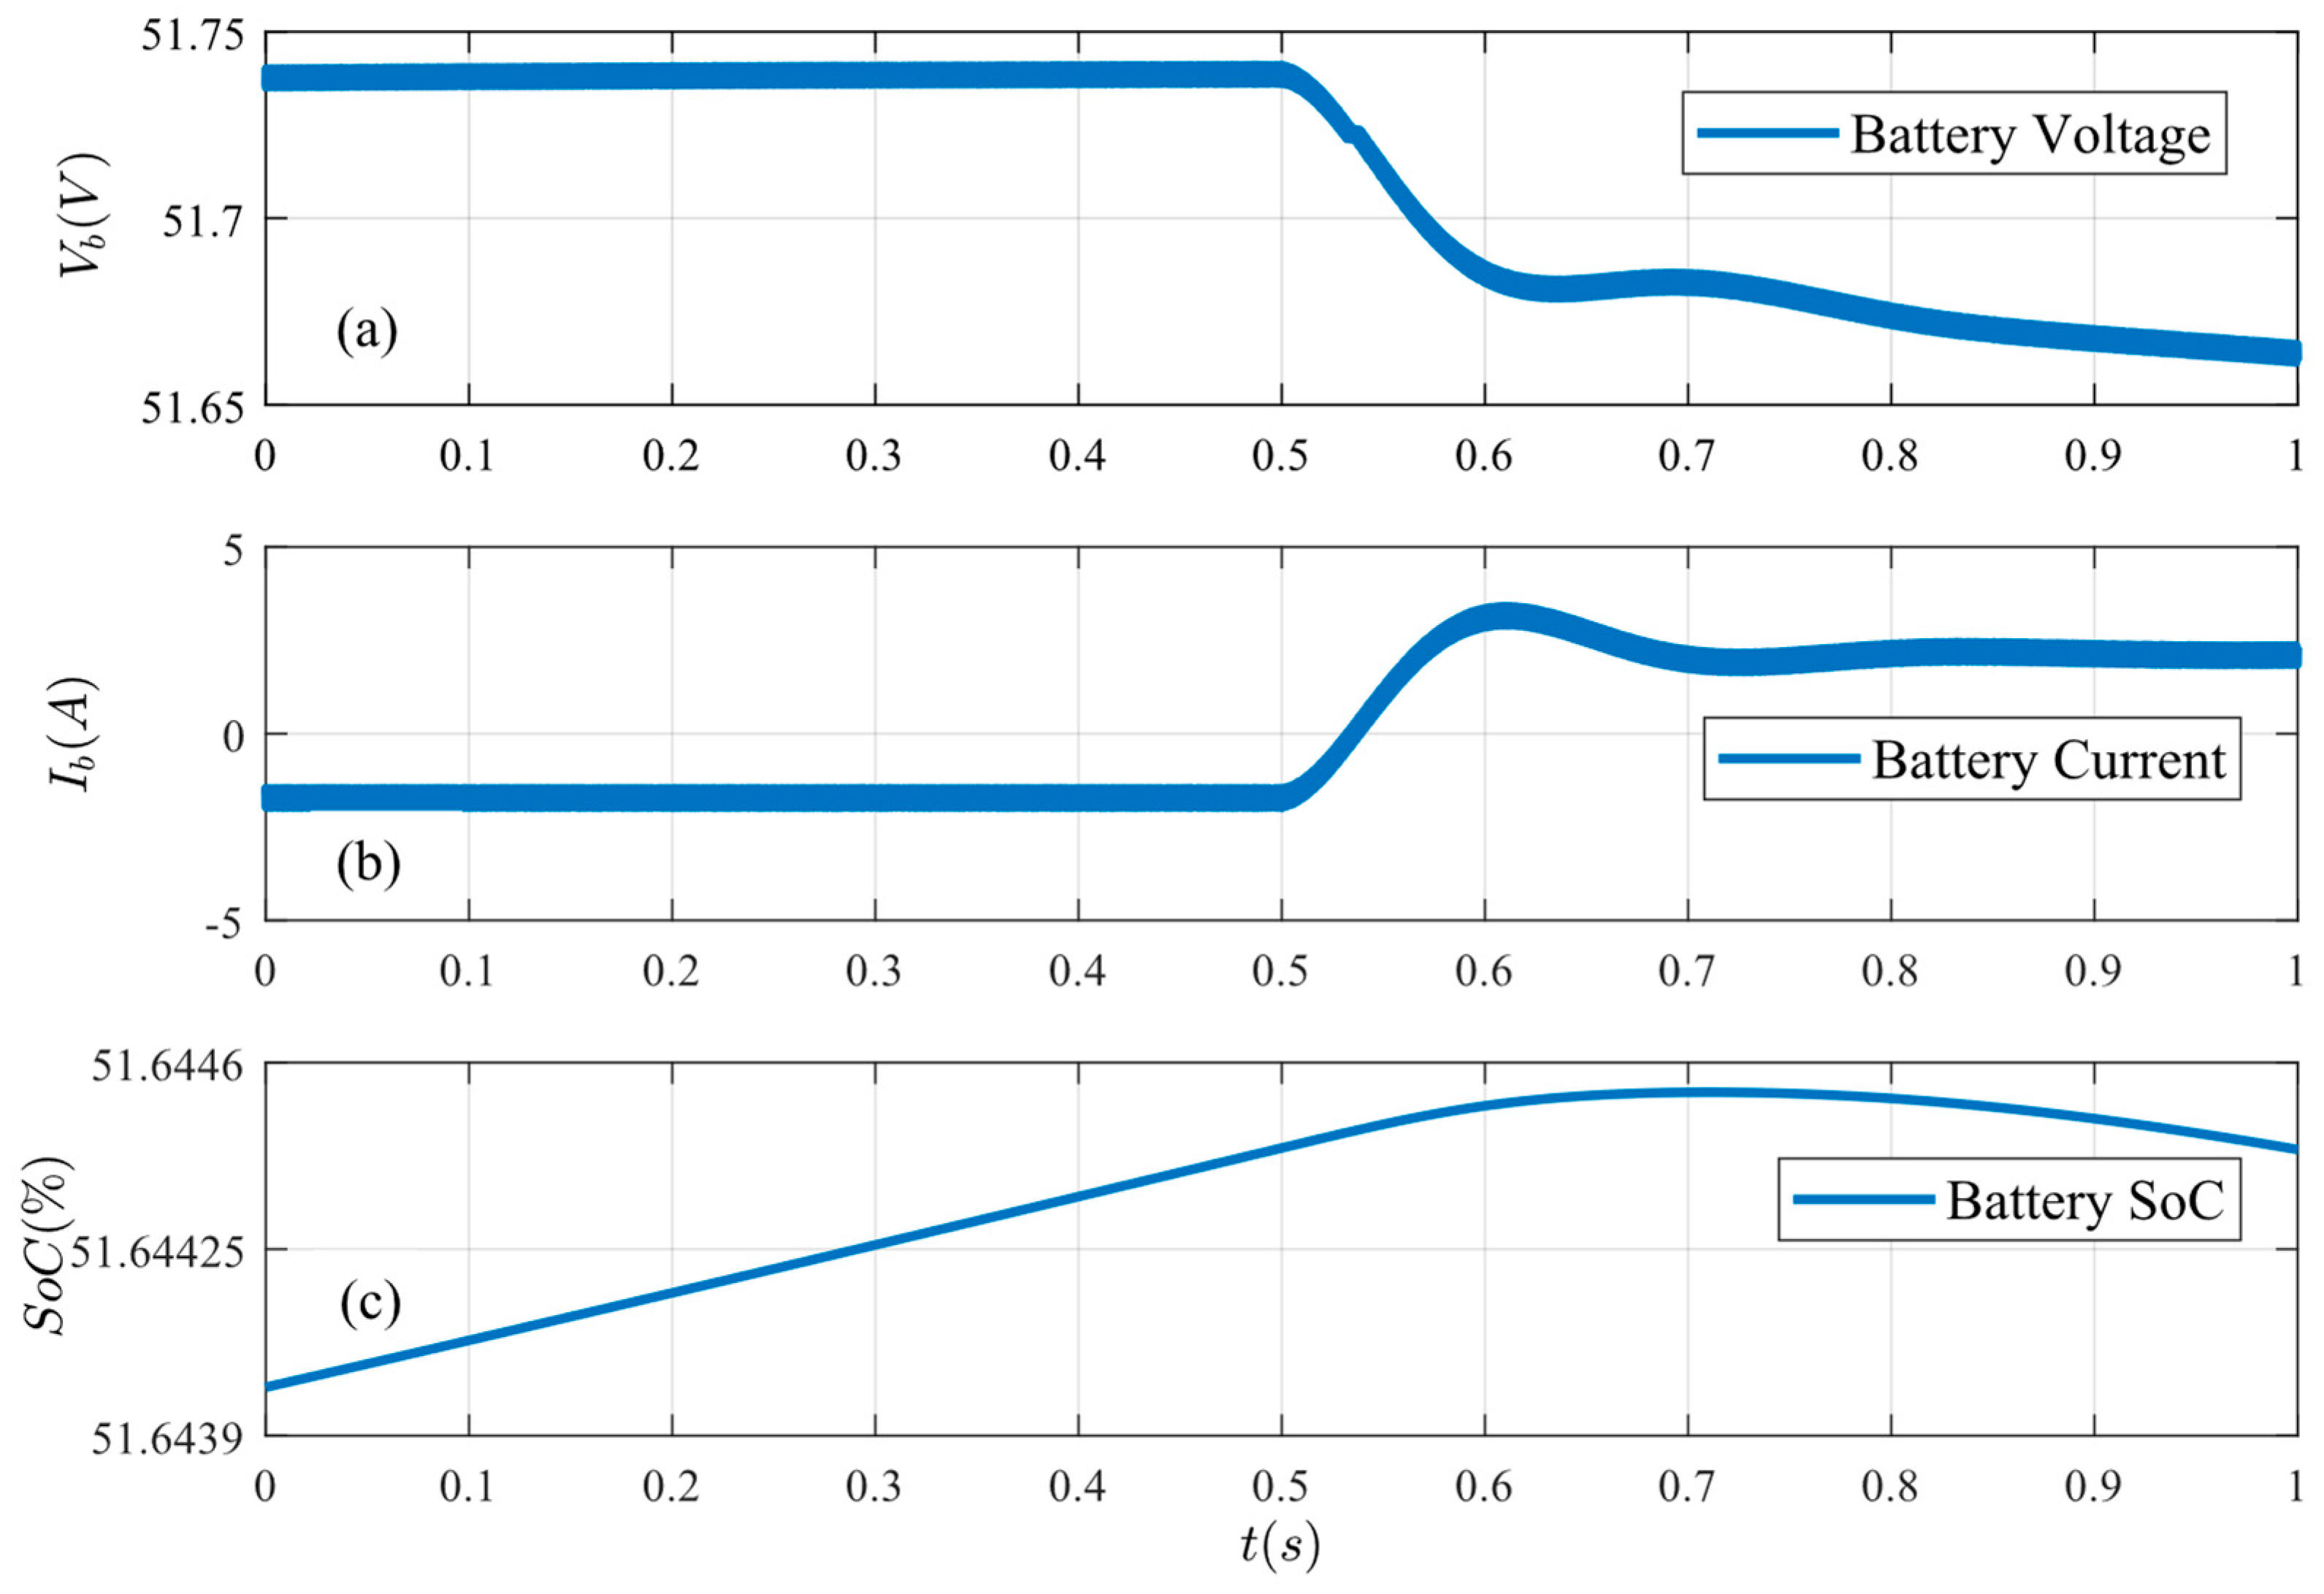
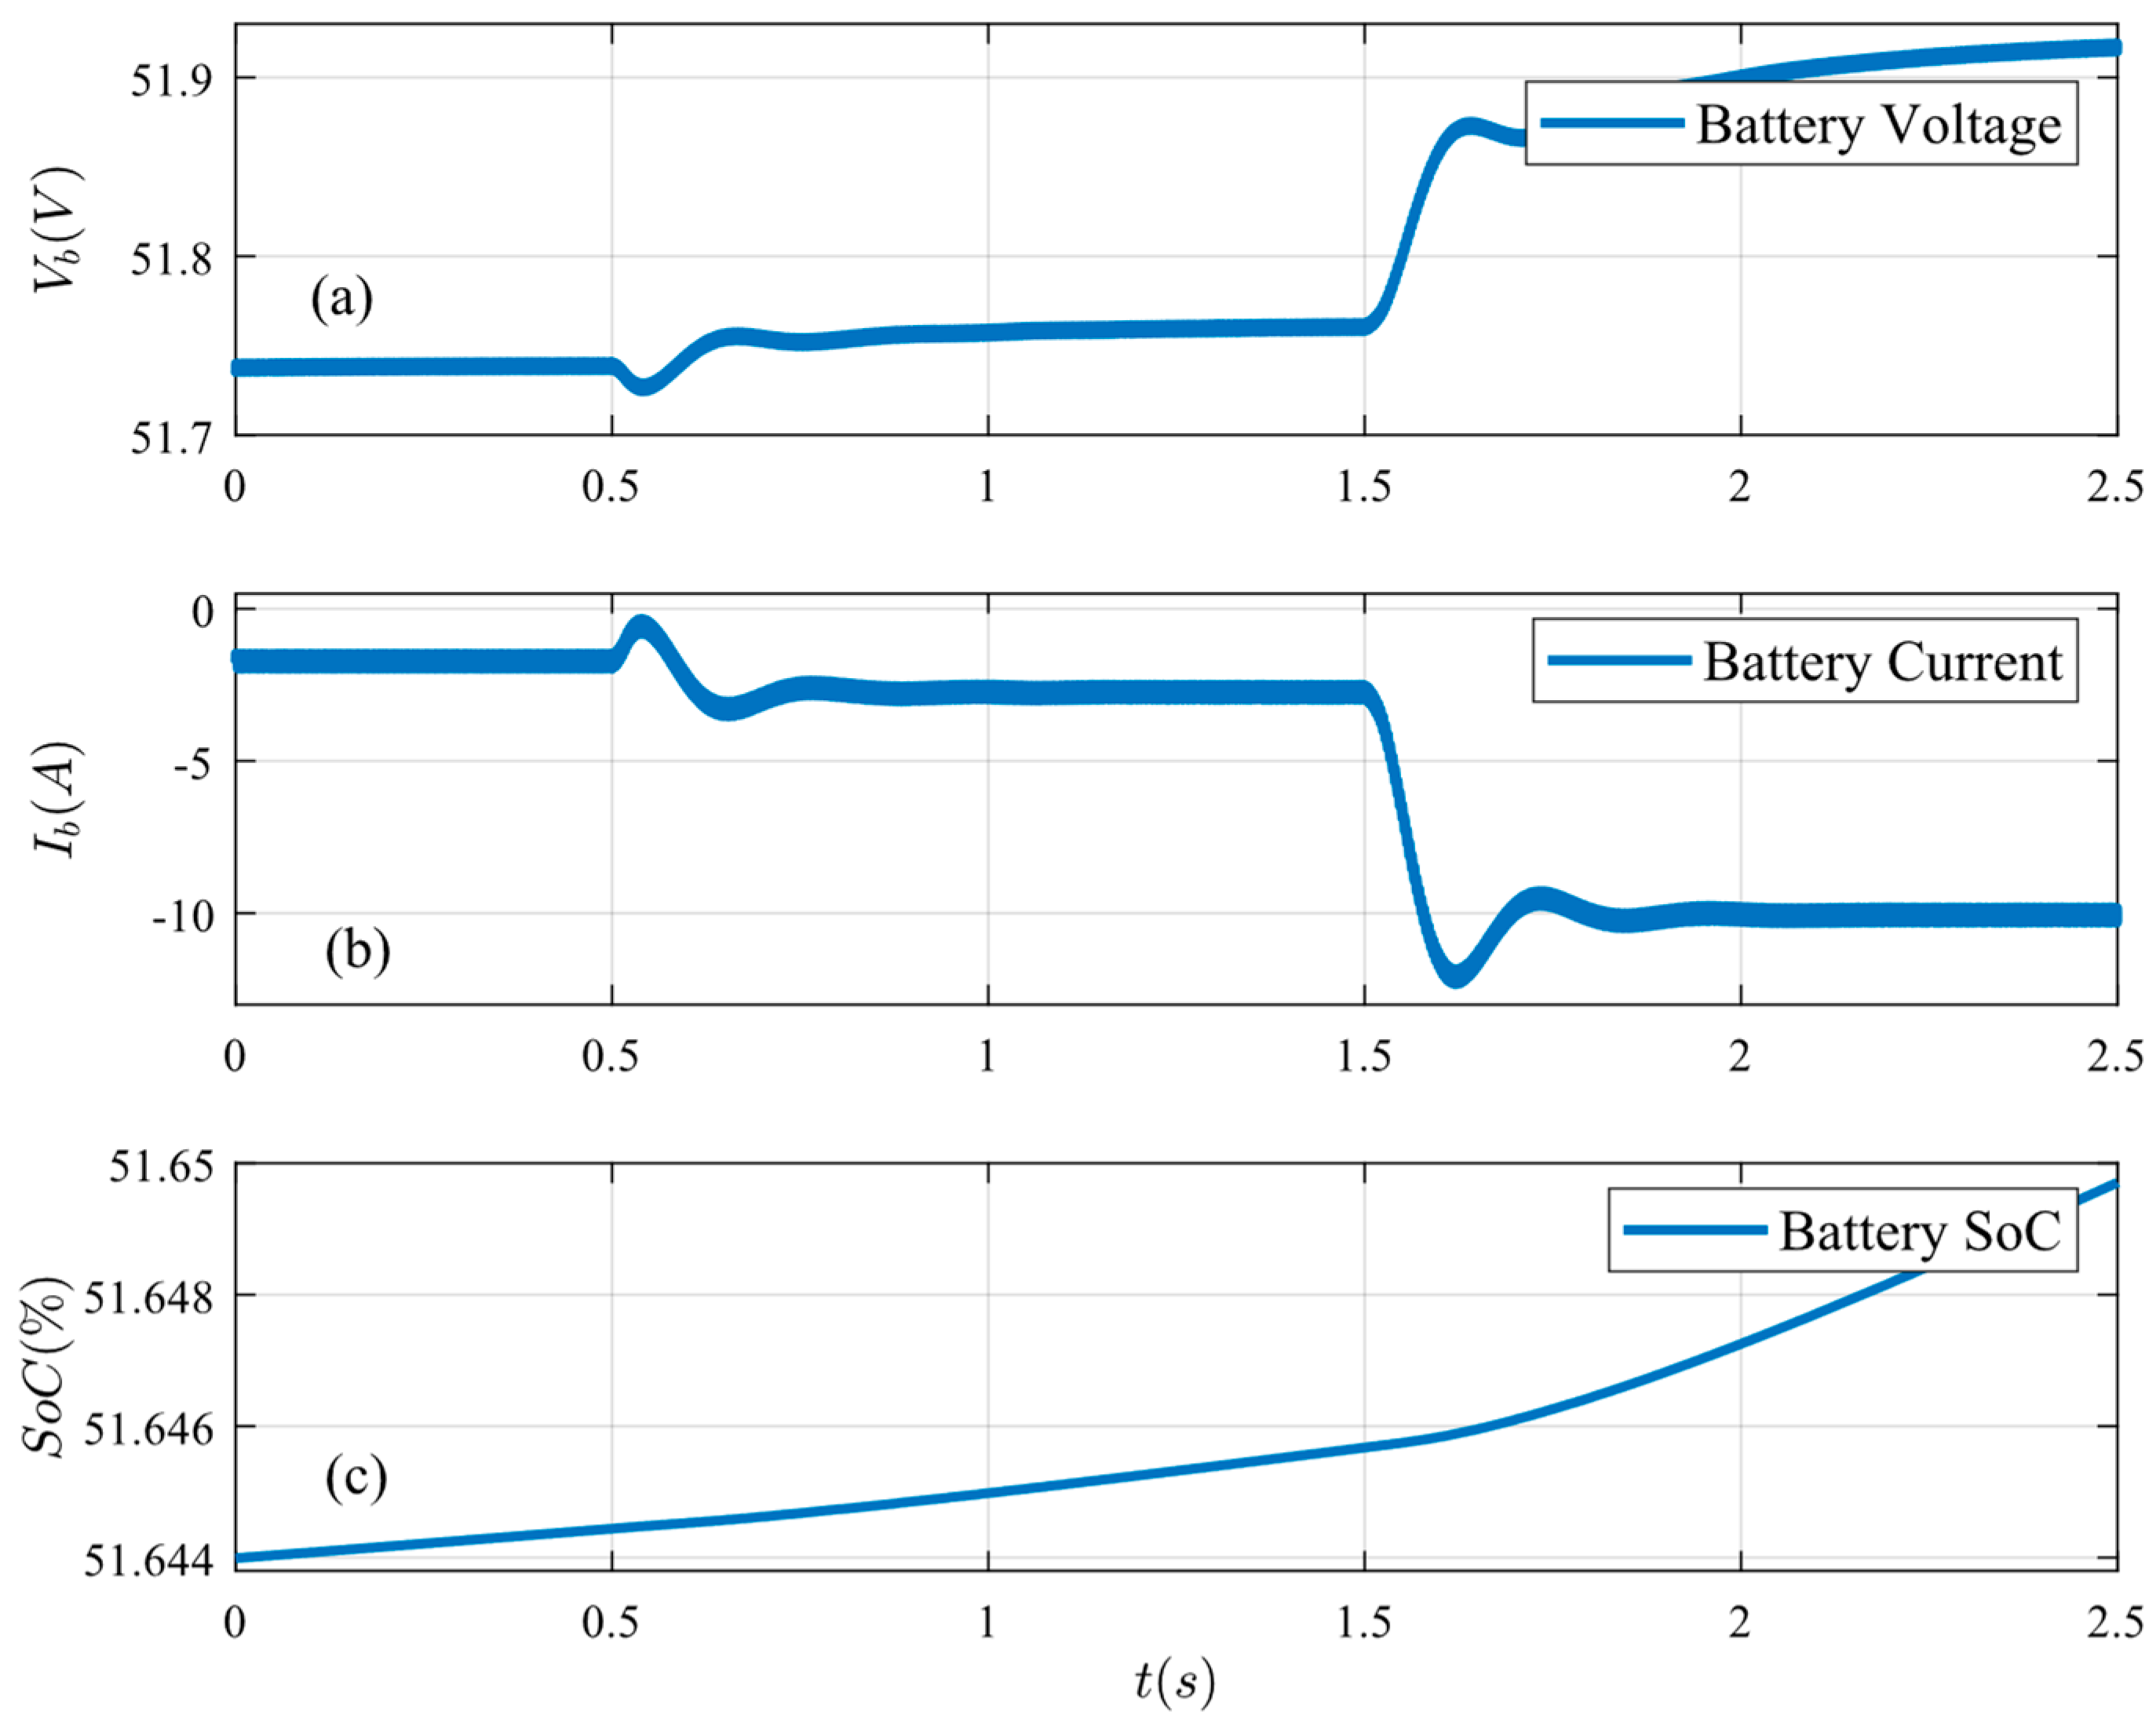
Figure 11.
Battery conditions under load increase: (a) battery voltage, (b) battery current, and (c) battery SoC.
Figure 11.
Battery conditions under load increase: (a) battery voltage, (b) battery current, and (c) battery SoC.
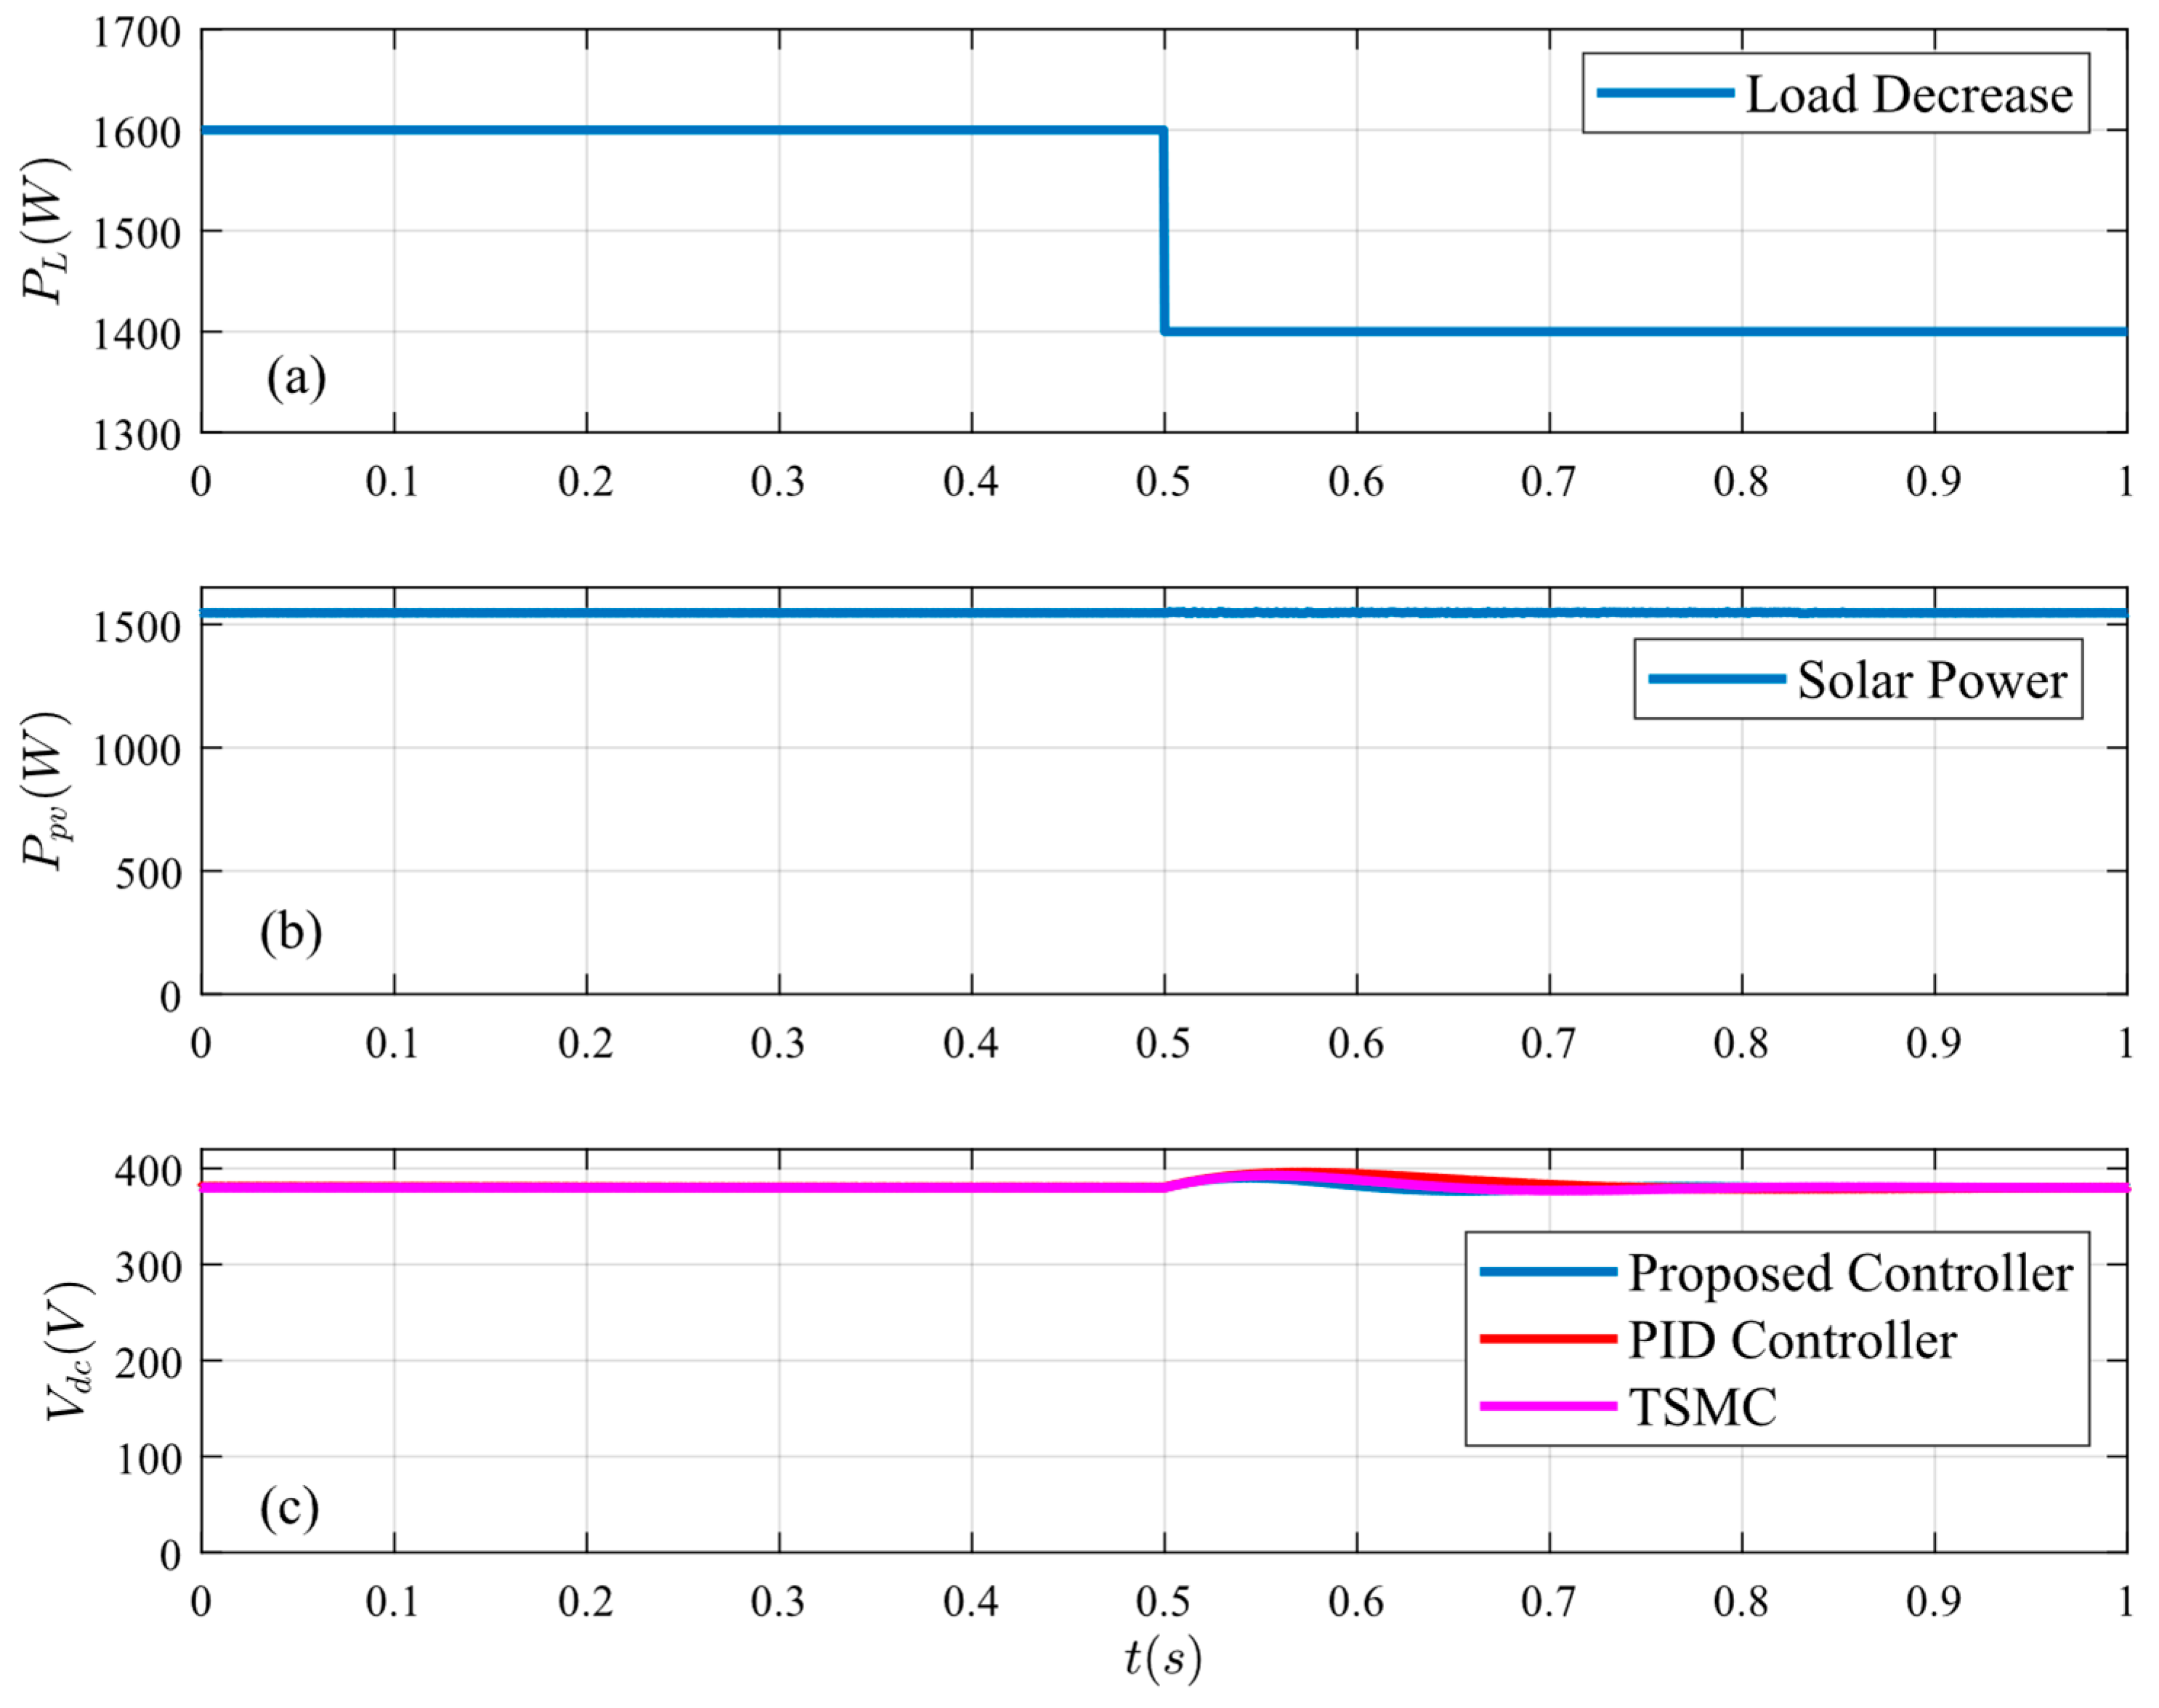
Figure 12.
System response under load decrease: (a) load power, (b) PV power, and (c) bus voltage.
Figure 12.
System response under load decrease: (a) load power, (b) PV power, and (c) bus voltage.
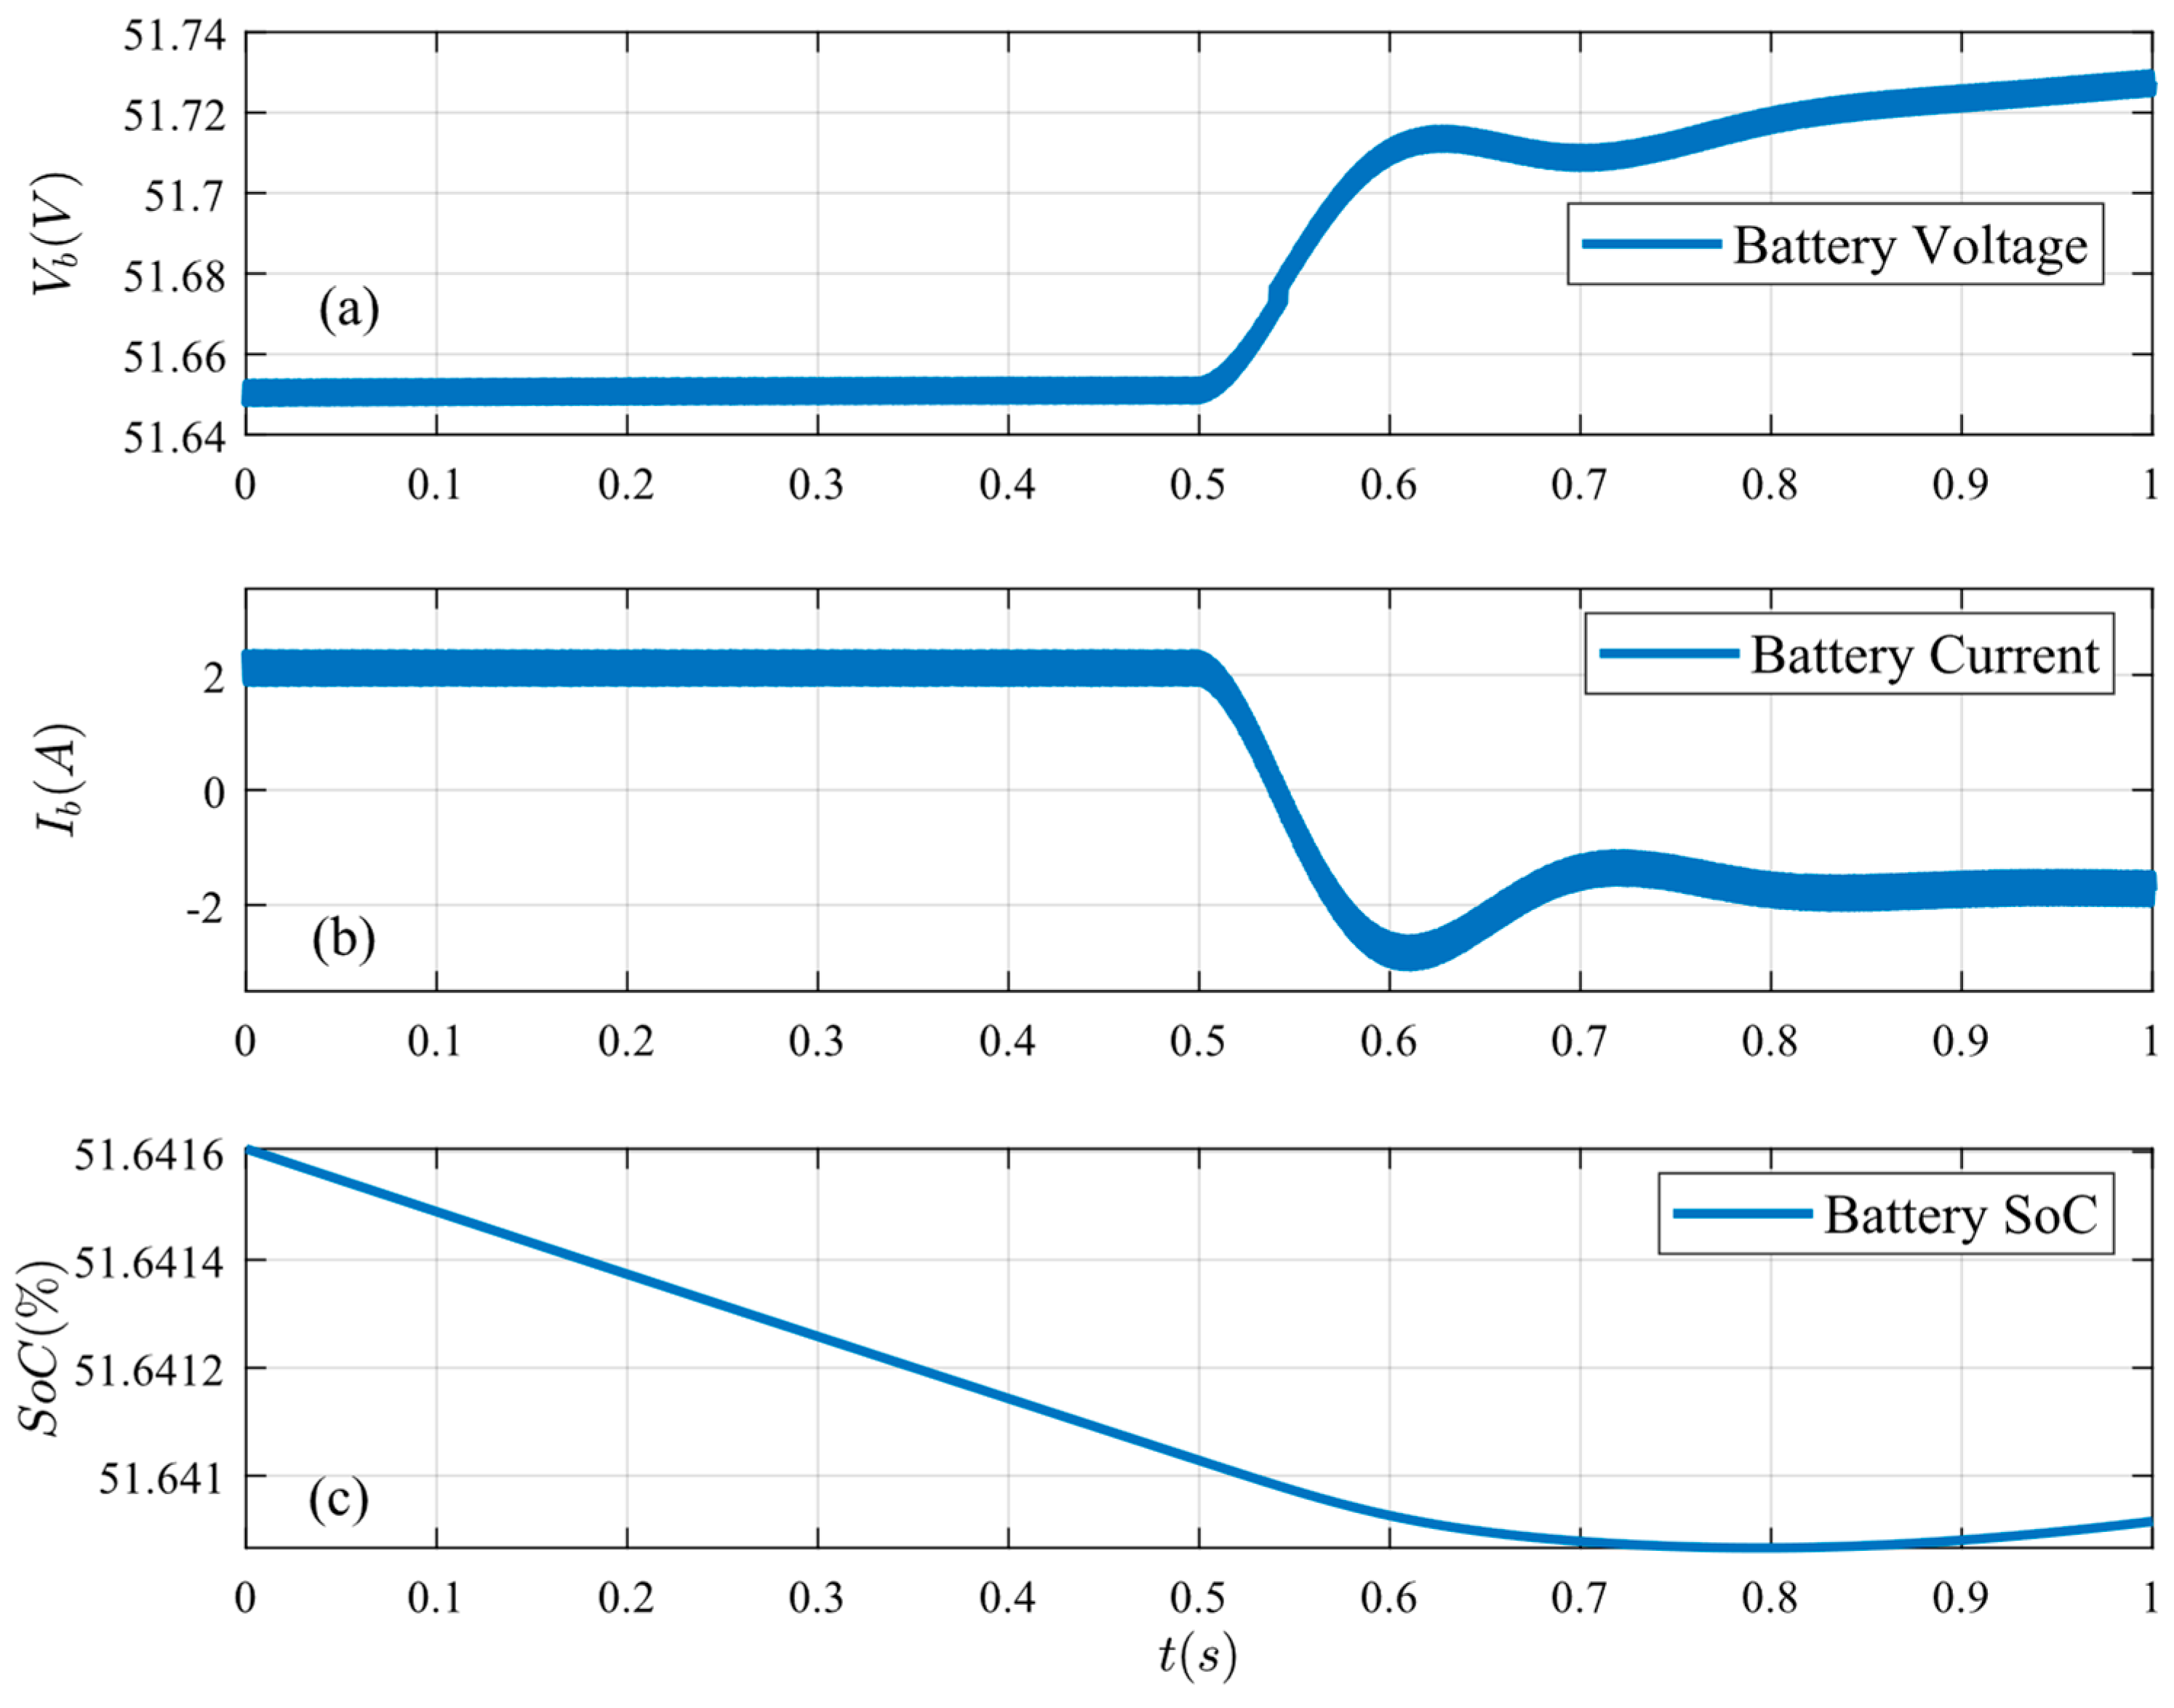
Figure 13.
Battery conditions under load decrease: (a) battery voltage, (b) battery current, and (c) battery SoC.
Figure 13.
Battery conditions under load decrease: (a) battery voltage, (b) battery current, and (c) battery SoC.
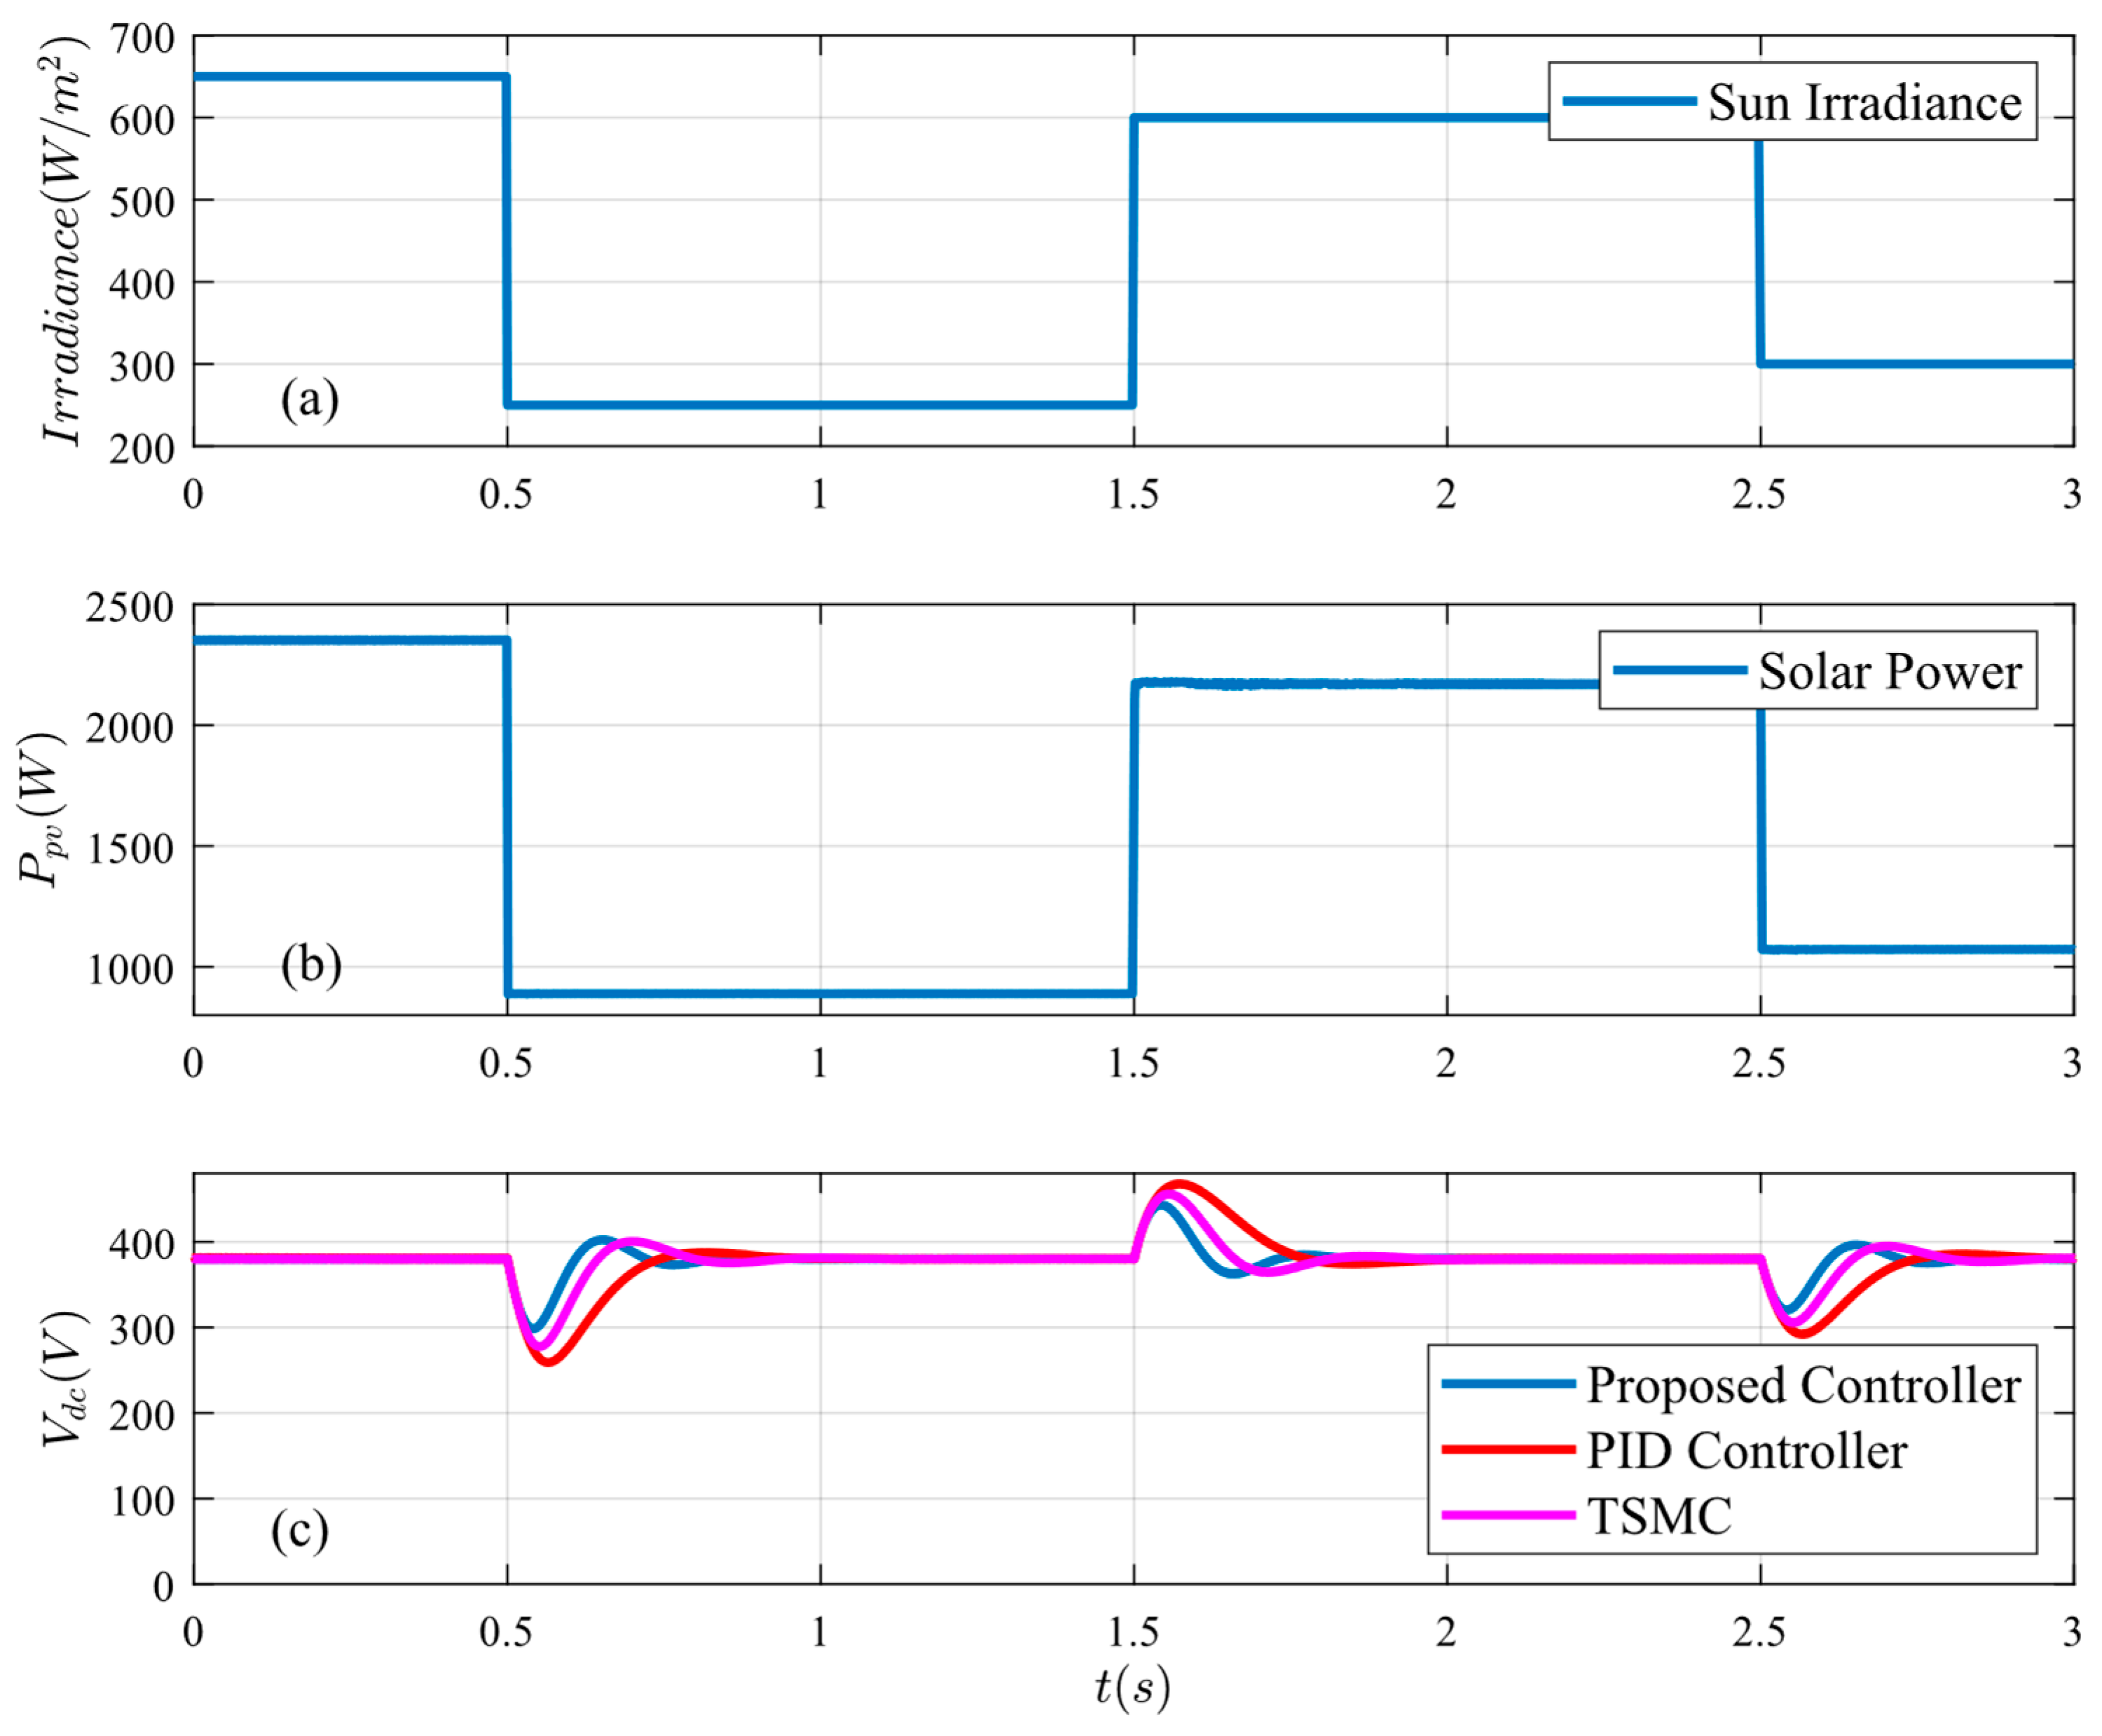
Figure 14.
System response under generation variations: (a) solar irradiance, (b) PV power, and (c) bus voltage.
Figure 14.
System response under generation variations: (a) solar irradiance, (b) PV power, and (c) bus voltage.
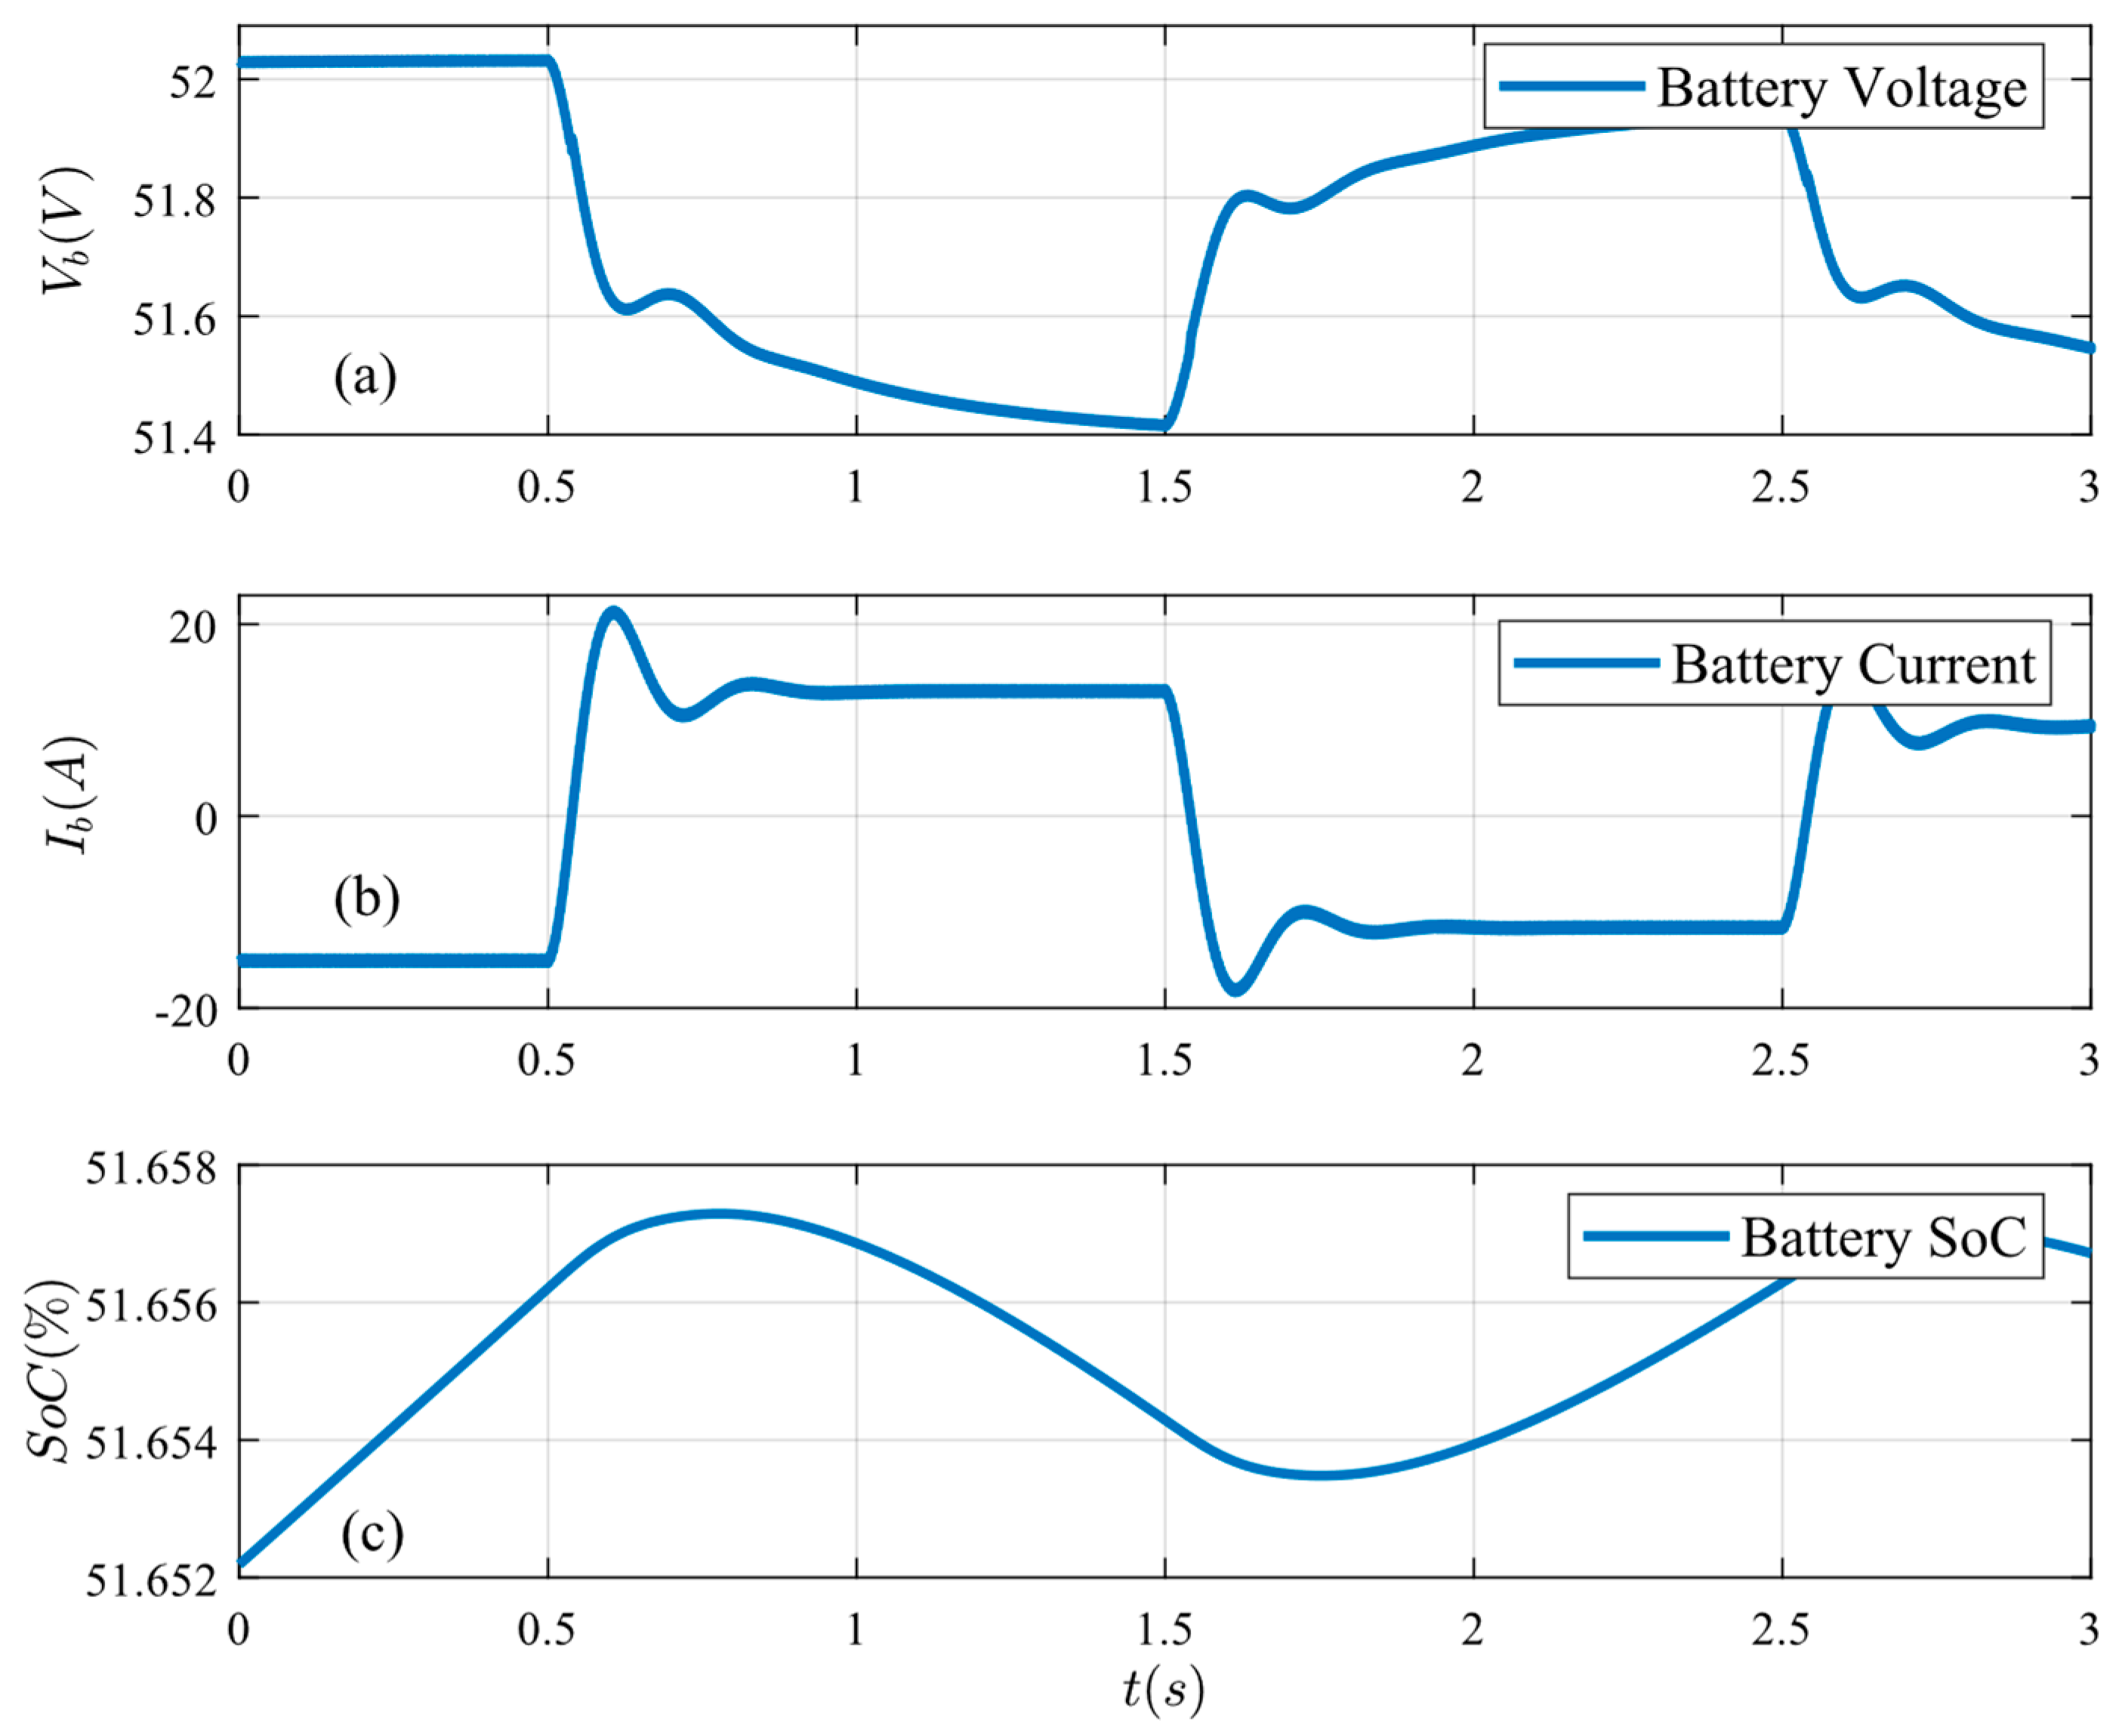
Figure 15.
Battery conditions under generation variations: (a) battery voltage, (b) battery current, and (c) battery SoC.
Figure 15.
Battery conditions under generation variations: (a) battery voltage, (b) battery current, and (c) battery SoC.
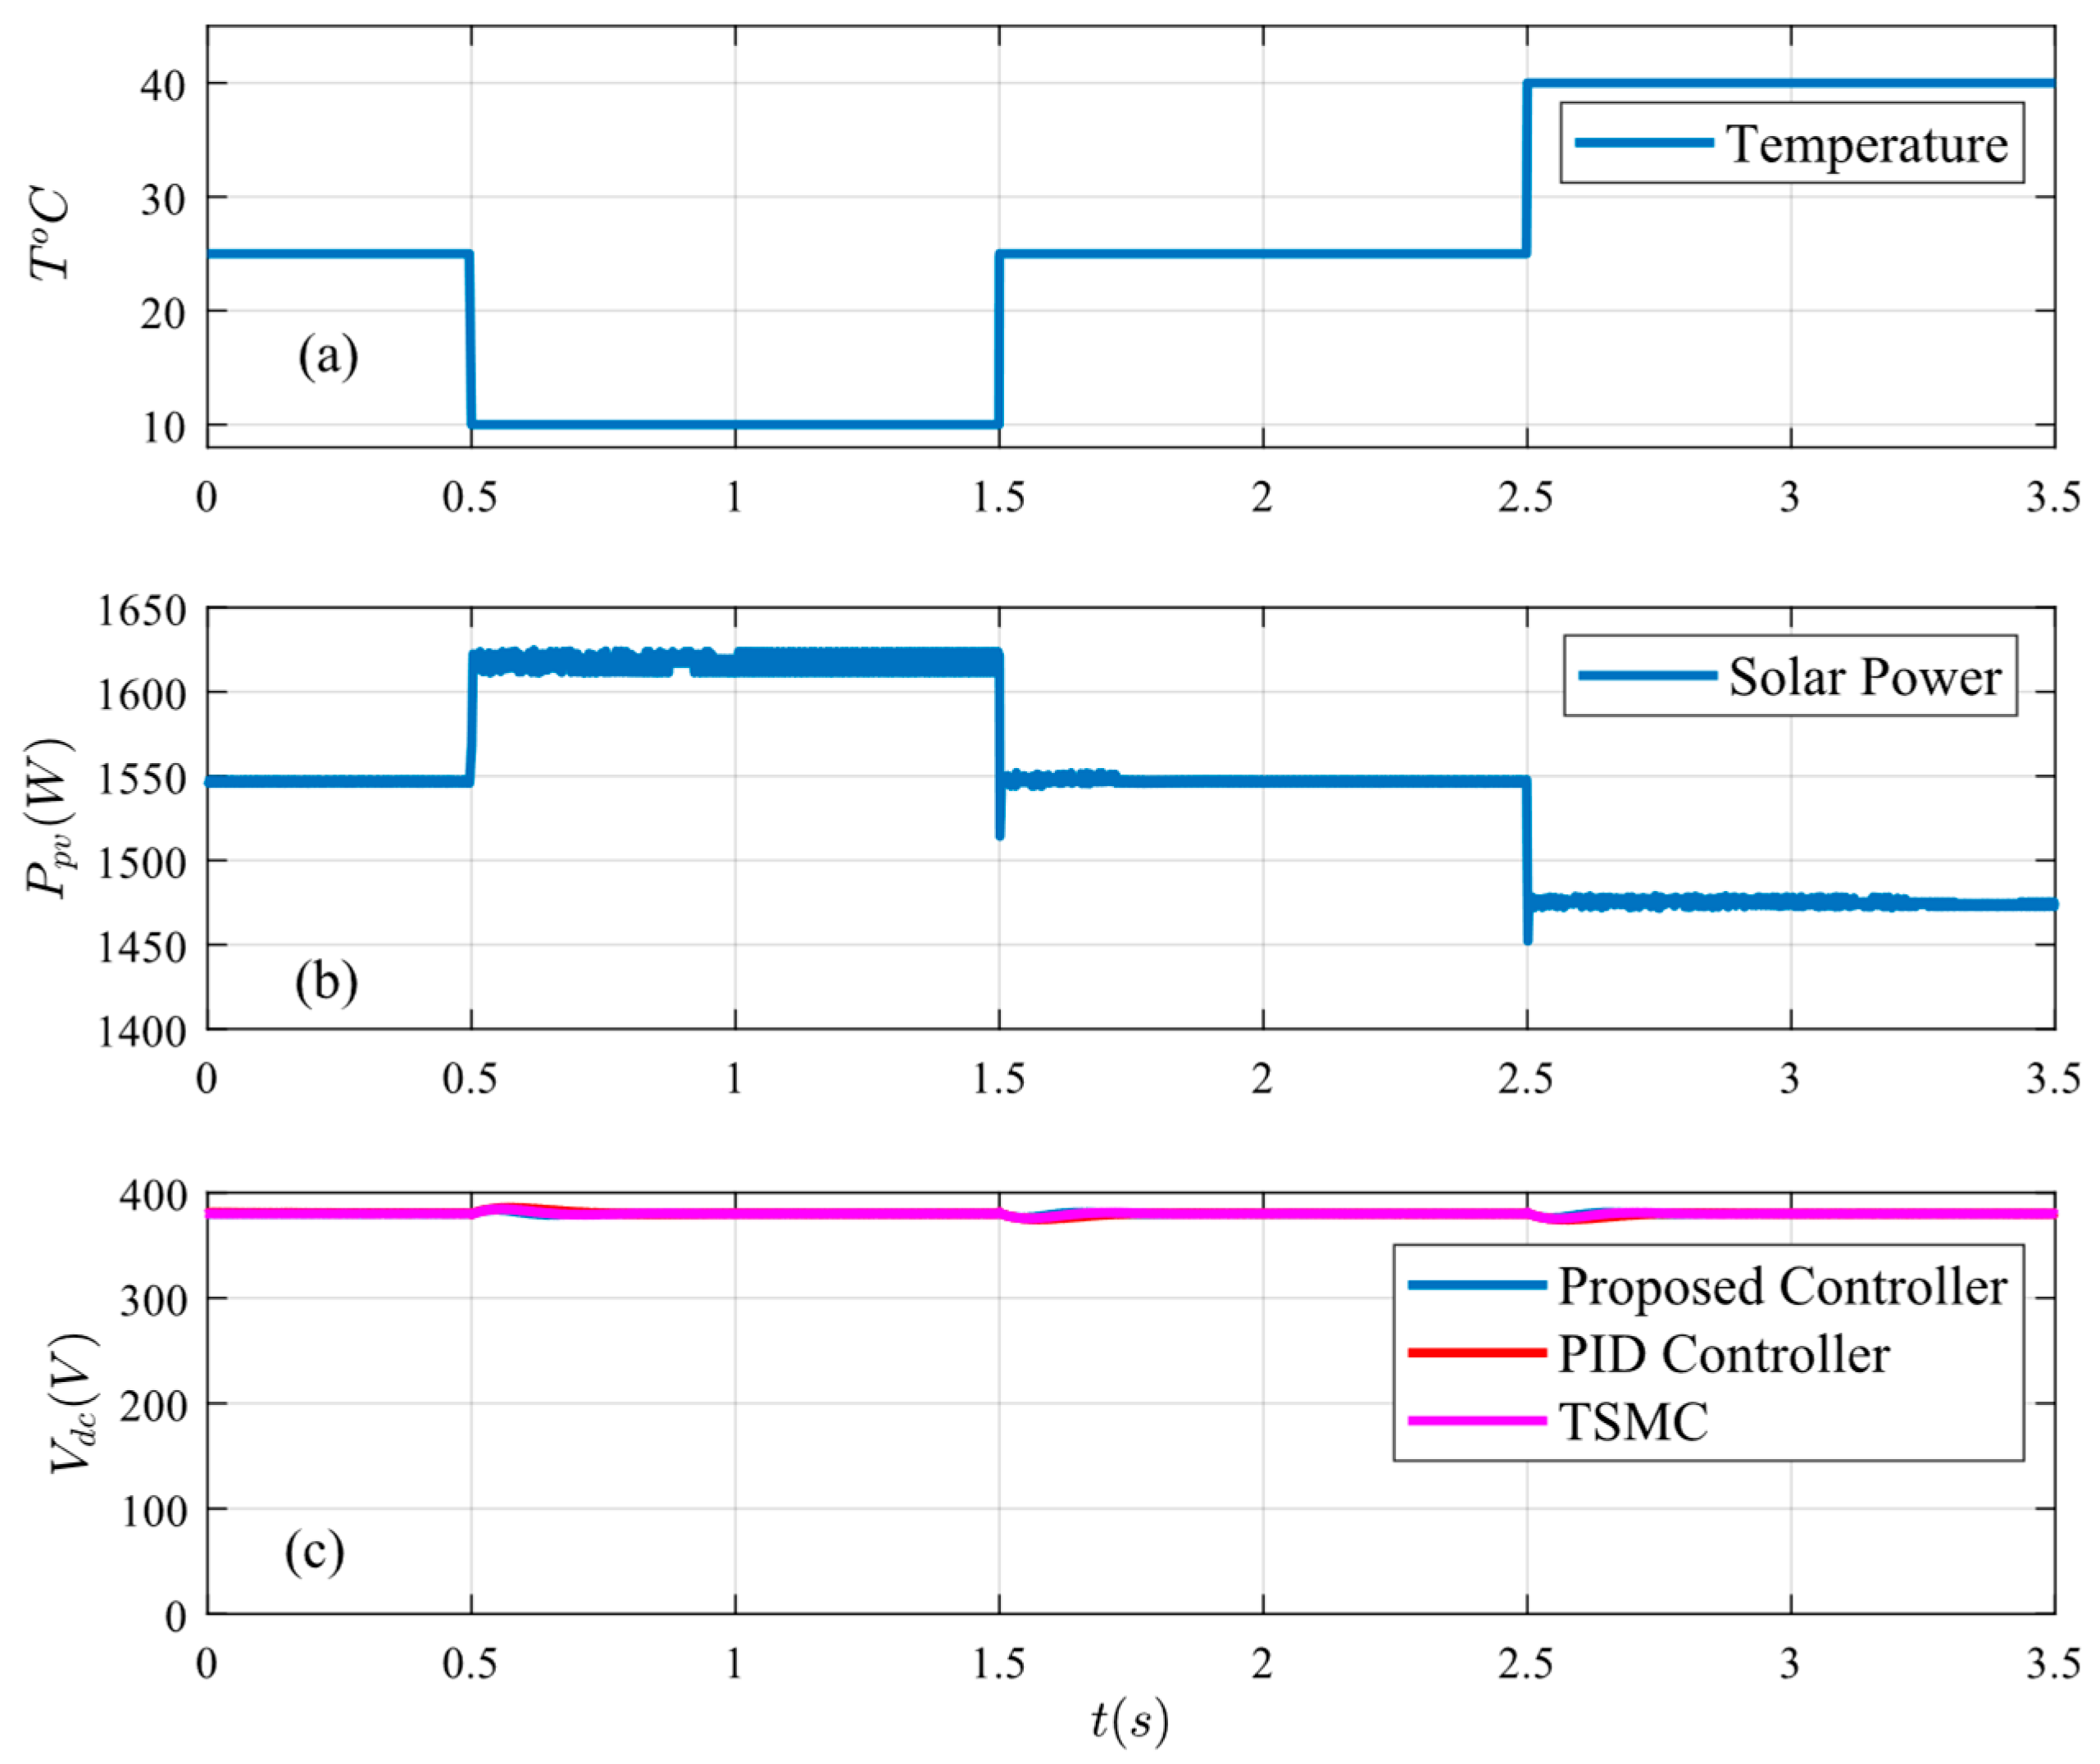
Figure 16.
System response under temperature change: (a) temperature, (b) PV power, and (c) bus voltage.
Figure 16.
System response under temperature change: (a) temperature, (b) PV power, and (c) bus voltage.
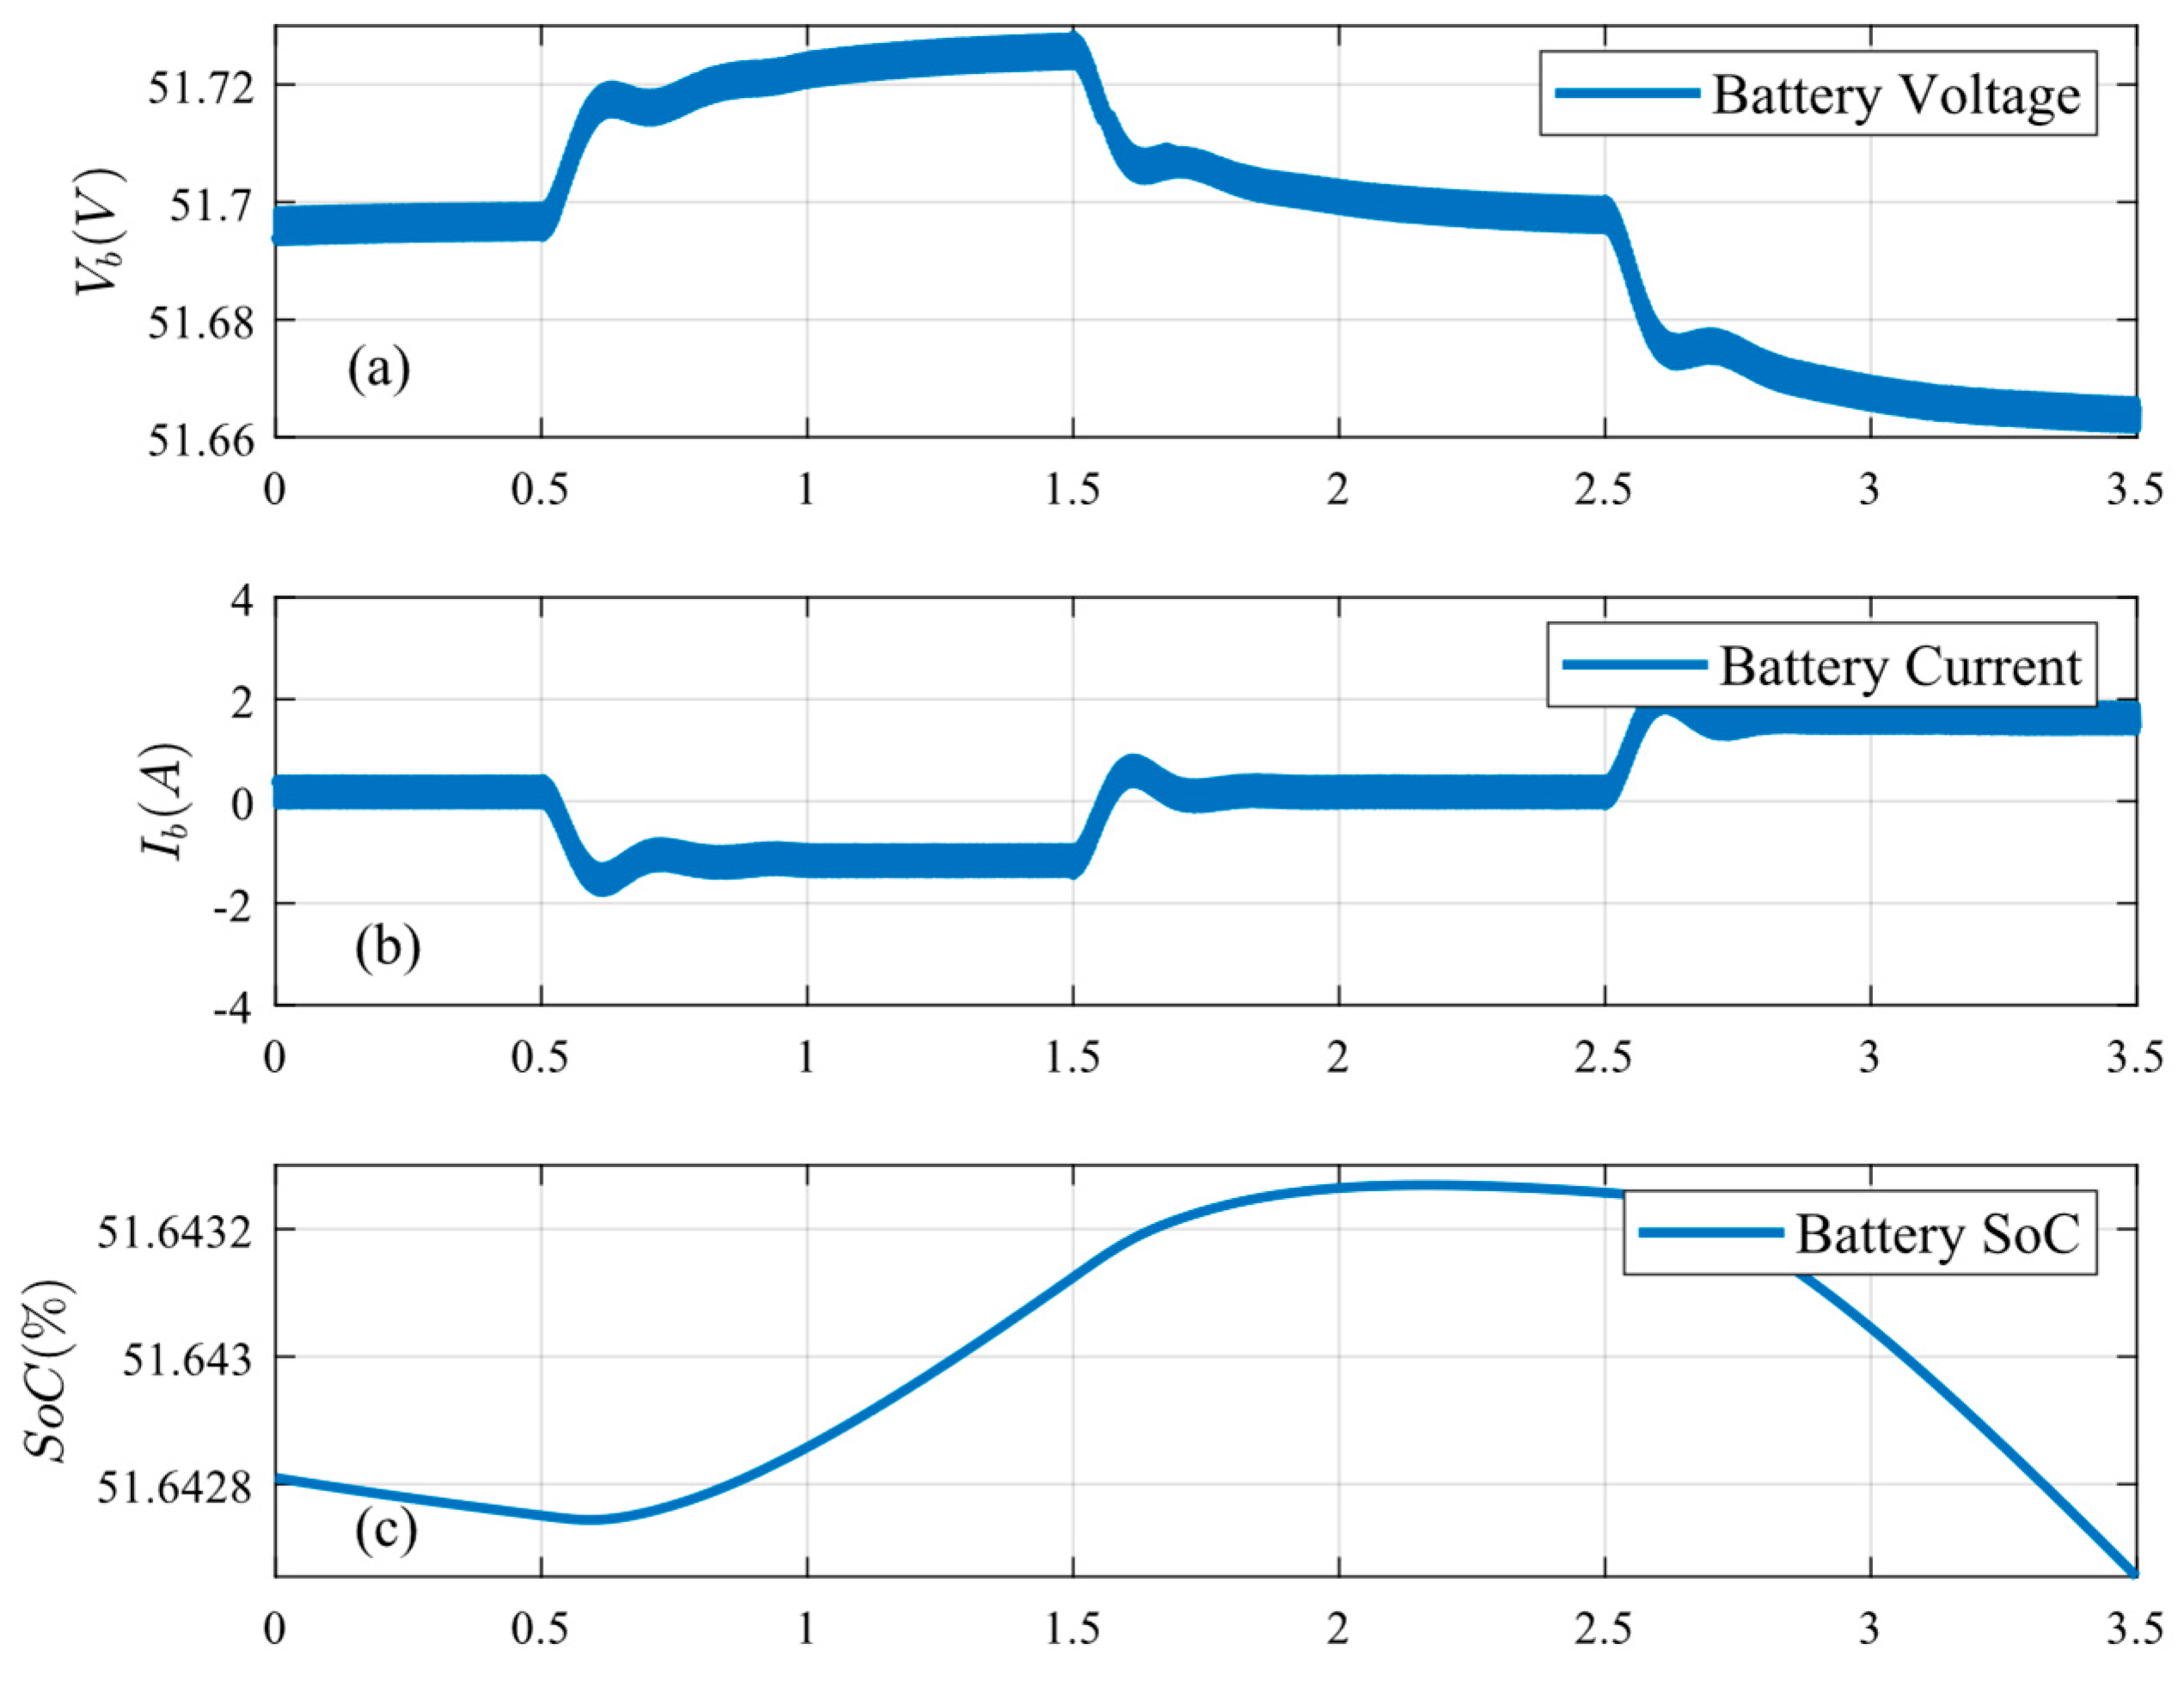
Figure 17.
Battery conditions under temperature change: (a) battery voltage, (b) battery current, and (c) battery SoC.
Figure 17.
Battery conditions under temperature change: (a) battery voltage, (b) battery current, and (c) battery SoC.
Figure 18.
System response under solar power off: (a) load power, (b) PV current, and (c) bus voltage.
Figure 18.
System response under solar power off: (a) load power, (b) PV current, and (c) bus voltage.
Figure 19.
Battery conditions under solar power off: (a) battery voltage, (b) battery current, and (c) battery SoC.
Figure 19.
Battery conditions under solar power off: (a) battery voltage, (b) battery current, and (c) battery SoC.
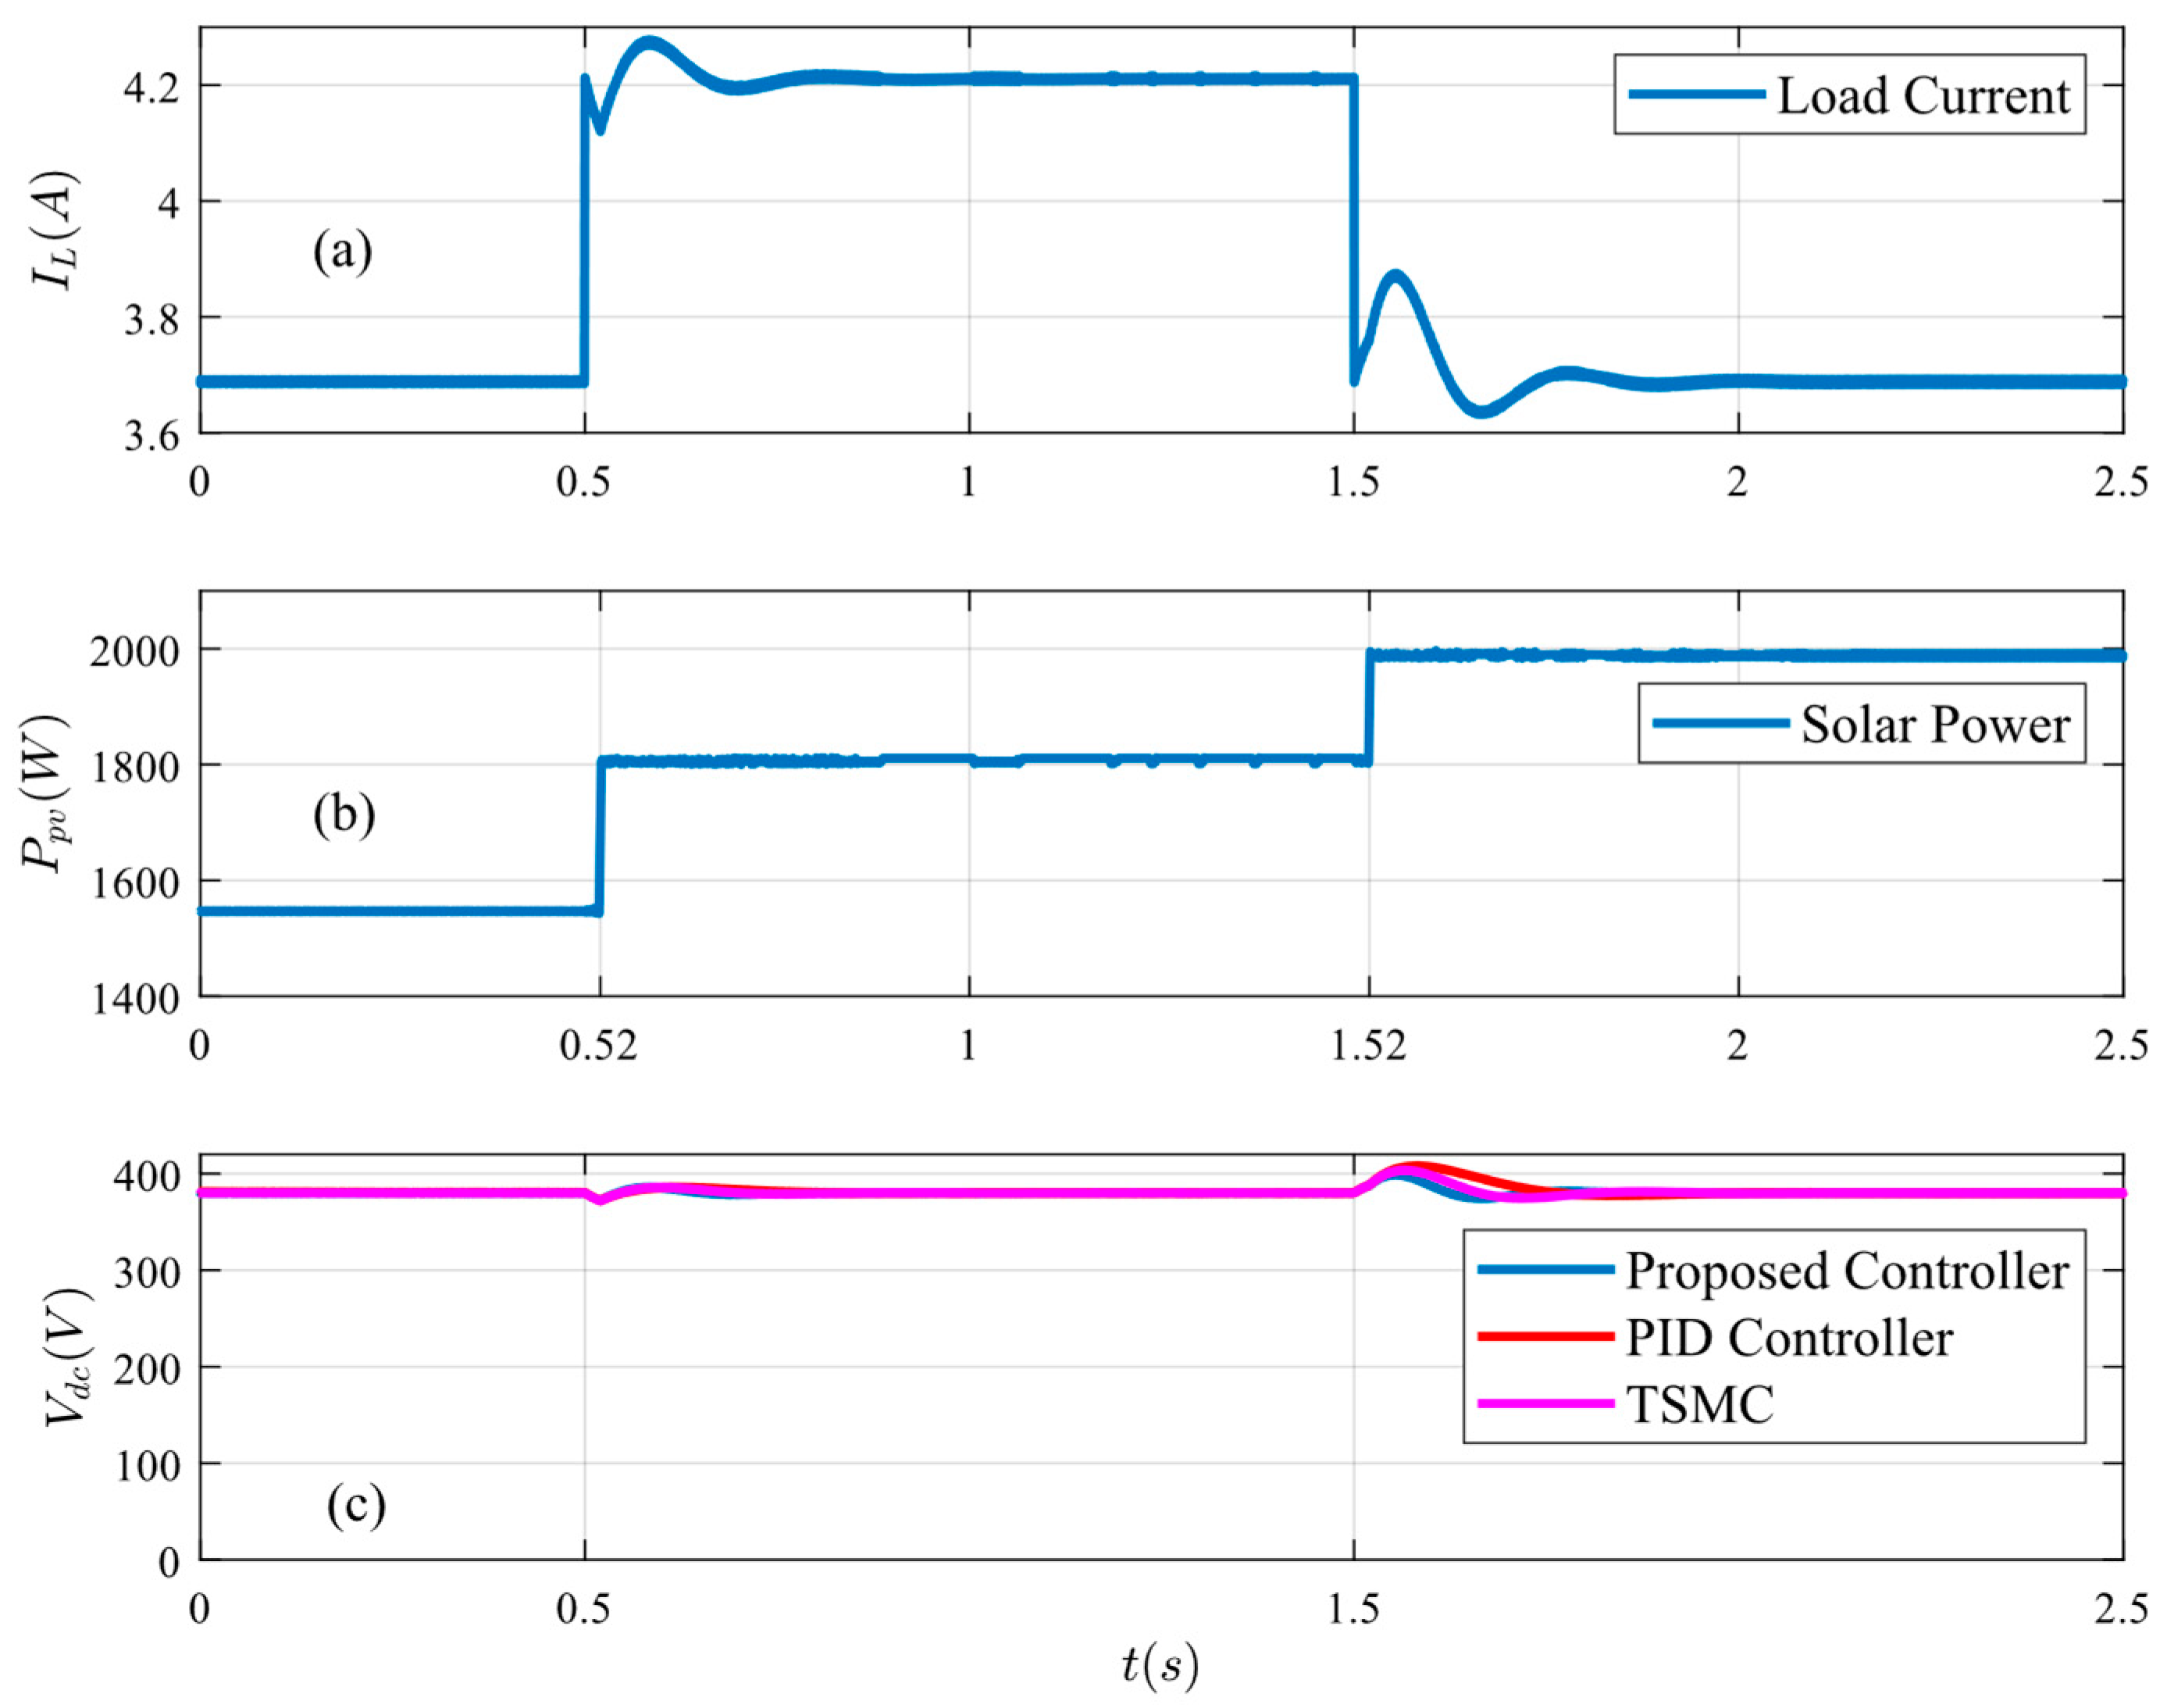
Figure 20.
System response under critical case: (a) load current, (b) PV current, and (c) bus voltage.
Figure 20.
System response under critical case: (a) load current, (b) PV current, and (c) bus voltage.
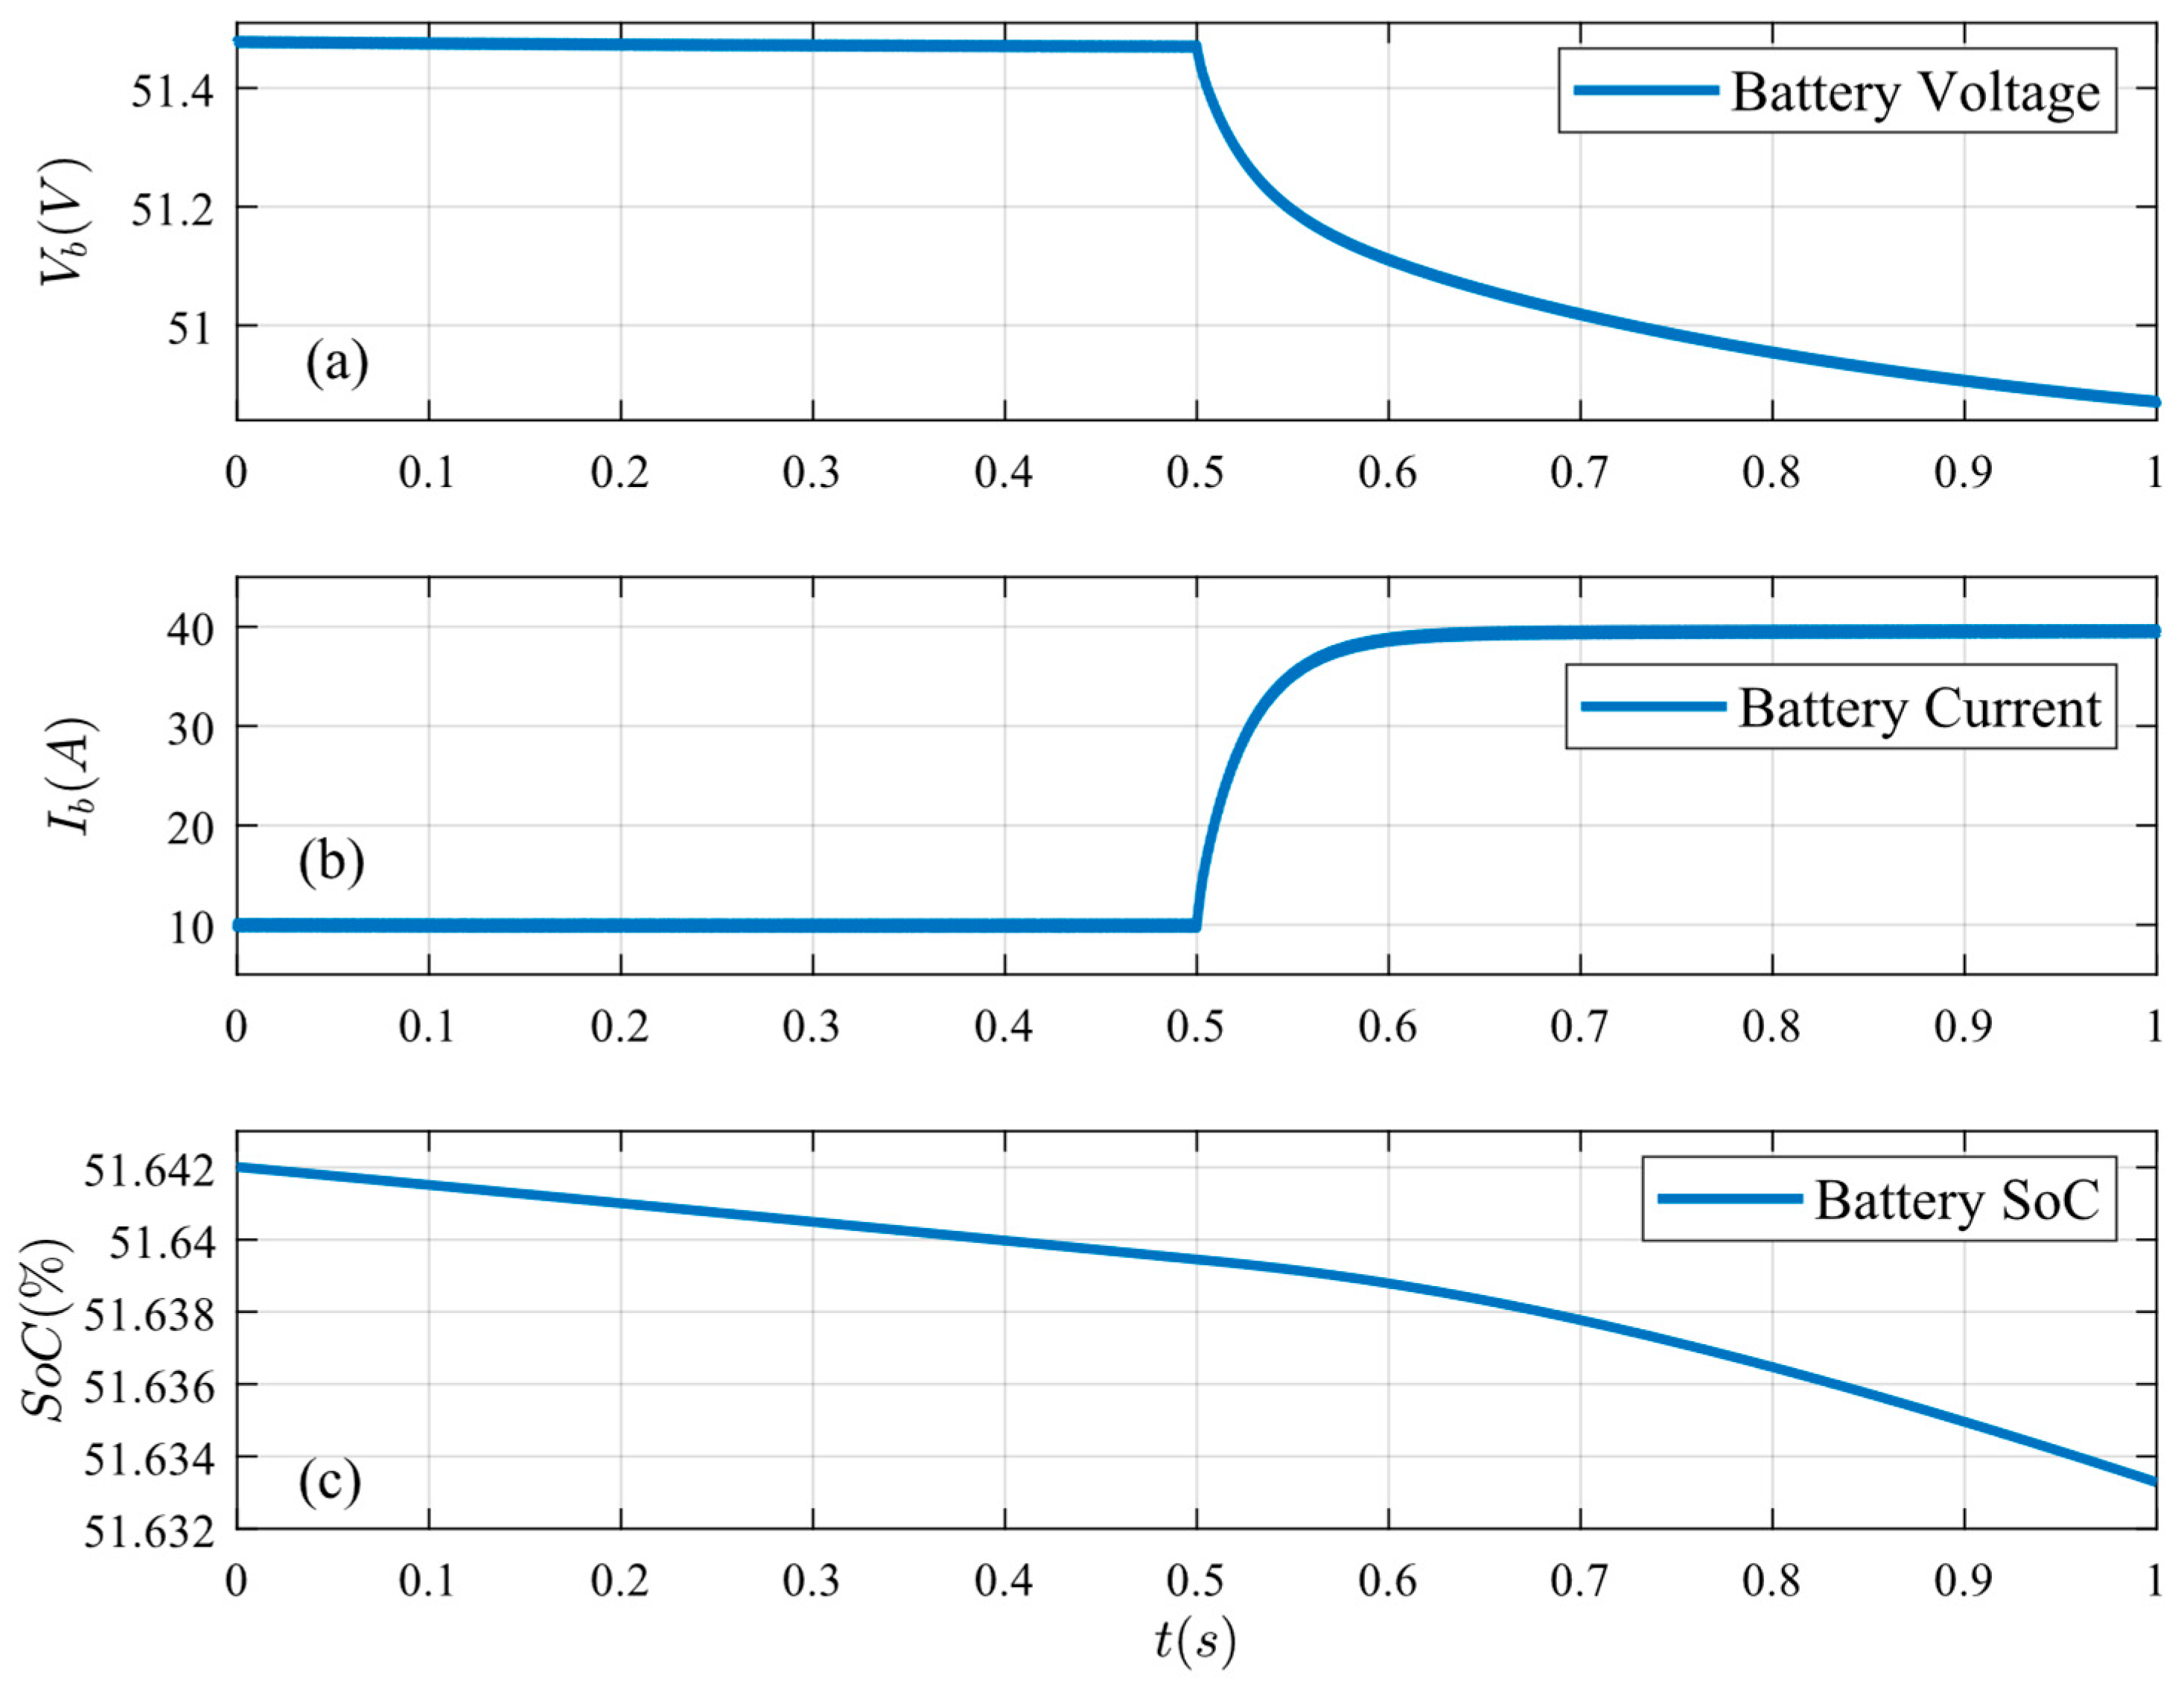
Figure 21.
Battery conditions under critical case: (a) battery voltage, (b) battery current, and (c) battery SoC.
Figure 21.
Battery conditions under critical case: (a) battery voltage, (b) battery current, and (c) battery SoC.
Figure 22.
Effect of the dominant pole due to load variations.
Figure 22.
Effect of the dominant pole due to load variations.
Figure 23.
Effect of the dominant pole due to inductance variations.
Figure 23.
Effect of the dominant pole due to inductance variations.
Table 1.
System performance specifications.
Table 1.
System performance specifications.
| Performance Specification | Value |
|---|
| PID Controller | Proposed ACM Controller |
|---|
| Rise time (ms) | 155 | 63 |
| Settling time (ms) | 274 | 117 |
| Phase margin (degree) | 86 | 84 |
| Gain margin (dB) | 28 | 10 |
| Bandwidth (Hz) | 14 | 35 |
Table 2.
System parameters.
Table 2.
System parameters.
| Parameter | Value |
|---|
| Load power and DC bus voltage | 2 kW and 380 V |
| Battery capacity and terminal voltage | 50 Ah and 48 V |
| PV power | 1.5 kW |
| Inductance, L1, L2 | 470 µH and 5 mH |
| Capacitance, C1, C2 | 1000 µF and 33 µF |
| Switching frequency | 20 kHz |
| Target crossover frequency for current loop compensator | 2 kHz |
| Target crossover frequency for voltage loop compensator | 0.2 kHz |
| Current and voltage feedback gain, Hi, Hv | 1 and 1 |
Table 3.
System performance specifications under load increase.
Table 3.
System performance specifications under load increase.
| Performance Specification | Value |
|---|
| Proposed Controller | PID Controller | TSMC |
|---|
| Settling time (ms) | 67 | 152 | 100 |
| Voltage regulation (%) | 0.05 | 0.08 | 0.05 |
| THD (%) | 0.08 | 0.09 | 0.09 |
| IAE | 18.6965 | 27.5475 | 21.8052 |
| ITAE | 4.2595 | 10.5770 | 5.6779 |
| ISV | 2.2626 | 4.2943 | |
Table 4.
System performance specifications under generation variation.
Table 4.
System performance specifications under generation variation.
| Performance Specification | Value |
|---|
| Proposed Controller | PID Controller | TSMC |
|---|
| Settling time (ms) | 201 | 316 | 265 |
| Voltage regulation (%) | 0.05 | 0.08 | 0.21 |
| THD (%) | 0.12 | 0.14 | 0.14 |
| IAE | 37.0525 | 66.8412 | 49.2745 |
| ITAE | 59.7949 | 132.8653 | 87.7773 |
| ISV | 3.3930 | 4.1903 | |
Table 5.
System performance specifications under temperature change.
Table 5.
System performance specifications under temperature change.
| Performance Specification | Value |
|---|
| Proposed Controller | PID Controller | TSMC |
|---|
| Settling time (ms) | 50 | 75 | 60 |
| Voltage regulation (%) | 0.05 | 0.08 | 0.05 |
| THD (%) | 0.09 | 0.10 | 0.09 |
| IAE | 18.2035 | 27.7458 | 21.0757 |
| ITAE | 6.5272 | 14.7534 | 8.4643 |
| ISV | 3.78 | 5.73 | |
Table 6.
System performance specifications under disconnecting solar power.
Table 6.
System performance specifications under disconnecting solar power.
| Performance Specification | Value |
|---|
| Proposed Controller | PID Controller | TSMC |
|---|
| Settling time (ms) | 80 | 250 | 135 |
| Voltage regulation (%) | 0.87 | 0.92 | 0.05 |
| THD (%) | 0.74 | 0.92 | 0.06 |
| IAE | 18.1647 | 35.9427 | 22.2331 |
| ITAE | 6.1925 | 19.0399 | 8.9024 |
| ISV | 1.1141 | 3.3530 | |
Table 7.
System performance specifications under critical case.
Table 7.
System performance specifications under critical case.
| Performance Specification | Value |
|---|
| Proposed Controller | PID Controller | TSMC |
|---|
| Settling time (ms) | 100 | 203 | 134 |
| Voltage regulation (%) | 0.03 | 0.08 | 0.08 |
| THD (%) | 0.10 | 0.10 | 0.09 |
| IAE | 20.4090 | 30.9235 | 24.1554 |
| ITAE | 9.9271 | 22.2810 | 13.6763 |
| ISV | 3.0239 | 5.0441 | |


 ,
, 


