Article

A Data-Driven Approach to Voltage Stability Support via FVSI-Based Distributed Generator Placement in Contingency Scenarios

by
Manuel Jaramillo
1,*,
Diego Carrión
1,
Filippos Perdikos
2 and
Luis Tipan
1
1
Smart Grid Research Group—GIREI (Spanish Acronym), Electrical Engineering Department, Salesian Polytechnic University, Quito EC170702, Ecuador
2
Openchip & Software Technologies SL, 08034 Barcelona, Spain
*
Author to whom correspondence should be addressed.
Energies 2025, 18(10), 2466; https://doi.org/10.3390/en18102466
Submission received: 11 April 2025 / Revised: 30 April 2025 / Accepted: 9 May 2025 / Published: 11 May 2025
(This article belongs to the Special Issue Energy, Electrical and Power Engineering: 4th Edition)

Abstract

:
This research presents a novel methodology based on data analysis for improving voltage stability in transmission systems. The proposal aims to determine a single distributed generator’s optimal location and sizing using the Fast Voltage Stability Index (FVSI) as the primary metric under N 1 contingency conditions. The developed strategy systematically identifies the most critical transmission lines close to instability through a frequency analysis of the FVSI in the base case and across multiple contingency scenarios. Subsequently, the weak buses associated with the most critical line are determined, on which critical load increases are simulated. The Distributed Generator (DG) sizing and location parameters are then optimized through a statistical analysis of the inflection point and the rate of change of the FVSI statistical parameters. The methodology is validated in three case studies: IEEE systems with 14, 30, and 118 buses, demonstrating its scalability and effectiveness. The results show significant reductions in FVSI values and notable improvements in voltage profiles under stress and contingency conditions. For example, in the 30-bus IEEE system, the average FVSI for all contingency scenarios was reduced by 26% after applying the optimal solution. At the same time, the voltage profiles even exceeded those of the base case. This strategy represents a significant contribution, as it is capable of improving the stability of the electrical power system in all N 1 contingency scenarios with overload at critical nodes. Using a single DG as a low-cost and highly effective corrective measure, the proposed approach outperforms conventional solutions through statistical analysis and a data-centric approach.

1. Introduction

Modern power networks, which operate close to their limits, require safe and uninterrupted supply alongside efficient operation. This is also true for voltage stability, for which it is critically important for safety in power system operation. The challenges related to voltage stability are amplified by the increased penetration of distributed generation resources, N 1 contingencies, and sudden electrical demand spikes [1].
A large number of different indices have been developed over the years aimed at monitoring operational safety, such as the Voltage Stability Index (VSI), Fast Voltage Stability Index (FVSI), L m n index, and load quality index LQP, among others [2]. FVSI has proven particularly useful for detecting critical lines and predicting voltage collapse instability due to its sensitivity to changes in the system topology and low computational requirements.
Though existing literature proposes heuristic approaches and optimization models for voltage profile enhancement, they mainly focus on FVSI monitoring, overlooking active decision-making for corrective action planning, such as determining the size and location of auxiliary generation units for contingency scenarios. While some heuristic approaches to optimize voltage profiles have been put forth, very few incorporate multi-scenario FVSI behavioral analysis into the optimization framework to create systematic decision structures.
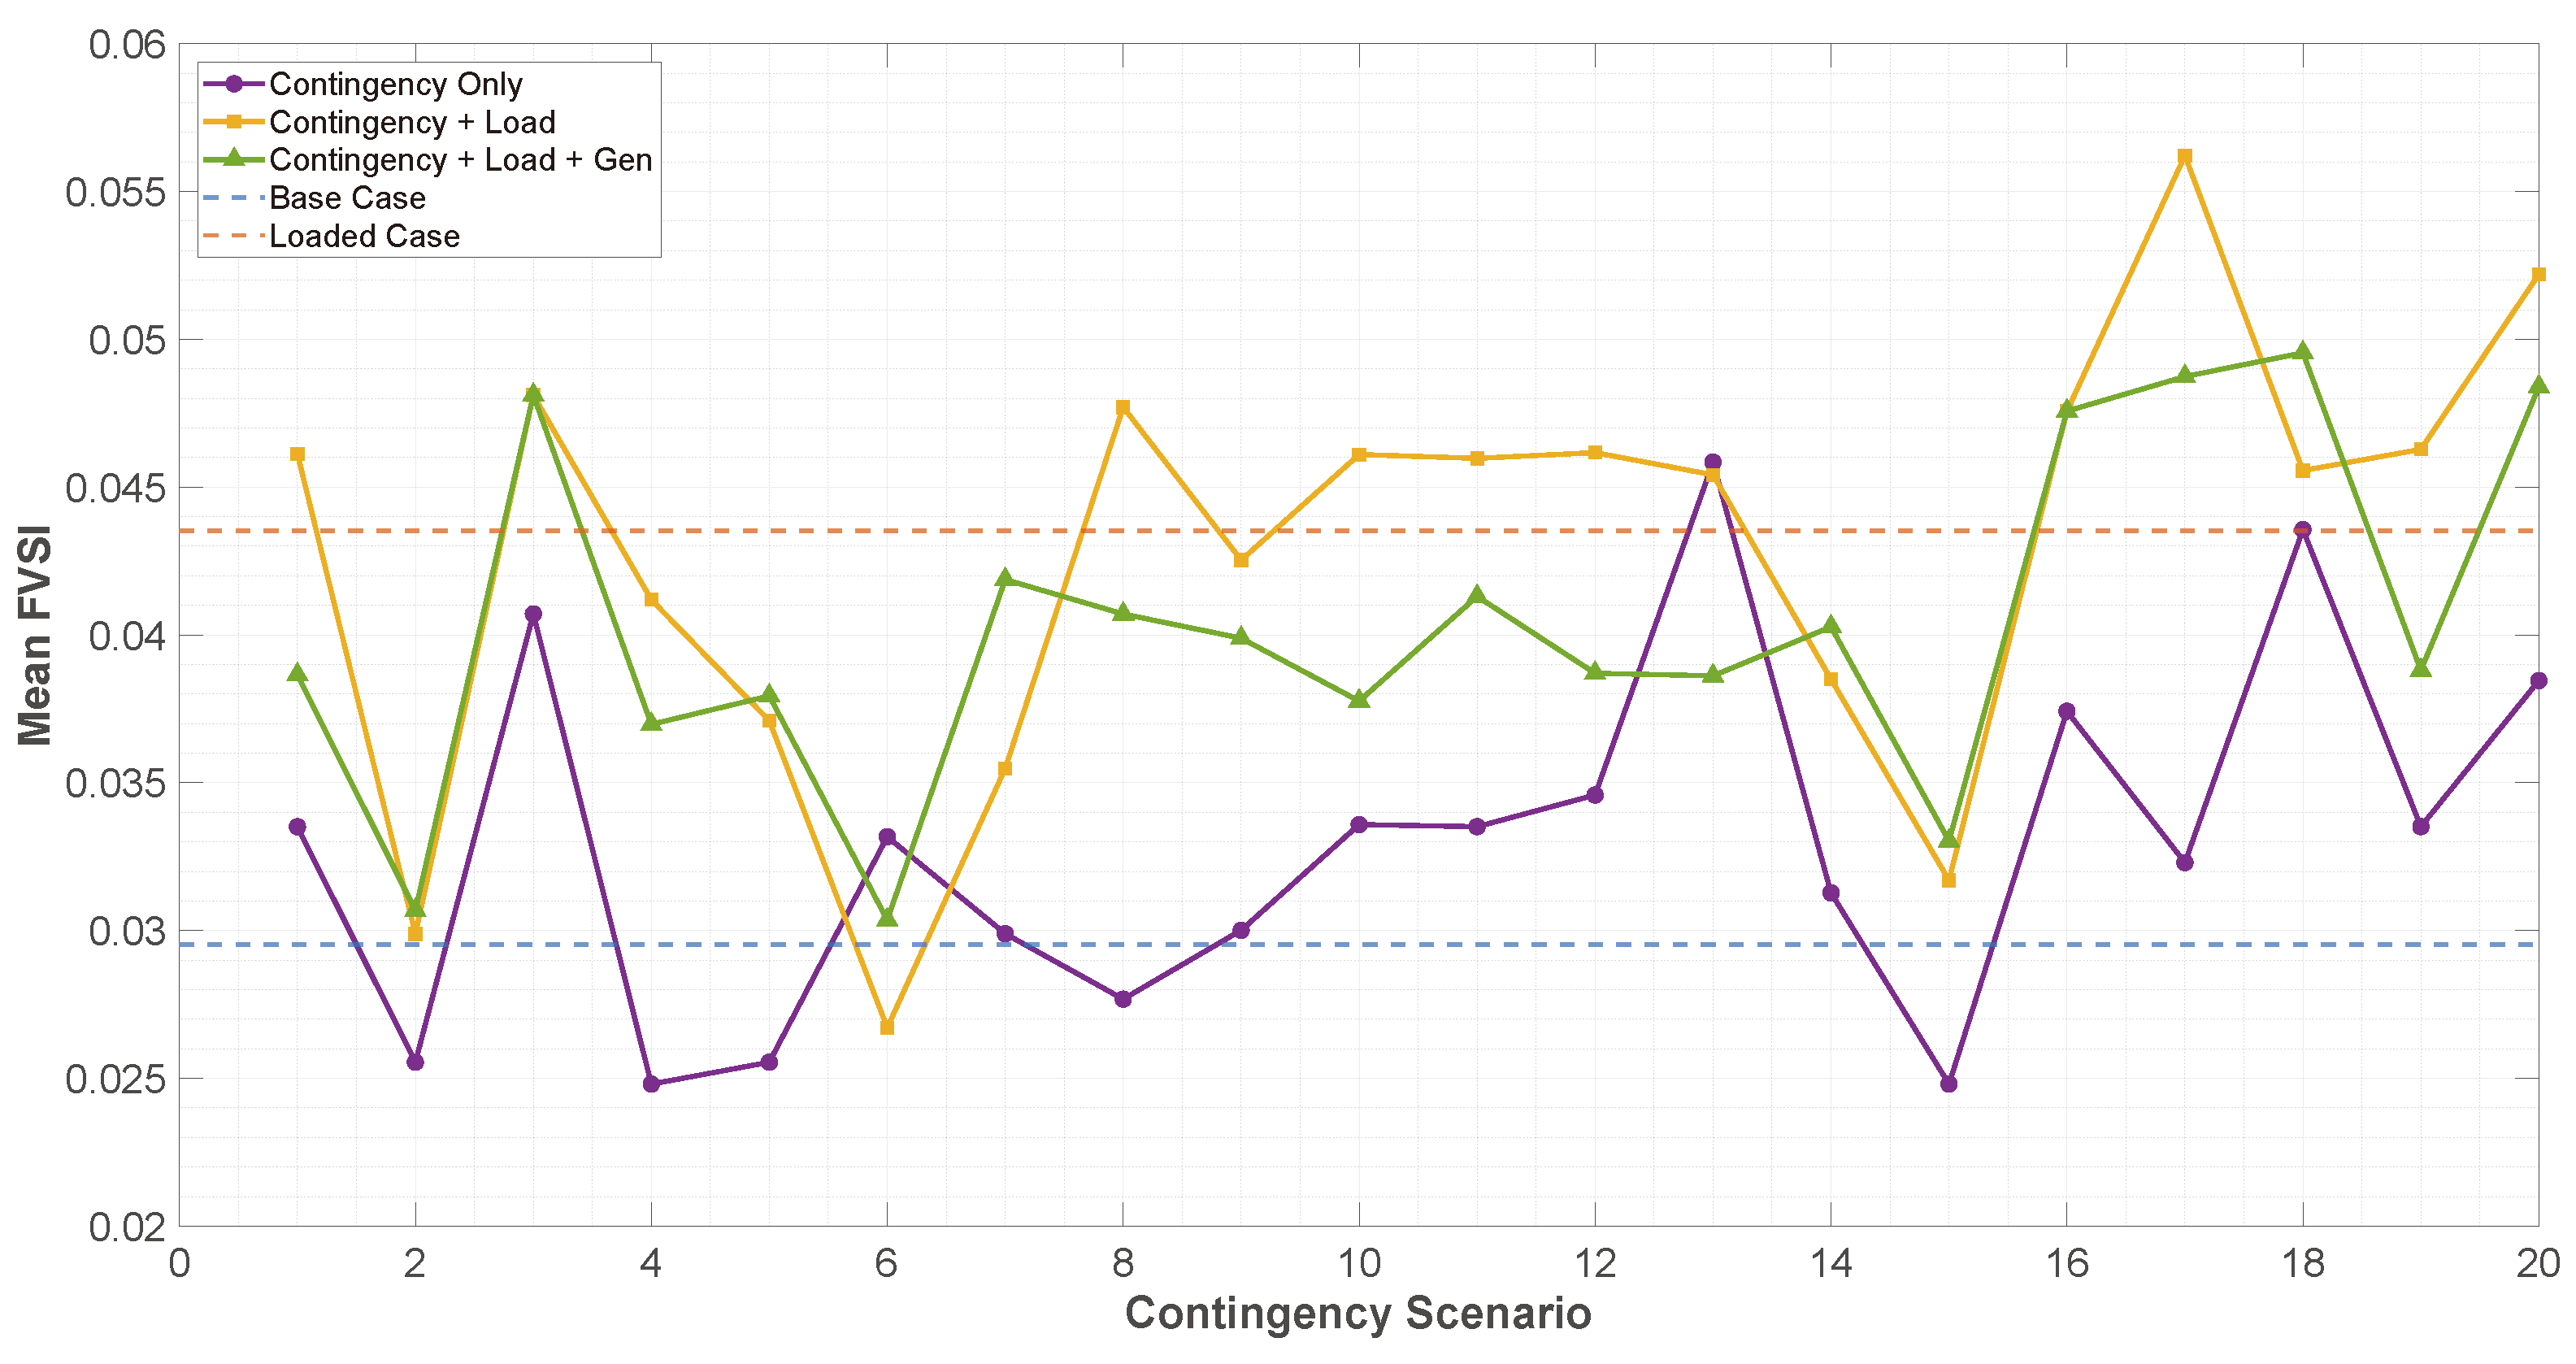
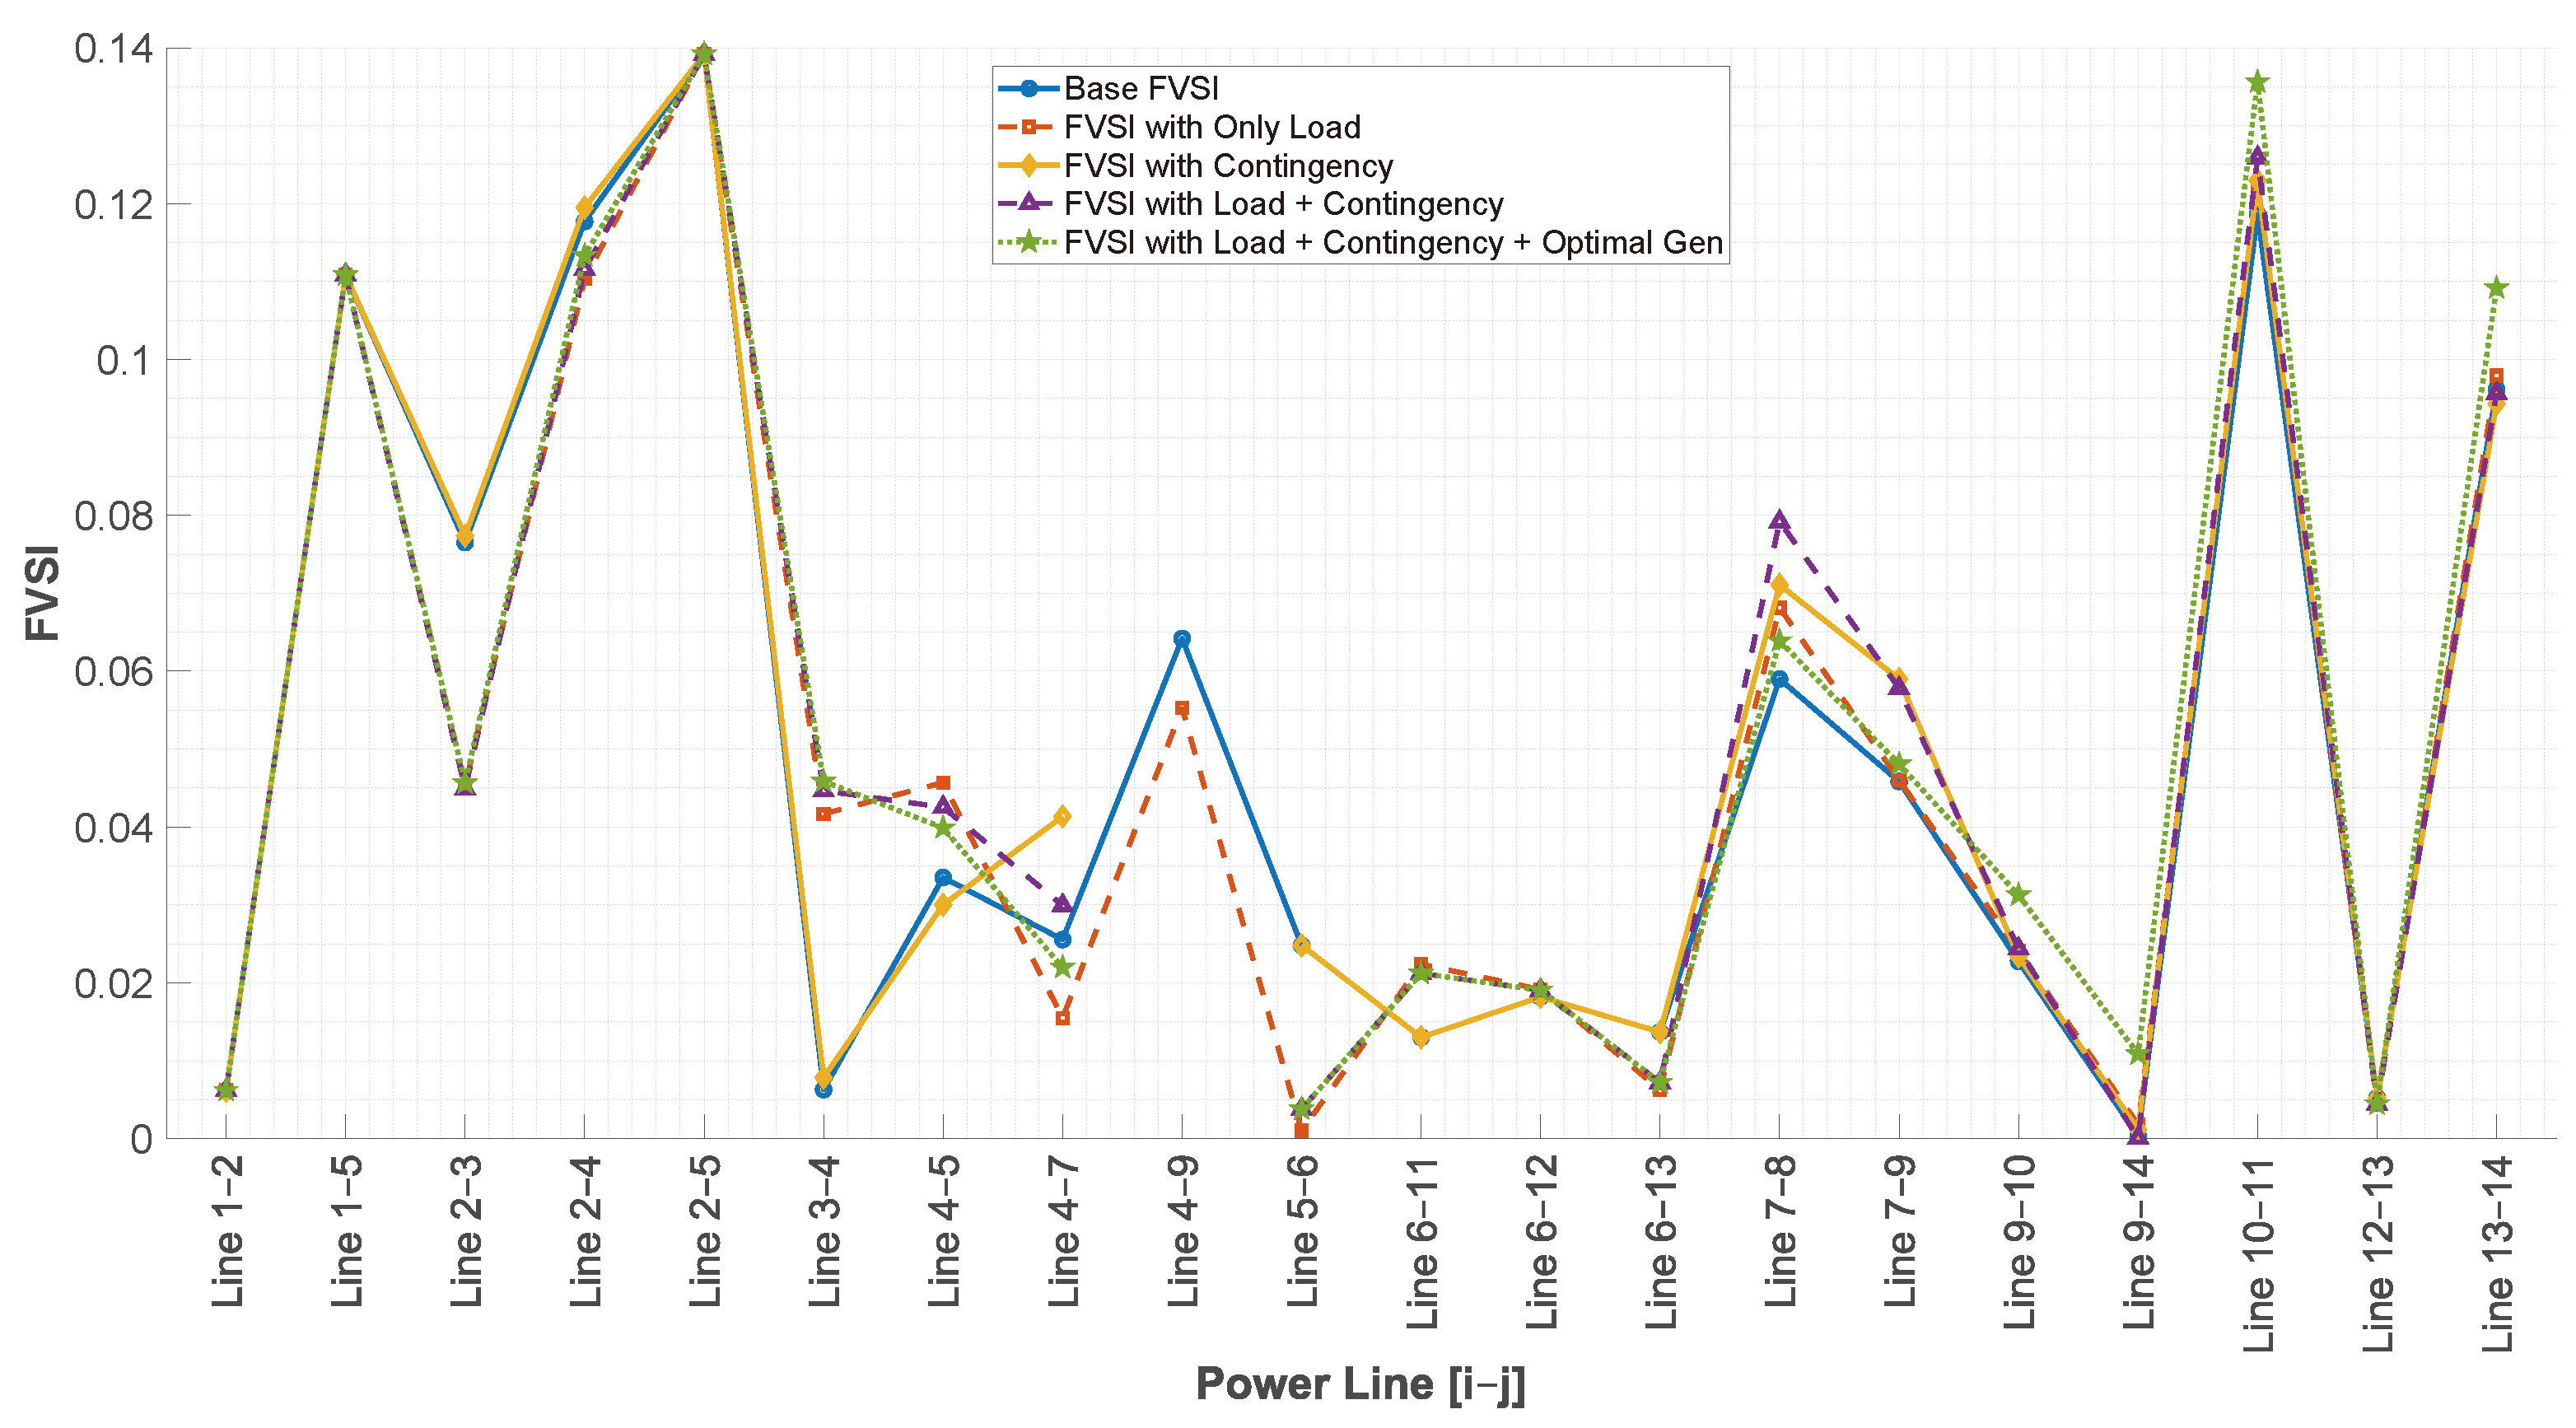
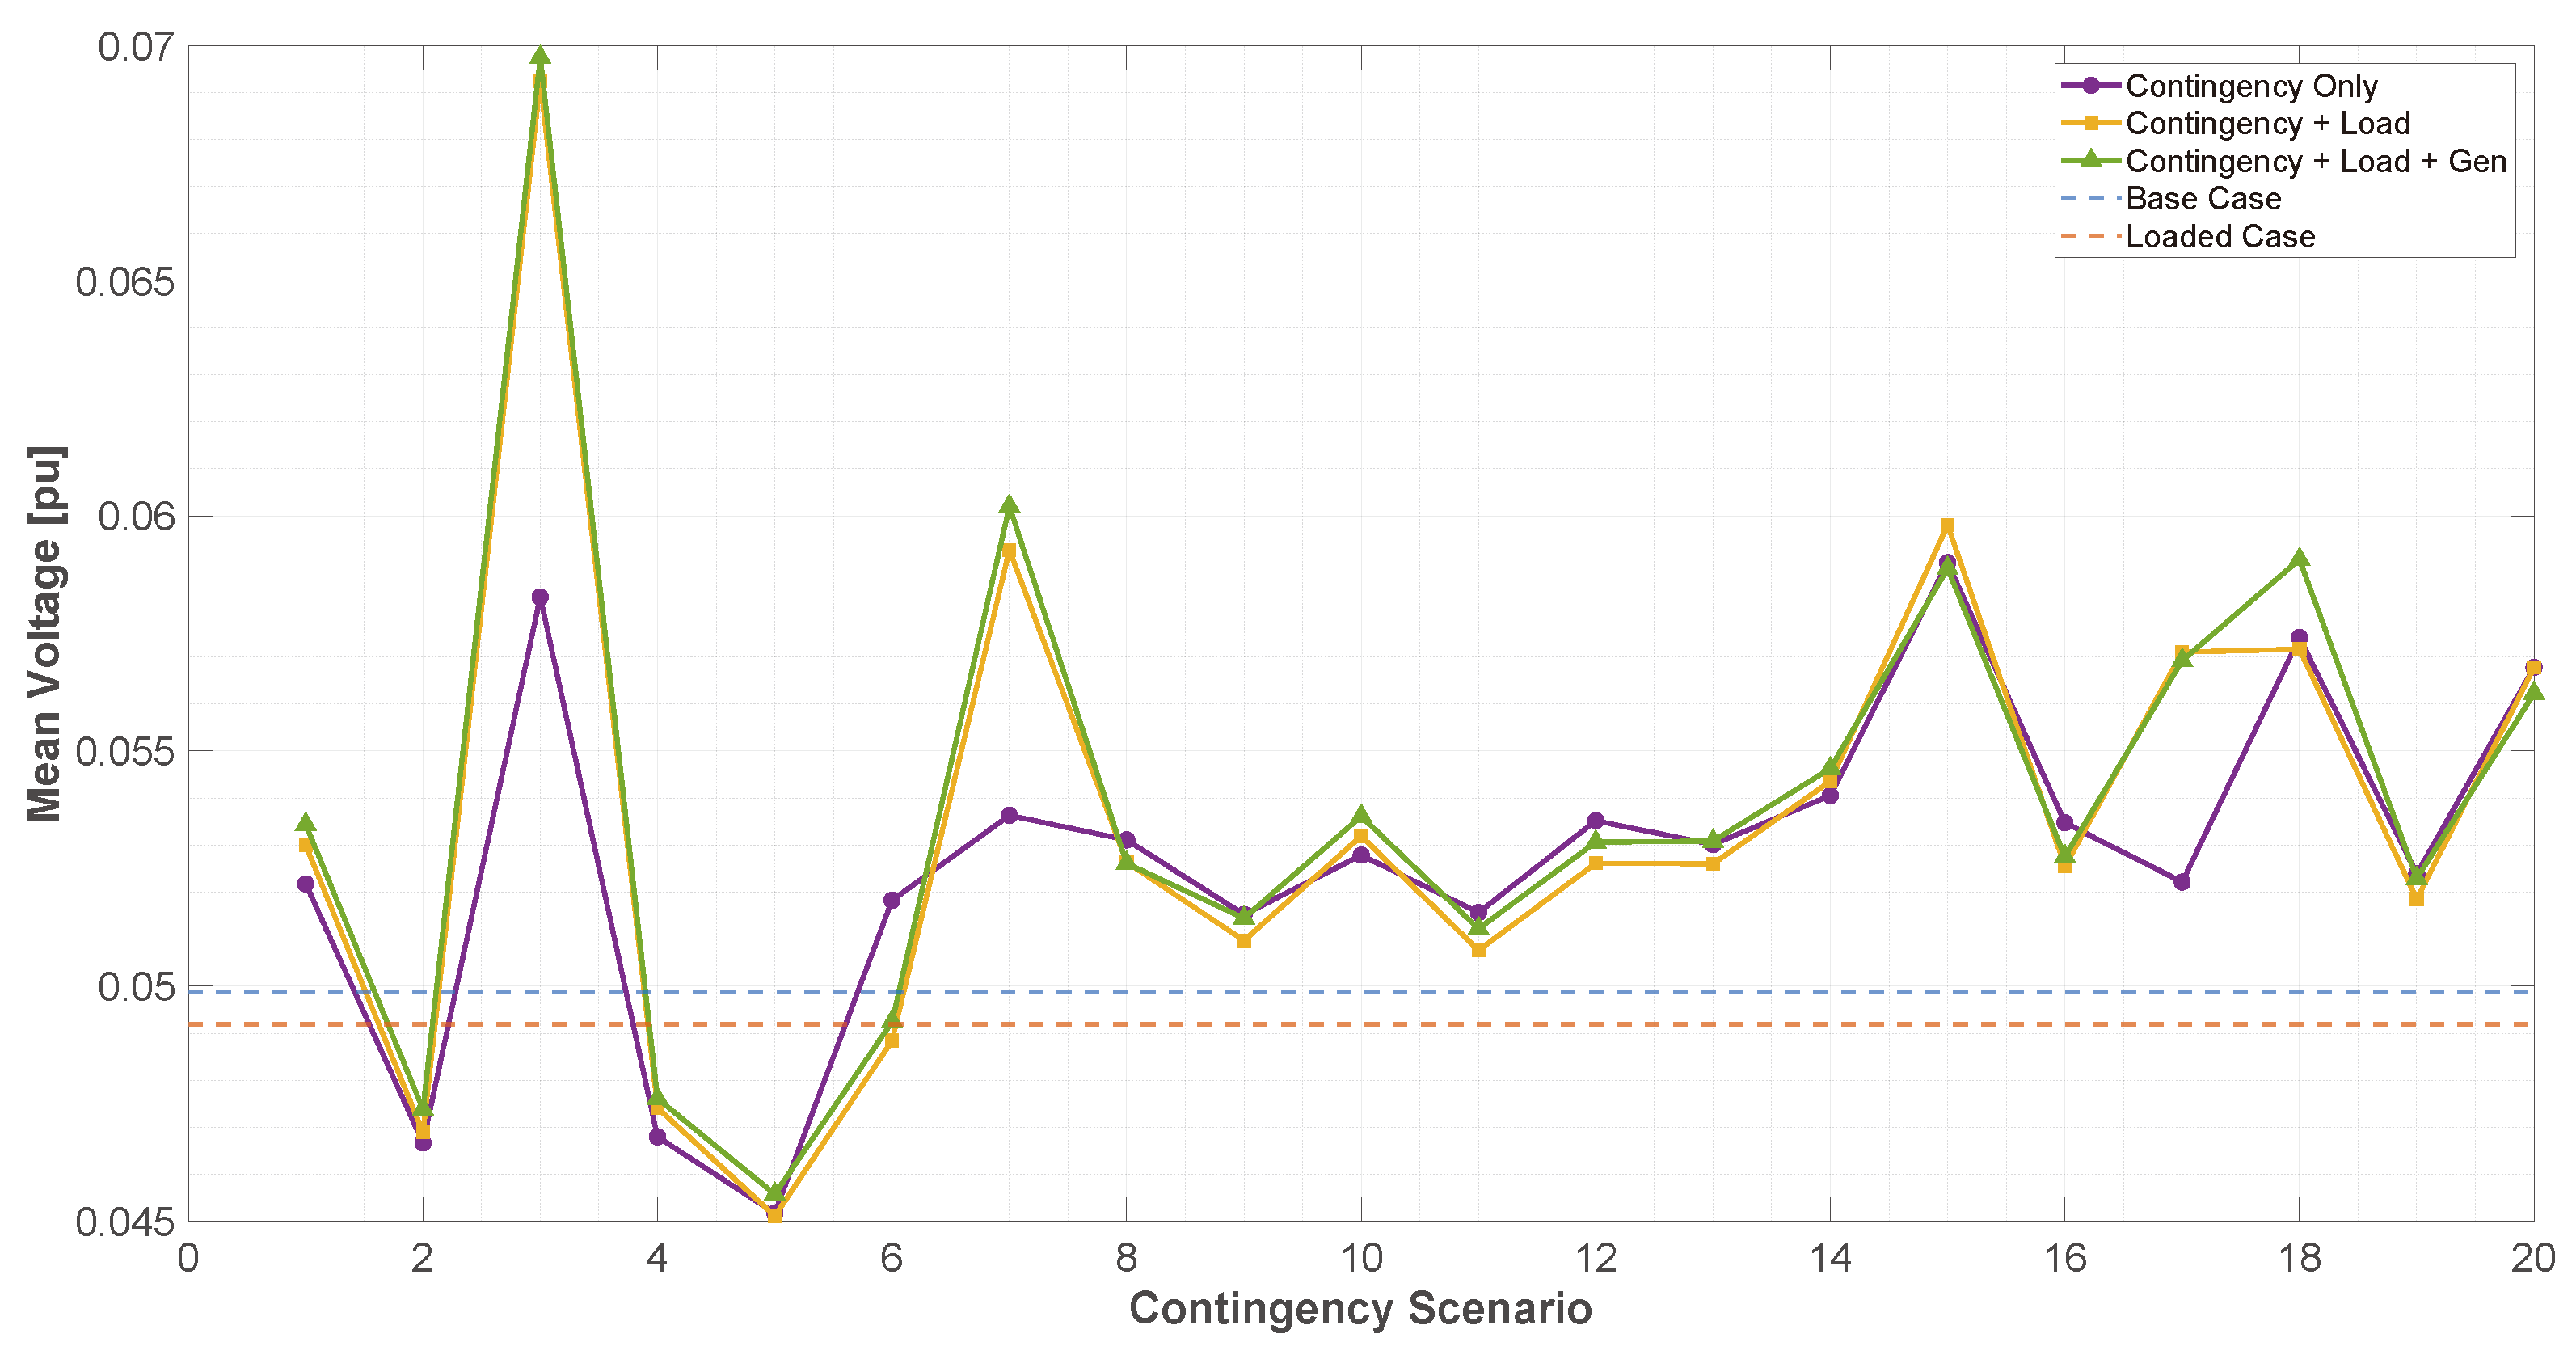
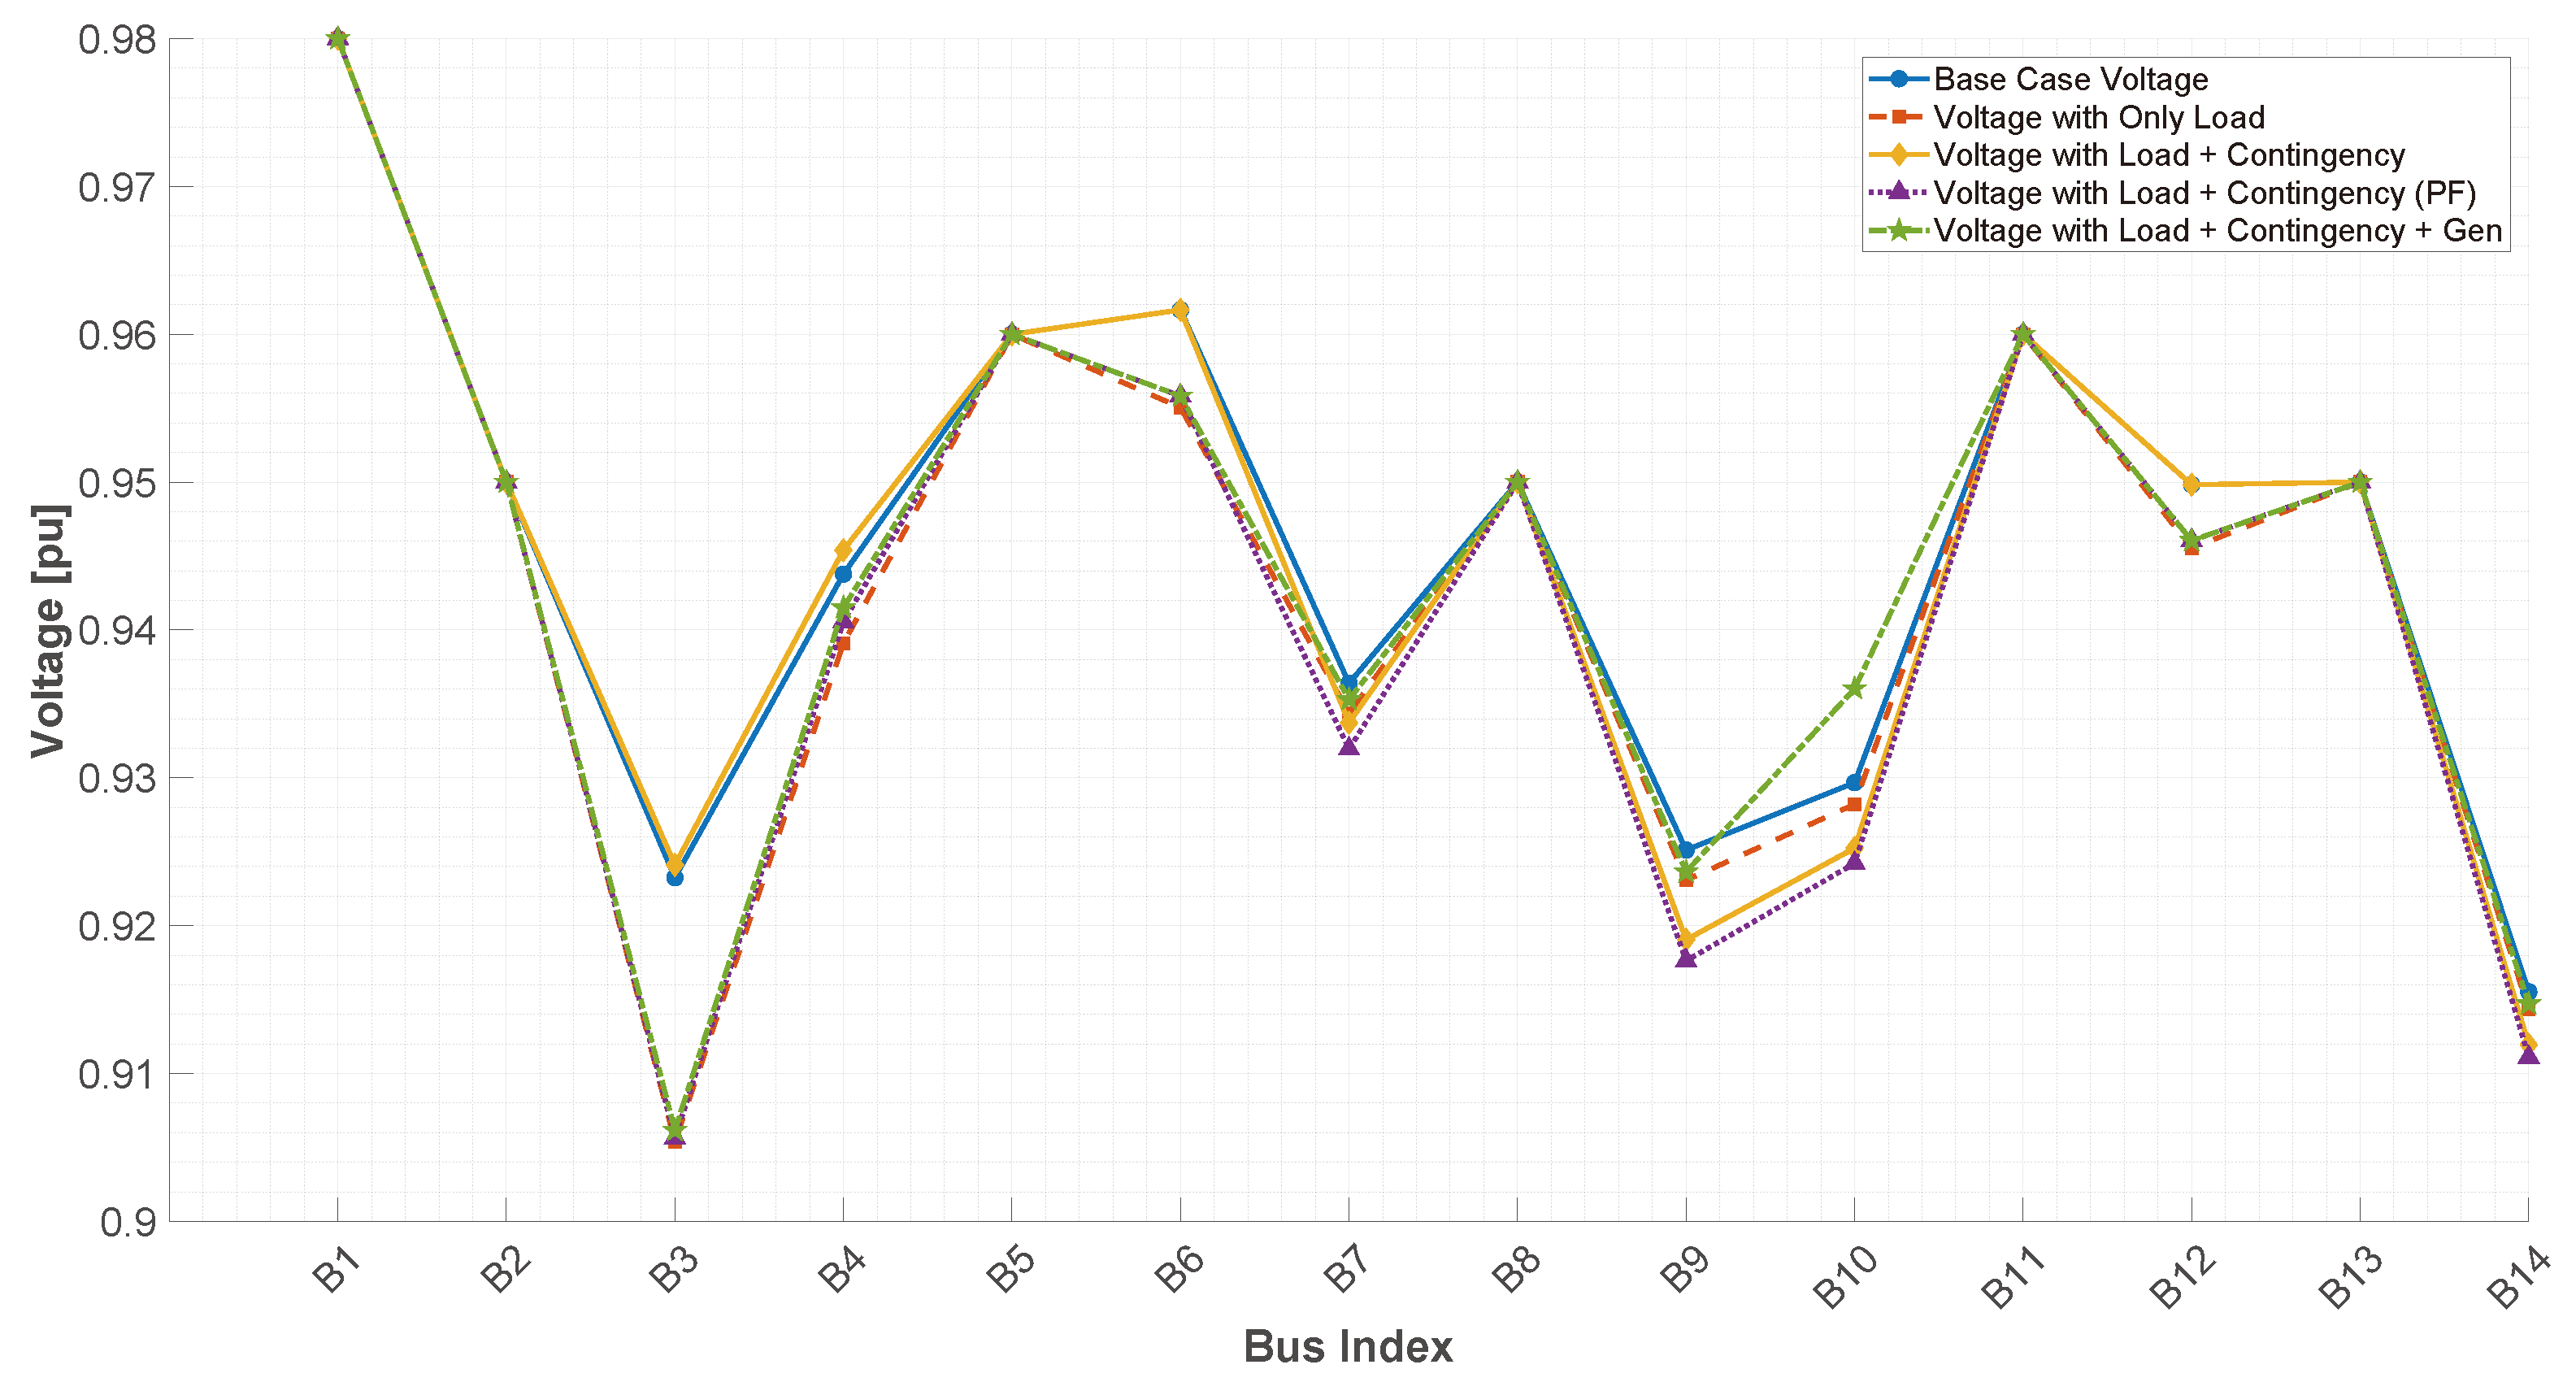
In this regard, this work proposes a methodology where the analysis region is extended to include contingency and overload conditions to identify the critical lines and weak busbars and optimally position a single auxiliary distributed generator averted to the determined sensitive loading conditions. To the best of our knowledge, the difference between this study and others is that the proposal is tested using three IEEE systems (14, 30, and 118 busbars) and implements decision strategies derived from FVSI statistical inflection point analysis. The approach enhances voltage profiles while FVSI peak values almost halve, proving a cost-efficient scalable solution to operate electrical systems safely under critical conditions.

1.1. Literature Review

This section presents the most relevant works in the review of the state of the art that have used the Fast Voltage Stability Index (FVSI) to improve stability in electrical power systems by connecting active or reactive power.
Researches in [1] propose the optimal allocation of solar PV and wind generators on the IEEE 33-bus system using the Fast Voltage Stability Index (FVSI) to identify the three most critical buses (buses 6, 3, and 28). Simulations in MATLAB R2023b. and MATPOWER 7.1 showed that allocating three solar PV units reduced power loss from 0.20 MW to 0.093 MW (a 53.5% reduction), while three wind generators reduced it further to 0.049 MW (75.5% reduction). The voltage at the weakest bus (bus 18) improved from 0.90 to 0.98 p.u. Wind generators outperformed solar PV due to their additional reactive power contribution. This paper presented an FVSI strategy to allocate generation while stabilizing voltage profiles.
The study presented in [2] proposed a Genetic Algorithm (GA)-based method to determine the optimal placement of Thyristor-Controlled Series Capacitor (TCSC) devices to improve voltage profiles in power systems. Using the IEEE 30 bus-bar test system, the methodology identified weak buses via the Fast Voltage Stability Index (FVSI) and applied GA to minimize voltage deviation and enhance system stability. Results showed that optimal TCSC placement reduced real power loss by 15.67% and improved minimum bus voltage from 0.91 to 0.963 p.u. The approach outperformed traditional methods in both convergence speed and voltage profile enhancement.
Authors in [3] propose a voltage control strategy for radial distribution systems (RDS) integrating electric vehicles (EVs) by leveraging reactive power procurement as an ancillary service. Using the IEEE 14 bus-bar radial system, the methodology involves optimal DG placement (Bus 9, 58 MW) via FVSI and voltage constraints, followed by iterative reactive power estimation to restore voltage profiles under EV loading scenarios. Three EV case studies show voltage dips (e.g., 0.9 p.u. at Bus 3) and successful compensation without grid support in Case 1. In Cases 2 and 3, additional reactive power was required. Results support cost-based reactive compensation to maintain stability amid EV-induced load stress.
Researches in [4] propose a multi-objective optimization method using the Marine Predators Algorithm (MPA) for optimal allocation of hybrid electric vehicle charging stations (EVCS) and renewable distributed generators (RDGs) in the IEEE 69 bus-bar system. The objective functions minimize active power loss (APL) and improve voltage stability indices (VSI, FVSI, LPQ, PVSI). Results show that the EVCS-WTDG case outperformed all others, reducing active/reactive power losses by 96.27% and 91.51%, respectively, and improving minimum bus voltage to 0.991 p.u. The MPA algorithm consistently performed better than other algorithms like SMA, GWO, and POA.
The study presented by [5] developed an Artificial Neural Network (ANN)-based method to estimate voltage stability indices (FVSI and LMN) using synthetic Phasor Measurement Unit (PMU) data for IEEE 14, 30, and 57 bus-bar systems. The methodology involved optimal PMU placement via Mixed Integer Linear Programming and ANN training using 70% of the dataset. The results showed strong prediction accuracy, with MSE values as low as 1.05 × 10⁻⁶ (IEEE 30 LMN) and correlation coefficients R greater than 0.998. Critical lines were identified in IEEE 57 (with FVSI = 1.45 and LMN = 2.22). The ANN achieved results almost identical to Newton-Raphson-based calculations.
Paper presented in [6] proposes an Arithmetic Optimization Algorithm (AOA) for optimal placement and sizing of DSTATCOM units in distribution systems, targeting minimization of active power loss (APL) and enhancement of voltage stability indices (VSI, FVSI, LPQ, PVSI). Applied to IEEE 33 and 69 bus-bar systems, results showed APL reductions of 32.24% and 33.09%, respectively, with three DSTATCOMs. Voltage profiles improved significantly, with minimum voltages raised to 0.9359 p.u. (33-bus) and 0.9275 p.u. (69-bus). The AOA converged in under 50 iterations, proving highly efficient and effective for enhancing voltage stability and minimizing losses in distribution networks.
Authors in [7] compare two techniques—Power Stability Index (PSI) and Fast Voltage Stability Index (FVSI)—for optimal placement of Static VAR Compensator (SVC) devices in the IEEE 14-bus system. Using Newton-Raphson power flow in MI Power, buses 10 and 11 were identified as optimal candidates. SVC placement at bus 10 (FVSI) reduced active power loss by 20.45% and reactive loss by 52.9%, while placement at bus 11 (PSI) reduced active loss by 27.3% and reactive loss by 51.3%. Both techniques improved voltage profiles, with FVSI offering better overall system stability through reactive power flow reduction.
Researchers in [8] introduce a new line stability index (NLSI-1) for predicting voltage collapse in power systems, applied to the 28-bus, 330 kV Nigerian National Grid. The index incorporates voltage angle differences and a switching logic to improve accuracy over conventional indices like FVSI and Lmn. The simulation results in the base and contingency scenarios show that NLSI-1 matches existing indices with an error of less than 2.4% and identifies Bus 16 as the weakest, with a critical line at 16–19 and a maximum reactive load of 139.5 MVAr. NLSI-1 proves computationally efficient and effective for real-time voltage stability assessment.
Research in [9] introduced and evaluated a new voltage stability index, namely the Modern Stability Assessment Index (MSAI), comparing its effectiveness against established indices, including NCPI, MVSI, Lmn, FVSI, LQP, NLSI, NVSI, and VSLI. Numerical analyses were conducted using IEEE 30-bus, 57-bus, and 118-bus test systems under various loading scenarios, including heavy reactive power loads, combined active and reactive power loads, and N 1 and N 2 contingency conditions. The advantages and limitations of each evaluated index were thoroughly discussed, highlighting MSAI’s superior ability to approach the stability limit accurately (index value 1.00), thus reliably predicting voltage collapse points and identifying critical system lines. The numerical results provide valuable insights into each index’s performance, supporting the recommendation of MSAI as a highly suitable tool for effective and accurate monitoring of power system stability.
The study in [10] proposed a Novel Collapse Prediction Index (NCPI) to accurately predict voltage collapse and rank contingencies in power systems. NCPI was tested against established indices such as Lmn, FVSI, LQP, NLSI, and VSLI through comprehensive numerical studies on IEEE 30-bus and IEEE 118-bus systems. The analysis included heavy active/reactive power loading scenarios and various N 1 and N 2 contingency conditions. Results indicated NCPI’s superior performance, accurately reaching stability limits (1.00) and reliably identifying critical lines and weak buses. NCPI provided more precise predictions and robust performance under diverse conditions, outperforming existing indices by considering critical assumptions overlooked by others.
The study by [11] proposed a generalized voltage stability index to accurately evaluate voltage stability in both transmission and distribution (T&D) networks, considering their interactions and the effect of line length (long, medium, and short lines). Unlike existing indices, the proposed method assesses stability in T&D networks individually or combined, including the impacts of distributed generation (DG) and tap-changers. Numerical evaluations confirmed its superior performance over established indices, indicating it could effectively replace multiple indices currently required for different scenarios.
Researches in [12] comprehensively reviewed voltage stability monitoring and improvement methods in renewable energy-integrated deregulated power systems. It evaluated traditional assessment techniques like continuation power flow (CPF), modal analysis, and voltage stability indices (VSIs), alongside emerging machine learning approaches, such as Artificial Neural Networks (ANN), Fuzzy Logic, Decision Trees, and Support Vector Machines. The research highlighted the critical roles of FACTS devices, including STATCOM, SVC, and UPFC, for enhancing voltage stability under renewable energy penetration.
The paper presented in [13] analyzed voltage stability enhancement in distribution networks integrated with a squirrel cage induction generator (SCIG) wind turbine using voltage stability indices (FVSI and Lmn) and the continuation power flow (CPF) technique. The CPF method identified the optimal location for the wind generator, improving voltage profiles and system loadability from 1.7 to 1.72 p.u. Voltage stability indices determined the weakest lines and buses, guiding the proper placement of STATCOM and SSSC FACTS devices. Simulation results indicated that STATCOM performed better than SSSC in restoring voltage stability under three-phase fault conditions, providing quicker reactive power support and system stabilization.
The study by [14] proposed a Modern Voltage Stability Index (MVSI) designed to accurately predict voltage collapse and estimate maximum loadability for identifying weak buses and critical lines in power systems. The MVSI partially considers line resistance, addressing inaccuracies from completely ignoring it, which can cause prediction errors exceeding 70%. The proposed index was evaluated against established indices like Lmn, FVSI, LQP, NLSI, VSLI, and NVSI on the IEEE 30-bus system under various load conditions (heavy active, reactive, and apparent power). Results demonstrated MVSI’s superior performance, consistently achieving values close to the stability limit (1.00).
Research in [15] focuses on enhancing voltage stability in high wind energy penetration power systems. The authors identify weak nodes within the system and quantify their short-circuit ratio (SCR) requirements under voltage safety constraints. They propose a third-order dynamic model of a virtual synchronous generator (VSG) and design a virtual transient reactance to meet these SCR requirements. Simulations demonstrate that under the proposed control strategy, grid-forming wind turbines can effectively enhance voltage stability by optimizing transient reactance, thereby improving the system’s voltage support capabilities.
The paper presented in [16] presented a congestion management method utilizing the Fast Voltage Stability Index (FVSI) for identifying congested lines, combined with Particle Swarm Optimization (PSO) to determine the optimal sizing and placement of FACTS devices. FVSI assessed voltage stability conditions across power lines, identifying critical lines when reactive loads at selected buses reached maximum loadability. Tests on the IEEE 30-bus system identified congestion on specific lines (e.g., line 20 at bus 14 with an FVSI of 0.9751). Subsequent optimal placement and sizing of FACTS devices significantly reduced system losses and improved voltage profiles, demonstrating the effectiveness of the proposed congestion management technique.
Authors in [17] proposed a New Voltage Stability Pointer (NVSP) to assess line contingency ranking and identify vulnerable lines in power systems. The NVSP was derived from a simplified 2-bus network model and tested on the IEEE 14-bus system. Simulation results demonstrated NVSP’s capability to accurately rank line contingencies by incrementally varying reactive power loads until maximum loadability was reached. Compared with existing indices (Lmn, FVSI), NVSP provided enhanced accuracy and faster computational performance. The results indicated that NVSP effectively identified the most critical lines approaching voltage collapse (values near unity), demonstrating its practical application for real-time voltage stability monitoring and contingency planning.
Authors in [18] improved the resilience of power grids against extreme events through strategic placement of distributed generation (DG). The research addressed voltage stability challenges caused by multiple line or generator outages using a two-stage method involving Voltage Stability Constrained Optimal Power Flow (VSCOPF) and Integer Programming (IP). Evaluations on the IEEE 118-bus system showed the method effectively maintained system stability under 40 extreme scenarios, requiring DG placements at buses 21, 44, 52, and 95. Specifically, single DG placement stabilized 32 scenarios, while paired DG placements were necessary for the remaining 8, demonstrating the strategy’s effectiveness in significantly reducing the likelihood of voltage instability.
The study presented by [19] proposes a methodology to enhance voltage stability under N 1 contingencies by optimally placing and sizing a static VAR compensator (SVC) based on the Fast Voltage Stability Index (FVSI). Using Newton-Raphson power flow and brute-force simulation across all line outages, the algorithm locates the most critical line. It determines the SVC size (5–100 Mvar range) needed to restore FVSI and voltage profiles. Results on IEEE 14, 30, and 118-bus systems showed 100% accuracy in restoring FVSI values to pre-contingency levels, with average FVSI reductions up to 20.33% and full voltage profile recovery using a single SVC installation. However, that work did not include generator-based optimization, statistical trend analysis, or load stress modeling, which are the focus of the present study.
Author in [20] aimed to enhance stability assessment (SA) in new power systems (NPS) dominated by renewable energy and power electronics. The research presents a framework comparing traditional and deep learning-driven SA methods, analyzing over 100 studies. Results show that transient stability accounts for 77% of research, while voltage stability is only 17%, indicating a research gap. Time-series data analysis grew by 38%, emphasizing dynamic modeling needs. Deep learning methods, especially LSTM and CNN, outperform traditional SVM and DT in accuracy and scalability but face deployment challenges due to high communication and computational requirements. Future trends favor edge computing and spatial-temporal analysis.
The study proposed by [21] developed an ANFIS-based predictive model to assess voltage stability using the Novel Line Stability Index (NLSI) and Critical Boundary Index (CBI). Input features included resistance, reactance, load levels, voltage, and angle differences. Tested on IEEE 14 and 118 bus systems, the model achieved a Mean Absolute Percentage Error (MAPE) as low as 0.361% for CBI and 3.15% for NLSI, with RRMSE below 2% for CBI. The correlation coefficient R exceeded 0.998 for CBI across all simulations, confirming superior predictive performance. Results validate CBI as a robust, accurate, real-time voltage stability monitoring tool.
Researches in [22] reviews power system optimization approaches to mitigate voltage instability using Particle Swarm Optimization (PSO). It surveys over 30 voltage stability indices (e.g., FVSI, Lmn, LQP, NLSI), analyzing their pros and cons. The methodology highlights PSO’s application in optimal FACTS placement, reactive power compensation, and distributed generation sizing. Results from multiple IEEE test systems report significant voltage profile improvement and power loss reductions exceeding 20% in some cases. The paper emphasizes PSO’s fast convergence, robustness, and ease of implementation, positioning it as a key technique for voltage stability enhancement in modern power systems.
Despite the extensive use of the FVSI index in power system monitoring and the integration of optimization methods for voltage support, several gaps remain in the literature. Most studies focus on voltage profile enhancement without formulating statistical decision frameworks based on the behavior of FVSI across multiple contingency scenarios. Furthermore, many optimization methods rely on multi-generator or FACTS-based reinforcement, which, while effective, lack cost-efficiency and often neglect the implications of parameter uncertainties or variability in system behavior. Additionally, inflection point analysis as a strategy for determining optimal generator size and placement is rarely, if ever, explored in existing works.
This paper addresses the above gaps by introducing a novel data-driven methodology that combines FVSI frequency analysis, load stress simulations, and a statistical inflection point detection algorithm to determine the optimal sizing and placement of a single distributed generator (DG). The proposed approach enables low-cost voltage stability reinforcement in critical areas under N 1 contingencies and overload conditions. Unlike prior work, our method offers quantified FVSI improvements, voltage profile recovery, and a detailed comparative analysis across three benchmark test systems, validating its scalability and practical applicability.
To further highlight the novelty and practical relevance of this study, a direct comparison with representative traditional approaches is presented in Table 1. This comparison highlights the methodological differences in the decision-making strategy, cost-effectiveness, robustness under contingencies, and scalability of the system. By contrasting key characteristics, it becomes evident how the proposed framework builds upon and extends existing literature through a statistically grounded and minimally intrusive reinforcement strategy.

1.2. Organization

Section 1—This presents the paper’s introduction and a review of the state of the art, showing the main research articles that have employed the FVSI to analyze electrical power systems stability for generation sizing or location.
Section 2—This paper explains in detail the methodology formulation in a step-by-step process for the optimal location and sizing of generation for FVSI improvement while focusing on voltage profile limitations.
Section 3—This section presents the application of this paper’s proposed methodology in three study cases, IEEE 14, 30, and 118 bus-bar transmission systems: metrics and statistical analysis.
Section 4—Conclusions: presents a summary and overview of quantitative results obtained in the study cases; this section validates the effectiveness of the proposed index.
Section 5—Future work and challenges: This presents challenges for complex analysts to consider to further improve stability by analyzing additional conditions for the FVSI and further validations under more conditions and different scenarios.

2. Methodology

This paper proposes a methodology to strengthen the stability of an electrical power system by analyzing transmission stability and identifying weak lines using the voltage stability index (FVSI). The methodology determines a distributed generator’s optimal location and proper sizing, ensuring the system can recover to an operating state close to its baseline state under critical overload conditions at vulnerable nodes and N 1 contingency scenarios due to line disconnections. The proposed strategy seeks an effective, low-cost, and easy-to-implement solution based on incorporating a single distributed generator, which mitigates the deterioration of voltage stability in critical situations.
The methodology proposed in this paper will be explained in detail in the following sections, starting with concepts essential for the method proposed in this research.

2.1. Electrical Power System Analysis, Power Flow Calculations

To extract the electrical parameters of interest in the analyzed power systems, this work uses power flows calculated using the Newton-Raphson method. This numerical method allows solving systems of nonlinear equations resulting from applying Kirchhoff’s laws to an electrical network [23]. In this study, the equations that describe the active power P i (Active power at sending node i) and reactive power Q i (Reactive power at sending node i) flows are specifically used, which in turn depend on the voltage magnitudes V i and phase angles δ i , as shown in Equations (1) and (2).
P i ( x ) = j = 1 n V i V j G i j c o s δ i j + B i j s i n δ i j
Q i ( x ) = j = 1 n V i V j G i j s i n δ i j B i j c o s δ i j
Solving these equations using the Newton-Raphson method will obtain the electrical parameters necessary for calculating the FVSI stability index, such as the voltages at the sending and receiving nodes, the active and reactive power at each bus, and other relevant data to evaluate the system’s correct convergence.

2.2. Stability Index: Fast Voltage Stability Index (FVSI)

In the study of the stability of electrical power systems, various stability indices have been developed over the years to evaluate the behavior of busbars, nodes, and other network elements, as well as variables of interest such as voltage or frequency. Well-known examples of these indices include the L-Index, the VCPI (Voltage Collapse Proximity Indicator), the LSI (Line Stability Index), and the FVSI (Fast Voltage Stability Index), among others.
This paper addresses the effect of N 1 contingencies (line disconnections) and adopts the FVSI index as the primary metric for analyzing stability. This indicator provides a simple estimate of each line’s proximity to instability. Its main advantage lies in its simplicity: values close to one indicate a line close to the stability limit, while values close to zero indicate normal operating conditions.
Figure 1 shows a section of an electrical power system illustrating the procedure for calculating the FVSI. This scheme considers the parameters of a sending node i and a receiving node j. Equation (3) presents the formulation of this index, where Q j i is the receiving reactive power at node j, V i is the voltage magnitude at the sending node, X i j is the reactance of line i j , and Z i j is the impedance of line i j .
F V S I i j = 4 Z i j Q j i V i 2 X i j
While several more recent indices—such as the Line Stability Index (Lmn), Novel Voltage Stability Index (NVSI), and Modern Stability Assessment Index (MSAI)—have been proposed in the literature, the Fast Voltage Stability Index (FVSI) remains one of the most widely adopted tools due to its computational simplicity, clear interpretability, and proven correlation with proximity to voltage collapse. These attributes make FVSI particularly well-suited for large-scale contingency screening and iterative evaluations, as required in the proposed methodology. Furthermore, FVSI offers an intuitive scale (values close to 1 indicate critical lines), which facilitates comparative analysis across scenarios. Its lightweight formulation allows repeated computation under multiple stressed operating conditions, which is central to this paper’s approach that relies on statistical frequency and inflection point analysis. Therefore, FVSI provides a practical and robust basis for the data-driven reinforcement strategy developed in this study.

2.3. Proposed Methodology for Optimal Generation Location and Sizing

The methodology proposed in this paper begins with loading the electrical power system data, including line parameters, generator specifications, and bus information. A baseline power flow analysis is then conducted using the Newton–Raphson method, providing the initial voltage magnitudes and power values at each bus. Following this, an N–1 contingency analysis is performed by sequentially disconnecting each transmission line and recalculating the power flow for each scenario. The Fast Voltage Stability Index (FVSI) is computed across all lines, allowing the identification of the most critical line—i.e., the one that most frequently exhibits instability across multiple contingencies. Once this critical line is determined, its associated buses (nodes i and j) are identified. The analysis then selects neighboring nodes that are directly connected to either node i or j, excluding slack or generator buses, as candidate weak buses. This diagnostic phase establishes a focused region of vulnerability within the network, serving as the foundation for simulating additional load increments and assessing the feasibility and impact of optimally placing a support generator.
In the next phase, additional loads are randomly assigned to the identified weak nodes, simulating critical overload conditions. The power flow is recalculated for each case, and the FVSI is determined, quantifying the degree of induced instability. The methodology then explores different combinations of location and sizing of a single booster distributed generator, seeking to restore operating values close to the original state. Through successive iterations, power ranges are varied to find the optimal point that increases voltages and reduces the FVSI on critical lines. Finally, the optimal DG is tested under overload and line disconnection scenarios, ensuring that the system regains stability and voltages are within safe ranges. This validates the implemented strategy, demonstrating its effectiveness in the face of potential extreme conditions and additional nonlinear operating scenarios. A fully detailed explanation for this methodology is explained in Algorithm 1.

Data-Driven Nature of the Methodology

The term data-driven in this context refers to a methodology that bases its decisions on statistical patterns extracted from empirical simulations, rather than relying solely on fixed analytical rules or theoretical formulations. Unlike traditional model-driven approaches, which use predefined equations or optimization objectives derived from system topology, this research’s method analyzes the variation of the Fast Voltage Stability Index (FVSI) across a large set of contingency and overload scenarios. By collecting FVSI values under multiple simulated stress conditions, the methodology performs frequency analysis and statistical profiling to identify the most frequently unstable lines, determine vulnerable buses, and quantify the effect of Distributed Generator (DG) injection on system recovery. Furthermore, the optimal sizing and placement of the DG are selected through inflection point analysis and deviation metrics, making the solution dependent on the system’s data behavior under stress rather than rigid modeling assumptions. This empirical insight enables a more adaptive and scalable planning process, especially useful in uncertain or complex grid environments.

2.4. Case Studies

The proposed methodology will be validated in transmission systems with different complexities, proving the proposed solution’s scalability. Thus, the IEEE 14, 30, and 118 bus-bar systems have been selected for this paper as case studies. These systems represent transmission power systems that researchers have used to test and validate new algorithms and methodologies. The IEEE 14 bus-bar system was developed exclusively for research, and the 30 and 118 systems represent portions of real power systems located in the United States.
The three selected test systems used in this study are standardized IEEE bus-bar networks commonly employed in voltage stability research. The IEEE 14-bus system has 14 bus-bars, 5 generators, and 11 loads, representing a small-scale network ideal for initial validation. The IEEE 30-bus system has 30 bus-bars, 2 generators and 9 loads, offering a medium-sized meshed configuration that simulates practical distribution complexity. The IEEE 118-bus system is a large-scale testbed comprising 118 buses, 19 generators, and 91 loads, which accurately reflects the dynamics of a real transmission network in the United States. These systems were selected to verify the scalability, robustness, and consistency of the proposed method across varying system sizes and topologies.
Algorithm 1: Methodology for DG-Based Restoration of Pre-Contingency Performance
Step: 1
Load System Data
  •    Base electrical parameters from lines, buses, generators, and loads
  •     S y s t e m D a t a L o a d S y s t e m D a t a ( B u s d a t a , G e n d a t a , L i n e d a t a , L o a d d a t a )
Step: 2
Power Flow Calculations
  •    By executing Newton–Raphson method:
  •     V i V j δ i δ j P o w e r F l o w A n a l y s i s ( S y s t e m D a t a )
  •    Compute F V S I base if needed.
Step: 3
N 1 Contingencies on Lines
  •     for   k = 1 : N lines
  •         Remove Line ( k ) from L i n e _ d a t a
  •         Run power Flow, Go to Step 2
  •         Identify max ( F V S I k )
  •         Restore Line ( k )
  •     end for
  •     Select line with highest FVSI-frequency L weak
Step: 4
Critical Nodes & Overload
  •    From L weak , extract ( N o d e i , N o d e j ) .
  •    Identify neighbors if needed (exclude slack/PV).
  •    Define P max , Q max ; distribute loads stochastically in { N o d e i , N o d e j , } .
  •    Run power Flow, Go to Step 2
Step: 5
DG Placement & Sizing
  •     for each candidate node N o d e c
  •        for   m = 0 : Δ : G e n max
  •           Insert G e n ( N o d e c , s i z e = m )
  •           Go to Step 2
  •           Evaluate | F V S I temp F V S I base |
  •       end for
  •       Select { m opt , N o d e c } minimizing deviation from base
  •     end for
  •      OptimalBus , OptimalSize
Step: 6
Validation under Contingencies
  •    Apply ( OptimalBus , OptimalSize ) to each line-out scenario.
  •    Check F V S I withGen , V near original.
Step: 7
Return Final Output
  •     { OptimalBus , OptimalSize } ; updated F V S I , V profiles, ensuring stability.

3. Results

3.1. Case Study: IEEE 14-Bus-Bar System

The FVSI is calculated for all power lines in the IEEE 14 bus-bar system base form as a starting point. Then, the top 5 weakest lines (highest values of FVSI) are identified as shown in Table 2 where it is clear that power line l i n e 2 5 is the closest to instability with a 0.1392 FVSI value.
Then, for the second step in Algorithm 1, a frequency approach detects the weakest power line in N 1 scenarios. First, each line in the system is individually removed ( N 1 contingency), and the FVSI for each power line is recalculated. In every contingency scenario, the line with the highest FVSI is flagged. These results are then compiled to determine how often each line emerges as the system’s weakest under its respective contingency. Thus, the power line that appears most frequently across all scenarios is deemed the most common weak line. This methodology ensures the final selection is critical under a single outage but repeatedly proves to be the most unstable across numerous disconnections. The results from this step are shown in Table 3 in which power l i n e 2 5 is identified as the weakest in 75% of contingencies with an average FVSI of 0.1392. These results can be also verified in Figure 2, where the accumulative effect of the FVSI is prominent in power l i n e 2 5 .
As indicated in Step 3 of Algorithm 1, critical nodes are chosen by examining all nodes directly connected to the sending node i and the receiving node j of the system’s weakest power line ( l i n e 2 5 ) . The slack bus is explicitly excluded from this set, as including it might distort the intended behavior analysis of the network. Consequently, nodes 2, 3, 4, 5, and 6 are selected as candidate nodes for the increase in load in subsequent overload scenarios.
To define the vulnerability region for load stress simulations, the methodology identifies all nodes directly connected to the two terminal buses (i and j) of the critical line determined by the FVSI frequency analysis. This includes adjacent buses on both sides of the line, except for the slack bus and generator buses, which are excluded to avoid distortion of the stress profile. This approach ensures that load increments are applied in areas most sensitive to instability propagation, as these nodes are topologically and electrically coupled to the weakest segment of the system. This local reinforcement strategy enables targeted evaluation of system resilience while avoiding unnecessary system-wide stress.
After critical nodes are identified and selected, additional loads are allocated to a subset of identified weak buses n L to simulate stressed operating conditions in critical areas of the power system. A total active power increment P max is defined for the IEEE 14 bus bar system with a value of 100 MW, and a corresponding reactive power component Q max = 0.25 · P max is included to maintain an overall 80 / 20 split between active and reactive power, ensuring a typical power factor representation. The total apparent power S max = P max + Q max is then partitioned randomly across the selected buses using a normalized random vector r R n L such that r i = 1 . For each selected bus i, the injected load is defined as P i = 0.8 · r i S max and Q i = 0.2 · r i S max , and these values are added to the original load profile. This process is repeated over multiple scenarios to evaluate system performance under diverse yet physically consistent loading conditions.
Then, the overload system, N 1 contingencies are performed, thus having a baseline of critical conditions for the system under critical load conditions and power line disconnections. Figure 3 explores the FVSI of the original system and the system under the conditions described. This figure indicates how the system stability is compromised under these critical conditions.

3.1.1. Optimal DG Placement

This section will further detail Step 4 of Algorithm 1, which proposes the optimal generation support placement and sizing to restore system voltage stability under contingency and overloaded conditions. For each line disconnection scenario L i , the FVSI index is computed for the network under critical load conditions. A potential support location b gen ( i ) is selected based on the location of the highest FVSI value in contingency i.
The generator injection is defined in discrete steps, with a maximum value P gen max and step size Δ P , as described in Equation (4):
P gen = { 0 , Δ P , 2 Δ P , , P gen max }
For each increment in generation z, a power flow analysis is performed, and the FVSI is recalculated as shown in Equation (5):
FVSI i , z = index _ fvsi ( L i , PF ( b gen ( i ) , z · Δ P ) )
Then, to evaluate the effect of generation on system stability, the absolute difference with respect to the base case FVSI is computed as shown in Equation (6):
Δ FVSI i , z = FVSI i , z FVSI base
After this, the Maximum deviation: max i , z = max ( Δ F V S I i , z ) and Standard deviation: σ i , z = std ( Δ FVSI i , z ) are calculated as statistical indicators.
Following, to detect the optimal generation step, the second derivative of the maximum deviation is computed and smoothed as shown in Equation (7):
δ 2 max i , z = smooth d 2 d z 2 max i , z
Finally, The optimal DG step z i * is the first significant inflection point in the smoothed curve. If this condition is not possible, the generator size that minimizes the standard deviation is selected following the criteria shown in Equation (8).
z i * = arg min z δ 2 max i , z > τ if exists arg min z σ i , z otherwise
Finally, the DG is placed at b gen ( i ) with size z i * · Δ P . Then a statistical analysis is performed on all scenarios to identify the most common optimal generator size and placement.
For the IEEE 14 bus-bar system, this process was executed in every contingency; due to the large amount of data, Figure 4 shows the optimal DG placement and sizing process for the ninth contingency when line number 9 ( l i n e 4 9 ) was disconnected and critical nodes overloaded.
By executing this process for all the contingencies, the optimal solution was located at Bus 10 with a generator of 20 MW; the detailed results can be seen in Table 4. This optimal solution allows the system to recover stability conditions similar to the based conditions with the connection of a single generator with the small possible power, which in itself is also cost-effective.

3.1.2. Optimal Solution Validation

To validate the effectiveness of the proposed methodology described in Algorithm 1, the optimal solution—corresponding to the allocation of a 20 MW generator at bus-bar 10 is tested under five distinct operational scenarios. These scenarios are designed to incrementally stress the system and evaluate the robustness of the proposed reinforcement strategy. The validation process is shown as it follows:
  • The original system operating under normal base-case conditions.
  • A stressed condition with additional load applied to critical nodes identified in Section 3.1.
  • A contingency scenario involving N 1 line disconnections to simulate structural vulnerability.
  • A combined scenario incorporating both contingencies and load stress.
  • The application of the optimal DG support under the combined contingency and overload conditions.
The Fast Voltage Stability Index (FVSI) and voltage profiles are computed and compared for each case. These metrics allow a quantitative and qualitative assessment of system stability and voltage support improvements achieved through the proposed solution.
  • FVSI analysis
The IEEE 14-bus system includes 20 transmission lines, which results in 20 distinct N 1 contingency scenarios, each corresponding to the disconnection of a single line. For every contingency case, a specific load stress condition is imposed on critical nodes identified using the FVSI-based vulnerability assessment. The optimal DG placement and sizing strategy is applied to each combined contingency and loading scenario.
Figure 5 presents the mean FVSI values for all contingencies across the five evaluated conditions. As can be seen, the optimal solution, represented by the green trend line, significantly enhances voltage stability by decreasing FVSI in both overload and line disconnection. The FVSI values achieved approach those of the original system, thereby validating the effectiveness of the proposed reinforcement strategy.
Given the extensive data generated across all scenarios, a representative case is selected to illustrate the results. Specifically, one contingency scenario is randomly chosen to graphically present the impact of the optimal solution on voltage stability. This visual analysis enables an in-depth evaluation of the system’s behavior under line disconnection, additional load, and the proposed corrective action. Figure 6 shown the FVSI for each power line when the 9th line ( l i n e 4 9 ) is disconnected.
Figure 6 clearly demonstrates that the implementation of the optimal generation strategy substantially reduces FVSI values across all transmission lines, effectively restoring the system’s performance to levels close to the original (pre-contingency) conditions. To provide a complete assessment of this improvement, Table 5 presents a detailed statistical analysis for the scenario in which line l i n e 4 9 is disconnected. The table includes the mean, standard deviation, median, and maximum FVSI values across all validation scenarios.
Finally, Table 6 presents the percentage reduction in FVSI achieved by the optimal generation solution when compared to the contingency-only and contingency with load scenarios. The results confirm that the proposed method performs as expected, achieving a reduction of 21.89% in the mean FVSI relative to the contingency-only case and 10.41% relative to the contingency with load scenario.
  • Voltage profile analysis
Similarly, as with the FVSI analysis, the optimal DG placement and sizing strategy is applied to each combined contingency and loading scenario.
Figure 7 presents the mean FVSI values for all contingencies across the five evaluated conditions. As can be seen, the optimal solution, represented by the green trend line, enhances the voltage profile in both overload and line disconnection. The objective was to decrease FVSI while increasing the voltage profile. Therefore, these results verify the effectiveness of the proposed strategy.
As with the FVSI analysis, due to the extensive data generated, one contingency scenario is randomly chosen to graphically present the impact of the optimal solution on the voltage profile. Figure 8 shown the Voltage Profiles for each bus-bar when the 9th line ( l i n e 4 9 ) is disconnected.
Figure 8 illustrates that the application of the optimal generation strategy significantly enhances the voltage profiles across all bus bars. This outcome confirms the second objective of the proposed algorithm, namely, improving voltage stability under stressed conditions. Notably, the voltage levels achieved after applying the optimal solution exceed those of the original (pre-contingency) state in several cases. A detailed evaluation of this improvement is presented in Table 7, which reports the mean, standard deviation, median, and minimum voltage values for the scenario where line l i n e 4 9 is disconnected. The table comprehensively compares all validation scenarios, highlighting the effectiveness of the proposed approach.
Finally, Table 8 presents the percentage improvements in the voltage profile obtained by applying the optimal generation solution, compared to both the contingency only and the contingency with load scenarios. As expected, the voltage magnitude increased by 0.486% relative to the contingency + load case and by 0.066% compared to the contingency-only case. All voltage quality indicators show consistent improvement, with only the standard deviation values decreasing. This reduction in deviation indicates a more uniform voltage distribution across the network, which is not only favorable but, in this case, even better than that of the original base-case scenario.

3.2. Case Study: IEEE 30-Bus-Bar System

The second study case is based on the IEEE 30 bus bar system. For this cases the same structure analysis as for the IEEE 14 bus-bar system will be followed. First, the FVSI is calculated for all power lines; then, the top 5 weakest lines (highest values of FVSI) are identified as shown in Table 9 where it is clear that power line l i n e 2 5 is the closest to instability with a 0.1952 FVSI value.
Following, the second step in Algorithm 1 is applied for a frequency approach that detects the weakest power line in N 1 scenarios. The results from this step are shown in Table 10 in which power l i n e 2 5 is identified as the weakest in 92.68% of contingencies with an average FVSI of 0.1952. These results can be also verified in Figure 9, where the accumulative effect of the FVSI is prominent in power l i n e 2 5 .
Next, step 3 of Algorithm 1, critical nodes are chosen by examining all nodes directly connected to the sending node i and the receiving node j of the system’s weakest power line ( l i n e 2 5 ) . As with the first study case, the slack bus is excluded, and consequently, nodes 2, 3, and 4 are selected as candidate nodes for the increase in load in subsequent overload scenarios.
Then, similarly, as with the previous study case, additional loads are allocated to a subset of identified weak buses n L , considering a total active power increment P max of 100 MW, and a corresponding reactive power component Q max = 0.25 · P max is included to maintain an overall 80 / 20 split between active and reactive power, also the same normalized random distribution described in Section 3.1 for the loads is considered for this study case.
Then, the overload system N 1 contingencies are performed, thus having a baseline of critical conditions for the system under critical load conditions and power line disconnections. Figure 10 explores the FVSI of the original system and the system under the conditions described. This figure indicates how the system stability is compromised under these critical conditions, and even as it is obvious that all values are increased, what stands out the most is that there are more outliers in the contingency cases that represent FVSI values far greater than average.

3.2.1. Optimal DG Placement

For step 4 of Algorithm 1, the same process described in Equations (4)–(8) for the optimal generation size and location for the IEEE 30 bus-bar system is followed, this process was executed in every contingency; due to a large amount of data, Figure 11 shows the optimal DG placement and sizing process for the ninth contingency when line number 15 ( l i n e 4 12 ) was disconnected and critical nodes overloaded.
By executing this process for all the contingencies, the optimal solution was located at Bus 9 with a generator of 40 MW; the detailed results can be seen in Table 11.

3.2.2. Optimal Solution Validation

The optimal solution—corresponding to the allocation of a 40 MW DG at bus-bar-9 is tested under the same five distinct operational scenarios defined in Section 3.1.2. These scenarios are designed to incrementally stress the system and evaluate the robustness of the proposed reinforcement strategy.
Then, the Fast Voltage Stability Index (FVSI) and voltage profiles are computed. These metrics allow for a quantitative and qualitative assessment of system stability.
  • FVSI analysis
The IEEE 30-bus system includes 41 transmission lines, which results in 41 distinct N 1 contingency scenarios, each corresponding to the disconnection of a single line. For every contingency case, a specific load stress condition is imposed on critical nodes identified using the FVSI-based vulnerability assessment. Following this, the optimal generator placement and sizing strategy is applied to each combined contingency and loading scenario.
Given the extensive data generated across all scenarios, it is not feasible to show all contingency cases’ mean variation (or any other statistic value). Thus, a representative case is selected to illustrate the results. One contingency scenario is randomly chosen to graphically present the impact of the optimal solution on voltage stability. Figure 12 shows the FVSI for each power line when the 15th line ( l i n e 4 12 ) is disconnected.
Figure 12 shows only the bus bars close to the disconnected line due to the high number of lines in the power system; this figure demonstrates that the implementation of the optimal generation strategy substantially reduces FVSI values across all transmission lines, effectively restoring the system’s performance to levels close to the original (pre-contingency) conditions.
To provide a complete assessment of this improvement, Table 12 presents a detailed statistical analysis for the scenario in which line l i n e 4 12 is disconnected. The table includes the mean, standard deviation, median, and maximum FVSI values across all validation scenarios.
Finally, Table 13 presents the percentage reduction in FVSI achieved by the optimal generation solution when compared to the contingency-only and contingency with load scenarios. The results confirm that the proposed method performs as expected, achieving a reduction of 26.81% in the mean FVSI relative to the contingency-only case and 17.74% relative to the contingency with load scenario.
  • Voltage profile analysis
Similarly, as with the FVSI analysis, the optimal DG placement and sizing strategy is applied to each combined contingency and loading scenario. As with the FVSI analysis, it is impossible to show the mean voltage profile variation across all contingencies due to the extensive data generated. Thus, the same randomly chosen contingency scenario is selected to graphically present the impact of the optimal solution on the voltage profile. Figure 13 shows the Voltage Profiles for each bus-bar when the 9th line ( l i n e 4 12 ) is disconnected.
Figure 13 illustrates that the application of the optimal generation strategy significantly enhances the voltage profiles across all bus bars. A detailed evaluation of voltage profile improvement is presented in Table 14, which reports the mean, standard deviation, median, and minimum voltage values for the scenario where line l i n e 4 12 is disconnected. The table comprehensively compares all validation scenarios, highlighting the effectiveness of the proposed approach.
Finally, Table 15 presents the percentage improvements in the voltage profile obtained by applying the optimal generation solution, compared to both the contingency only and the contingency with load scenarios. As expected, the voltage magnitude increased by 1% relative to the contingency + load case and by 0.620% compared to the contingency-only case. All voltage quality indicators consistently improve, with only the standard deviation values decreasing. This reduction in deviation indicates a more uniform voltage distribution across the network, which is not only favorable but, in this case, even better than that of the original base-case scenario.

3.3. Case Study: IEEE 118-Bus-Bar System

The third study case is based on the IEEE 118 bus bar system. For this case, the same structure analysis as the previous ones will be followed. First, the FVSI is calculated for all power lines; then, the top 5 weakest lines (highest values of FVSI) are identified as shown in Table 16 where it is clear that power line l i n e 92 100 is the closest to instability with a 0.2102 FVSI value.
In the second step of the proposed algorithm (Algorithm 1), a frequency-based analysis is conducted to identify the weakest power line under N 1 contingency conditions. The outcomes of this step are summarized in Table 17, where power line 92 100 emerges as the most critical, appearing as the weakest line in 97.31% of the scenarios with an average FVSI of 0.2102. Given that the IEEE 118-bus system includes 186 transmission lines, a full cumulative analysis is not feasible. However, the results presented in Table 17 provide strong evidence supporting the effectiveness of the proposed frequency-based approach in reliably detecting the most vulnerable line in the network.
Next, step 3 of Algorithm 1, critical nodes are chosen by examining all nodes directly connected to the sending node i and the receiving node j of the system’s weakest power line ( l i n e 92 100 ) . As with the first study case, the slack bus is excluded, and consequently, nodes 2, 3, and 12 are selected as candidate nodes for the increase in load in subsequent overload scenarios.
Similarly to the previous study case, additional loads are allocated to a subset of identified weak buses n L , considering a total active power increment of P max = 100 MW and a corresponding reactive power component of Q max = 0.25 · P max , maintaining an 80 / 20 split between active and reactive power. The same normalized random distribution described in Section 3.1 is applied for this case. Subsequently, the system is subjected to N 1 contingencies under these overload conditions, forming a baseline of critical scenarios with both power line disconnections and stress on weak nodes.
Since this study case presents 186 contingency scenarios, the results will not be shown graphically. However, as in the IEEE 30 bus-bar system, the proliferation of outliers in the contingency scenarios indicates considerably elevated FVSI beyond the average.

3.3.1. Optimal DG Placement

Similarly, as in the IEEE 30 bus-bar study case Equations (4)–(8) will be used to find the optimal generation size and location. This process was executed in every contingency. By executing this process for all the contingencies, the optimal solution was located at Bus 9 with a generator of 10 MW; the detailed results can be seen in Table 18.

3.3.2. Optimal Solution Validation

The optimal solution—corresponding to the allocation of a 10 MW DG at bus-bar-9 is tested under the same five distinct operational scenarios defined in Section 3.1.2. These scenarios are designed to incrementally stress the system and evaluate the robustness of the proposed reinforcement strategy.
Then, the Fast Voltage Stability Index (FVSI) and voltage profiles are computed. These metrics allow for a quantitative and qualitative assessment of system stability.
  • FVSI analysis
The IEEE 118-bus system includes 186 transmission lines, which results in 186 distinct N 1 contingency scenarios, each corresponding to the disconnection of a single line. For every contingency case, a specific load stress condition is imposed on critical nodes identified using the FVSI-based vulnerability assessment. The optimal DG placement and sizing strategy is applied to each combined contingency and loading scenario.
Given the extensive data generated across all scenarios, it is not feasible to show all contingency cases’ mean variation (or any other statistic value). Thus, a representative case is selected to illustrate the results. One contingency scenario is randomly chosen to graphically present the impact of the optimal solution on voltage stability. To provide a complete assessment of this improvement, Table 19 presents a detailed statistical analysis for the scenario in which the 18th line ( l i n e 13 15 ) is disconnected. The table includes the mean, standard deviation, median, and maximum FVSI values across all validation scenarios.
Finally, Table 20 presents the percentage reduction in FVSI achieved by the optimal generation solution when compared to the contingency-only and contingency with load scenarios. The results confirm that the proposed method performs as expected, achieving a reduction of 6.79% in the mean FVSI relative to the contingency-only case and 5.29% relative to the contingency with load scenario.
  • Voltage profile analysis
Similarly, as with the FVSI analysis, the optimal DG placement and sizing strategy is applied to each combined contingency and loading scenario. As with the FVSI analysis, it is impossible to show the mean voltage profile variation across all contingencies due to the extensive data generated. A detailed evaluation of voltage profile improvement is presented in Table 21, which reports the mean, standard deviation, median, and minimum voltage values for the scenario where line l i n e 13 15 is disconnected. The table comprehensively compares all validation scenarios, highlighting the effectiveness of the proposed approach.
Finally, Table 22 presents the percentage improvements in the voltage profile obtained by applying the optimal generation solution, compared to both the contingency only and the contingency with load scenarios. As expected, the voltage magnitude increased by 1.15% relative to the contingency + load case and by 1.04% compared to the contingency-only case.

3.4. Sensitivity Analysis: Impact of System Parameter Variations

To evaluate the robustness of the proposed methodology under varying system conditions, a sensitivity analysis was conducted on the IEEE 14-bus test system. The representative scenario selected was contingency case 9, where l i n e 4 9 is disconnected, and critical nodes are overloaded as detailed in Section 3.1.
Three sensitivity cases were explored to assess the impact of system parameter changes:
  • Case A: Load Scaling. The total load was increased by 10% and 20%, while maintaining the same load distribution pattern. The proposed optimization continued to identify Bus 10 as the optimal location, though the generator size increased slightly to meet the higher demand while still ensuring FVSI reduction and voltage recovery.
  • Case B: Line Reactance Variation. The reactance of the critical l i n e 2 5 was perturbed by ±10%. A minor impact on FVSI values was observed, but the optimal generator location remained unchanged. This demonstrates the method’s resilience to moderate parameter uncertainties.
  • Case C: DG Capacity Limitations. When the maximum generator power was reduced from 40 MW to 30 MW, the optimization still provided FVSI improvement, albeit with smaller margins. This suggests a trade-off between DG sizing and achievable system restoration.
The following table (Table 23) details the sensitivity analysis previously described:
The results from these cases confirm that the proposed method is not only effective under nominal conditions but also robust under reasonable parameter deviations, which are typical in practical grid operations. This sensitivity assessment strengthens the applicability of the proposed approach in real-world settings with parameter uncertainty.

3.5. Cross-System Performance Comparison

To assess the scalability and effectiveness of the proposed methodology, Table 24 summarizes key performance indicators across the three IEEE test systems. The results demonstrate consistent FVSI reductions and voltage profile improvements using a single optimally sized distributed generator, even as system complexity increases. The observed patterns support the adaptability and robustness of the method regardless of network scale.

3.6. Economic Considerations of the Proposed DG Strategy

The proposed optimization strategy offers significant economic advantages by leveraging a single distributed generator (DG) to restore system voltage stability under stress and contingency conditions. In contrast to conventional reinforcement techniques, such as installing multiple FACTS devices (e.g., SVC or STATCOM), expanding transmission infrastructure, or deploying several distributed resources, the use of one optimally placed DG reduces both capital investment and operational complexity.
For example, while FACTS devices can cost upwards of $30,000 per MVAr with additional control infrastructure, a pre-integrated DG unit incurs lower deployment and integration costs, especially when deployed in a modular fashion. Moreover, this method minimizes installation time and allows utilities to implement targeted corrections with minimal system disruption [23].
Although detailed economic analysis is beyond the scope of this study, the comparative simplicity and cost-efficiency of the single-DG approach represent a practically viable solution for network reinforcement in real-world applications.
A fully detailed economic comparison of this paper’s strategy against others commonly used is shown in Table 25.

4. Conclusions

Across the three IEEE test systems (14, 30, and 118 bus-bars), the proposed methodology based on the Fast Voltage Stability Index (FVSI) demonstrated high effectiveness in restoring voltage stability under N 1 contingency conditions with critical overload. In each case, a single DG’s optimal location and sizing enabled significant improvements in voltage profiles and substantial reductions in FVSI values.
In the IEEE 14 bus-bar system, the optimal solution (20 MW DG at bus 10) reduced the mean FVSI from 0.06419 (base case) to 0.05766 under combined contingency and load conditions—representing a 10.41 % improvement. The minimum voltage increased from 0.89476 to 0.90116 , and the voltage standard deviation decreased by 10.44 % , indicating more excellent uniformity and stability across the network.
In the IEEE 30 bus-bar system, the strategy placed a 40 MW DG at bus 9. This reduced the mean FVSI under stress and contingency conditions from 0.02179 to 0.01594 , corresponding to a 26.81 % improvement. The voltage profile also improved, with a 1.000 % increase in the mean voltage and a 3.51 % reduction in its standard deviation compared to the contingency with load scenario.
The optimal solution for the IEEE 118 bus-bar system, which included 186 contingency scenarios (a 10 MW DG at bus 9), reduced the mean FVSI from 0.00378 to 0.00358 —a 5.29 % improvement. More importantly, the voltage profile was fully restored to base-case levels ( 0.97000 for mean, median, and minimum), with a negligible standard deviation of 6.68 × 10 16 , demonstrating exceptional performance even under large-scale system conditions.
During the development of this work, several challenges were addressed. Ensuring power flow convergence under stressed contingency conditions required adaptive step-size tuning and early-stopping mechanisms. Identifying meaningful inflection points in FVSI trends was resolved using smoothing and derivative checks. Finally, scalability for large networks was achieved through efficient scenario filtering and data handling. These measures enhanced the method’s robustness and support its applicability in practical planning contexts.
These findings confirm the proposed methodology’s scalability, cost-effectiveness, and robustness. A data-driven approach supported by statistical inflection point analysis and FVSI behavior enables power system operators to enhance system resilience through a low-cost, single-DG corrective action, outperforming conventional methods across a wide range of stress scenarios.

5. Future Work and Challenges

While the proposed methodology has demonstrated high effectiveness across the IEEE 14, 30, and 118 bus-bar systems, future research has several directions to extend its applicability and robustness. One promising line of work involves generalizing the strategy to multi-DG scenarios. By considering multiple distributed generators rather than a single unit, the methodology could further improve system resilience and stability, especially in more extensive or meshed networks. This would require advanced optimization algorithms that handle multi-objective constraints and non-linear interactions between generation units.
Another key extension includes time-varying load profiles and renewable generation variability. As modern power systems are increasingly influenced by intermittent sources like solar and wind, incorporating stochastic models and forecast-based optimization could enhance the methodology’s predictive capabilities and real-time responsiveness. Additionally, integrating Flexible AC Transmission System (FACTS) devices such as STATCOMs or SVCs could complement generator placement. Exploring hybrid strategies that combine generation support with reactive compensation would provide a more comprehensive voltage control mechanism under N 1 contingencies.
Moreover, validating the methodology in real-time environments through hardware-in-the-loop (HIL) simulation or digital twin platforms would enable the assessment of control latencies, measurement noise, and communication delays—factors critical for real-world deployment. Finally, the strategy could be adapted for decentralized control architectures, making it suitable for future power systems characterized by microgrids, peer-to-peer energy trading, and edge-based control. These enhancements will ensure that the proposed methodology remains scalable, reliable, and relevant for emerging smart grid paradigms.

Author Contributions

M.J.: conceptualization, methodology, validation, writing—review and editing, data curation, formal analysis. D.C.: review and editing. F.P.: review and editing. L.T.: review and editing. All authors have read and agreed to the published version of the manuscript.

Funding

This research was funded by Universidad Politécnica Salesiana and GIREI—Smart Grid Research Group under the project “Optimization of Energy Dispatch in Block H of the Salesian Polytechnic University, Quito South Campus, through a Predictive Consumption Model and Hybrid Management between Solar Panels and the Electric Grid”. Project approved and founded by resolution 005-01-2025-02-07.

Data Availability Statement

The original contributions presented in this study are included in the article. Further inquiries can be directed to the corresponding author(s).

Conflicts of Interest

The authors declare no conflict of interest.

Abbreviations

The following abbreviations are used in this manuscript:
FVSIFast Voltage Stability Index
N 1 Single Line Outage Contingency
ANNArtificial Neural Network
PVSIPower Voltage Stability Index
LQPLoadability Quality Power Index
LmnLine Stability Index by modal method
P i Active power at bus i
Q i Reactive power at bus i
V i Voltage magnitude at bus i
δ i Voltage angle at bus i
X i j Reactance between buses i and j
Z i j Impedance between buses i and j
Q j i Receiving reactive power at node j from node i
P gen Generator active power injection
Δ P Generator power step size
P gen max Maximum generator power injection
b gen ( i ) Candidate bus for generator placement in scenario i
zDiscrete generation step index
z i * Optimal generation step index for scenario i
FVSI i , z FVSI at scenario i, generation step z
Δ FVSI i , z        Absolute FVSI deviation at scenario i, generation step z
σ i , z Standard deviation of FVSI deviation at scenario i, step z
δ 2 max i , z Second derivative (inflection) of max FVSI deviation
τ Threshold for inflection point significance
B u s _ d a t a Input matrix with bus specifications
G e n _ d a t a Input matrix with generator specifications
L i n e _ d a t a Input matrix with transmission line specifications
L o a d _ d a t a Input matrix with load specifications
S y s t e m D a t a Structure containing all system information used in power flow calculation
P F base Power flow results under base case conditions
L i Transmission line removed under contingency scenario i
F V S I base FVSI index under base conditions
F V S I temp Temporary FVSI result for a given generator configuration
F V S I withGen FVSI result after applying optimal generator

References

  1. Otieno, O.E. Optimal Allocation of Renewable Energy Resources to Improve Voltage Profile and Minimize Power Losses on the Most Critical Buses Prone to Voltage Instability. In Proceedings of the International Exchange and Innovation Conference on Engineering & Sciences, Fukuoka, Japan, 17–18 October 2024; pp. 68–73. [Google Scholar] [CrossRef]
  2. Sahoo, S.K.; Kar, M.K.; Kumar, S.; Mahanty, R.N. Genetic Algorithm based Optimal Placement of TCSC for Improving Voltage Profile. In Proceedings of the 2024 11th International Conference on Signal Processing and Integrated Networks (SPIN), Noida, India, 21–22 March 2024; pp. 403–408. [Google Scholar] [CrossRef]
  3. Rajput, D.; Saxena, N.K.; Srivastava, A.; Verma, D.; Tyagi, P.K. Reactive Power Procurement as Ancillary Service for Dispersed Electric Vehicles in Radial Distribution System. Lect. Notes Electr. Eng. 2024, 1099, 153–166. [Google Scholar] [CrossRef]
  4. Zellagui, M.; Settoul, S.; Belbachir, N. Multi-Objective Optimal Allocation of Hybrid Electric Vehicles Charging Stations and Renewable Distributed Generators into the Distribution System. In Proceedings of the 2023 8th International Engineering Conference on Renewable Energy & Sustainability (ieCRES), Gaza, Palestine, 8–9 May 2023. [Google Scholar] [CrossRef]
  5. Calma, E.R.B.; Pacis, M.C. Artificial Neural Network-based Voltage Stability Analysis of Power Transmission Networks with Distributed Generation using Phasor Measurement Unit Synthetic Data. In Proceedings of the 2021 IEEE 12th Control and System Graduate Research Colloquium (ICSGRC), Shah Alam, Malaysia, 7 August 2021; pp. 1–6. [Google Scholar] [CrossRef]
  6. Zellagui, M.; Lasmari, A.; Settoul, S.; El-Bayeh, C.Z.; Chenni, R.; Belbachir, N. Arithmetic Optimization Algorithm for Optimal Installation of DSTATCOM into Distribution System based on Various Voltage Stability Indices. In Proceedings of the 2021 9th International Conference on Modern Power Systems (MPS), Cluj-Napoca, Romania, 16–17 June 2021. [Google Scholar] [CrossRef]
  7. Roshan, R.; Samal, P.; Sinha, P. Optimal placement of FACTS devices in power transmission network using power stability index and fast voltage stability index. In Proceedings of the 2020 International Conference on Electrical and Electronics Engineering (ICE3), Gorakhpur, India, 14–15 February 2020; pp. 246–251. [Google Scholar] [CrossRef]
  8. Samuel, I.; Katende, J.; Awosope, C.; Awelewa, A.; Adekitan, A.; Agbetuyi, F. Power system voltage collapse prediction using a new line stability index (NLSI-1): A case study of the 330-kV Nigerian National Grid. Int. J. Electr. Comput. Eng. 2019, 9, 5125–5133. [Google Scholar] [CrossRef]
  9. Mokred, S.; Wang, Y. Voltage stability assessment and contingency ranking in power systems based on modern stability assessment index. Results Eng. 2024, 23, 102548. [Google Scholar] [CrossRef]
  10. Mokred, S.; Wang, Y.; Chen, T. A novel collapse prediction index for voltage stability analysis and contingency ranking in power systems. Prot. Control Mod. Power Syst. 2023, 8, 7. [Google Scholar] [CrossRef]
  11. Sadeghi, S.E.; Akbari Foroud, A. A general index for voltage stability assessment of power system. Int. Trans. Electr. Energy Syst. 2021, 31, e13155. [Google Scholar] [CrossRef]
  12. Anthony, K.; Arunachalam, V. Voltage stability monitoring and improvement in a renewable energy dominated deregulated power system: A review. e-Prime Adv. Electr. Eng. Electron. Energy 2025, 11, 100893. [Google Scholar] [CrossRef]
  13. Eisa Osman, S.H.; Irungu, G.K.; Murage, D.K. Application of FVSI, Lmn and CPF Techniques for Proper Positioning of FACTS Devices and SCIG Wind Turbine Integrated to a Distributed Network for Voltage Stability Enhancement. Eng. Technol. Appl. Sci. Res. 2019, 9, 4824–4829. [Google Scholar] [CrossRef]
  14. Mokred, S.; Wang, Y.; Chen, T. Modern voltage stability index for prediction of voltage collapse and estimation of maximum load-ability for weak buses and critical lines identification. Int. J. Electr. Power Energy Syst. 2023, 145, 108596. [Google Scholar] [CrossRef]
  15. Zhang, X.; Wu, J.; Fu, Y. Voltage support strength analysis and stability control strategy for grid-forming wind power transmission system. IET Renew. Power Gener. 2025, 19, e13194. [Google Scholar] [CrossRef]
  16. Ali, N.Z.M.; Musirin, I.; Mohamad, H. Fast Voltage Stability Index (FVSI) Based Technique for Congestion Management Assessment. Appl. Mech. Mater. 2015, 793, 49–53. [Google Scholar]
  17. Badrudeen, T.U.; Ariyo, F.K.; Salau, A.O.; Braide, S.L. Analysis of a new voltage stability pointer for line contingency ranking in a power network. Bull. Electr. Eng. Inform. 2022, 11, 3033–3041. [Google Scholar] [CrossRef]
  18. Öner, A.; Abur, A. Voltage stability based placement of distributed generation against extreme events. Electr. Power Syst. Res. 2020, 189, 106713. [Google Scholar] [CrossRef]
  19. Jaramillo, M.D.; Carrión, D.F.; Muñoz, J.P. A Novel Methodology for Strengthening Stability in Electrical Power Systems by Considering Fast Voltage Stability Index under N-1 Scenarios. Energies 2023, 16, 3396. [Google Scholar] [CrossRef]
  20. Shen, Y.; Zhu, Y.; He, K.; Zhou, Q.; Shuai, Z. Data-driven Stability Assessment for New Power Systems: Typical Characteristics, Research Framework and Future Prospects. In Proceedings of the 2023 IEEE/IAS Industrial and Commercial Power System Asia (I&CPS Asia), Chongqing, China, 7–9 July 2023; pp. 975–983. [Google Scholar] [CrossRef]
  21. Adewuyi, O.B. Performance Analysis for Predictive Voltage Stability Monitoring Using Enhanced Adaptive Neuro-Fuzzy Expert System. Mathematics 2024, 12, 3008. [Google Scholar] [CrossRef]
  22. Adegoke, S.A.; Sun, Y. Power system optimization approach to mitigate voltage instability issues: A review. Cogent Eng. 2023, 10, 2153416. [Google Scholar] [CrossRef]
  23. Jaramillo, M.; Carrión, D.; Muñoz, J. A Deep Neural Network as a Strategy for Optimal Sizing and Location of Reactive Compensation Considering Power Consumption Uncertainties. Energies 2022, 15, 9367. [Google Scholar] [CrossRef]
Figure 1. Fast voltage stability index formulation between two nodes i j .
Energies 18 02466 g001
Figure 2. IEEE 14 bus—bar system: FVSIs for every contingency scenario.
Energies 18 02466 g002
Figure 3. Boxplot of FVSI values across all N 1 contingency scenarios, including the base case, IEEE 14 bus-bar system.
Energies 18 02466 g003
Figure 4. Optimal generation step detection using FVSI deviation and 2 smoothing, for 9th contingency at IEEE 14 bus-bar system.
Energies 18 02466 g004
Figure 5. Mean FVSI trends under contingency-based scenarios with and without generation, IEEE 14 bus-bar.
Energies 18 02466 g005
Figure 6. FVSI comparison across scenarios for each power line under contingency case # 9 ., IEEE 14 bus-bar.
Energies 18 02466 g006
Figure 7. Mean voltage profile comparison across all N 1 contingency scenarios, IEEE 14 bus-bar.
Energies 18 02466 g007
Figure 8. Voltage profile comparison across scenarios for each Bus Bar under contingency case # 9 ., IEEE 14 bus-bar.
Energies 18 02466 g008
Figure 9. IEEE 30bus-bar system: FVSIs for every contingency scenario.
Energies 18 02466 g009
Figure 10. Boxplot of FVSI values across all N 1 contingency scenarios, including the base case, IEEE 30 bus-bar system.
Energies 18 02466 g010
Figure 11. Optimal generation step detection using FVSI deviation and 2 smoothing, for 15th contingency at IEEE 30 bus-bar system.
Energies 18 02466 g011
Figure 12. FVSI comparison across scenarios for each power line under contingency case # 15 ., IEEE 30 bus-bar.
Energies 18 02466 g012
Figure 13. Voltage profile across scenarios for each Bus Bar under contingency case # 15 ., IEEE 30 bus-bar.
Energies 18 02466 g013
Table 1. Comparison between traditional methods and the proposed approach.
AspectTraditional SolutionsThis Work (Proposed)
Contingency ModelingOften single-scenario basedMulti-scenario N 1 analysis with overloads
Decision MethodologyHeuristic or optimization-basedStatistical analysis (inflection points, trends)
Control Devices UsedFACTS (SVC, STATCOM), multiple DGsSingle DG, low-cost, scalable
DG Sizing CriteriaFixed capacity or brute-force optimizationInflection point detection on FVSI deviation
RobustnessLimited sensitivity analysisValidated across parameter variations and three networks
Cost-EfficiencyHigh (multiple devices)Low (single DG with adaptive sizing)
Table 2. Top lines by FVSI in the base case (descending).
Power LineFVSI
Node  iNode  j
250.1392
10110.1186
240.1177
150.1108
13140.0962
Table 3. Summary of Weakest-Line Statistics Based on Frequency Analysis for IEEE 14 bus-bar system.
Node iNode jFVSI AvgValueCountPercentage
2.00005.00000.139215.000075.0000
3.00004.00000.17521.00005.0000
10.000011.00000.14484.000020.0000
Table 4. Frequency of optimal bus locations and DG sizes for IEEE 14 bus-bar system.
Bus LocationCount(%)Generator Size [MW]Count(%)
3151015
421020735
71530420
10168040630
5015
7015
Optimal Bus Location: 10Optimal Generator Size: 20.00 MW
Table 5. FVSI statistics for Line 9 under different scenarios.
ScenarioMeanStd DevMedianMax
Base Case0.0641900.064190.06419
Loaded (No Contingency)0.0534400.053440.05344
Contingency Only0.073860.031410.064190.16518
Contingency + Load0.064350.031970.055280.15881
Contingency + Load + Gen0.057660.028280.047650.13179
Table 6. Percentage reduction of FVSI statistics for Line 9 when applying the optimal solution.
StatisticReduction vs Contingency Only (%)Reduction vs Contingency + Load (%)
Mean21.89%10.41%
Standard Deviation9.96%11.57%
Median25.75%13.79%
Max20.22%17.00%
Table 7. Voltage statistics for different operating scenarios when l i n e 4 9 is disconnected.
ScenarioMeanStd. Dev.MedianMin
Base Case0.9251100.925110.92511
Loaded (No Contingency)0.9226600.922660.92266
Contingency Only0.920240.007770.924540.89630
Contingency + Load0.916400.008860.920420.89476
Contingency + Load + Gen0.920850.007930.924720.90116
Table 8. Percentage improvement of voltage profiles after applying the optimal solution, relative to Contingency and Contingency + Load scenarios when l i n e 4 9 is disconnected.
ComparisonMean [%]Std. Dev. [%]Median [%]Min [%]
Contingency Only vs. Opt. Gen+0.066% 1.08 %+0.019%+0.542%
Contingency + Load vs. Opt. Gen+0.486% 10.44 %+0.468%+0.714%
Table 9. Top lines by FVSI in the base case (descending).
Power LineFVSI
Node  iNode  j
250.1952
9110.1384
260.1245
12130.1126
24250.1038
Table 10. Summary of Weakest-Line Statistics Based on Frequency Analysis for IEEE 30 bus-bar system.
Node iNode jFVSI AvgValueCountPercentage
2.00005.00000.195238.000092.6829
1.00003.00000.72841.00002.4390
6.000010.00000.24411.00002.4390
9.000011.00000.13841.00002.4390
Table 11. Frequency of optimal bus locations and DG sizes for IEEE 30 bus-bar system.
Bus LocationCount(%)Generator Size [MW]Count(%)
112.439201229.268
612.4393024.878
93585.366401434.146
1249.75615049.7561
6037.3171
7037.3171
8024.878
9012.439
Optimal Bus Location: 9Optimal Generator Size: 40.00 MW
Table 12. FVSI statistics for Line 15 contingency under different scenarios.
ScenarioMeanStd DevMedianMax
Base Case0.0164900.016490.01649
Loaded (No Contingency)0.0166500.016650.01665
Contingency Only0.021790.024180.016580.12791
Contingency + Load0.019380.029390.012150.15031
Contingency + Load + Gen0.015940.029460.007840.14297
Table 13. Percentage reduction of FVSI statistics for Line 15 contingency when applying the optimal solution.
StatisticReduction vs. Contingency Only (%)Reduction vs. Contingency + Load (%)
Mean26.81%17.74%
Standard Deviation−0.12%−0.23%
Median52.68%35.45%
Max11.70%4.89%
Table 14. Voltage statistics under different operating scenarios when l i n e 4 12 is disconnected.
ScenarioMeanStd. Dev.MedianMin
Base Case0.9928100.992810.99281
Loaded (No Contingency)0.9881400.988140.98814
Contingency Only0.990910.006080.992550.95849
Contingency + Load0.987200.006150.988400.95512
Contingency + Load + Gen0.997050.005930.988270.95644
Table 15. Percentage improvement of voltage profile after applying the optimal solution, relative to Contingency and Contingency + Load scenarios when line l i n e 4 12 is disconnected.
ComparisonMean [%]Std. Dev. [%]Median [%]Min [%]
Contingency Only vs. Opt. Gen+0.620% 2.33 % 0.43 % 0.21 %
Contingency + Load vs. Opt. Gen+1.000% 3.51 % 0.01 %+0.14%
Table 16. Top lines by FVSI in the base case (descending) at IEEE 118 bus-bar.
Power LineFVSI
Node  iNode  j
921000.2102
26300.2015
65660.1871
62660.1641
76770.1558
Table 17. Summary of Weakest-Line Statistics Based on Frequency Analysis for IEEE 118 bus-bar system.
Node iNode jFVSI AvgValueCountPercentage
1.00002.0000NaN1.00000.5376
26.000030.00000.22863.00001.6129
38.000065.00000.28661.00000.5376
92.0000100.00000.2102181.000097.3118
Table 18. Frequency of optimal bus locations and DG sizes for IEEE 118 bus-bar system.
Bus LocationCount(%)Generator Size [MW]Count(%)
310.53761016287.097
918096.77420168.6022
1310.53763052.6882
2310.53764021.0753
3810.537610010.5376
4510.5376
7910.5376
Optimal Bus Location: 9Optimal Generator Size: 10.00 MW
Table 19. FVSI statistics for Line 18th contingency under different scenarios.
ScenarioMeanStd DevMedianMax
Base Case0.0026600.002660.00266
Loaded (No Contingency)0.0025300.002530.00253
Contingency Only0.003840.013850.002660.18815
Contingency + Load0.003780.013850.002600.18815
Contingency + Load + Gen0.003580.013850.002600.16815
Table 20. Percentage reduction of FVSI statistics for Line 18 contingency when applying the optimal solution.
StatisticReduction vs Contingency Only (%)Reduction vs Contingency + Load (%)
Mean6.79%5.29%
Standard Deviation−0.04%0.00%
Median2.38%0.00%
Max10.64%10.64%
Table 21. Voltage statistics under different operating scenarios when l i n e 13 15 is disconnected.
ScenarioMeanStd. Dev.MedianMin
Base Case0.9700000.970000.97000
Loaded (No Contingency)0.9700000.970000.97000
Contingency Only0.960006.68 × 10 16 0.970000.97000
Contingency + Load0.959006.68 × 10 16 0.970000.97000
Contingency + Load + Gen0.970006.68 × 10 16 0.970000.97000
Table 22. Percentage improvement of voltage profile after applying the optimal solution, relative to Contingency and Contingency + Load scenarios when line l i n e 13 15 is disconnected.
ComparisonMean [%]Std. Dev. [%]Median [%]Min [%]
Contingency Only vs. Opt. Gen+1.04% + 0.00 %0.00%0.00%
Contingency + Load vs. Opt. Gen+1.15% + 0.00 %0.00%0.00%
Table 23. Sensitivity analysis results: Variation in l i n e 2 5 reactance.
ScenarioMax FVSI (Line 2–5)Mean FVSI (System)Optimal Bus LocationOptimal DG Size [MW]
Base Case (X line 2–5)0.13920.0642Bus 1020
Reactance Decrease (−10%)0.12780.0601Bus 1018
Reactance Increase (+10%)0.15140.0683Bus 1022
Table 24. Cross-comparison of optimal results across IEEE systems.
SystemOptimal DG BusDG Size [MW]FVSI Mean ReductionVoltage Profile Improvement
IEEE 14-busBus 102021.89% (vs contingency only)+0.486% mean voltage
IEEE 30-busBus 94026.81%+1.00%
IEEE 118-busBus 92106.79%+1.15%
Table 25. Economic comparison of voltage support reinforcement strategies.
TechnologyTypical Cost Range (USD)Installation ComplexityResponse TimeOperational Flexibility
Single Distributed Generator (DG)$500–1200 per kWLow (plug-and-play, existing DG units)Moderate (seconds)High (scalable, dispatchable)
Static VAR Compensator (SVC)$30,000–50,000 per MVArMedium (requires control integration)Fast (sub-seconds)Medium
STATCOM$40,000–70,000 per MVArHigh (requires complex inverter & controls)Very Fast (milliseconds)High
Transmission Upgrade (New Line)$100,000–300,000 per kmVery High (permits, land, construction)Slow (weeks to months)Low (fixed asset)
Disclaimer/Publisher’s Note: The statements, opinions and data contained in all publications are solely those of the individual author(s) and contributor(s) and not of MDPI and/or the editor(s). MDPI and/or the editor(s) disclaim responsibility for any injury to people or property resulting from any ideas, methods, instructions or products referred to in the content.

