Article

Enhanced Simulation Accuracy and Design Optimization in Power Semiconductors Through Individual Aluminum Metallization Layer Modeling

by
Na-Yeon Choi
1,2,
Sang-Gi Kim
3 and
Sung-Uk Zhang
1,2,*
1
Digital Twin Laboratory, Dong-Eui University, 176 Eomgwang-ro, Busan 47340, Republic of Korea
2
Center for Brain Busan 21, Dong-Eui University, 176 Eomgwang-ro, Busan 47340, Republic of Korea
3
Eyeq Lab, Anyang 14057, Republic of Korea
*
Author to whom correspondence should be addressed.
Energies 2025, 18(10), 2457; https://doi.org/10.3390/en18102457
Submission received: 6 March 2025 / Revised: 23 April 2025 / Accepted: 25 April 2025 / Published: 10 May 2025

Abstract

:
This study investigates the impact of modeling the aluminum (Al) metallization layer as an integrated part of the chip model, versus as an individual component, on the results of electrical–thermal analysis of power semiconductor packages using Finite Element Analysis (FEA), ANSYS 2024 R2. The results showed that modeling the aluminum metallization layer separately exhibited high consistency with actual thermal imaging data. Furthermore, based on these findings, we observed through simulations that the aluminum metallization layer plays a key role in improving the uniformity of current density and temperature distribution within the chip. Using the aluminum metallization layer model, we optimized the thickness, material, and design of the metallization layer, as well as the bonding wire material through the design of experiments (DOE) methodology. Under the optimized conditions, an optimal design is proposed to minimize the voltage–current ratio (VDS/IDS), maximum junction temperature, strain, and von Mises stress. This study systematically examines the influence of aluminum metallization layer modeling on FEA-based power semiconductor package simulations and is expected to serve as a valuable reference for future power device design utilizing finite element analysis.

1. Introduction

With the spread of electric vehicles, there is an increasing demand for higher efficiency and downsizing of power semiconductors used in power conversion systems such as inverters, converters, and onboard chargers [1]. Power semiconductors are among the most failure-prone components in power systems, as they are highly susceptible to electrical, thermal, and mechanical stress [2]. The reliability of power semiconductors remains a key challenge in electric vehicle applications operating under high-voltage, high-speed switching, and extreme temperature conditions [2]. To achieve this, it is important to comprehensively understand and analyze the physical phenomena that occur during the operation of power devices [3].
Finite Element Analysis (FEA) is widely utilized for conducting such analyses. Using FEA, it is possible to predict temperature, voltage, and stress distributions in areas of power devices that are difficult to access directly, such as their interior, and to identify critical problem areas [4]. These capabilities enable the development of various reliability evaluations [5]. In a recent study, Otiaba, Kenny C. et al. analyzed the impact of silver (Ag) content in solder on reliability using FEA models [6]. Celaya, José R. et al. investigated methods for predicting the remaining life of power MOSFETs (Metal Oxide Field Effect Transistors) under thermal stress using FEA [7]. Naghibi, J., Mehran, K. et al. proposed a method to evaluate the reliability of SiC MOSFETs using real-time monitoring technology and used FEA to iteratively estimate the temperature variation and defect rate to make accurate lifetime predictions [8]. Entzminger, Cameron et al. proposed a high-accuracy, low-order thermal model of SiC MOSFETs that uses model order reduction to reduce computational complexity while maintaining the accuracy of FEA [9].
However, obtaining accurate results in multi-physics simulations requires careful consideration of appropriate parameters, geometric models, and material properties. Additionally, simplifying the analysis model is sometimes necessary to reduce simulation time and cost. Despite the widespread adoption of FEA in power device simulation, significant challenges persist, including achieving precise electro-thermal predictions, managing limited chip data, balancing computational complexity, and optimizing design parameters. This research seeks to address these specific challenges by focusing on the role of the Al metallization layer in enhancing simulation accuracy and device performance.
Figure 1 shows an SEM image of an aluminum metallization layer bonded with aluminum bonding wire. The Al metallization layer is a layer formed during the semiconductor process to allow bond wires to be attached to the chip [10]. The Al metallization layer provides an electrical pathway between the active regions inside the chip and the external circuitry [11,12]. It has a high thermal conductivity, which allows the heat generated by the chip to dissipate to the outside [13]. Previous researchers have studied the relationship between the Al metallization layer and wire reliability. J. Ackaert et al. replaced a single-layer metallization layer with a double-layer metallization layer in a power cycle experiment and quantified the stress reduction using FEA [14]. Kawashiro et al. analyzed the reliability of Al wire for power cycle experiments using copper over pad metallization instead of Al metal pads [15]. Broll et al. analyzed the material changes of an aluminum metal pad microstructure during the ultrasonic wire bonding process [16]. Although the Al metallization layer influences the performance of power devices, it is often omitted in various reliability evaluations and studies of power semiconductors utilizing finite element analysis by being integrated into the chip model.
This study aims to quantitatively analyze the impact of modeling the Al metallization layer on the simulation results of power devices, with a particular focus on current density and temperature distribution. By conducting a comparative analysis of two different modeling approaches—integrated and individual modeling—this study highlights the importance of accurately representing the metallization layer in simulations. In this study, the integrated modeling approach refers to incorporating the Al metallization layer directly within the chip dummy model, treating it as part of the overall structure. In contrast, the individual modeling approach, as defined in this paper, treats the Al metallization layer as a separate entity, allowing for a more detailed and isolated analysis of its thermal and electrical effects. This comparison is motivated by the need to assess whether the common practice of integrating the metallization layer into the chip model for simplicity compromises its critical role in influencing thermal and electrical behaviors, which are essential for reliable power device performance. By employing both approaches, this study seeks to identify how each impacts key simulation results, such as current density and temperature distribution, thereby providing insights into the significance of precise metallization layer modeling.
The workflow of this study is shown in Figure 2. To analyze the differences in simulation results between the integrated and individual modeling of the Al metallization layer, a DUT (Device Under Test) was selected. Detailed analyses, such as decapsulation and cross-sectioning of the device, were conducted to design a 3D CAD model. Subsequently, a bias was applied to the decapsulated device to measure the temperature at the top surface of the chip under current flow. These measured bias conditions and temperatures were then used to build an electro-thermal simulation. In the finite element analysis model, equivalent resistivity and equivalent thermal conductivity of the input chip were calibrated based on the presence or absence of the Al metallization layer modeling, and the differences were evaluated.
Further, the developed 3D model was used to perform design of experiments (DOE)-based optimization while varying the design parameters of the Al bonding wire and metallization layer to ultimately propose the optimized design conditions.
The results of the analysis comparing the integrated and individual Al metallization layer modeling approaches are presented in Section 3, and the results of varying the design parameters of the wire and metallization layer, along with the corresponding optimization, are presented in Section 4.

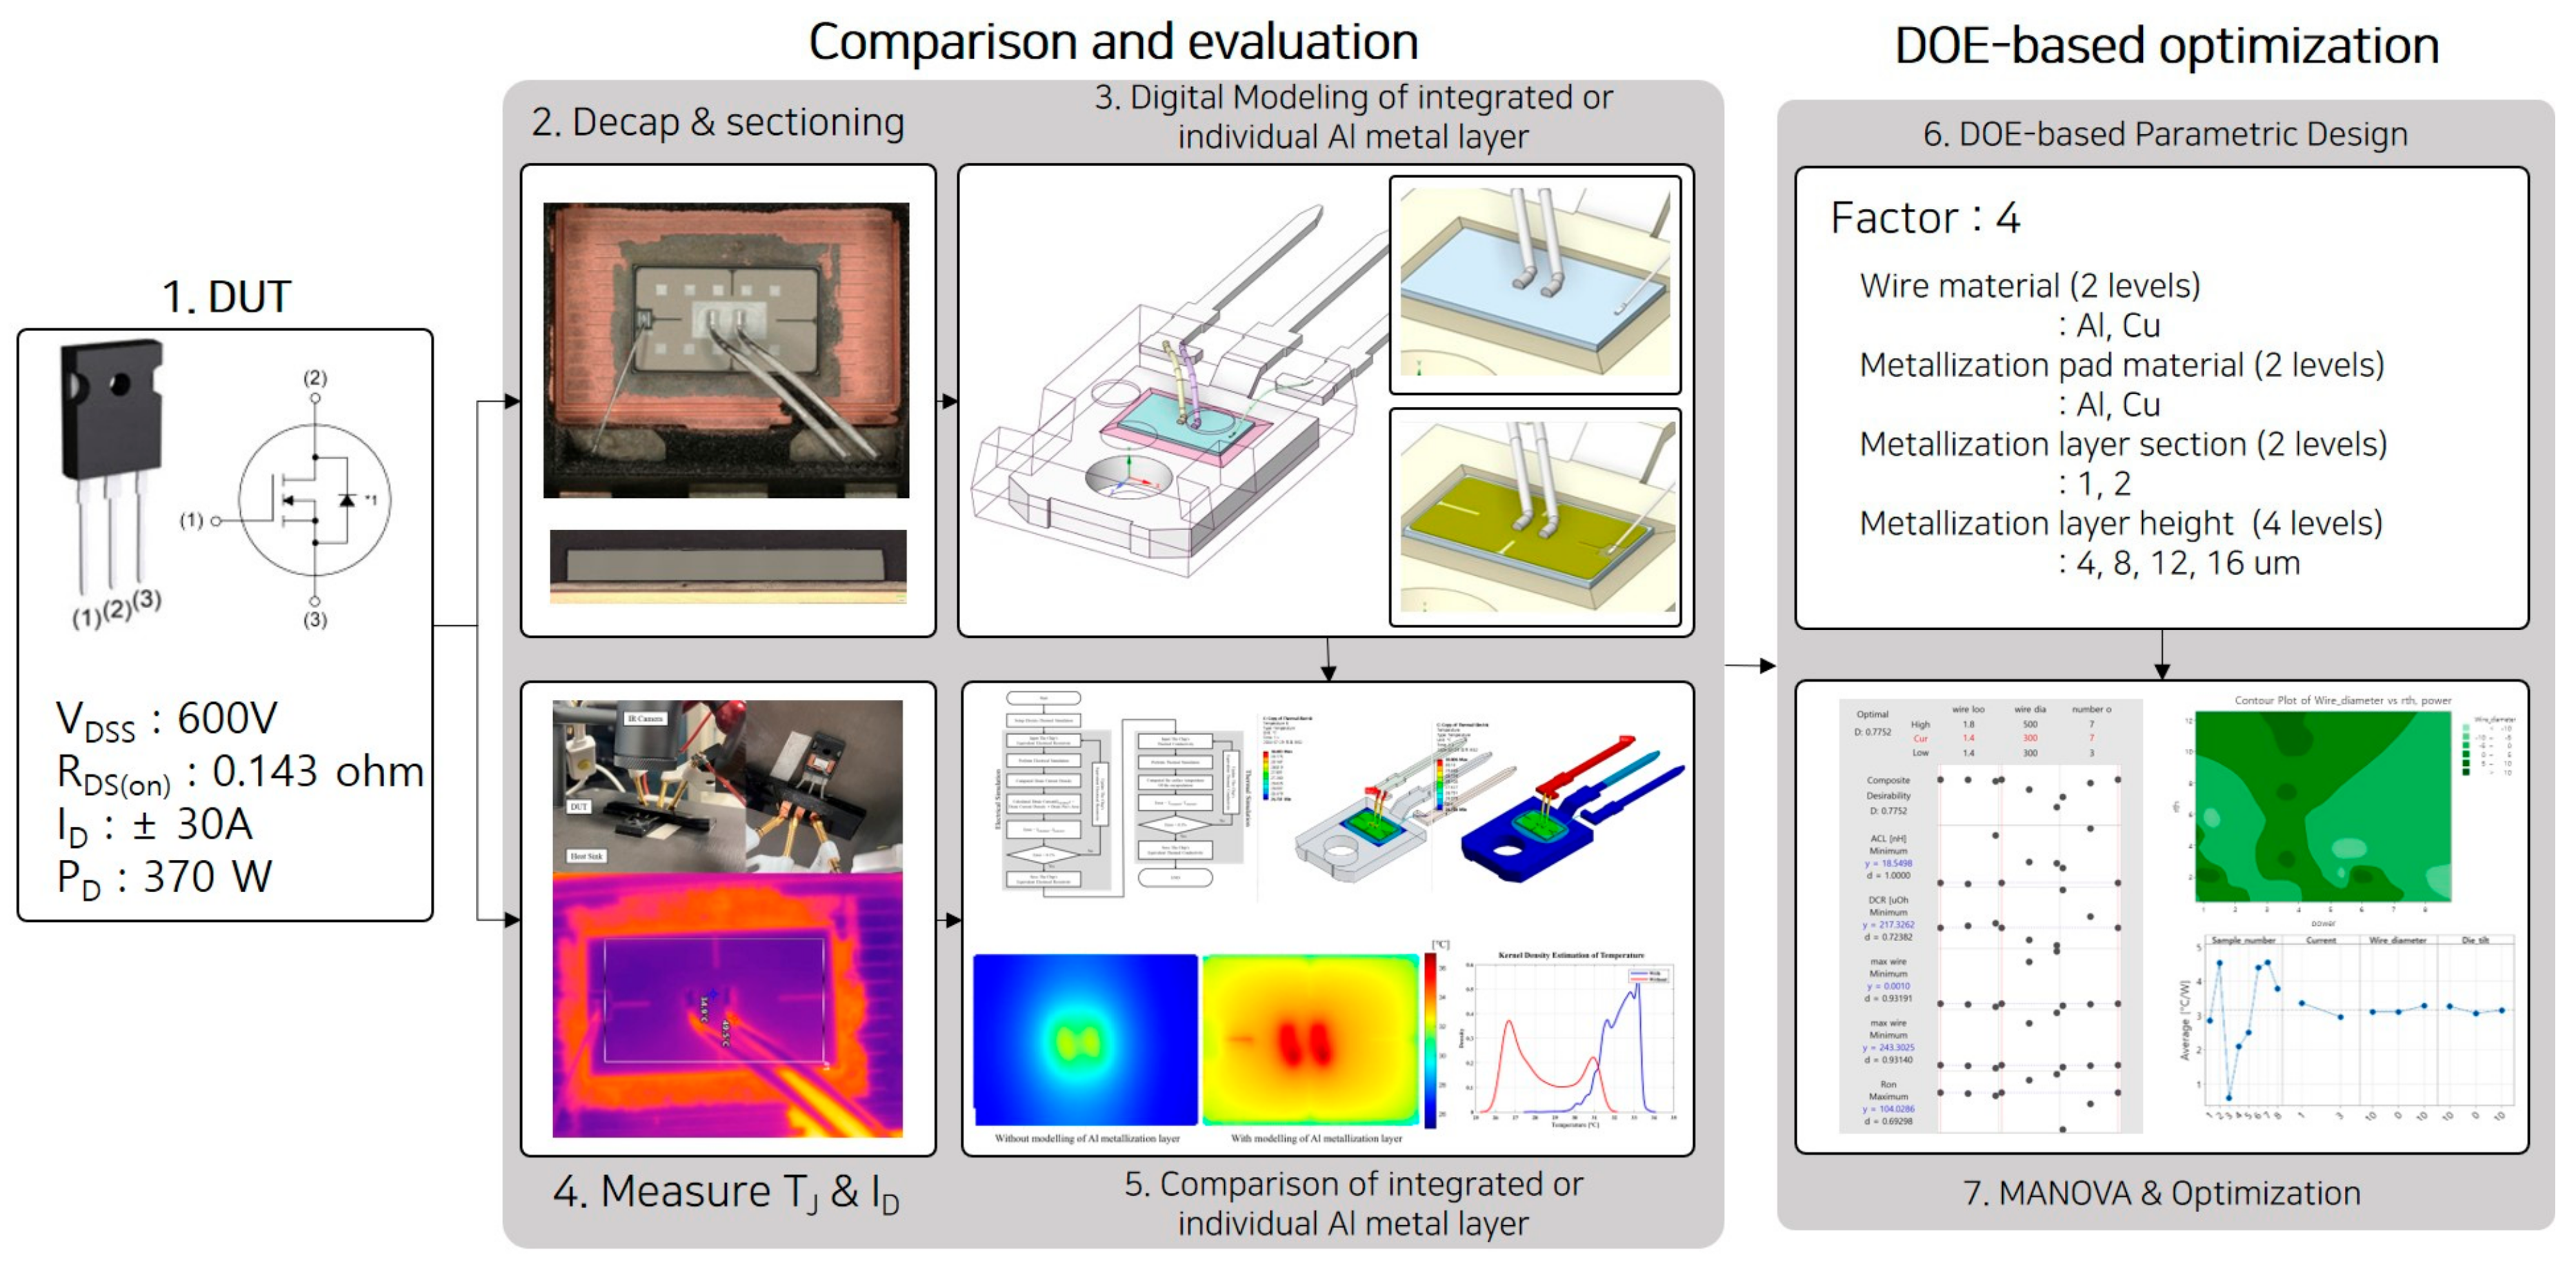
2. Comparison and Evaluation of Integrated vs. Individual Al Metallization Layer Modeling Approaches

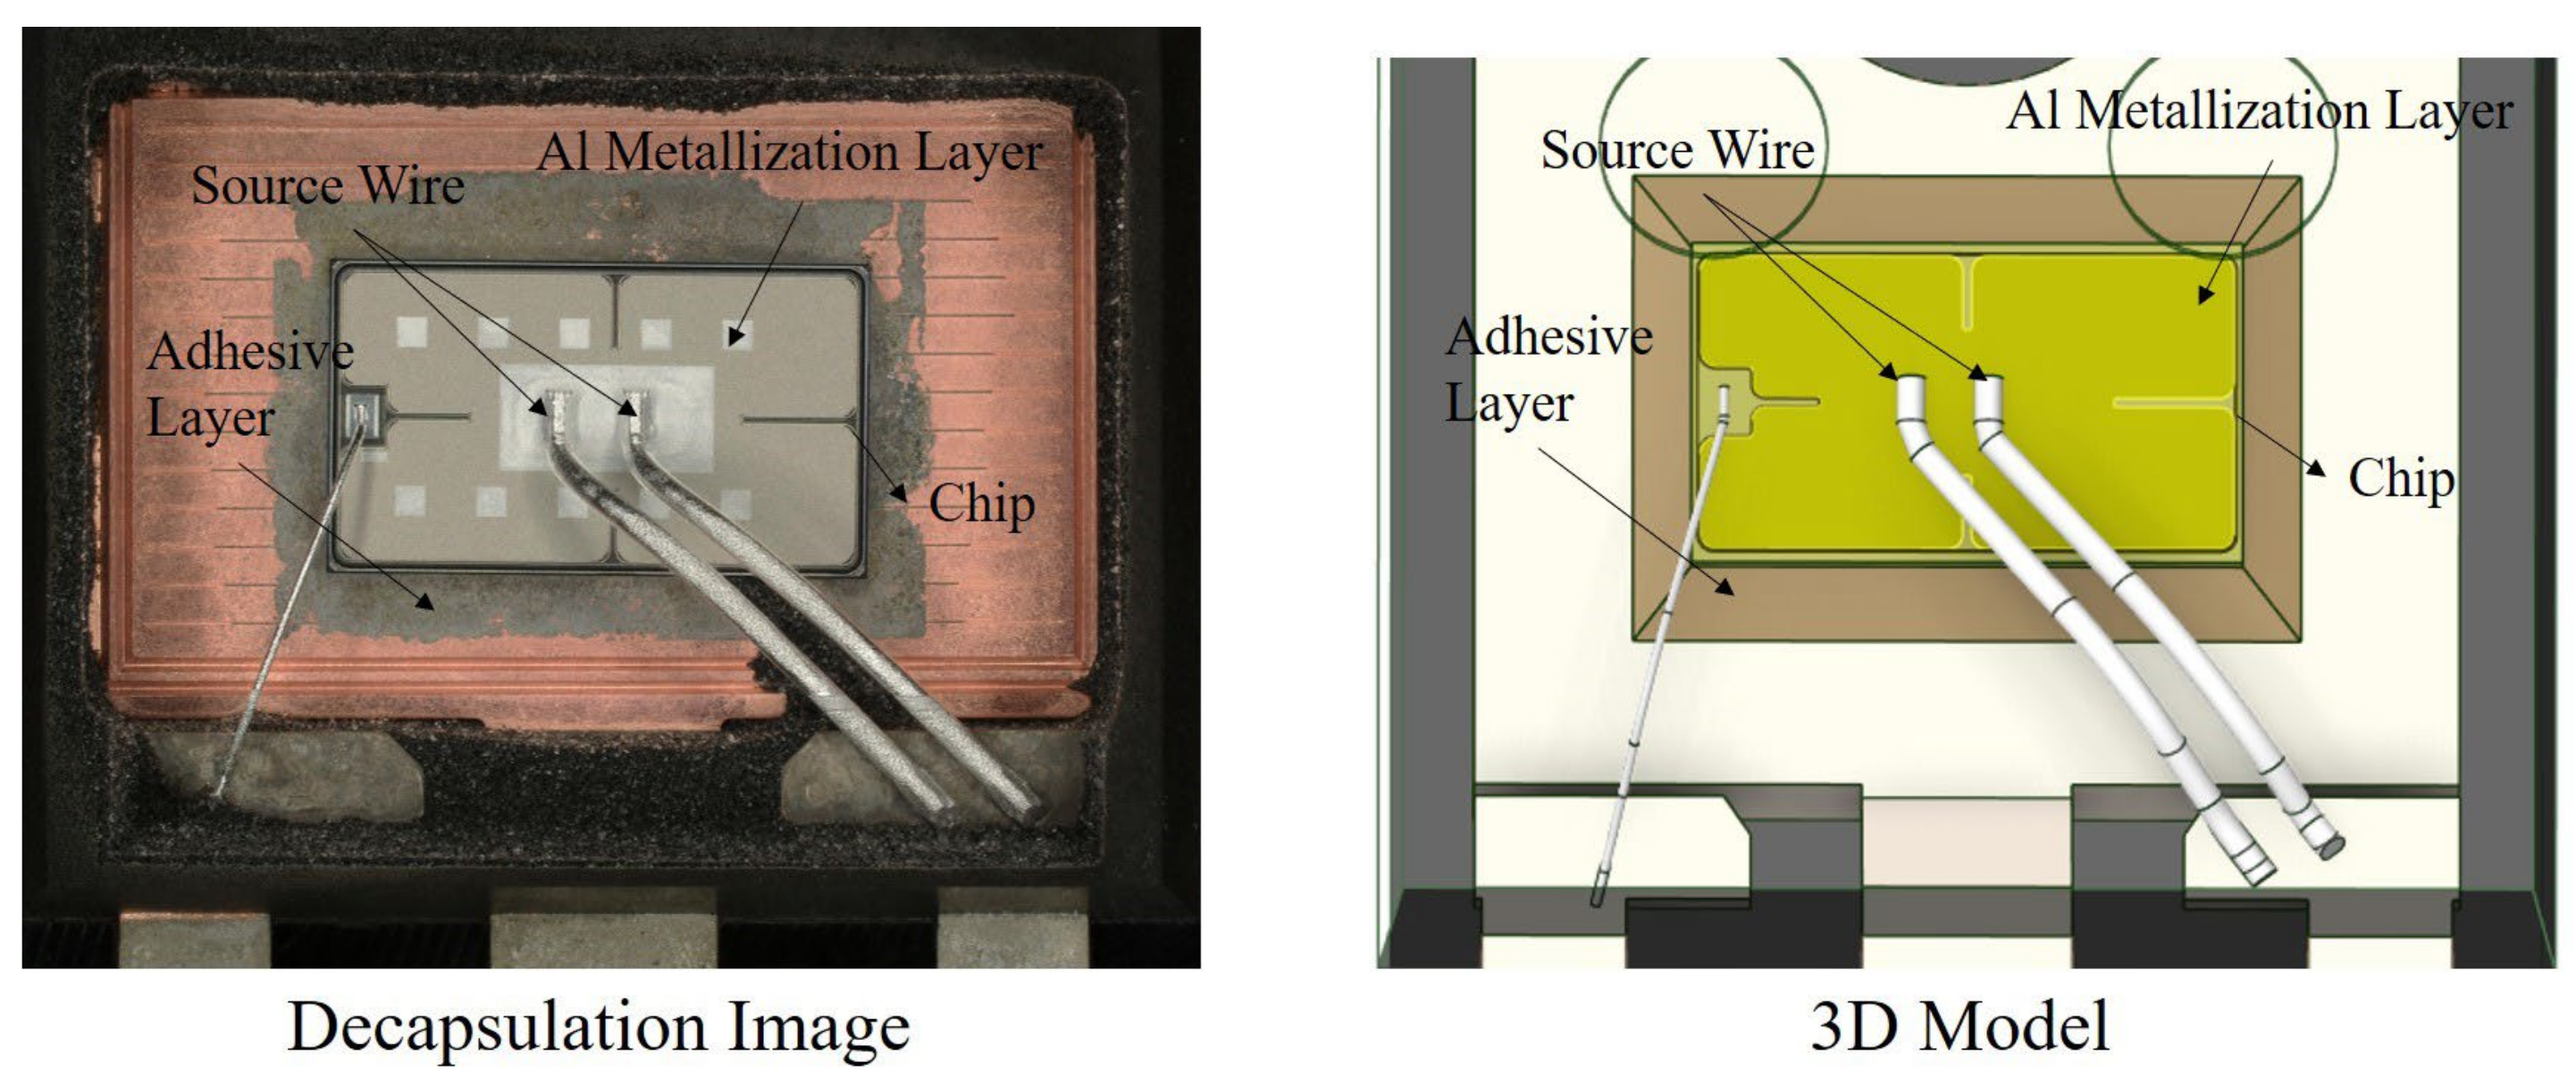
2.1. Preparation and Test
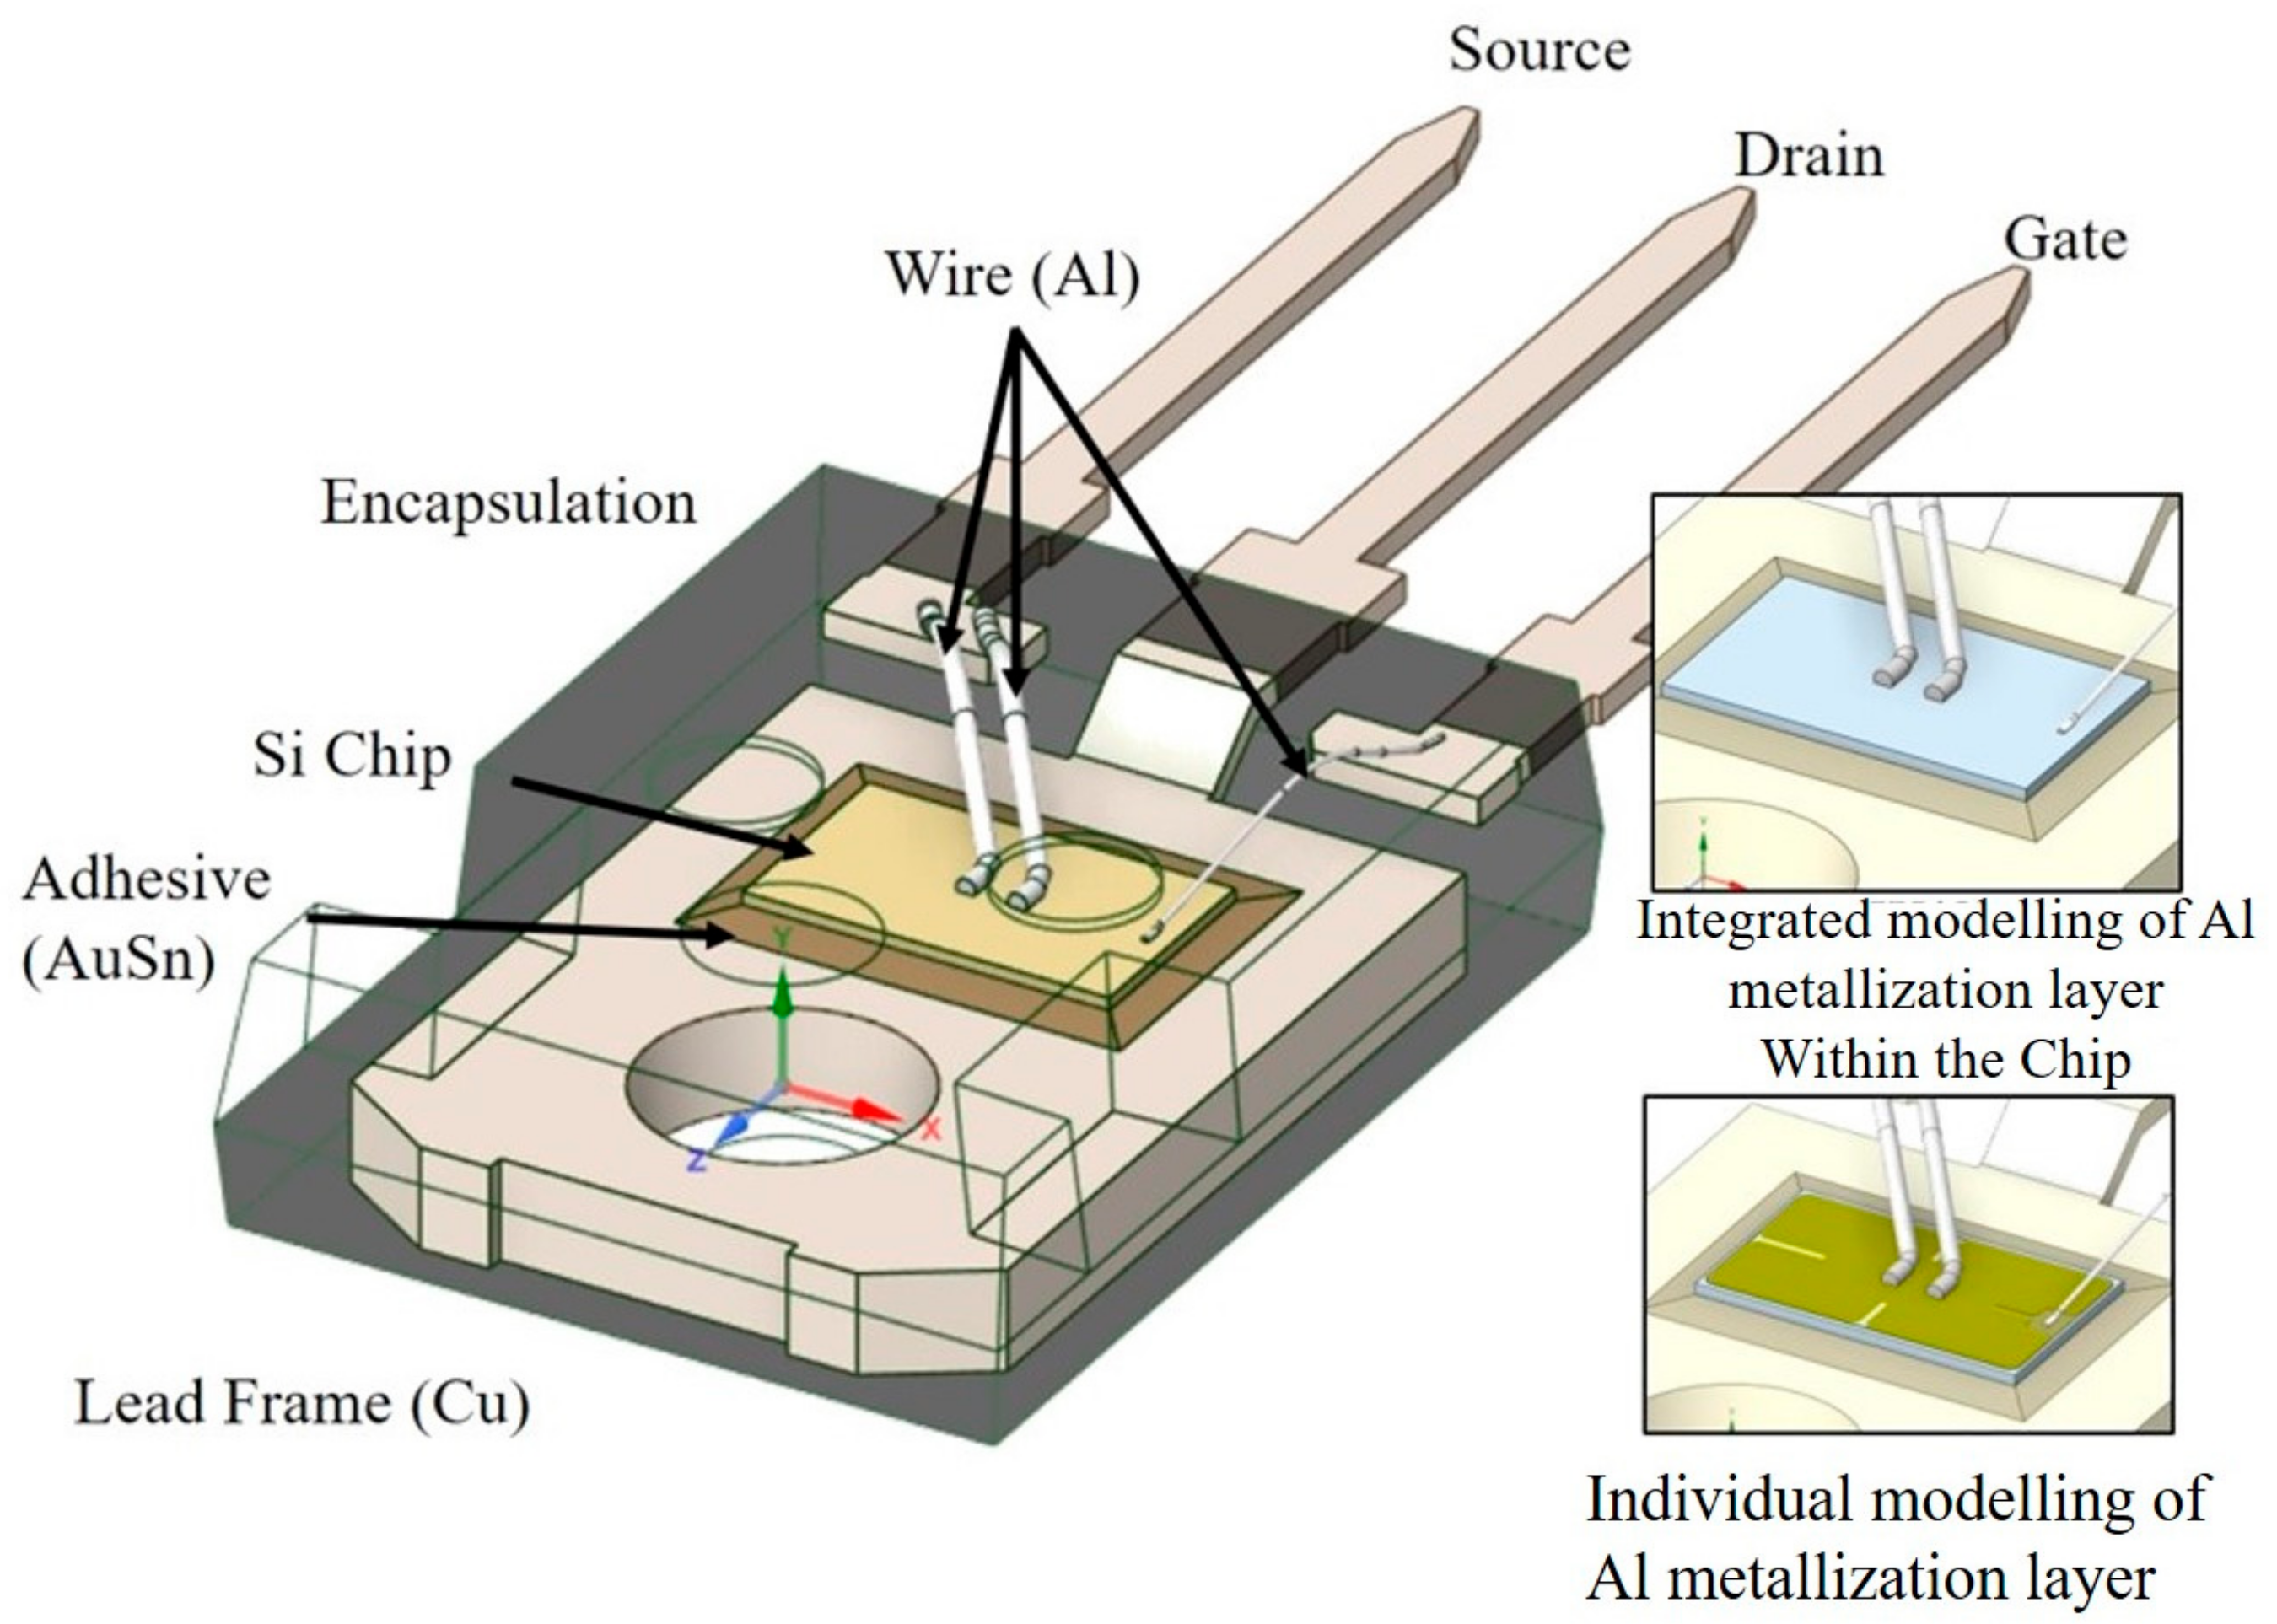
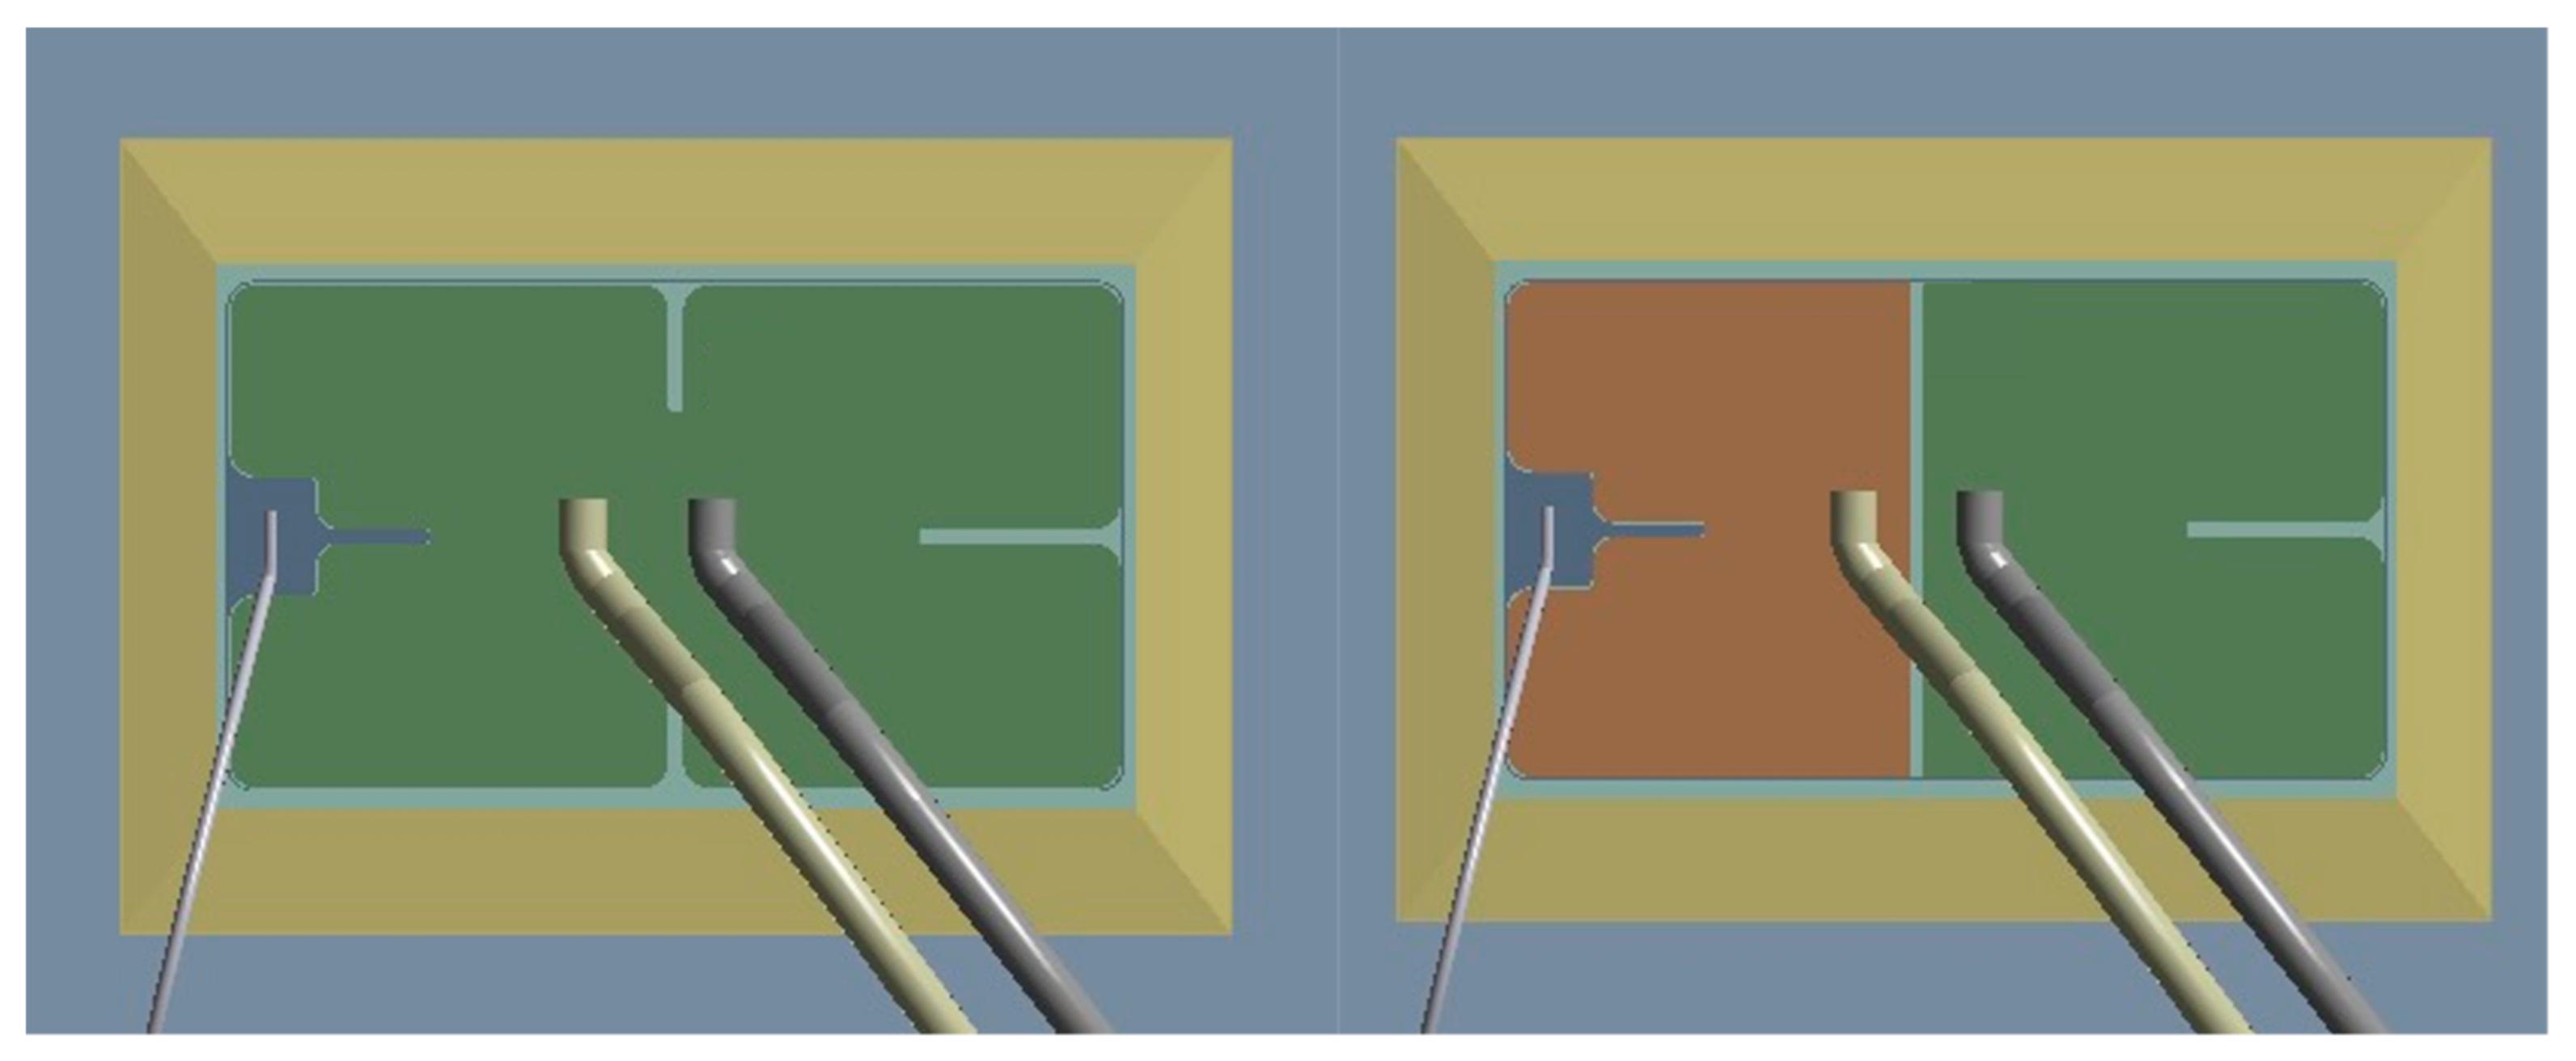
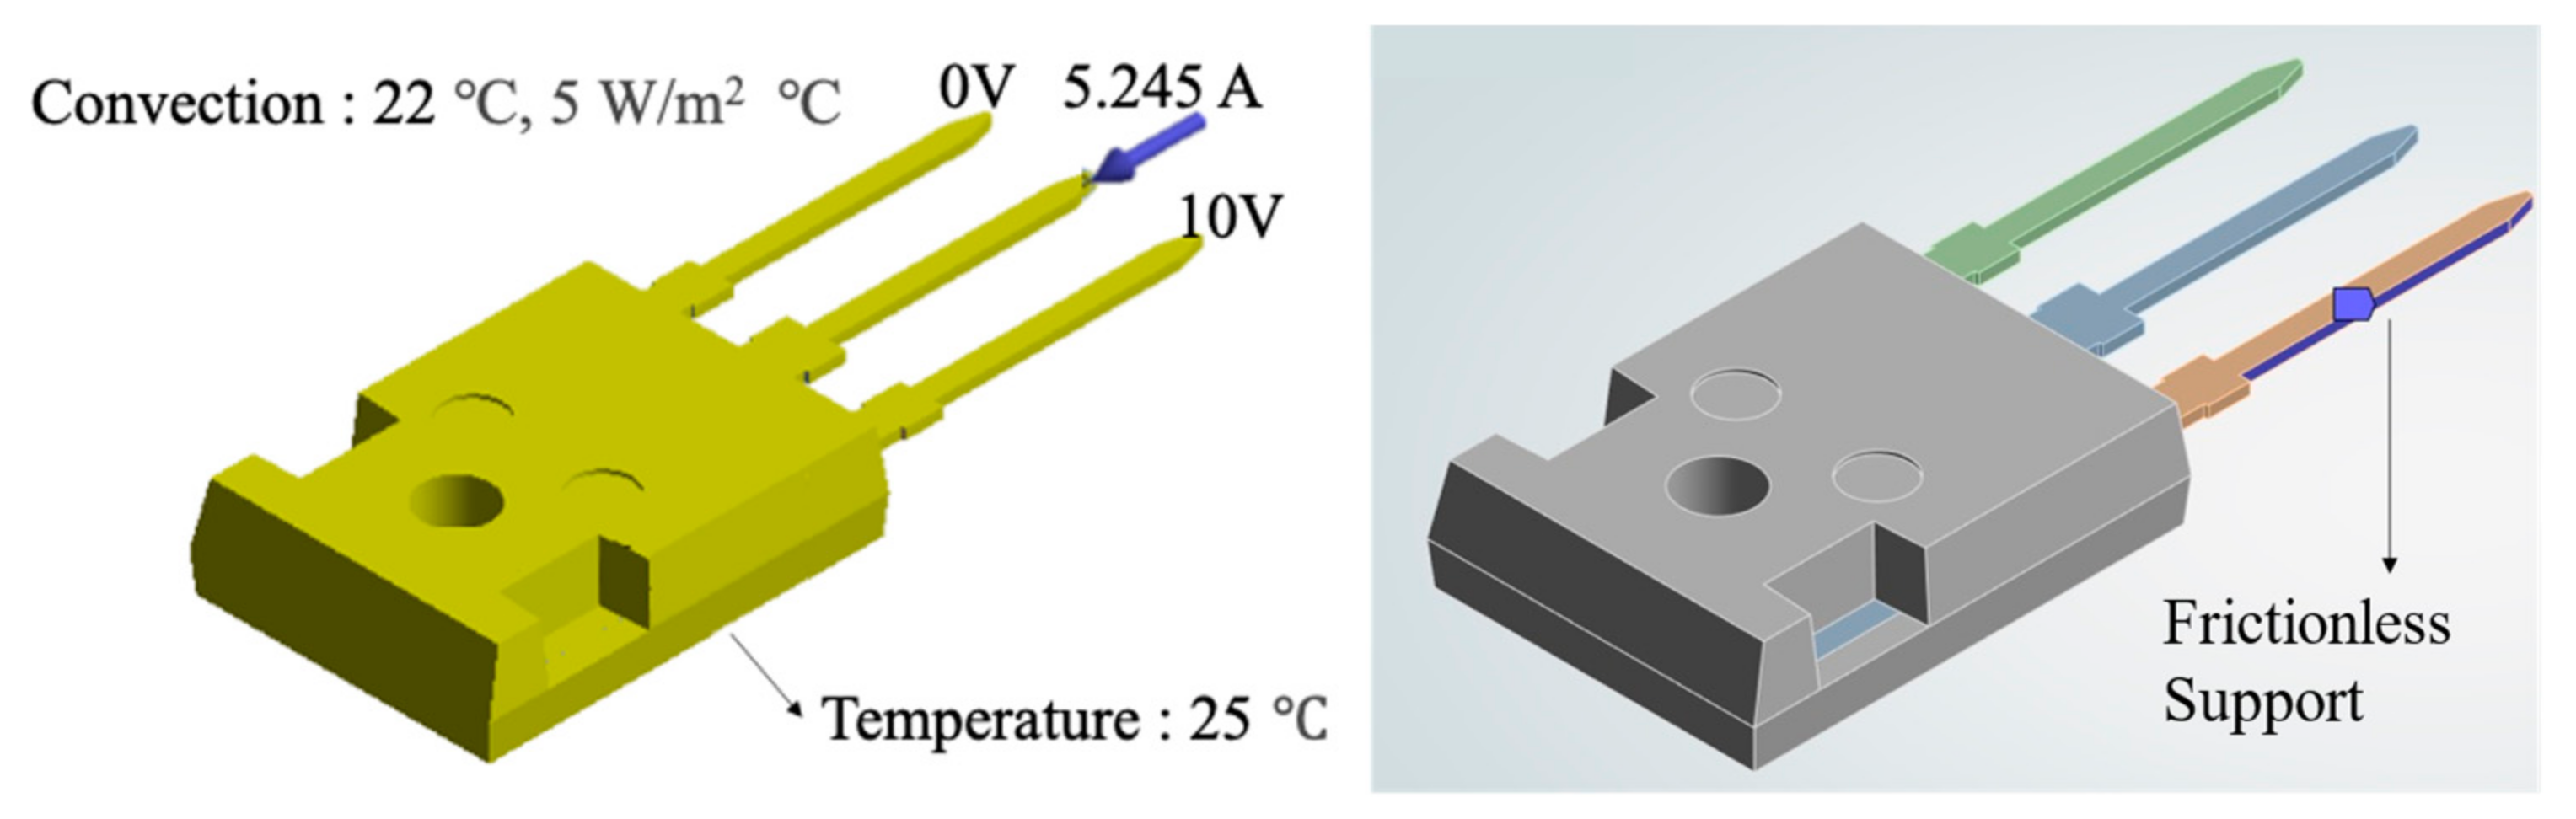
The analysis in this study utilized the R6030JNZ4 N-channel Power MOSFET from Rohm (Kyoto, Japan). This device is capable of handling a drain-source voltage of 650 V and a current of 30 A, and it is packaged in a TO-247G type. The detailed specifications of this device are presented in Table 1. The TO-247 package is widely used in power electronics applications, including electric vehicles (EVs), industrial motor drives, and power conversion systems. The 650 V/30 A rating makes it a suitable representative for high-voltage and high-current switching applications.

2.2. 3D Geometry

Obtaining accurate geometric information and precise modeling of actual devices is a critical factor in achieving highly accurate results when analyzing power semiconductor devices using the finite element method (FEM) [17]. In this study, geometric information of the power semiconductor device was acquired using X-ray, chemical decapsulation, and cross-section analysis techniques, and a 3D CAD model was designed based on this data. The designed CAD model is shown in Figure 3. The Al metallization layer was designed using the image of the decapsulated device. The actual decapsulation image and the CAD model are presented in Figure 4.

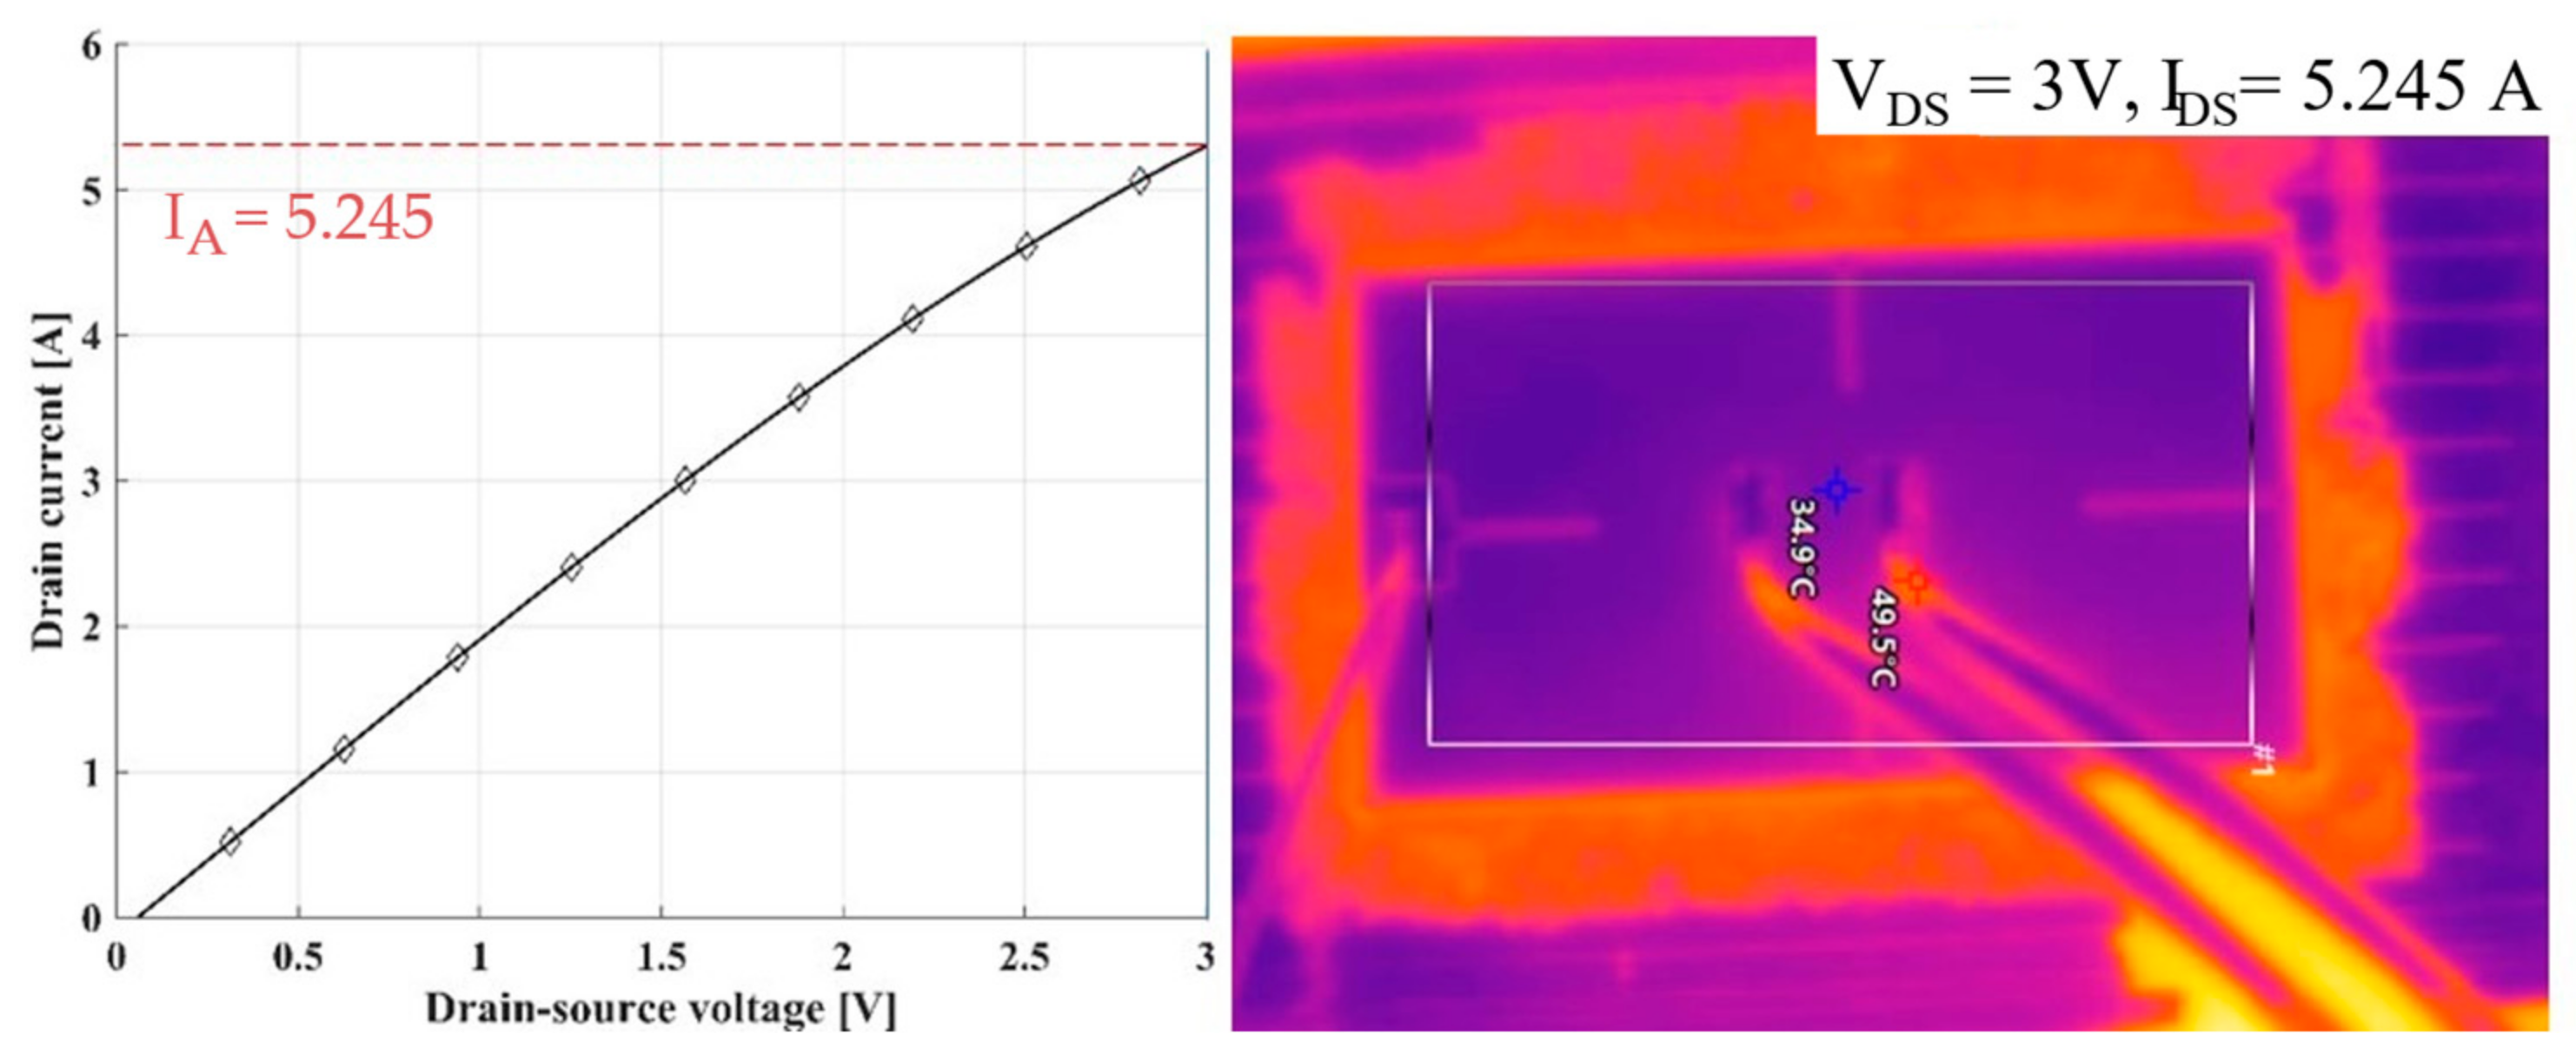
2.3. Measurement of Junction Temperature & Drain Current

To match the simulation results with the actual measurement results, we first measured the temperature of the chip surface with a thermal imaging camera with a bias applied. The measurement station is shown in Figure 5. A Tektronix Curve Tracer A370 (Tektronix, Beaverton, OR, USA) was used for bias application and measurement, and an Al heatsink was used on the bottom for heat dissipation. The resulting I–V curve and temperature distribution on the chip surface are shown in Figure 6. Simulation models and integrated and individual modeling of the Al metallization layer were built and calibrated to the corresponding measurement results of VDS = 3 V, IDS = 5.245 A, and 34.9 °C at the center of the chip through electro-thermal analysis. The results of the finite element analysis were calibrated using the actual measured data.

2.4. Calibration of FEM Model Using Experimental Data

Due to intellectual property protection restrictions, it is often difficult to obtain detailed chip data under operating conditions. To address this issue, this study used a dummy chip in the package and calibrated its equivalent resistance and thermal conductivity to match the measured results, replicating the behavior of the real chip in simulation and effectively overcoming data limitations while ensuring reliable and accurate analysis [18,19,20,21,22,23,24]. For electrical–thermal analysis, we utilized the ANSYS 2024 R2 Academic Research at the Converging Materials Core Facility of Dong-Eui University. The structure of a commercial Power MOSFET is shown in Figure 7. In this study, the on-state equivalent electrical resistivity of the chip, depending on the presence or absence of the Al metallization layer, is defined by Equations (1) and (2). Here, n represents the number of components within the chip, and the equation calculates the equivalent electrical resistivity by reflecting the electrical resistivity (ρ) of each component along the current path. Similarly, the equivalent thermal conductivity of the chip, based on the presence or absence of the Al metallization layer, is defined by Equations (3) and (4). In this case, n also denotes the number of components within the chip, and the equation evaluates the overall thermal conductivity of the chip by reflecting the thermal conductivity (λ) of each component. These definitions enable a quantitative analysis of the electrical and thermal roles of the Al metallization layer in the simulation.
ρ e q u i v a l e n t _ i n d i v i d u a l   A l   p a d = f ρ 1 , ρ 2 , ρ 3 ρ n  
ρ ( e q u i v a l e n t _ i n t e g r a t e d   A l   p a d ) = f ρ 1 , ρ 2 , ρ 3 ρ n , ρ A l   p a d
λ ( e q u i v a l e n t _ i n d i v i d u a l   A l   p a d ) = f ( λ 1 , λ 2 , λ 3 λ n )
λ ( e q u i v a l e n t _ i n t e g r a t e d   A l   p a d ) = f λ 1 , λ 2 , λ 3 λ n , λ A l   p a d
The boundary condition and workflow for calculating the equivalent resistivity and equivalent thermal conductivity of the chip are shown in Figure 8, and the material properties are shown in Table 2. 0 V was applied to the source side pin and 10 V to the gate side pin, and a constant current of 5.245 A was set for the drain. A mesh size of 0.1 mm was set on the wire and the Al metallization layer. The model was specified as a shared topology to minimize contact conditions. Shared topology means that each body is shared between nodes. Equivalent properties of the chip were updated to save the properties of the chip when the measured drain voltage [mV] value and the calculated drain voltage [mV] error rate were less than 0.1%. The material properties of the encapsulation are specified as air in this section to simulate the decapsulated situation in the experiment.

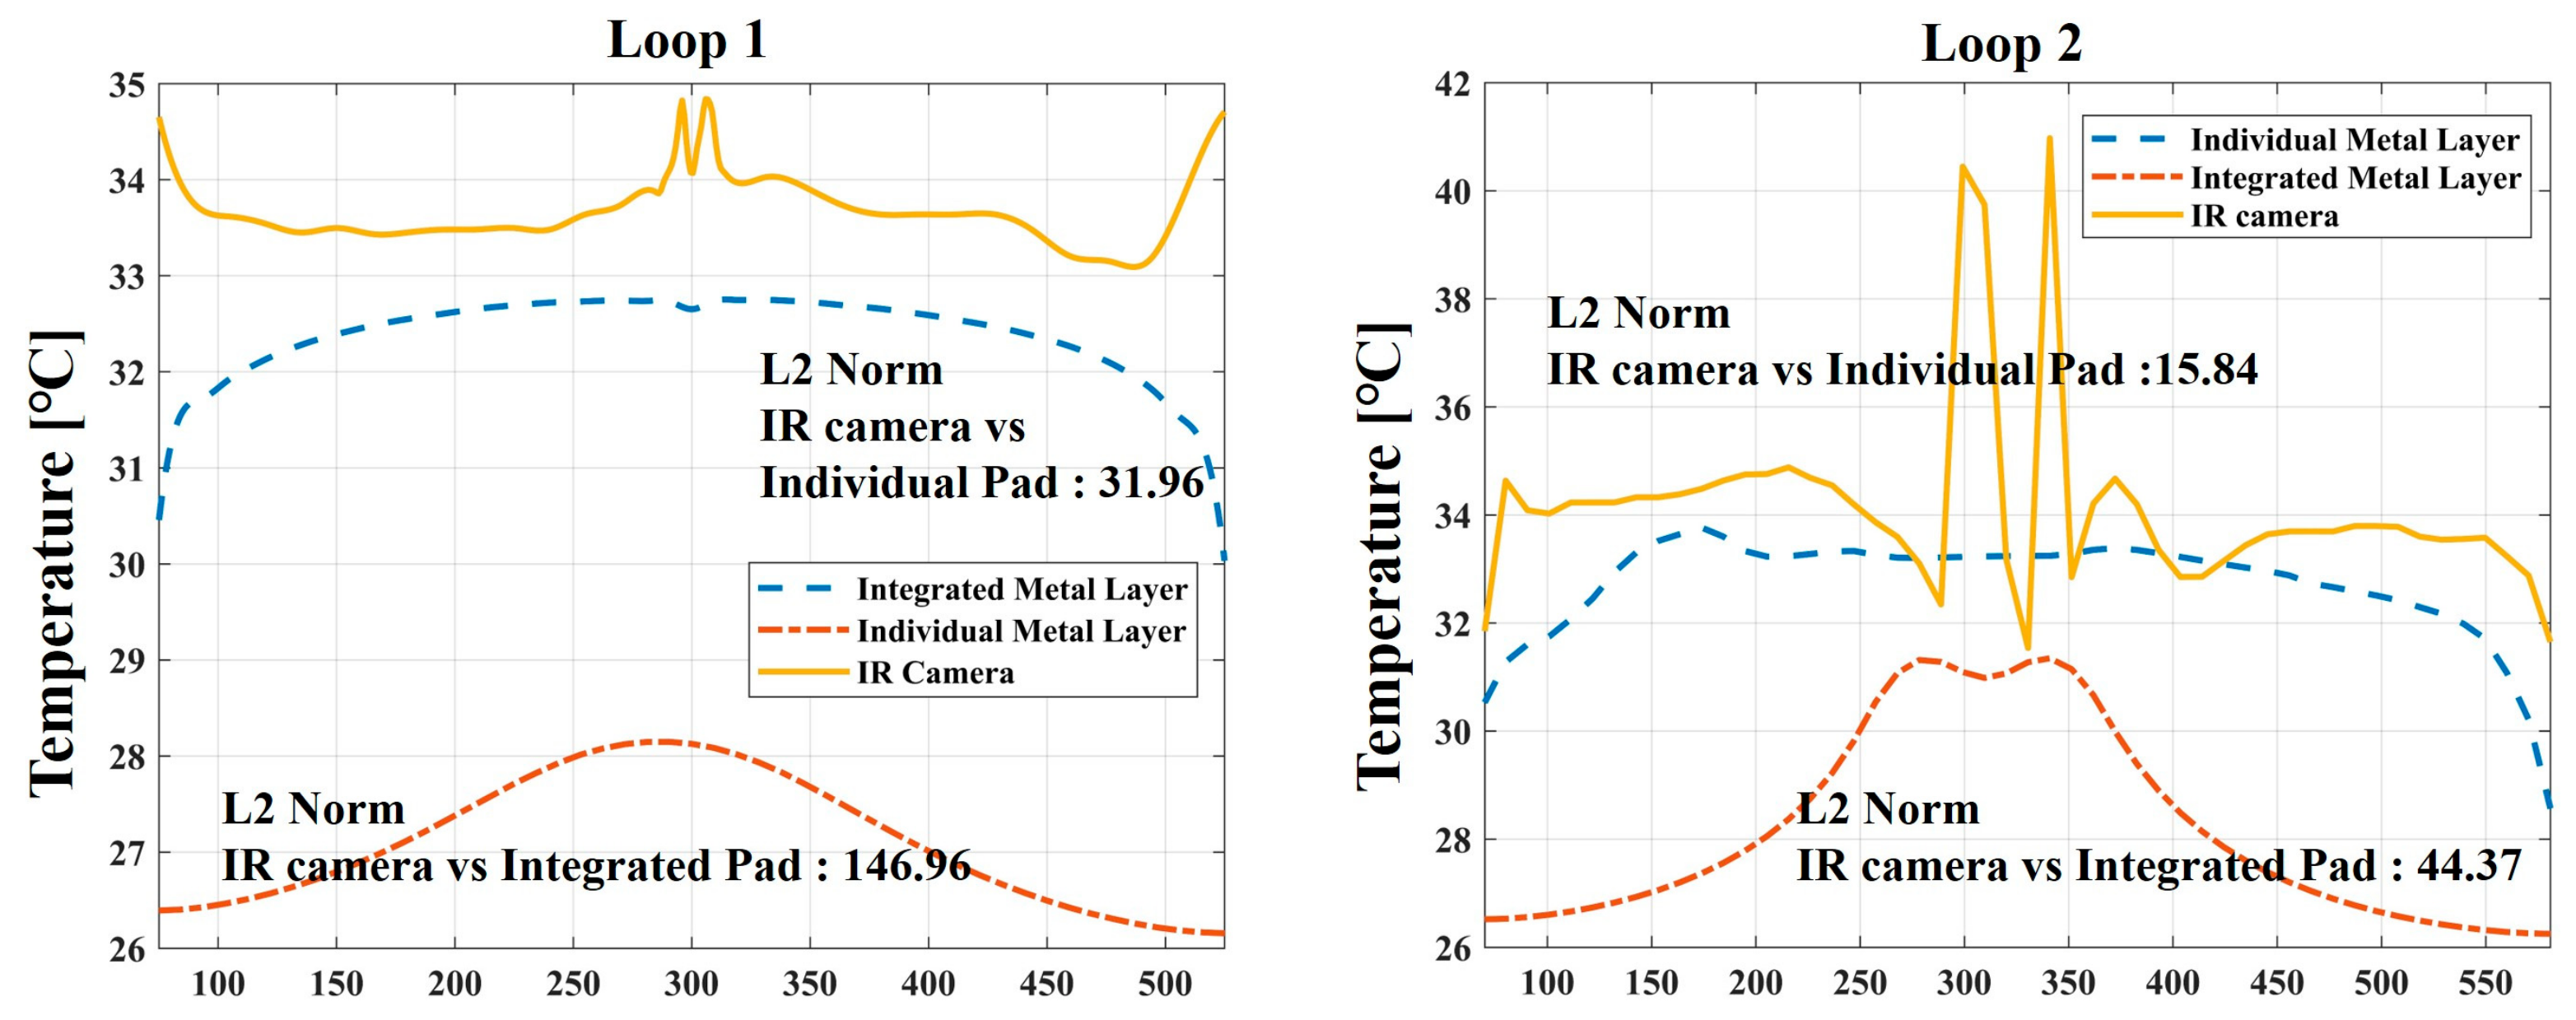
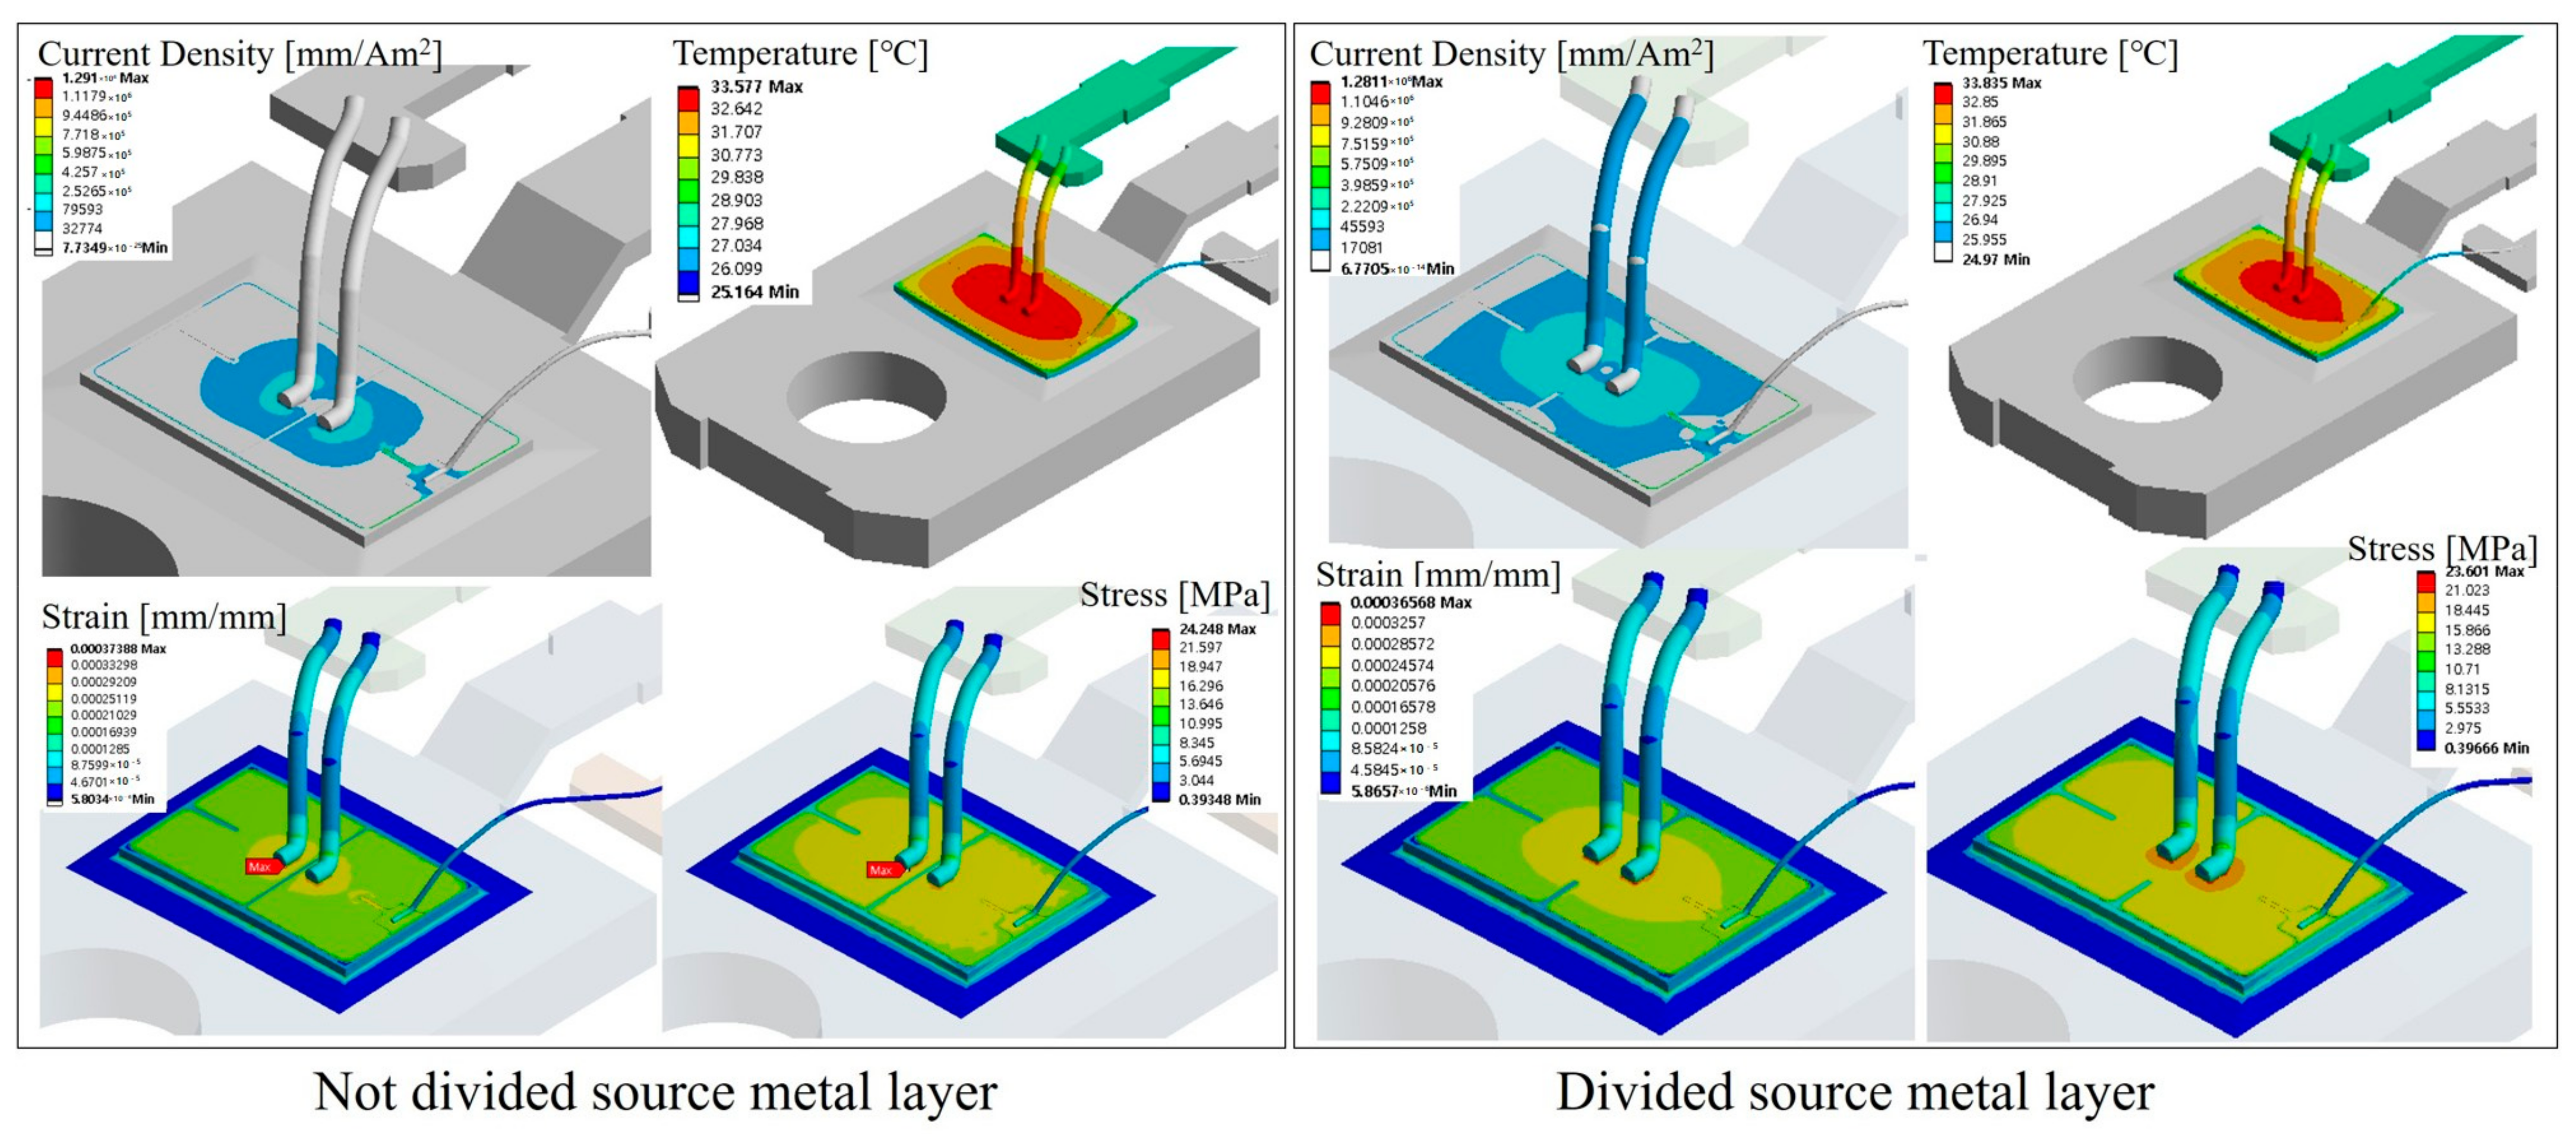
2.5. Results and Discussion

In this study, the electrical and thermal simulation results of the 3D modeling of the Al metallization layer were compared. Table 3 presents the input parameters and output values from the simulations conducted using the integrated modeling and individual modeling approaches for the Al metallization layer. The equivalent resistivity of the chip was found to be 2.533 ohm·mm when the Al metallization layer was modeled and calibrated using the individual modeling approach, whereas it increased notably to 69.296 ohm·mm when the integrated modeling approach was used, incorporating the Al metallization layer into the dummy chip. This indicates that the equivalent resistivity is higher when the Al metallization layer is integrated into the dummy chip rather than treated as a separate component through individual modeling.
The equivalent thermal conductivity of the chip was calibrated based on the experimentally measured temperature. In the integrated modeling approach, the Al metallization layer was incorporated into the dummy chip, resulting in an equivalent thermal conductivity of 2450 W/m·K. This value was obtained through the calibration process in Section 2.4 to match the experimentally measured chip surface temperature of 34.9 °C. However, it appears to be overestimated due to the excessive thermal contribution of the Al metallization layer (265 W/m·K) when incorporated into a single dummy chip. The high thermal conductivity of the Al metallization layer, which was overly reflected in the overall heat transfer path of the chip, likely led to this unrealistic value.
A thermal conductivity exceeding 2000 W/m·K is typically observed only in specialized materials, such as diamond or certain forms of graphene [25], indicating that the integrated model may not accurately reflect physical reality. In contrast, the discrete modeling approach treated the Al metallization layer separately, yielding a more realistic equivalent thermal conductivity of 12.5 W/m·K. Given that the typical thermal conductivity of silicon chips ranges from 130 to 150 W/m·K, and that of aluminum is approximately 237 W/m·K [26], the inclusion of the Al metallization layer indeed affects the equivalent thermal conductivity of the chip. However, the 2450 W/m·K obtained from the integrated model is likely an overestimation.
These overestimations can affect the reliability of real-world power devices. For example, assuming excessive heat transfer capability can lead to the prediction of lower junction temperatures (TJ) and thermal resistance than are actually present, which risks underestimating thermal stress and lifetime in high-voltage environments such as electric vehicles. The change in the output value was relatively small, from about 1 to 1.4 times, as a result of adjusting the input parameters to match the experimental data.
Images of the temperature and current density distribution at the top of the chip, where the wire and chip are joined, using the integrated and individual Al metallization layer modeling approaches, are shown in Figure 9. Both current density and temperature are concentrated at the junction with the wire in the absence of Al metallization.
To quantitatively evaluate the temperature and current density distribution in the designated region, the kernel density distribution was utilized for visualization, as shown in Figure 10. When the Al metallization layer is included in the model, the current density on the top surface where the chip and wire are bonded is primarily concentrated around an average of 190 mA/mm2. However, in the absence of the Al metallization layer, the current density is more widely dispersed with greater variance. This can be interpreted as the result of the current being concentrated at the bonding points with the wire. The influence of this current density distribution on the chip’s temperature distribution was also observed.
When the Al metallization layer modeling is individual, the temperature distribution is clustered between 31 °C and 34 °C, with a peak at about 33 °C. However, when the Al metallization layer modeling is integrated, the distribution is spread from 26 °C to 31 °C with a peak at 31 °C. Considering that the temperature of the bottom heat sink is 25 °C, the peak at 26 °C is considered to be the ambient temperature of the system. These results demonstrate that the Al metallization layer substantially influences the temperature distribution, contributing to the accuracy of both simulation and experimental results.
In general, aluminum has a high thermal conductivity, which should result in a lower temperature. In this result, the reason why the peak temperature appears higher when the Al metallization layer is modeled separately is that the temperature was calibrated using measured data at a specific point. The temperature at the calibration point is the same for both cases, i.e., when the Al metallization layer is included in the dummy chip and when it is modeled separately. However, the temperature at the junction with the wire and the temperature distribution across the chip are different.
In practice, accurately measuring the temperature of the junction where the wire and chip are joined is challenging. To address this, understanding the model is essential for obtaining accurate simulation results. In this study, we separately evaluated the measured results using integrated and separated Al metallization modeling in the simulation, based on the actual measured temperature path.
To quantitatively analyze the agreement between the simulation results of both integrated and individual Al metallization layer’s, the temperature was measured using an IR camera ( T I R   c a m e r a ) and the simulated temperature results ( T s i m u l a t i o n ) were compared using the L2 Norm. The L2 Norm is a mathematical method for analyzing the difference between two points, enabling numerical evaluation of the agreement between experimental data and simulation results. Figure 11 illustrates the positions of loop 1 and loop 2 designated on the IR camera. The temperatures of the loops, calculated through simulation, were linearly extracted from the top surface of the chip for computational convenience. The formula used to calculate the L2 Norm is presented in Equation (5).
T I R   c a m e r a T s i m u l a t i o n 2 = i = 0 n ( T I R   c a m e r a , i T s i m u l a t i o n , i ) 2
Here, TIR camera,i and Tsimulated,i represent the temperature values at discrete points i along the defined loops. L2 Norm quantifies the average square root deviation between these data sets, providing a single metric to assess overall similarity. By minimizing the L2 Norm, this study ensures that the electro-thermal simulation model is well-calibrated to experimental data, improving the reliability and accuracy of the finite element analysis (FEA).
Figure 12 presents the evaluation of temperature differences between experimentally measured IR images and simulation results, assessed using the L2 Norm for integrated and individual Al metallization layer modeling. For Loop 1, the L2 Norm value was 31.96 when the Al metallization layer was modeled individually in the simulation, increasing to 146.96 when it was modeled as integrated. Similarly, for Loop 2, the L2 Norm value was 15.84 for the individual modeling approach and increased to 44.37 for the integrated approach.
The L2 Norm value decreases as the measurement point becomes closer to the bonding area between the wire and the chip, which indicates a reduced discrepancy between the simulation and experimental results. Conversely, in Loop 2, which is further from the bonding area, the discrepancy between the simulation and experimental results becomes more pronounced. When the Al metallization layer was integrated, the L2 Norm value increased significantly from 44.37 to 146.96, representing approximately a threefold rise. Moreover, at the individual Al metallization layer, the differences become substantially larger: 31.96 vs. 146.96 in Loop 1 and 15.84 vs. 44.37 in Loop 2. These findings indicate that including the Al metallization layer in the simulation allows for a more accurate evaluation of the chip’s temperature distribution compared to the actual IR measurements.
These results confirm that modeling the Al metallization layer separately from the chip results in a more realistic assessment of the temperature distribution of the chip. These temperature distributions can be used to understand the main sources of thermal stress in the operation of power devices and, thus, play an important role in quantitatively analyzing their thermal behavior.
We also examined the impact of the presence or absence of the Al metallization layer on simulation results related to the wire bonding area. For this purpose, the bonding foot area was varied by −7%, +9%, and +13% compared to the initial model, and the effect of changes in the bonding foot area on the results was analyzed and integrated in terms of the individual Al metallization layer. A constant current of 5.245 A was applied in each configuration, and the changes in the maximum junction temperature and VDS/IDS were statistically analyzed.
The results of variance analysis between the two groups, conducted using the Bonett and Levene tests, are presented in Figure 13. The analysis shows that the standard deviation of the maximum junction temperature and VDS/IDS due to the change of the bonding foot is large when the Al metallization layer is included in the dummy chip. In contrast, when the Al metallization layer is designed and analyzed as a separate model, the variance of maximum junction temperature and VDS/IDS due to the change of bonding foot becomes smaller. This can be attributed to the role of the Al metallization layer in maintaining uniformity of current density and temperature distribution.
These results suggest that, if the metallization layer is not designed in the simulation and is interpreted as a dummy chip, the variability of simulation results due to changes in wire geometry will be greater. Several studies have reported that wire bonding has a limited impact on the overall device performance when performed on the same material and under the same process conditions [27,28,29,30]. Therefore, modeling the Al metallization layer separately in simulation provides a more realistic representation of the device’s electrical performance, reflecting the inherent stability and uniformity of the fabrication process. In finite element analysis (FEA), the geometry significantly affects simulation outcomes; however, when the Al metallization layer is modeled separately, variations in wire geometry have less impact on the results, better reflecting the chip’s intrinsic characteristics.
In this study, the use of a decapsulation device allowed direct observation of the chip’s junctions and a detailed analysis of the effect of the Al metallization layer on the temperature distribution. However, decapsulating a device inherently changes the boundary conditions by removing the encapsulation, leading to potential changes in heat dissipation paths and electrical characteristics. These changes can cause deviations in temperature measurements and current density distributions when compared to conditions in the encapsulated device.
To address this issue, one approach has been to model the encapsulation as air during simulation to approximate the altered thermal and electrical behavior. However, this approach is limited in its ability to fully reproduce the insulating properties and heat transfer mechanism of the original encapsulation material. Future work will utilize custom-designed ceramic packages to directly characterize the chip without decapsulation. This will ensure that the boundary conditions remain consistent, which is expected to improve the reliability of the results and minimize the changes that occur during the encapsulation process.
This study suggests that the Al metallization layer plays a notable role in influencing power semiconductor package simulations conducted through finite element analysis. However, the Al metallization layer typically has a thickness on the micrometer scale, and accurately reproducing it with fine meshing in simulations of individual components, modules, or PCBs, where dimensions are usually measured in millimeters or centimeters, requires substantial computational resources and time. This not only increases the complexity of the model but also influences the overall simulation time.
In this study, the number of elements increased from 137,540 to 215,512—a 56.68% increase—when the Al metallization layer was included in the simulation model. Consequently, the analysis time also increased by approximately 35%. Therefore, depending on the purpose of the analysis and the required level of accuracy, it may still be feasible to simplify or omit detailed modeling of the Al metallization layer. This approach allows for efficient management of analysis time while enabling simulations under specific conditions. However, it is important to understand the limitations of a simplified model and to consider its potential impact when interpreting the analysis results. This can help ensure a balanced trade-off between computational efficiency and result accuracy.

3. Optimal Design for Wire and Metallization Layer Variations

The Al metallization layer and Al bonding wire are subjected to thermal stress due to differences in their coefficients of thermal expansion caused by temperature changes. This thermal stress can lead to damage, such as cracks or lift-off, between the Al bonding wire and the Al metallization layer. Several previous researchers have conducted studies on the failure modes of metallization layers, chips, and bonding wires. Dornic, N. et al. observed cracks and microstructure changes occurring at the interface of bonding wire and metallization pad in IGBT modules, suggesting the predictability of cracks through VCE changes [31]. England, L. performed a reliability analysis of Cu wire bonding versus Au wire bonding to the Al metallization layer [32]. R. Ruffillia et al. noted that the Al metallization layer, which is bonded to the bonding wire, is the most vulnerable part of the power device and analyzed the degradation of the metallization layer material using accelerated aging tests [33].
In this section, we will analyze the effects on electrical, thermal, and mechanical properties by changing the parameters of the metallization layer and bonding wire based on design of experiments (DOE) and propose an optimized design using electrical–thermal–structural multiphysics analysis.

3.1. Setup and Factor Analysis for Metallization Layer and Bonding Wire Optimization

For the optimization of the metallization layer and bonding wire, factors and levels were selected based on an experimental design. Table 4 shows the factors and levels of the experimental design for optimization. Factors were selected as source metallization layer section (2), metallization layer thickness (4), metallization layer material (2), and bonding wire material (2), and a total of 32 runs were conducted. The design of the divided/undivided metallization layer is shown in Figure 14.
These factors were selected for the following reasons: metallization layer design has been reported to have an impact on current distribution and resistance [34]. While segmented metallization layer designs provide uniform current distribution, previous studies have noted that they can result in increased electrical resistance or decreased mechanical stability, depending on the design. Metal layer thickness has a considerable impact on mechanical strength, electrical conductivity, and fatigue life. Thin layers can reduce electrical losses, but at the expense of mechanical stability; conversely, thicker layers can increase durability and mechanical stability, but at the expense of reduced electrical performance and potentially increased parasitic losses [35,36]. In addition, as Si-based power semiconductors are transitioning to SiC power semiconductors, which are wide bandgap (WBG) devices, new interconnection technologies and materials that can provide higher reliability and lower bonding complexity are required. One such technology is Cu wire bonding, and studies have been conducted on Cu layers for stable bonding of Cu wire bonding [37]. Therefore, in this study, the experimental design was conducted by selecting these four factors.
Four responses to these factors were selected: VDS/IDS, an electrical parameter; maximum junction temperature, a thermal parameter; and strain and von Mises stress, which evaluate mechanical reliability. We quantitatively analyze the impact of each factor on the response and propose an optimal interconnection design that minimizes these responses.
The boundary conditions applied to the electrical–thermal–structural multiphysics analysis are shown in Figure 15. The same boundary conditions as in Section 2 were applied to the electrical–thermal analysis, and the results of strain and von Mises stress were analyzed by setting a frictionless support on the gate pin side. The equivalent resistivity and equivalent thermal conductivity of the chip calculated in Section 2 were used as the properties of the chip, and the properties of the encapsulation specified as air were changed to an epoxy molding compound.

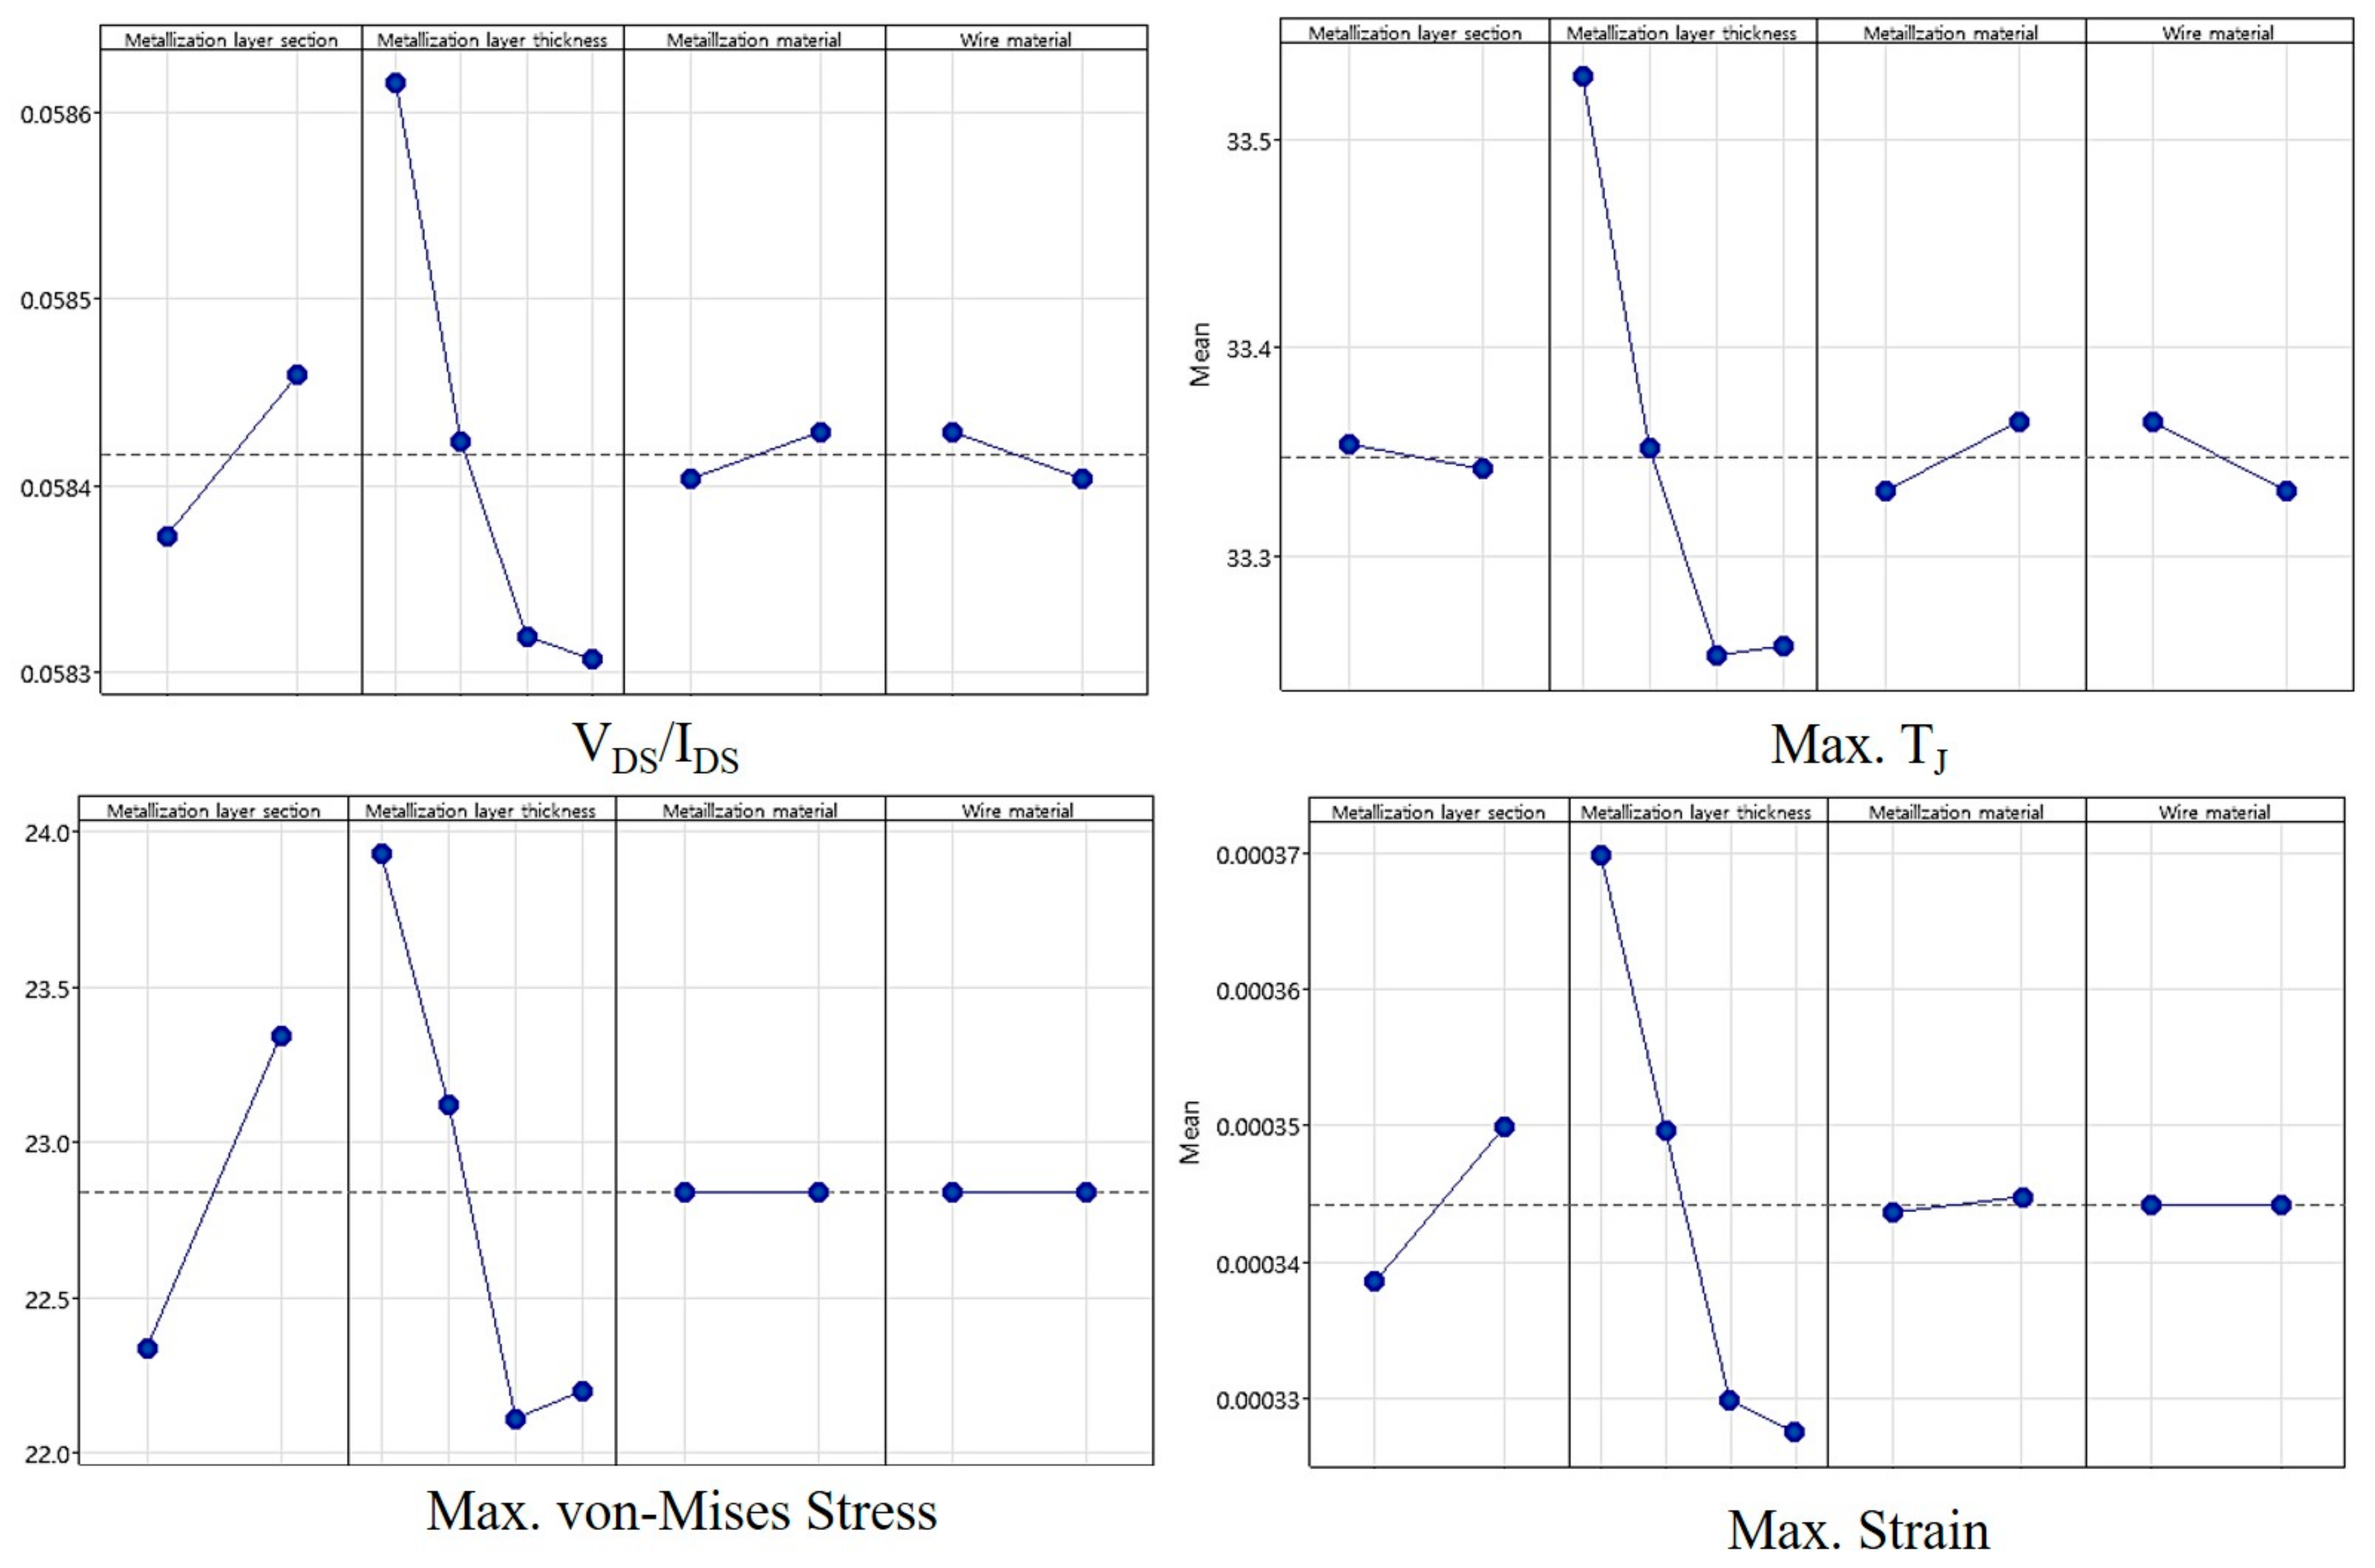
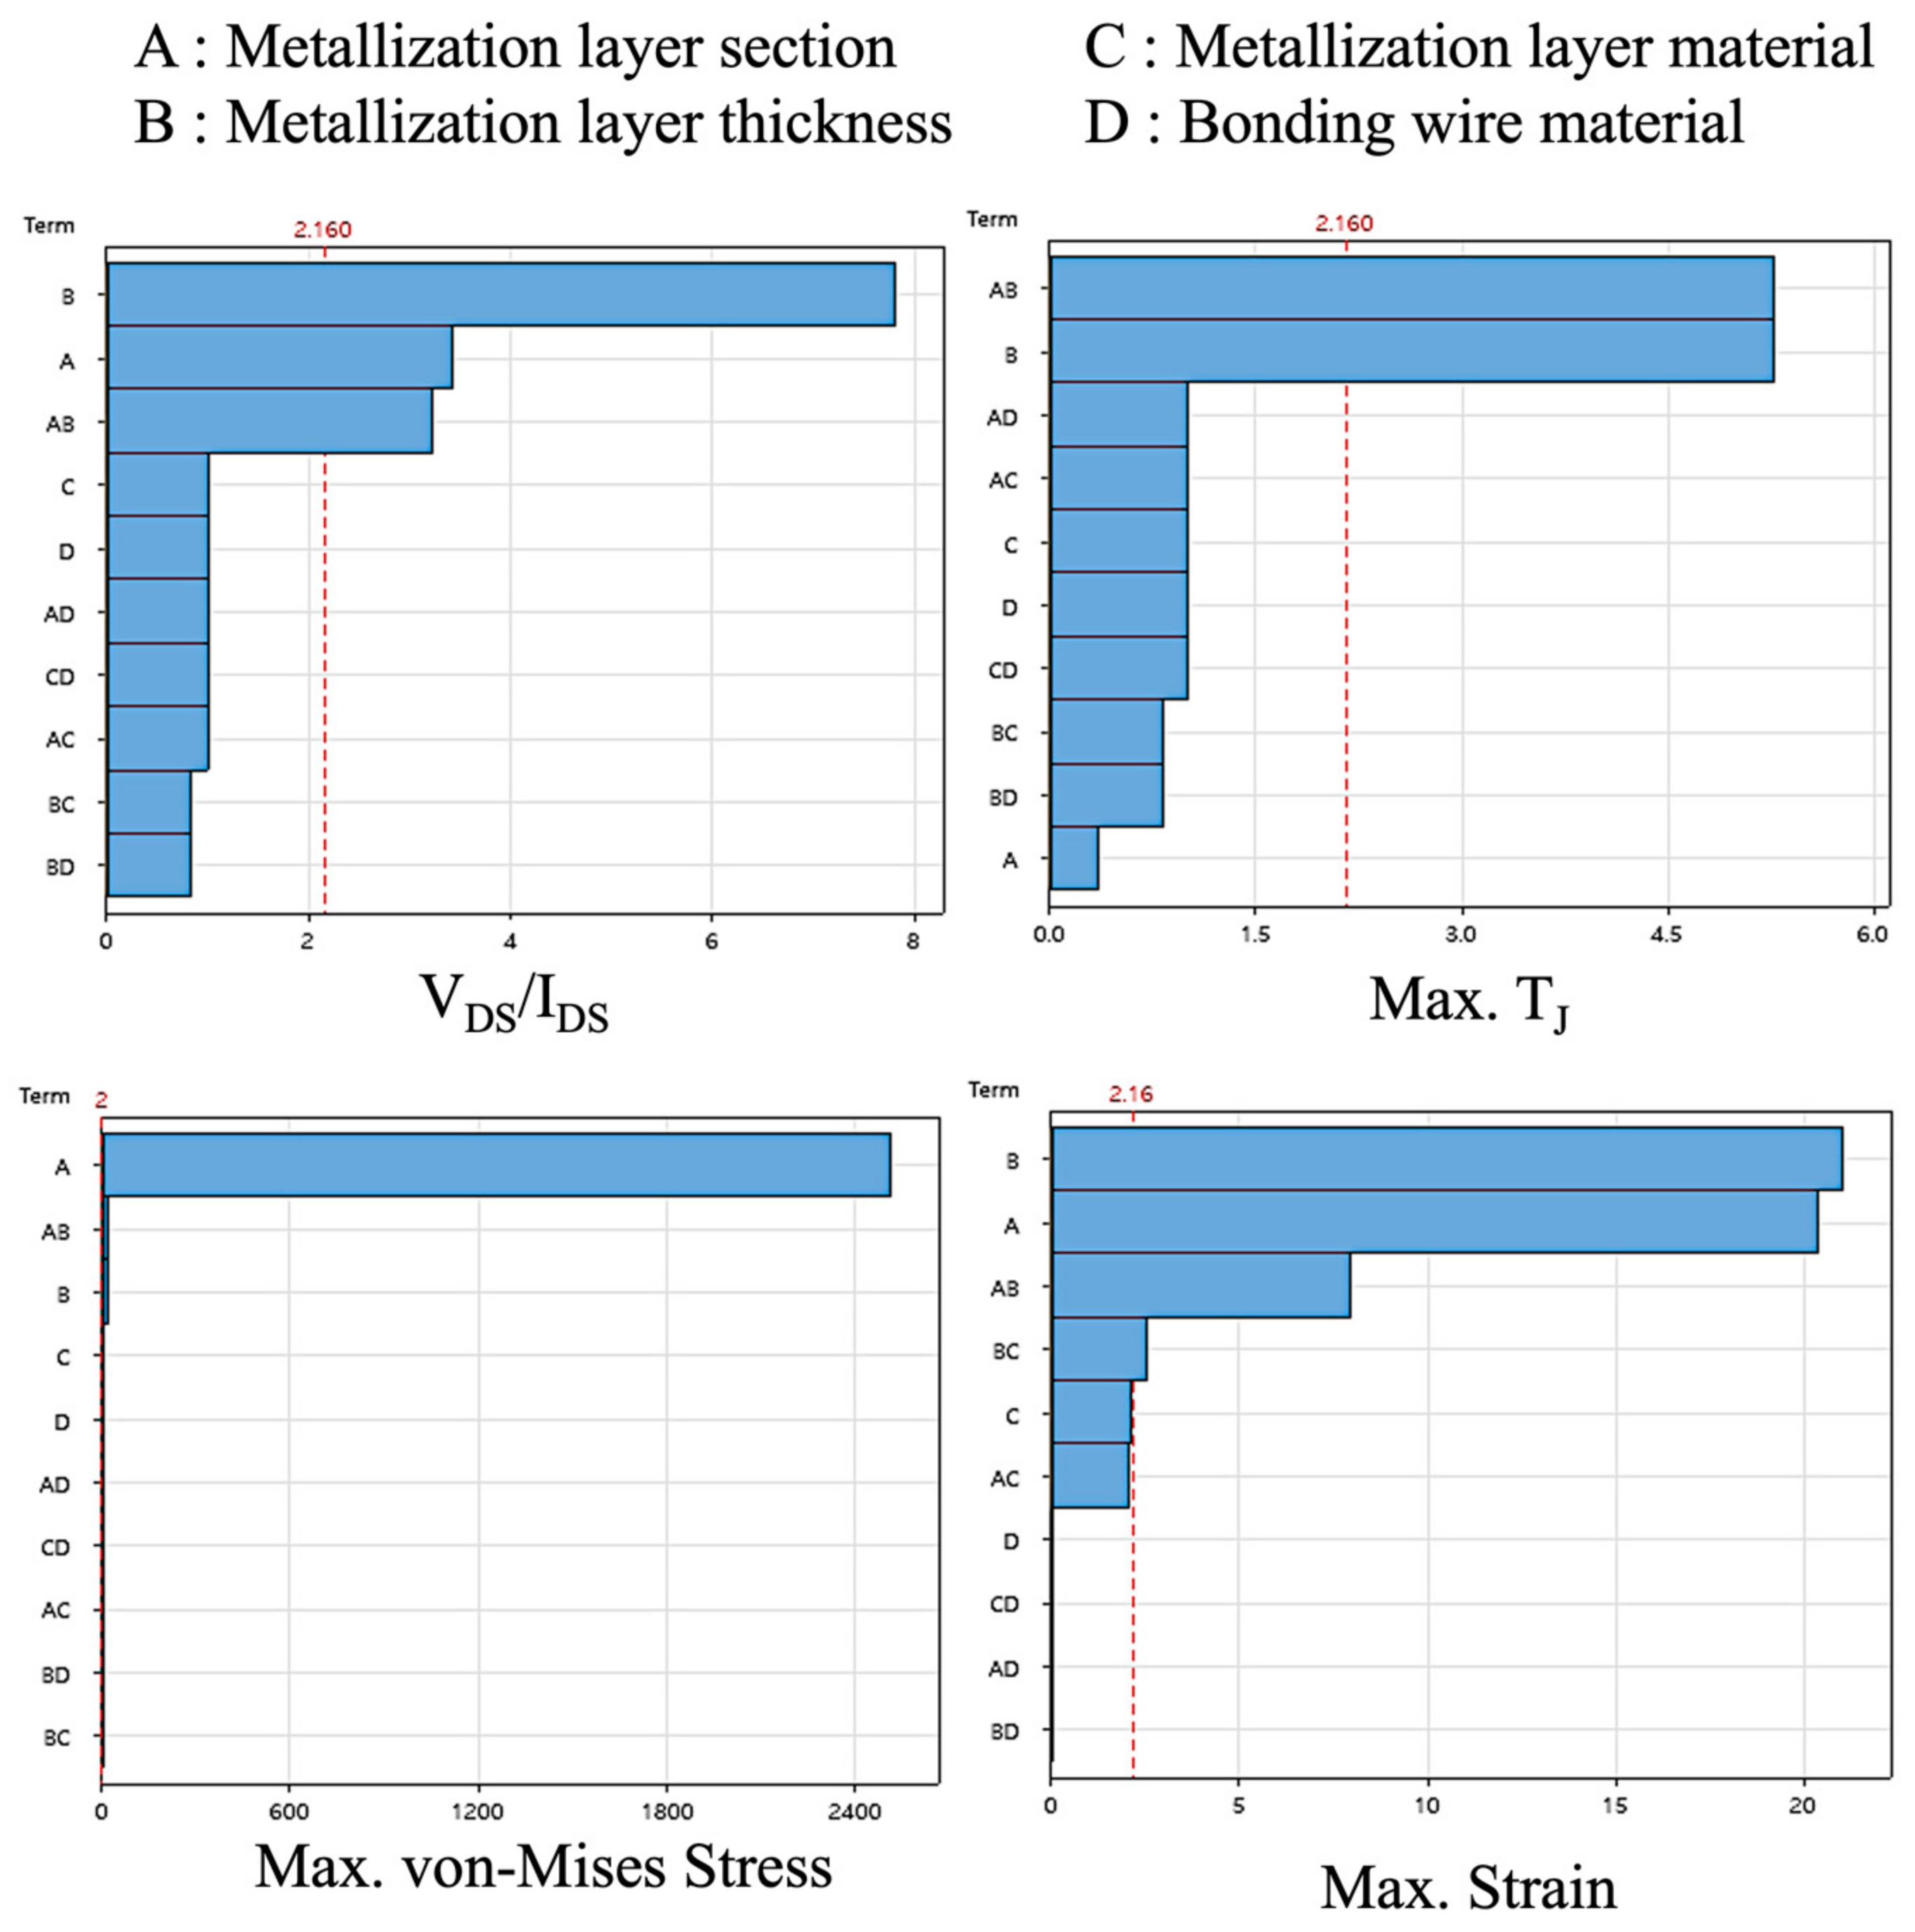
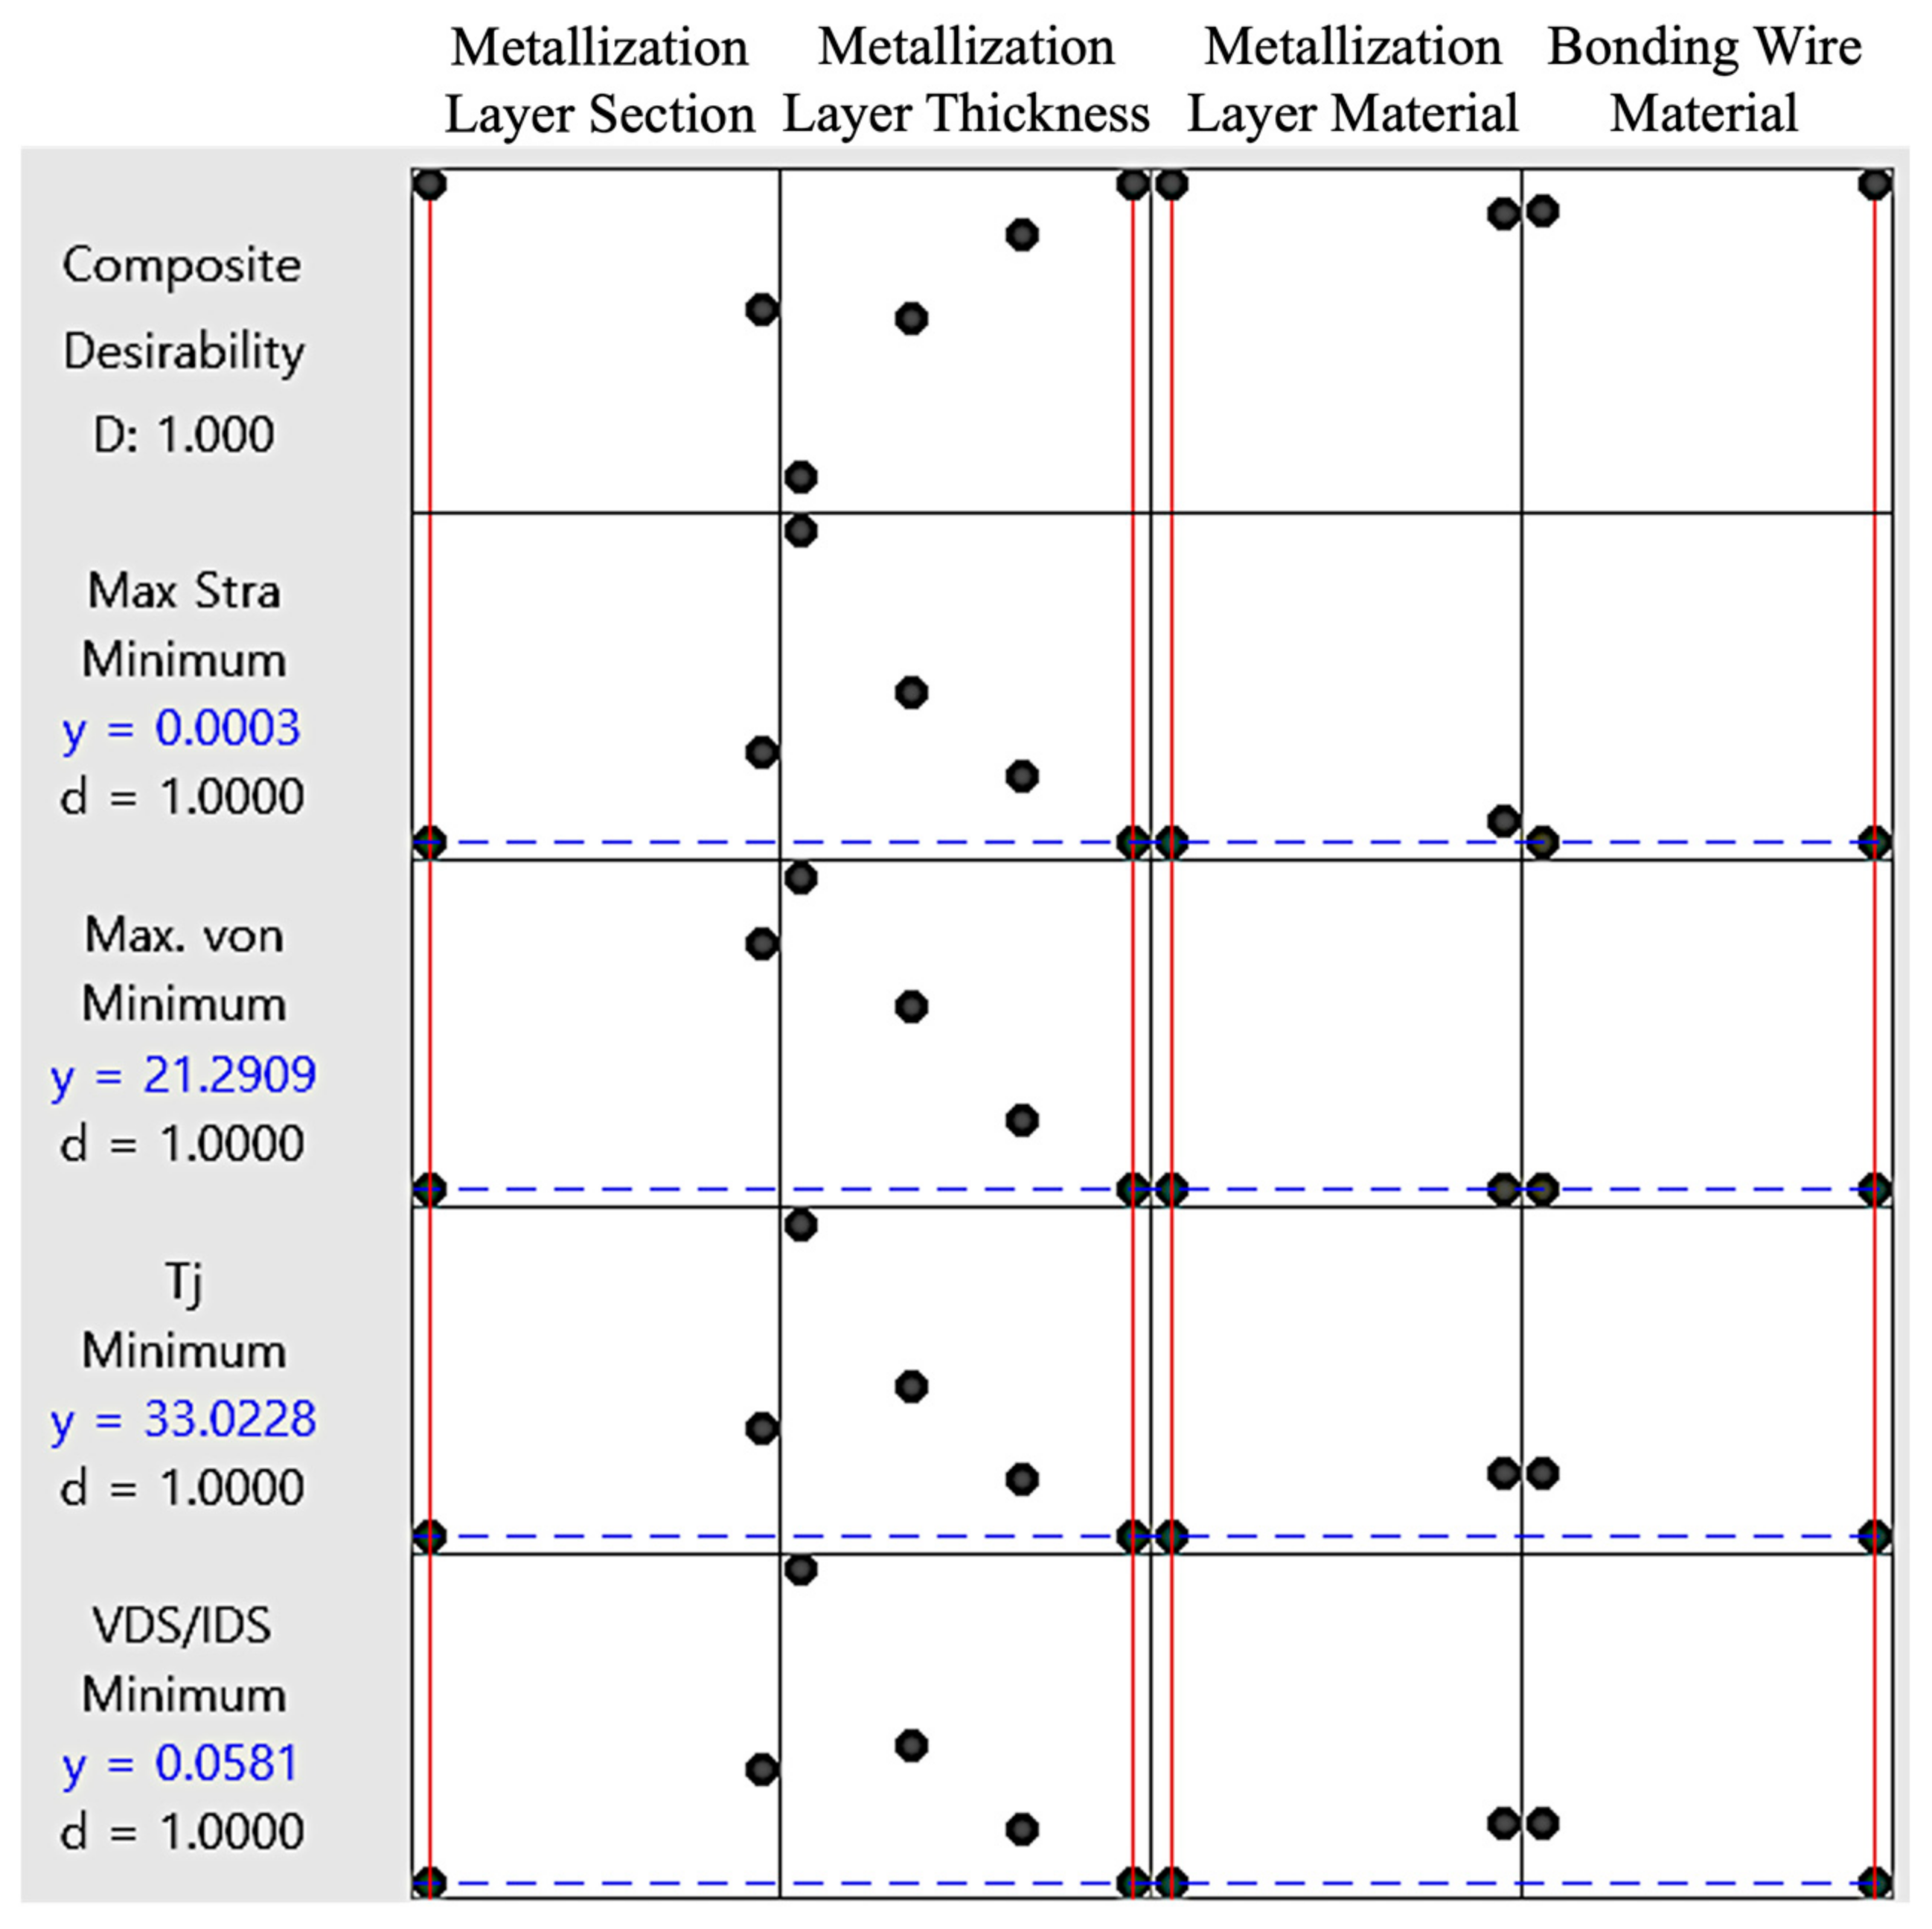
3.2. Results and Discussion

Figure 16 shows the distributions of current density, temperature, strain, and von Mises stress when the metallization layer is undivided and when it is divided. The current density, temperature, strain, and stress distributions are similar. Figure 17 illustrates the results of an ANOVA analysis, showing how main factors such as the metallization layer section, thickness, material, and wire material influence VDS/IDS, TJ, maximum von Mises stress, and maximum strain. The analysis results indicated that using an undivided metal layer led to a reduction in VDS/IDS, TJ, von Mises stress, and strain compared to a divided metal layer.
As the thickness of the metallization layer increases, VDS/IDS, TJ, strain, and von Mises stress all show a decreasing trend, with the layer thickness being particularly sensitive compared to other factors. In particular, the increased thickness reduces VDS/IDS and TJ, thereby improving thermal stability. This is because the enhanced heat transfer path suppresses localized overheating, stabilizes the temperature distribution, and facilitates effective heat dissipation. This ability to effectively dissipate heat has important implications in power devices. If the temperature distribution is not uniform and overheating occurs in certain areas of the chip, thermal stresses are concentrated, which can increase the risk of damage, such as material fatigue and thermal cracking, and, ultimately, reduce reliability.
It was also observed that the stress and strain tended to decrease with increasing thickness. This is consistent with previous studies that have shown that mechanical stability increases as the thickness of the Al metallization layer increases [38]. From these simulation results, we have quantitatively observed that increasing the thickness of the Al metallization layer improves both mechanical and thermal stability and improves the reliability of the power device.
However, the thickness and design of the metallization layer can lead to changes in parasitic parameters, potentially affecting switching losses. Therefore, it is essential to consider the trade-off between improving thermal stability and the potential increase in switching losses to achieve an optimal design [39]. Overall, the metallization layer was found to be influenced by its thickness, with improvements observed in performance as the thickness increased.
Figure 18 presents a Pareto Chart based on the DOE analysis. This chart visually represents the effect size of each factor and interaction term, making it a useful tool for identifying the variables that influence the outcome. In the graph, the blue bars indicate the effect size of each factor or interaction term on the response, while the red dotted line represents the threshold for significance. Among the factors analyzed, the thickness of the metallization layer had a notable influence on VDS/IDS, maximum junction temperature, strain, and von Mises stress. The divided metallization layer influenced VDS/IDS, von Mises stress, and, especially, Max. von Mises stress. The divided case showed a relatively higher von Mises stress than the undivided case. This is expected to be due to the fact that the divided metallization has independent expansion rates for heat, and this imbalance leads to higher stresses for heat. This can also be seen to affect the von Mises stress of the metallization layer design.
Figure 19 is the response optimization graph based on DOE, and the optimal design was carried out by targeting the value where VDS/IDS, TJ, strain, and von Mises stress are minimized. The red solid lines indicate the optimal levels for each factor, while the blue dotted lines represent the individual desirability trends for each response. Consequently, with an undivided metal layer, a thickness of 22 µm, an Al-Cu-Si metallization layer material, and copper wire, the composite desirability achieved a value of 1, indicating that this design fulfills all performance objectives and represents the optimal configuration. However, this study is limited to optimization based solely on static electrical–thermal–structural simulation results, without considering the effects of degradation occurring during operation. Previous studies have indicated that a thick Al metallization layer causes greater stress concentration when exposed to thermal fatigue, which can lead to micro-cracks or delamination in the long term [40,41]. Changes in the thickness of the Al metallization layer can affect the electrical properties, which suggests that it may also affect parasitic parameters [41]. Future research should experimentally validate and analyze the proposed optimal interconnection design to address this limitation.

4. Conclusions

In this study, we analyzed the effect of modeling the Al metallization layer on the electrical–thermal simulation results of a power device based on finite element analysis. This study showed that, when Al metallization layers were modeled individually in finite element analysis for power devices, the results matched infrared image measurements more closely. It also found that Al metallization layers help make current density and temperature distribution more uniform. These findings emphasize the importance of including Al metallization layers in simulations, as they help stabilize temperature, reduce thermal stress, and improve the performance of Si MOSFETs.
Furthermore, the developed model incorporating the metallization layer was utilized to propose an optimal design by varying the design, thickness, and material of the metallization layer, as well as the material of the wire, to analyze thermal, electrical, and mechanical outcomes. When using an undivided metal layer with a thickness of 22 µm, an Al-Cu-Si metallization layer material, and copper wire, the composite desirability reached 1. This confirms that the optimized design successfully minimizes responses, including VDS/IDS, TJ, strain, and von Mises stress. The proposed optimal design provides valuable guidance for optimizing the electrical–thermal–mechanical performance in the design of Si MOSFETs and SiC-based power semiconductor packages. The TO-247 package used in this study is a widely adopted package type across various power devices, suggesting that these findings have broad generalizability and are expected to serve as a foundation for future reliability reassessment of packages and the development of Progress Design Kits (PDKs) using finite element analysis.
However, this study derived the optimal design based on the results of static electrical–thermal–structural simulations, without considering the effects of several environments, such as transient states, or the influence of parasitic parameters. To address these limitations, additional experimental validation, dynamic simulations, and a detailed analysis of parasitic parameters are necessary.
In future research, the proposed optimal design will be applied to actual devices to evaluate reliability, and analyses incorporating operational conditions, such as long-term thermal stress and the impact of parasitic parameters, will be conducted. The findings of this study are expected to serve as valuable references for simulating, predicting, and evaluating power devices and packages using finite element analysis.

Author Contributions

Conceptualization, N.-Y.C., S.-G.K. and S.-U.Z.; methodology, N.-Y.C.; software, N.-Y.C. (ANSYS Workbench 2022 R2); validation, N.-Y.C., S.-G.K. and S.-U.Z.; formal analysis, N.-Y.C.; investigation, N.-Y.C.; resources, N.-Y.C.; data curation, N.-Y.C.; writing—original draft preparation, N.-Y.C.; writing—review and editing, N.-Y.C.; visualization, N.-Y.C.; supervision, S.-G.K. and S.-U.Z.; project administration, S.-G.K. and S.-U.Z.; funding acquisition, S.-G.K. All authors have read and agreed to the published version of the manuscript.

Funding

This work was supported by the Technology Innovation Program Development Program-Development of 1700V SiC MOSFET commercialization device for high efficiency xEV (RS-2024-00402824) funded by the Ministry of Trade, Industry & Energy (MOTIE, Korea) and this work was supported by the Korea Institute of Energy Technology Evaluation and Planning (KETEP) and the Ministry of Trade, Industry & Energy (MOTIE) of the Republic of Korea (No. RS-2023-00281219).

Data Availability Statement

The original contributions presented in this study are included in the article. Further inquiries can be directed to the corresponding author.

Conflicts of Interest

Author Sang-Gi Kim was employed by the company Eyeq Lab. The remaining authors declare that the research was conducted in the absence of any commercial or financial relationships that could be construed as a potential conflict of interest. The funders had no role in the design of this study; in the collection, analyses, or interpretation of data; in the writing of the manuscript; or in the decision to publish the results.

References

  1. Blaabjerg, F.; Wang, H.; Vernica, I.; Liu, B.; Davari, P. Reliability of Power Electronic Systems for EV/HEV Applications. Proc. IEEE 2021, 109, 1060–1076. [Google Scholar] [CrossRef]
  2. Calabretta, M.; Renna, M.; Vinciguerra, V.; Messina, A.A. Power Packages Interconnections for High Reliability Automotive Applications. In Proceedings of the ESSDERC 2019—49th European Solid-State Device Research Conference (ESSDERC), Cracow, Poland, 23–26 September 2019; pp. 35–39. [Google Scholar] [CrossRef]
  3. Wang, Y.; Ding, Y.; Yin, Y. Reliability of Wide Band Gap Power Electronic Semiconductor and Packaging: A Review. Energies 2022, 15, 6670. [Google Scholar] [CrossRef]
  4. Li, Q.; Li, Y.-B.; Fu, H.-D.; Tu, C.-M.; Xiao, B.; Xiao, F.; Zhai, D.-Y.; Lu, J.-W. Review of the Failure Mechanism and Methodologies of IGBT Bonding Wire. IEEE Trans. Compon. Packag. Manuf. Technol. 2023, 13, 1045–1057. [Google Scholar] [CrossRef]
  5. Ye, H.; Lin, M.; Basaran, C. Failure modes and FEM analysis of power electronic packaging. Finite Elem. Anal. Des. 2002, 38, 601–612. [Google Scholar] [CrossRef]
  6. Otiaba, K.C.; Bhatti, R.; Ekere, N.; Mallik, S.; Ekpu, M. Finite element analysis of the effect of silver content for Sn–Ag–Cu alloy compositions on thermal cycling reliability of solder die attach. Eng. Fail. Anal. 2013, 28, 192–207. [Google Scholar] [CrossRef]
  7. Celaya, J.R.; Saxena, A.; Saha, S.; Goebel, K.F. Prognostics of power MOSFETs under thermal stress accelerated aging using data-driven and model-based methodologies. Annu. Conf. PHM Soc. 2011, 3, 1. [Google Scholar] [CrossRef]
  8. Naghibi, J.; Mehran, K.; Foster, M.P. An online failure assessment approach for SiC-based MOSFET power modules using iterative condition monitoring technique. In Proceedings of the 2020 IEEE 21st Workshop on Control and Modeling for Power Electronics (COMPEL), Aalborg, Denmark, 9–12 November 2020; pp. 1–5. [Google Scholar] [CrossRef]
  9. Entzminger, C.; Qiao, W.; Qu, L.; Hudgins, J.L. A high-accuracy, low-order thermal model of SiC MOSFET power modules extracted from finite element analysis via model order reduction. In Proceedings of the 2019 IEEE Energy Conversion Congress and Exposition (ECCE), Baltimore, MD, USA, 29 September–3 October 2019; pp. 4950–4954. [Google Scholar] [CrossRef]
  10. Zhao, J.; An, T.; Fang, C.; Bie, X.; Qin, F.; Chen, P.; Dai, Y. A Study on the Effect of Microstructure Evolution of the Aluminum Metallization Layer on Its Electrical Performance During Power Cycling. IEEE Trans. Power Electron. 2019, 34, 11036–11045. [Google Scholar] [CrossRef]
  11. Fukuda, Y.; Kohda, S.; Kitano, Y. A new aluminum pattern formation using substitution reaction of aluminum for polysilicon and its application to MOS device fabrication. IEEE Trans. Electron Devices 1984, 31, 828–832. [Google Scholar] [CrossRef]
  12. Singh, M.; Ramasubramanian, L.N.; Singh, R.N. Influence of processing conditions on the titanium–aluminum contact metallization on a silicon wafer for thermal management. J. Vac. Sci. Technol. B 2023, 41, 4. [Google Scholar] [CrossRef]
  13. Pfost, M.; Boianceanu, C.; Lascau, I.; Simon, D.-I.; Sosin, S. Measurement and investigation of thermal properties of the on-chip metallization for integrated power technologies. In Proceedings of the 2013 IEEE International Conference on Microelectronic Test Structures (ICMTS), Osaka, Japan, 25–28 March 2013; pp. 121–126. [Google Scholar]
  14. Ackaert, J.; Colpaert, T.; Malik, A.; Gonzalez, M. Metallization scheme optimization of plastic-encapsulated electronic power devices. In Proceedings of the 2015 International Conference on IC Design & Technology (ICICDT), Leuven, Belgium, 1–3 June 2015; pp. 1–4. [Google Scholar] [CrossRef]
  15. Kawashiro, F.; Takao, K.; Kobayashi, T.; Yoshikawa, M.; Miyake, E.; Endo, Y.; Tonedachi, T.; Nishikawa, H. Effect of copper over-pad metallization on reliability of aluminum wire bonds. Microelectron. Reliab. 2019, 99, 168–176. [Google Scholar] [CrossRef]
  16. Broll, M.S.; Geissler, U.; Höfer, J.; Schmitz, S.; Wittler, O.; Lang, K.D. Microstructural evolution of ultrasonic-bonded aluminum wires. Microelectron. Reliab. 2015, 55, 961–968. [Google Scholar] [CrossRef]
  17. Cioban, R.; Szöke, S.; Kórádi, Z.; Zaharie, B.D.; Leordean, C. Validated Model Calibration for Simulation Aided Thermal Design. In Proceedings of the 2020 36th Semiconductor Thermal Measurement, Modeling & Management Symposium (SEMI-THERM), San Jose, CA, USA, 16–20 March 2020; pp. 114–123. [Google Scholar] [CrossRef]
  18. Choi, N.-Y.; Zhang, S.-U. Numerical Evaluation of Thermal Resistance for Power MOSFET Packaged in Hermetic Method. J. Electr. Eng. Technol. 2022, 17, 1915–1920. [Google Scholar] [CrossRef]
  19. Choi, N.-Y.; Zhang, S.-U. Numerical Evaluation of P-Channel MOSFETs Depending on the TID Effect Using Electric-Thermal Analysis. In Proceedings of the 2024 25th International Conference on Thermal, Mechanical and Multi-Physics Simulation and Experiments in Microelectronics and Microsystems (EuroSimE), Catania, Italy, 7–10 April 2024. [Google Scholar]
  20. Nam, S.; Zhang, S.-U. Comparative Thermo-electric Analysis of Void and Wire Diameter Variation for Two Packages TO-251 and TO-252 Using Die-attach Sintered Ag. Trans. Korean Inst. Electr. Eng. 2024, 73, 1344–1350. [Google Scholar] [CrossRef]
  21. Choi, N.; Zhang, S.-U. Numerical Analysis of Cu Clip and Al Wire Bonding for MOSFET Packaging. Trans. Korean Inst. Electr. Eng. 2024, 73, 320–326. [Google Scholar] [CrossRef]
  22. Choi, N.; Zhang, S.-U. Numerical Study of GaN HEMT Devices with Variations in Wire Bonding and Die Bonding Using Finite Element Analysis. Trans. Korean Inst. Electr. Eng. 2024, 73, 1351–1359. [Google Scholar] [CrossRef]
  23. Swan, I.R.; Bryant, A.T.; Parker-Allotey, N.A.; Mawby, P.A. 3-D Thermal Simulation of Power Module Packaging. In Proceedings of the 2009 IEEE Energy Conversion Congress and Exposition (ECCE), San Jose, CA, USA, 20–24 September 2009; pp. 1247–1254. [Google Scholar] [CrossRef]
  24. Zhao, X.; Xu, Y.; Hopkins, D.C. Advanced Multi-Physics Simulation for High-Performance Power Electronic Packaging Design. In Proceedings of the 2016 International Symposium on 3D Power Electronics Integration and Manufacturing (3D-PEIM), Raleigh, NC, USA, 13–15 June 2016; IEEE: Piscataway, NJ, USA, 2016. [Google Scholar]
  25. Inyushkin, A.V. Thermal Conductivity of Group IV Elemental Semiconductors. J. Appl. Phys. 2023, 134, 221102. [Google Scholar] [CrossRef]
  26. Zhang, A.; Li, Y. Thermal Conductivity of Aluminum Alloys—A Review. Materials 2023, 16, 2972. [Google Scholar] [CrossRef]
  27. Ma, L.; Chen, H. Failure Analysis and Case Study of Wire Bonding. In Proceedings of the 2018 19th International Conference on Electronic Packaging Technology (ICEPT), Shanghai, China, 8–11 August 2018; IEEE: Piscataway, NJ, USA, 2018. [Google Scholar]
  28. Vath, C.J.; Holliday, R. Bonding Wire Options and Their Impact on Product Reliability. In Proceedings of the 2011 IEEE 13th Electronics Packaging Technology Conference, Singapore, 7–9 December 2011; IEEE: Piscataway, NJ, USA, 2011. [Google Scholar]
  29. Chen, L.; Liu, Y. Modeling and Optimization of Mechanical Performance for Cu Wire Bonding Process. In Proceedings of the 2023 IEEE 73rd Electronic Components and Technology Conference (ECTC), Orlando, FL, USA, 30 May–2 June 2023; IEEE: Piscataway, NJ, USA, 2023. [Google Scholar]
  30. Unger, A.; Hunstig, M.; Meyer, T.; Brökelmann, M.; Sextro, W. Intelligent Production of Wire Bonds Using Multi-Objective Optimization—Insights, Opportunities and Challenges. In Proceedings of the International Symposium on Microelectronics, Pasadena, CA, USA, 8–11 October 2018; Volume 1, pp. 000572–000577. [Google Scholar]
  31. Dornic, N.; Ibrahim, A.; Khatir, Z.; Degrenne, N.; Mollov, S.; Ingrosso, D. Analysis of the Aging Mechanism Occurring at the Bond-Wire Contact of IGBT Power Devices During Power Cycling. Microelectron. Reliab. 2020, 114, 113873. [Google Scholar] [CrossRef]
  32. England, L.; Jiang, T. Reliability of Cu Wire Bonding to Al Metallization. In Proceedings of the 2007 57th Electronic Components and Technology Conference, Sparks, NV, USA, 29 May–1 June 2007; pp. 1604–1613. [Google Scholar] [CrossRef]
  33. Ruffilli, R.; Berkani, M.; Dupuy, P.; Lefebvre, S.; Weber, Y.; Warot-Fonrose, B.; Marcelot, C.; Legros, M. Aluminum Metallization and Wire Bonding Aging in Power MOSFET Modules. Mater. Today Proc. 2018, 5, 14641–14651. [Google Scholar] [CrossRef]
  34. Chen, Y.; Fu, Y.; Cheng, X.; Wu, T.X.; Shen, Z.J. Modeling and Analysis of Metal Interconnect Resistance of Power ICs. In Proceedings of the 19th International Symposium on Power Semiconductor Devices and ICs (ISPSD), Jeju, Republic of Korea, 27–31 May 2007; pp. 253–256. [Google Scholar] [CrossRef]
  35. Kovacevic-Badstuebner, I.; Race, S.; Luethi, N.; Nagel, M.; Grossner, U. Fail-to-Open Short Circuit Failure Mode of SiC Power MOSFETs: 2-D Thermo-Mechanical Modeling. Solid State Phenom. 2024, 358, 121–126. [Google Scholar] [CrossRef]
  36. Mack, S.; Ourinson, D.; Meßmer, M.; Teßmann, C.; Krieg, K.; Benick, J.; Huyeng, J.D.; Greulich, J.; Wolf, A. Approaches for Reducing Metallization-Induced Losses and Cost in Industrial TOPCon Solar Cells. EPJ Photovoltaics 2025, 16, 5. [Google Scholar] [CrossRef]
  37. Losbichler, D.; Klingler, M.; Orso, S.; Wunderle, B. Lifetime Modeling of Copper Metallization for SiC Power Electronics. In Proceedings of the 2023 24th International Conference on Thermal, Mechanical and Multi-Physics Simulation and Experiments in Microelectronics and Microsystems (EuroSimE), Graz, Austria, 16–19 April 2023; pp. 1–9. [Google Scholar] [CrossRef]
  38. Ruffilli, R. Fatigue Mechanisms in Al-Based Metallizations in Power MOSFETs. Ph.D. Thesis, Université Paul Sabatier-Toulouse III, Toulouse, France, 2017. [Google Scholar]
  39. Garosshen, T.J.; Stephenson, T.A.; Slavin, T.P. Aluminum Metallization Technology for Semiconductor Devices. JOM 1985, 37, 55–59. [Google Scholar] [CrossRef]
  40. Pietranico, S.; Lefebvre, S.; Pommier, S.; Berkani Bouaroudj, M.; Bontemps, S. A Study of the Effect of Degradation of the Aluminium Metallization Layer in the Case of Power Semiconductor Devices. Microelectron. Reliab. 2011, 51, 1824–1829. [Google Scholar] [CrossRef]
  41. Dupont, L.; Khatir, Z.; Lefebvre, S.; Bontemps, S. Effects of Metallization Thickness of Ceramic Substrates on the Reliability of Power Assemblies under High Temperature Cycling. Microelectron. Reliab. 2006, 46, 1766–1771. [Google Scholar] [CrossRef]
Figure 1. SEM images of metallization layer.
Energies 18 02457 g001
Figure 2. Workflow schematic of the simulation and optimization process.
Energies 18 02457 g002
Figure 3. Three-dimensional CAD model.
Energies 18 02457 g003
Figure 4. Decapsulation image and 3D modeling of interconnection.
Energies 18 02457 g004
Figure 5. Curve tracer and measurement station.
Energies 18 02457 g005
Figure 6. I–V curve (VGS = 10 V) and IR image.
Energies 18 02457 g006
Figure 7. Cross-sectional structure of N-Channel MOSFET.
Energies 18 02457 g007
Figure 8. Boundary conditions and calibration workflow for electro-thermal analysis of integrated vs. individual Al metallization layer modeling.
Energies 18 02457 g008
Figure 9. Current and thermal distribution on the chip surface for individual and integrated Al metallization layer.
Energies 18 02457 g009
Figure 10. Kernel density estimation of current density and temperature on chip surface individual and integrated Al metallization layer.
Energies 18 02457 g010
Figure 11. Temperature distribution comparison integrated and individual Al metallization layer along defined loops (IR image and simulation path).
Energies 18 02457 g011
Figure 12. Comparison of temperature distributions between integrated and individual Al metallization layers, including measured values from the IR camera.
Energies 18 02457 g012
Figure 13. Variance analysis of maximum TJ and VDS/IDS for integrated and individual Al metallization layer.
Energies 18 02457 g013
Figure 14. The design of the divided/undivided metallization layer.
Energies 18 02457 g014
Figure 15. Boundary conditions for electrical–thermal–structural multiphysics analysis of optimized metallization layer and bonding wire designs.
Energies 18 02457 g015
Figure 16. Distribution of current density, temperature, strain, and stress in divided vs. undivided source metallization layers.
Energies 18 02457 g016
Figure 17. Main effect analysis of factors on VDS/IDS, maximum TJ, maximum von Mises stress, and maximum strain.
Energies 18 02457 g017
Figure 18. Pareto analysis of metallization layer and bonding wire factors on electrical, thermal, and mechanical responses.
Energies 18 02457 g018
Figure 19. Response optimization graph for metallization and bonding wire factors based on DOE analysis.
Energies 18 02457 g019
Table 1. Specification of a DUT.
TypeSi N-MOSFET
Part numberR6030JNZ4
specification0.143 ohm, 600 V, ±30 A, 370 W
Package typeTO-247G
Table 2. Material properties.
ComponentMaterialIsotropic Electrical Resistivity [ohm·m]Thermal Conductivity [W/m·K]
EncapsulationEMC1 × 10133
WireAluminum2.22 × 10−7317
SolderAuSn1.64 × 10−757
Metallization layerAl-Si-Cu1.88 × 10−7265
Lead FrameCu1.71 × 10−8401
Table 3. Comparison of equivalent electrical and thermal characteristics of integrated and individual Al metallization layers.
Modeling of Al Metallization Layer in Dummy Chip
Integrated Modeling (With)Individual Modeling (Without)
Calculated Input ParameterCalculated equivalent resistivity of chip [ohm·mm]2.53369.296
Calculated equivalent thermal conductivity of chip [W/m·K]245012.5
VDS/IDS [V/A]0.5720.587
Output ValueMaximum TJ31.33233.84
Power Dissipation [W]15.5223416.152
Thermal Resistance0.410.57
Table 4. DOE factors and levels for optimization design of metallization layer and bonding wire.
FactorLevel
Section of source metallization layerUndivided, divided (2 levels)
Metallization layer thickness4 µm, 10 µm, 16 µm, 22 µm (4 levels)
Metallization layer materialAl-Si-Cu, Cu (2 levels)
Bonding wire materialAl, Cu (2 levels)
Disclaimer/Publisher’s Note: The statements, opinions and data contained in all publications are solely those of the individual author(s) and contributor(s) and not of MDPI and/or the editor(s). MDPI and/or the editor(s) disclaim responsibility for any injury to people or property resulting from any ideas, methods, instructions or products referred to in the content.

