Article

Economy or Climate? Impact of Policy Uncertainty on Price Volatility of China’s Carbon Emission Trading Markets

1
Economic & Technology Research Institute, State Grid Shandong Electric Power Company, Jinan 250021, China
2
State Grid Jinan Power Supply Company, Jinan 250001, China
3
CEC Technical & Economic Consulting Center of Power Construction, Electric Power Development Research Institute Co., Ltd., Beijing 100053, China
4
School of Economics and Management, North China Electric Power University, Beijing 102206, China
*
Author to whom correspondence should be addressed.
Energies 2025, 18(10), 2448; https://doi.org/10.3390/en18102448
Submission received: 3 April 2025 / Revised: 7 May 2025 / Accepted: 8 May 2025 / Published: 10 May 2025

Abstract

:
Based on the economic and climate policy uncertainty index and the price data of major carbon emission trading markets from May 2014 to August 2023, this paper uses the generalized autoregressive conditional heteroskedasticity and mixing data sampling (GARCH-MIDAS) model to analyze the impact of policy uncertainty on carbon market price volatility. The results indicate the following: (1) The price volatility in the Hubei carbon market is influenced by both economic and climate policy uncertainties, while the Guangdong market is only affected by climate policy uncertainty, and the Shenzhen carbon market is only affected by economic policy uncertainty. (2) Before the establishment of the national carbon market, the carbon market prices in Hubei were impacted by both policy uncertainties, while Guangdong and Shenzhen carbon markets were only affected by climate policy uncertainties. (3) On the contrary, after the establishment of the national carbon market, only the Shenzhen carbon market was affected by both policy uncertainties, and the price volatility in the Guangdong and Hubei carbon markets was not affected by policy uncertainties. The above research conclusions are helpful for regulatory agencies and policymakers to assess the future direction of the pilot carbon market and provide an empirical basis for preventing and resolving policy risks. At the same time, the proposed GARCH-MIDAS model effectively solves the inconsistent frequency problem of policy uncertainty and carbon price volatility, providing a new perspective for the study of factors affecting carbon market volatility.

1. Introduction

As a result of the overuse and exploitation of fossil fuels, global greenhouse gas (GHG) concentrations are still rising, and the climate change issue is getting worse [1]. At the 26th Conference of the Parties to the United Nations Framework Convention on Climate Change (UNFCCC), UN Secretary-General António Guterres pointed out that climate change is a fundamental issue and a common challenge faced by all humankind. As a participant, contributor, and leader in the global ecological civilization construction, China has long been dedicated to boosting green, circular, and low-carbon development. At the general debate of the 75th session of the General Assembly in 2020, China formally articulated the “carbon peaking and carbon neutrality” goals, which align with China’s global responsibility in advancing the construction of a community with a shared future for humankind [2]. Distinct from conventional administrative regulation, the establishment of a carbon emission trading market (CETM) capitalizes on market-driven mechanisms to incentivize greenhouse gas mitigation, exhibiting superior cost-effectiveness and operational sustainability [3]. In the report to the 20th National Congress of the Communist Party of China (CPC), the construction of CETM was explicitly prioritized as the main task of China’s carbon neutrality roadmap. Since its initial conceptualization in 2010, China’s CETM has undergone a phased developmental process (from regional pilot to unification). In December 2017, the national CETM was officially established, which shows strong significance for reducing market transaction costs, promoting efficient and smooth market operations, and expanding the scale of the market [4]. Figure 1 shows the different stages of China’s carbon market development.
There is an intricate interplay between financial markets and macroeconomic policies [5]. On the one hand, exogenous policy shocks will to some extent affect investor sentiment and market expectation, thereby inducing price volatility. On the other hand, price volatility provides feedback mechanisms for policy calibration, which can guide the formulation of future policies. The genesis of policy uncertainty stems from the inherent unpredictability, informational opacity, and regulatory ambiguity embedded in policymaking processes [6]. Currently, scholars have conducted certain research on policy uncertainty and financial market price volatility, and the extant literature mainly focuses on the fields of stocks, futures, and digital currencies [7,8,9].
Given the unique characteristics of scarcity, assetization, tradability, and value preservation, CETM manifests pronounced financial attributes [10]. As an emerging financial market, the price of CETM is not only influenced by internal market entities and other external markets [11,12], but also to some extent by macroeconomic policies [13]. Due to the late start of China’s CETM, existing research mainly focused on the European Union emission trading system (EU ETS), analyzing the impact of policy uncertainty on EU ETS price volatility [14,15]. However, structural divergences in participating entities and industrial coverage led to significant differences in the price trends and fluctuations between China’s CETMs and the EU ETS. Hence, the conclusions of the above research on EU TS are inapplicable to the development of China’s carbon market. In recent years, China-focused studies have begun addressing the aforementioned problems. Wang et al. [16] proposed a wavelet-based quantile regression model to quantify EPU effects on Shenzhen’s CETM price volatility. Lu et al. [17] adopted a multiregime framework incorporating cross-country EPU indices (China, U.S., and global) to dissect heterogeneous policy impacts in Guangdong’s CETM. At the sectoral level, Li et al. [18] analyzed the impact of different EPU subtypes (trade, currency, and exchange rate) on the price volatility of China’s CETMs. However, the above research focuses on the impact of EPU on the CETMs, overlooking CPU as a distinct driver during energy transition pathways [19]. So far, existing studies have proved the effects of CPU on energy and stock markets, while paying less attention to CETMs [20,21]. Figure 2 shows the current studies on policy uncertainty and financial markets.
Moreover, the establishment of the national CETM represents a major mechanism of innovation in China’s climate governance. However, existing research mainly focuses on the price mechanism and economic environment impact of the national CETM, with a particular emphasis on the interaction with other energy and financial markets before and after the establishment of the national CETM [22,23]. There is a gap in the impact of policy uncertainty on local CETM price volatility before and after the establishment of the national CETM.
From the perspective of methodologies, the generalized autoregressive conditional heteroskedasticity (GARCH) model has been widely used in characterizing the volatility of different financial markets. However, most of the policy uncertainty indices constructed are monthly or annual data, which exhibit different frequency phenomena compared to CETM price data with a daily time scale. To this end, some scholars have attempted to downshift high-frequency daily data and measure the volatility of market prices in the current month using the monthly standard deviation of daily returns. However, such processing methods often lead to issues such as missing data information and inaccurate estimation results.
To address the above issues, this paper employs a generalized autoregressive conditional heteroskedasticity model and a mixed-frequency data sampling method (GARCH-MIDAS) framework to analyze the impact of policy uncertainty on price volatility in China’s CETMs. Specifically, two types of uncertainty factors (EPU and CPU) and three CETMs (Hubei, Guangdong, and Shenzhen) are considered in this paper. Our research makes three substantive contributions:
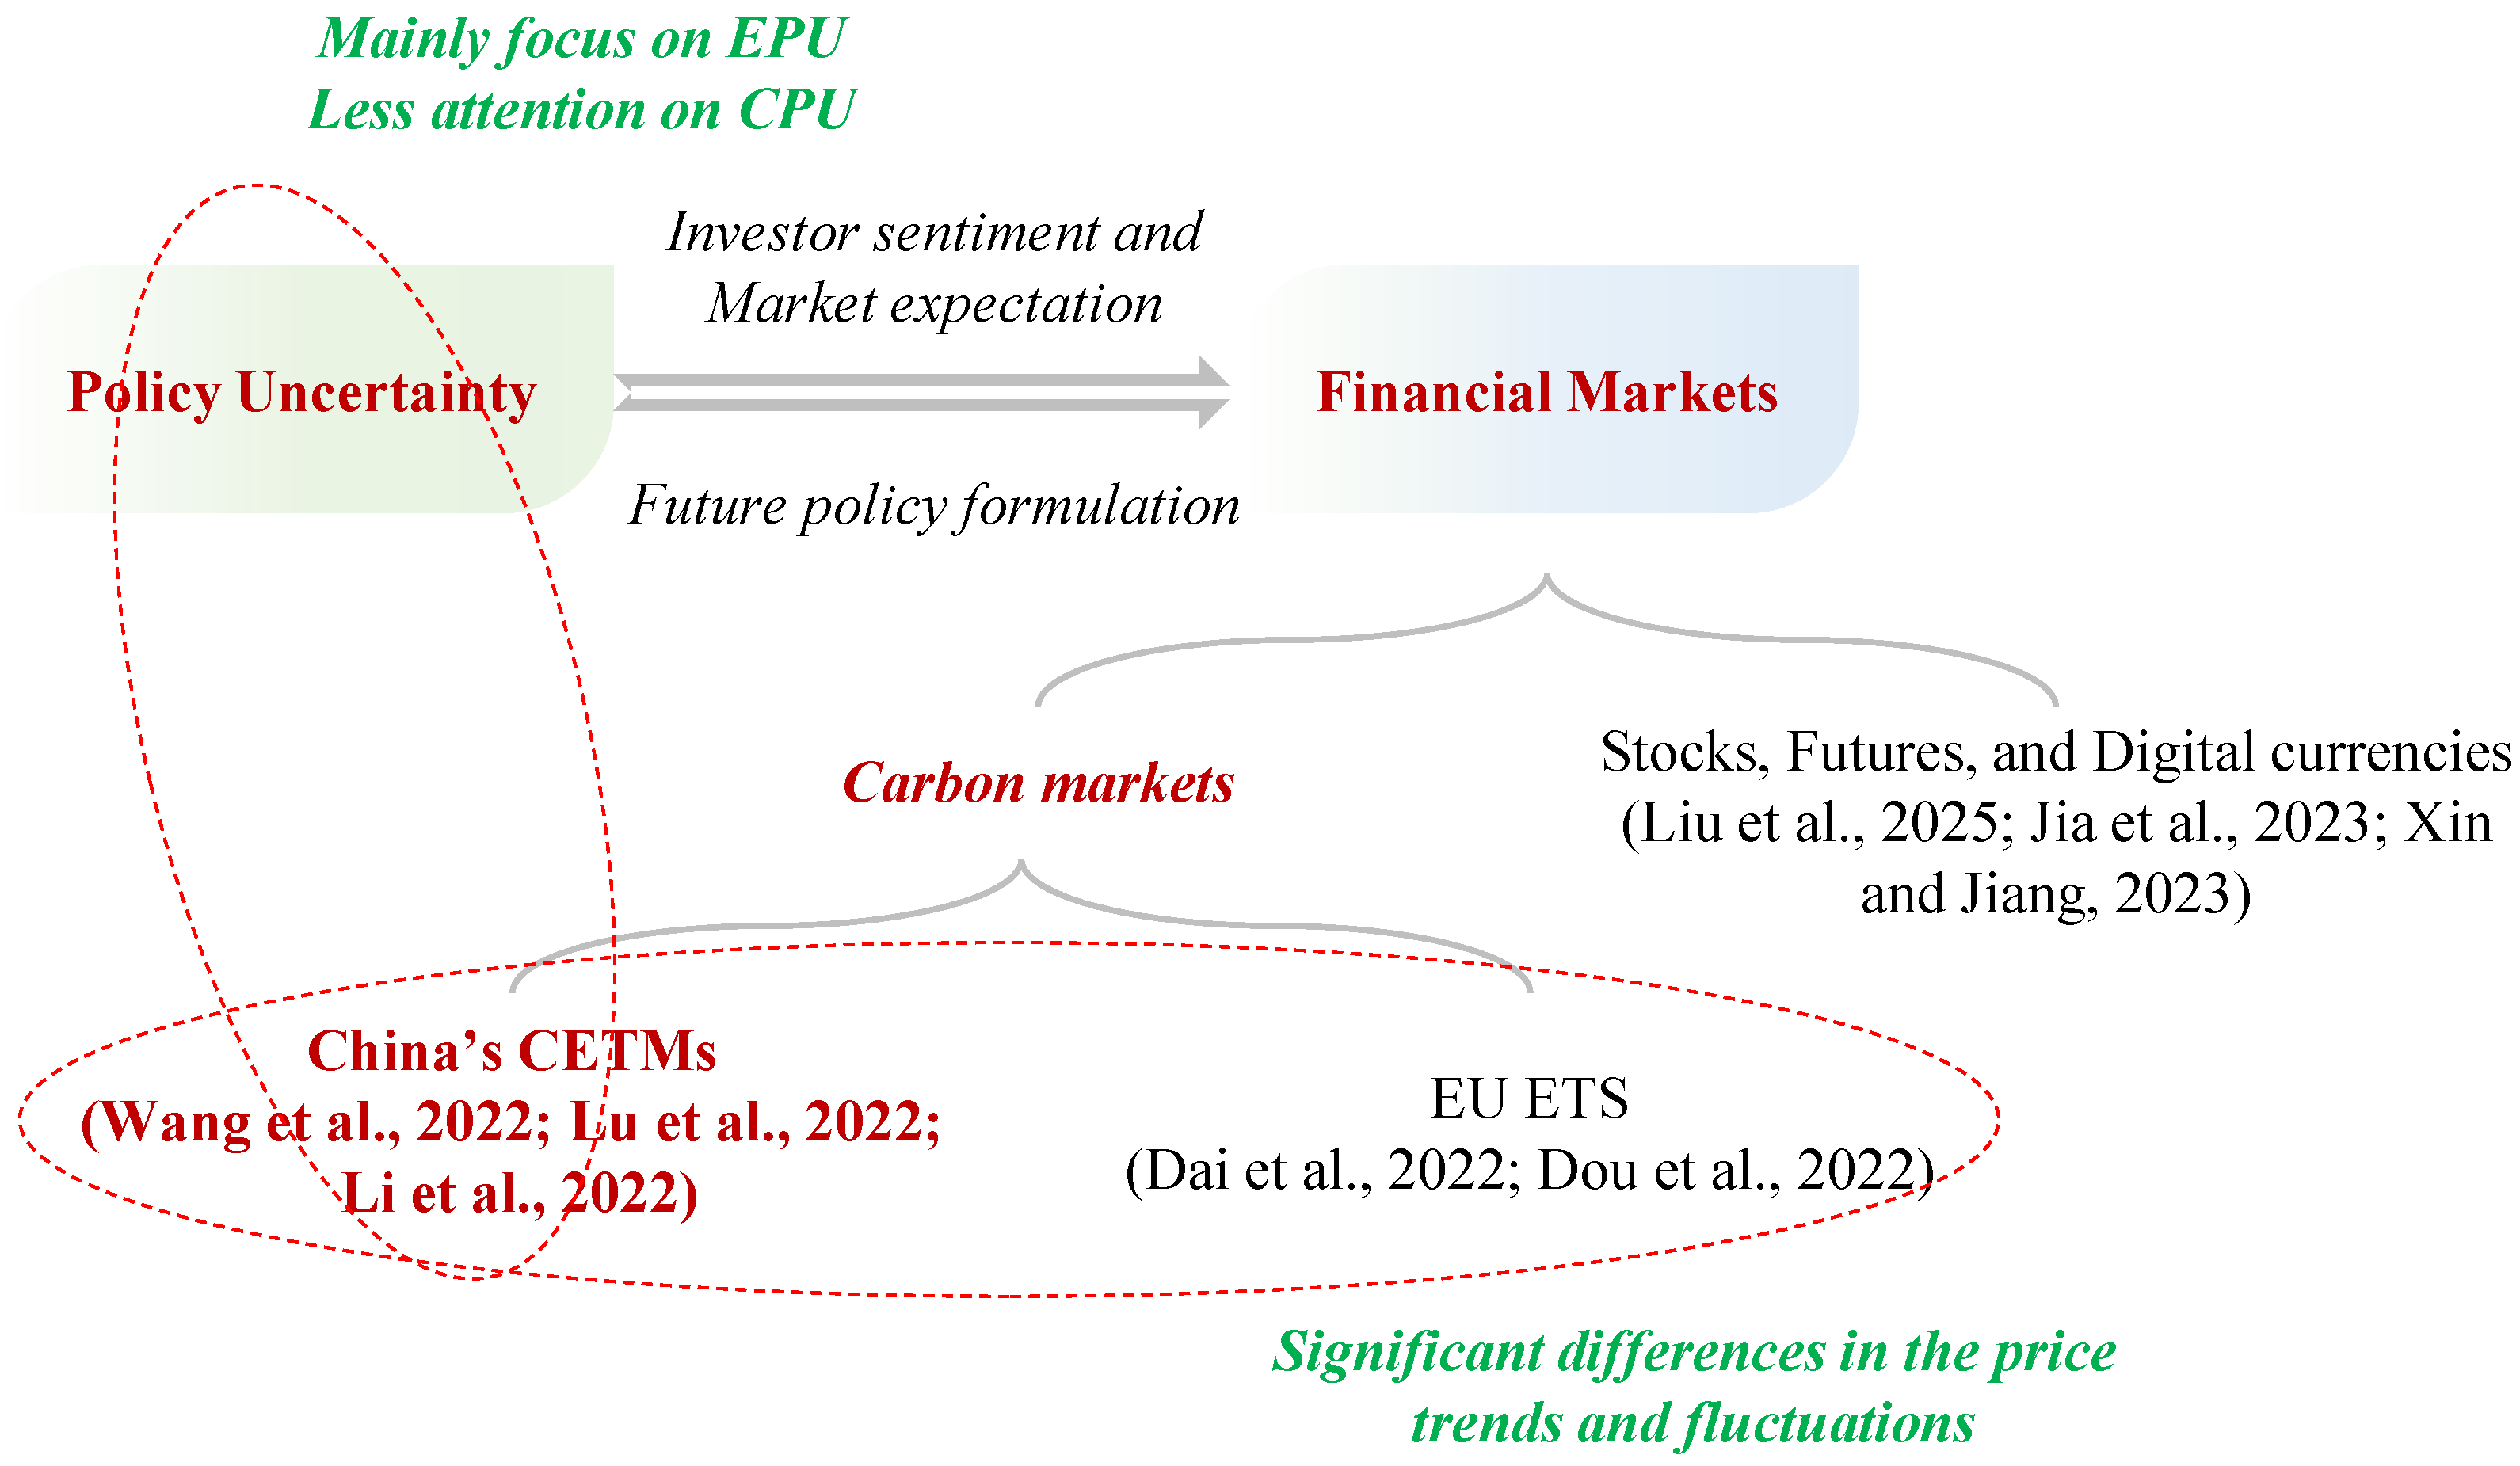
  • We innovatively incorporated the CPU to study the influencing factors of CETM price volatility, which breaks through the limitations of existing research that mainly focuses on EPU.
  • We proposed the GARCH-MIDAS model to process mixed-frequency data, which compensates for the shortcomings of previous research on simple processing methods for high-frequency data.
  • We conducted a phase-comparative analysis on the heterogeneous impact of policy uncertainty on CETM price volatility, which can reflect the role of establishment for the national CETM.
The paper is organized as follows: The introduction part is in Section 1, and Section 2 elaborates on the methodology and data sources. Then, the empirical analysis is introduced in Section 3, and the conclusions are given in Section 4.

2. Methodology and Data Sources

2.1. GARCH-MIDAS Model

In 2013, the MIDAS model proposed by Engle et al. was able to directly model mixed-frequency data [24], which performed better than dynamic averaging models and other traditional volatility measurement methods. The basic steps of GARCH-MIDAS are as follows:
Step 1: Conversion of the raw carbon price data into return data.
To satisfy the stationarity requirements of the GARCH model, non-stationary carbon price series are transformed into stable returns through logarithmic difference, as shown in Equation (1):
r i = ( ln P i ln P i 1 ) × 100
where r i represents the return of the CETM on i -th day, and P represents the original price.
Step 2: Volatility component decomposition.
Following Nelson’s volatility clustering framework, the return data can be further decomposed into short-term transitory shocks and long-term persistent components, as shown in Equation (2):
r i , t = μ + τ t × g i , t ε i , t i = 1 , 2 , , N t
where r i , t represents the return of the CETM on i -th day of t -th month, and μ represents the unconditional mean (this means that ε i , t follows a non-normal distribution under the condition of Φ i 1 , t ). Φ i 1 , t represents the information set on the i 1 -th day of the t -th month, which satisfies E ( r i 1 , t ) = μ ; ε i , t Φ i 1 , t N ( 0 , 1 ) .
Step 3: Short-term volatility estimation. Short-term volatility can be expressed as follows:
g i , t = ( 1 α β ) + α × r i , t E ( r i 1 , t ) 2 τ t + β × g i 1 , t
where α and β represent the parameters to be estimated, which satisfy α > 0 , β > 0 , α + β < 1 .
Step 4: Long-term volatility estimation. Long-term volatility can be obtained by the realized volatility, as shown in Equation (4):
τ t = m + θ × k = 1 K φ k ( ω 1 , ω 2 ) × V t k V t = i = 1 N t r i , t 2
where K represents the maximum lag order of V t (set to 12 in this paper), θ represents the impact coefficient from V t on long-term volatility, and φ k ( ω 1 , ω 2 ) represents the beta weighting function, which can be expressed as follows:
φ k ( ω 1 , ω 2 ) = ( k / K ) ω 1 1 × ( 1 k / K ) ω 2 1 j = 1 K ( j / K ) ω 1 1 × ( 1 j / K ) ω 2 1
The impact of V t on long-term volatility under different lag orders should gradually weaken as the lag period continues. Hence, we set ω 1 to 1 and determine the weighting coefficient of V t according to ω 2 . Furthermore, the beta weighting function can be simplified as follows:
φ k ( ω 2 ) = ( 1 k / K ) ω 2 1 j = 1 K ( 1 j / K ) ω 2 1
The coefficients of the GARCH-MIDAS model can be estimated through the logarithmic likelihood function, shown as follows:
L L F = 1 2 t = 1 T log ( 2 π ) + log g t ( Φ ) τ t ( Φ ) + ( r t μ ) 2 g t ( Φ ) τ t ( Φ )
When estimating the impact of policy uncertainty on CETM price volatility, we only need to replace the realized volatility index mentioned earlier with the corresponding policy uncertainty index.

2.2. Data Sources

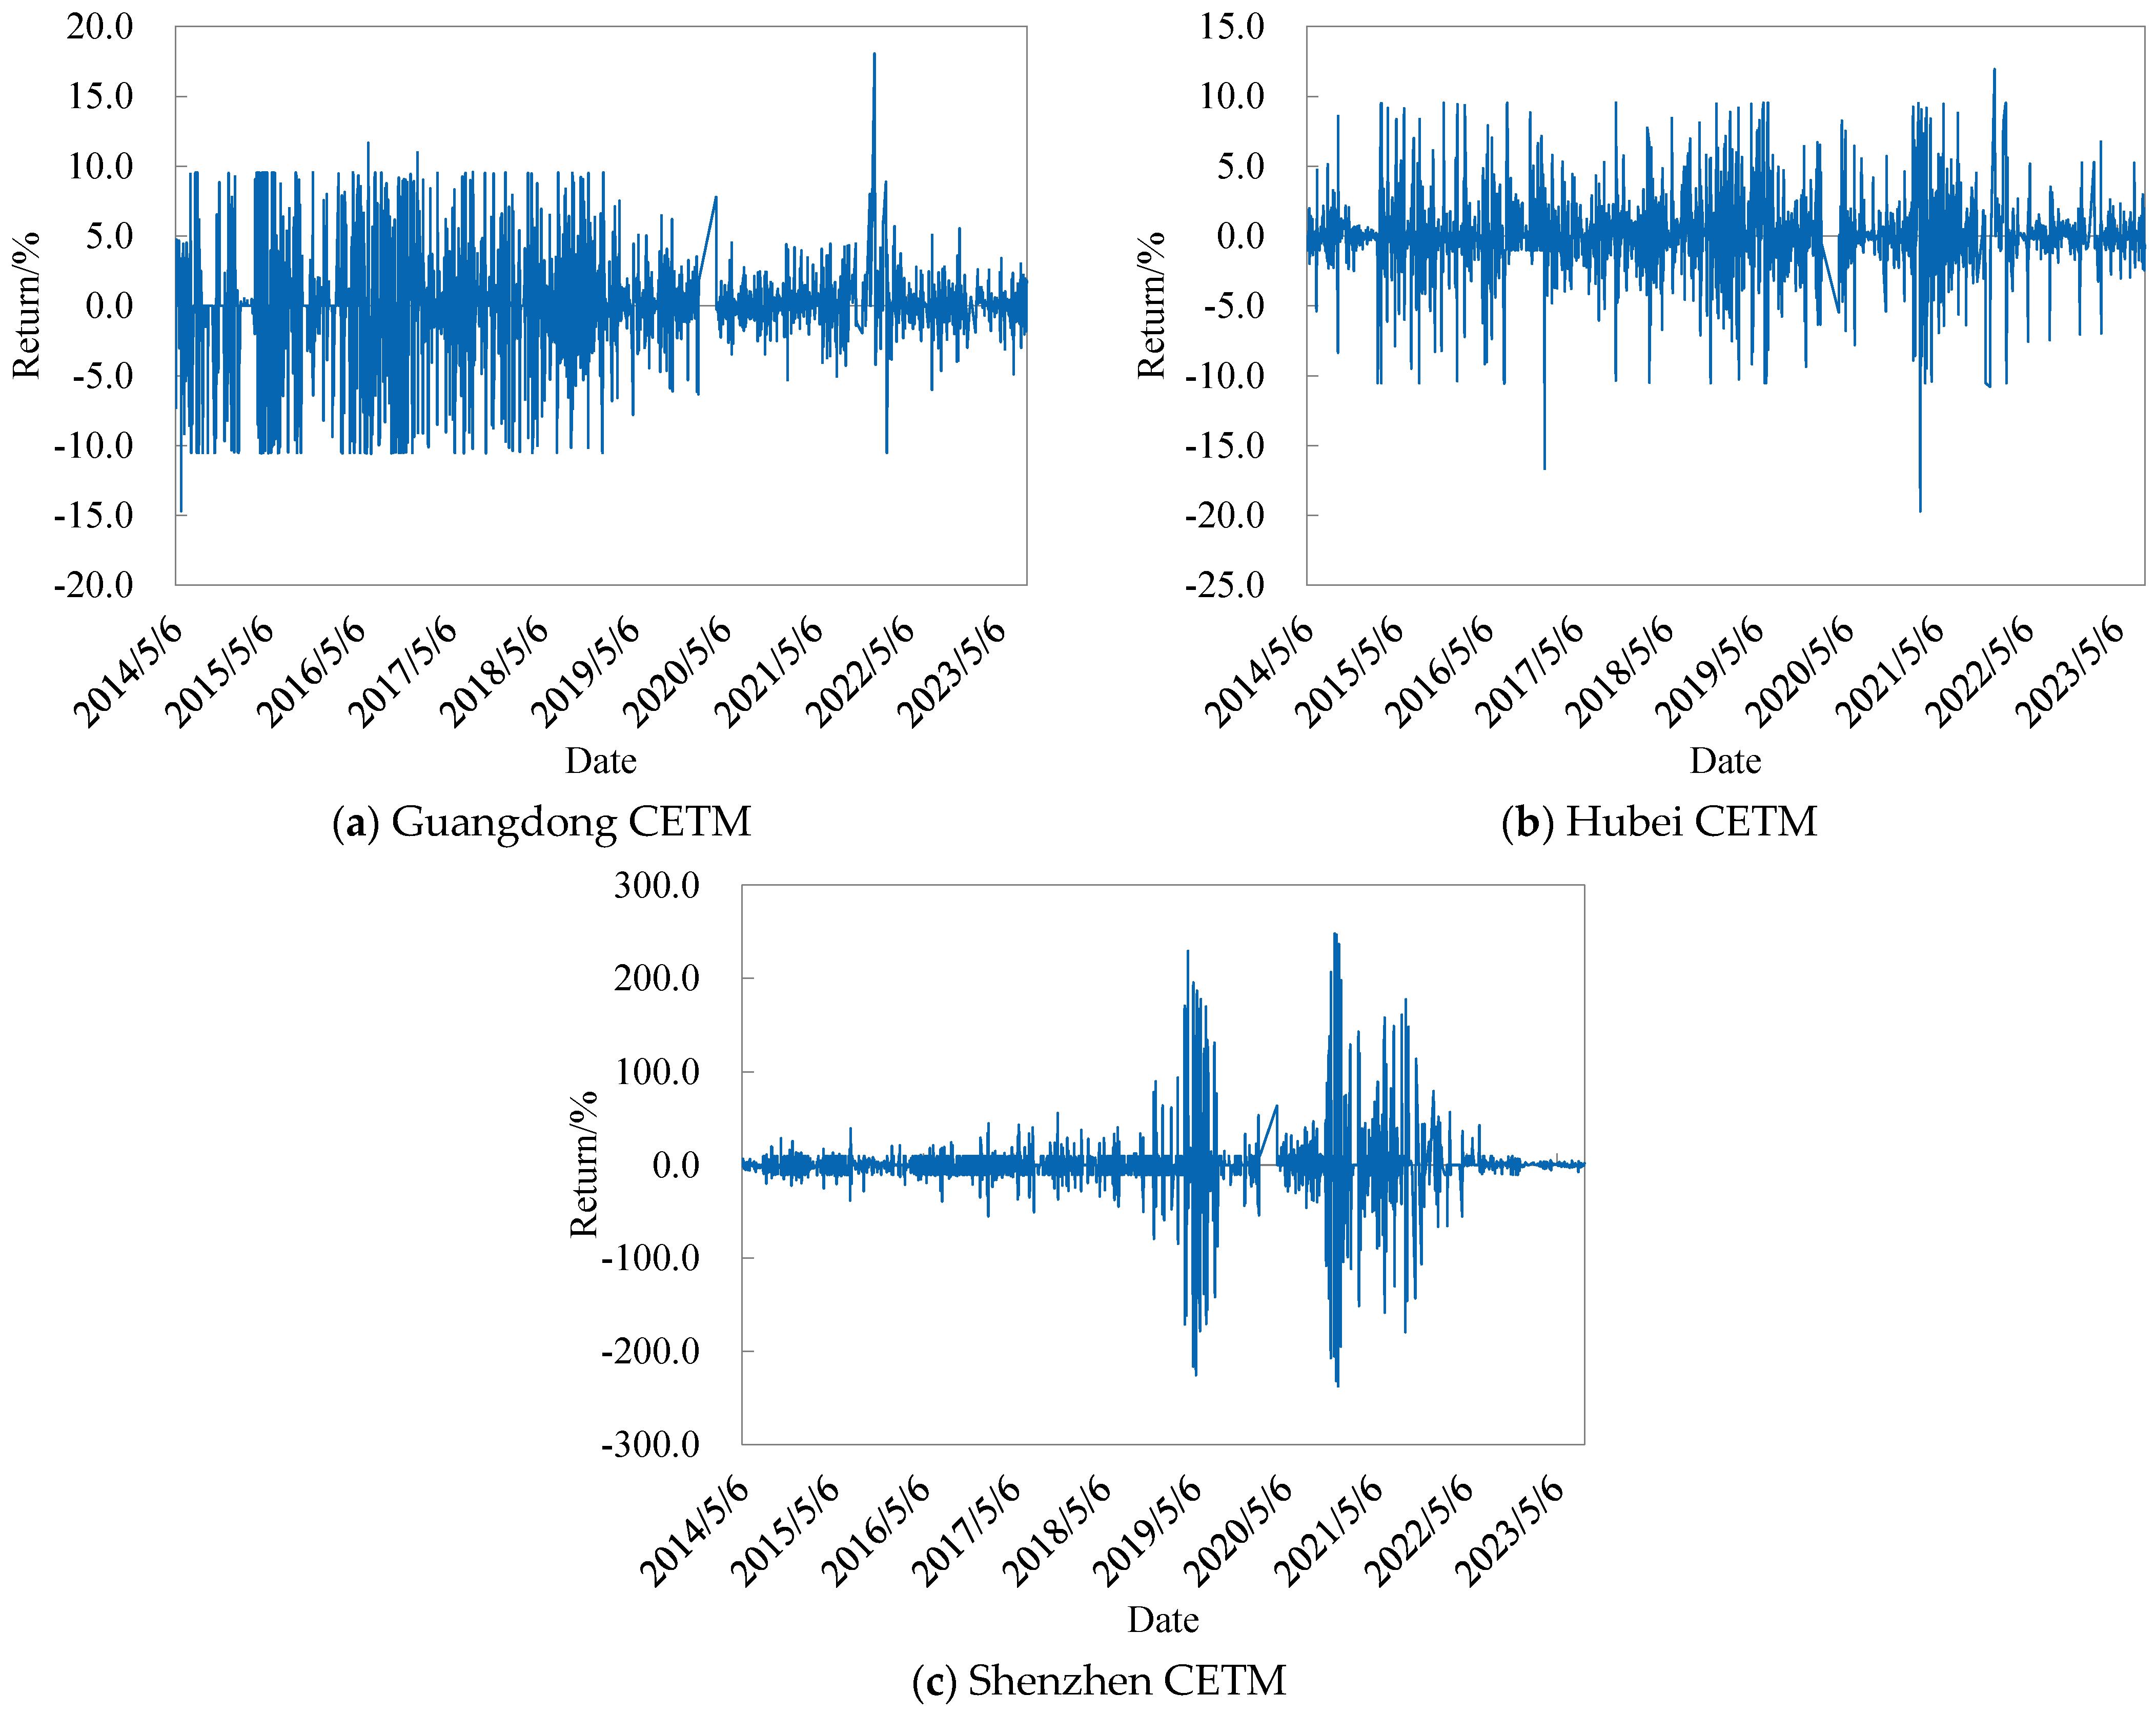
2.2.1. CETM Price Data

According to Wang et al. [25], the market efficiency and transaction activity of Shenzhen, Hubei, and Guangdong are higher than those of other CETMs. Hence, we mainly select the above three CETMs as the main research objects. Considering the differences in the opening dates of the three pilot CETMs (Guangdong: 19 December 2013; Hubei: 2 April 2014; Shenzhen: 18 June 2013), we mainly select the CETM closing price data from 5 May 2014 to 25 August 2023 for research to ensure data consistency. The data are sourced from the Wind database. Similarly, the time range for the EPU and CPU index is also selected from May 2014 to August 2023. According to Equation (1), the original carbon price data are converted into return data, as shown in Figure 3.
As shown in Figure 3, each CETM exhibits differentiated return characteristics. Although Guangdong is one of China’s largest pilot CETMs, the market showed significant price fluctuations in the early stages, dropping from CNY 60 to 80 at the beginning of 2014 to the lowest price of CNY 7.57 on 4 July 2016, and gradually recovering to over CNY 20 after 2019. As a key indicator reflecting the frequency of market transactions, the turnover rate (TR) can also be used to measure the trading liquidity of the CETM. According to the China Carbon Market Report 2014 (https://iea.blob.core.windows.net/assets/imports/events/11/21ZHONGQINGChinaCarbonMarketReport2014.pdf (accessed on 27 March 2025)), the monthly TR of the Hubei CETM remained between 0.1% and 0.3% during the same period, while the monthly TR of the Shenzhen CETM reached a maximum of 3.35%. In contrast, the persistent liquidity of Guangdong CETM was significantly low, with a daily turnover rate of less than 0.05%. Attributable to the Guangdong Carbon Allowance Allocation Plan 2019 (https://gdee.gd.gov.cn/attachment/0/378/378141/2675260.pdf (accessed on 27 March 2025)), the role of market supervision and constraint on emission control is fully exerted. Unlike the Guangdong CETM, the price of the Hubei CETM remained relatively stable throughout the entire statistical period, with the average volatility being significantly lower than that of the Guangdong CETM [26].
Unlike the previous two CETMs, the unique characteristics of the Shenzhen CETM have resulted in extremely unstable volatility. In the early construction, the Shenzhen CETM focused on referencing typical experiences brought by foreign markets and attracted a wide range of participants with low entry barriers and a high degree of marketization. However, the market instability has significantly increased with the overall increase in market size and foreign capital intervention [27]. Previous studies have shown a close connection between CETMs and energy markets, and the susceptibility of the Shenzhen carbon market to risk contagion will infinitely amplify this connection. In 2019, the problem of tight market supply caused a high-level oscillation in the coal market, which synchronously affected the return of the Shenzhen CETM. Then, affected by the insufficient production capacity after the recovery of the COVID-19 pandemic, the coal market prices soared in the first three quarters of 2021. However, in the fourth quarter, coal prices quickly plummeted, falling to 1100–1200 CNY/ton.
Furthermore, it is worth noting that in the first half of 2020 (especially in the first quarter), the price fluctuations in the three CETMs were relatively weak, and the situation did not change until the second half of the year. The reason for this is that, after being affected by COVID-19, all regions stopped production in succession, and some CETMs were intermittently closed. With the successive introduction of relevant government policies, key industries have resumed work and production, and the CETMs have returned to normal operation.

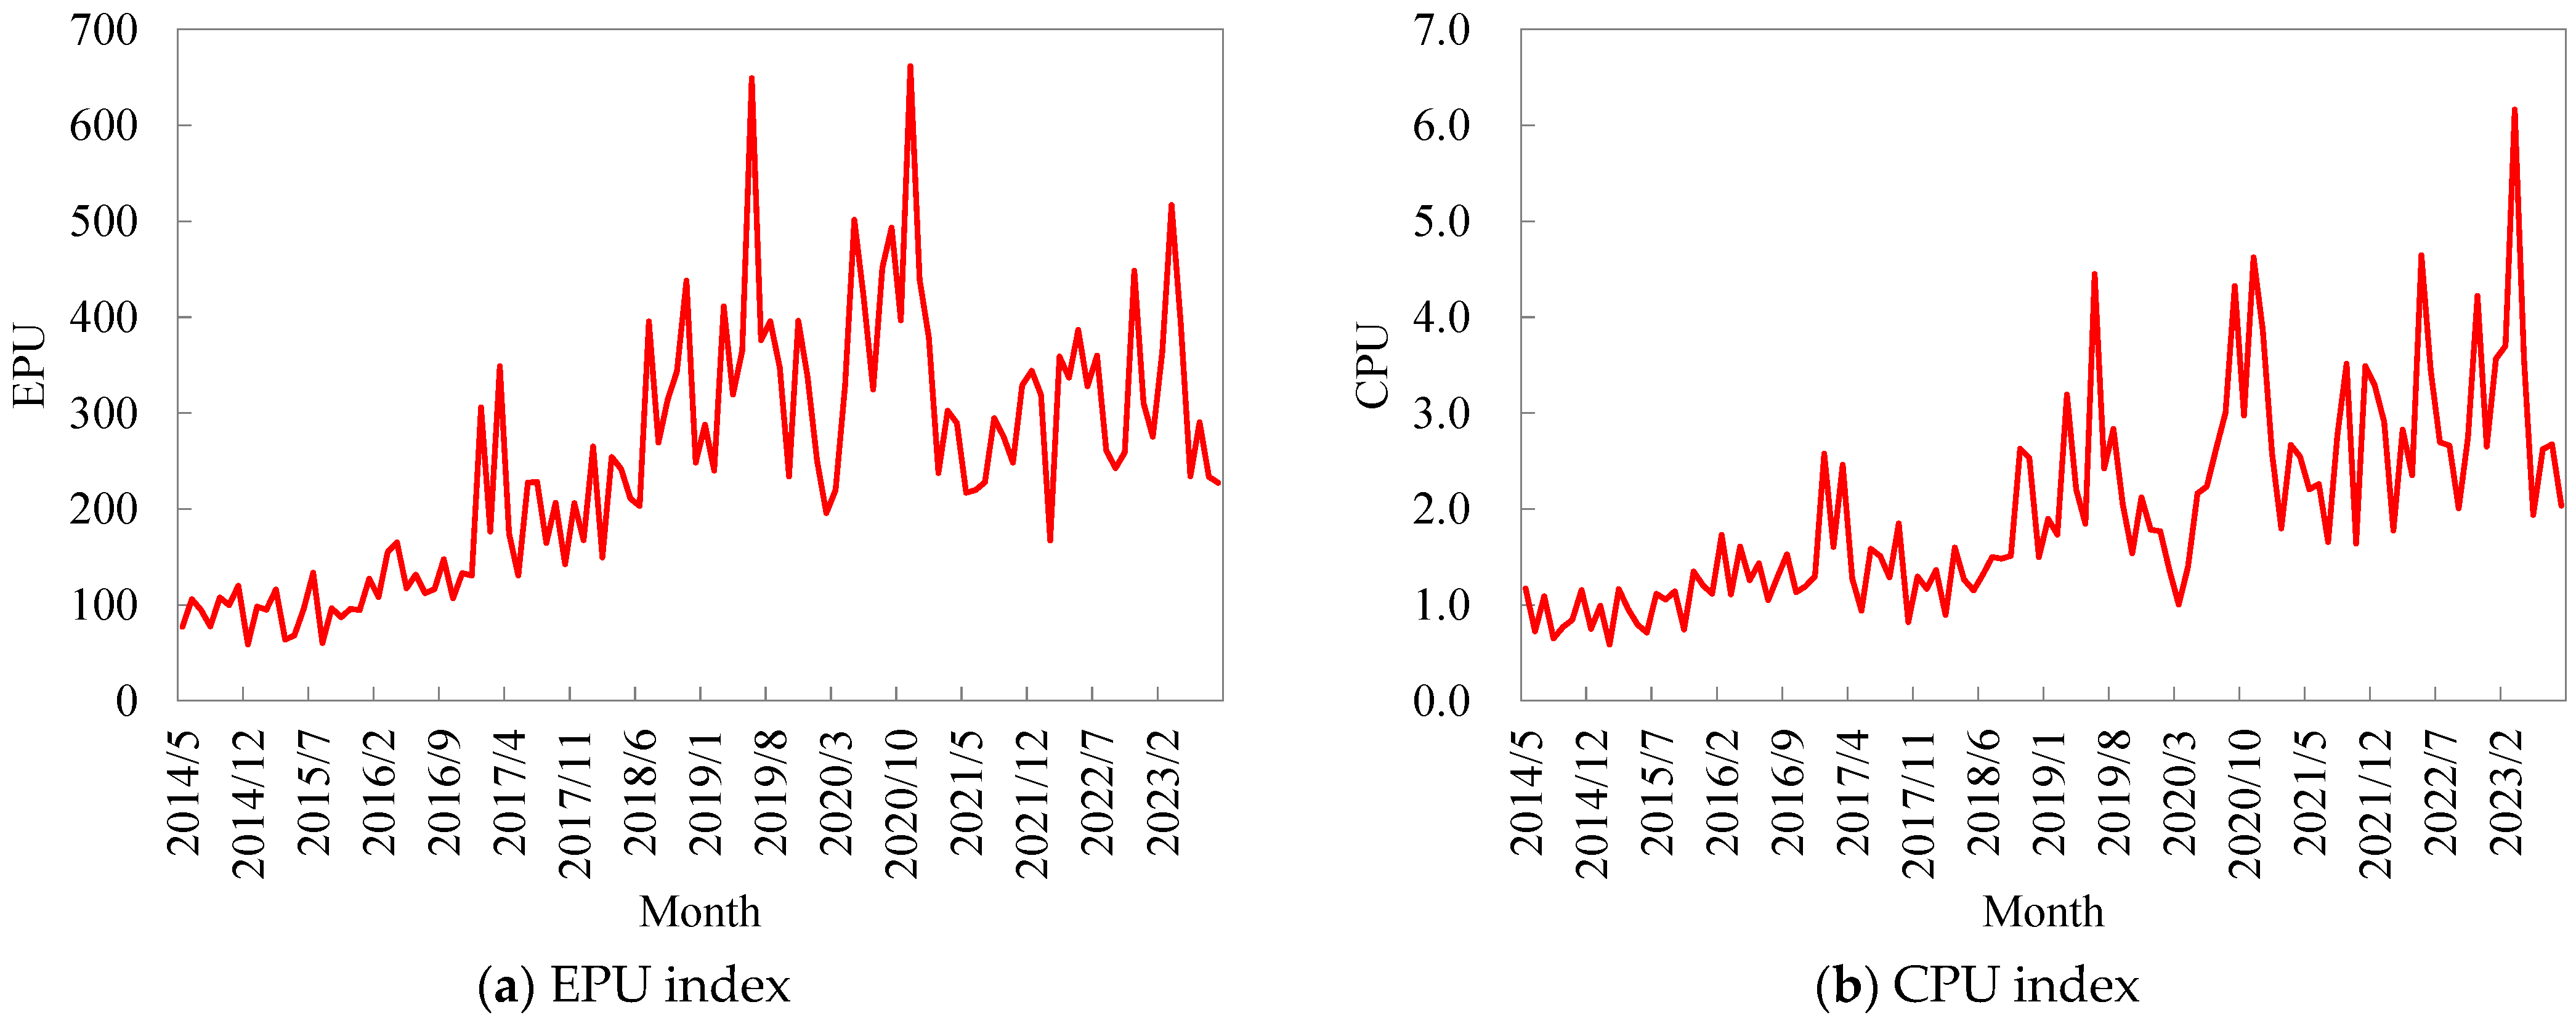
2.2.2. Policy Uncertainty Index

According to Baker et al. in 2016 [28], the EPU index is mainly constructed by calculating the frequency of articles related to EPU through the main English newspaper in Hong Kong (South China Morning Post). By calculating the simultaneous occurrence of four keywords, including “China”, “economy”, “policy”, and “uncertainty”, the monthly EPU index can be derived. Similarly, Ji et al. [29] constructed the monthly CPU index through the text analysis of Chinese newspapers, and the keywords used were “carbon dioxide”, “climate”, “climate risk”, and “greenhouse gases” (Climate Policy Uncertainty Index: https://figshare.com/articles/dataset/Global_Climate_Policy_Uncertainty_2000-2023_/24807627 (accessed on 28 April 2025)).
The above research combines local newspapers, news, and policy information in China and truly reflects the actual changing patterns of policy uncertainty in China. Hence, we still follow the policy uncertainty measurement method from previous studies. The policy uncertainty index data are shown in Figure 4.
As shown in Figure 4, there are certain similarities and differences between the Chinese EPU and CPU.
(1)
First peak in early 2017
In early 2017, Donald Trump became the 45th President of the United States. With its “America First” foreign policy, it adopted aggressive trade protectionism policies in the early stages of its tenure, which led to a rapid escalation of the global trade situation and significant friction between the United States and major trading partners such as China. At the same time, Trump overturned a series of energy regulatory policies of his predecessor and proposed to withdraw from the Paris Agreement, which is tantamount to increasing the challenges and risks of global efforts to address climate change. In this context, China’s EPU and CPU have experienced significant fluctuations.
(2)
Second peak in mid-2019
Affected by the Sino-US trade tensions and the slowdown in global economic growth, the uncertainty of China’s economic policies rapidly increased between 2018 and 2019, reaching its first peak in mid-2019. In response to the escalating tariff policies in the United States, the State Council Information Office of the People’s Republic of China announced “China’s Position on the China-US Economic and Trade Consultations” in June 2019. During the same period, global climate change issues continued to escalate, with global temperatures reaching an all-time high in June 2019, multiple wildfires in the Arctic Circle, and global carbon emissions peaking.
(3)
Third peak in the latter half of 2020
Due to the impact of the COVID-19 epidemic, the uncertainty of China’s economic policies continued to rise in 2020 and reached its second peak in November 2020. As the northern hemisphere entered winter, the global COVID-19 pandemic accelerated. The cumulative number in November 2020 was 7.5 times that of the previous month. In terms of CPU, China first proposed “carbon peak and carbon neutrality” climate targets in September 2020, which influenced the subsequent series of climate policies.
(4)
Fourth peak in early 2023
In early 2023, the U.S. Department of Commerce announced the addition of multiple Chinese companies to the export control “Entity List”. The escalating trade friction has further intensified the uncertainty of economic policies between China and the United States. Similarly, global climate risks significantly increased in 2023, with extreme heat and other out-of-season phenomena occurring in regions such as Europe at the beginning of the year.
Furthermore, we analyzed the correlation between EPU and CPU in China using the Pearson correlation model. The results indicate that the correlation coefficient between the two is as high as 0.83, which also means that China’s EPU and CPU exhibit a high degree of convergence.

3. Empirical Analysis

3.1. Descriptive Statistics

Table 1 presents the descriptive statistical results of CETM return data and the policy uncertainty index.
As shown in Table 1, the returns of China’s pilot CETM exhibit significant heterogeneity. Specifically, Hubei CETM exhibits characteristics of high returns and low volatility, while the Shenzhen CETM exhibits characteristics of low returns and high volatility. From the perspective of policy uncertainty, China’s EPU is significantly higher than CPU, and the fluctuation trend of the former is also significantly stronger than that of the latter. From the perspective of skewness and kurtosis, the skewness of various CETM returns and policy uncertainty indices is not zero, and kurtosis is greater than three. The J-B statistic of CETM return data remains significant at the 1% level, and that of the policy uncertainty index is significant at the 5% level and 10% level. The descriptive statistical results indicate that the CETM return data presented exhibit significant asymmetry and leptokurtic characteristics, which also implies that the CETM has a feedback effect.

3.2. Stability Test and ARCH Effect Test

Before establishing the GARCH model for policy uncertainty and CETM return volatility, it is necessary to ensure the stationarity of the data. Therefore, Augmented Dickey–Fuller (ADF) tests were conducted on the return data of three CETMs, and the results are shown in Table 2.
As shown in Table 2, the three CETM return data points have all passed the ADF test, proving that the first-order difference processed data are stationary. In addition, to test whether there is an ARCH effect in the CETM return data, an autoregressive conditional heteroskedasticity Lagrange multiplier (ARCH-LM) test was conducted, and the results are shown in Table 3.
As shown in Table 3, the three CETM return data points have all passed the ARCH-LM test; therefore, further research can be conducted.

3.3. Analysis of the Impact of Policy Uncertainty on CETM Price Volatility

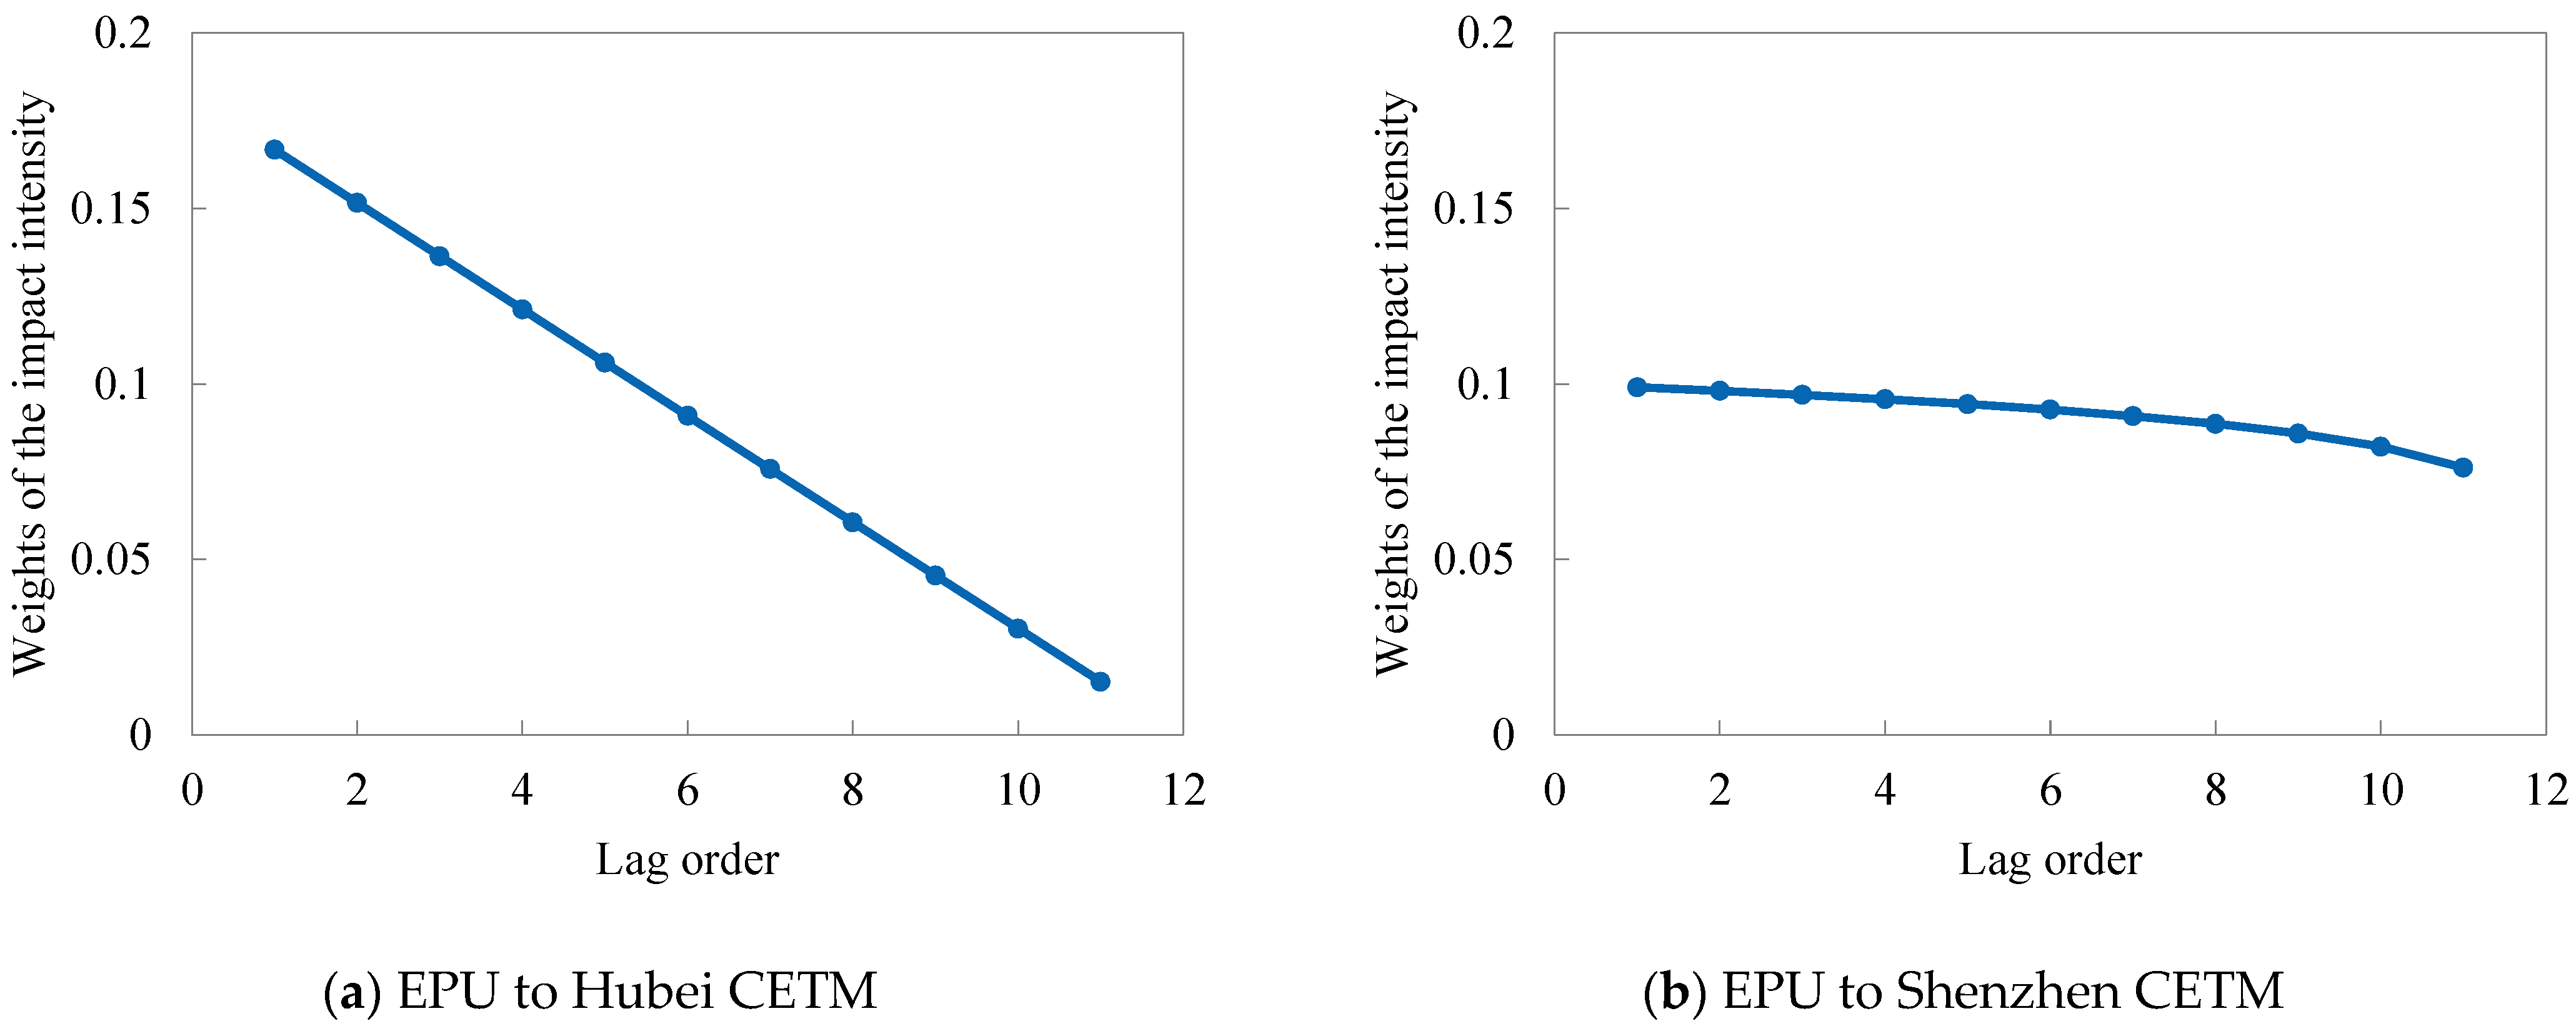
3.3.1. Impact of EPU on CETM Price Volatility

Based on the GARCH-MIDAS model constructed in Section 2, an analysis was conducted on the impact of EPU on CETM price volatility. The parameter estimation results are shown in Table 4.
As shown in Table 4, α and β are major parameters reflecting the short-term volatility of carbon prices. The return data of the three CETMs all meet the requirements and are significant at a 1% confidence level, which means that the short-term volatility of CETM return in Guangdong, Hubei, and Shenzhen has strong memory and persistence. θ is another important parameter that needs attention, reflecting the impact of policy uncertainty on long-term fluctuations in carbon returns. If θ > 0 , this indicates that as EPU increases, the long-term component of carbon price fluctuations will also increase. On the contrary, if θ < 0 , this indicates that as the uncertainty of economic policies increases, the long-term component of carbon price fluctuations will decrease. The results indicate that the long-term price volatility in the Hubei and Shenzhen CETMs is affected by EPU, while the long-term price volatility in the Guangdong CETM is not affected by EPU. In addition, the return fluctuations in Hubei and Shenzhen CETMs affected by EPU show opposite manifestations.
In addition, the dynamic impact trend in EPU on CETM price volatility can be calculated through θ × φ k ( ω 2 ) , and Figure 5 shows the dynamic impact trend in EPU on returns in Hubei and Shenzhen CETMs, respectively.
Taking the Hubei CETM as an example, under first-order lag, the weight of the impact intensity of EPU on price volatility is 0.1668, and the impact intensity is −0.0030%. In other words, for every 1% increase in the rate of change of the current EPU index, the price volatility of Hubei CETM will decrease by 0.0030% in the next period. With regard to the trend in weight changes, the weight of the impact of EPU on market price volatility decreases as the lag order increases, showing a rapid linear downward trend overall.
The weight of the impact of EPU on Shenzhen CETM price fluctuations under first-order lag is 0.0990, which is slightly lower than that of the Hubei carbon market. However, the decrease in its impact strength weight is not significant, and the impact strength weight still reaches 0.0761 after lagging by 11 orders. From the perspective of impact intensity, the impact intensity of economic policy uncertainty on price fluctuations in the Shenzhen carbon market under first-order lag reaches 0.9202%, which is significantly higher than that of the Hubei carbon market.

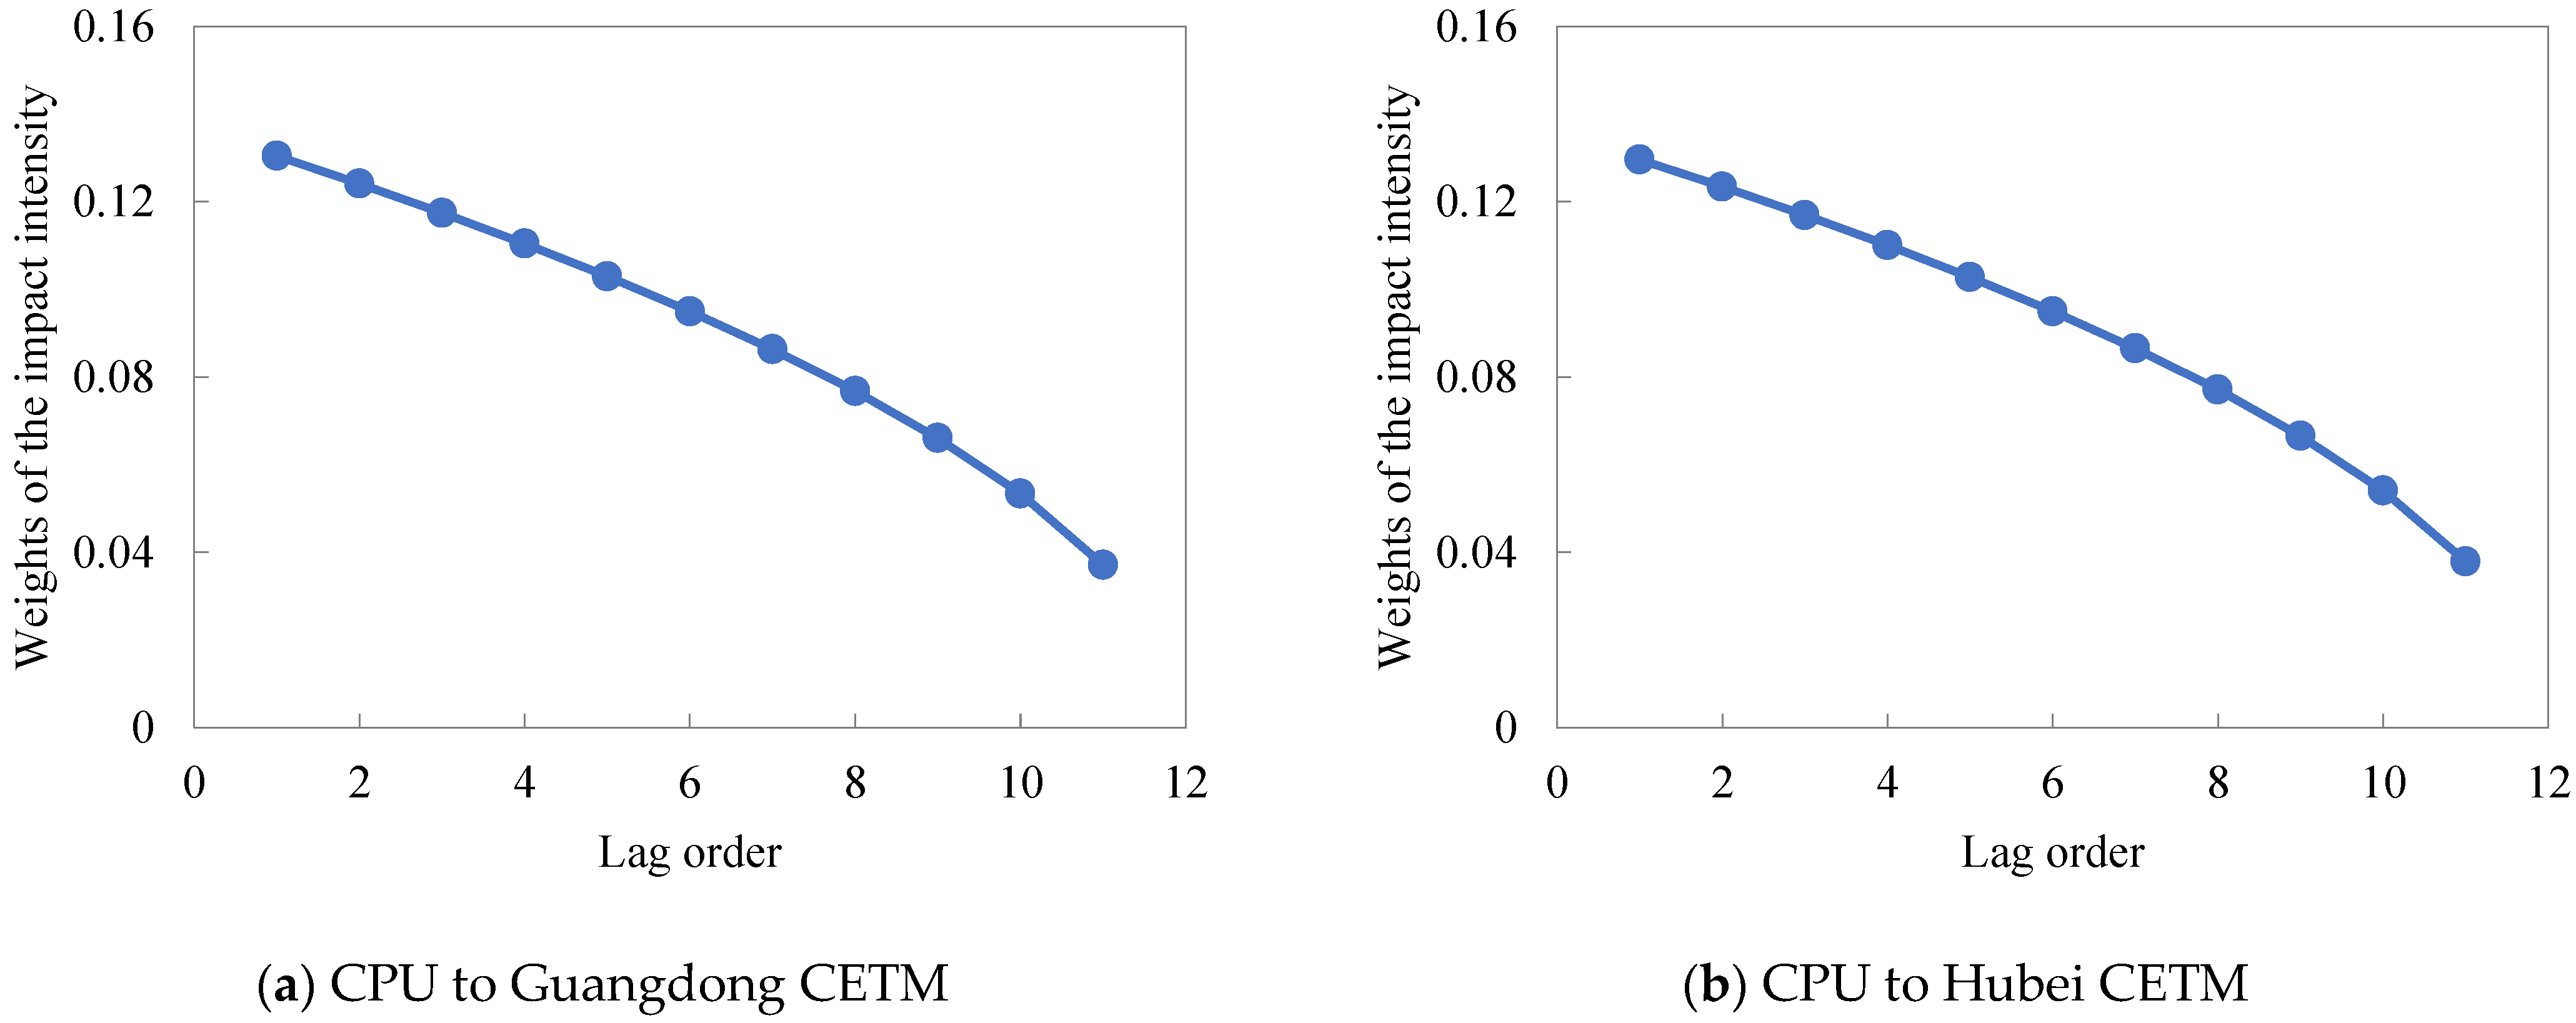
3.3.2. Impact of CPU on CETM Price Volatility

Similarly, an analysis was conducted on the impact of CPU on CETM price volatility. The parameter estimation results are shown in Table 5.
Different from the EPU, the long-term price fluctuations of Guangdong and Hubei CETMs are affected by CPU, while the long-term price volatility of Shenzhen CETM is not affected by CPU. The similarity lies in the fact that with the increasing uncertainty of climate policies, the long-term volatility in Guangdong and Hubei CETMs has synchronously decreased, with the former experiencing a more significant decline. Similarly, the dynamic impact trend in CPU on market price volatility can be calculated, and Figure 6 shows the dynamic impact trend in CPU on return volatility in Guangdong and Hubei CETMs, respectively.
Due to the similar estimation results of parameter ω for the Guangdong and Hubei CETMs in Table 5, the trend in weight changes for the impact intensity of CPU on price volatility in both markets is completely consistent. Affected by parameter θ , the impact intensity differs a little by 2.8004% and 3.1139%, respectively.
Similarly, under the influence of the U.S. trade policy, European CPU also experienced significant fluctuations and increases in the middle of 2019. Then, affected by COVID-19, European CPU also declined in early 2020. Interestingly, at the beginning of the observation period, the changes in European CPU had a significant impact on the price fluctuation of EU ETS (similar to that in China), but after being affected by the COVID-19 pandemic and the Russia–Ukraine war, the subsequent trends were different [30].

3.3.3. Phased Analysis

With the establishment of China’s national CETM, key emission units in the power generation industry will no longer participate in local CETM trading but will participate uniformly in the national CETM. According to the operation of pilot CETMs throughout 2021, after the establishment of the national CETM, the transaction prices of various pilot carbon markets generally increased to varying degrees.
As shown in Table 6, such significant breakpoints and structural inflection points are not caused by policy uncertainty. If we neglect the impact of the national CETM construction, it may lead to biased estimates of the impact of policy uncertainty on CETM price fluctuations. To avoid the impact of this special event, we decided to conduct a phased analysis, which can help to eliminate the impact of structural changes and analyze the heterogeneity performance of the market at different stages. The dividing point is set to 16 July 2021 (the official listing and trading of China’s national CETM).
  • First phase (from 5 May 2014 to 15 July 2021);
  • Second phase (from 16 July 2021 to 25 August 2023).
Due to the relatively short establishment time of the national CETM, the maximum lag order of the second stage was adjusted to 1. The parameter estimation results of the impact of EPU on CETM price volatility at different stages are shown in Table 7.
As shown in Table 7, regardless of the establishment of the national CETM, the price volatility in the Guangdong CETM was not affected by EPU. In contrast, the price volatility in the Hubei CETM was mainly affected by the uncertainty of the first-stage economic policies, while the price volatility in the Shenzhen CETM was mainly affected by the uncertainty of the second-stage economic policies. Similarly, the impact of CPU at different stages on CETM price volatility was further studied, and the parameter estimation results are shown in Table 8.
As shown in Table 8, before the establishment of the national CETM, the volatility of prices in Guangdong, Hubei, and Shenzhen CETMs was affected by CPU. However, with the establishment of China’s national CETM, the power generation industry was separated from local pilot CETMs, and only the price volatility of the Shenzhen CETM was still affected by CPU. We sorted out the relationship between the price volatility and policy uncertainty throughout the entire cycle and stages, as shown in Table 8.
As shown in Table 9, with the establishment of the national CETM, the price volatility of the Guangdong and Hubei CETMs has gradually decreased due to policy uncertainty. While the trading price of the Shenzhen CETM is simultaneously affected by both policy uncertainties, specifically, with the increase in economic and climate policy uncertainty, price volatility has shown a downward trend. It is worth mentioning that the Guangdong CETM was not affected by EPU before and after the establishment of the national carbon market, while the price volatility of the Shenzhen CETM showed different trends before and after the establishment of the national CETM, resulting in the full-cycle trading price volatility being offset by the impact of CPU.

3.3.4. Robustness Test

To ensure the robustness of our econometric specifications, we conducted robustness tests through alternative variable construction.
  • EPU
In addition to the EPU index used in this paper, Davis et al. also proposed an EPU measurement method in 2019, which can be used as an alternative variable for the above EPU index [31]. The difference between the two EPUs mainly lies in the source of information and the sample size of data: the former is mainly based on the South China Morning Post, and data collection for the sample began in January 1995. While the latter is mainly based on mainland newspapers, data collection for the sample began in October 1949 (https://fred.stlouisfed.org/series/CHNMAINLANDEPU (accessed on 28 April 2025)). The two methods of measuring EPU are similar in that they are based on newspaper information. In consideration of readability, the replacement EPU indicator is named “AEPU”.
2.
CPU
In terms of climate change, current research on CPU is relatively scarce. Of these few studies, the measurement methods proposed by Ren et al. and Ma et al. have been widely applied in many fields [32,33]. The basic principle of the former is to use the global mean surface temperature (GMST) as a variable tool to reduce the impact of endogenous factors, but its disadvantage is that the index is annual data (the available data are from 2014 to 2023, and the sample size considering a one-year lag is only nine). However, the latter is mainly based on the news text data related to climate change, which is similar to the measurement method of policy uncertainty based on newspaper information. Considering the characteristics of the two kinds of CPU replacement variables, this paper adopts the second variable replacement method and names the replaced climate policy uncertainty index as “ACPU”.
Although there are slight differences in data capacity, the selection of newspaper/news types, and keywords, both the replacement variables and the original policy uncertainty indicators are based on the same principles. For example, Refs. [29,32] both used six newspapers such as People’s Daily, Guangming Daily, etc., and the difference is the approach applied in these two studies.
Considering that only the transaction price fluctuation of Hubei CETM is affected by the two policy uncertainties at the same time within the whole cycle, Table 10 mainly shows the parameter estimation results of the impact of the two replaced policy uncertainties on the price fluctuation of Hubei CETM.
Compared with the parameter estimation results before and after the replacement of the policy uncertainty index ( θ E P U H B = 0.0002 , θ A E P U H B = 0.0003 , θ C P U H B = 0.2161 , θ A C P U H B = 0.2426 ), although there is a slight deviation in the value of the impact coefficient, the direction of the impact intensity and the significance of the parameters are completely consistent with those before variable replacement. This result verifies the robustness of the model constructed in this paper.
From the perspective of the robustness of our research methods, we converted high-frequency carbon price data into monthly data based on previous studies and analyzed the relationship between the policy uncertainty index and carbon price fluctuations through the VAR-GARCH model. To simplify the analysis, we also conducted an analysis based on the Hubei carbon market, and the reconstructed monthly return data of the Hubei CETM are shown in Figure 7.
The parameter estimation result is that the EPU–Hubei CETM coefficient is 0.0085, and the CPU–Hubei CETM coefficient is 1.1337 (both are significant at the 1% level). Although the value of parameter estimation results differs from the method used in this paper, the correlation between policy uncertainty and carbon market price fluctuations remains consistent, which also demonstrates the robustness of the method used in this paper.

4. Conclusions

By employing the GARCH-MIDAS framework, this study systematically investigates the asymmetric impacts of policy uncertainty on CETM price dynamics across three pioneer pilots (Guangdong, Hubei, and Shenzhen) during 2014–2023. The core findings reveal the following:
(1)
Policy uncertainty has a significant impact on the CETM price, and the impact of different types of policy uncertainties on the price fluctuation of each CETM shows obvious heterogeneity. Depending on the perfect market trading and security system, the Hubei CETM actively investigates and develops the market price stability mechanism. Consequently, the market price fluctuation exhibits a declining trend regardless of the cycle of EPU or CPU. On the contrary, Guangdong CETM price volatility is more reliant on the supremacy of climate policies and is constrained by the effects of economic policies. Conversely, the impact of the COVID-19 epidemic and Sino-US trade tensions is inextricably linked to the significant volatility of the price in Shenzhen CETM.
(2)
In terms of stages, the impact of policy uncertainty on local pilot CETMs before and after the establishment of the national CETM is also different. Before the establishment of the national CETM, the market liquidity of Guangdong and Shenzhen was relatively weak, and the impact of macroeconomic policy adjustments on micro market participants was not significant. On the contrary, the CPU was the main factor leading to the price fluctuation of the pilot CETM in the first stage. After the establishment of the national CETM, the uncertainty of economic and climate policies gradually declined, and the impact on the price fluctuation of Guangdong and Hubei CETMs was not significant. On the contrary, the price of Shenzhen CETM still showed a high volatility trend, which was opposite to the change direction of policy uncertainty.
With the development of the national CETM, the market participants will be further expanded, and the participation of financial institutions will further aggravate the risk contagion brought by macro policies and external markets. Hence, it is necessary to strengthen risk prevention, improve the effectiveness of legislation, and ensure the stable and healthy operation of CETMs. Through the improvement of the trading rules and regulatory policy system of the CETM, this can help provide strong support for China to achieve the “carbon peaking and carbon neutrality” goals. Based on the research content of this paper, we will further investigate various carbon pricing mechanisms and carbon trading tools [34,35,36].

Author Contributions

Conceptualization, Z.C. and X.G.; methodology, N.C. and Y.Z.; data curation, N.C., Y.Z. and S.G.; writing—original draft preparation, S.G. and Z.C.; supervision, X.G.; project administration, Z.C. and X.G. All authors have read and agreed to the published version of the manuscript.

Funding

This research received no external funding.

Data Availability Statement

The data presented in this study are available upon request from the corresponding author due to the non-free database.

Acknowledgments

Thanks are due to the editors and reviewers for their valuable opinions, which were of great help in improving the quality of this paper.

Conflicts of Interest

Zhuoer Chen and Xiaohai Gao were employed by the State Grid Shandong Electric Power Company; Nan Chen was employed by the State Grid Jinan Power Supply Company; Yihang Zhao was employed by the Electric Power Development Research Institute Co., Ltd. The remaining author declares that the research was conducted in the absence of any commercial or financial relationships that could be construed as a potential conflict of interest.

References

  1. Nejat, P.; Jomehzadeh, F.; Taheri, M.M.; Gohari, M.; Majid, M.Z.A. A global review of energy consumption, CO2 emissions and policy in the residential sector (with an overview of the top ten CO2 emitting countries). Renew. Sustain. Energy Rev. 2015, 43, 843–862. [Google Scholar] [CrossRef]
  2. Zhao, Y.; Su, Q.; Li, B.; Zhang, Y.; Wang, X.; Zhao, H.; Guo, S. Have those countries declaring “zero carbon” or “carbon neutral” climate goals achieved carbon emissions-economic growth decoupling? J. Clean. Prod. 2022, 363, 132450. [Google Scholar] [CrossRef]
  3. Wang, H.; Feng, T.; Zhong, C. Effectiveness of CO2 cost pass-through to electricity prices under “electricity-carbon” market coupling in China. Energy 2023, 266, 126387. [Google Scholar] [CrossRef]
  4. Tang, C.; Wu, Y.; Liu, X. Does China’s national carbon market play a role? Evidence from corporate ESG performance. Econ. Anal. Policy 2025, 85, 1053–1064. [Google Scholar] [CrossRef]
  5. Li, M.; Ma, X.; Jia, J.; Zhu, C. Risk spillovers between the financial market and macroeconomic sectors under mixed-frequency information: A frequency domain perspective. Int. Rev. Econ. Financ. 2025, 99, 103976. [Google Scholar] [CrossRef]
  6. Chen, Z.; Zhang, L.; Wang, C. Does climate policy uncertainty affect Chinese stock market volatility? Int. Rev. Econ. Financ. 2023, 84, 369–381. [Google Scholar] [CrossRef]
  7. Liu, H.; Yu, J.; Tang, G.; Chen, J. External trade policy uncertainty, corporate risk exposure, and stock market volatility. China Econ. Rev. 2025, 89, 102331. [Google Scholar] [CrossRef]
  8. Jia, L.; Xu, R.; Wu, J.; Song, M.; Chen, X. Impacts of geopolitical risk and economic policy uncertainty on metal futures price volatility: Evidence from China. Resour. Policy 2023, 87, 104328. [Google Scholar] [CrossRef]
  9. Xin, B.; Jiang, K. Economic uncertainty, central bank digital currency, and negative interest rate policy. J. Manag. Sci. Eng. 2023, 8, 430–452. [Google Scholar] [CrossRef]
  10. Yan, J.; Işık, C. Assessing the risk spillover effects between the Chinese carbon market and the US-China energy market. Heliyon 2025, 11, e41186. [Google Scholar] [CrossRef]
  11. Tan, X.; Sirichand, K.; Vivian, A.; Wang, X. How connected is the carbon market to energy and financial markets? A systematic analysis of spillovers and dynamics. Energy Econ. 2020, 90, 104870. [Google Scholar] [CrossRef]
  12. Zhao, Y.; Zhou, Z.; Zhang, K.; Huo, Y.; Sun, D.; Zhao, H.; Sun, J.; Guo, S. Research on spillover effect between carbon market and electricity market: Evidence from Northern Europe. Energy 2023, 263, 126107. [Google Scholar] [CrossRef]
  13. Song, Y.; Liu, T.; Liang, D.; Li, Y.; Song, X. A Fuzzy Stochastic Model for Carbon Price Prediction Under the Effect of Demand-related Policy in China’s Carbon Market. Ecol. Econ. 2019, 157, 253–265. [Google Scholar] [CrossRef]
  14. Dai, P.-F.; Xiong, X.; Huynh, T.L.D.; Wang, J. The impact of economic policy uncertainties on the volatility of European carbon market. J. Commod. Mark. 2022, 26, 100208. [Google Scholar] [CrossRef]
  15. Dou, Y.; Li, Y.; Dong, K.; Ren, X. Dynamic linkages between economic policy uncertainty and the carbon futures market: Does Covid-19 pandemic matter? Resour. Policy 2022, 75, 102455. [Google Scholar] [CrossRef]
  16. Wang, K.-H.; Liu, L.; Zhong, Y.; Lobonţ, O.-R. Economic policy uncertainty and carbon emission trading market: A China’s perspective. Energy Econ. 2022, 115, 106342. [Google Scholar] [CrossRef]
  17. Lu, H.; Gao, Q.; Li, M. Does economic policy uncertainty outperform macroeconomic factor and financial market uncertainty in forecasting carbon emission price volatility? Evidence from China. Appl. Econ. 2022, 55, 2156470. [Google Scholar] [CrossRef]
  18. Li, X.; Li, Z.; Su, C.-W.; Umar, M.; Shao, X. Exploring the asymmetric impact of economic policy uncertainty on China’s carbon emissions trading market price: Do different types of uncertainty matter? Technol. Forecast. Soc. Chang. 2022, 178, 121601. [Google Scholar] [CrossRef]
  19. Liu, W.; Liu, Y.; Wen, F.; Gong, X. Climate policy uncertainty and analyst earnings forecasts: Evidence from the Chinese energy sector. Int. Rev. Financ. Anal. 2025, 100, 103960. [Google Scholar] [CrossRef]
  20. Lv, W.; Li, B. Climate policy uncertainty and stock market volatility: Evidence from different sectors. Financ. Res. Lett. 2023, 51, 103506. [Google Scholar] [CrossRef]
  21. Ding, S.; Wang, A.; Cui, T.; Du, A.M. Renaissance of climate policy uncertainty: The effects of U.S. presidential election on energy markets volatility. Int. Rev. Econ. Financ. 2025, 98, 103866. [Google Scholar] [CrossRef]
  22. Xing, X.; Chen, Y.; Wang, X.; Li, B.; Deng, J. The impact of national carbon market establishment on risk transmission among carbon and energy markets in China: A systemic importance analysis. Financ. Res. Lett. 2023, 57, 104219. [Google Scholar] [CrossRef]
  23. Tang, C.; Yang, G.; Liu, X. Risk spillover within the carbon-energy system—New evidence considering China’s national carbon market. Econ. Anal. Policy 2024, 81, 1227–1240. [Google Scholar] [CrossRef]
  24. Engle, R.; Ghysels, E.; Sohn, B. Stock Market Volatility and Macroeconomic Fundamentals. Rev. Econ. Stat. 2013, 95, 776–797. [Google Scholar] [CrossRef]
  25. Wang, Y.; Wang, Z.; Tang, N. Comparative Study on Efficiency of China’s Pilot Carbon Trading Market Based on Sharpe Ratio. Sci. Technol. Manag. Land Resour. 2022, 39, 9–19. [Google Scholar]
  26. Liu, T.; Guan, X.; Wei, Y.; Xue, S.; Xu, L. Impact of economic policy uncertainty on the volatility of China’s emission trading scheme pilots. Energy Econ. 2023, 121, 106626. [Google Scholar] [CrossRef]
  27. Wang, R.; Yuan, J.; Xu, H.; Ning, W. Measurement and empirical study on Value-at-Risk of China carbon market. China Soft Sci. 2023, 7, 142–150. [Google Scholar]
  28. Baker, S.; Bloom, N.; Davis, S. Measuring Economic Policy Uncertainty. Q. J. Econ. 2016, 131, 1593–1636. [Google Scholar] [CrossRef]
  29. Ji, Q.; Ma, D.; Zhai, P.; Fan, Y.; Zhang, D. Global climate policy uncertainty and financial markets. J. Int. Financ. Mark. Inst. Money 2024, 95, 102047. [Google Scholar] [CrossRef]
  30. Li, Y.; Wang, H.; Liu, X. On Relationship Between EU Climate Change Economic Policy Uncertainty(EPU) and Carbon Prices: Keyword Valuation Based on Mood Variables. Sci. Technol. Manag. Land Resour. 2023, 40, 74–84. [Google Scholar]
  31. Davis, S.; Liu, D.; Sheng, X. Economic Policy Uncertainty in China Since 1949: The View from Mainland Newspapers. In Proceedings of the Fourth Annual IMF-Atlanta Fed Research Workshop on China’s Economy Atlanta, Atlanta, GA, USA, 19 September 2019. [Google Scholar]
  32. Ren, X.; Zhang, X.; Yan, C.; Gozgor, G. Climate policy uncertainty and firm-level total factor productivity: Evidence from China. Energy Econ. 2022, 113, 106209. [Google Scholar] [CrossRef]
  33. Ma, Y.-R.; Liu, Z.; Ma, D.; Zhai, P.; Guo, K.; Zhang, D.; Ji, Q. A news-based climate policy uncertainty index for China. Sci. Data 2023, 10, 881. [Google Scholar] [CrossRef] [PubMed]
  34. Du, Q.; Ma, M.; Lu, C.; Wang, X.; Bai, L. Assessing the impact of emission trading scheme and carbon tax in the building sector: An embodied carbon perspective. Environ. Impact Assess. Rev. 2025, 111, 107732. [Google Scholar] [CrossRef]
  35. Du, Q.; Wan, Z.; Yang, M.; Wang, X.; Bai, L. Dynamic integrated simulation of carbon emission reduction potential in China’s building sector. Sustain. Cities Soc. 2024, 116, 105944. [Google Scholar] [CrossRef]
  36. Jia, Z.; Wen, S.; Wu, R. Synergistic effect of emission trading scheme and carbon tax: A CGE model-based study in China. Environ. Impact Assess. Rev. 2025, 110, 107699. [Google Scholar] [CrossRef]
Figure 1. Different stages of China’s carbon market development.
Energies 18 02448 g001
Figure 2. Current studies on policy uncertainty and financial markets [7,8,9,14,15,16,17,18].
Energies 18 02448 g002
Figure 3. The return for CETMs.
Energies 18 02448 g003
Figure 4. The policy uncertainty index.
Energies 18 02448 g004
Figure 5. The dynamic impact of EPU on CETM price volatility.
Energies 18 02448 g005
Figure 6. The dynamic impact of CPU on CETM price volatility.
Energies 18 02448 g006
Figure 7. The reconstructed monthly return data of the Hubei CETM.
Energies 18 02448 g007
Table 1. Descriptive statistical results.
IndicatorsSample SizeMeanStd.SkewnessKurtosisJ-B Statistic
Guangdong CETM (GD)21080.00643.8781−0.27174.8729334.0300 ***
Hubei CETM (HB)21080.03102.8337−0.29748.04812269.3900 ***
Shenzhen CETM (SZ)2108−0.007232.56130.254425.010042,572.70 ***
EPU112249.4170127.78270.64743.26718.1577 **
CPU1121.99021.04181.20034.597938.8073 ***
Note: *** represents significance at the 1% level, ** represents significance at the 5% level, and * represents significance at the 10% level.
Table 2. ADF test results.
IndicatorsADF Test Coefficient
GD−17.1025 ***
HB−18.9692 ***
SZ−21.1067 ***
Note: *** represents significance at the 1% level, ** represents significance at the 5% level, and * represents significance at the 10% level.
Table 3. ARCH-LM test results.
IndicatorsARCH-LM Test Coefficient
GD284.3823 ***
HB253.1755 ***
SZ269.2509 ***
Note: *** represents significance at the 1% level, ** represents significance at the 5% level, and * represents significance at the 10% level.
Table 4. Parameter estimation results of the impact of EPU on CETM price volatility.
ParameterEPU-GDEPU-HBEPU-SZ
μ 0.0005
(1.2279)
0.0004
(1.0506)
0.0014
(0.5177)
α 0.0815 ***
(23.7710)
0.4076 ***
(13.7750)
0.1125 ***
(18.9740)
β 0.9180 ***
(389.3700)
0.5431 ***
(33.8900)
0.8821 ***
(229.9900)
θ 1.305 × 10⁻⁵
(0.2068)
−0.0002 **
(−1.9889)
0.0929 *
(1.6805)
ω 3.0208 ***
(4.8702)
1.0013 ***
(8.6656)
1.1098 ***
(3.6347)
m −1.5406 × 10⁻⁵
(−0.2068)
0.0026 **
(2.5163)
−0.0695
(−1.5976)
LLF3302.783662.23379.836
AIC−6593.55−7312.45−747.673
BIC−6560.25−7279.15−717.365
Note: *** represents significance at the 1% level, ** represents significance at the 5% level, and * represents significance at the 10% level. The value in parentheses represents the t-statistic, LLF represents the log likelihood value, and AIC and BIC represent the Akaike information criterion and Bayesian information criterion, respectively.
Table 5. Parameter estimation results of the impact of CPU on CETM price volatility.
ParameterCPU-GDCPU-HBCPU-SZ
μ 0.0082
(1.3977)
−0.0004
(−0.5704)
0.0197
(0.7382)
α 0.4988 ***
(6.5277)
0.5080 ***
(7.6480)
1.2498 ***
(18.4242)
β 0.2386 ***
(5.0112)
0.2508 ***
(5.0300)
1.6776 ***
(13.4730)
θ 0.2387 ***
(3.5098)
−0.2161 ***
(3.5426)
2.0924
(0.2109)
ω 1.5239 ***
(4.9171)
1.5126 ***
(4.3543)
1.0139 ***
(5.2322)
m 0.0019 **
(4.4499)
0.0015 **
(4.6302)
−0.0834
(−0.6721)
LLF1886.521935.54294.75
AIC−3712.33−3859.08−629.88
BIC−3667.50−3828.97−590.01
Note: *** represents significance at the 1% level, ** represents significance at the 5% level, and * represents significance at the 10% level. The value in parentheses represents the t-statistic, LLF represents the log likelihood value, and AIC and BIC represent the Akaike information criterion and Bayesian information criterion, respectively.
Table 6. Changes in prices of major CETMs.
CETMsAverage Transaction Price in 2021
Before the Establishment of the National CETMAfter the Establishment of the National CETM
Guangdong35.4443.22
Hubei30.2938.79
Shenzhen10.6112.96
Table 7. Parameter estimation results of the impact of EPU on CETM price volatility (different phases).
ParameterPhase 1Phase 2
EPU-GDEPU-HBEPU-SZEPU-GDEPU-HBEPU-SZ
μ 0.0009
(1.4151)
0.0004
(0.7885)
−0.0001
(−0.0518)
0.0003
(0.1914)
0.0016
(1.6054)
0.0158
(0.9345)
α 0.0598 ***
(16.9820)
0.3573 ***
(11.9020)
0.1375 ***
(19.4010)
0.1617 ***
(3.5941)
0.5971 ***
(8.3943)
0.0547 ***
(5.2612)
β 0.9402 ***
(267.0300)
0.5870 ***
(33.5150)
0.8586 ***
(189.2700)
0.8286 ***
(18.2740)
0.3696 ***
(15.9910)
0.9453 ***
(82.6310)
θ 0.0633
(1.5436)
−0.0002 ***
(−2.6153)
0.1858
(0.8649)
0.0005
(1.1636)
−0.0012
(−0.5442)
−0.0280 ***
(−3.5681)
ω 1.4220 ***
(4.4380)
38.4100
(0.3118)
3.2426 ***
(3.5827)
2.7896 ***
(2.7458)
5.5438 **
(2.0541)
5.5914
(0.5596)
m −0.0541
(−1.5027)
0.0026 ***
(2.9604)
−0.1522
(−0.8558)
−0.0015
(−1.1557)
0.0111
(0.5443)
0.3375 ***
(9.2812)
LLF2884.063148.44381.06433.66473.3334.93
AIC−5756.12−6284.88−750.12−855.33−934.66−57.85
BIC−5723.52−6252.28−717.52−835.16−914.50−37.68
Note: *** represents significance at the 1% level, ** represents significance at the 5% level, and * represents significance at the 10% level. The value in parentheses represents the t-statistic, LLF represents the log likelihood value, and AIC and BIC represent the Akaike information criterion and Bayesian information criterion, respectively.
Table 8. Parameter estimation results of the impact of CPU on CETM price volatility (different phases).
ParameterPhase 1Phase 2
CPU-GDCPU-HBCPU-SZCPU-GDCPU-HBCPU-SZ
μ 0.0009 **
(1.8655)
0.0003
(0.6644)
4.1937 × 10⁻⁵
(0.0151)
0.0014
(0.8188)
0.0009
(1.0801)
0.0180
(1.4125)
α 0.3320 ***
(8.6684)
0.3597 ***
(11.9090)
0.1209 ***
(18.4790)
0.2447 ***
(2.8028)
0.6385 ***
(11.3170)
0.0663 ***
(15.0060)
β 0.5220 ***
(13.6140)
0.5792 ***
(31.3400)
0.8727 ***
(233.2900)
0.7303 ***
(9.1242)
0.3310 ***
(8.6724)
0.9336 ***
(207.1000)
θ −0.0025 ***
(−5.8531)
−0.0005 **
(−2.5271)
0.1723 *
(1.6461)
0.0011
(0.9342)
−0.0013
(−0.6143)
−0.2613 ***
(−2.5841)
ω 1.5000 ***
(9.7236)
4.0787
(1.4060)
1.0718 ***
(5.0516)
1.0010 ***
(10.4200)
47.2900
(1.2773)
1.0011 ***
(10.1580)
m 0.0056 ***
(5.9253)
0.0025 ***
(3.1221)
−0.1348
(−1.6038)
−0.0009
(−0.6986)
0.0055
(0.6131)
1.0834 ***
(3.6336)
LLF2933.483150.50376.39439.78475.3645.14
AIC−5854.97−6289.00−740.78−867.56−938.72−78.28
BIC−5822.37−6256.40−708.18−847.39−918.55−58.11
Note: *** represents significance at the 1% level, ** represents significance at the 5% level, and * represents significance at the 10% level. The value in parentheses represents the t-statistic, LLF represents the log likelihood value, and AIC and BIC represent the Akaike information criterion and Bayesian information criterion, respectively.
Table 9. The relationship between price volatility and policy uncertainty in various carbon markets (full cycle and phases).
PhaseEPU-GDEPU-HBEPU-SZCPU-GDCPU-HBCPU-SZ
Phase 1--
Phase 2----
Full cycle--
Note: “-” indicates that policy uncertainty has no impact on CETM price volatility, “↓” indicates that an increase in policy uncertainty will lead to a decrease in CETM price volatility, and “↑” indicates that an increase in policy uncertainty will lead to an increase in CETM price volatility.
Table 10. Parameter estimation results of the impact of replaced economic and climate policy uncertainties on the price fluctuations of Hubei’s carbon market.
ParameterAEPU-HBACPU-HB
μ 0.0006
(1.3534)
−0.0004
(−0.7106)
α 0.3952 ***
(14.0400)
0.6128 ***
(8.1223)
β 0.5602 ***
(37.2150)
0.2872 ***
(5.2267)
θ −0.0003 **
(−2.3573)
−0.2426 ***
(3.9100)
ω 43.5440
(0.3592)
1.5210 ***
(4.39063)
m 0.0037 **
(2.4388)
0.0016 ***
(5.9302)
LLF3668.512090.78
AIC−7325.02−3943.26
BIC−7291.72−3930.55
Note: *** represents significance at the 1% level, ** represents significance at the 5% level, and * represents significance at the 10% level. The value in parentheses represents the t-statistic, LLF represents the log likelihood value, and AIC and BIC represent the Akaike information criterion and Bayesian information criterion, respectively.
Disclaimer/Publisher’s Note: The statements, opinions and data contained in all publications are solely those of the individual author(s) and contributor(s) and not of MDPI and/or the editor(s). MDPI and/or the editor(s) disclaim responsibility for any injury to people or property resulting from any ideas, methods, instructions or products referred to in the content.

