Article

Experimental and Numerical Study of the Heat Dissipation of the Electronic Module in an Air Conditioner Outdoor Unit

by
Yi Peng
1,
Su Du
2,
Qingfeng Bie
3,
Dechang Wang
1,*,
Qinglu Song
1 and
Sai Zhou
1
1
College of Mechanical and Electrical Engineering, Qingdao University, 308 Ningxia Road, Qingdao 266071, China
2
China United Network Communications Corporation, Yantai Branch, 318 Shengli Road, Yantai 264000, China
3
Hisense Air Conditioner Co., Ltd., Hisense R & D Center, 399 Songling Road, Qingdao 266104, China
*
Author to whom correspondence should be addressed.
Energies 2025, 18(10), 2439; https://doi.org/10.3390/en18102439
Submission received: 15 March 2025 / Revised: 29 April 2025 / Accepted: 6 May 2025 / Published: 9 May 2025

Abstract

:
Effective thermal management of electronic modules is crucial to the reliable operation of variable frequency air conditioners. For this reason, two types of plate-finned heat sinks of electronic modules were selected. The experiments utilized ceramic heating plates to simulate chip heating, conducted in an enthalpy difference laboratory with controlled environments. Four installation cases were analyzed to evaluate the impact of heat sink orientation, airflow direction, and structural layout. The results showed that when multiple chips were arranged on the same heat dissipation substrate, the heat dissipation process of the chips would be coupled with each other, and the rational layout of the chips played an important role in heat dissipation. In the case of cooling air impacting the jet, the heat dissipation performance of the heat sink was significantly improved, and the heat transfer coefficient of the heat sink was as high as 316.5 W·m−2·°C−1, representing a 6.9% improvement over conventional designs (case I: 296.1 W·m⁻2·°C⁻1). The maximum temperature of the chips could be reduced by 11.1%, which is 10.1 °C lower. This study will provide a reference for the optimization design of the heat sink of the electric control module in inverter air conditioners.

1. Introduction

With economic growth and improvements in quality of life, consumption priorities in buildings have shifted from the use of building materials and durable goods to the emphasis on functional and environmental qualities. The energy consumption required to guarantee indoor air comfort has risen rapidly [1].
In air conditioner outdoor units, the electronic module converts alternating current (AC) and direct current (DC) power and controls the compressor, fan, and other mechanical components. Research shows that the reliability of electronic devices decreases by 10–20% for each 2 °C increment in temperature within the 70–80 °C range [2]. Elevated temperatures alter chip parameters like on-resistance, on-state voltage drop, and threshold voltage, significantly impacting performance. Over 55% of electronic device failures are attributed to high operating temperatures [3], highlighting the importance of maintaining acceptable chip temperatures.
The heat dissipation methods of the electronic module can be broadly classified into three categories: natural convection air cooling, refrigerant cooling, and forced convection air cooling. Natural convection air cooling is not sufficient to meet the high heat dissipation requirements of the chip. Refrigerant cooling utilizes the refrigeration lines in the air conditioner for the chip cooling [4,5]. Although it has a certain heat dissipation effect [6], it has complex pipelines and is prone to causing dew condensation on the chip surface. In contrast, forced convection air cooling uses a fan to enhance airflow through heat sink fins, providing 5 to 10 times the cooling capacity of natural air cooling. The air conditioner outdoor unit features an axial fan, reducing the need for extra power. This method is simpler, less costly, and easier to maintain than refrigerant cooling, making it a popular choice for cooling chips in air conditioners. It effectively enhances system performance and reliability.
Plate-fin heat sinks are widely used due to their advantages such as low cost, easy installation, and high reliability. Kazem et al. [7] provided an overview of the cooling devices employed in photovoltaic systems. They also demonstrated that the geometry of heat sinks and fins has a considerable impact on heat dissipation. Zaghloul et al. [8] compared the heat sinks with different fin designs through numerical simulation. The flared fin design is very effective for solar cell cooling, followed by straight fins. Johnston et al. [9] conducted a simulation comparison for different lengths of straight fins. An increase in fin length has been demonstrated to effectively reduce the temperature of the PV module, with an increase in efficiency of 15% observed at a fin height of 100 mm. Furthermore, the operating life of the module is extended.
In addition to the geometry of the fins themselves, the interaction between the fins and the flow field is extremely important, particularly in forced convection scenarios. Adhikari et al. [10] studied the effect of forced convection heat transfer at a low Reynolds number in a plate fin heat sink and found that fin lengths above a certain limit result in a reduction in the heat transfer rate in each channel. The angle of the heatsink to the cooling airflow also affects cooling. Meng et al. [11] simulated the straight-fin radiator and its surrounding wind field, and found that when the direction of cooling air formed an angle of 90° with the surface of the radiator, the heat dissipation effect was the best. The smaller the angle, the smaller the effective heat dissipation area. Moradikazerouni et al. [12] found that the reduction in fin height with vertical air intake resulted in a more uniform temperature inside the heat sink. Kim et al. [13] experimentally observed the non-uniformity of the cooling air flow rate in different channels when the air enters vertically into the finned heat sink. The effect of this phenomenon can be neglected for Reynolds numbers greater than 350.
In an air conditioning system, the primary function of the fan in the outdoor unit is to facilitate the heat transfer of the heat exchanger [14]. The direction of airflow through the heat sink is not fixed. The forced convection in the heat sink channels is characterized by a Reynolds number below 350.
In conclusion, significant research has been conducted on fin heat sink design with forced convection heat transfer, but less attention has been given to heat sinks in air conditioner outdoor unit electric modules. However, the current heat sink design differs only in the shape and installation direction of the heat fins [15], and the analysis of the heat flow field is lacking. Additionally, the fan operation and air conditioner outdoor unit structure will affect the air flow and temperature field distribution in the radiator.
Different from the above work, this work was carried out in a real outdoor unit environment, where the heat dissipation performance of the electronic control module heat sink under different conditions of the air conditioner outdoor unit was experimentally and numerically studied, and the interaction between the fan system and the radiator was analyzed. To accurately simulate the thermal behavior of electronic chips under operational conditions, ceramic heating plates were selected for their superior electrical-to-thermal conversion efficiency, stability, and precise controllability. These plates mimic the geometric dimensions (length, width, and thickness) and power density of the actual chips (IPM, FRD, IGBT, and BR). Based on the experimental data, the heat transfer effect of the electronic control module heat sink was compared in four cases. The characteristics of the heat transfer and flow were analyzed by numerical simulation. The heat dissipation effect of different heat sink installation positions was evaluated to provide reference for the heat dissipation of electronic modules.

2. Experiments

The heating process of the chip was simulated by a ceramic heating plate. The ceramic heating plate has good electric heating conversion performance, and the heating process of the chip can be simulated by adjusting its input power. The heat dissipation power is obtained by measuring the corresponding voltage and current value when the ceramic heating plate reaches a specific temperature. This method avoids the complexity and uncontrollability of directly measuring the heat dissipation of the chip.
The experiments were carried out in the enthalpy difference laboratory located at the Hisense R&D Center (Qingdao, China). This facility is equipped with state-of-the-art environmental control systems, enabling precise regulation of temperature (±0.2 °C) and humidity (±2% RH) across two independent rooms, the indoor unit environment room and the outdoor unit environment room. The indoor unit is equipped within the indoor environment room. The indoor unit is maintained at a constant temperature of 24 °C and constant relative humidity of 48%. The outdoor unit for the air conditioner with electronic module heat sink test equipment is installed in the outdoor environment room, which is maintained at 45 °C and 27% humidity. The experimental results provide boundary conditions for numerical simulation and verify the accuracy of the simulation model.
The type, measuring range, and uncertainty of the equipment utilized in the experiments are presented in Table 1. The method proposed by Moffat [16] is used to analyze the uncertainty of the experimental data. The power consumption of the ceramic heaters is measured indirectly by voltage and current. The relative uncertainty of the ceramic heater power is calculated by Equations (1) and (2), and the maximum uncertainty is ±0.14%.
P = U I
where P is the power consumption of the ceramic heaters (W), U is the voltage (V), and I is the current (A).
δ P = P U δ U 2 + P I δ I 2 1 2
where δP, δU, and δI represent the absolute uncertainties in power, voltage, and current, respectively.

3. Numerical Simulation

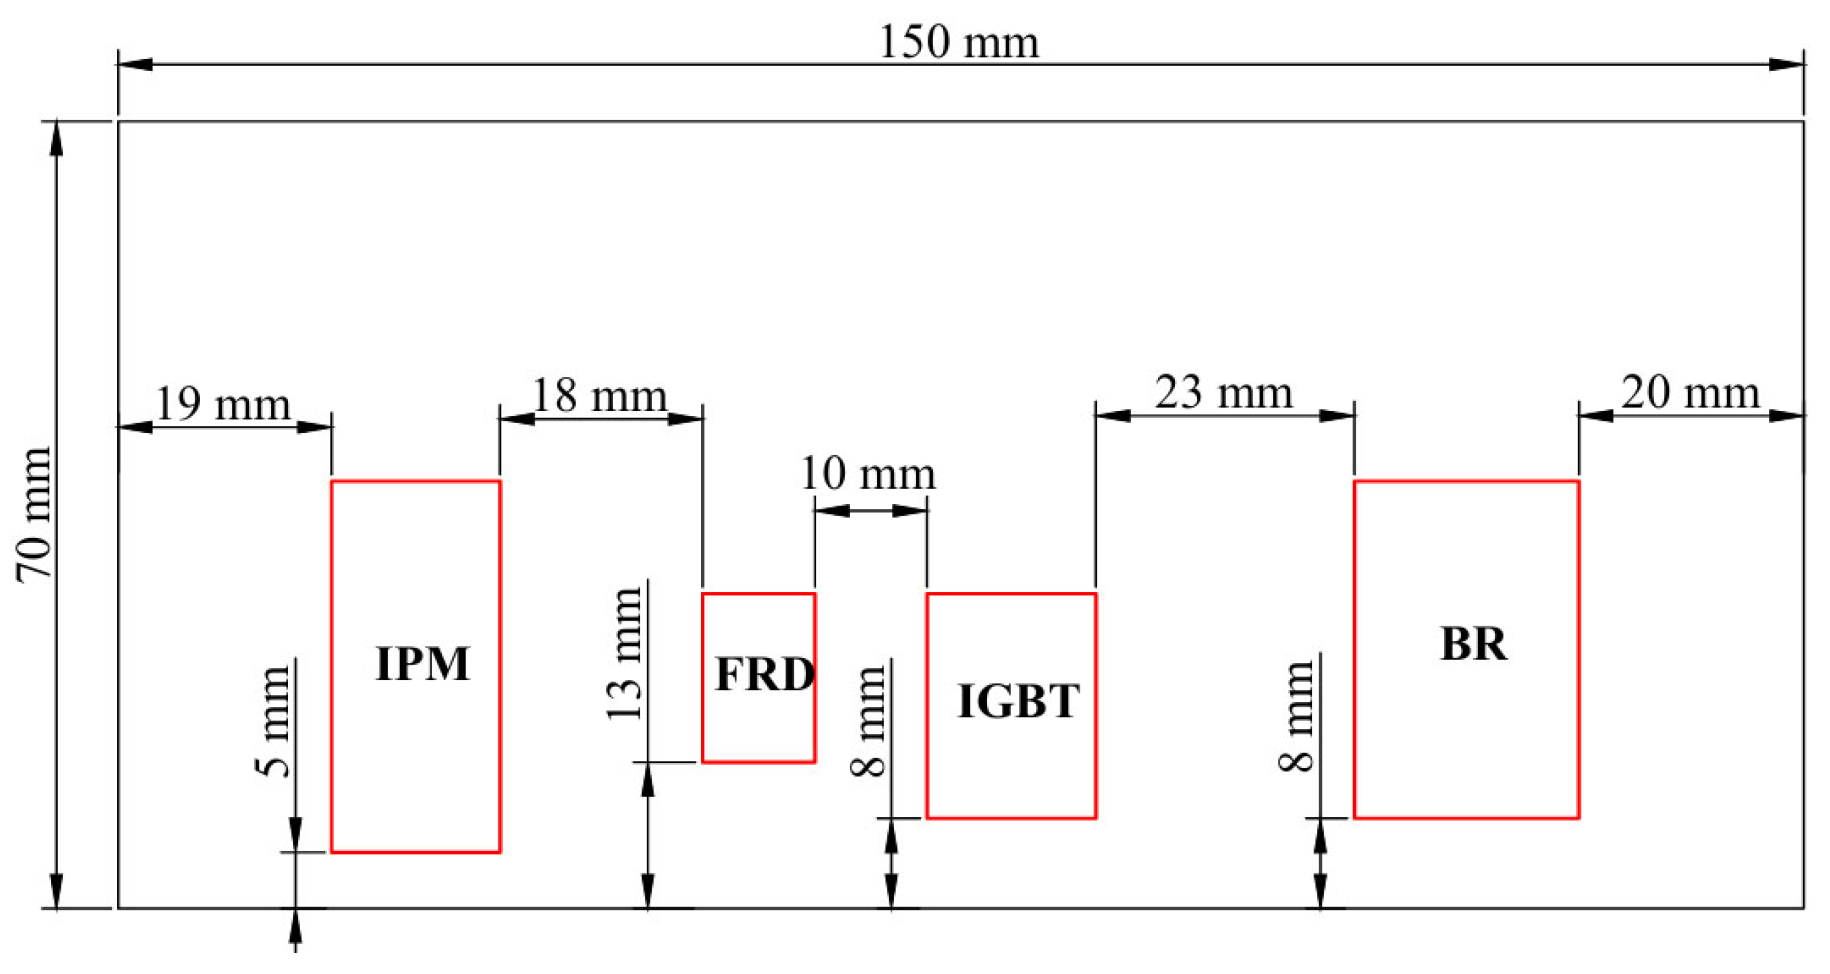
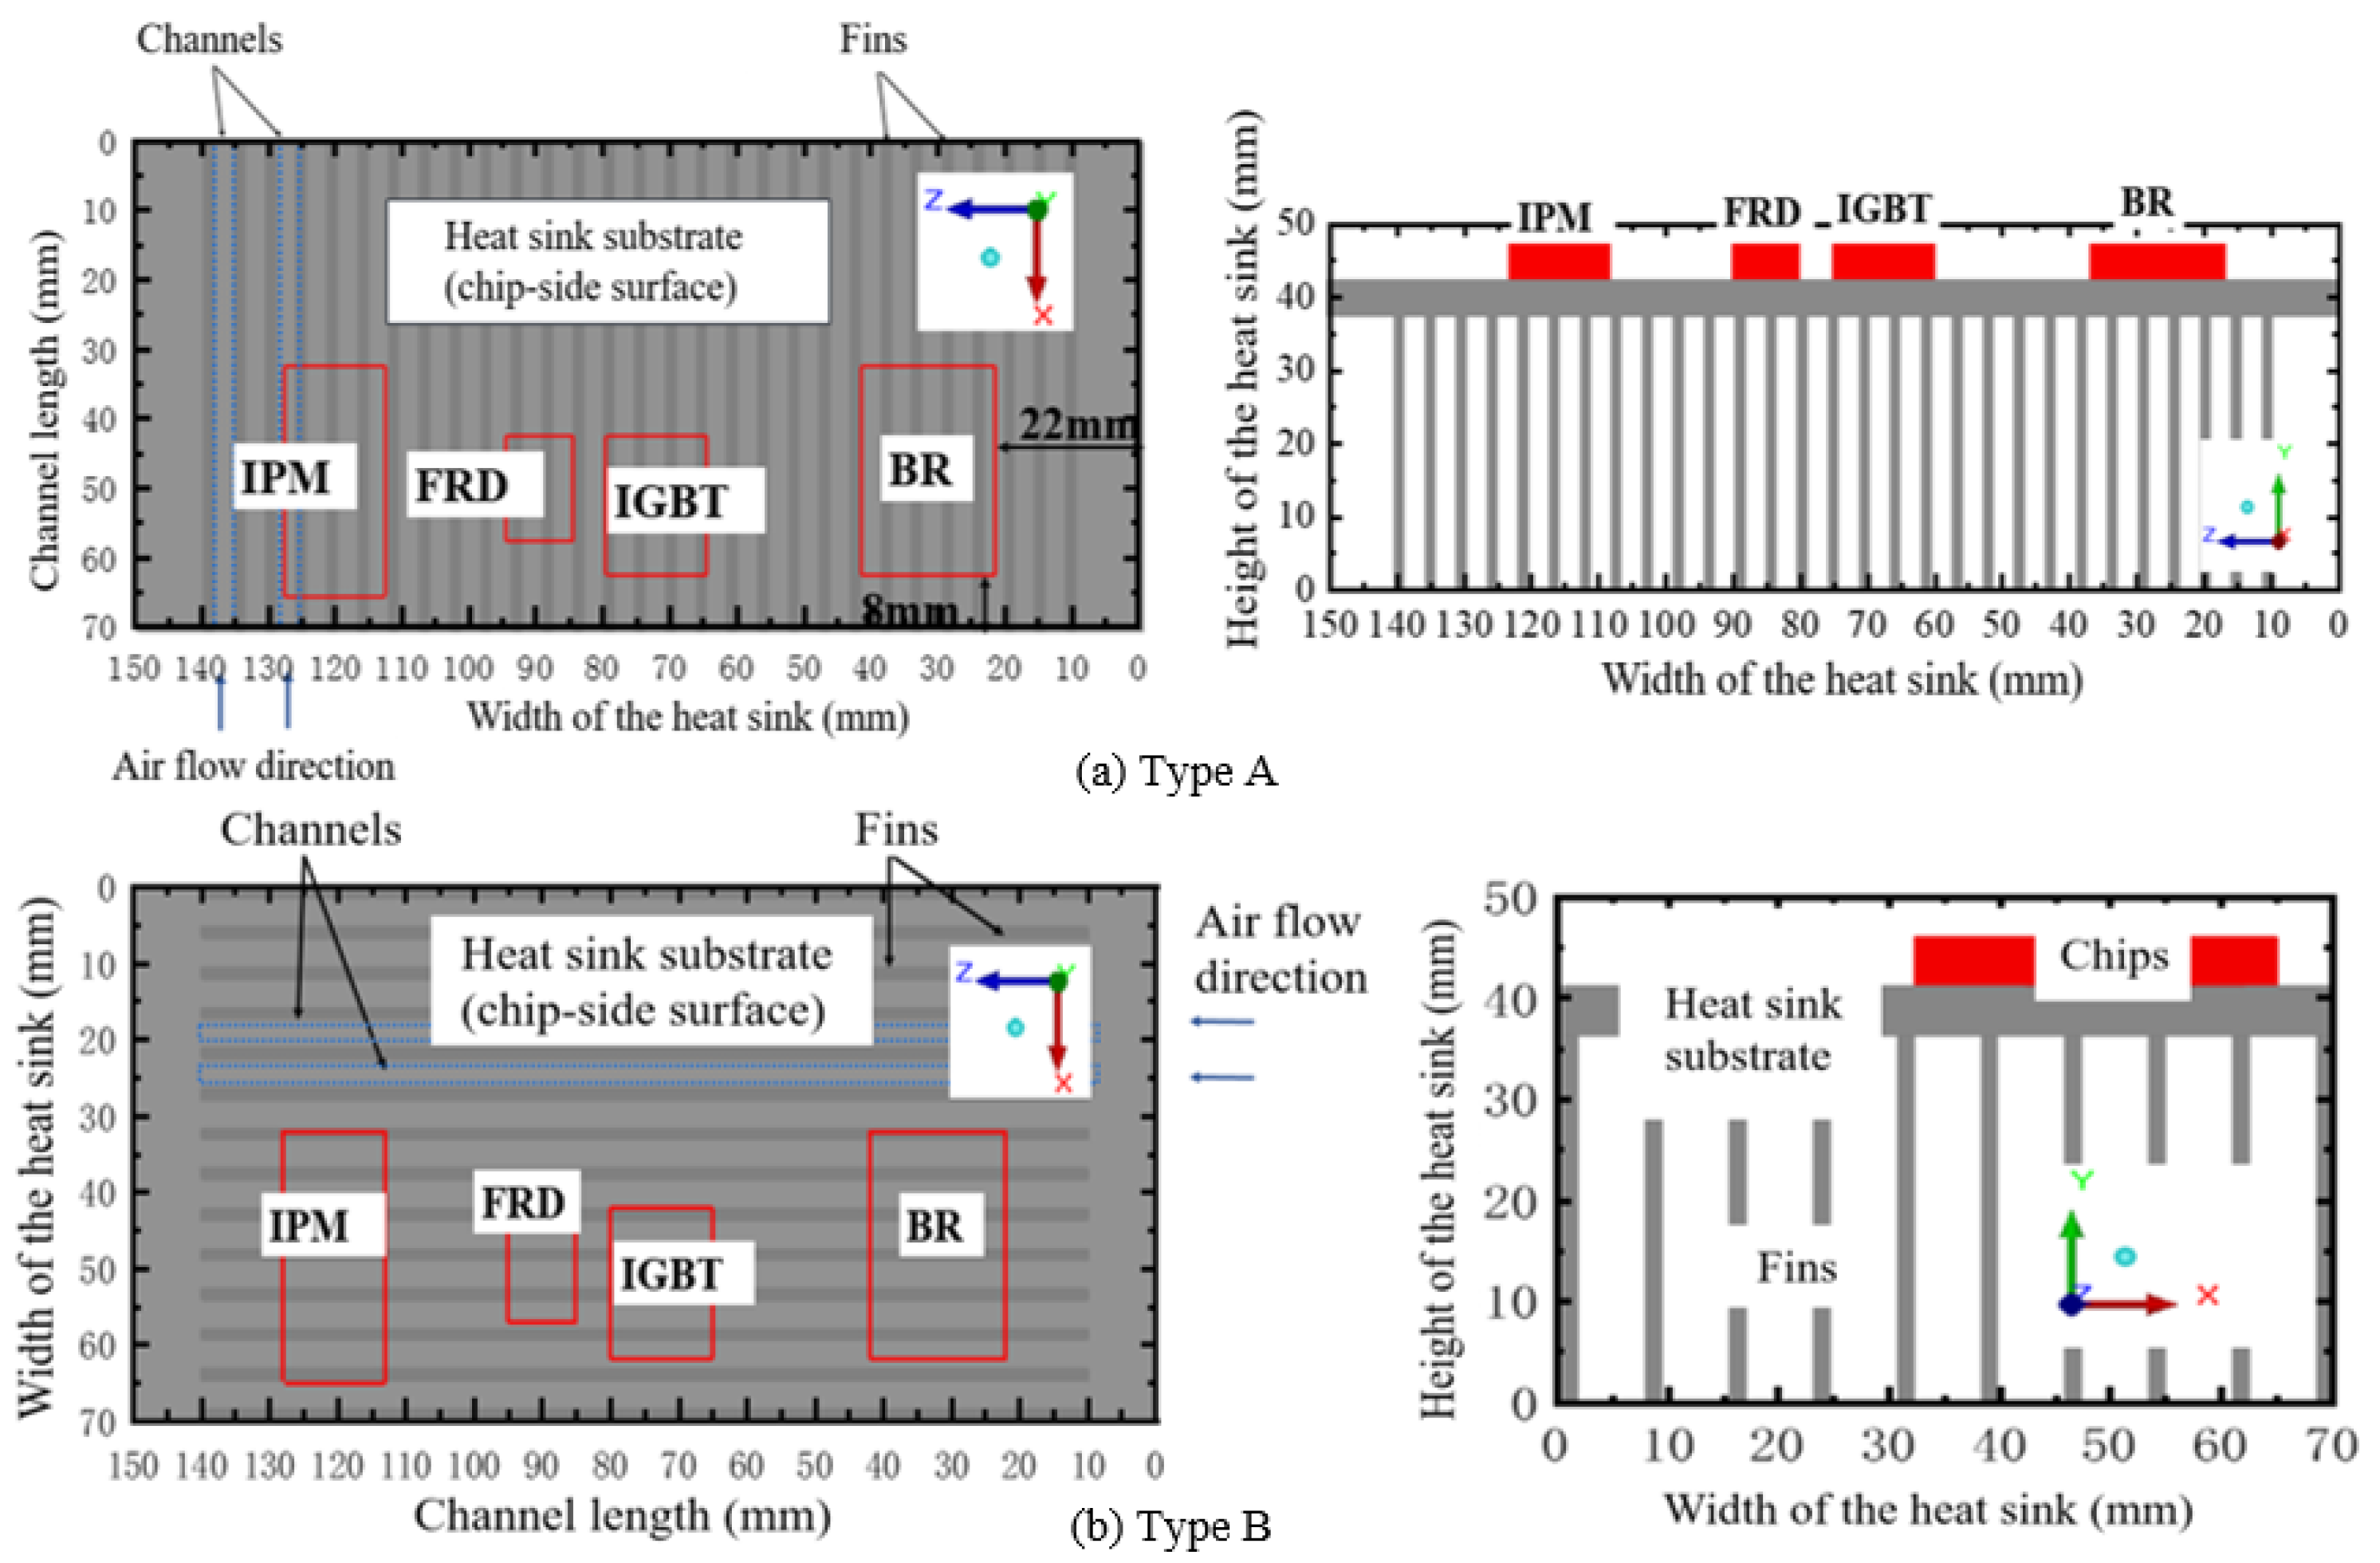
3.1. Model of Plate-Fin Heat Sink

The electronic control module of the air conditioner is composed of an intelligent power module (IPM), fast recovery diode (FRD), insulated gate bipolar transistor (IGBT), and bridge rectifier (BR), which generate significant heat. For instance, the IPM manages power conversion and compressor control, generating heat due to high-frequency switching losses, while the FRD facilitates rapid current commutation in AC–DC conversion, dissipating heat from reverse recovery losses. Similarly, the IGBT drives the motor control with high-voltage switching, and the BR converts AC to DC, contributing heat from resistive losses. In this work, a plate-finned heat sink was used. The heat sink substrate is in direct contact with these chips. The other side of the heat sink is machined into the fins. There is no contact thermal resistance between the fin and substrate. The passage between the adjacent fins forms a channel for cooling air. In order to facilitate the numerical analysis process, the following assumptions are introduced in the solution process using the ANSYS ICEPAK (2023 R1) software:
(1)
The physical property parameters are assumed to be constant [17].
(2)
The effects of viscous dissipation and gravity are neglected.
(3)
The flow can be thought of as a continuum.
(4)
When analyzing the heat dissipation process of the equipment, the heat conduction and forced convection heat transfer of the equipment are mainly considered [12].
The two-resistances model [18,19] is used to describe the heat dissipation path of chips. The heat will be dissipated along the upward and downward paths, which are called path 1 and path 2, respectively, as shown in Figure 1.
The electronic module chip specifications are shown in Table 2, including chip type, thermal resistance, power consumption, size, etc. Figure 2 shows the relative position of each chip. Rjh denotes the thermal resistance between the heat source junction and the heat sink, while Rja denotes the thermal resistance from the heat source junction to the ambient air. It is possible to obtain these by referring to the materials provided by the chip manufacturer. Q denotes the power consumption of the chip, and L, W, and H denote the length, width, and height of the chip, respectively.

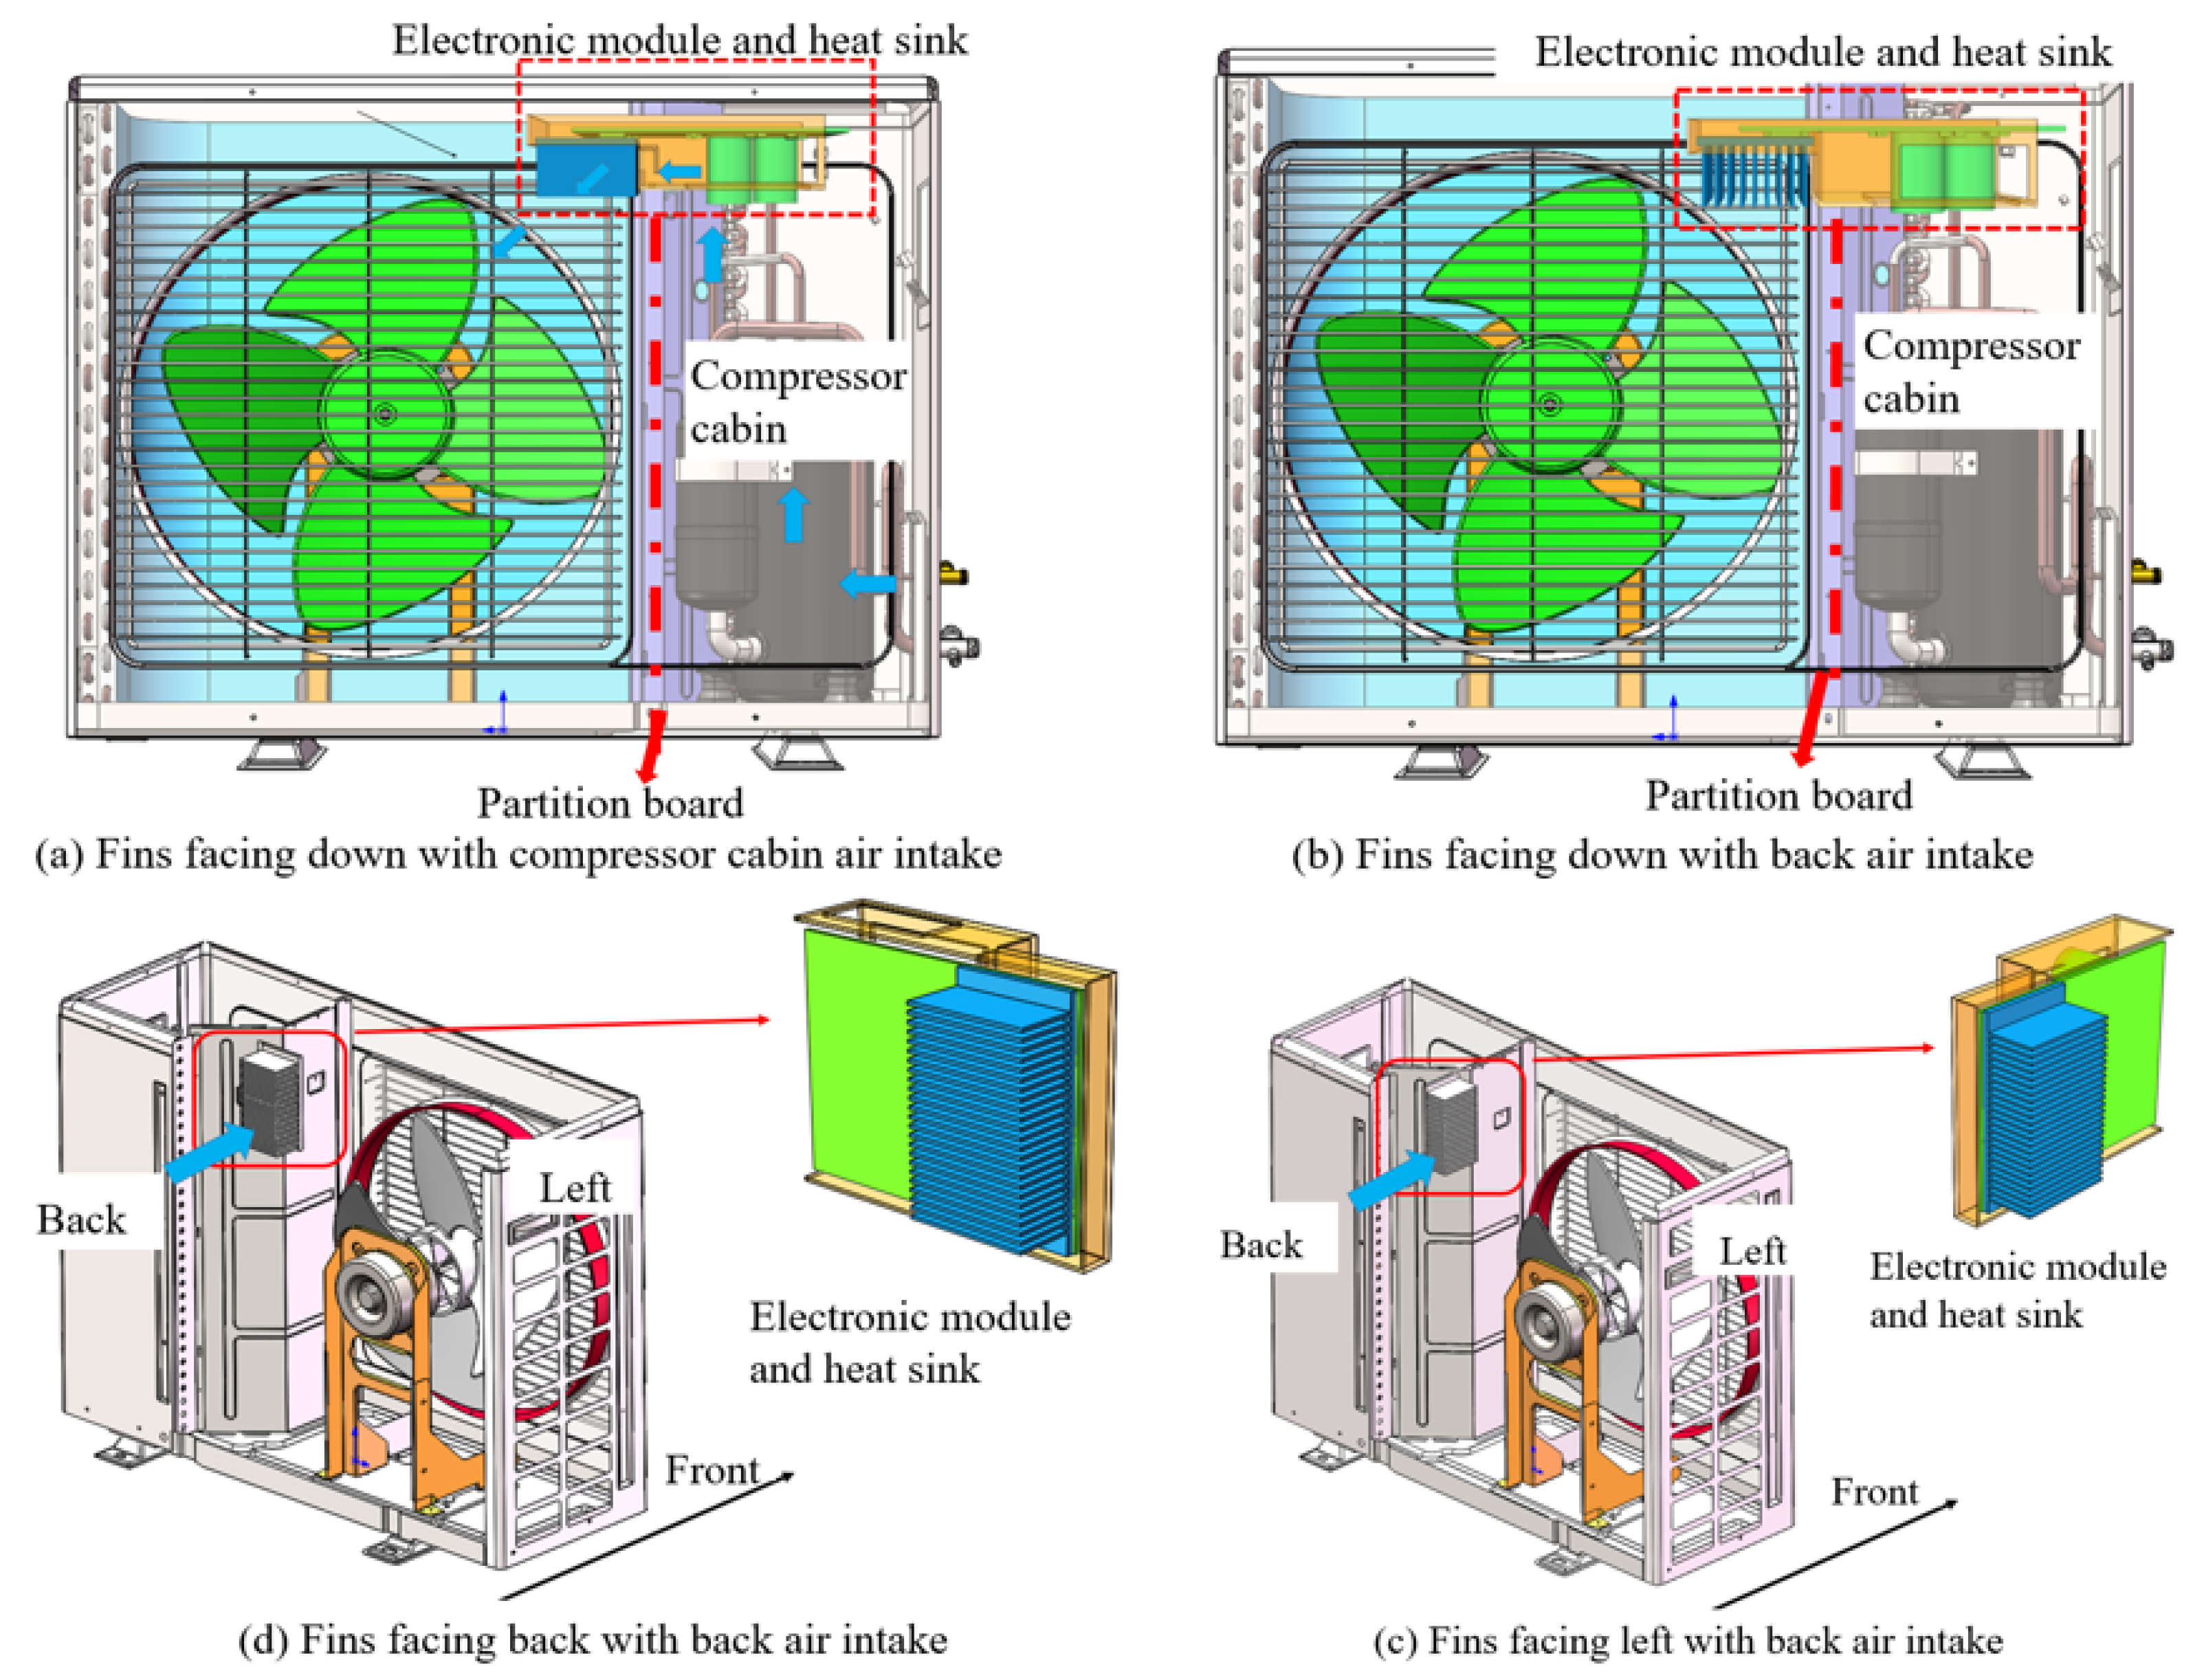
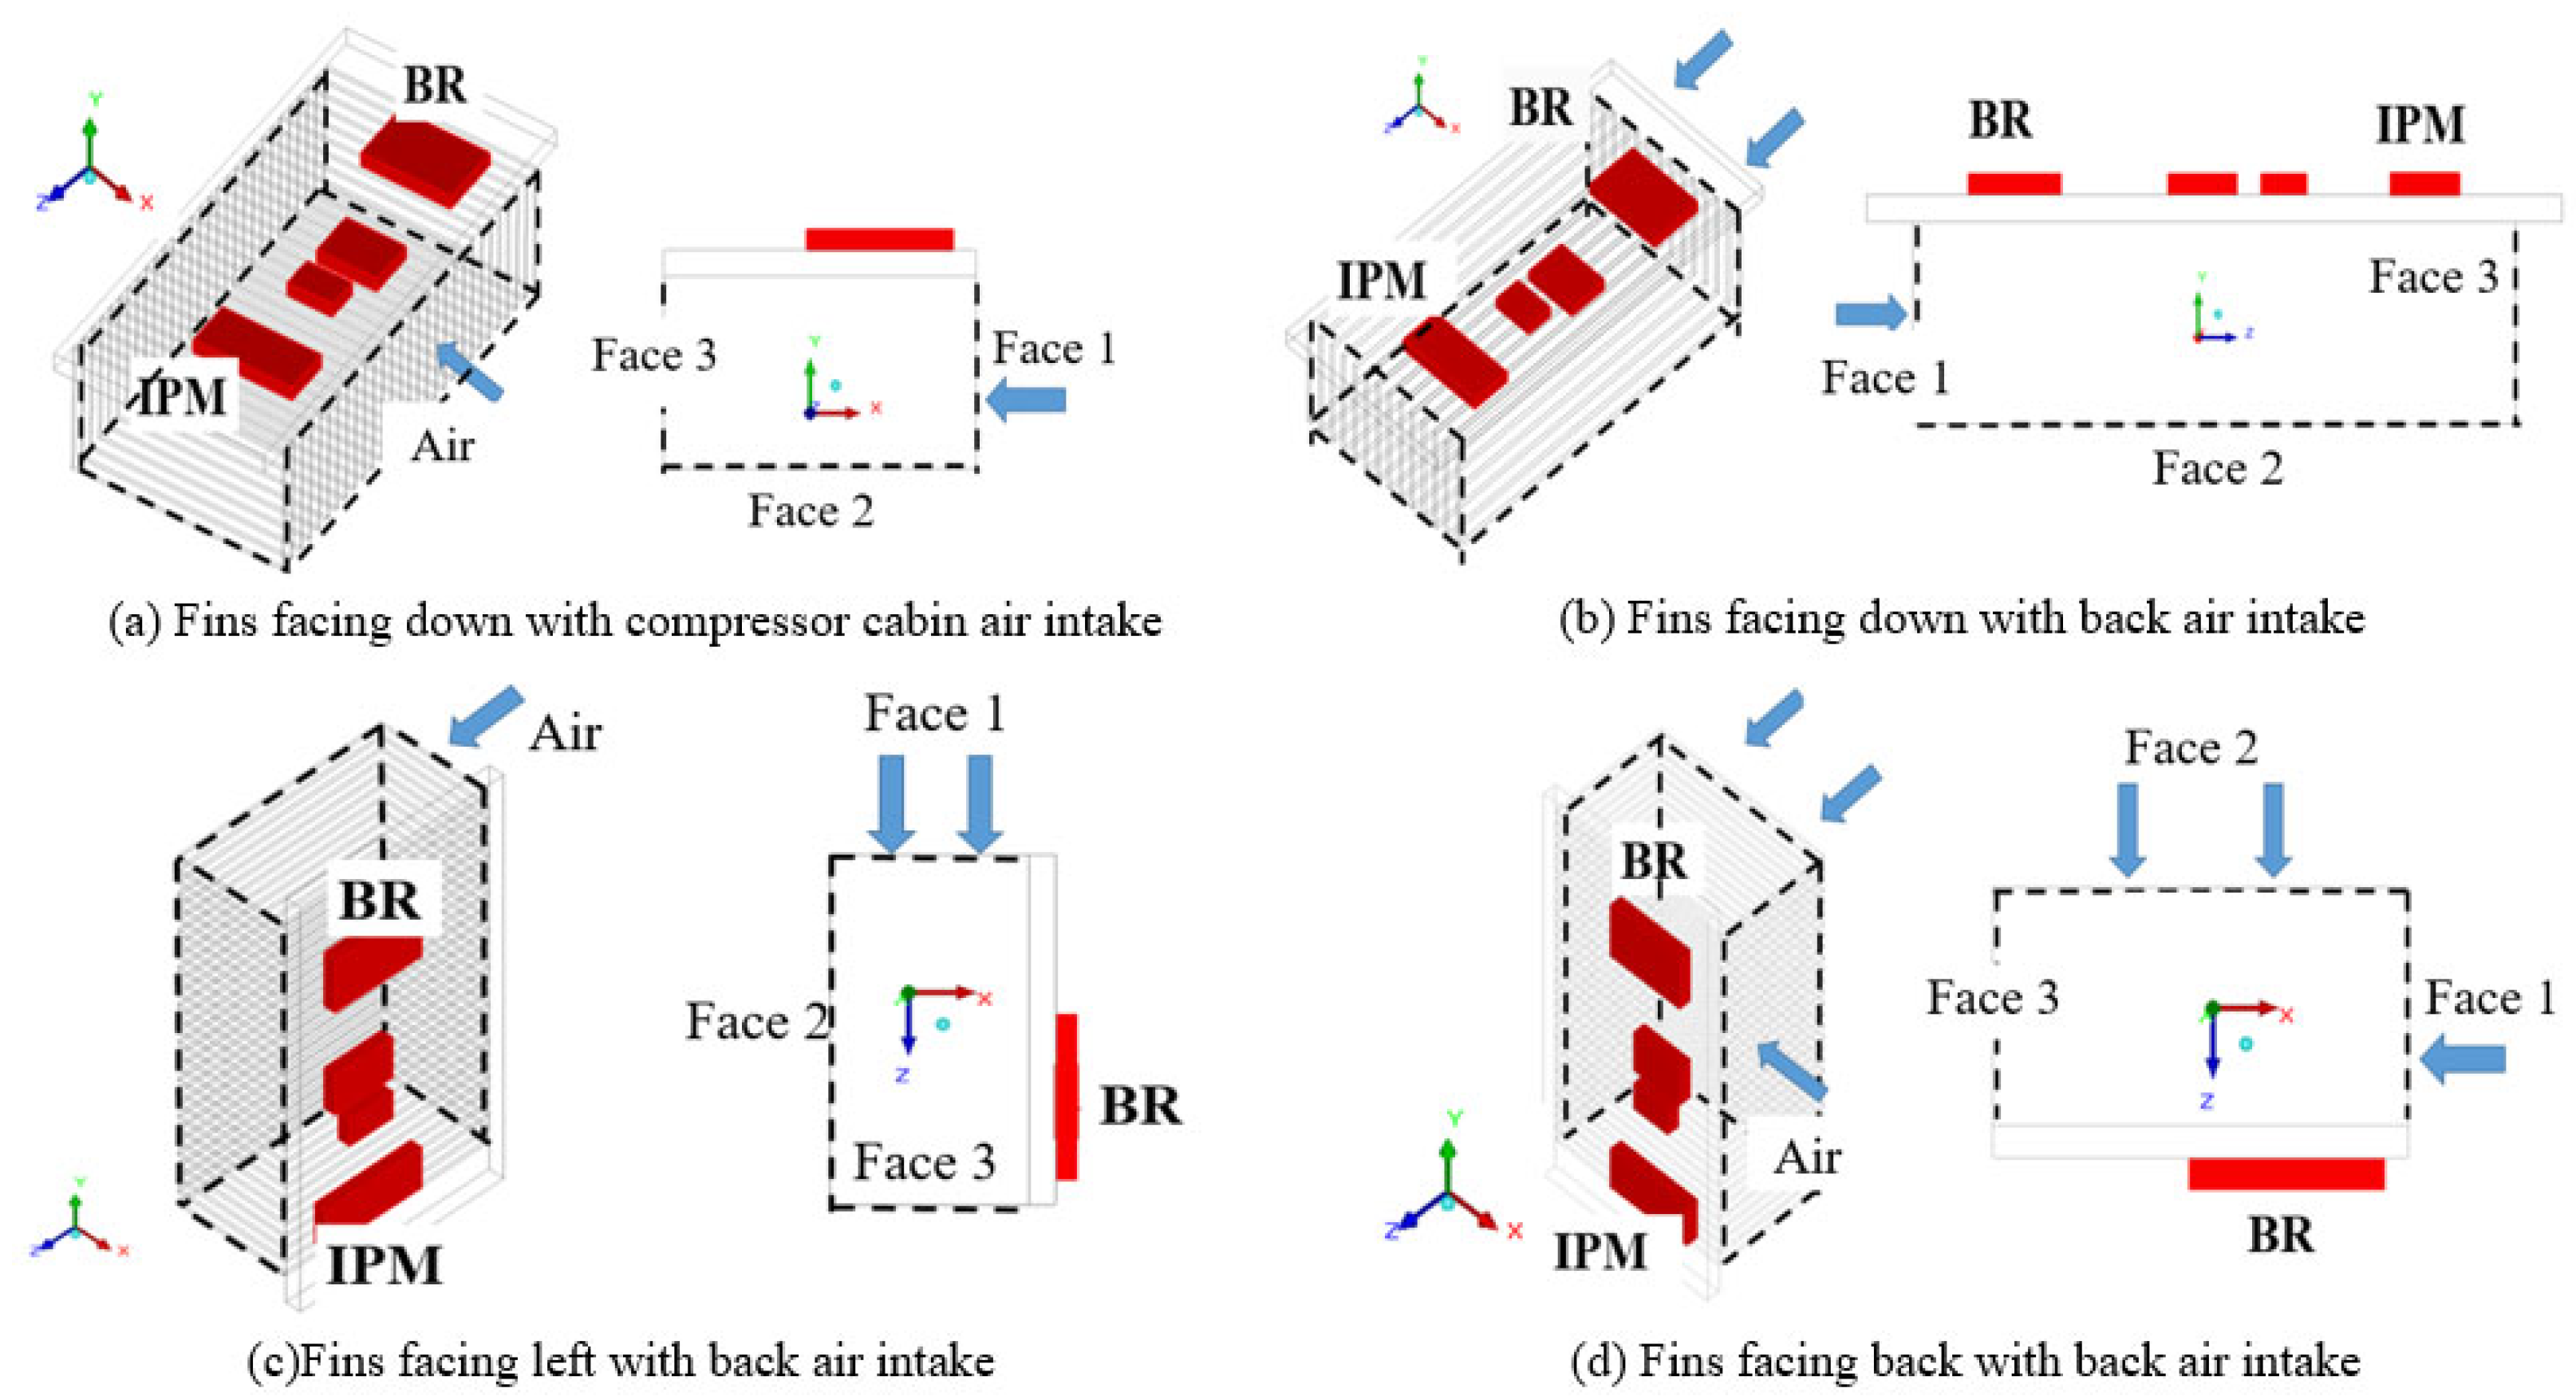
3.2. Different Heat Dissipation Cases for the Electronic Module

The electronic control module is a fundamental component of the air conditioner. The installation positions of the electronic modules and radiators in the outdoor units of air conditioners have a significant impact on the heat dissipation performance. Therefore, after evaluation, four typical cases were selected for numerical and experimental studies.
Case I: Figure 3a shows the intake of air from the compressor compartment with the fins facing down. A fan is employed to create a negative pressure environment, enabling the cooling air to enter the system through the air grille on the right side panel of the outdoor unit and subsequently into the heat sink through the compressor compartment and the electronic control box. In this case, the circuit board is positioned horizontally.
Case II: By changing the direction of the radiator channel in case I, the cooled air enters the fan compartment from the outside through the outdoor heat exchanger and subsequently flows through the heat sink. The fins are facing down and the rear air intake is shown in Figure 3b.
Case III: The third case utilizes the negative pressure inside the fan compartment to drive air from the outdoor heat exchanger to the heat sink. Contrary to the first two cases, in this case the normal direction of the substrate is perpendicular to the axial direction of the fan, as shown in Figure 3c.
Case IV: The fourth case also utilizes the negative pressure inside the fan compartment to drive air from the outdoor heat exchanger to the heat sink. In contrast to case III, the substrate in case IV is positioned vertically, and the normal direction of the substrate is the same as the axial direction of the fan, as shown in Figure 3d.
The four cases differ in the incoming temperature and direction of the air flow into the heat sink. The advantage of case I is that the temperature of the compressed indoor air is relatively low. However, this design also presents a challenge, as it may cause rainwater to enter the electronic control box from the fan compartment when the fan is reversed, and therefore, the installation of a windscreen in the electronic control box is required.
Type A heat sinks are used in cases I, III, and IV, while a type B heat sink is used in case II. Figure 4 and Table 3 present the specifications of heat sink types A and B. The two heat sink variants maintain identical substrate dimensions, but exhibit distinct channel directions. Table 4 presents the installation information for the four cases. The heat sink and fins are designed as an integrated monolithic structure, fabricated from 6063-T5 aluminum alloy with a thermal conductivity of 209 W·m−1·K−1.

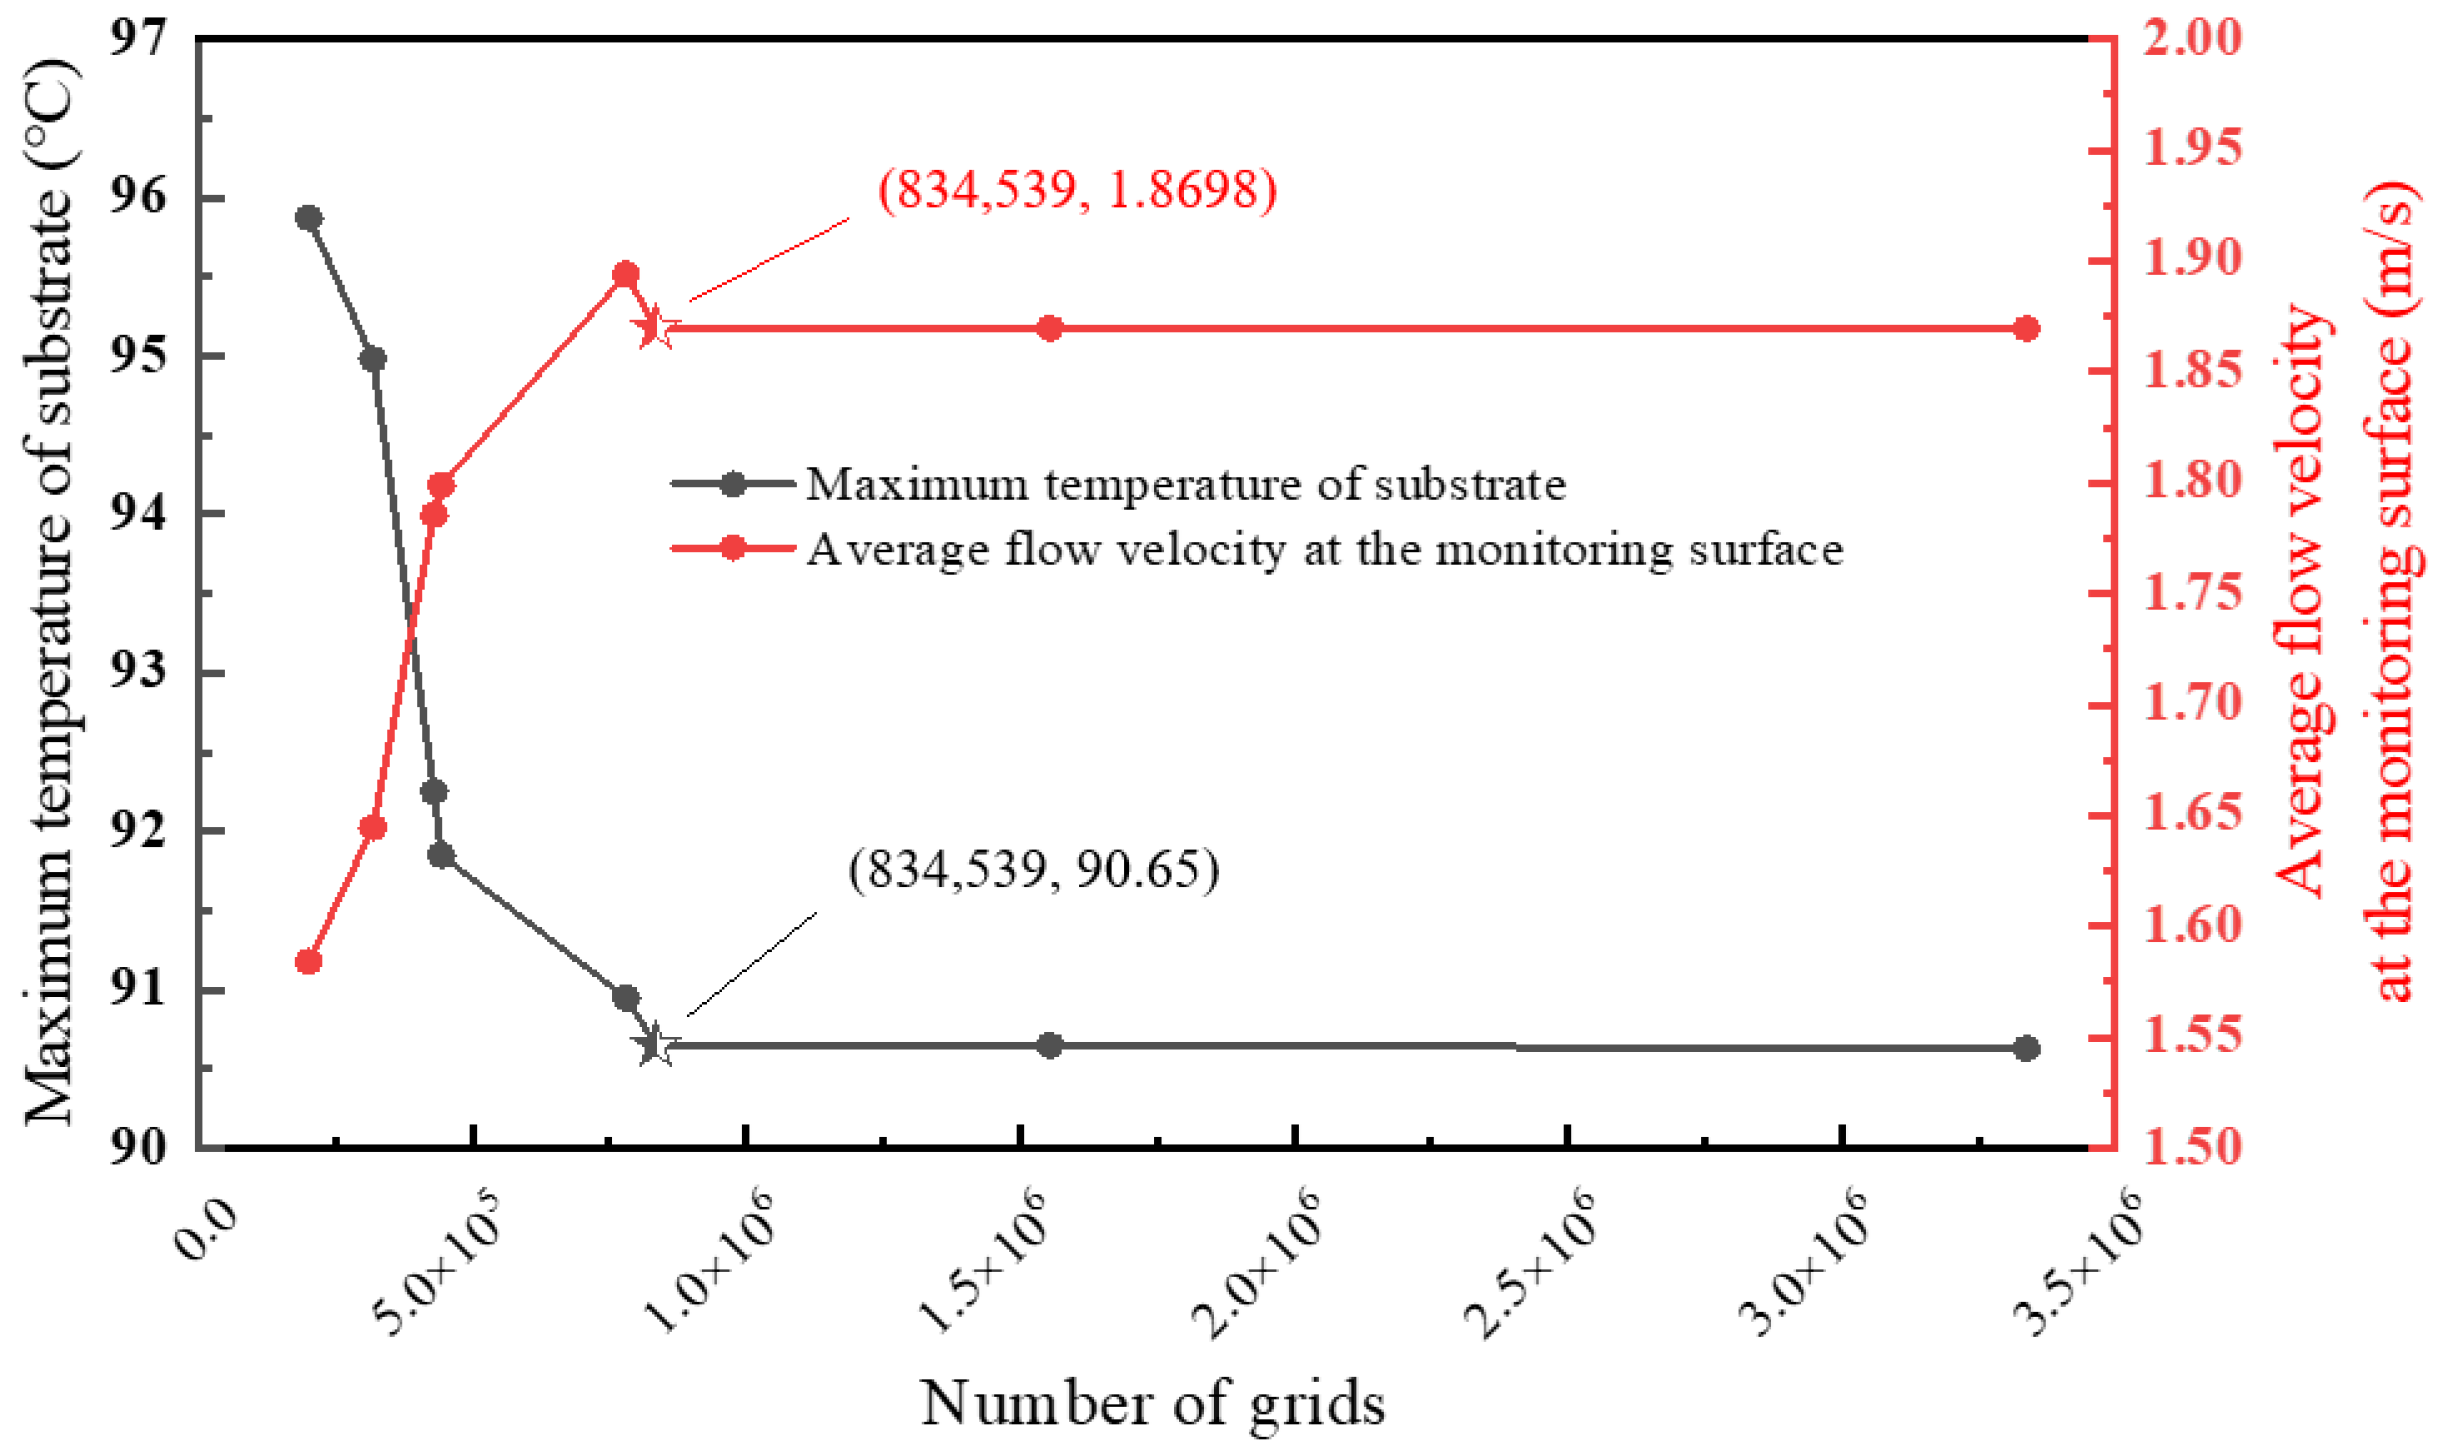
3.3. Computation Domain, Boundary Conditions, and Grid Independency

In order to reduce the influence of the boundary of the simulation area on the simulation result, the simulation area is extended. The inlet and outlet of the outdoor unit are extended by 1 m and 5 m, respectively, and the height remains unchanged. Based on the experimental results, the temperature increase of air varies across different components. As the air flows through the compressor and enters the heat sink, its temperature increases by 3 °C. However, as the air flows through the outdoor heat exchanger and enters the heat sink, its temperature increases by 8 °C. Under controlled testing conditions with a 45 °C ambient temperature, the boundary conditions of the computational domain exhibit variation in relation to position: Inlet 1 (located at z = 0 mm) and Inlet 2 (at x = 0 mm) both maintain a temperature of 53 °C, while Inlet 3 (positioned at x = 2780 mm) operates at 48 °C, as shown in Figure 5.
Due to the limitation of current computing power, direct numerical simulation (DNS) and large eddy simulation (LES) methods cannot be fully applied to engineering problems. For general engineering applications, simulations of Reynolds mean Navier–Stokes (RANS) equations are more common. Considering the RANS simulation adopted, the k-epsilon turbulence model has a simple formula, good robustness and good prediction performance, so it is considered to be a suitable choice for analyzing the heat dissipation problem of the electronic module of an air conditioner [20].
In order to ensure that the calculation results are not affected by the grid division results, multiple groups of grid independence verification are carried out, and a monitoring surface is established at the 1m position of the outdoor unit fan outlet. This monitoring surface allows the grid irrelevance to be assessed by looking at the average flow velocity.
The RANS model is used directly to solve the boundary layer without considering the wall function. As shown in Figure 6, when the number of grids reaches 830,000, the difference between the average speed of the monitoring surface and the calculated results of 3 million grids is less than 1%. At the same time, the maximum heat sink temperature change is negligible (<1%), indicating that the grid division has no influence on the calculation results.

4. Results and Discussion

4.1. Validation of the Simulation Model

In order to verify the accuracy of the simulation model, the temperature of the electronic control module of the outdoor unit was experimentally tested, and the chip temperatures in four cases were measured. The results are shown in Figure 7. Among the four chips, the IPM has the highest temperature, followed by the IGBT. The difference between the numerical simulation and the experimental results is less than 1%. The experimental results are in agreement with the calculated results, which verifies the rationality of the modeling process for the simplification of outdoor unit components.

4.2. Comparative Analysis of Heat Transfer Coefficients

According to the experimental results, the heat transfer coefficients (HTCs) of the four cases can be obtained by Equations (3) and (4).
H T C = Q ˙ A chips Δ T
Δ T = T c h i p s T f , i n T f , o u t 2
where Achips is the total contact area between the four chips and the heat sink, (m2); Tf,out is the average temperature of air at the outlet of the heat sink, (°C); Tf,in is the average temperature of air at the inlet of the heat sink (°C); and Tchips is the average temperature of the four chips (°C). The HTC quantifies the heat exchange capability between the chip and the cooling air. Table 2 shows the geometry of the chip and its corresponding heat dissipation power.
The experimental test results are shown in Table 5. Compared with the other three cases, based on the same contact area between the chip and the substrate, the heat transfer coefficient of case IV is the largest, reaching 316.5 W·m−2·°C−1, so the corresponding maximum chip temperature is the lowest.
The heat transfer process mainly includes the conduction inside the heat sink and the convection between the heat sink surface and the air flow. The numerical simulation results can show the distribution of the temperature field and velocity field in the heat transfer process.

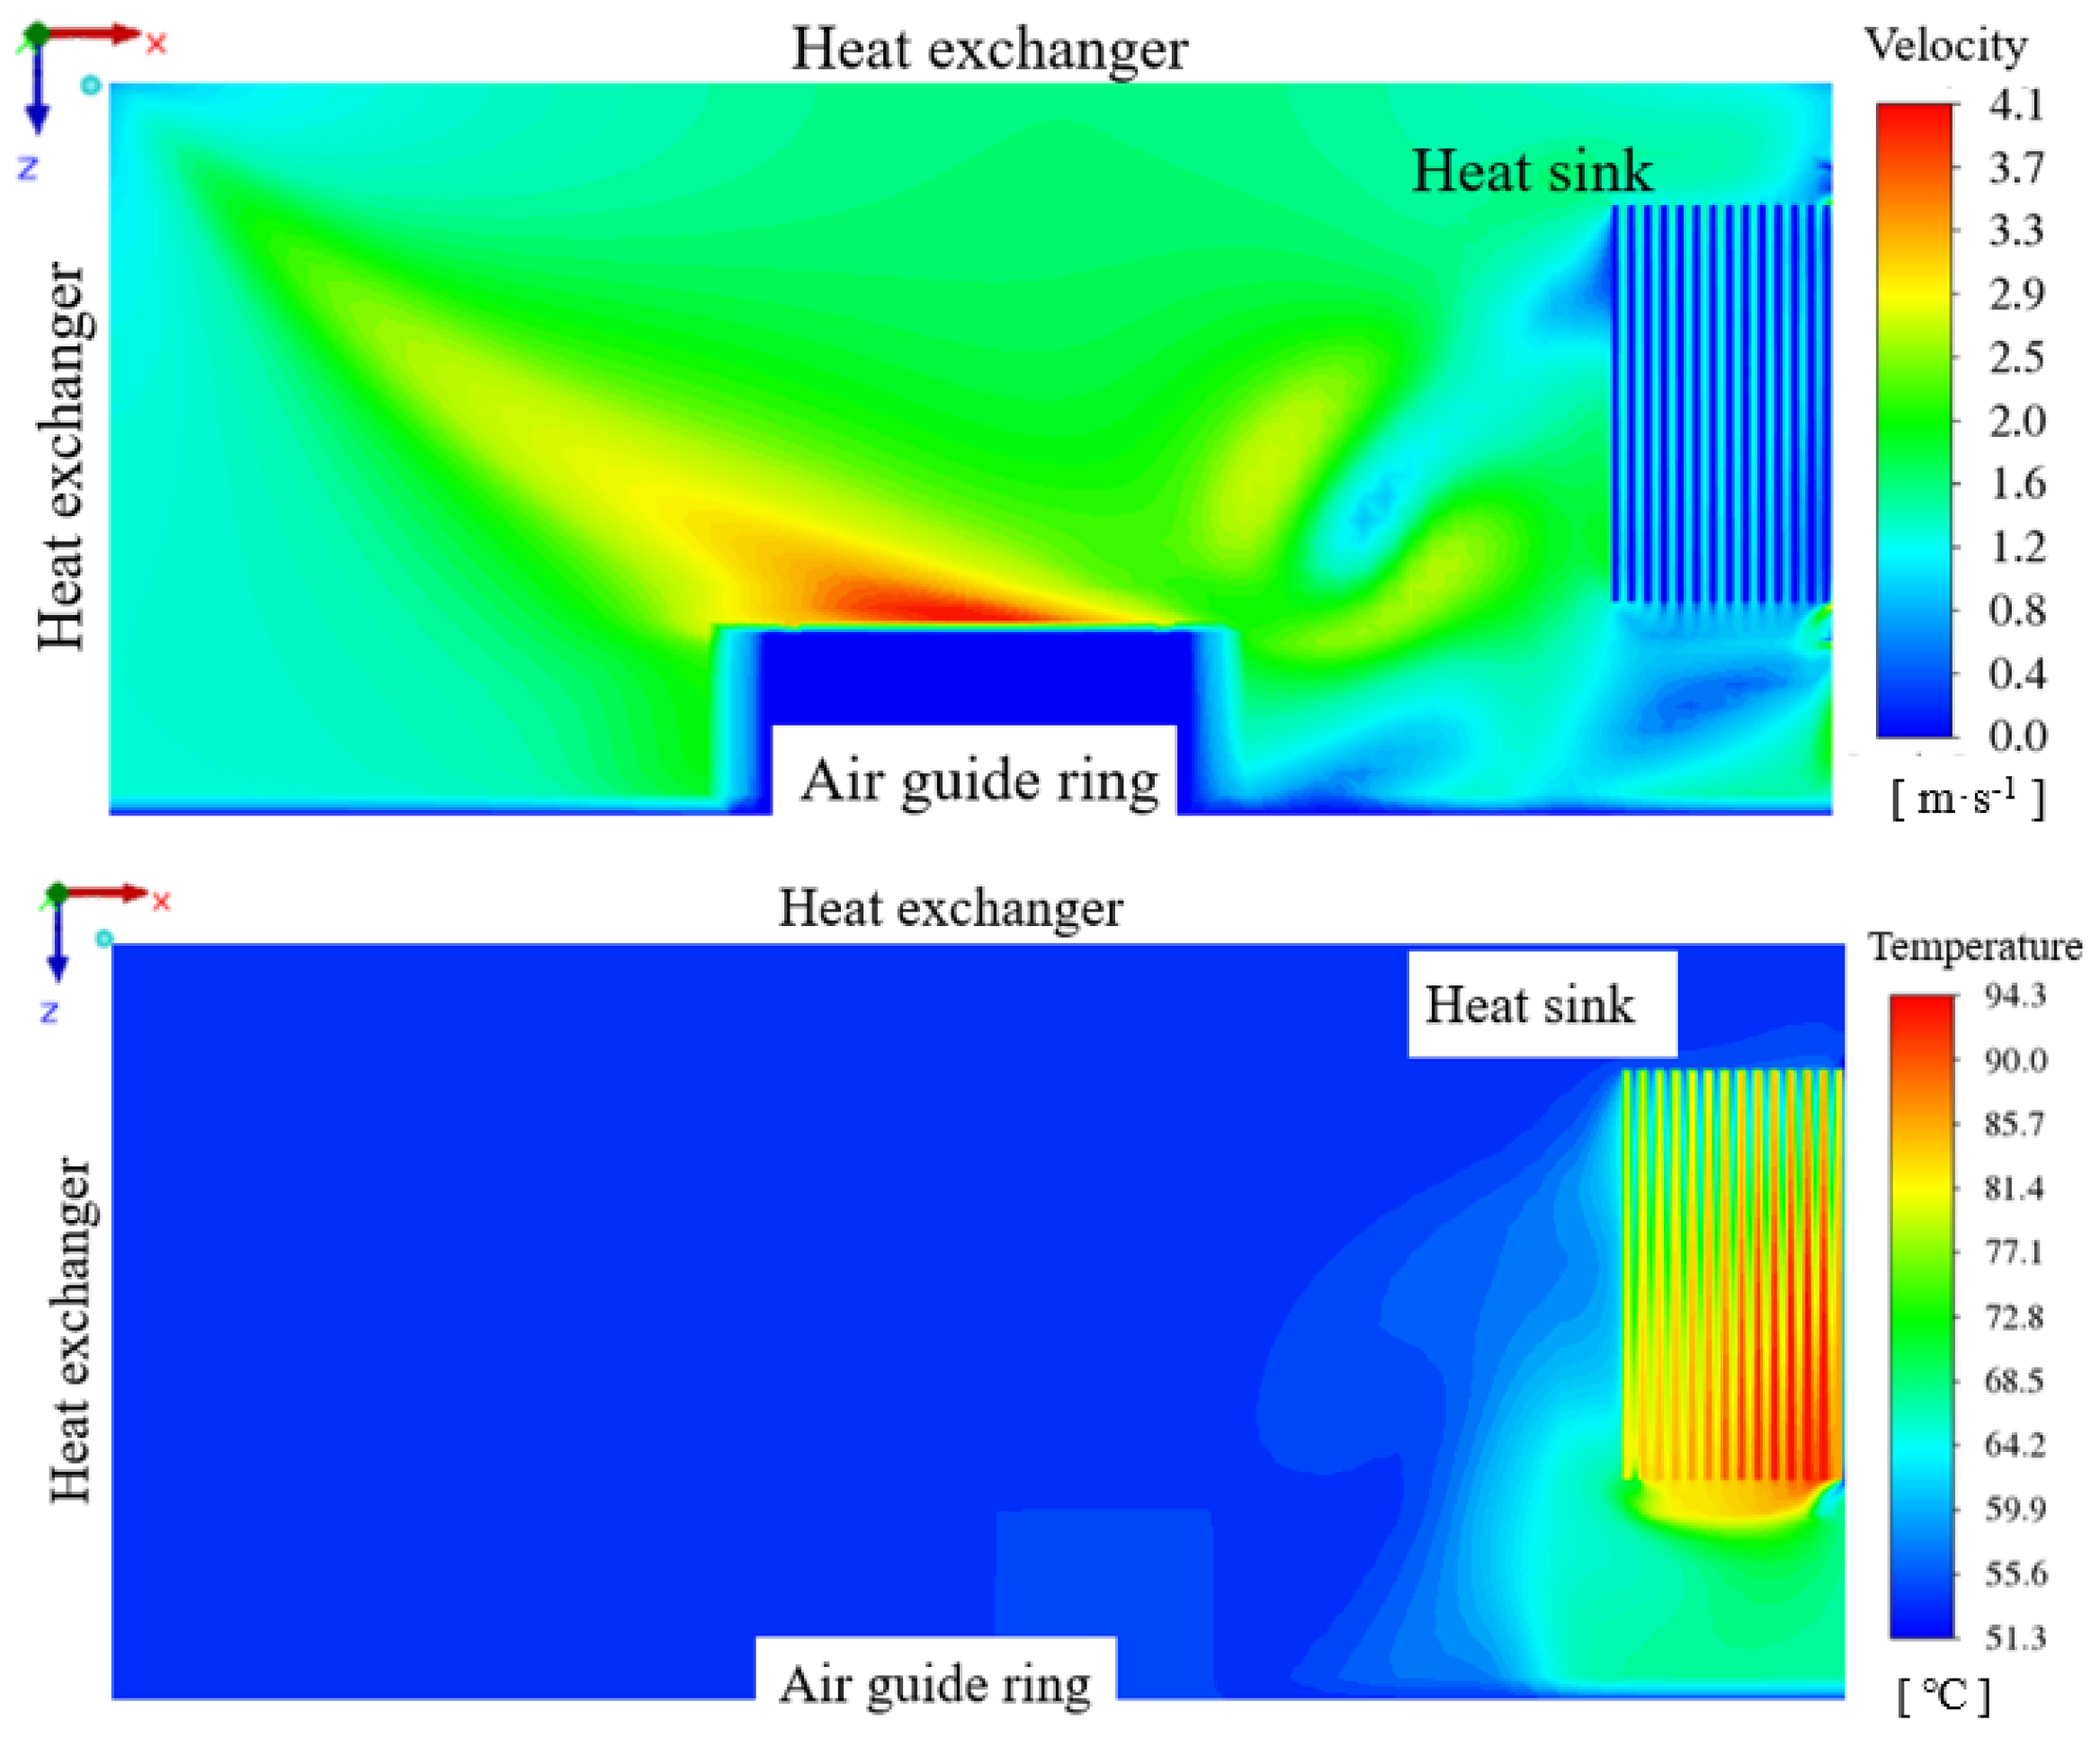
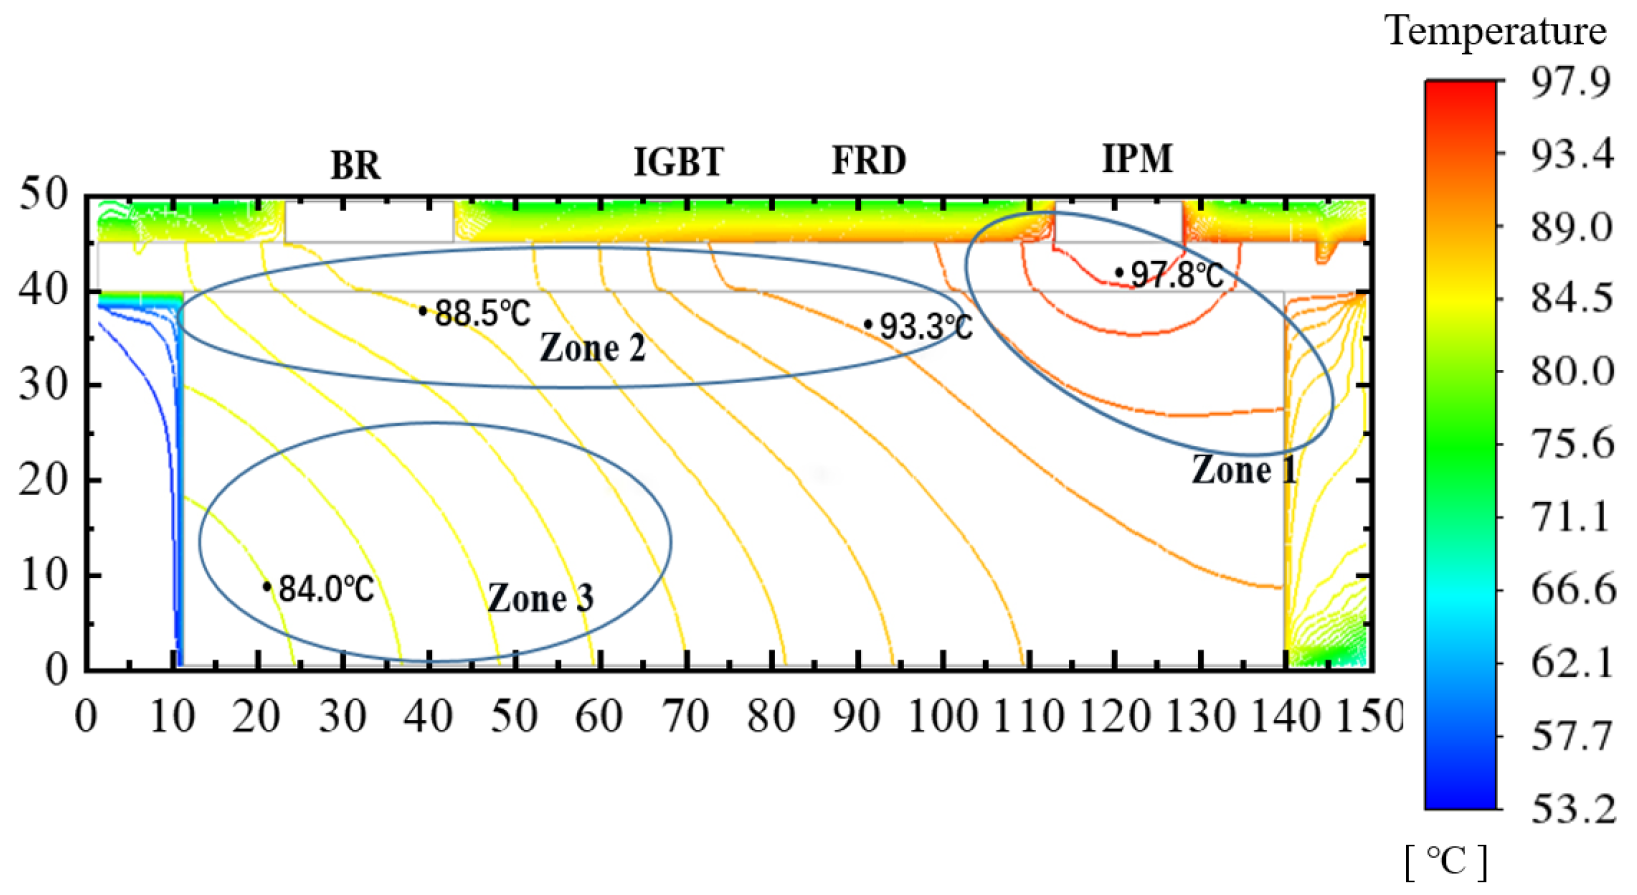
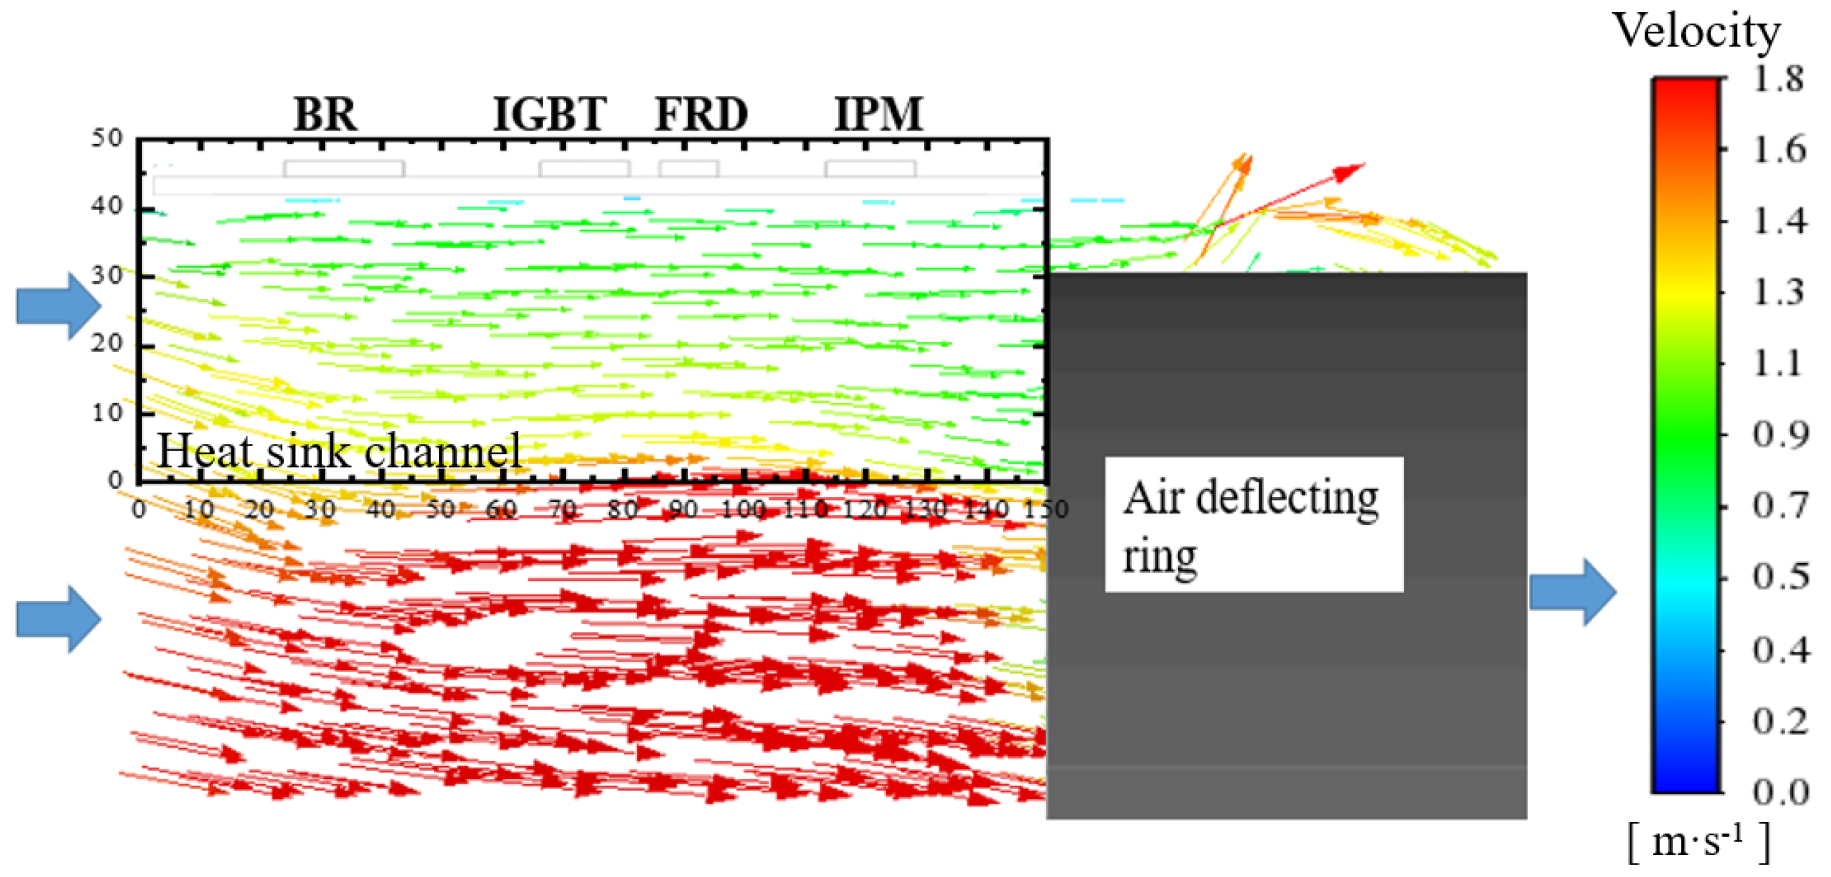
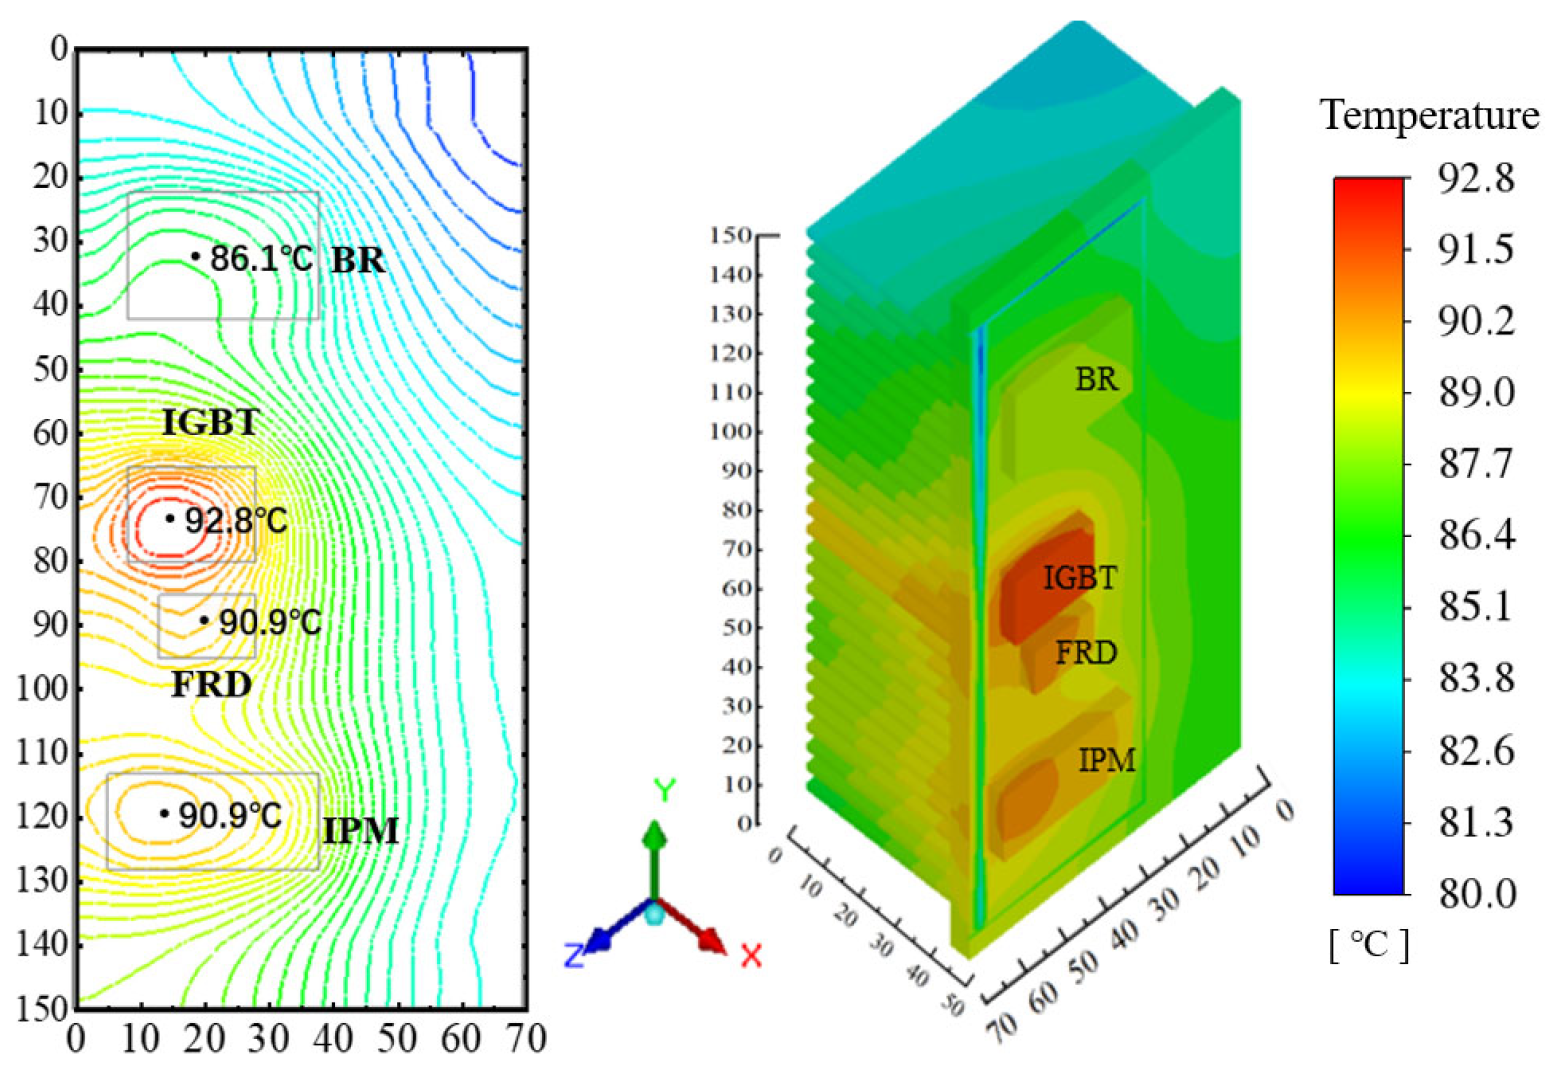
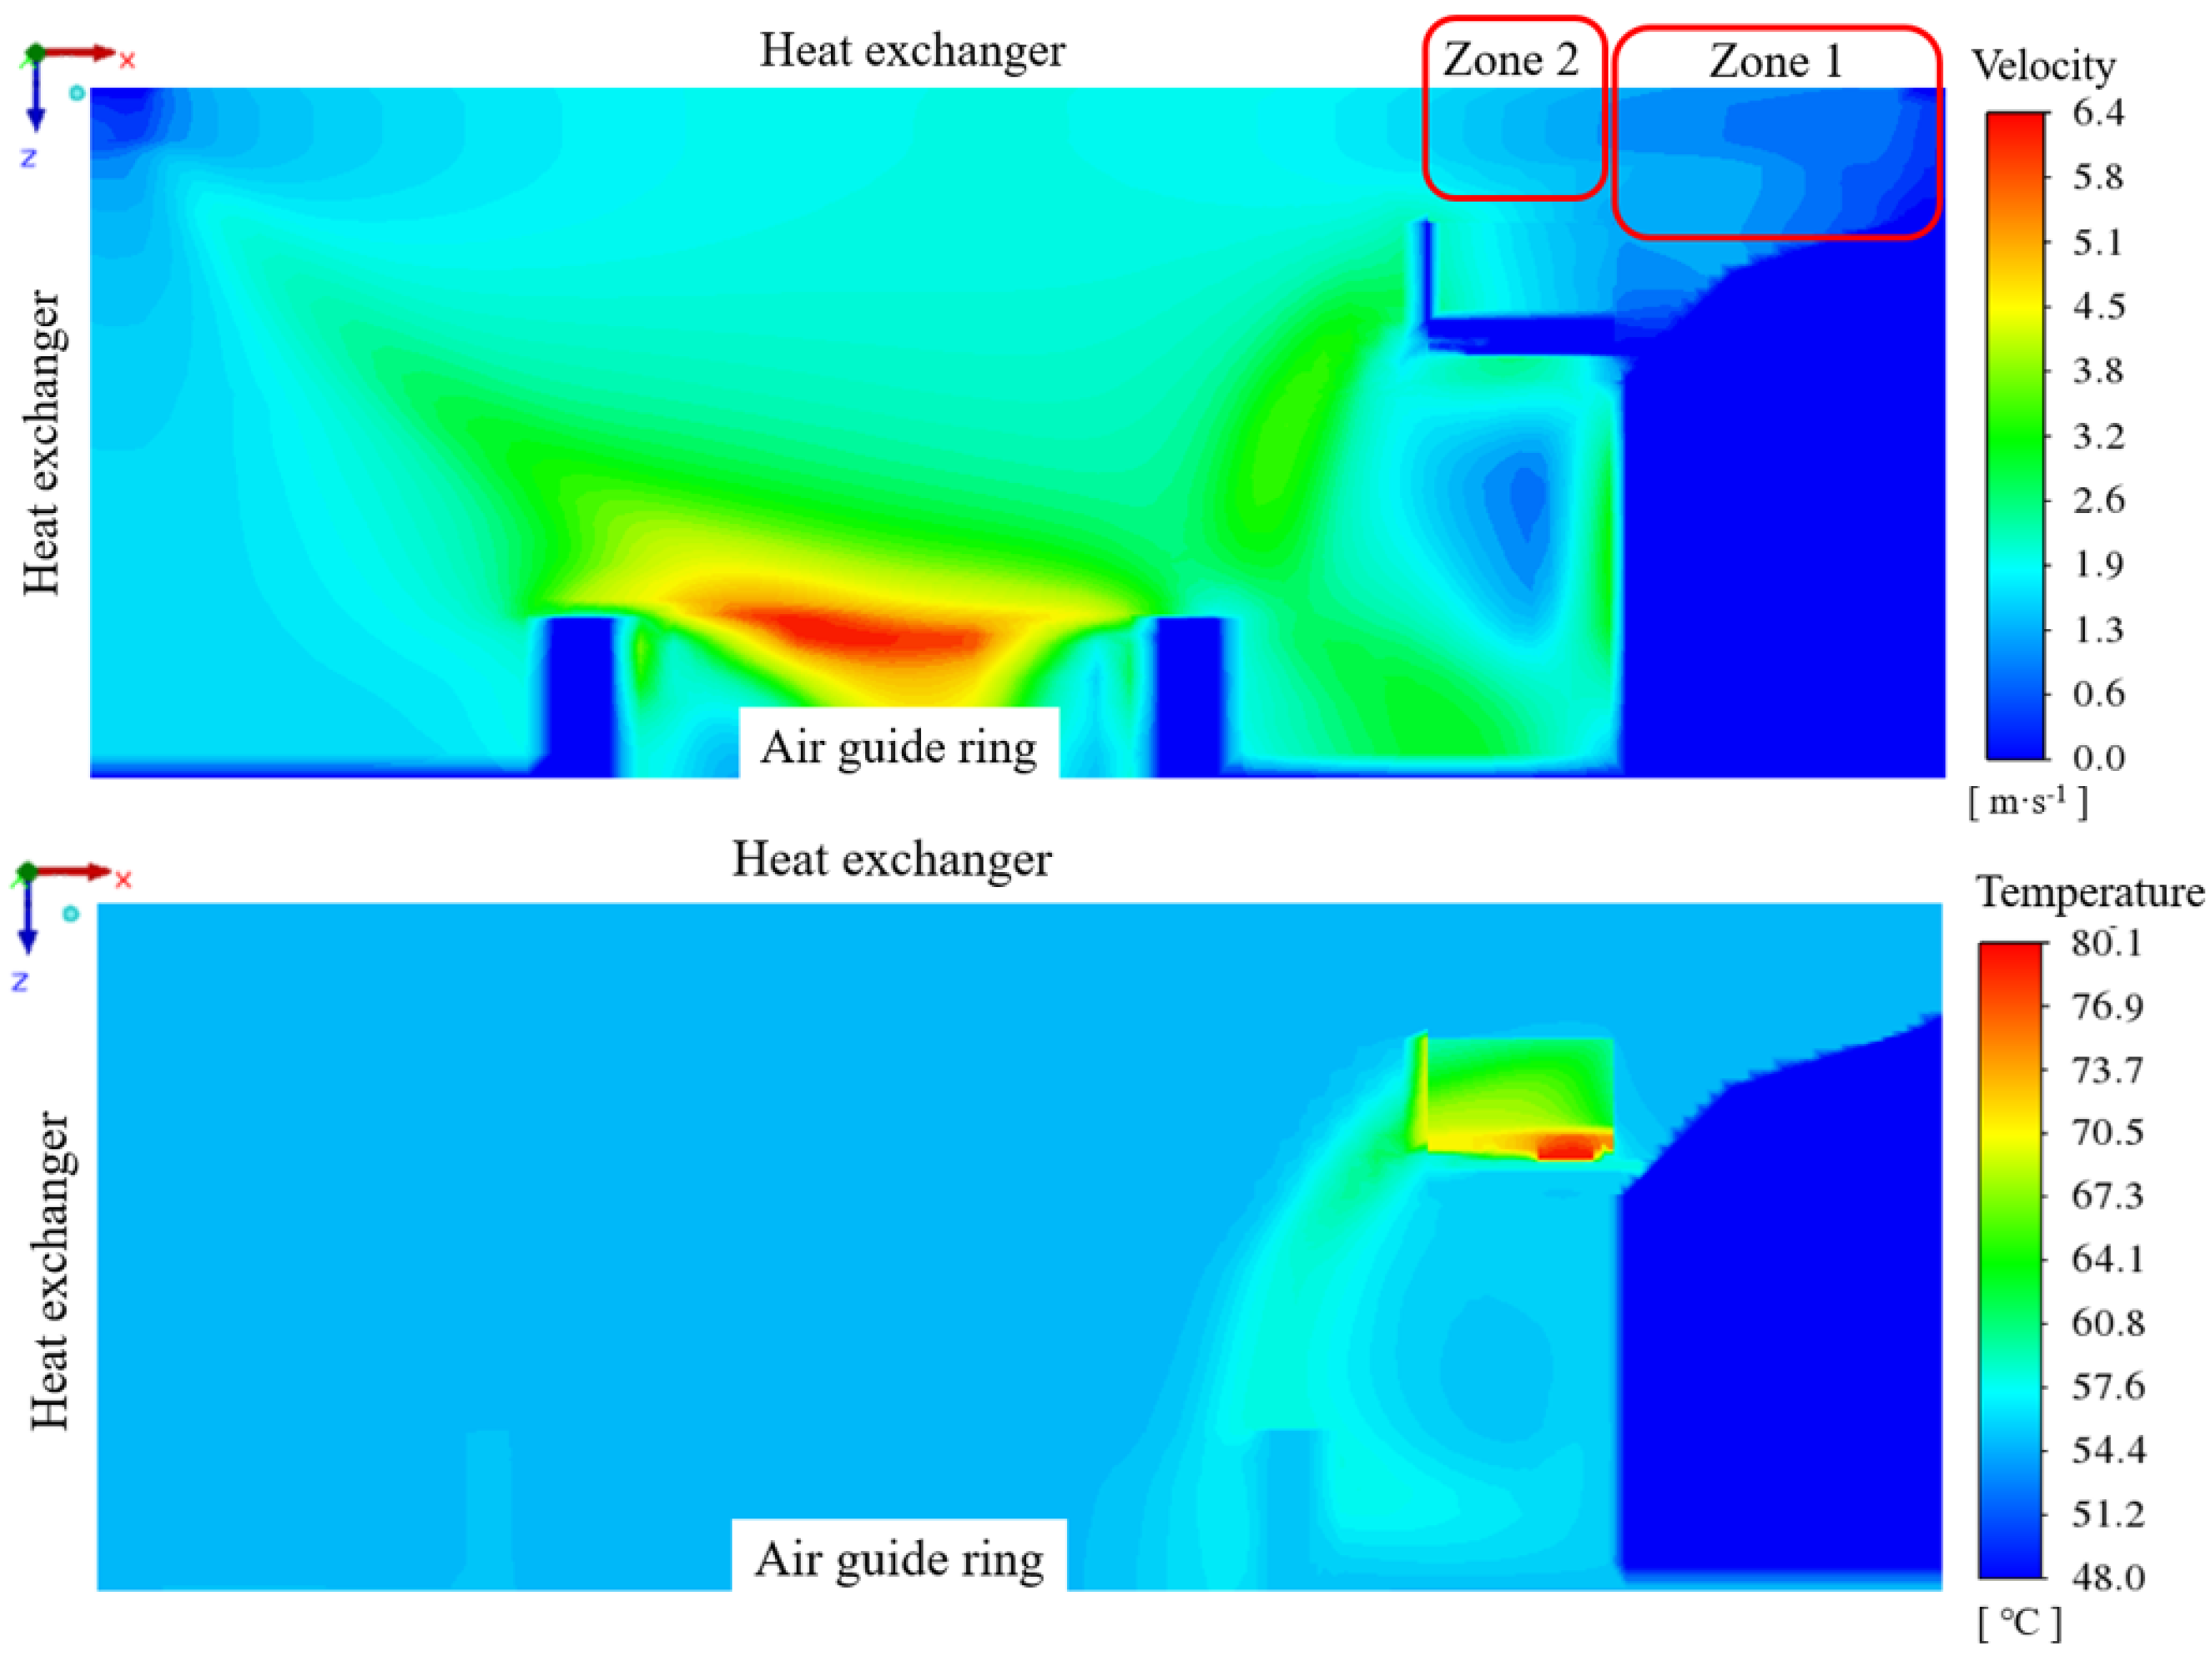
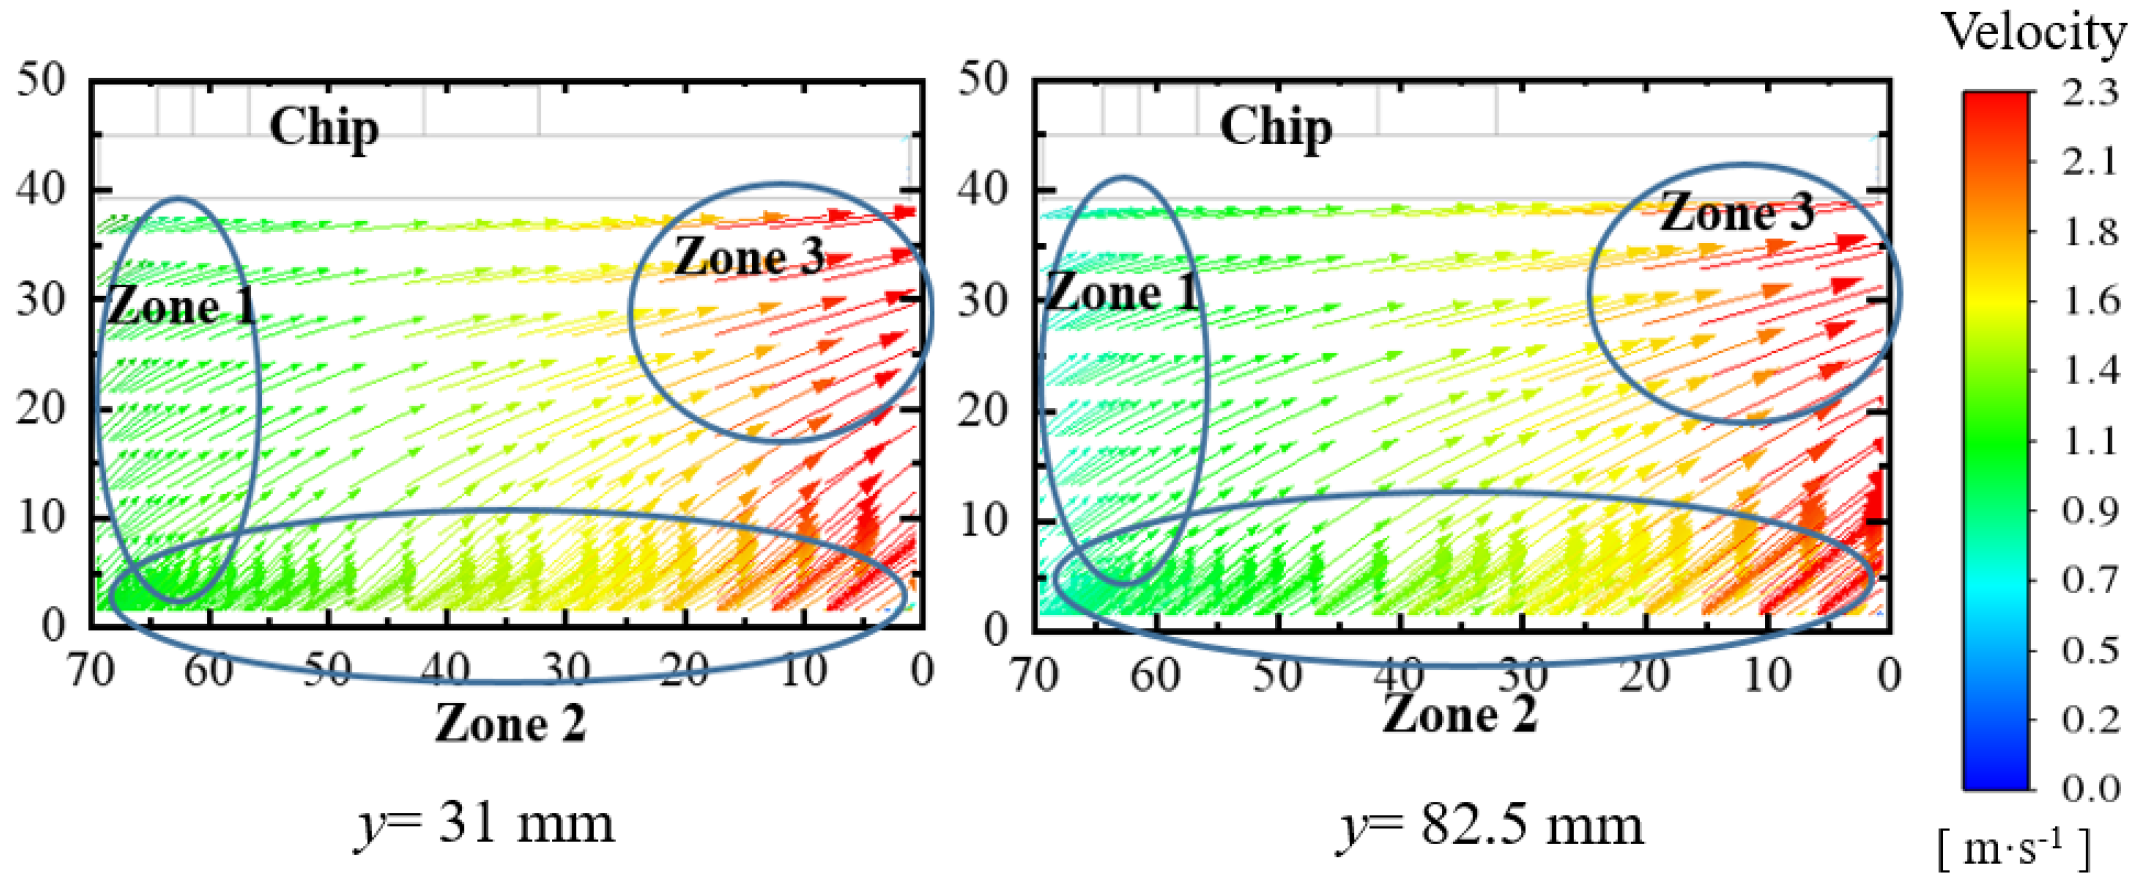
4.3. Fins Facing Down with Air Intake from Compressor Compartment

Figure 8 shows the velocity and temperature contour distribution of the air conditioner outdoor unit in the x–y plane in case I. The air flow direction in the heat sink is negative in the x-axis. By intercepting the simulation results in the x–y plane of case I, the non-uniformity of the airflow in the fan compartment can be observed. The velocity contour shows that most of the air enters the fan compartment from the outdoor heat exchanger, and the velocity distribution is asymmetrical due to the limited air intake on the right side of the partition. After zooming in on the velocity cloud around the heat sink, it can be seen that the airflow from the compressor compartment into the heat sink shows a curved trajectory due to the rain baffle.
In the temperature curve shown in Figure 8, the air temperature in the fan compartment is maintained at 53 °C, while the air temperature in the compressor compartment is 48 °C. The most significant temperature changes are concentrated around the heat sink installation. As air enters the radiator from the right side of the partition, it gradually heats up and exits. The distribution of cooling air in the channel is uneven. Higher temperatures are observed in the part away from the substrate. This temperature distribution is related to the velocity distribution discussed above.
The temperature peaks around the chip, forming a distinct high temperature zone, as show in Figure 9. With the increase of the distance from the chip, the temperature of the heat sink substrate decreases gradually, and the uneven temperature distribution increases. The IPM and IGBT exhibit a typical annular temperature pattern due to their high heat flux. The FRD chip itself has the smallest heating power, but is strongly affected by the IGBT chip and IPM chip, forming a high temperature area. In addition, the distance between chips is large, and the influence of the chip BR on the IGBT is small. This shows that the layout of the chips on the heat sink substrate will directly affect the heat dissipation effect of the chips.
Figure 10 shows the temperature distribution on the x–z cross-section of the radiator (y = 20 and y = 40). The temperature gradient of the heat sink fin changes little and the temperature distribution is relatively uniform. Because the high speed of air flow can effectively strengthen the heat dissipation, the temperature change of the air zone between the channels is more drastic. The temperature variation is concentrated near the solid wall, indicating that convective heat transfer is the main form of heat dissipation. In addition, the lower right area (z = 80~140 mm, x = 40~70 mm) of the heat sink has a significantly higher temperature, and the gradient changes are minimal, indicating more heat accumulation and a poor heat dissipation effect.
The air velocity between the fins of the radiator will directly affect the heat dissipation performance of the heat sink. The airflow velocity near the radiator substrate is significantly higher, as shown in Figure 11. This is because the cooling air entering the heat sink from the compressor compartment is blocked by the rain baffle, causing the air flow direction to blow towards the substrate. In the range of y = 0~20 mm (Zone 1), the flow rate remains at about 0.9 m/s, while in the range of y = 20~40 mm, the flow rate increases to about 1.5 m/s. Subsequently, because the air is affected by the friction resistance of the flow in the channels, the flow velocity of the air in the heat sink channels gradually decreases.
From the above analysis, the advantage of case I is that the cooling air is in direct contact with the heat sink substrate. The HTC is larger due to the significant difference in temperature between the air and the heat sink, as well as the high velocity of the air. However, the flow rate of cooling air between the channels is very uneven. About one-third of the fin area (Zone 1) has a low airflow rate, and the fin surface area is not fully utilized for heat dissipation. This shows that the presence of the rain baffle is the main factor leading to the low cooling efficiency of the heat sink.

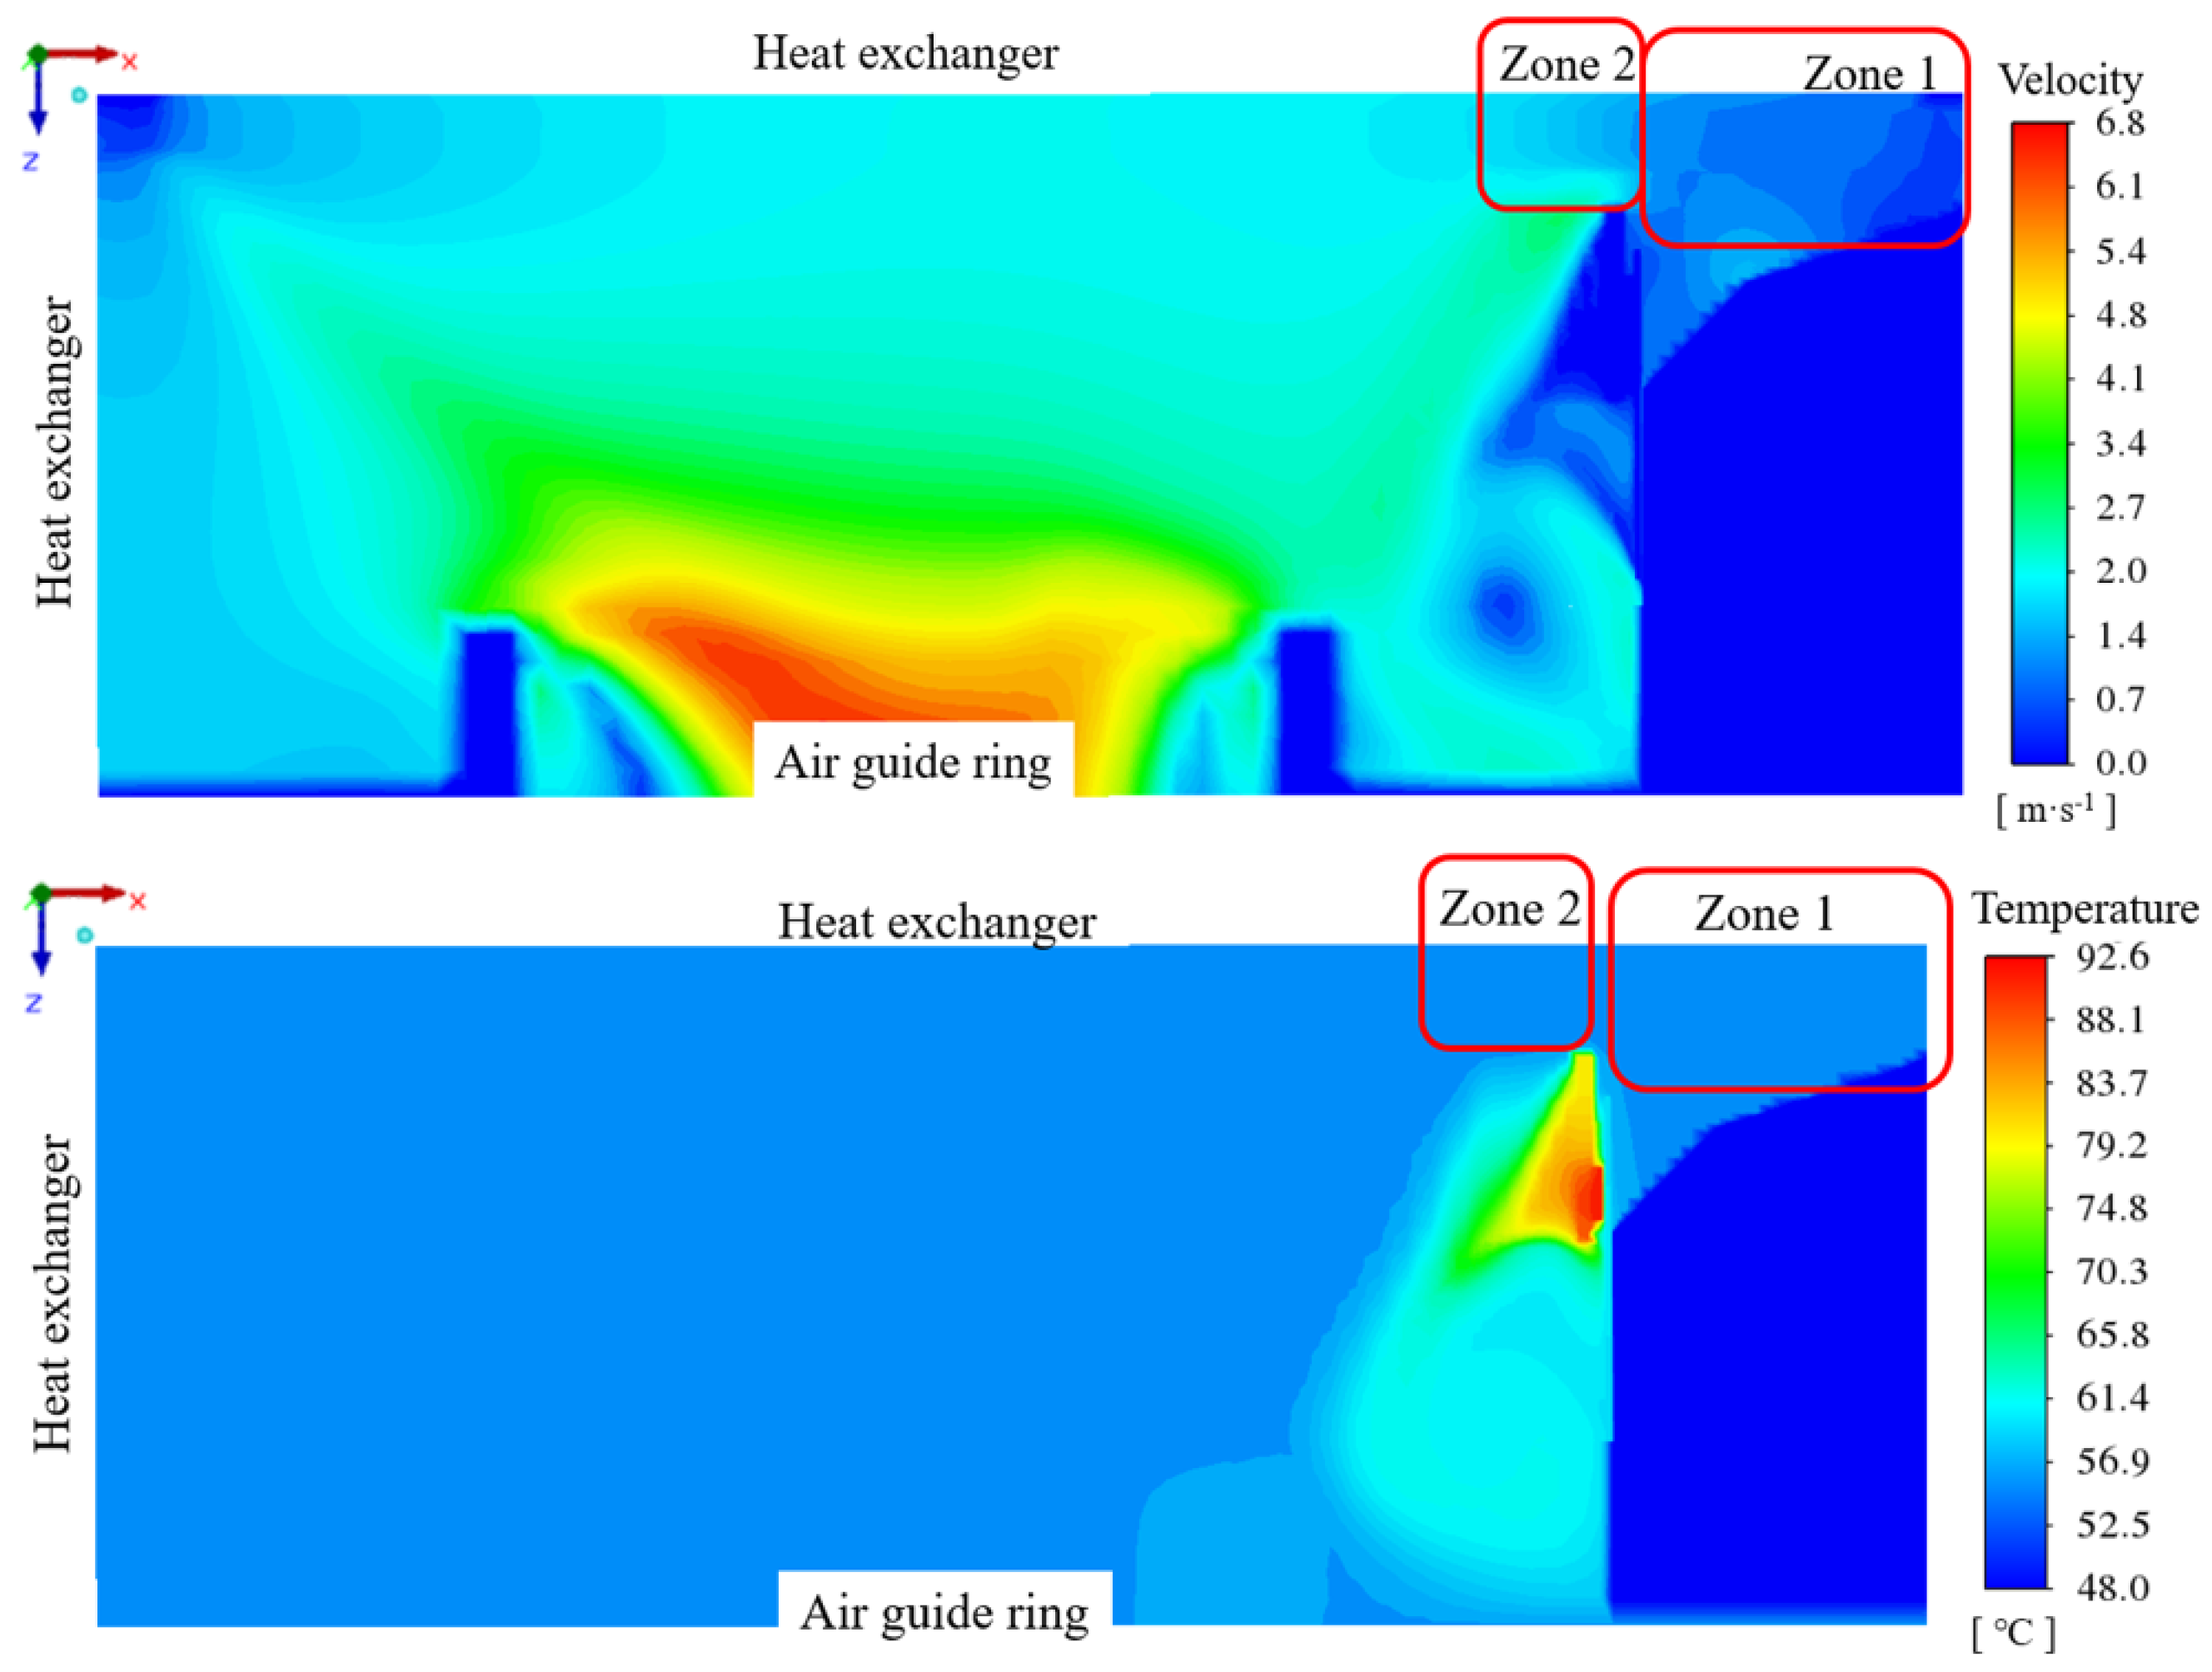
4.4. Fins Facing Down with Back Air Intake

The fins facing down with back air intake case has the same installation position as the heat sink in case I, differing only in the direction of the channels. The air flow direction in the heat sink is positive in the z-axis. Therefore, in this case, the analysis of the flow field in the x–z plane of the outdoor unit adopts a similar method as in case I.
It is evident from the velocity vector in Figure 12 that the asymmetric structure of the outdoor heat exchanger prevents air from flowing into the zoned side of the fan compartment, resulting in an asymmetric flow field. There is a distinct velocity gradient from the upper left corner of the diagram to the axial fan outlet, similar to the velocity profile distribution observed in I. The gap between the air guide ring and the fan generates significant eddy currents, causing turbulence in the air near the heat sink, which may reduce the heat dissipation efficiency of the heat sink. From the inlet to the outlet of the radiator, the air temperature gradually rises. The hot air is concentrated in the lower part of the heat sink, and the temperature varies greatly compared to the air in the rest of the fan compartment.
As can be seen from Figure 13, the highest temperature of the heat sink is 99.1 °C, 8.8 °C higher than that in case I. The temperature distribution near the IPM and IGBT is comparable to that observed in case I. Unlike case I, where the flow channel is perpendicular to the z axis, the air flow channel is along the z axis. The left channels exhibit markedly enhanced heat dissipation, while the right channels demonstrate a notable accumulation of heat. The air is heated by the BR, resulting in a decrease in temperature difference with other chips, while the effective heat dissipation decreases.
Figure 14 shows the temperature distribution inside the heat sink fin in the z–y section at x = 48 mm. This fin is located directly beneath the four chips. The semicircular isotherms are most visible in Zone 1 below the IPM chip. Zone 2, below the BR, IGBT, and FRD, is affected by Zone 1 and Zone 3. Inside the fins, the gradient mainly follows a stratified pattern from top right to bottom left, as shown in Figure 14. Zone 3 is close to the air inlet of the heat sink, the cooling air temperature is low, and the convective heat transfer is strengthened. As a result, the temperature gradient line inside the heat sink fin protrudes in the direction of the substrate from the air inlet.
As can be seen from Figure 15, the air velocity in the heat sink channel is low near the root of the heat sink and the substrate of the heat sink. The speed increases gradually along the height of the fin (in the negative direction along the y-axis). For the air in the heat sink channel, the velocity direction near the heat sink substrate is less affected by the airflow in the fan compartment, while the airflow direction at the end of the fin is more affected by the airflow in the fan compartment.
In case II, the heat source of the heat sink is positioned further away from the fan. The convection process occurs primarily between the lower temperature fins and the cooling air. This convection process experiences a smaller difference in temperature and subsequently has a lower HTC.

4.5. Fins Facing Left with Back Air Intake

Figure 16 depicts the airflow inside an outdoor unit with a heat sink fin facing left and rear-facing air intake. In this case, the air in Zone 1 cannot enter the radiator after being obstructed by the PCB, while the air in Zone 2 flows freely. The axial fan induces directional airflow within the heat sink structure, causing most of the cooling air to escape from the side. Once air enters the heat sink, its flow gradually shifts towards the side with the fan. On the side near the chips, the air velocity is extremely low, resulting in heat accumulation.
Figure 17 shows the distribution of the temperature field of the case III heat sink. Compared with the conditions of cases I and II, the IGBT temperature is 92.8 °C, 1.8 °C higher than that of the IPM. This is due to the vertical positioning of the heat sink, i.e., the lower channel is located closer to the fan. This facilitates the rapid flow of air, thereby increasing the efficiency of convective heat transfer.
Figure 18 shows the temperature contours of the fins under the BR chip and air flow velocity contours of the adjacent channel. On the surface of the heat sink near the chip, the air velocity is close to zero. Consequently, the poor coupling between heat and air flow leads to minimum HTC in case III.

4.6. Fins Facing Back with Back Air Intake

When the fin faces back to the air inlet, its flow characteristics are similar to the previous three cases, but there are some differences, as shown in Figure 19. The asymmetric air intake design creates turbulent swirls that affect the airflow around the heat sink. It is worth noting that this setup has two air inflow sources (Zone 1 and Zone 2) that allow more air to enter the heat sink. Due to the proximity to the fan and the smaller exit section, airflow increases near the heat sink air outlet. The temperature curve shows that the temperature from the air inlet to the outlet gradually rises, and the air temperature uniformity around the outlet is better. Figure 20 shows the temperature distribution of the heat sink in case IV. Compared with the other three cases, the temperature distribution of the radiator is relatively uniform. The maximum temperature of the radiator is 80.2 °C, which is the lowest of the four cases.
As can be seen from Figure 21, the airflow velocity in the heat sink channel varies greatly. The velocity is lower near the air inlet (Zone 1) and higher near the outlet. This distribution is related to the location of the heat sink in the fan compartment. The air near the air inlet (Zone 1) has a lower flow rate due to its proximity to the corner formed by the heat sink and partition. Instead, the installation position allows the heat sink to have effective air intake on two sides, resulting in a high flow rate near the outlet (Zone 3), which contains the air flow from Zones 1 and 2. In addition, in case IV, the impact of air on the substrate forms an impact jet heat transfer, and the heat transfer between the air and the heat sink is strengthened.

4.7. Comparison of Four Cases

In order to comprehensively evaluate the cooling effect of the heat sink in different situations, the mass flow rate of the air on different surfaces of the heat sink was calculated according to the simulated data, as shown in Table 6. Positive mass flow indicates the inflow of cold air and negative mass flow indicates the outflow of hot air. The inlet and outlet air face definitions of the heat sinks in four situations is shown in Figure 22.
According to Table 6, the airflow shown in case IV is approximately 3.4 times that of case I, due to its superior mounting position. This increased airflow enhances cooling performance. However, the analysis shows that in case III, most of the air entering from Face 1 does not effectively promote heat dissipation, but is discharged directly from Face 2. Therefore, the cooling effect of the chip in case III is not as good as that in case I. In case IV, although the inlet air temperature is higher than that of case I, more cooling air is in direct contact with the surface of the high-temperature fin of the heat sink, resulting in a better heat dissipation effect. The large mass flow rate of effective cooling air is favorable for the heat dissipation of the heat sink. A better cooling effect can be obtained through the synergistic effect between the velocity field and the temperature field of the cooling air flow of the heat sink.
For heat sinks of the same structure, cases I, III, and IV, changing the installation position and direction of the heat sink is crucial to the heat dissipation of the chip. The experimental and simulation results have confirmed that in case IV, the maximum chip temperature is reduced by more than 10 °C compared with cases I and III (as shown in Table 7), and the heat dissipation effect is greatly enhanced.
Case IV demonstrates a design principle analogous to the optimal configuration proposed by Zhao et al. [15], as both leverage airflow generated by the fan within the outdoor unit to enhance heat dissipation. When the cooling airflow aligns nearly parallel to the fins, convective heat transfer is significantly enhanced, thereby improving the heat sink’s thermal performance. However, prior studies neglected the impact of multi-chip contact [9], which induces localized high-temperature zones on specific regions of the heat sink surface. In contrast, case IV strategically directs cooling air to first impinge on these high-temperature regions while maintaining maximum airflow throughput. This dual optimization of airflow targeting and volume renders case IV the configuration with the best thermal performance.

5. Conclusions

The characteristics of the air side flow field and temperature field at four heat sinks installed in the outdoor unit of an air conditioner are numerically simulated by a simplified model. The correctness of the simulation model is verified by the experimental data. According to the simulation results, the heat sink performance of all four conditions, including three fan compartment intakes and one compressor compartment intake, was analyzed. According to the results of comparative analysis, it was found that it is effective to improve the performance of the heat sink by changing the installation position of the heat sink. The specific conclusions are summarized as follows:
(1)
Multiple chips are arranged on the same heat sink substrate, and the heat dissipation process of the chips will be coupled with each other. The placement of the chip on the circuit board has an important effect on the heat dissipation of the chip. The optimization of multi-chip placement on the substrate is an important research topic in the future.
(2)
Case IV indeed demonstrates the most favorable thermal performance and is recommended as the optimal configuration for the electronic control module in variable frequency air conditioner outdoor units. Case IV has the highest HTC at 316.5 W·m−2·°C−1, outperforming case I by 6.9%, case II by 13.9%, and case III by 56.8%. The air impact jet is very beneficial to the heat dissipation process of the heat sink. The flow rate and temperature of the effective cooling air entering the heat sink play an important role in strengthening the heat dissipation of the heat sink.
(3)
Under the condition that the structural parameters of the heat sink are unchanged, the effect of heat transfer can be enhanced by changing the installation position of the heat sink and the direction between the heat sink and the air flow. The total effective cooling air mass flow rate in case IV exhibits a 238% increase compared to case I. In case IV, the maximum chip temperature is more than 10 °C lower than that in cases I and III. The effect is obvious.
In contrast to prior studies focusing primarily on fin geometry optimization, this work systematically investigates the coupled effects of inlet air temperature, airflow rate, and air entry angle on heat dissipation performance. These parameters were previously underexplored in the context of inverter air conditioner electronic modules. The current study highlights that the thermal coupling between chips significantly influences heat dissipation. Dispersing high-power chips (e.g., IPM and IGBT) across the substrate could reduce localized hotspots and improve temperature uniformity. For instance, placing low-power components (e.g., FRD) between high-power chips might act as a thermal buffer, mitigating mutual heating effects. However, the optimal case IV configuration requires vertical substrate alignment and dual-side air intake, which may demand redesigning outdoor unit enclosures and fan systems. Such modifications could increase manufacturing costs and complexity. The current study highlights that the thermal coupling between chips significantly influences heat dissipation.

Author Contributions

Conceptualization, Y.P. and S.D.; Methodology, Y.P.; Software, S.D.; Investigation, S.D.; Resources, Q.B.; Data curation, Y.P.; Writing—original draft, Y.P.; Writing—review & editing, D.W., Q.S. and S.Z.; Supervision, Q.B. and D.W.; Project administration, D.W.; Funding acquisition, D.W. and Q.S. All authors have read and agreed to the published version of the manuscript.

Funding

This work was supported by the Natural Science Foundation of Shandong Province, China (Grant No. ZR2021QE219) and Young Talent of Lifting Engineering for Science and Technology in Shandong, China (Grant No. SDAST2024QTA048).

Data Availability Statement

The original contributions presented in this study are included in the article. Further inquiries can be directed to the corresponding author.

Conflicts of Interest

Author Su Du was employed by the company China United Network Communications Corporation. Author Qingfeng Bie was employed by the company Hisense Air Conditioner Co., Ltd. The remaining authors declare that the research was conducted in the absence of any commercial or financial relationships that could be construed as a potential conflict of interest.

Nomenclature

AArea (mm2)
HHeight of the heat sink (mm)
HTCHeat transfer coefficient (W·m−2·°C−1)
LLength of the heat sink (mm)
m ˙ Mass flow rate (kg·s−1)
PPower consumption (W)
Heat transfer rate dissipated from the fin (W)
RjhThermal resistance between heat source junction and heat sink (°C·W−1)
RjaThermal resistance between junction and ambient air (°C·W−1)
Tf,outHeat sink outlet air average temperature (°C)
Tf,inHeat sink inlet air average temperature (°C)
WWidth of the heat sink (mm)
δUncertainty
ACAlternating current
BRBridge rectifier
DCDirect current
FRDFast recovery diode
FSFull-scale
IGBTInsulated gate bipolar transistor
IPMIntelligent power module
PCBPrinted circuit board
PVPhotovoltaic
RHRelative humidity

References

  1. Aggarwal, V.; Meena, C.S.; Kumar, A.; Alam, T.; Kumar, A.; Ghosh, A.; Ghosh, A. Potential and Future Prospects of Geothermal Energy in Space Conditioning of Buildings: India and Worldwide Review. Sustainability 2020, 12, 8428. [Google Scholar] [CrossRef]
  2. Bar-Cohen, A.; Iyengar, M. Design and Optimization of Air-Cooled Heat Sinks for Sustainable Development. IEEE Trans. Compon. Packag. Technol. 2002, 25, 584–591. [Google Scholar] [CrossRef]
  3. Li, Z.; Luo, H.; Jiang, Y.; Liu, H.; Xu, L.; Cao, K.; Wu, H.; Gao, P.; Liu, H. Comprehensive Review and Future Prospects on Chip-Scale Thermal Management: Core of Data Center’s Thermal Management. Appl. Therm. Eng. 2024, 251, 123612. [Google Scholar] [CrossRef]
  4. Ayers, C.W.; Conklin, J.C.; Hsu, J.S.; Lowe, K.T. A Unique Approach to Power Electronics and Motor Cooling in a Hybrid Electric Vehicle Environment. In Proceedings of the 2007 IEEE Vehicle Power and Propulsion Conference, Arlington, TX, USA, 9–12 September 2007; Volumes 1 and 2, pp. 102–106. [Google Scholar]
  5. Whelan, B.P.; Kempers, R.; Robinson, A.J. A Liquid-Based System for Cpu Cooling Implementing a Jet Array Impingement Waterblock and a Tube Array Remote Heat Exchanger. Appl. Therm. Eng. 2012, 39, 86–94. [Google Scholar] [CrossRef]
  6. Vittorini, D.; Cipollone, R. Fin-Cooled Photovoltaic Module Modeling—Performances Mapping and Electric Efficiency Assessment under Real Operating Conditions. Energy 2019, 167, 159–167. [Google Scholar] [CrossRef]
  7. Kazem, H.A.; Al-Waeli, A.A.; Chaichan, M.T.; Sopian, K.; Ahmed, A.-A.; Roslam, W.I.W.N. Enhancement of Photovoltaic Module Performance Using Passive Cooling (Fins): A Comprehensive Review. Case Stud. Therm. Eng. 2023, 49, 103316. [Google Scholar] [CrossRef]
  8. Zaghloul, H.; Abdelrahman, M.A.; Rabbo, M.F.A.; Emam, M. Passive Thermal Control of a Triple-Junction Solar Cell at High Concentrations Using Various Finned Heat Sink Configurations. J. Clean. Prod. 2023, 387, 135844. [Google Scholar] [CrossRef]
  9. Johnston, E.; Szabo, P.S.B.; Bennett, N.S. Cooling Silicon Photovoltaic Cells Using Finned Heat Sinks and the Effect of Inclination Angle. Therm. Sci. Eng. Prog. 2021, 23, 100902. [Google Scholar] [CrossRef]
  10. Adhikari, R.C.; Wood, D.H.; Pahlevani, M. An Experimental and Numerical Study of Forced Convection Heat Transfer from Rectangular Fins at Low Reynolds Numbers. Int. J. Heat Mass Transf. 2020, 163, 120418. [Google Scholar] [CrossRef]
  11. Meng, X.; Zhu, J.; Wei, X.; Yan, Y. Natural Convection Heat Transfer of a Straight-Fin Heat Sink. Int. J. Heat Mass Transf. 2018, 123, 561–568. [Google Scholar] [CrossRef]
  12. Moradikazerouni, A.; Afrand, M.; Alsarraf, J.; Wongwises, S.; Asadi, A.; Nguyen, T.K. Investigation of a Computer Cpu Heat Sink under Laminar Forced Convection Using a Structural Stability Method. Int. J. Heat Mass Transf. 2019, 134, 1218–1226. [Google Scholar] [CrossRef]
  13. Kim, T.; Han, Y.-S.; You, H.; Kim, C.; Kim, M.; Choi, B.-I.; Do, K.H. Pressure Drop and Thermal Resistance Characteristics of Plain-Fin Heat Sink with Impingement Flow. Int. J. Therm. Sci. 2023, 194, 108598. [Google Scholar] [CrossRef]
  14. Mehryan, S.A.M.; Kashkooli, F.M.; Soltani, M. Comprehensive Study of the Impacts of Surrounding Structures on the Aero-Dynamic Performance and Flow Characteristics of an Outdoor Unit of Split-Type Air Conditioner. Build. Simul. 2017, 11, 325–337. [Google Scholar] [CrossRef]
  15. Zhao, X.; Sun, J.; Wang, C.; Zhang, Z. Experimental and Numerical Study of Electronic Module-Cooling Heat Sinks Used in a Variable Frequency Air-Conditioner Outdoor Unit. Int. J. Refrig. 2014, 38, 10–21. [Google Scholar] [CrossRef]
  16. Moffat, R.J. Describing the Uncertainties in Experimental Results. Exp. Therm. Fluid Sci. 1988, 1, 3–17. [Google Scholar] [CrossRef]
  17. Zhao, Z.; Liu, Q.; Jiang, X.; Dong, X.; Zou, W.; Zhang, X. Numerical Simulation of Elastocaloric Cooling Thermal Control System for Electronic Chips. J. Refrig. 2024, 45, 85–92. [Google Scholar]
  18. Tal, Y. An Improved Two-Resistors Compact Thermal Model by Means of Modified Top-Surface-Area. In Proceedings of the Eighteenth Annual IEEE Semiconductor Thermal Measurement and Management Symposium, Proceedings 2002, San Jose, CA, USA, 12–14 March 2002; pp. 64–70. [Google Scholar]
  19. Dang, H.; Lu, Y.; Du, Y.; Zhang, X.; Zhang, Q.; Ma, W.; Zhang, X. A Detailed Thermal Resistance Network Analysis of Fcbga Package. J. Therm. Sci. 2023, 33, 18–28. [Google Scholar] [CrossRef]
  20. Lee, D.; Ji, H.Y.; Chung, D.-Y.; Kim, W.D.; Kang, C.; Kim, J.-Y. Numerical Study on the Thermal Fluid of Multi-Chip Test Chamber with Guide Vane. Case Stud. Therm. Eng. 2024, 53, 103851. [Google Scholar] [CrossRef]
Figure 1. Schematic of the two-resistors model.
Energies 18 02439 g001
Figure 2. Relative positions of the chips.
Energies 18 02439 g002
Figure 3. Schematic of different heat sink installation cases inside air conditioner outdoor units.
Energies 18 02439 g003
Figure 4. Schematic of two heat sinks.
Energies 18 02439 g004
Figure 5. Computational domain.
Energies 18 02439 g005
Figure 6. Grid independency.
Energies 18 02439 g006
Figure 7. Comparisons of chip temperatures in different cases.
Energies 18 02439 g007
Figure 8. Velocity and temperature contours at the x–y plane of the air conditioner outdoor unit in case I.
Energies 18 02439 g008
Figure 9. Temperature contours of the heat sink in case I.
Energies 18 02439 g009
Figure 10. Temperature contours of the heat sink in the x–z cross-section (y = 20 mm and y = 40 mm).
Energies 18 02439 g010
Figure 11. Cross-section velocity contours of the heat sink in y–z (x = 10 mm, x = 35 mm, and x = 60 mm).
Energies 18 02439 g011
Figure 12. Velocity and temperature contours at the x–z plane of the air conditioner outdoor unit in case II.
Energies 18 02439 g012
Figure 13. Temperature contours of the heat sink in case II.
Energies 18 02439 g013
Figure 14. Temperature contours in the heat sink fins (x = 48 mm).
Energies 18 02439 g014
Figure 15. Velocity vectors of the heat sink channel.
Energies 18 02439 g015
Figure 16. Velocity and temperature contours at the x–z plane of the air conditioner outdoor unit in case III.
Energies 18 02439 g016
Figure 17. Case III temperature contours of the heat sink.
Energies 18 02439 g017
Figure 18. Temperature contours of the fins under the BR chip and air flow velocity contours of the adjacent channel.
Energies 18 02439 g018
Figure 19. Velocity and temperature contours at the x–z plane of the air conditioner outdoor unit in case IV.
Energies 18 02439 g019
Figure 20. Temperature contours of the heat sink in case IV.
Energies 18 02439 g020
Figure 21. Velocity vector in the x–z section channels (y = 31 mm and y = 82.5 mm).
Energies 18 02439 g021
Figure 22. Schematic of air inlet and outlet surfaces of heat sinks in four cases.
Energies 18 02439 g022
Table 1. Specifications of the equipment utilized in the experiment.
EquipmentTypeMeasuring RangeUncertainty
ThermocoupleT−200 °C~350 °C±0.2 °C
Standard DC power supplyGWINSTEK GPS-3303C0 V~30 V
0 A~3 A
±0.01% FS
±0.01% FS
Digital differential pressure measuring instrumentTesto 5120 Pa~200 Pa±0.5% FS
Table 2. Thermal resistance, heat fluxes, and dimensions of chips.
Type of ChipsRjh (°C·W−1)Rja (°C·W−1) (W)L (mm) W (mm)H (mm)Supplier
IPM0.4712.5032.633154Silan
FRD0.2540.0010.015104Vishay
IGBT0.4540.0033.020154Infineon
BR0.8022.0024.030204ASEMI
Table 3. Dimensions of the heat sinks.
Heat Sink TypeType AType B
Substrate thickness (mm)55
Total height (mm)4242
Width (mm)15070
Channel length (mm)70150
Fin thickness (mm)1.51.5
Fin spacing (mm)33.7
Number of fins2914
Table 4. Installation information for the four cases.
CaseIIIIIIIV
Heat sinkType AType BType AType A
Distance from the outdoor heat exchanger (mm)27272343
Distance from the front panel of the outdoor unit (mm)6363147155
Distance from the cover plate of the outdoor unit (mm)15151010
The distance from the left plate of the outdoor unit (mm)205205208203
Table 5. Temperature measurements and HTCs for various cases.
Case No.Temperature of Various Chips (°C)Tf,inTf,outHTC
IPMFRDIGBTBR(°C)(°C)(W·m−2·°C−1)
I90.889.790.783.948.086.0296.1
II99.597.998.590.753.093.9277.9
III929294.186.953.065.6201.8
IV79.678.980.774.953.063.3316.5
Table 6. Air mass flow rate and temperature at the inlet and outlet faces of heat sinks.
ParametersFace 1Face 2Face 3Total
Casesg·s−1g·s−1g·s−1g·s−1
I2.50.1−2.62.6
II2.3−1.2−1.12.3
III7.8−6.8−1.07.8
2.66.2−8.88.8
Table 7. Comparison between experimental results and simulation results of maximum chip temperatures (°C).
Case No.IIIIIIIV
Experimental90.899.594.180.7
Simulated90.399.192.880.2
Disclaimer/Publisher’s Note: The statements, opinions and data contained in all publications are solely those of the individual author(s) and contributor(s) and not of MDPI and/or the editor(s). MDPI and/or the editor(s) disclaim responsibility for any injury to people or property resulting from any ideas, methods, instructions or products referred to in the content.

