1. Introduction
The climate and energy transformation of the European and global economies requires efficient low-emission hydrogen production systems and large amounts of cheap energy from renewable energy sources (RESs) [
1]. The generation of low-emission hydrogen from RESs represents a significant domain for the implementation of the latest techniques for diverse hydrogen production and its storage, transport [
2], and distribution [
3]. Equally substantial challenges face those who will provide electricity to the large hydrogen plants. This issue includes the creation of policies favoring energy production from RESs [
4] and the physical implementation of modern power lines [
5]. Especially during the implementation of innovative technologies, they should be subject to detailed monitoring in order to track the correctness of the processes taking place and to ensure safety [
6]. All components in the system should be Internet of Things (IoT) devices, and the large measurement data obtained from them (Big data) should be analyzed and processed using traditional and artificial intelligence (AI) algorithms [
7]. Such operational analysis will enable the effective optimization of individual system components [
8] and, in the future, it will be the basis for the development and implementation of advanced process control (APC) [
9]. The entire approach to the production of low-emission hydrogen from RESs must be carried out with the active participation of scientists who will research and develop both individual algorithms and entire tools for optimizing and controlling the production processes of both electricity [
10] and hydrogen itself [
11].
The process of producing low-emission hydrogen using renewable energy sources is complex and requires detailed analysis in each specific application [
12,
13]. As with any complex process, it can be decomposed into a series of simpler processes. These, in turn, are easier to analyze for optimization purposes and the development of effective control [
14]. In the intricate process of producing low-emission hydrogen through renewable energy sources, the purpose of hydrogen production is of paramount importance [
15]. For this reason, the demand for hydrogen can be divided into the following groups:
In this article, the authors assume the use of low-emission hydrogen for the production of artificial fertilizers [
24] or industrial chemicals [
25]. Until now, gray hydrogen produced in the processes of steam reforming of natural gas has been used for its production [
26]. Control of such large and complex production processes is currently carried out using the APC (advanced process control) formula. An important reason for selecting such a hydrogen production target is its substantial demand, which can reach tons of hydrogen per day [
27]. Another requirement is the continuous production of hydrogen due to the integration of its production with other substrates needed for the production of artificial fertilizers [
28]. The hydrogen production process must, therefore, be continuous, and it is rather difficult to provide large amounts of stored hydrogen to support the production processes. Stationary storage of tons of hydrogen in compressed, cryogenic, or metal hydride form is simply not economically viable. Due to these difficulties, there is a growing preference for the production of green ammonia as opposed to hydrogen in its purest form [
29,
30]. The only option that can be considered is to regulate the efficiency of hydrogen production, to which the rest of the partial processes that make up the overall process of producing artificial fertilizers can be adapted. The continuity of demand for hydrogen in a given location can also be supported by its supply via hydrogen pipelines [
31]. At the same time, they constitute a hydrogen storage facility, but the costs of their construction are enormous [
32].
It is important to note that the production of low-emission hydrogen should not disrupt or burden existing receivers of energy from renewable energy sources [
33]. Therefore, low-emission hydrogen production systems should be powered by newly created capacities from renewable energy sources [
34]. All sources generating energy in renewable energy mixes should also be subjected to a detailed characterization and analysis [
35]. According to the authors, it is imperative to know and quantitatively describe the substitutability and supplementation of energy production by individual sources within the energy mix [
36]. Another essential element of energy generation for the production of low-emission hydrogen is the need to use energy storage systems with large energy capacities [
37,
38]. They are needed to store the surplus energy produced in relation to the continuous demand for electrolyzer power and to release it at times of lower energy production [
39]. At present, they are the most cost-effective methods of enabling self-balancing of the newly created generating capacities from renewable energy sources [
40]. In the previous articles, the authors have already shown that with the appropriate design of power generation from individual renewable energy sources, the size of the energy storage does not have to be very large at all.
The Internet of Things (IoT) has become a prominent phenomenon in the third decade of the 21st century [
41]. The IoT is a concept in which everyday devices are connected to the Internet, enabling them to communicate with each other and with their users. Due to the integration of sensors and software, devices such as refrigerators, cars, or smart watches can collect, analyze, and transmit data in real time. This allows for the automation of many processes, increased convenience, and optimization of resource consumption, e.g., energy. The IoT is employed in many industries, from smart homes and cities to industry, transport, and healthcare. Another salient trend present in the industry is Industry 4.0 [
42]. This is a concept of modern production, which uses advanced digital technologies such as the Internet of Things (IoT), artificial intelligence, robotics, and data analysis. The objective of this initiative is to establish smart factories, in which machinery, systems, and people communicate in real time, thereby automating processes and increasing efficiency. This allows for the personalization of production, cost reduction, and resource optimization. Industry 4.0 contributes to increasing the competitiveness of companies and transforming traditional business models into more flexible and sustainable ones. In addition, artificial intelligence (AI) supports Industry 4.0 by analyzing huge amounts of data, enabling the optimization of production processes and predicting machine failures. Due to machine learning algorithms, systems can automatically adjust the operating parameters of devices, which increases efficiency and reduces losses. Advanced process control (APC) is an advanced method of controlling industrial processes that applies mathematical models and algorithms to optimize the operation of the systems [
43]. APC analyzes data in real time and predicts changes in the process, enabling automatic adjustment of parameters to improve the efficiency and quality of production. This allows for reducing the consumption of raw materials, energy, and waste. This technology is adopted in various industries, such as the chemical, oil, energy, and food industries, providing better control and stability of the processes. The research conducted by the authors aligns closely with the three trends outlined above related to the acquisition and processing of large amounts of data from renewable energy sources to support business decision-making (Business Intelligence).
In recent literature, the topic of creating efficient energy mixes consisting of different renewable energy sources is very often discussed. Meister et al. analyzed how wind and PV systems can complement each other to balance power [
44]. Ten years of meteorological data were used to assess annual fluctuations and calculate the demand coverage factor (DCF). The results indicated that the optimal ratio of wind to PV energy production is 0.7/0.3 or 0.8/0.2, respectively, achieving a DCF of 0.62. Meister et al. used real measurement data from wind speed measuring towers and real photovoltaic systems. The authors concluded that different scenarios related to the substitutability and supplementarity of energy production by individual RESs should be mathematically described. However, the authors also use a real case of electricity demand. In relation to the time-varying power consumption profile, the authors calculated the DCF depending on the different shares of individual RESs in the energy mix. The research was conducted using real measurement data for wind and sun conditions in Estonia and the United States. The authors also perform an analytical calculation of the required ESS.
Al-Fatlawy et al. discussed different strategies for integrating PV and wind systems to provide a sustainable and reliable power supply [
45]. The proposed approaches include the use of energy storage, intelligent management systems, and optimization of the size of system components. A probabilistic power flow (PPF) analysis algorithm was developed by researchers from Iraq and India to assess the impact of uncertainties in renewable energy generation and demand in the power grid. The authors used probabilistic models based on probability density functions to represent the variability of factors such as solar irradiance, wind speed, and load behavior. The results of the probabilistic analysis presented in the paper prove that the system is able to effectively manage the fluctuations in energy generation and demand, maintaining voltage stability and ensuring reliable power flow.
Elminshawy et al. investigated the technical and economic feasibility of a stand-alone hybrid system based on photovoltaic cells, a wind turbine, an energy storage device, and a water electrolyzer to generate electricity and green hydrogen in three regions of Egypt with different climates [
46]. The researchers showed that within a single country, there can be more or less favorable solar and wind conditions, which have a direct impact on the costs of electricity production and low-emission hydrogen. Such studies have great practical application, as they help authorities to design different national hydrogen production systems in different locations within a given country. It turns out that the differences in energy production by photovoltaic and wind systems in different geographical contexts are very large. The authors show that the Lublin region in Poland is a convenient location for investment in the production of electricity from a photovoltaic–wind mix and for the production of green hydrogen.
Determining the signatures of power generated in the photovoltaic–wind mix using clustering has its advantages and disadvantages compared to other scientific methods. Compared to probabilistic analysis using the Metalog probability distribution family, it allows determining the complementarity and substitutability of the power generated by one source with another. The Metalog probability distribution family allows for the calculation of the probability of generating individual power levels by the tested energy mix [
6]. Unsupervised clustering does not have this possibility. The signatures of power generated by the energy mix and the presentation of their results in the form of heat maps allow the locating of time periods requiring the accumulation of overproduction of power and periods of its deficit, when power must be drawn from the power grid or energy storage systems. Clustering does not allow for the exact calculation of the size of the energy storage system. Analysis of the monthly average hourly power allows determining the size of the energy storage [
7]. All presented methods for assessing the efficiency of energy mixes provide significant information about the process of generating power and energy production. They can be used simultaneously or interchangeably, depending on the needs. Markov models can be used in the analysis of energy generated from RESs in many aspects, such as forecasting [
47], optimization [
48], and reliability analysis [
49].
In this article, the authors conduct an operational analysis of low-emission production from a photovoltaic–wind mix. The article is a response from the scientific side to the need to support entrepreneurs in the area of planning, implementing, and optimizing hydrogen production systems for the purposes of climate and energy transformation. The article is a case study of hydrogen production in the Lublin region in Poland. This research is justified by the production of industrial chemicals, fertilizers [
50], and buses powered by hydrogen fuel cells in our region [
51]. Each of these industries requires large amounts of cheap, low-emission hydrogen. Additionally, the Lublin region is characterized by favorable climate conditions for the production of energy from the sun and the wind on a national scale. All this contributes to the possibility of designing and creating a regional ecosystem for the production and use of low-emission hydrogen. The initial goal of the article is to characterize the production of energy from a photovoltaic–wind mix using statistical and probabilistic methods. The main objective of the article is to process the measurement data of the generated power from a photovoltaic–wind mix using unsupervised clustering methods and to demonstrate their usefulness in the operational analysis of energy generation for the production of low-emission hydrogen.
The article presents a practical method of designing and assessing the power generated in a photovoltaic–wind mix for the production of low-emission hydrogen. The authors oppose the commonly accepted statement that balancing power in a photovoltaic–wind mix is impossible or very difficult to implement in practice. The signature of the power generated in the mix depends on the power signatures of individual RESs. Therefore, the authors perform detailed statistical analyses and clustering of individual RESs and then their mix. The authors prove quantitatively that individual RESs in the mix replace and complement each other. Importantly, the Probability Density Function of the power generated in the mix in one of the months shows characteristics of anti-fragile systems. This means that designing a photovoltaic–wind mix is possible in this direction in more months of the year. Such an indicator of the efficiency of the energy mix has not been used so far in science and in industrial practice. Signatures of generated power in the photovoltaic–wind mix were prepared using unsupervised clustering. Individual states of the power generation process in the mix were given a physical meaning related to the quality of generated power and the related possibilities of producing low-emission hydrogen. This approach is called operational analysis and, according to the authors, is necessary to understand the nature of each RES and its mix. Operational analysis based on signatures determined as a result of clustering allows for the identification of the occurrence of the process in selected clusters in individual time intervals over the course of a good. The authors present a very detailed analysis of the generated power by individual RESs and their mix using traditional statistical tools and modern algorithms for processing measurement data.
4. Discussion
One of the computational nodes in KNIME is the Silhouette Coefficient. It allows us to evaluate the clustering quality by determining how well elements fit into their clusters compared to other groups. The coefficient value ranges from −1 to 1, where higher values indicate a better fit of points to their own clusters and their greater separation from others. This metric facilitates the comparison of different clustering results, thereby assisting in the selection of the optimal number of clusters in algorithms such as k-means. It is especially beneficial in exploratory data analysis when there are no known class labels, because it provides an intuitive way to assess the coherence of groups. By means of the Silhouette Coefficient [
67], one can avoid both too many (by over-splitting) and too few (by merging unrelated elements) clusters. The results of the average Silhouette Coefficient values for different numbers of clusters for the month of April are presented in
Table 3, and for the month of May in
Table 4. The highest Silhouette Coefficient value for both months was obtained for the number of clusters equal to 3 (red font in
Table 3 and
Table 4). It should be noted that for other numbers of clusters the Silhouette Coefficient is also very high and changes only slightly. In this case, the choice of the number of clusters is left to the expert’s discretion. The number of clusters will be adjusted to the number of process states that can be named and used in the management of low-emission hydrogen production.
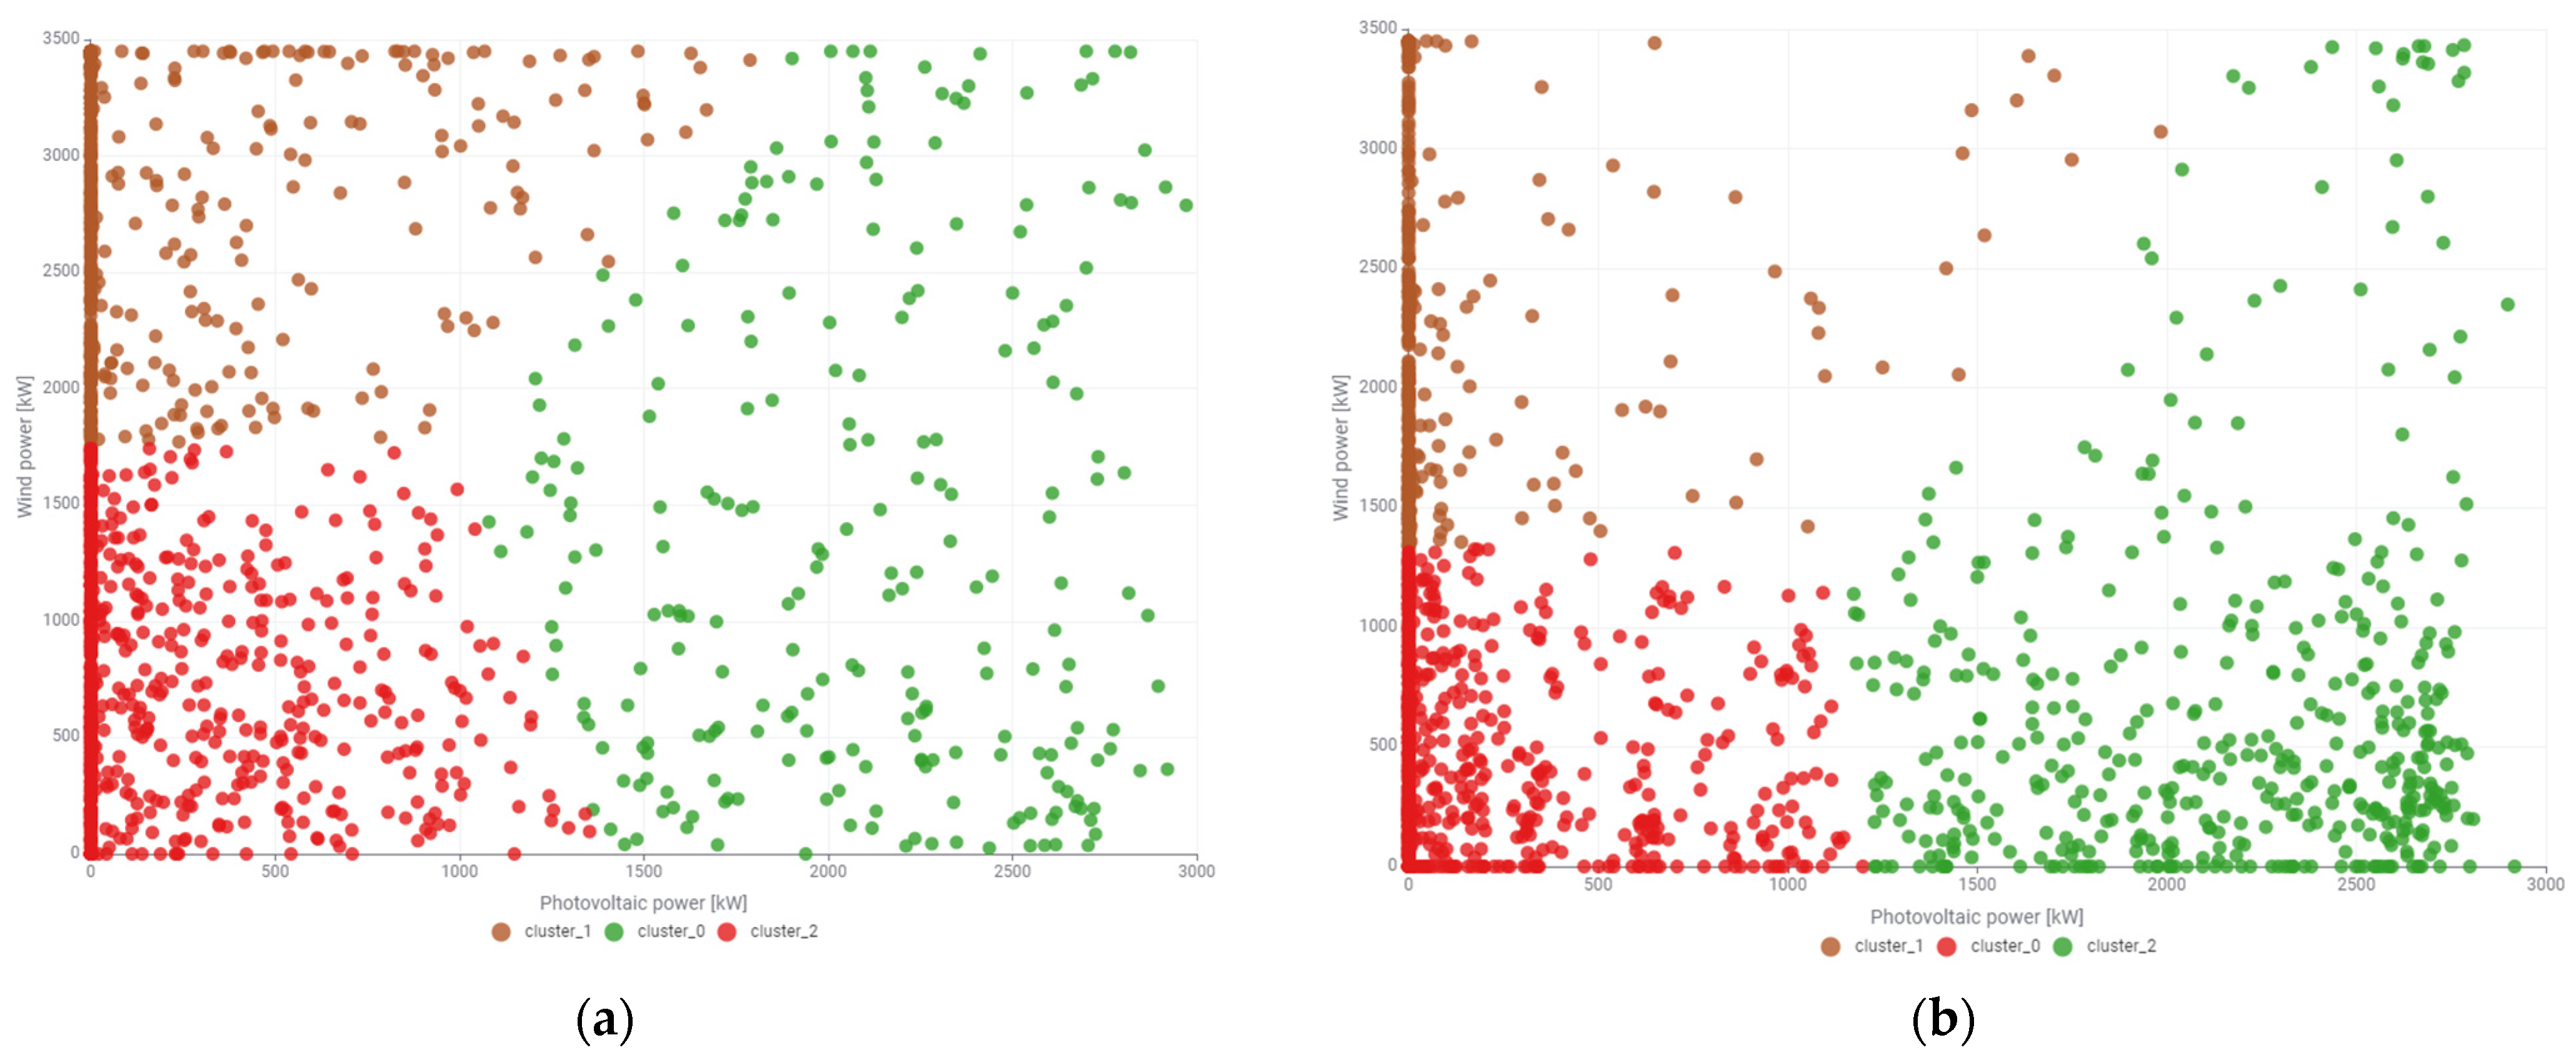
The unsupervised clustering process was initiated based on the determined Silhouette Coefficient values. The two-dimensional state space was divided into three clusters. The clustering results for April are shown in
Figure 8a, and for May in
Figure 8b. Despite some similarities, the division of the generated power space has clear differences. These are the boundary differences in the generated power. For example, cluster_0 (red) in May seems to be separated by a horizontal boundary of about 1300 kW on the wind power axis and a vertical boundary of 1200 kW on the photovoltaic power axis. Unlike in May, cluster_2 (red) has a completely different shape in April. It has a clear horizontal boundary of about 1700 kW on the wind power axis. However, the boundary separating it from cluster_0 (green) is not vertical. Cluster_2 (red) clearly cuts into cluster_0 (green) at the bottom. Similar observations can be made by carefully looking at the division boundaries between all clusters. The authors decided that the division into 3 clusters is not sufficient to describe the production of low-emission hydrogen. The spaces of generated power defined by 3 clusters are too large and may contain many potential characteristic substates. In this case, the authors decided to decompose and divide the generated power space into 6 clusters. The reason for this choice was the high Silhouette Coefficient of 0.5 for the month of May.
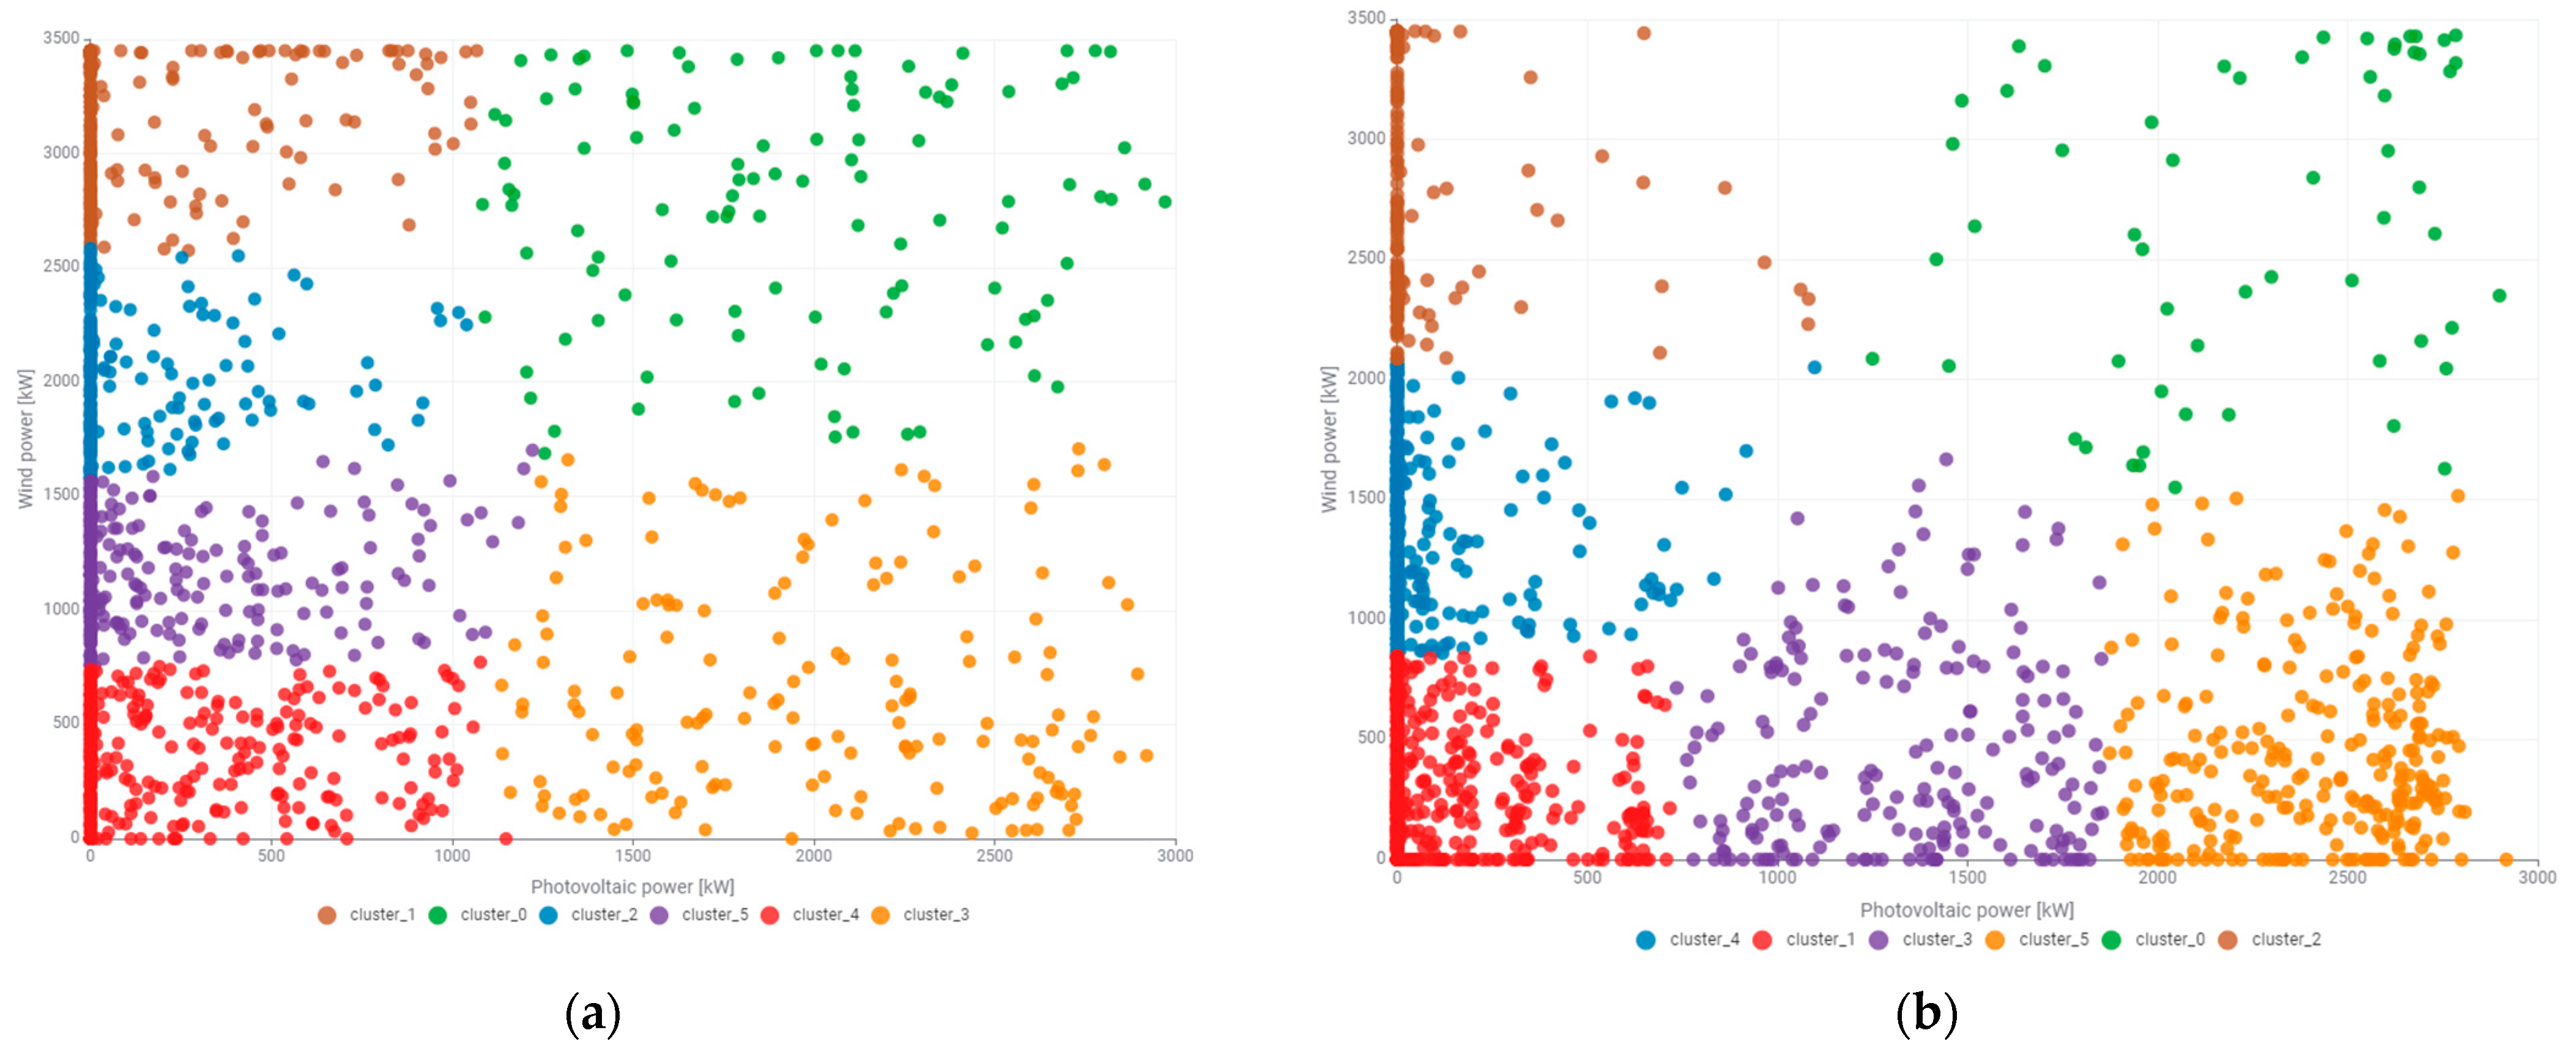
The clustering results into 6 clusters for April are shown in
Figure 9a, and for May in
Figure 9b. Also with this division, despite certain similarities, the division of the generated power space has clear differences. For April, the k-Means algorithm divided it into 4 clusters along the turbine power axis and only into 2 clusters along the photovoltaic power axis. For May, the division was the opposite. The k-Means algorithm divided it into 3 clusters along the turbine power axis and into 3 clusters along the photovoltaic power axis. This division has its mathematical explanation. It results from the statistics and histograms presented in
Table 1 and
Table 2 and in
Figure 6. A larger number of records in a given range of generated power forces the generation of a larger number of clusters in that range. The authors considered that the division into 6 clusters is also not sufficient to describe the production of low-emission hydrogen. The generated power spaces designated by 6 clusters are too large and may contain many potential characteristic substates. In this case, the authors decided to decompose and divide the generated power space into 9 clusters. The reason for this choice was the high Silhouette Coefficient for both months. Both for April and May, the Silhouette Coefficient for the division into 9 clusters was higher than for the neighboring values.
The results of clustering into 9 clusters for the month of April are presented in
Figure 10a and for the month of May in
Figure 10b. Expert verification of the obtained clustering results for April is presented in
Table 5 and for May in
Table 6.
After the clustering process, the results can be presented in the form of state-transition diagrams.
Figure 11 shows the state-transition diagram for May 1. It is possible to track the process of generating power from the photovoltaic–wind mix in individual periods of the day. It is clearly visible that the process very often stays in a given state (cluster) for only half an hour. Usually, it stays in it for 2, 3, 4, or more such half-hour periods. Further statistical or probabilistic analysis can also be used for transitions from one state to another. Learning such process behaviors with accuracy to the probability distribution can have practical application in predicting such complex processes.
Very important data in terms of quantity is provided by the monthly analysis of the relative frequency of the power generation process in individual states (clusters). The relative frequency of the power generation process in individual clusters (divided into 9 clusters) in individual months is presented in
Figure 12. At this time, it is imperative to recall that the division into 9 clusters during the period of April and May corresponds to the data presented in
Figure 10. However, the clusters obtained in these months are not identical and should not be compared in terms of colors or cluster numbers. Taking into account the division into an equal number of clusters (9) and a very similar clustering quality obtained in individual clusters as well as its average value for all clusters, a certain observation can be made, i.e., the process of generating power by the photovoltaic–wind mix in the individual months of April and May is characterized by a certain similarity.
The next stage of cluster analysis involves drawing up graphs of the process occurrence in individual clusters in specific hourly intervals. The calculation data presented in
Figure 13 show that the process presence in individual clusters usually occurs at the same times of day. Analyzing the data from both April and May, one can conclude that the generation of power from the photovoltaic–wind mix is repetitive in a daily perspective.
The most obvious example of daily repeatability (cyclicality) of the occurrence of the process of generating power from the RES mix is the daily generation of power by the photovoltaic system. The corresponding cluster_6 in April and cluster_8 in May clearly occur during the day. Another example is the generation of average power by a wind turbine. This is the state of cluster_2 in April and cluster_5 in May. For May, it can be seen that this type of state does not occur during the day. For April, the break during the day is smaller because this cluster also includes the generation of power from the photovoltaic system, with values up to several hundred kW.
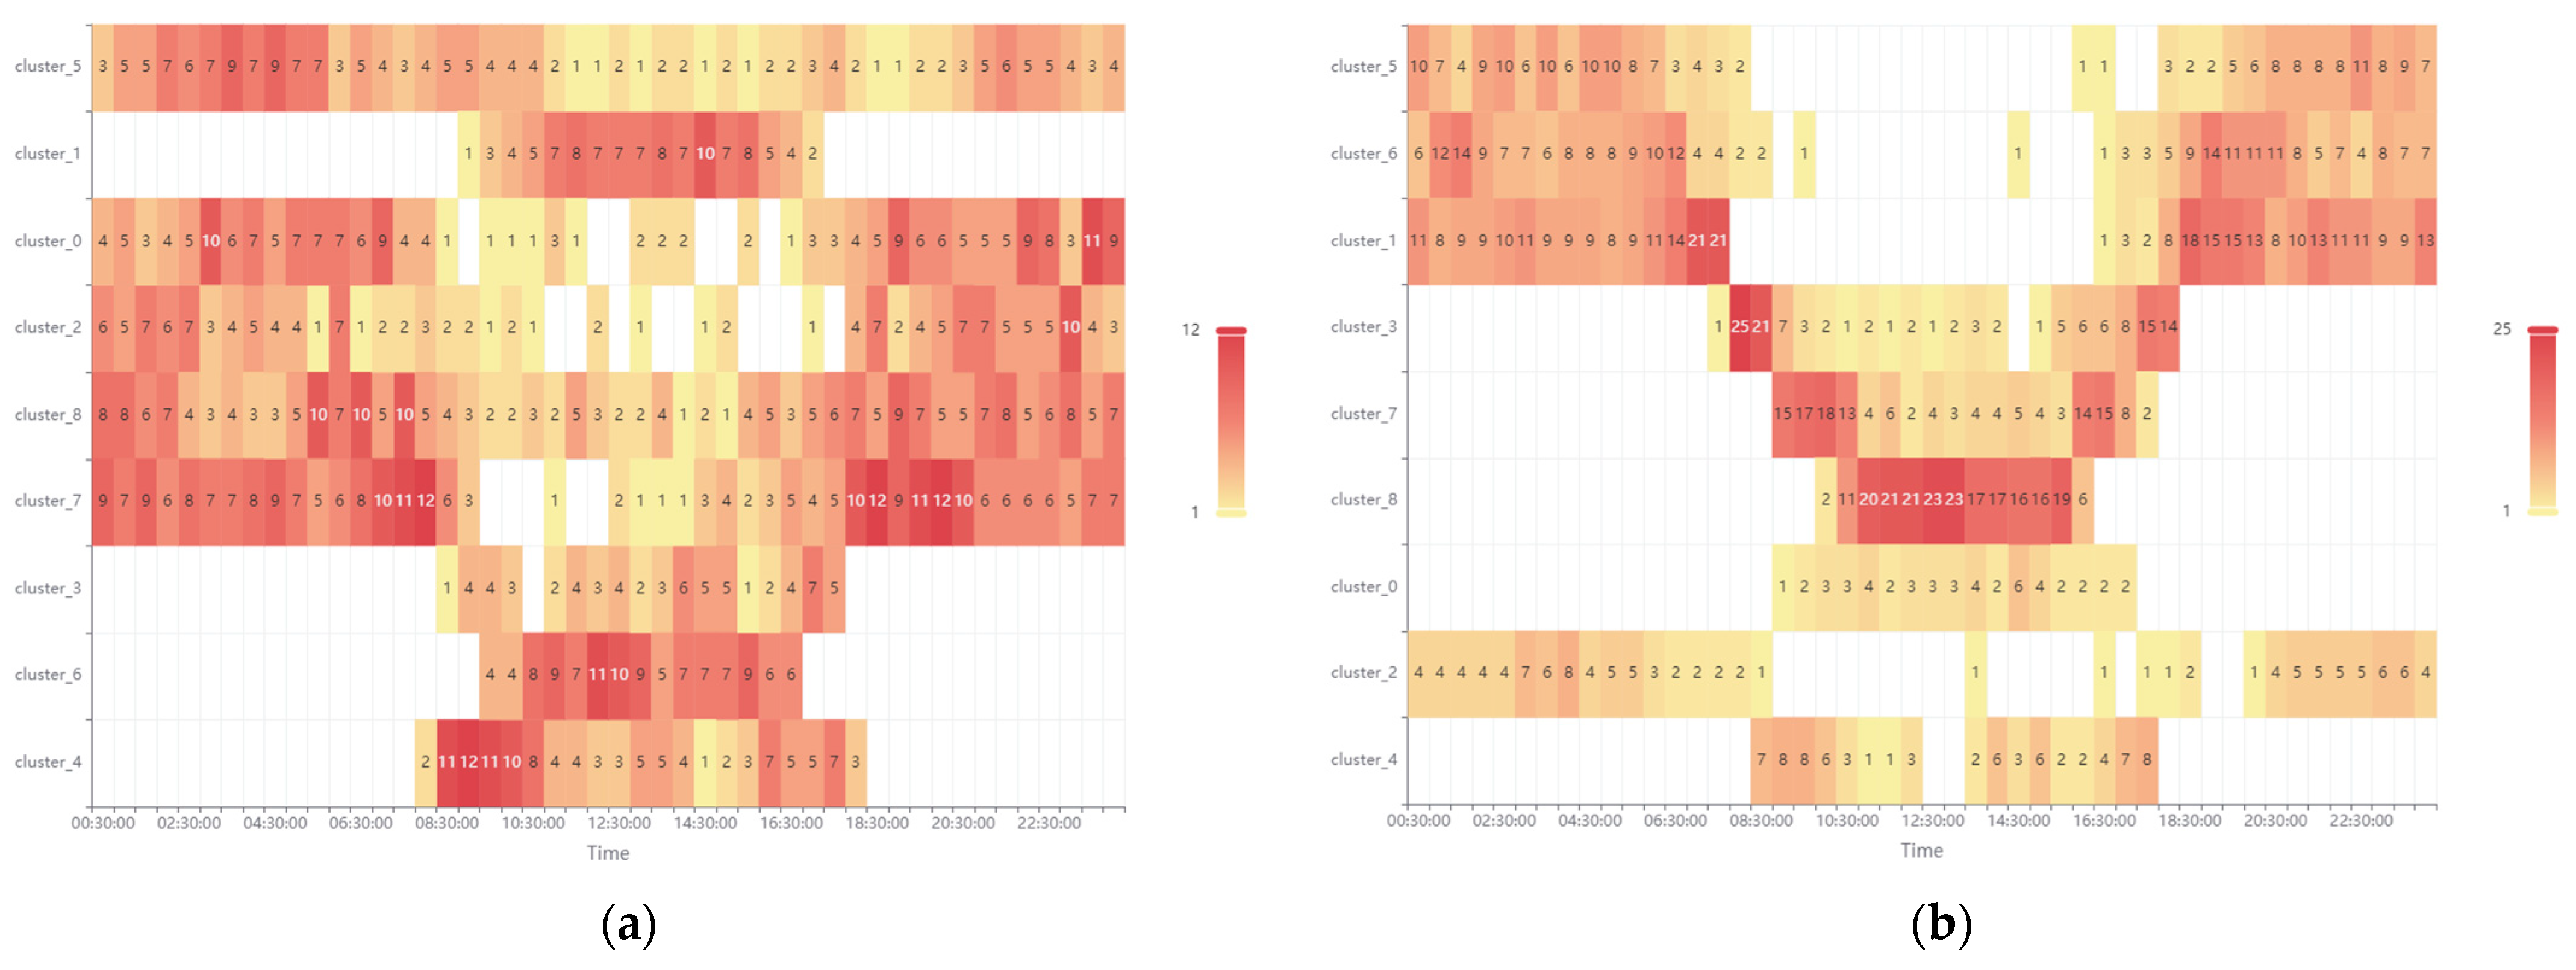
Heatmaps undoubtedly provide the most quantitative information on the occurrence of clustering over time. They are a graphical representation of the data in which numerical values are presented using colors, making it easier to identify patterns and trends. They are used, among others, in website traffic analysis, UX research, and statistical data visualization. They can be used to quickly see which areas are most frequently used, clicked, or viewed. Heatmaps add a third dimension to a two-dimensional graph by representing numerical values using colors, which makes it easier to analyze complex data. This enables the simultaneous visualization of the relationships between two variables and the intensity of their values at different points on the graph. Heatmaps for the clustering results of power generation processes from the photovoltaic–wind mix in April and May are presented in
Figure 14.
The practical use of heatmaps will be presented to analyze the most important cases related to the production of low-emission hydrogen from a photovoltaic–wind mix. The first case is associated with a large overproduction of generated power and energy produced from the mix, which significantly exceeds the maximum power threshold of the hydrogen electrolyzers used. In the case of April, this process corresponds to cluster_1 (green), and in the case of May, cluster_0 (green). The heatmap shows that this condition occurs in April only during the day, with a fairly high frequency of occurrence. In May, this condition also occurs only during the day, but with a much lower frequency. Let us recall that this condition corresponds to the generation of power by both renewable sources with a total power exceeding 3500 kW. It also includes powers exceeding 6000 kW. This means the need to promote large amounts of energy, constituting overproduction in relation to the assumed level of electrolyzer power of 2000 kW. However, not only do the above-mentioned clusters require energy storage, but the need to store large amounts of energy is also necessary in the process states in which high levels of total mix power result from high power generated mostly by one source. Consider the first case, when high total mix power is obtained largely from the photovoltaic system. This corresponds to the cluster_6 state in April and cluster_8 in May. Both clusters occur in the middle of the day with high frequency. However, the frequency of this state in May is much higher than in April due to the higher share of photovoltaic power in the mix. The total power generated in this state by both sources ranges from 2000 to 4000 kW in both months. The second case of generating a high level of total mix power results from the higher share of wind power in the mix. In April, this process corresponds to cluster_5 and in May to cluster_2. In April, cluster_5 occurs throughout the day, but its frequency is the highest at night after midnight. In May, cluster_2 occurs clearly at night, both before and after midnight. The total power generated in this state by both sources is between 3000 and 4000 kW in both months.
After analyzing the overproduction of energy from the photovoltaic mix, it was time to analyze the power shortages in relation to the assumed level of electrolyzer power. Heatmaps prove to be a valuable solution in this area as well. The state of the lowest generated power from both RESs corresponds to cluster_7 in April and cluster_1 in May. Both clusters are very similar in terms of their boundaries. They cover the power range from 0 to over 1000 kW. It is evident that this is insufficient to generate the requisite electrical power necessary to facilitate the electrolysis process. During this state, power must be supplied to the electrolytic processes from previously charged energy storage. It is worth noting here that red clusters have the highest frequency of occurrence in both months, amounting to 19% and 22%, respectively (see
Figure 12). Cluster_7 in April occurs with the highest frequency in the morning and evening hours. Similar frequencies of occurrence are visible for cluster_1 in May. Despite the highest frequencies occurring in the morning and evening hours, attention should be paid to their occurrence throughout the night in both months analyzed.
From the analysis presented above, a number of noteworthy conclusions can be drawn in the area of balancing the power generation system from the photovoltaic–wind mix and the production of low-emission hydrogen. In both analyzed months, there is a morning and evening minimum of power generation from the RES mix. In both analyzed months, there is a night and afternoon maximum of power generation from the RES mix. This allows the energy storage system to be charged from night overproduction and then discharged during the morning minimum. Then, at noon, the ESS will be charged again with the energy from the afternoon overproduction to make up for the shortages during the evening minimum. Therefore, on the majority of days in the analyzed months, the ESS will be charged and discharged twice a day. The conducted clustering shows that the ESS will be charged from the excess energy produced in the hydrogen production system during the periods when the energy is the cheapest. The conducted clustering shows that the ESS will be discharged during the periods when the energy purchased from the power grid is the most expensive. This means that such a system of producing energy from a mix of renewable energy sources for the production of low-emission hydrogen can be optimized in terms of electricity costs, which will positively affect the cost of hydrogen production.
The approach, methodology, and IT tools used by the authors have some limitations. Despite indicating very specific periods of overproduction of power by RESs and power shortages in the low-emission hydrogen production system, no results were obtained in the form of ESS capacity. This means that such a complex issue as the production of low-emission hydrogen from a photovoltaic–wind mix must use many different scientific methodologies and tools. The approach used by the authors supports and complements research conducted by other scientists and previously published by the authors themselves. The authors were also limited by the size of the article itself. The development of the area that was only signaled in the article also requires continuation. This concerns the presented state and transition diagram. The time the system spends in individual states (clusters) can be modeled and used to predict past performance. The authors see here significant support for the operation of the system in dynamic conditions. The variable power generated by RESs and the variable demand for electrolyzer power will be able to be effectively predicted with accuracy to the probability distribution based on archival data. The data presented in the article can be continued with the consideration of other months of the system’s operation. Here we have in mind the winter months, characterized by very high energy production from the wind turbine and very low production from the photovoltaic system.
5. Conclusions
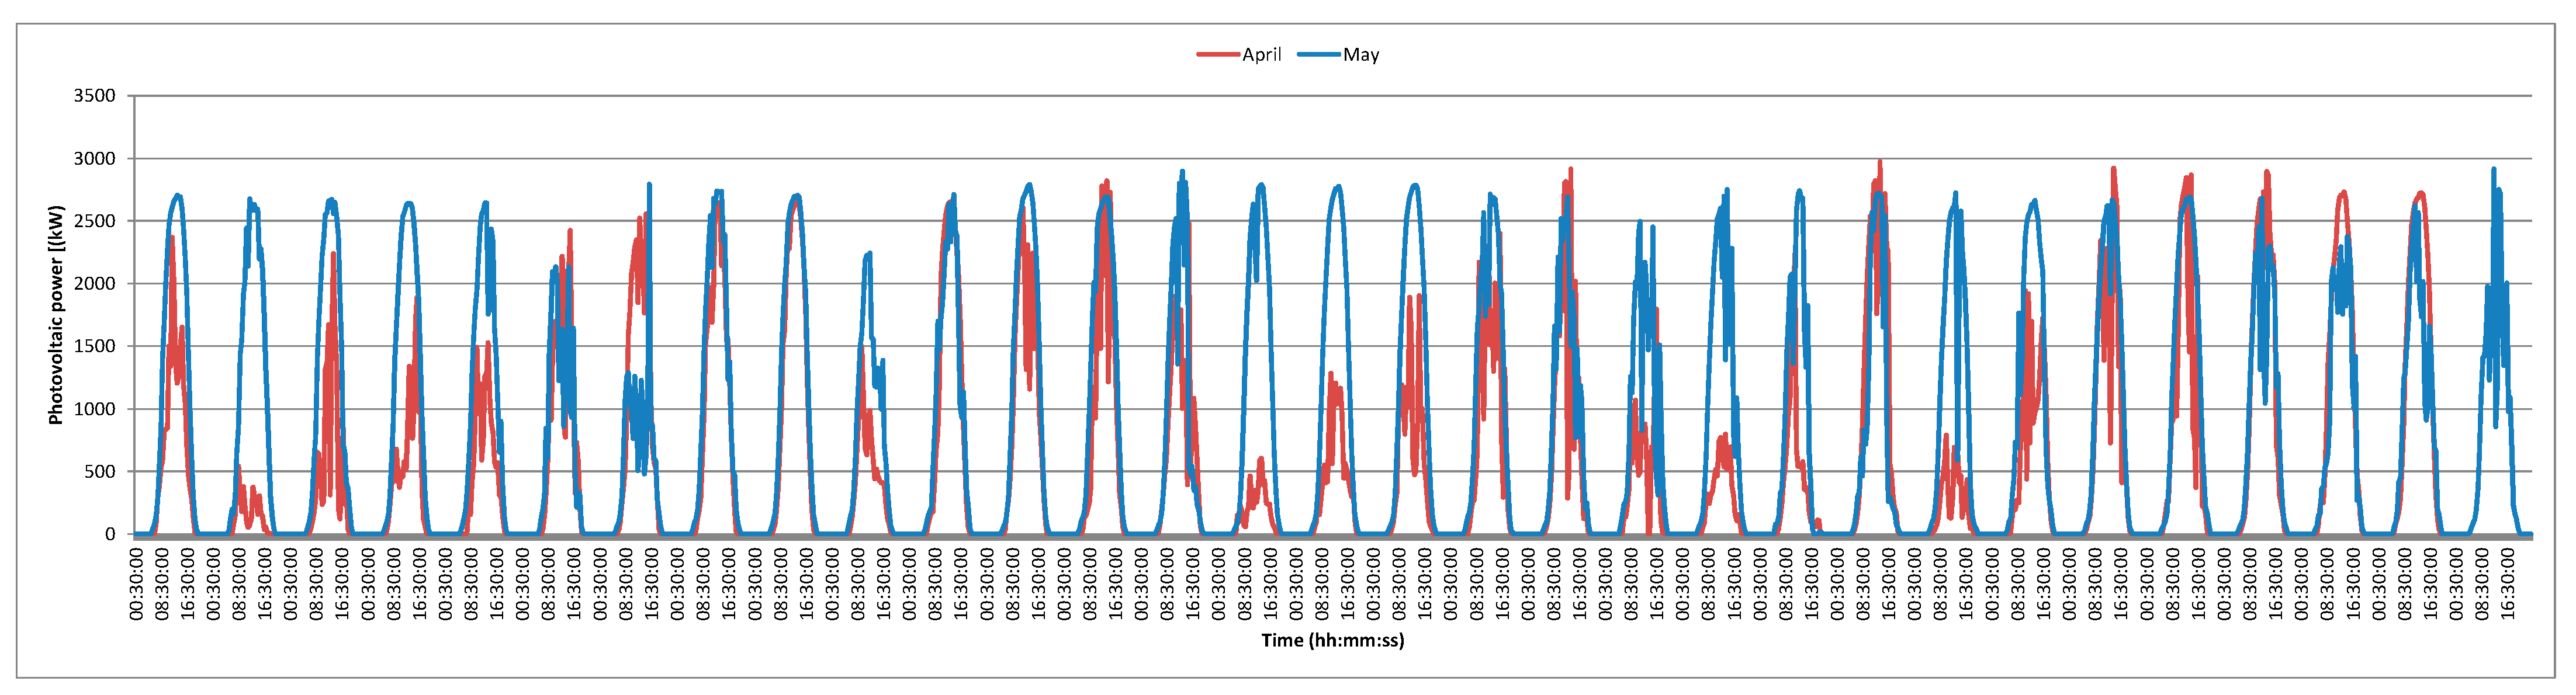
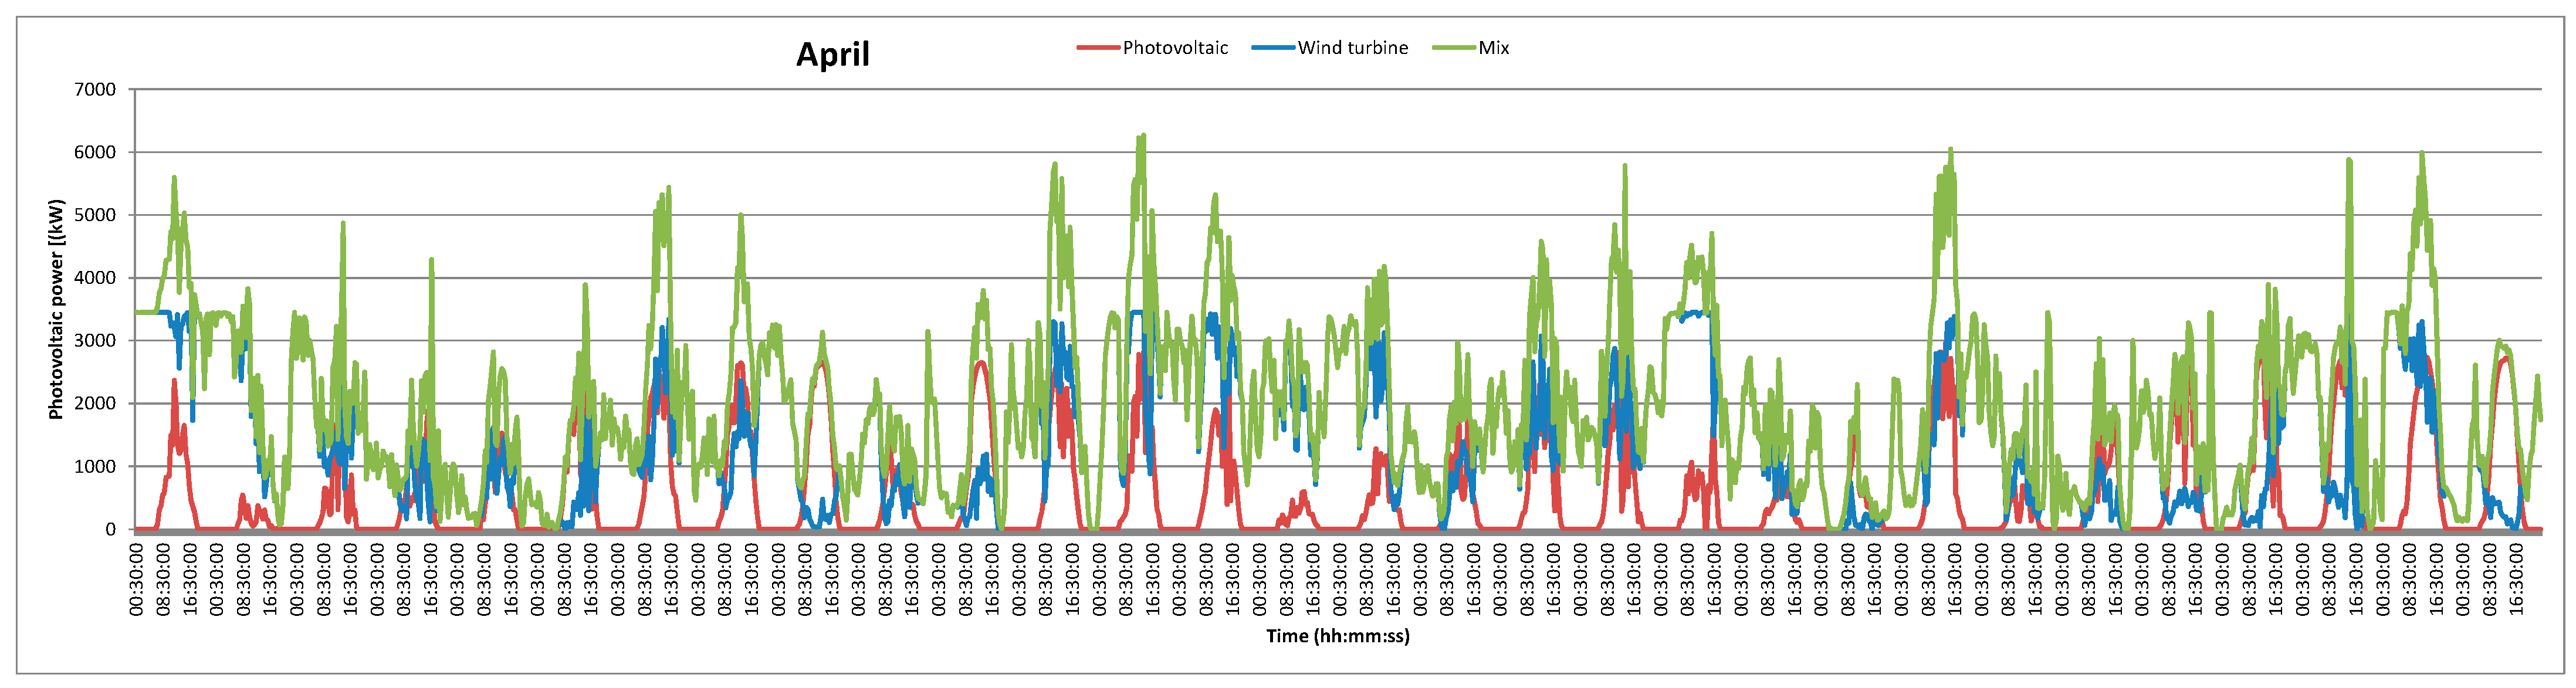
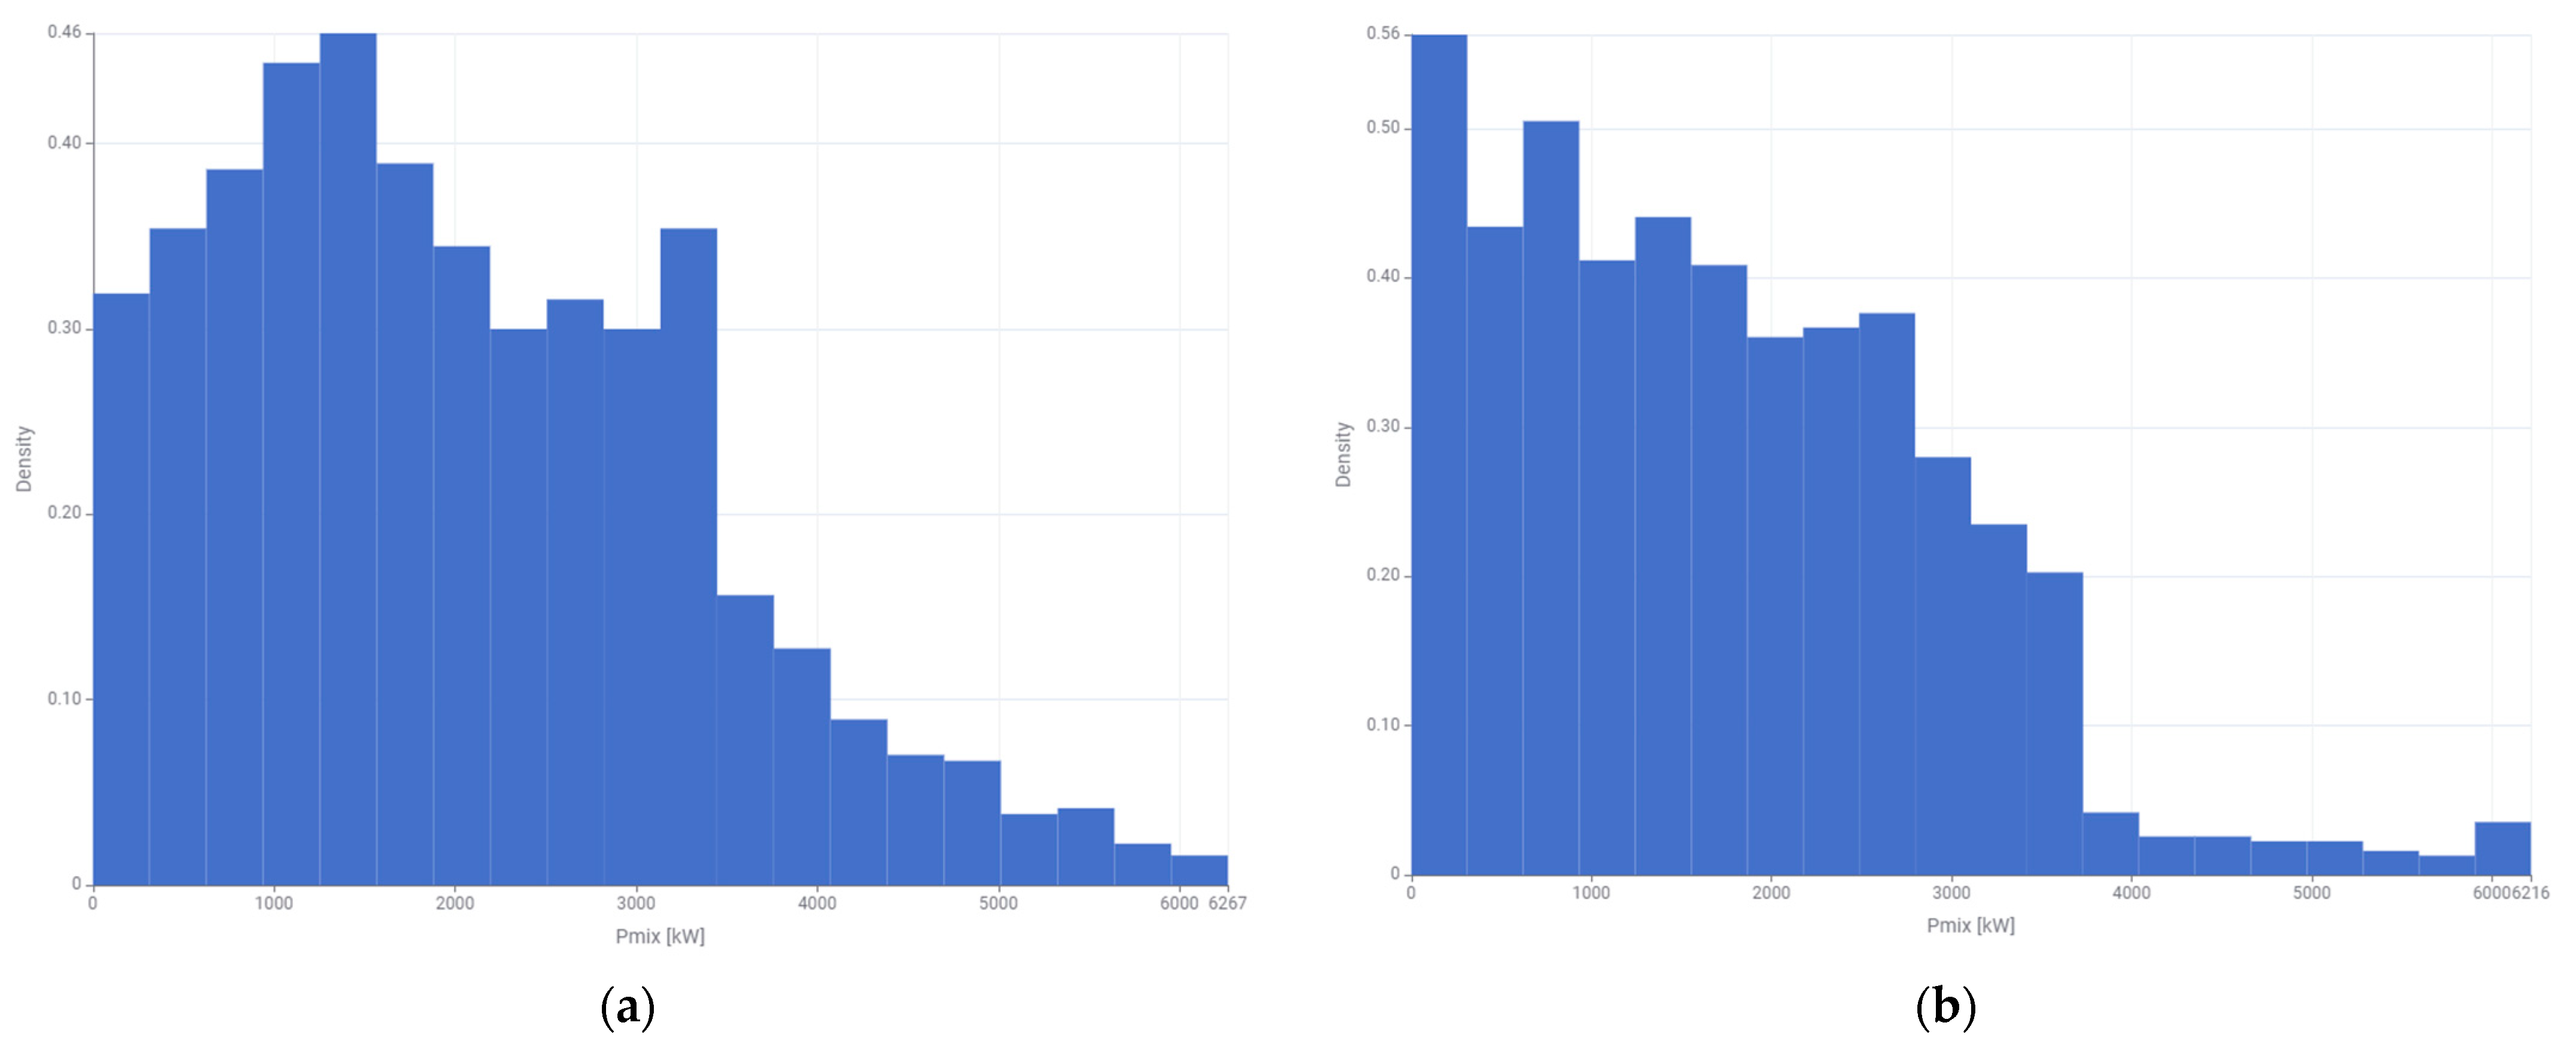
The article analyzes and studies the power generation by the photovoltaic–wind mix in two characteristic months. April was characterized by high energy production from the wind turbine and the average energy production from the photovoltaic system. In May, the system generated average amounts of energy from the wind and large amounts of energy from the photovoltaics. The preliminary research and statistical analyses demonstrate that in both analyzed months, the generated power in the mix is subject to mutual replacement and complementation with the power generated by individual RES. This is particularly visible in the histograms of the density of individual power levels for individual RESs and for their mix. In April, a graph of considerable interest was obtained on the histogram corresponding to anti-fragile properties. Generating power from a photovoltaic–wind mix fits into the concept of an anti-fragile system because it uses complementary energy sources—the wind (often stronger at night and in winter) and the sun (more efficient during the day and in summer), which allows for a better adaptation to changing weather conditions and increases resistance to disruptions. Such a system not only minimizes the risk of energy shortages but also benefits from environmental instability, because distributed production and adaptive control enable optimal use of available resources.
The unsupervised clustering performed using the k-Means algorithm provides significant findings regarding the process of generating power from the RES mix and its use in the low-emission hydrogen production system. In these areas, the following conclusions can be drawn from the conducted research:
The Silhouette Coefficient research supported by expert validation led to the division of the two-dimensional space of generating power from the photovoltaic system and the wind turbine into 9 clusters.
The division of the state space into 9 clusters is sufficient for an accurate description of the power generated from the RES mix for the production of low-emission hydrogen. The clusters were numbered and named, and their usefulness for balancing the entire system was demonstrated. The performed clustering became the basis for the operational analysis of the low-emission hydrogen production system from the photovoltaic–wind mix.
The relative frequency of their occurrence was calculated for individual clusters. It has been demonstrated that such calculations can be used to characterize the quality of the photovoltaic–wind mix in individual months of the year.
In the analyzed month of April, 25% of the energy generated in the photovoltaic–wind mix came from the photovoltaic system. The low-emission hydrogen generation process was in states (clusters), ensuring that the operation of the electrolyzer with nominal power amounted to 57% of the total operating time in that month. In May, the share of photovoltaics in the generated power was 45%. The low-emission hydrogen generation process was in states, ensuring that the operation of the electrolyzer with nominal power amounted to 43% of the total time in that month. In the remaining states of the hydrogen generation process, the power must be drawn from the energy storage system. The cluster analysis also showed the functioning of the operating states of the power generation process from the mix, which ensures the charging of the energy storage.
The graphs of the occurrence of power generation states (of individual clusters) in individual hours of the day confirm the complementarity and substitutability of some power sources by others in the mix. The operational analysis performed has shown the usefulness of clustering in balancing the low-emission hydrogen production system from the energy of the photovoltaic–wind mix.
The most detailed operational analysis of the clustering process was performed using the so-called heat maps. Using this technique of imaging the results obtained in clustering, it is possible to quantitatively describe the power generated by the photovoltaic–wind mix and its use for the production of low-emission hydrogen.
The operational analysis showed the need to use low-emission hydrogen production from the energy from the RESs mix of energy storage systems in the system. The data from both months presented in the form of heat maps confirmed the need to store excess energy produced in ESS and return it to the process during periods of lower energy production. The latter occurs in the morning and evening periods, which are very well visualized by heat maps. The obtained clustering shows that ESS would be charged and discharged twice a day.
The research and analyses conducted in the article confirmed the presence of favorable climatic and geographical conditions for the production of low-emission hydrogen from the photovoltaic–wind mix in the Lublin region in Poland. This fact, combined with the production of artificial fertilizers, industrial chemicals, and hydrogen buses in this region, creates highly conducive conditions for the climate and energy transformation of the entire region. The authors intend to continue to support local entrepreneurs in this area.
Quantitative research results in the form of record statistics within one cluster and detailed cluster boundaries will be the subject of our future works and scientific articles. Quantitative data related to the presentation of the process in specific states and in specific periods of time can also be used to determine the energy storage. However, this requires advanced data processing within individual clusters on a daily basis.


