Article

Moisture Localization and Diagnosis Method for Power Distribution Cables Based on Dynamic Frequency Domain Reflectometry

1
College of Electrical Engineering, Sichuan University, Chengdu 610065, China
2
Electric Power Research Institute State Grid Hubei Electric Power Co., Ltd., Wuhan 430048, China
*
Author to whom correspondence should be addressed.
Energies 2025, 18(10), 2430; https://doi.org/10.3390/en18102430
Submission received: 21 March 2025 / Revised: 25 April 2025 / Accepted: 7 May 2025 / Published: 9 May 2025
(This article belongs to the Section F4: Critical Energy Infrastructure)

Abstract

:
Moisture ingress in power distribution cable bodies can lead to insulation degradation, jeopardizing the operational safety of power grids. However, current cable maintenance technologies lack effective diagnostic methods for identifying moisture defects in cable bodies. To address this gap, this paper proposes a dynamic frequency domain reflectometry (D-FDR) method for moisture localization and diagnosis in power distribution cables. Leveraging the temperature-sensitive nature of moisture defects—in contrast to the temperature-insensitive characteristics of other defects—the method involves the application of thermal excitation to induce differential dynamic changes in the distributed capacitance of moisture-affected cable segments compared to normal segments, enabling the precise identification and diagnosis of moisture ingress. Simulations and experiments confirm that moisture ingress in cable bodies increases the distributed capacitance, generating reflection peaks at corresponding distances on frequency domain localization plots. Under thermal excitation, the reflection peak amplitude of moisture defects exhibits a temperature-dependent decrease, distinct from the behavior of intact cables (amplitude increase) and copper shielding layer damage (negligible variation). By utilizing the dynamic characteristics of reflection peak amplitudes as diagnostic criteria, this method is able to accurately localize and diagnose moisture defects in cable bodies.

1. Introduction

Power distribution cables (mostly three-core cables) are widely used in urban medium- and low-voltage distribution networks, serving as critical components of urban power systems. Their safe and stable operation forms the cornerstone of urban power supply reliability [1,2]. However, many cables operate for years in damp or flooded trenches under harsh environmental conditions. When the cable outer sheath becomes compromised due to transportation damage, improper installation, or corrosion, moisture ingress frequently occurs in power distribution cables. Persistent moisture exposure accelerates copper shielding layer corrosion and insulation dampness, ultimately degrading insulation performance and jeopardizing operational safety. Therefore, there is an urgent need for technical solutions to effectively locate and diagnose moisture-related defects in distribution cables.
Traditional defect localization techniques no longer meet current operation and maintenance requirements. For instance, time domain reflectometry (TDR) suffers from rapid high-frequency signal attenuation during cable transmission, resulting in an inability to locate subtle defects and being limited to identifying open- or short-circuit faults [3]. The partial discharge method, while effective in detecting knife marks, air gaps, and other defects that generate partial discharges in cables, faces challenges due to its weak signal susceptibility to electromagnetic interference in field environments [4,5]. Moreover, it fails to effectively locate moisture ingress defects in cable insulation systems. The visualization feature method of grounding current harmonics is used to diagnose and identify moisture defects, but it cannot locate a defect’s location [6]. In order to solve the above problems, scholars have proposed frequency-domain-reflection-based methods in recent years.
Frequency domain reflectometry (FDR) has emerged as a novel cable defect localization technique. It identifies cable defects by analyzing the reflection coefficient spectrum of linear frequency-swept signals injected at the cable terminal [7,8]. Compared with traditional methods like partial discharge detection [9] and time domain reflectometry [10,11], FDR demonstrates superior levels of sensitivity and accuracy in defect diagnosis and localization. However, moisture ingress defects and non-hydrous cable body defects like shielding layer breaches exhibit similar frequency domain signatures in frequency domain reflectometry (FDR), making it impossible to distinguish defect types solely through reflection peak amplitude analyses of FDR localization diagrams. During cable operation and maintenance, as outage durations are strictly limited, not all identified defects require immediate intervention. Defects that do not compromise normal cable operation are categorized as monitored points, allowing for timely power restoration. Nevertheless, untreated moisture ingress may trigger progressive defects, including copper shielding layer corrosion and the dielectric performance degradation of the insulation layer, critically threatening cable lifespan and potentially causing dielectric breakdown, which jeopardizes the power supply’s reliability. While physically exposing cable jackets for moisture defect verification remains technically feasible, this approach incurs substantial labor and material costs. Therefore, advancing FDR technology to achieve precise moisture defect localization and diagnosis would not only optimize resource allocation but also significantly enhance the security and stability of urban grid systems.
Some researchers have conducted extensive fundamental research and engineering applications of FDR-based cable defect localization [12,13]. As documented in [14], a methodology using the transmission coefficient of reference cables (of an identical type) as kernel functions for integral transforms was proposed, leveraging their generalized orthogonality with FDR data to achieve defect localization. However, this approach introduces measurement inaccuracies and technical constraints due to its dependency on reference cables, resulting in limited engineering applicability. Building on frequency domain analysis, the study in [15] developed a windowed Fourier transform (FT) method for equivalent frequency extraction from FDR data, enabling precise defect localization and the field deployment of FDR systems. Nevertheless, this method failed to establish diagnostic criteria for specific defect types. Furthermore, the authors of [16] investigated moisture ingress mechanisms in single-core cables, clarifying the relationship between distributed parameter variations and FDR reflection peak characteristics before/after moisture exposure. However, their research neither proposed formal diagnostic thresholds nor addressed moisture defects in three-core distribution cables, demonstrating significant theoretical and practical limitations. These existing gaps highlight the critical need to address the challenge of similar frequency domain signatures among multiple defect types, which is essential for overcoming FDR’s current limitations in moisture defect diagnosis and ultimately enhancing distribution network maintenance efficiency.
To address these challenges, this paper proposes a moisture localization and diagnosis method for power cable bodies based on dynamic frequency domain reflectometry (D-FDR). After locating suspected moisture defects through FDR frequency domain positioning diagrams, temperature excitation is applied. Since the moisture in defects exhibits temperature sensitivity, heating will cause dynamic changes in the distributed capacitance, which subsequently alters reflection coefficients. Other defect types show minimal electrical parameter responses to temperature variations. Therefore, the dynamic variation trends reflected in FDR frequency domain positioning diagrams can be extracted as diagnostic criteria for moisture defects in power cable bodies. To validate the method’s effectiveness, a three-core cable moisture model was established. Simulations analyzed the temperature responses of distributed capacitance before and after moisture exposure, establishing diagnostic criteria for cable moisture. Finally, experiments were conducted on a 31.5 m 10 kV cross-linked polyethylene (XLPE) cable. The dynamic characteristics of FDR frequency domain positioning diagrams were obtained under temperature excitation before and after moisture exposure. A comparative analysis with reflection peak variations in normal cables and copper shielding layer damage under an identical level of temperature excitation confirmed the method’s effectiveness.

2. Principle of Defect Localization Using Frequency Domain Reflectometry

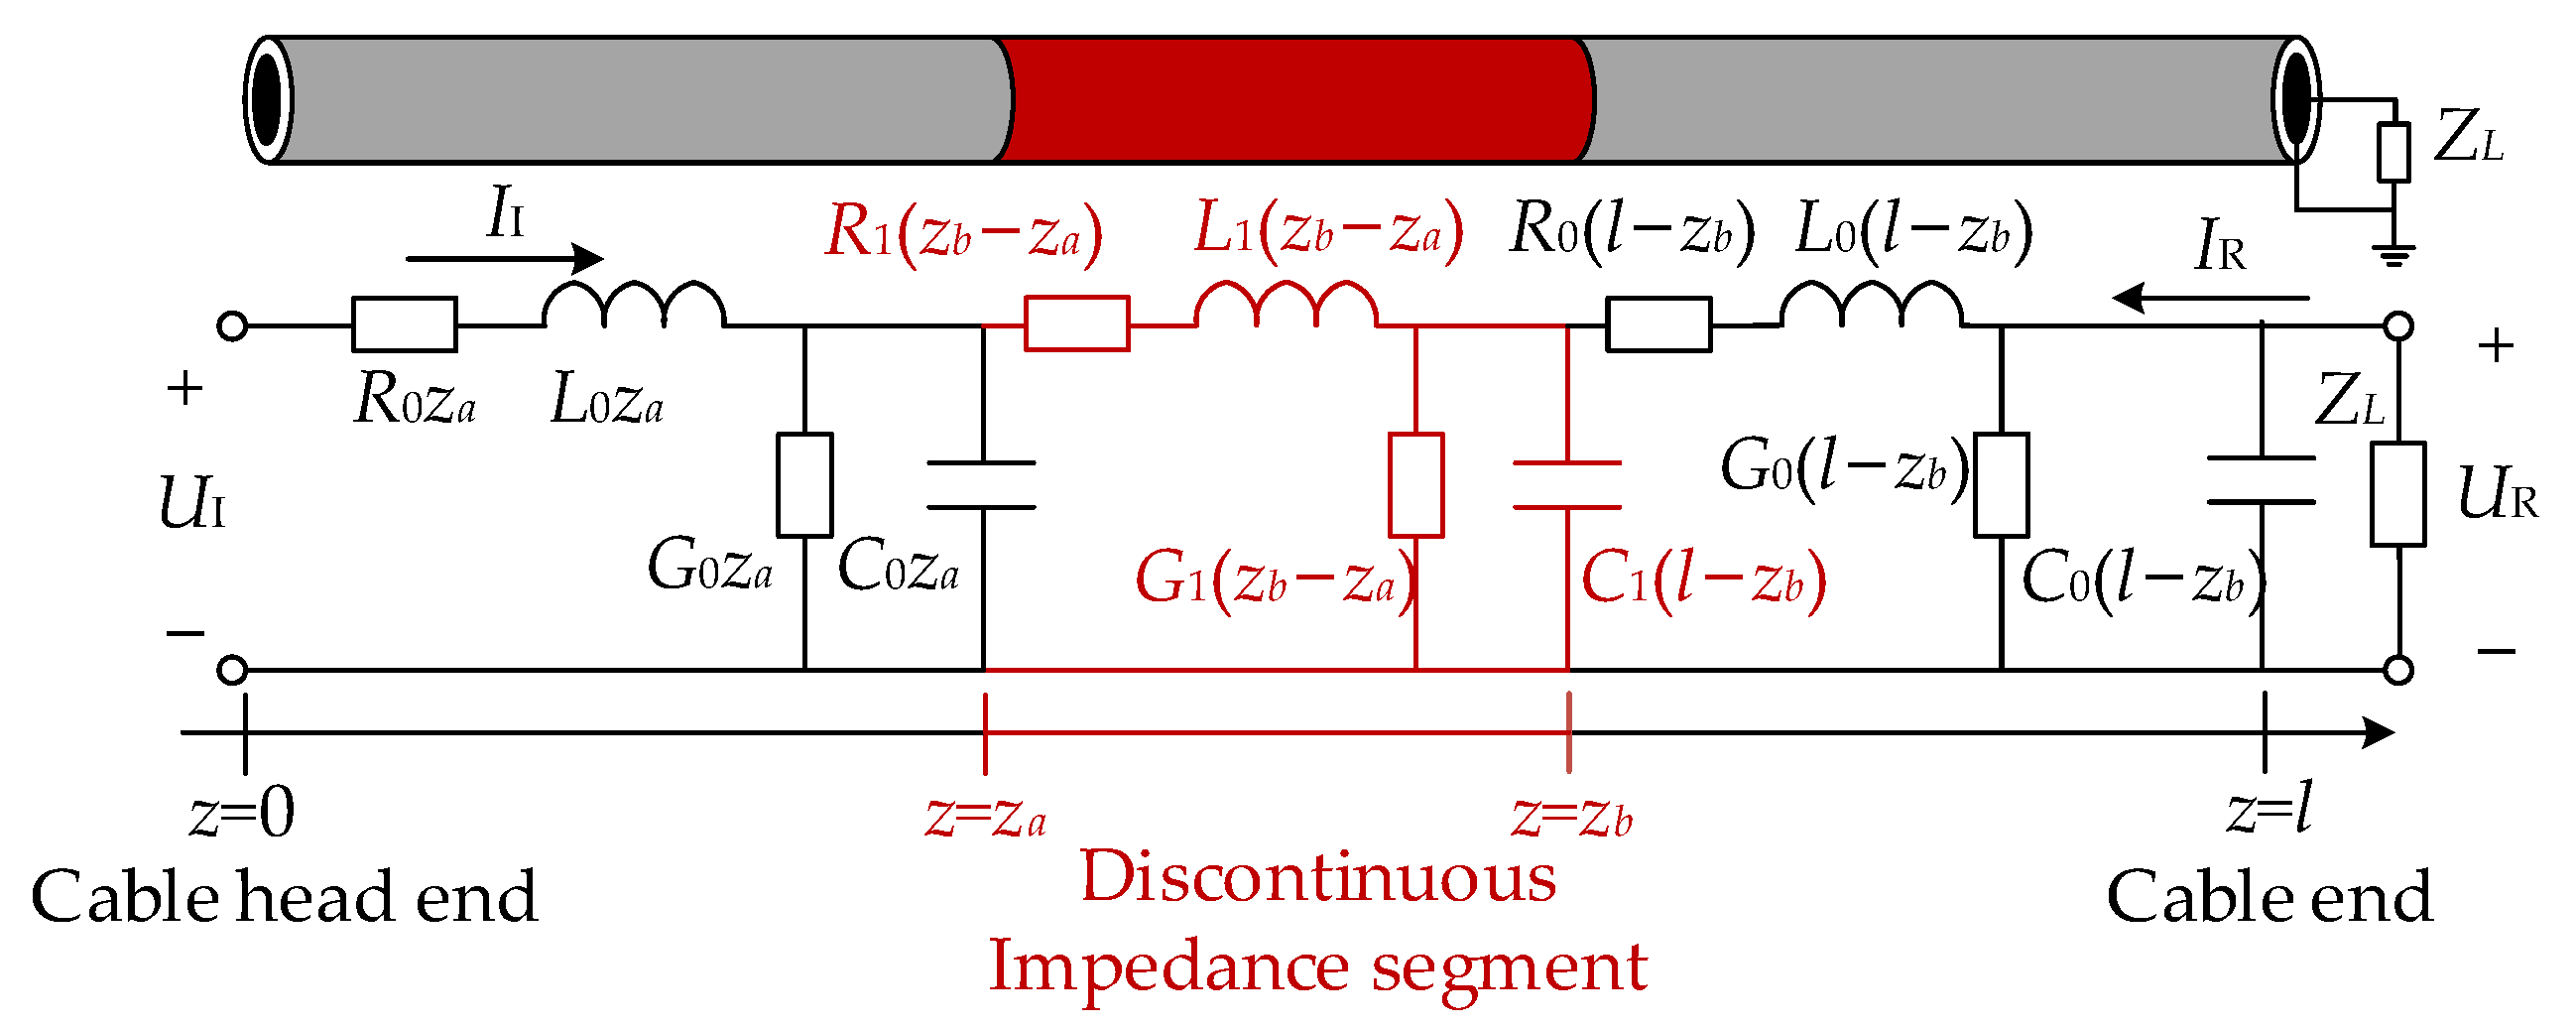
2.1. Cable Reflection Coefficient Spectrum

According to transmission line theory, when the length of a cable line is much greater than the wavelength of the incident signal, the cable line must be treated as a distributed parameter network [17]. The transmission line model of a power cable is shown in Figure 1.
In Figure 1, R0, L0, G0, and C0 represent the resistance, inductance, conductance, and capacitance per unit length of an intact cable [18], respectively, which can be represented by (1) to (4); R1, L1, G1, and C1 represent the resistance, inductance, conductance, and capacitance per unit length of the defective segment.
R 0 1 2 π μ 0 ω 2 1 r C ρ C + 1 r S ρ S
L 0 = μ 0 2 π ln r S r C + 1 4 π 2 μ 0 ω 1 r C ρ C + 1 r S ρ S
G 0 = 2 π σ ln r S / r C
C 0 = 2 π ε ln r S / r C
where ω is the angular frequency of the transmitted signal; ρS and ρC are the resistivities of the copper shielding layer and the cable core, respectively; μ0 is the vacuum permeability; σ and ε are the conductivity and dielectric constant of the insulating material, respectively; and rS and rC are the inner radius of the copper shielding layer and the radius of the cable core, respectively.
According to transmission line theory, the reflection coefficient Γ(z) at any position z along an intact cable of length l can be expressed as follows:
Γ z = U R U I e 2 γ l z = Z L Z 0 Z L + Z 0 e 2 γ l z
where UI is the incident signal voltage, UR is the reflected signal voltage, ZL is the load impedance at the cable end, Z0 is the characteristic impedance of the cable, and γ is the propagation coefficient of the signal in the cable. The characteristic impedance Z0 is given by the following:
Z 0 = R 0 + j ω L 0 G 0 + j ω C 0
Under high-frequency conditions, ωL0 >> R0 and ωC0 >> G0. Thus, the effects of R and G can generally be neglected, and Z0 and γ are simplified to the following:
Z 0 = L 0 C 0
γ ω = α ω + j β ω β ω = ω v = 2 π f v
where α and β are the attenuation constant and phase shift constant of the cable, respectively; f is the injected signal frequency; and v is the propagation velocity of the injected signal.
When the cable end is open (ZL = ∞), the reflection coefficient at the starting end (z = 0) becomes the following:
Γ 0 = e 2 γ l
Using Euler’s formula, this expands to the following:
Γ 0 = e 2 α l ( cos ( 2 β l ) j sin ( 2 β l ) )
The reflection coefficient spectrum contains multiple characteristic quantities that describe the cable properties. This paper focuses on analyzing the real part of the reflection coefficient. When injecting high-frequency signals, the real part of the first reflection coefficient spectrum can be expressed as:
Γ ( f ) = Re [ Γ 0 , f ] = e 2 α l cos ( 4 π l f v )

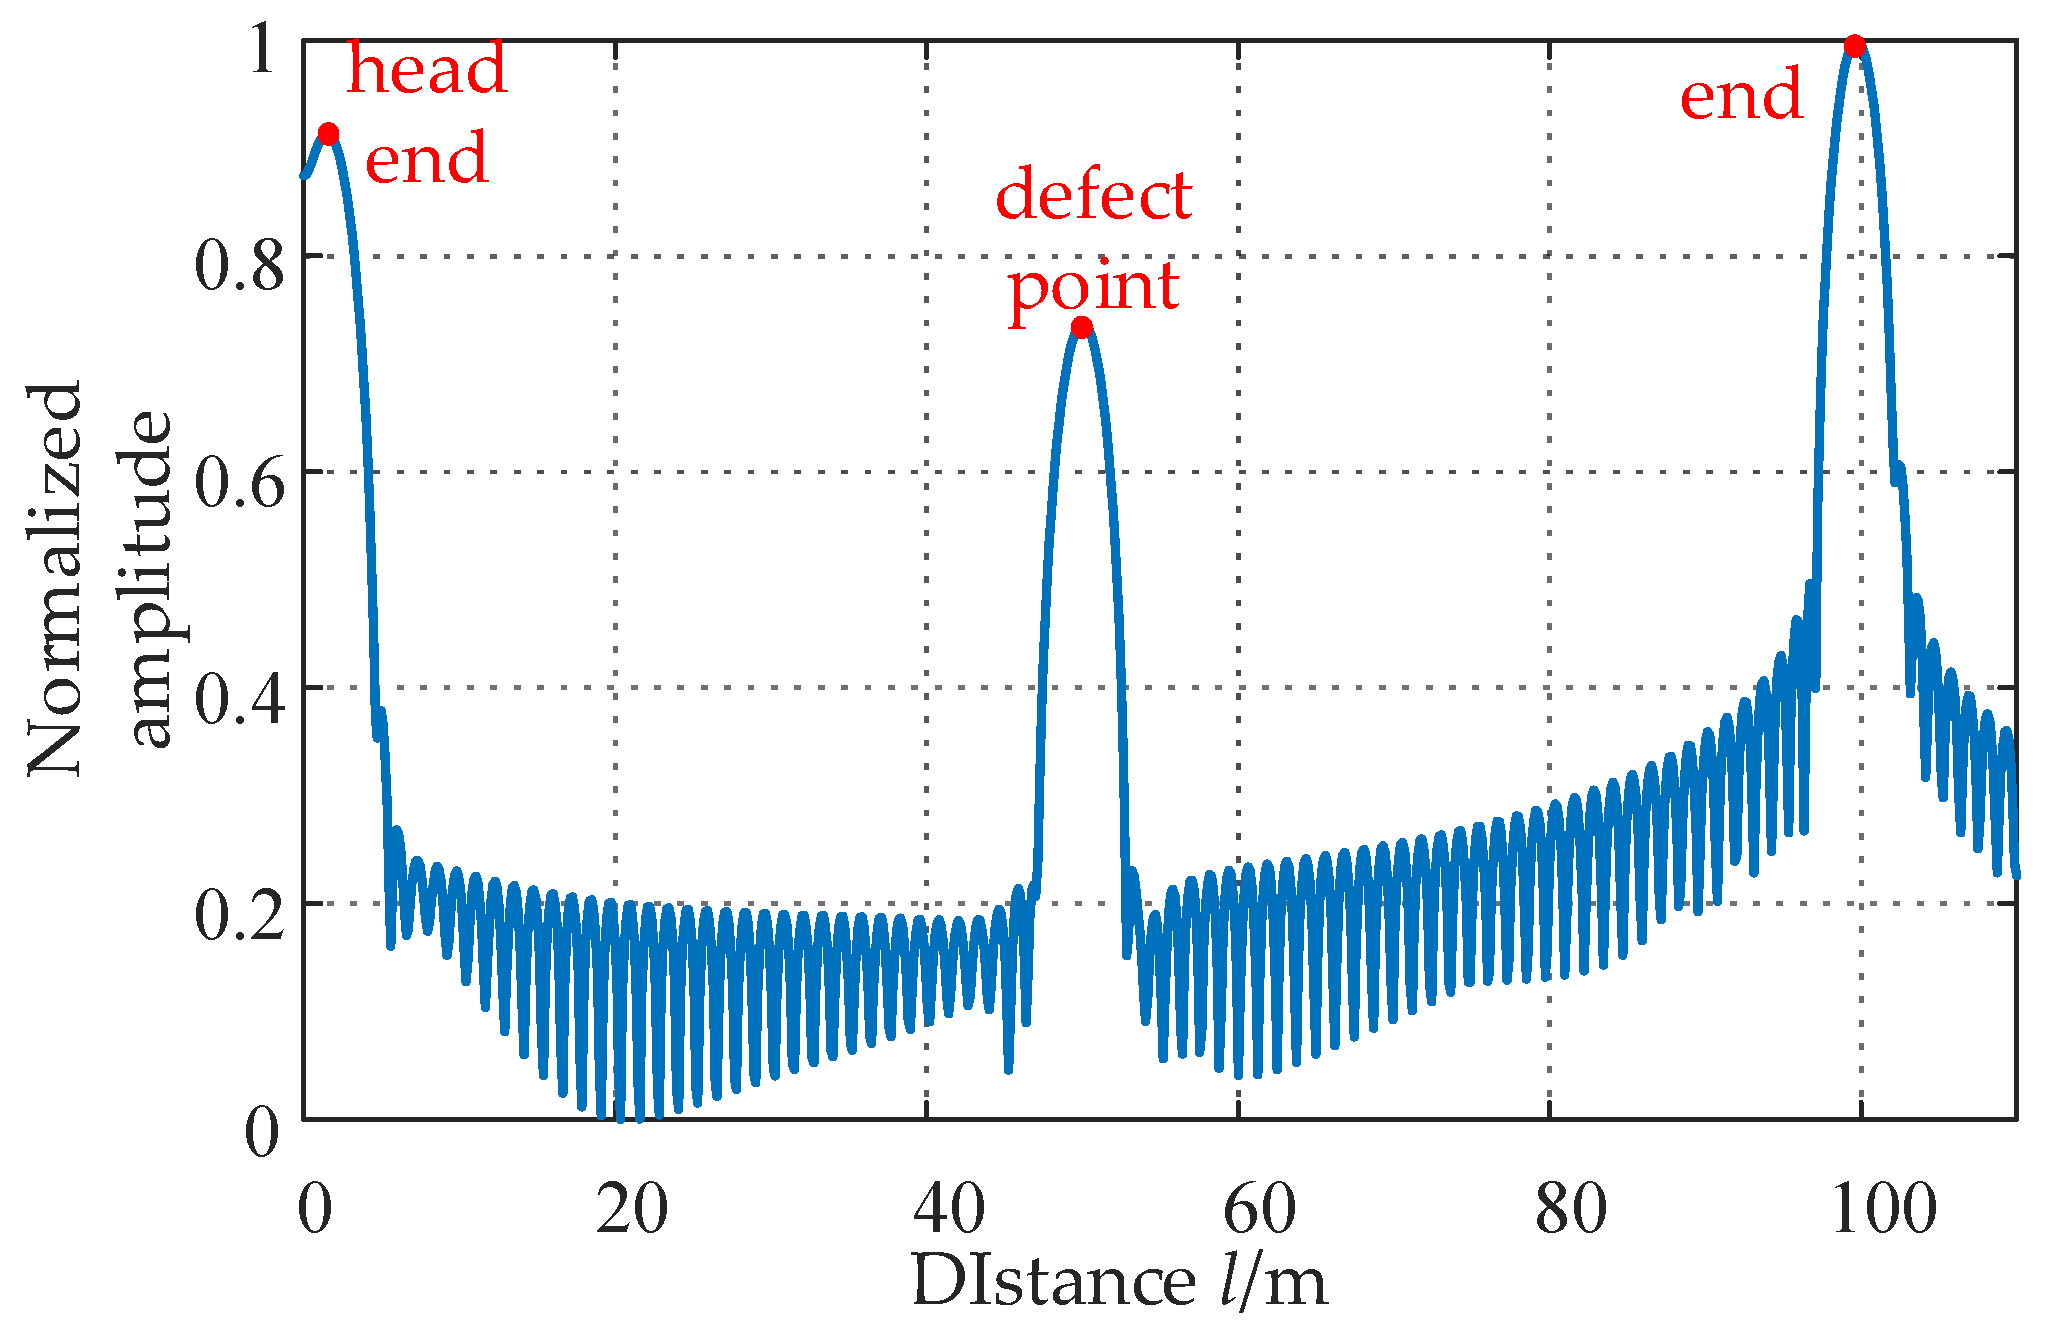
2.2. Defect Localization Principle

Under high-frequency conditions, v tends to be constant [14]. Therefore, in Equation (11), if f is treated as the independent variable, 2l/v can be regarded as the equivalent frequency generated at the cable end. When structural changes occur at position z’ along the cable, such as intermediate joints or defects, a component with an equivalent frequency of 2z’/v will arise in Γ’(f). Consequently, the FDR technique decomposes the equivalent frequencies in the real part of the reflection coefficient via Fourier transform (FT), converting them into a frequency spectrum with the distance on the horizontal axis. This enables the localization of impedance discontinuities (e.g., joints or defects) in the cable. By applying the Kaiser window function to suppress spectral leakage and amplify reflection characteristics, a frequency domain localization plot, as shown in Figure 2, is obtained. The simulation data in Figure 2 simulate a defect at 50 m in a 100 m cable. When a defect exists, a reflection peak appears at the corresponding position in the frequency domain localization plot, thereby achieving defect localization.

3. Dynamic FDR-Based Moisture Localization and Diagnosis Method for Cables

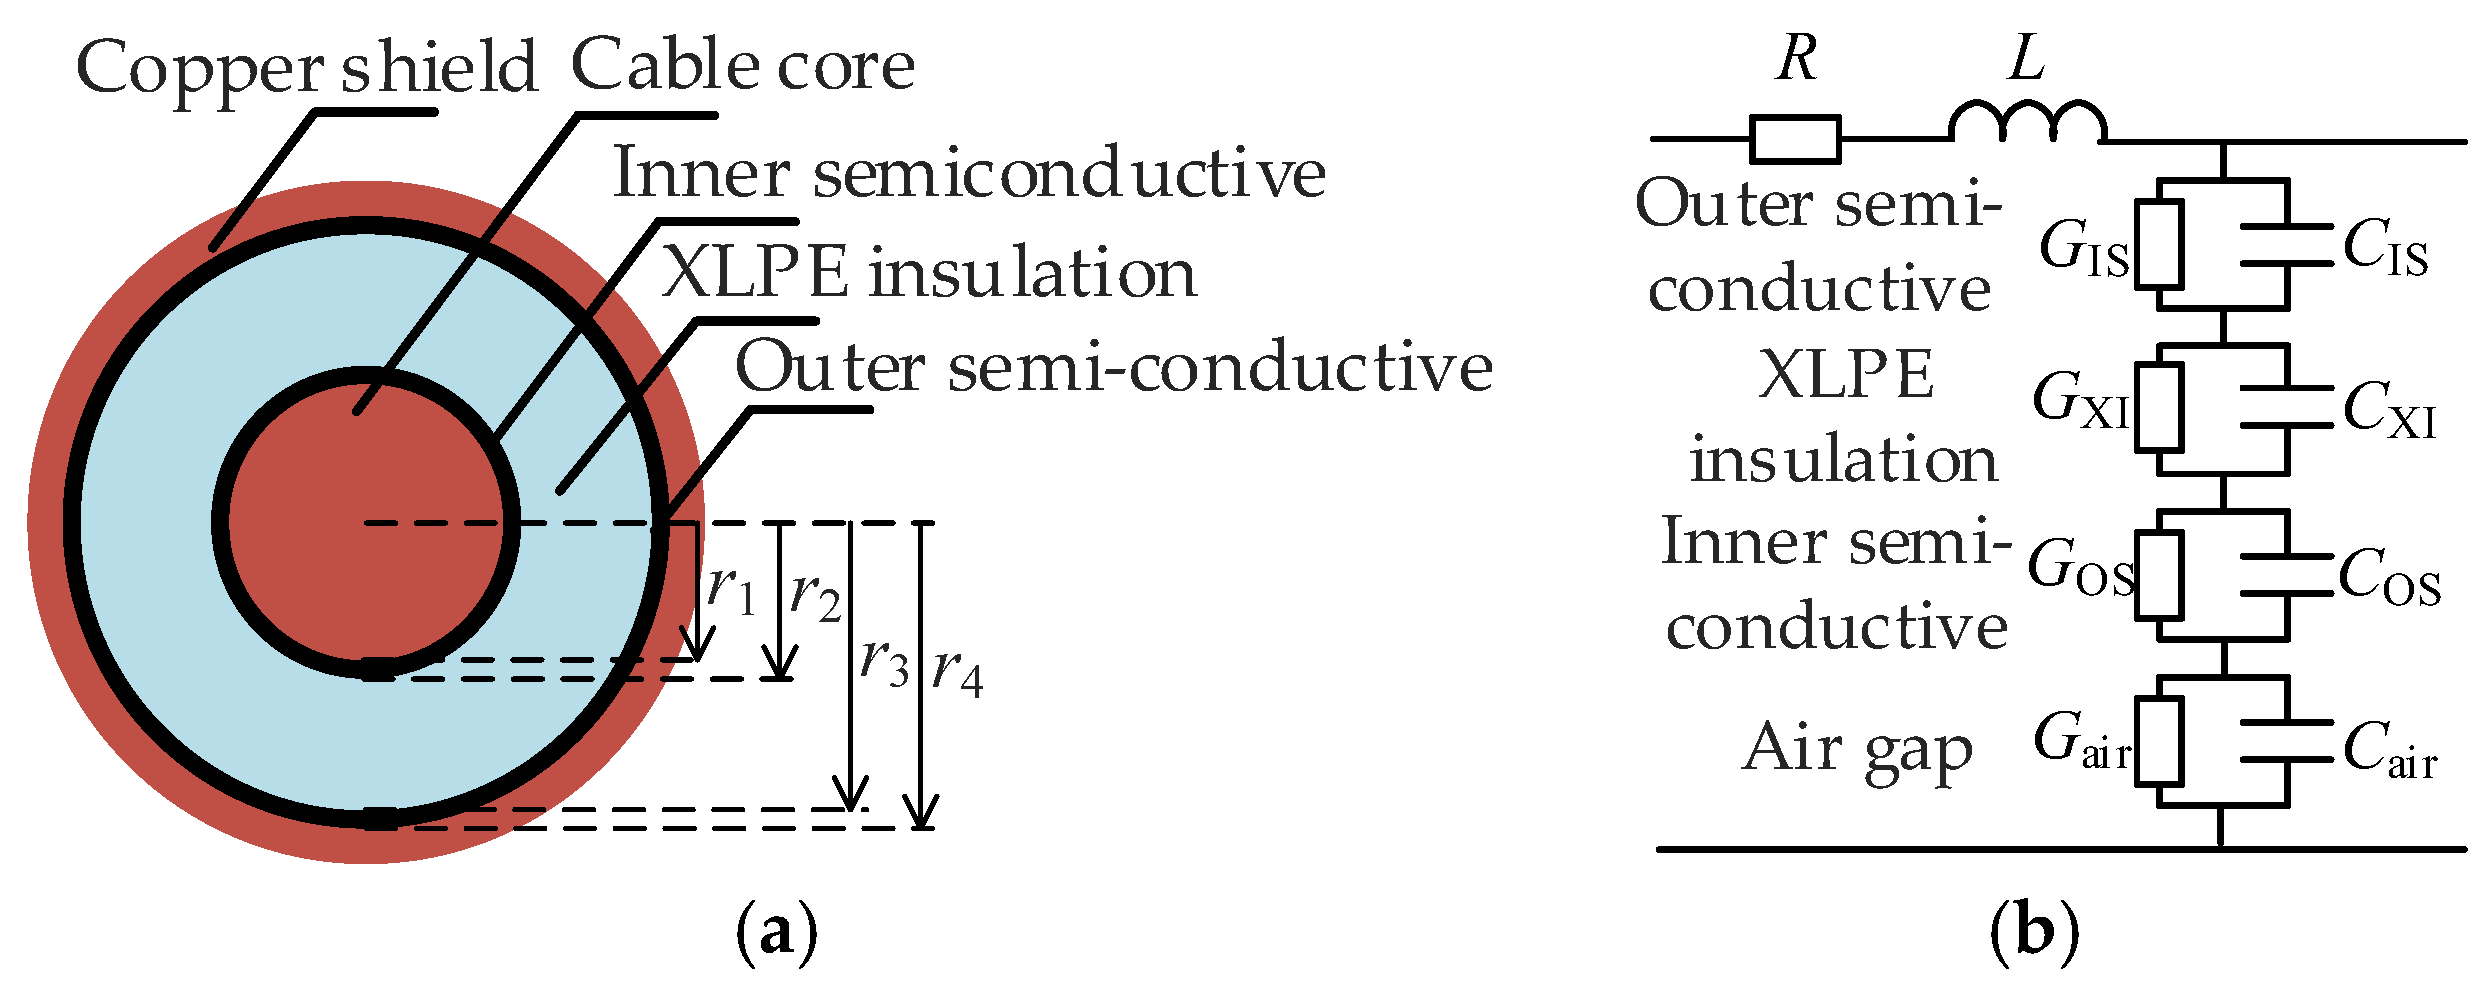
3.1. Moisture Characteristics and Capacitance Changes in Three-Core Cables

Before exploring the diagnostic methods for moisture defects, it is necessary to analyze and discuss the distribution of moisture intrusion and the changes in distributed parameters when power distribution cables are exposed to moisture.
Cross-linked polyethylene (XLPE), a commonly used insulator in power cables, has several desirable properties. Therefore, the research subjects of this study are all XLPE power cables [19]. Taking a 10 kV three-core XLPE cable as the research object, its structure is shown in Figure 3a and Figure 4a. As explained in Section 2.1, the distributed parameter model of power cables is mainly represented by four parameters: R, L, G, and C. Among them, R and L, the normal series impedance, are related to the state of the core and the metal shield, while G and C, the shunt admittance, reflect the state of the dielectric materials [20]. Since pure moisture intrusion hardly causes any damage to the core and copper shield, the effects of R and L in moisture defects can be ignored. In addition, the high frequency of the FDR test signal results in ωC >> G, and the influence of cable distributed G on reflection intensity can be ignored. Therefore, when analyzing moisture defects, only the distributed capacitance C’s impact on the characteristic impedance is considered.
Analyzing the influence of the cable structure on the distributed parameters from the core outward, according to the series structure shown in Figure 3a and the formula, the expression for the shunt admittance Y formed by the transmission line and surrounding dielectric is derived [20]:
Y X = G X + j ω C X = 1 / 1 Y k
Y K = G K + j ω C K j 2 π ω ε K ln ( r K / r K 1 )
where YX, GX, and CX represent the overall distributed admittance, conductance, and capacitance of a phase, respectively; Yk, Gk, Ck, σk, εk, and rk represent the distributed admittance, conductance, capacitance, conductivity, permittivity, and outer radius of the k-th layer (k = 1,2,3,…, K (K = 4)), respectively, where k = 1 represents the core, and k = 2 represents the inner semiconductive layer. There is a microscopic gap between the copper shield and the outer semiconductive layer [16], and the presence of gaps in the copper shield provides a pathway for moisture intrusion. Therefore, it is assumed that there is an extremely thin air layer between the outer semiconductive layer and the copper shield, as shown in Figure 3b.
The structure of the three-core distribution cable is shown in Figure 4a. The interphase capacitance is mainly composed of the parallel symmetric line capacitance formed by the dielectric between conductors. In reference [21], the capacitance between two shielded cables is described as a combination of conductor-to-ground capacitance, conductor-to-shield capacitance, core-to-core capacitance, and shield-to-shield capacitance. After neglecting the ground capacitance, the interphase capacitance is illustrated in Figure 4b. The expression for the distributed capacitance of parallel cylindrical symmetric lines is as follows:
C X Y = π ε X ln ( D r )
where CXY represents the distributed capacitance between any two cores or shields, r is the conductor radius, D is the distance between the centers of the two conductors, and εX is the permittivity of the dielectric between the two conductors.
In FDR testing, the interphase testing connection method shown in Figure 5a is typically used. Therefore, assuming the three phases are completely symmetrical, the intact distributed capacitance C0 of the cable (taking the AB phase test as an example) can be expressed as follows:
C 0 = 3 2 ( C A · C AB 2 C AB + C A + C ab )
If the cable’s outer sheath is damaged, moisture can easily intrude into the cable in a humid environment, causing the cable to become moist. When moisture intrudes into the cable, it displaces the air in the interphase and intra-phase gaps. Since the relative permittivity of water εwater (=81) is much greater than that of air εair (=1), the series capacitance Cair and CXY increase. According to the characteristics of series capacitance, the distributed capacitance C1 of the moist section will be greater than the intact distributed capacitance C0.

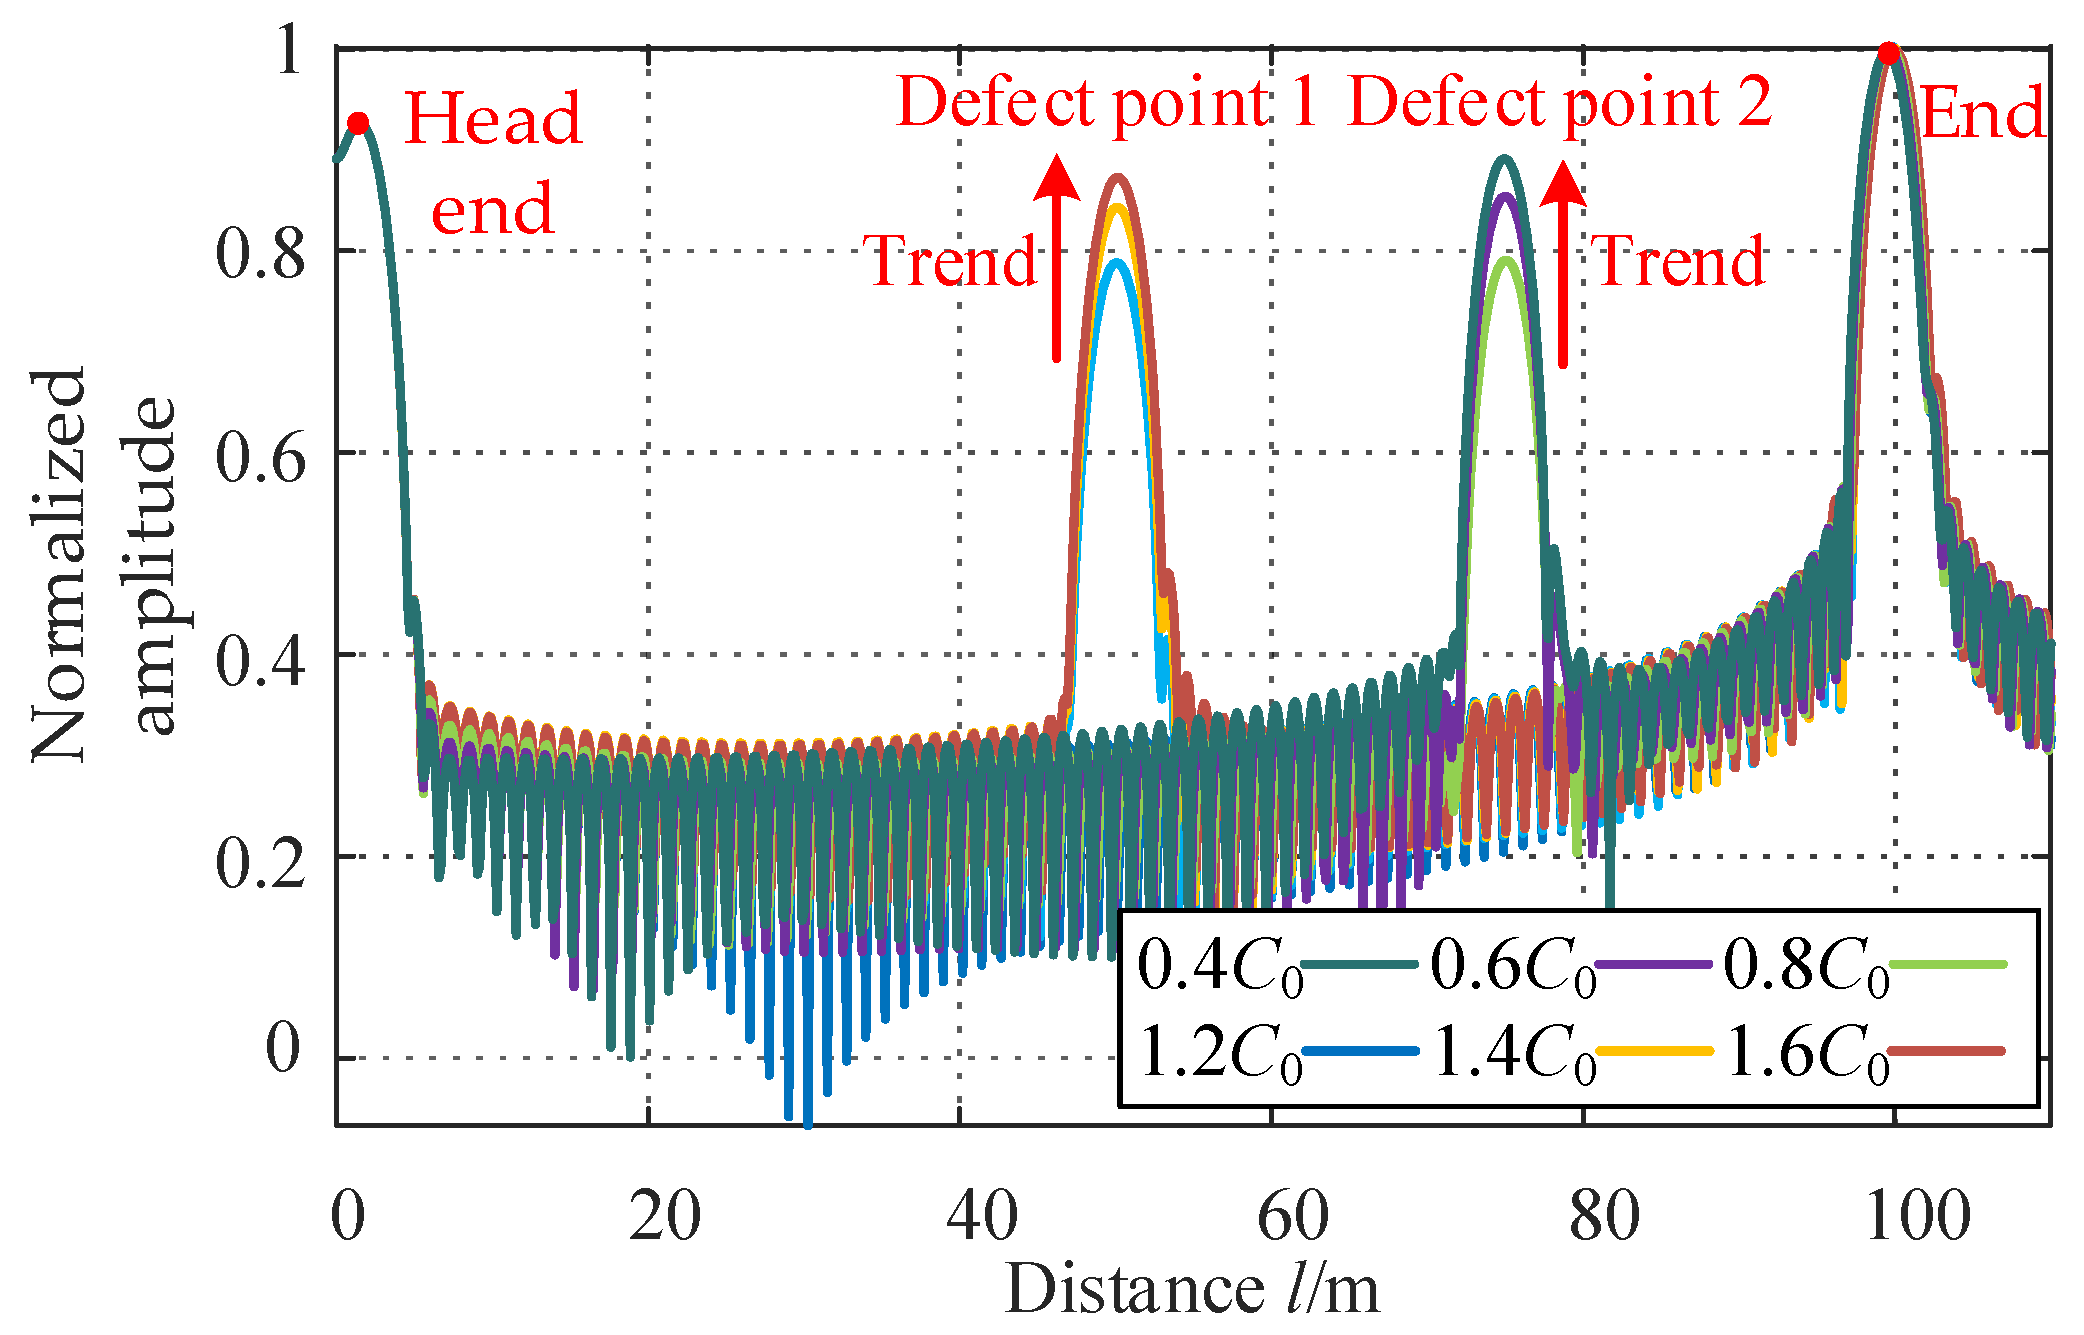
3.2. Dynamic Gradient on the Dynamic FDR Frequency Domain Localization Map

After moisture causes local capacitance changes, a reflection peak will appear on the FDR frequency domain localization map, allowing the defect to be located. However, current technology cannot determine whether the defect type is a moisture defect after locating the defect point. This is because any point on the frequency domain localization map at which the characteristic impedance is discontinuous with the cable body will produce a reflection peak, and the defect type cannot be judged solely based on the amplitude. Additionally, during FT processing, pseudo-peaks caused by spectral leakage are inevitable, which are not due to impedance discontinuity. In summary, the singularity of FDR frequency domain localization map information makes it impossible to accurately identify the moisture content of distribution cables based solely on amplitude characteristics, thereby reducing operation and maintenance efficiency.
To address the challenge of effectively identifying moisture defects, a diagnostic strategy is proposed: After locating the suspected moisture defect anomaly on the FDR frequency domain localization map, a temperature stimulus is applied. Since moisture in the defect is temperature-sensitive, heating induces dynamic changes in the distributed capacitance, thereby altering the reflection coefficient. In contrast, electrical parameters of other defect types exhibit minimal or distinct responses to temperature. This approach utilizes the dynamic variation trends on the FDR frequency domain localization map as a novel defect feature, enabling the precise localization and diagnosis of moisture defects. As indicated by Equation (7), the distributed capacitance C is a key parameter influencing the reflection coefficient at the defect point and is directly related to the dielectric state of the cable. When the localized distributed capacitance C undergoes dynamic changes due to external stimuli, the reflection peak amplitude on the frequency domain localization map will correspondingly vary.
To elucidate the correlation between dynamic electrical parameter changes and localized features, a 100 m long 10 kV XLPE cable was simulated using the transmission model formula in Section 2 in Python 3.10. Two defects were introduced: one at the 50 m point with dynamically increasing distributed capacitance C1 and another at the 75 m point with dynamically decreasing distributed capacitance C2.
The dynamic gradient on the frequency domain localization map is illustrated in Figure 6, where C0 represents the intact cable capacitance. When C1 at 50 m increases to 1.2 C0, a reflection peak emerges due to impedance discontinuity. As C1 further increases from 1.2 C0 to 1.8 C0, the reflection peak amplitude progressively intensifies. Similarly, at the 75 m point, as C2 decreases from 0.8 C0 to 0.4 C0, the reflection peak amplitude also increases. This demonstrates that the reflection peak amplitude reflects the degree of deviation from the normal characteristic impedance at the defect location. Specifically, the amplitude correlates with |C − C0|: larger deviations result in higher peak amplitudes, while values closer to C0 yield smaller amplitudes.
Therefore, if the distributed capacitance C of a cable moisture defect undergoes dynamic variations under specific stimuli, while other defect types exhibit insensitivity or divergent response trends to such stimuli, the effective diagnosis of moisture defects can be achieved. Water, as the dominant factor influencing the electrical parameters of moisture defects, displays highly temperature-sensitive electrical properties. For instance, the temperature-dependent variation in εwater significantly exceeds that of the dielectric constant εXLPE in the cable’s primary XLPE insulation. Furthermore, the physical state of water is also strongly influenced by temperature. Consequently, temperature can serve as a targeted stimulus source to induce dynamic changes in the distributed capacitance C1 of moisture defects, thereby establishing novel defect signatures and diagnostic criteria.

4. Temperature Response of Distributed Capacitance in Cable Moisture Defects

4.1. Temperature Response of Dielectric Constants in Moisture Defects

To investigate the influence of temperature on the distributed capacitance of moisture defects, it is critical to first clarify how temperature affects the dielectric constants of water and XLPE insulation within the moisture-affected cable segment.
Applying a temperature stimulus to the cable body induces a nonlinear decrease in the dielectric constant ε of the cable’s insulation medium as the temperature rises. In reference [22], the temperature-dependent response of the dielectric constant εXLPE for the cable’s XLPE insulation material was experimentally studied and measured. Using least squares fitting, the temperature response of εXLPE was derived, as summarized in Table 1.
From Table 1, it is evident that εXLPE is inversely proportional to temperature. Combining Equations (7) and (13), when the ratio of inner to outer radii remains constant, the capacitance CX of the intact cable decreases with increasing temperature under dry conditions, leading to a corresponding decrease in the overall capacitance C0. Consequently, the characteristic impedance Zx increases with temperature, causing the reflection peak to exhibit an upward trend.
When a temperature stimulus is applied to water, the thermal motion of water molecules intensifies as the temperature rises. This disrupts the hydrogen bonds between molecules, increases disorder in molecular arrangements, and reduces the ability of dipole moments to polarize under an external electric field, thereby decreasing the dielectric constant εwater. The relationship between εwater and temperature T is described by Equation (16).
ε water = 87.740 0.40008 T   + 9.398 × 10 4 T 2 1.410 × 10 6 T 3
The temperature response of εwater is summarized in Table 2. As shown in Table 2, εwater is also inversely proportional to temperature, but its initial value and variation magnitude are significantly greater than those of XLPE insulation. It can be inferred that under the influence of temperature, the distributed capacitance of moist and intact cable segments will exhibit a pronounced divergence.

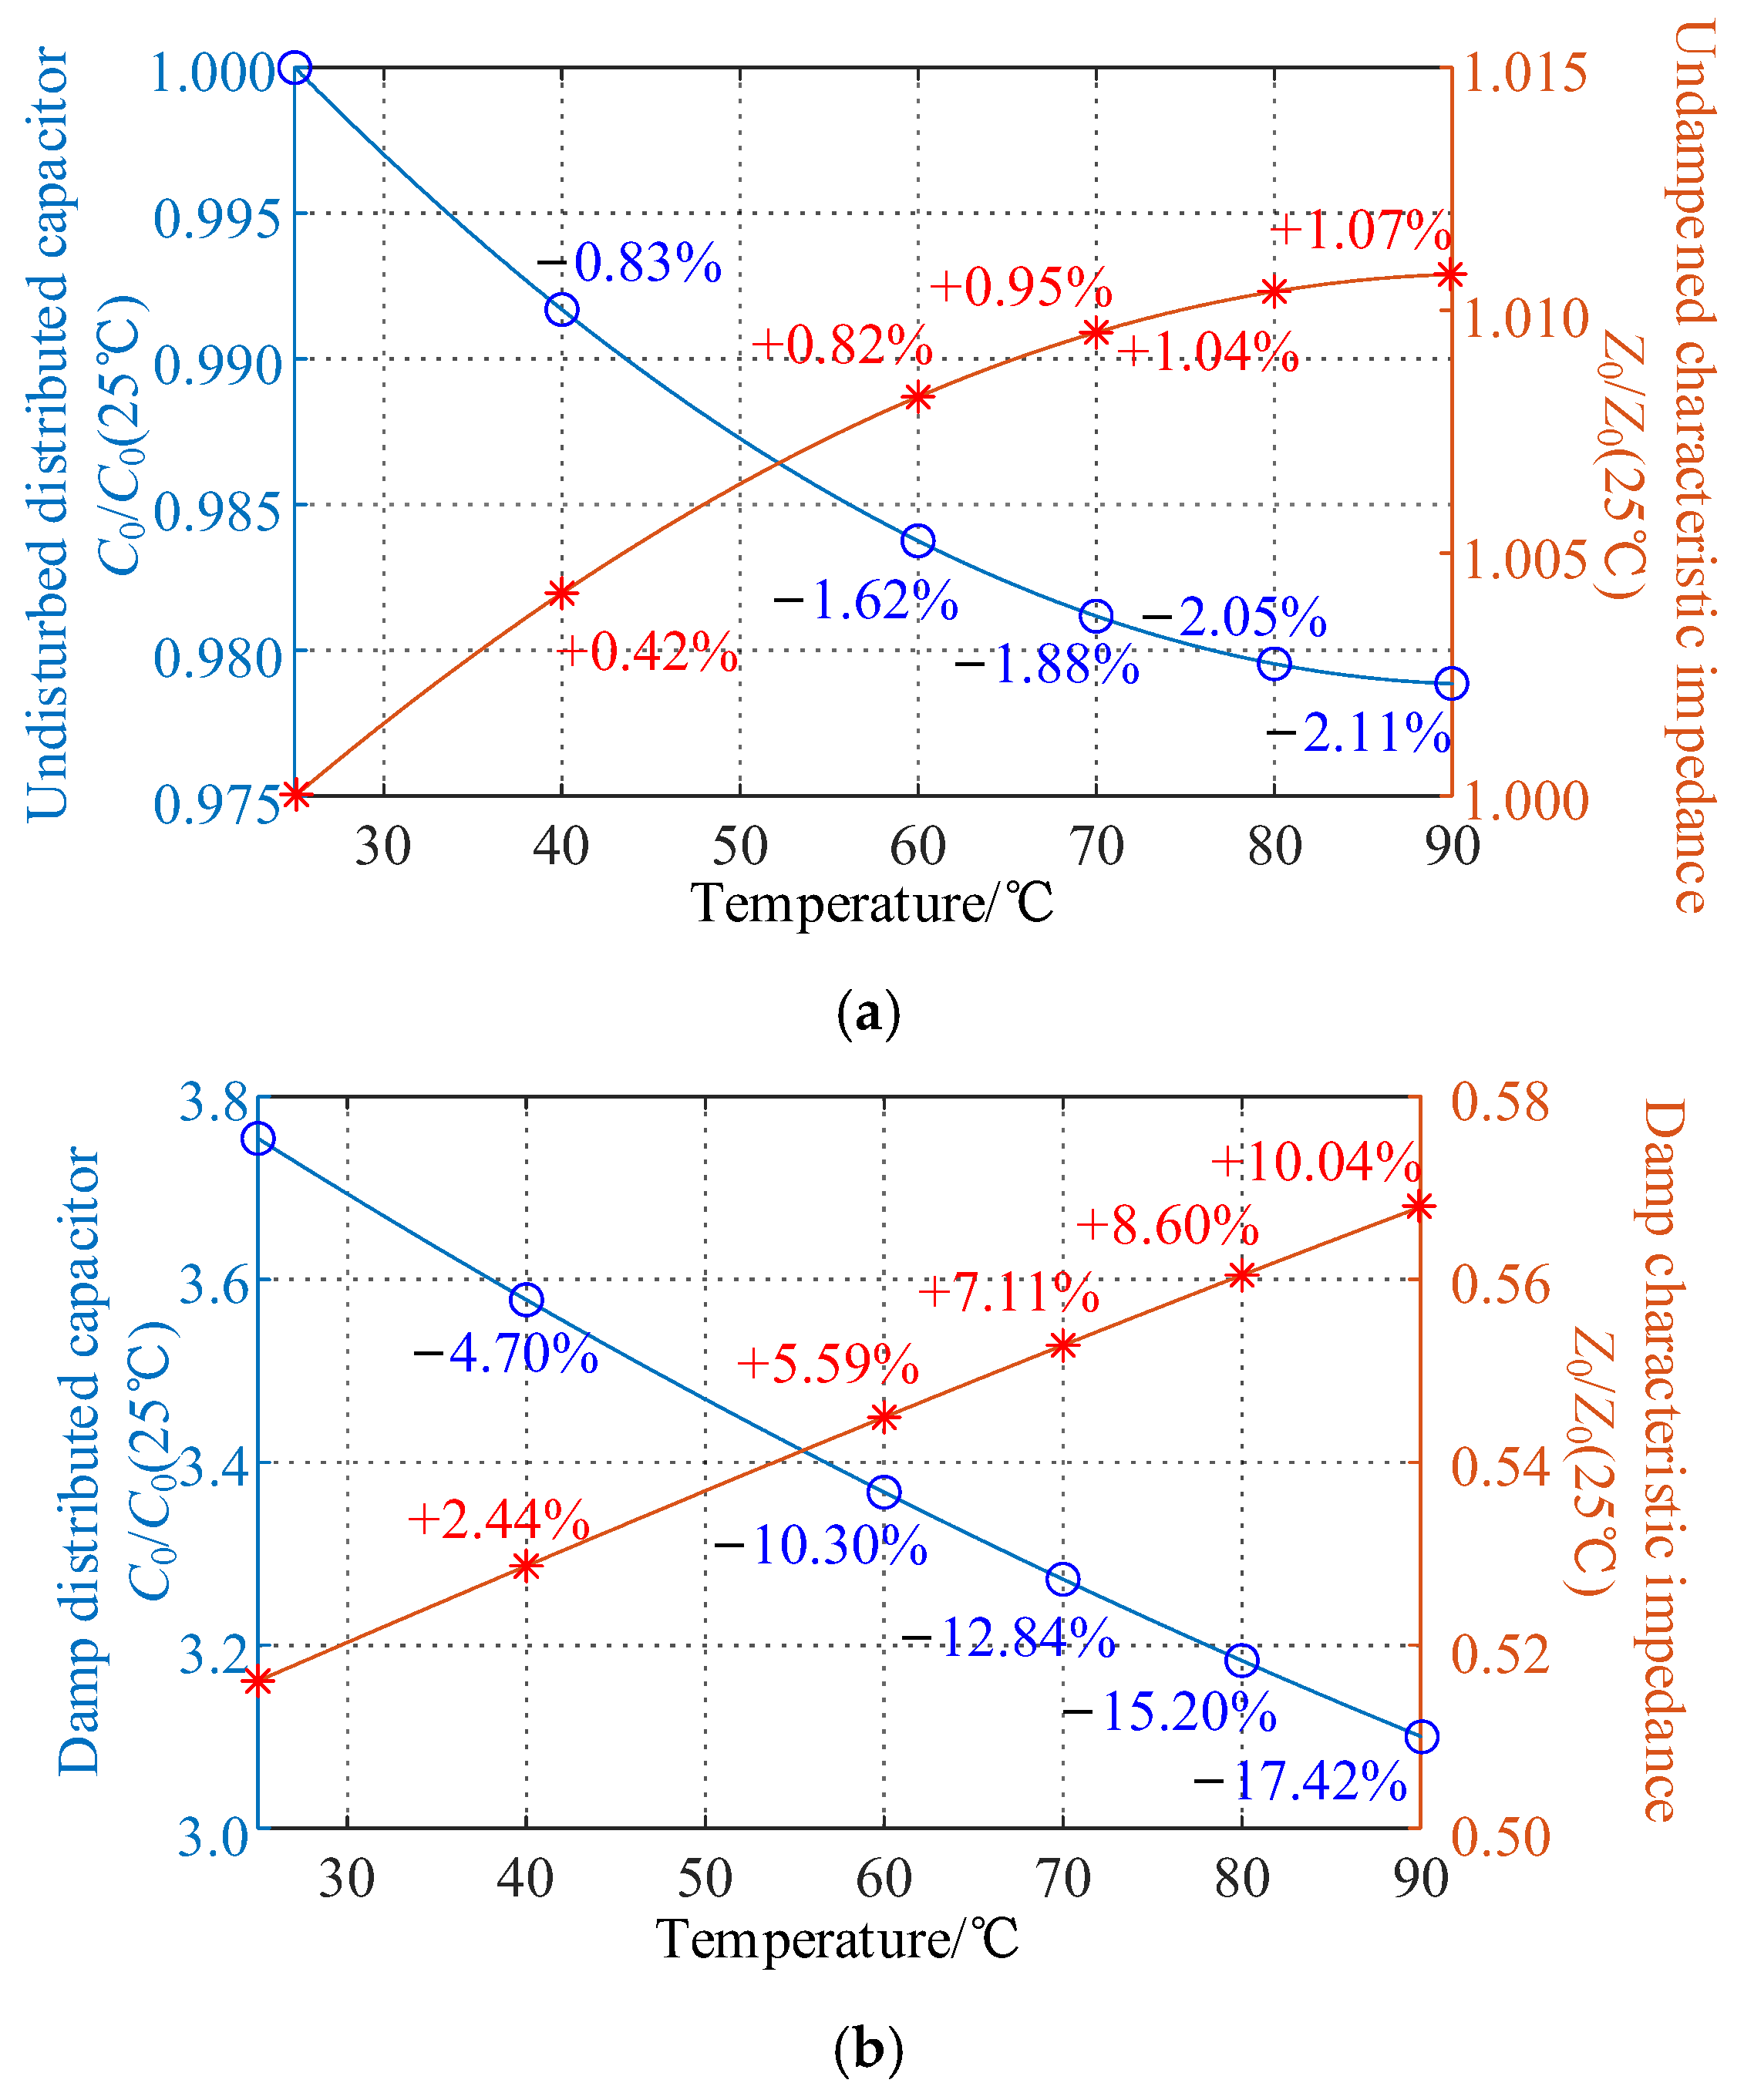
4.2. Computational Analysis of Temperature Response in Moisture-Affected Cable Capacitance

To investigate the dynamic variations in reflection peaks on the frequency domain localization map for moisture-affected and intact cables under temperature stimuli, a numerical simulation of the temperature-dependent responses of the distributed capacitance and characteristic impedance is essential.
Therefore, to analyze the temperature responses of C and Z, a parameterized simulation model of the cable was developed. This model integrates the fitted data from Table 1 and Table 2 with the simulation parameters of a 10 kV XLPE cable (with a conductor cross-sectional area of 35 mm2) listed in Table 3. The calculations were performed at the initial frequency of 150 kHz, corresponding to the FDR testing system’s operational range.
After moisture fully infiltrates and occupies the gaps, the calculated temperature responses of the distributed capacitance C and characteristic impedance Z for both moisture-free and moisture-affected cable segments are illustrated in Figure 7. Using the distributed capacitance C0 (25 °C) and characteristic impedance Z0 (25 °C) of the intact segment at room temperature (25 °C) as baseline values, the relative variations in these parameters were analyzed.
In Figure 7a, it is observed that as the temperature increases from 25 °C to 90 °C, the moisture-free distributed capacitance C0 decreases by 2.11%, while the characteristic impedance Z0 increases by 1.07%, gradually deviating from the baseline. As indicated by Equation (5), if this point represents an intact cable, a reflection peak will emerge under temperature stimulation, with its amplitude increasing as the temperature rises.
In Figure 7b, after moisture infiltration, the distributed capacitance C1 of the affected segment increases by 2.76 times compared to the intact segment. As the temperature rises from 25 °C to 90 °C, C1 decreases by 17.42%, and Z1 increases by 10.04%, gradually approaching the baseline values. According to Equation (5), the moisture defect generates a reflection peak, but under temperature stimulation, the peak amplitude decreases as the temperature increases.

5. Experimental Validation

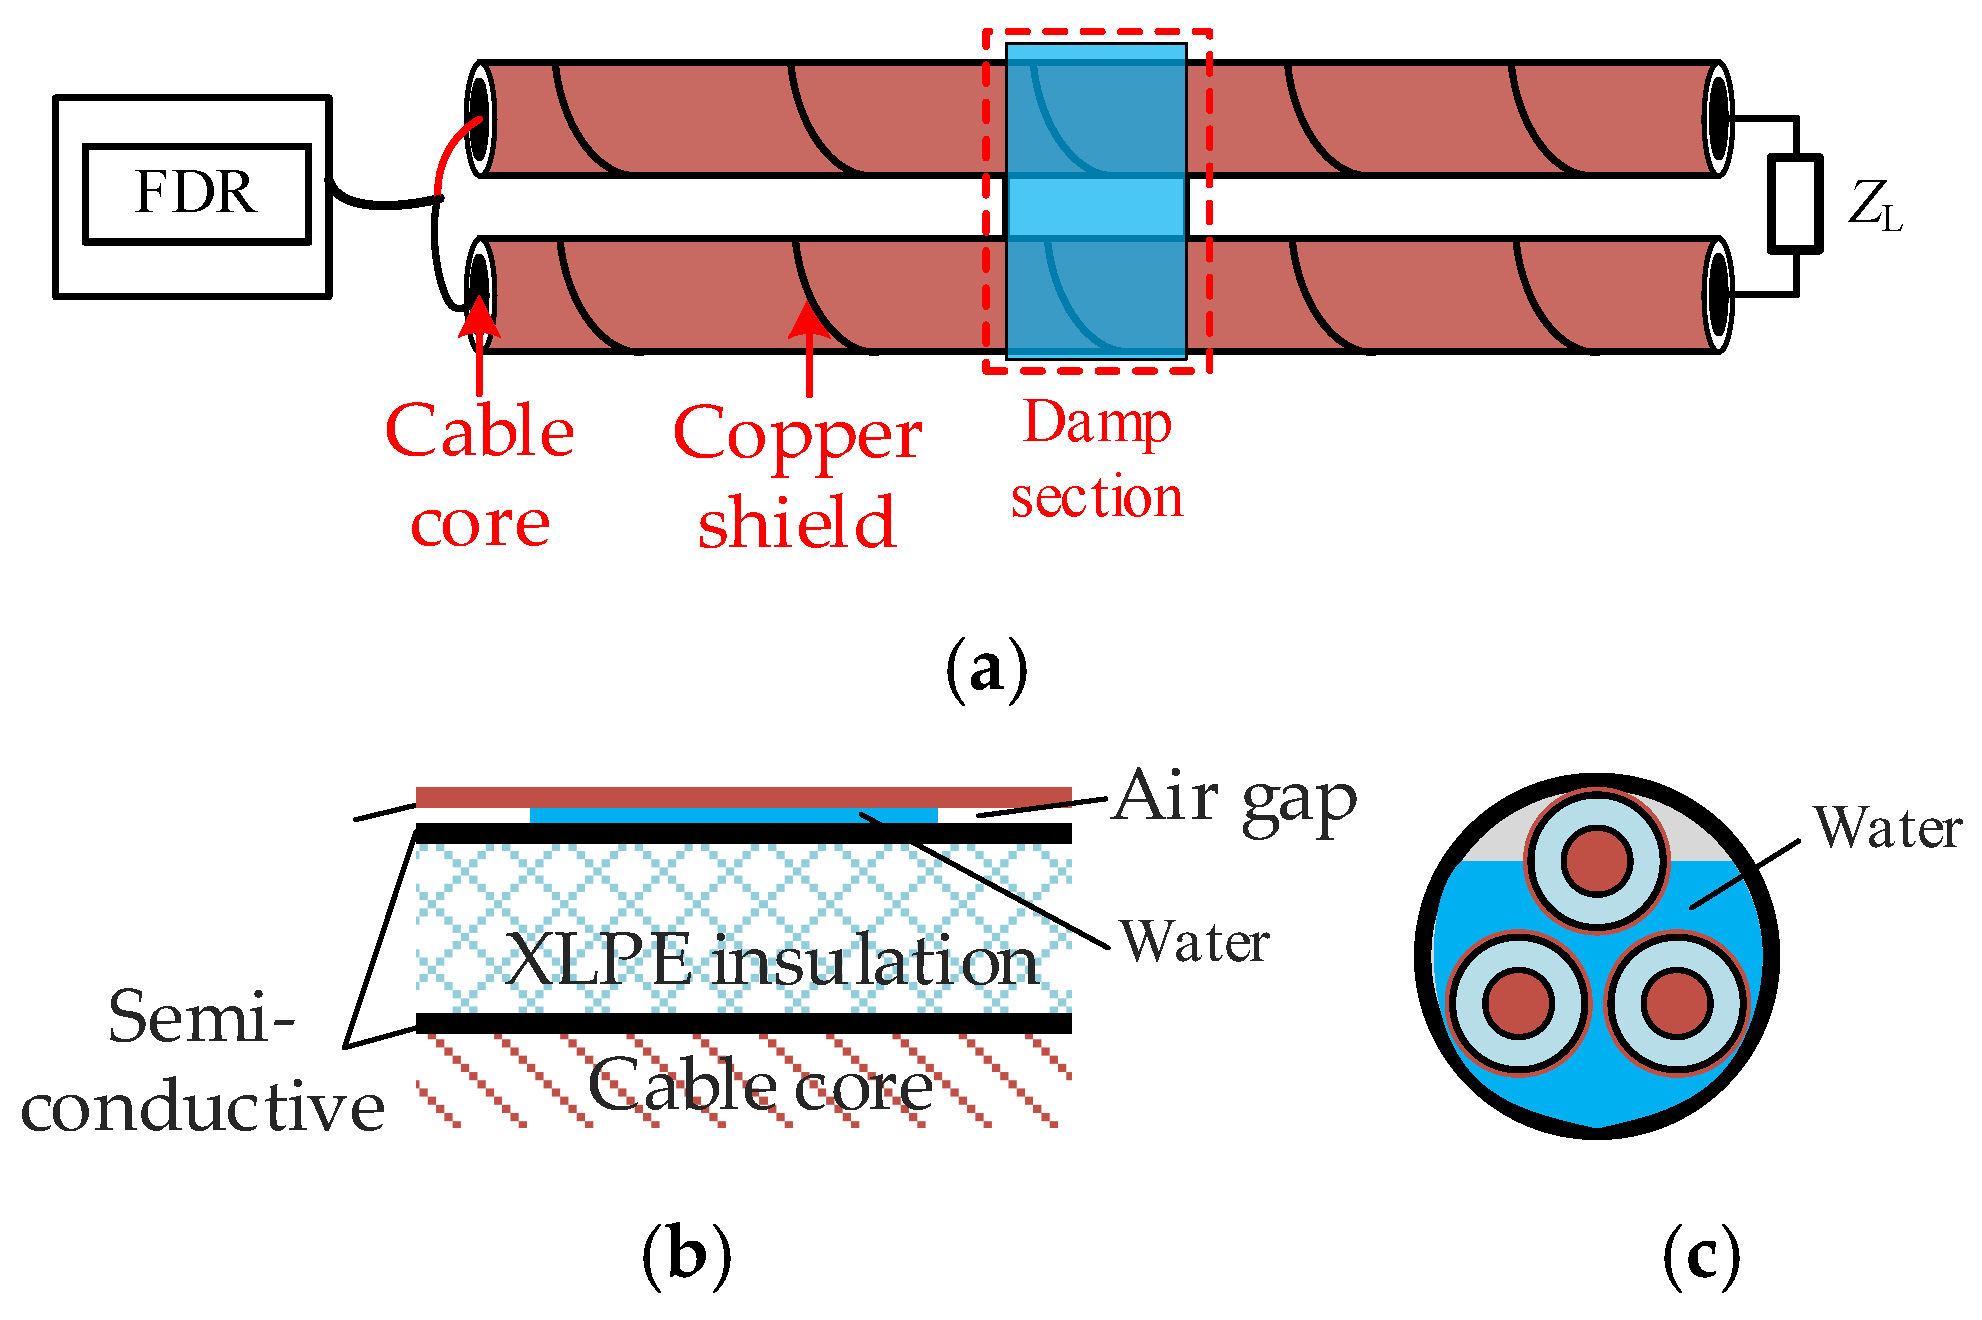
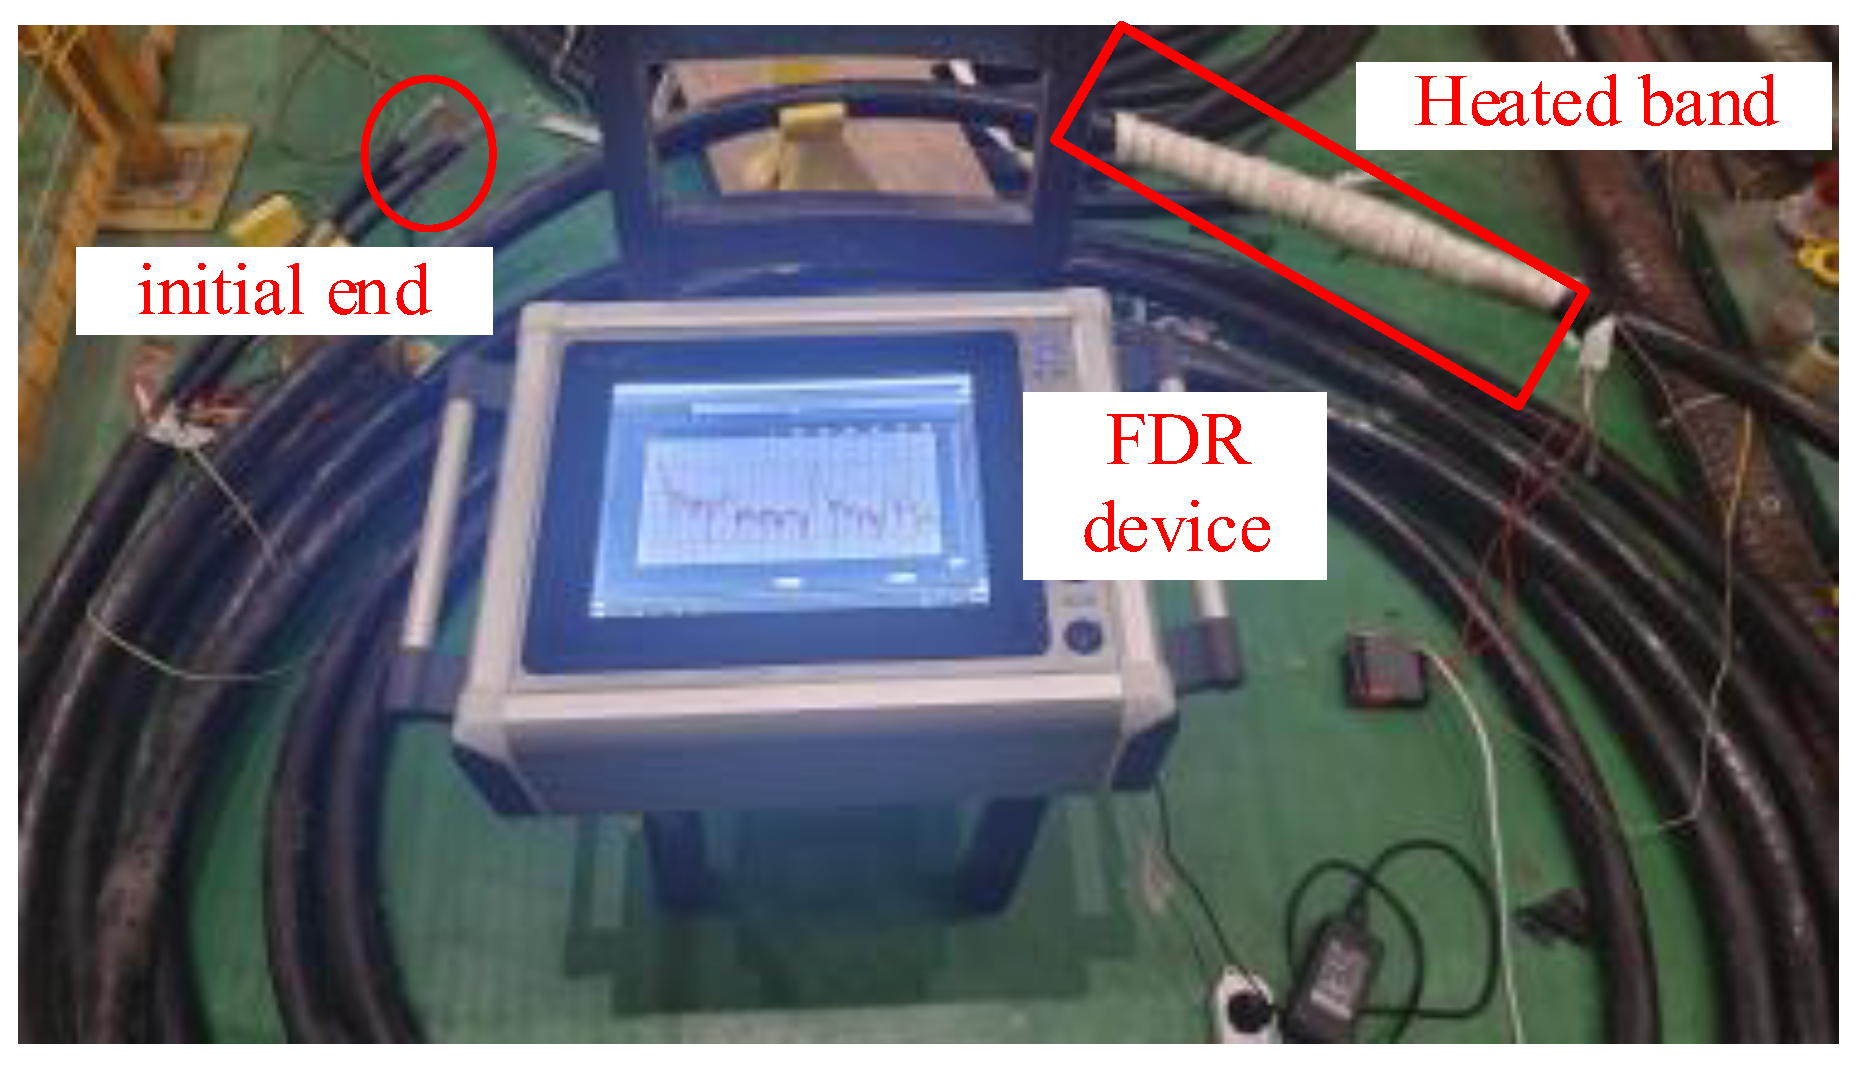
5.1. Experimental Design

To validate the effectiveness of the proposed method, experiments were conducted on a 31.5 m YJLV 3 × 35 XLPE 10 kV three-core power cable. The FDR device was employed to measure its front-end reflection coefficient spectrum, enabling an experimental analysis of the proposed methodology. The FDR testing system comprises a PC, data acquisition system, power splitter, and coupler [23]. The sweep signal parameters were configured as follows: start frequency: 150 kHz (determined by the hardware limitations of the testing system); stop frequency: 300 MHz; number of sweep points: 20,000 points; and test fixture length: 1.5 m.
To investigate the differences in the time frequency map variation trends between intact and moisture-affected cable states under thermal stimulation, a localized temperature excitation experiment was designed at the 14 m point of the cable using heating tape. This setup aims to validate the effectiveness of the proposed method. Due to the inefficiency of low-temperature heating, the following protocol was implemented to optimize experimental efficiency and outcomes: after acquiring baseline data at ambient temperature, heating was applied in 10 °C increments from 60 °C to 90 °C, with each temperature maintained for 30 min to ensure a uniform thermal distribution.
The test cable and experimental configuration are shown in Figure 8. The heating tape was wrapped over a 0.6 m cable segment. Given the similar electrical characteristics among phases, the interphase testing method was adopted for enhanced measurement accuracy—specifically, the test fixture was connected to one core per phase at both ends [24].

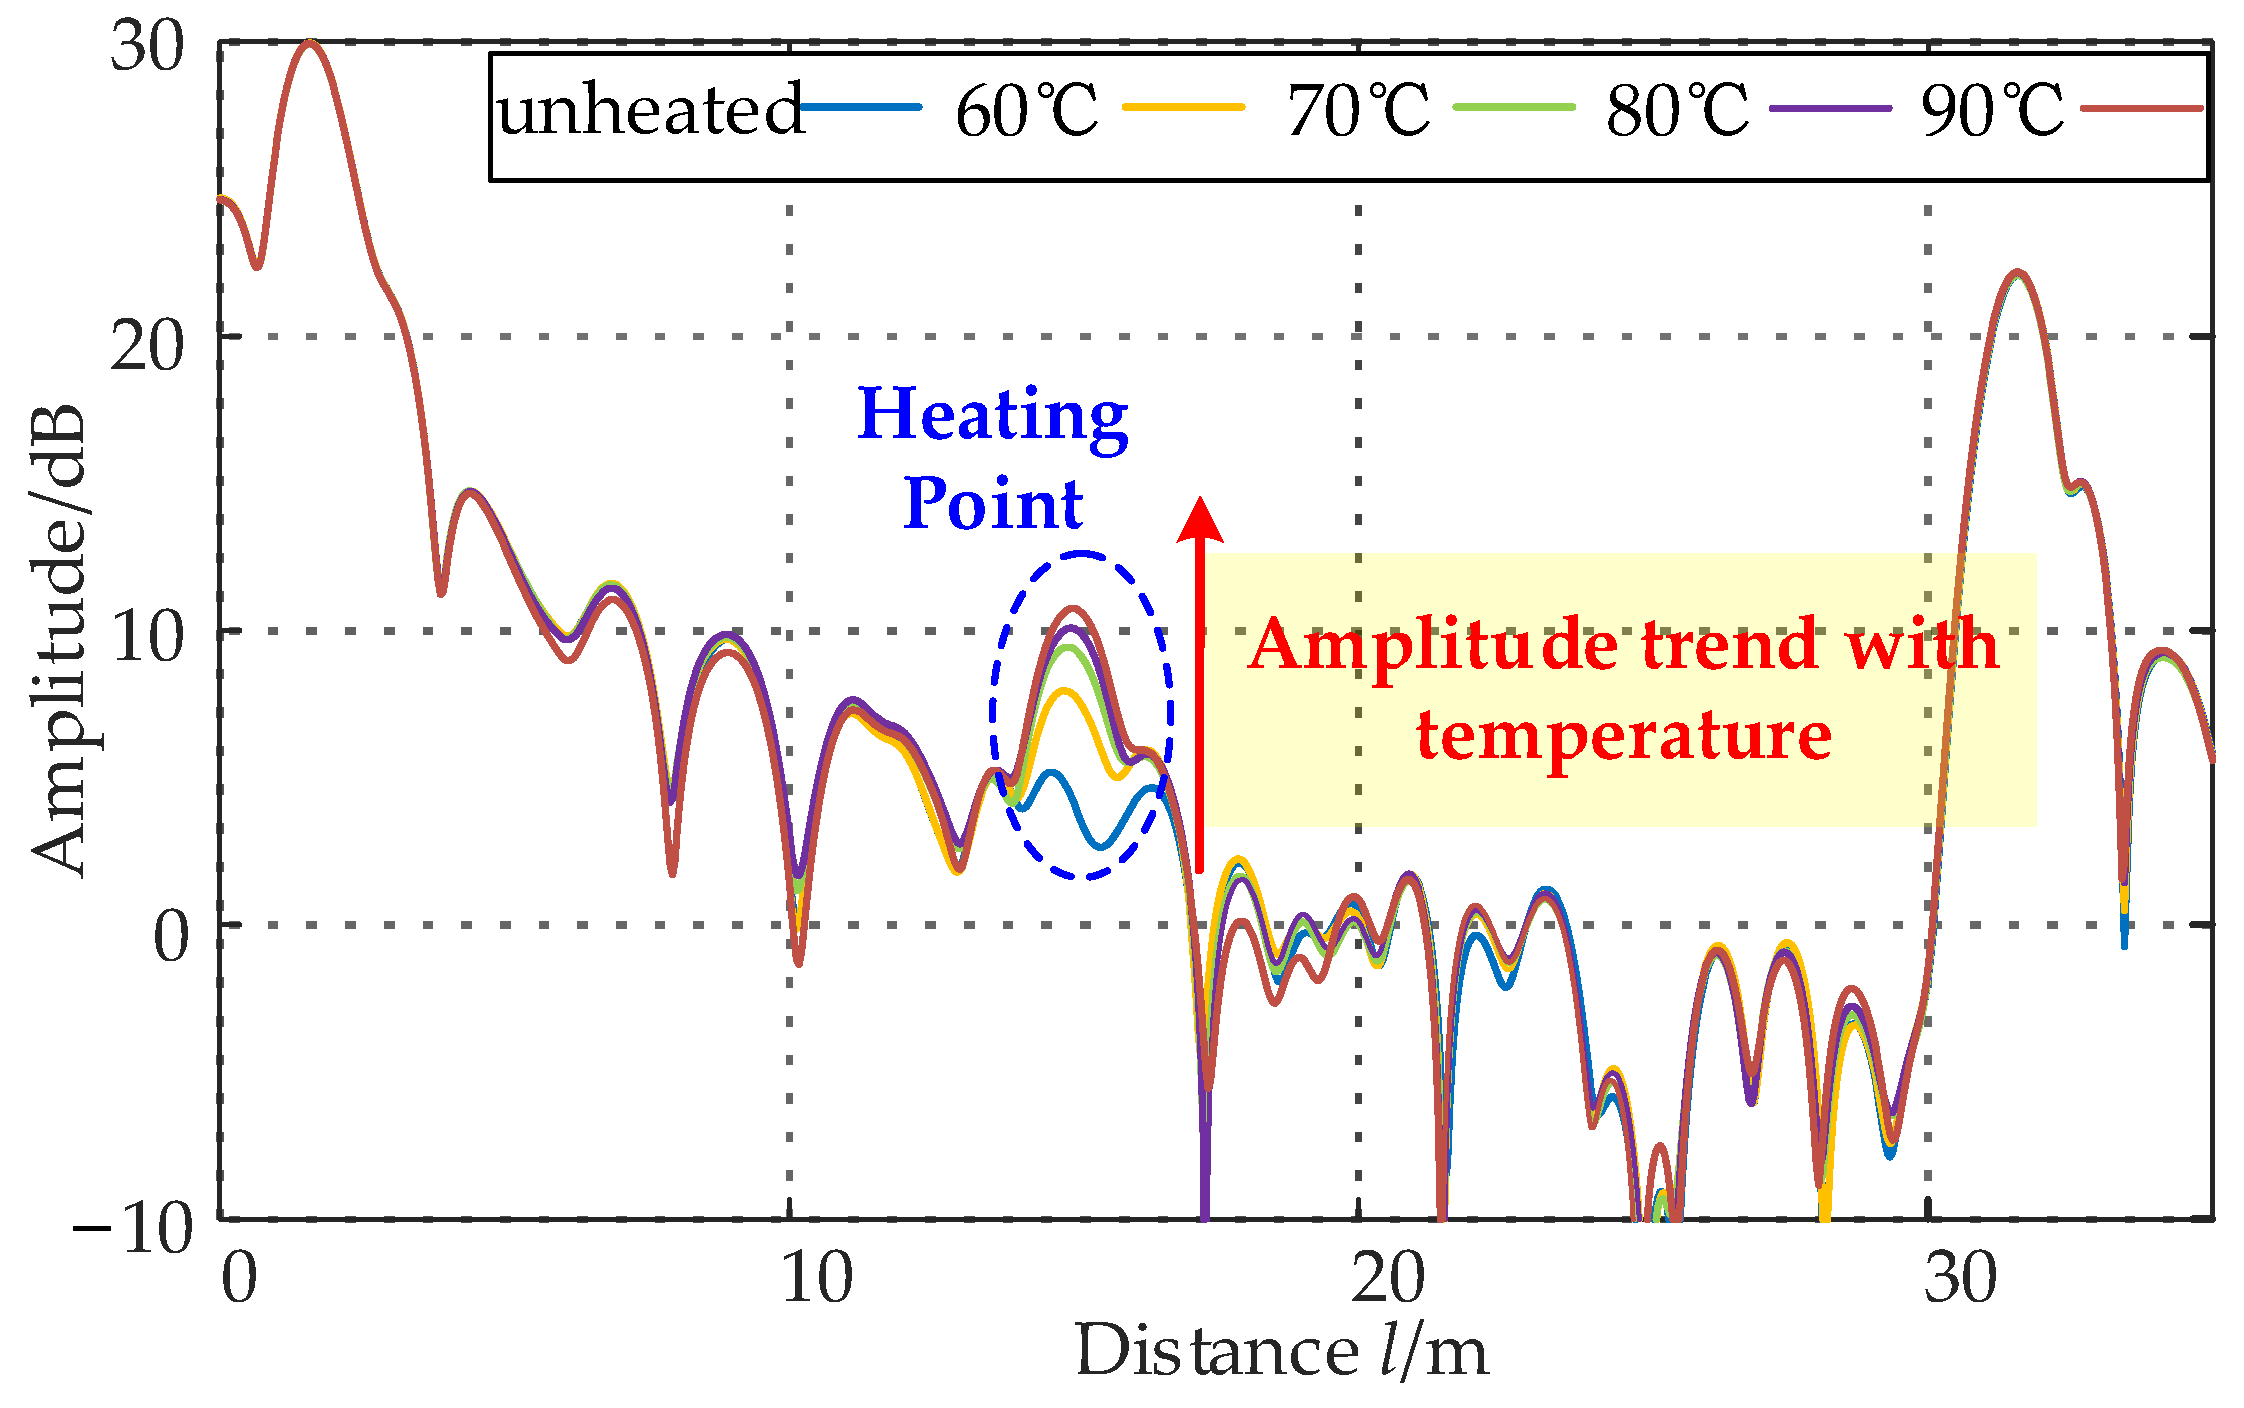
5.2. Experimental Results

Figure 9 shows the frequency domain localization plot of the intact, moisture-free cable segment under thermal excitation. A distinct reflection peak emerges at the 15 m position compared to the ambient-temperature state. The reflection peak amplitude exhibits a temperature-dependent increase: at 90 °C, the amplitude increases by 2.78 dB relative to the 60 °C measurement. This demonstrates that rising temperatures induce a decrease in distributed capacitance and a corresponding increase in characteristic impedance, causing deviations from the nominal impedance value and amplifying the reflection peak amplitude. These experimental observations align precisely with the theoretical conclusions presented in Section 3.2.
To validate the effectiveness of the temperature-gradient-based cable moisture diagnosis method, the heating experiment steps described in Section 3.2 were repeated on a water-injected cable segment. First, a 0.6 m section of the outer sheath at the 14 m position was stripped. The stripped segment was then sealed with insulating tape and waterproof adhesive, slightly bent to facilitate water retention, and saturated with water using a syringe.
The frequency domain localization results under thermal excitation for the moisture-affected cable segment are shown in Figure 10. After water injection, a distinct reflection peak appeared at the water-injected position, with an amplitude increase of 6.52 dB, confirming significant localized parameter variations caused by moisture ingress. During heating, the reflection peak amplitude decreased as the temperature rose, showing a 3.88 dB reduction at 90 °C compared to the unheated state. This demonstrates that heating reduces the distributed capacitance in moisture-affected regions, causing the characteristic impedance to approach its normal value and decreasing the reflection peak amplitude, consistent with the conclusions in Section 3.2.
After clarifying the dynamic characteristics of moisture-affected cables under temperature excitation, to verify whether the proposed method can distinguish between moisture-related defects and non-moisture-related defects, a copper shielding layer damage defect (as shown in Figure 11) was created at the 3.5 m mark on a 20 m YJLV 3 × 35 XLPE 10 kV cable. The heating test procedure from Section 3.2 was then repeated at the defect location.
Copper shielding layer damage is a typical cable body defect. In FDR (frequency domain reflectometry) field testing, such defects typically exhibit small reflection peaks, making them easily confused with moisture-related defects. This increases troubleshooting difficulty and wastes manpower and resources.
The frequency domain localization diagram of the temperature excitation experimental results for the partial copper shielding layer damage of the cable is shown in Figure 12. After the defect was created, a distinct reflection peak appeared at the defect location, with an amplitude increase of 3.83 dB. During heating, the amplitude of the reflection peak rose with increasing temperature. At 90 °C, the reflection peak amplitude increased by 0.33 dB compared to the unheated state, a relatively minor change.
An analysis of the experimental results indicates that under temperature excitation without moisture, the distributed capacitance of the copper shielding layer damage defect only superimposed the capacitance change caused by the temperature response of the cable’s XLPE insulation on the original capacitance reduction due to the defect. As a result, it exhibited the same upward trend as the intact cable. Although both cases involved temperature excitation without moisture, the initial capacitance values of the intact cable and the copper shielding damage defect differed, leading to variations in the relative changes in reflection intensity at the heating point.
The analysis results demonstrate that the proposed method can effectively diagnose and identify moisture-related defects by considering both the trend and degree of change in the reflection peaks.
Comparative analysis of the three experimental groups confirms that moisture-induced defects in cables exhibit distinct dynamic response characteristics under thermal excitation. The temperature-dependent variation trends of moisture defects serve as a definitive diagnostic criterion for identifying cable moisture ingress.

6. Conclusions

To address the limitations of existing FDR technology in diagnosing and identifying moisture ingress defects, this paper proposes a dynamic frequency domain reflectometry (D-FDR) method for moisture localization and diagnosis in power distribution cables. The dynamic characteristics of frequency domain localization plots for moisture defects in three-core distribution cables are systematically investigated. Experimental results validate the effectiveness of the proposed method, leading to the following conclusions:
Applying thermal excitation to moisture-affected cable segments induces dynamic variations in the distributed capacitance C. By analyzing the correlation between C-variation trends and reflection peak amplitude dynamics in frequency domain localization plots and leveraging the temperature-sensitive nature of moisture, the D-FDR method achieves precise moisture defect localization and diagnosis;
Moisture ingress in three-core cables fills interstitial voids, increasing localized capacitance and generating impedance mismatch points. Under thermal excitation, the distributed capacitance of moisture-affected segments decreases with rising temperatures, causing a dynamic reduction in reflection peak amplitudes on frequency domain localization plots. The temperature-dependent amplitude variation trends of moisture defects exhibit distinct differences from those of intact cables and copper shielding layer damage, establishing an effective diagnostic criterion for identifying moisture-related impedance discontinuities.

Author Contributions

Conceptualization, H.Z., K.Z., X.R. and Y.X.; Methodology, H.Z., K.Z., X.R. and Y.X.; Resources, K.Z., X.R. and Y.X.; Data curation, H.Z.; Writing—review and editing, H.Z., K.Z., X.R. and Y.X.; Supervision, K.Z. and Y.X.; Project administration, K.Z. and X.R.; Funding acquisition, X.R. All authors have read and agreed to the published version of the manuscript.

Funding

This research was funded by the Science and Technology Project of State Grid Corporation of China (Research and Application of High Voltage Cable Typical Defect Detection and Location Technology Based on Time-Frequency Information of Increased Frequency Pulse, Grant No. 5500-202422152A-1-1-ZN).

Data Availability Statement

The data presented in this study are available on request from the corresponding author due to privacy.

Conflicts of Interest

Author Xiang Ren was employed by the company Electric Power Research Institute State Grid Hubei Electric Power Co., Ltd. The remaining authors declare that the research was conducted in the absence of any commercial or financial relationships that could be construed as a potential conflict of interest.

Abbreviations

The following abbreviations are used in this manuscript:
FDRFrequency domain reflectometry
D-FDRDynamic frequency domain reflectometry
FTFourier transform

References

  1. Zhu, B.; Jia, Z.D.; Yuan, Y.; Lu, G.; Fan, W.N.; Guan, Z.C. Research on the insulation properties of 10 kV XLPE damp cable. In Proceedings of the 2015 IEEE 11th International Conference on the Properties and Applications of Dielectric Materials (ICPADM), Sydney, NSW, Australia, 19–22 July 2015; pp. 592–595. [Google Scholar]
  2. Adebomi, A.J.; Putter, H.T.; Legler, P. Contemporary Techniques and Case Studies in Offline Condition Assessment of MV Underground Power Cables. In Proceedings of the 2018 IEEE International Conference on High Voltage Engineering and Application (ICHVE), Athens, Greece, 10–13 September 2018; pp. 1–6. [Google Scholar]
  3. Jeon, S.-S.; Joung, J.M.; Lee, C.-K.; Kim, Y.-D. Cable fault and assessment using multiple frequency autoencoder regression-based reflectometry. IEICE Electron. Express 2022, 19, 20220113. [Google Scholar] [CrossRef]
  4. Khamlichi, A.; Garnacho, F.; Simón, P. New Synthetic Partial Discharge Calibrator for Qualification of Partial Discharge Analyzers for Insulation Diagnosis of HVDC and HVAC Grids. Sensors 2023, 23, 5955. [Google Scholar] [CrossRef] [PubMed]
  5. Arcones, E.; Álvarez, F.; Khamlichi, A.; Garnacho, F. Scale Modular Test Platform for the Characterization of PD Measuring Systems Using HFCT Sensors. Sensors 2024, 24, 1363. [Google Scholar] [CrossRef] [PubMed]
  6. Wang, M.; Liu, Y.; Huang, Y.; Xin, Y.; Han, T.; Du, B. Defect Identification of XLPE Power Cable Using Harmonic Visualized Characteristics of Grounding Current. Electronics 2024, 13, 1159. [Google Scholar] [CrossRef]
  7. Zhao, H.; Zhang, H.; Su, G.; Shi, X. Defect Diagnosis Method of Cable Shielding Layer Based on Frequency Domain Reflection Coefficient Spectrum. IEEE Trans. Electromagn. Compat. 2023, 65, 114–125. [Google Scholar] [CrossRef]
  8. Ohki, Y.; Hirai, N.; Yamada, T.; Kumagai, S. Highly sensitive location method of an abnormal temperature point in a cable by frequency domain reflectometry. In Proceedings of the 2013 IEEE International Conference on Solid Dielectrics (ICSD), Bologna, Italy, 30 June–4 July 2013; pp. 117–120. [Google Scholar]
  9. Guo, M.; Xu, J.; Zhang, Y.; Xiao, X.; Yang, Z.; Wu, Z. A Partial Discharge Localization Method for AC XLPE Cable Based on Improved GCC Algorithm. IEEE Open Access J. Power Energy 2023, 10, 605–616. [Google Scholar] [CrossRef]
  10. Zhu, G.; Liu, Z.; Zhou, K.; Wang, Z.; Lu, L.; Li, Y.; Meng, P. A Novel Dampness Diagnosis Method for Distribution Power Cables Based on Time-Frequency Domain Conversion. IEEE Trans. Instrum. Meas. 2022, 71, 3510609. [Google Scholar] [CrossRef]
  11. Chen, H.; Wang, L.; Xu, H.; Yang, S. Research on blind spot elimination of spread spectrum time domain reflectometry based on signal separation. Chin. J. Sci. Instrum. 2024, 45, 280–289. (In Chinese) [Google Scholar]
  12. Möhring, B.N.; Siart, U.; Eibert, T.F. Fast Chirp Frequency-Modulated Continuous-Wave Reflectometer for Monitoring Fast Varying Discontinuities on Transmission Lines. IEEE Trans. Instrum. Meas. 2021, 70, 8005611. [Google Scholar] [CrossRef]
  13. Zou, X.Y.; Mu, H.B.; Zhang, H.T.; Qu, L.Q.; He, Y.F.; Zhang, G.J. An Efficient Cross-Terms Suppression Method in Time–Frequency Domain Reflectometry for Cable Defect Localization. IEEE Trans. Instrum. Meas. 2022, 71, 3511610. [Google Scholar] [CrossRef]
  14. Zhou, Z.; Zhang, D.; He, J.; Li, M. Local degradation diagnosis for cable insulation based on broadband impedance spectroscopy. IEEE Trans. Dielectr. Electr. Insul. 2015, 22, 2097–2107. [Google Scholar] [CrossRef]
  15. Xie, M.; Zhou, K.; Zhao, S.; He, M.; Zhang, F. A new location method of local defects in power cables based on reflection coefficient spectrum. Power Syst. Technol. 2017, 41, 3083–3089. (In Chinese) [Google Scholar]
  16. Rong, L.I.; Kai, Z.H.O.U.; Xianjie, R.A.O. Localization of Damp Defects and Analysis of Moisture Characteristics for Cable Body in the Distribution Grid. Proc. CSEE 2021, 45, 825–832. (In Chinese) [Google Scholar]
  17. Rao, X.; Xu, Z.; Guan, H.; Ding, Y.; Yang, X.; Yang, Y. Cable Defect Location by Using Frequency Domain Reflectometry with Synchrosqueezing Generalized S-Transform. In Proceedings of the 2023 Panda Forum on Power and Energy (PandaFPE), Chengdu, China, 27–30 April 2023; pp. 1178–1182. [Google Scholar]
  18. Mu, H.B.; Zhang, H.T.; Zou, X.Y.; Zhang, D.N.; Lu, X.; Zhang, G.J. Sensitivity Improvement in Cable Faults Location by Using Broadband Impedance Spectroscopy with Dolph-Chebyshev Window. IEEE Trans. Power Deliv. 2022, 37, 3846–3854. [Google Scholar] [CrossRef]
  19. Nazrin, A.; Kuan, T.M.; Mansour, D.E.A.; Farade, R.A.; Ariffin, A.M.; Abd Rahman, M.S.; Wahab, N.I.B.A. Innovative Approaches for Augmenting Dielectric Properties in Cross-Linked Polyethylene (XLPE): A Review. Heliyon 2024, 10, e34737. [Google Scholar] [CrossRef] [PubMed]
  20. Nyamupangedengu, C.; Sotsaka, M.; Mlangeni, G.; Ndlovu, L.; Munilal, S. Effect of Temperature Variations on Wave Propagation Characteristics in Power Cables. SAIEE Afr. Res. J. 2015, 106, 28–38. [Google Scholar] [CrossRef]
  21. Xiaoyan, B.; Qibin, Z.; Yang, F. Numerical Method for Capacitance Matrix of Coaxial Cables of Finite Length. High Volt. Eng. 2009, 35, 1920–1926. (In Chinese) [Google Scholar]
  22. Fanggao, C.; Saunders, G.A.; Hampton, R.N.; Moody, S.M.; Clark, A.M. The effect of hydrostatic pressure and temperature on the permittivity of crosslinked polyethylene. In Proceedings of the Seventh International Conference on Dielectric Materials, Measurements and Applications (Conf. Publ. No. 430), Bath, UK, 23–26 September 1996; pp. 267–270. [Google Scholar]
  23. Huang, J.; Zhou, K.; Xu, Y.; Meng, P.; Tang, Z.; Liang, Z. Upper Sweeping Frequency Selection for Cable Defect Location Based on STFT. IEEE Trans. Instrum. Meas. 2023, 72, 3521109. [Google Scholar] [CrossRef]
  24. Mo, S.; Zhang, D.; Li, Z.; Wan, Z. The Possibility of Fault Location in Cross-Bonded Cables by Broadband Impedance Spectroscopy. IEEE Trans. Dielectr. Electr. Insul. 2021, 28, 1416–1423. [Google Scholar] [CrossRef]
Figure 1. Cable transmission line model.
Energies 18 02430 g001
Figure 2. Frequency domain localization.
Energies 18 02430 g002
Figure 3. Distribution cable single-phase in-phase structure and distributed parameter model. (a) Structure. (b) Distributed parameter.
Energies 18 02430 g003
Figure 4. Overall structure and interphase capacitance of distribution cable. (a) Structure. (b) Interconductor capacitance.
Energies 18 02430 g004
Figure 5. Moisture distribution of the distribution cable. (a) Phase test connection. (b) Damp in phase. (c) Phase moisture.
Energies 18 02430 g005
Figure 6. Dynamic gradient on frequency domain localization.
Energies 18 02430 g006
Figure 7. Temperature response of capacitance impedance of XLPE cables. (a) Damp-free. (b) Damp.
Energies 18 02430 g007
Figure 8. Wiring diagram for waterless local heating experiment.
Energies 18 02430 g008
Figure 9. Normal cable dynamic characteristics under local temperature excitation.
Energies 18 02430 g009
Figure 10. Dynamic characteristics of damp defects under local temperature excitation.
Energies 18 02430 g010
Figure 11. Shield layer damage defect.
Energies 18 02430 g011
Figure 12. Dynamic characteristics of copper shield failure defects under local temperature excitation.
Energies 18 02430 g012
Table 1. The temperature response of XLPE.
Temperature (°C)εXLPEε
252.6080%
402.5512.16%
602.4984.20%
702.4814.86%
802.4705.27%
902.4665.44%
Table 2. The temperature response of water.
Temperature (°C)εwaterε
2578.300%
4073.156.58%
6066.8114.67%
7063.8618.45%
8061.0322.06%
9058.3225.52%
Table 3. Simulation parameters for 10 kV XLPE cable.
ParameterValue
Core radius rC3.35 mm
Half conductive layer thickness rSC1 mm
Insulation thickness rXLPE4 mm
Gap thickness rgap0.1 mm
Shielding layer radius rS9.5 mm
Cable core distance D21 mm
Cable core (aluminum) resistivity ρC2.83 × 108 Ω∙m
Shielding layer resistivity ρS1.75 × 108 Ω∙m
Vacuum permeability μ04π × 107 H/m
Semiconducting layer εSC1000
Filler εFL2.3
Disclaimer/Publisher’s Note: The statements, opinions and data contained in all publications are solely those of the individual author(s) and contributor(s) and not of MDPI and/or the editor(s). MDPI and/or the editor(s) disclaim responsibility for any injury to people or property resulting from any ideas, methods, instructions or products referred to in the content.

