1. Introduction
One of the major global challenges today is the management of Municipal Solid Waste (MSW), whose generation has significantly increased in recent years. According to the Global Waste Management Outlook 2024, published by the United Nations Environment Programme (UNEP) [
1] in partnership with the International Solid Waste Association (ISWA), global MSW generation was estimated at 2.3 billion tons in 2023. Projections indicate that, if current trends continue, this volume could reach 3.8 billion tons by 2050, representing an increase of approximately 65%. Additionally, the report highlights that global costs associated with waste management—including environmental and public health impacts—could nearly double by 2050, reaching USD 640.3 billion annually.
MSW is generated through household activities and the cleaning of public areas [
2]. Although often considered waste, these materials can be repurposed. In developing economies such as Brazil, China, and India, MSW generation tends to grow more rapidly due to accelerated urbanization, population growth, and economic development [
3]. In Brazil alone, the National Water and Sanitation Agency (NWSA) reported that over 65 million tons of MSW were collected in urban areas in 2021 [
4], increasing to approximately 81.8 million tons in 2022—equivalent to 224 thousand tons per day [
5].
Despite advancements in MSW management, particularly following the implementation of the National Policy on Solid Waste (NPSW), Law No. 12.305 [
2], Brazil continues to face significant challenges. These include reducing the environmental impacts of waste and addressing social issues, such as integrating informal waste collectors into cooperatives and associations.
A key obstacle remains the improper final disposal of large volumes of MSW. Official data from the NPSW indicated that, in 2021, 9.6 million tons of MSW were dumped in open landfills, while 7.55 million tons were disposed of in controlled landfills [
6]. Data from the Brazilian Association of Public Cleaning and Special Waste Companies (ABRELPE) [
5] confirm that 39% of waste in Brazil was still disposed of inappropriately in 2022. Therefore, further efforts are needed to improve final disposal practices to mitigate environmental damage and safeguard public health [
7].
According to the World Health Organization (WHO) [
8], every dollar invested in basic sanitation—including waste management—can result in savings of four to five dollars in healthcare costs. Thus, investing in waste management not only improves public health but also enhances the efficiency of public spending.
One alternative for the treatment and final disposal of MSW is its conversion into Refuse-Derived Fuel (RDF) for energy recovery. RDF can be used to produce steam, electricity, or hot water. Electricity can be fed into the grid and distributed to consumers, hot water can supply district heating and cooling systems, and steam can be utilized in nearby industrial processes [
9].
However, for waste combustion to be viable, the RDF must have a Lower Heating Value (LHV) above 2390 kcal∙kg
−1 [
1]. In countries with average MSW characteristics, such as Brazil, the LHV typically ranges between 1100 and 1300 kcal∙kg
−1 due to high moisture content [
10].
A practical solution to reduce humidity and increase LHV is the incorporation of drier residues, such as agricultural biomass. Managing the disposal of these agro-industrial byproducts is also a growing challenge, as substantial quantities are routinely generated.
The Food and Agriculture Organization (FAO) [
11] estimates that around 1.3 billion tons of agro-industrial waste are produced annually, much of which results from processing across the production chain. These byproducts can be repurposed for energy generation in industrial furnaces, such as in sugar mills using sugarcane bagasse.
Agro-industrial biomass offers a sustainable alternative to fossil fuels in energy production [
12]. Among various biomasses, peanut shells stand out for their high LHV of 3164.77 kcal·kg
−1 [
13]. Recent studies reinforce the relevance of biomass in co-combustion scenarios involving waste and renewable inputs. For example, the feasibility of biomass-based waste-to-energy routes in the electricity sector has been evaluated, highlighting the role of biomass in reducing carbon emissions and enhancing the efficiency of thermal processes [
14]. Such findings support the strategic use of agro-industrial byproducts, like peanut shells, in RDF production and energy recovery applications.
In addition to their energy potential, peanut shells are particularly relevant to Brazil’s agricultural economy, especially in municipalities within the state of São Paulo. In Tupã, the study site, peanut shell availability is significant due to local grain processing industries. According to the Federation of Industries of the State of São Paulo (FIESP) [
15], in 2020, Tupã’s peanut export revenue accounted for 20.7% of the state’s total.
Recent advances in the application of artificial intelligence and data-driven methods have significantly contributed to the development of more accurate and automated systems for Refuse-Derived Fuel (RDF) classification. For example, image-based techniques combined with machine learning algorithms—such as random forest classifiers and neural networks—have proven effective in identifying RDF fractions from visual data [
16]. Furthermore, convolutional neural networks (CNNs) have been applied in regression models to predict the Higher Heating Value (HHV) of RDF based on spectrographic and elemental information, achieving high predictive accuracy [
17]. These techniques complement fuzzy models by offering alternative approaches to address the heterogeneity of municipal solid waste. In addition, recent reviews have emphasized the importance of incorporating sustainable practices into RDF production, particularly in waste processing facilities [
18]. Life cycle assessment (LCA) studies, such as one conducted in Korea, further reinforce the significance of evaluating RDF systems from a cradle-to-grave perspective [
19]. A broader overview of RDF classifications and their policy relevance is also presented in recent snapshot reviews, highlighting their role in waste-to-energy strategies [
20].
Based on this context, the present research addresses two pressing issues: (i) the environmentally appropriate disposal of MSW to reduce landfill use, and (ii) the reuse of peanut shells—a byproduct of agro-industrial processing. To achieve this, it is essential to evaluate how MSW mixed with biomass burns and assess the quality of the resulting RDF compound.
This study seeks to answer the following questions: How does the energy generation process occur from RDF composed solely of MSW? Can RDF be effectively produced by combining MSW with biomass, particularly peanut shells? Which variables are critical for assessing RDF quality? Is it possible to develop a mathematical model to classify RDF quality for use in Brazilian municipalities?
The general objective of this work is to develop a decision-making support algorithm capable of classifying the quality of RDF generated from MSW, with or without biomass addition.
The specific objectives are to (a) conduct a literature review on RDF and the use of biomass, especially peanut shells, as a fuel supplement; (b) identify key characteristics for RDF classification to define input variables for the model; (c) develop a mathematical model using fuzzy logic to classify RDF and assist in decision-making; (d) apply the model in a municipality in the interior of São Paulo to validate its effectiveness.
2. Theory
Environmentally appropriate waste disposal is a complex task and cannot be implemented uniformly across all municipalities, as the particle size and composition of Municipal Solid Waste (MSW) vary depending on the collection location. Therefore, the specific characteristics of waste in each locality must be considered when proposing a system for its final disposal.
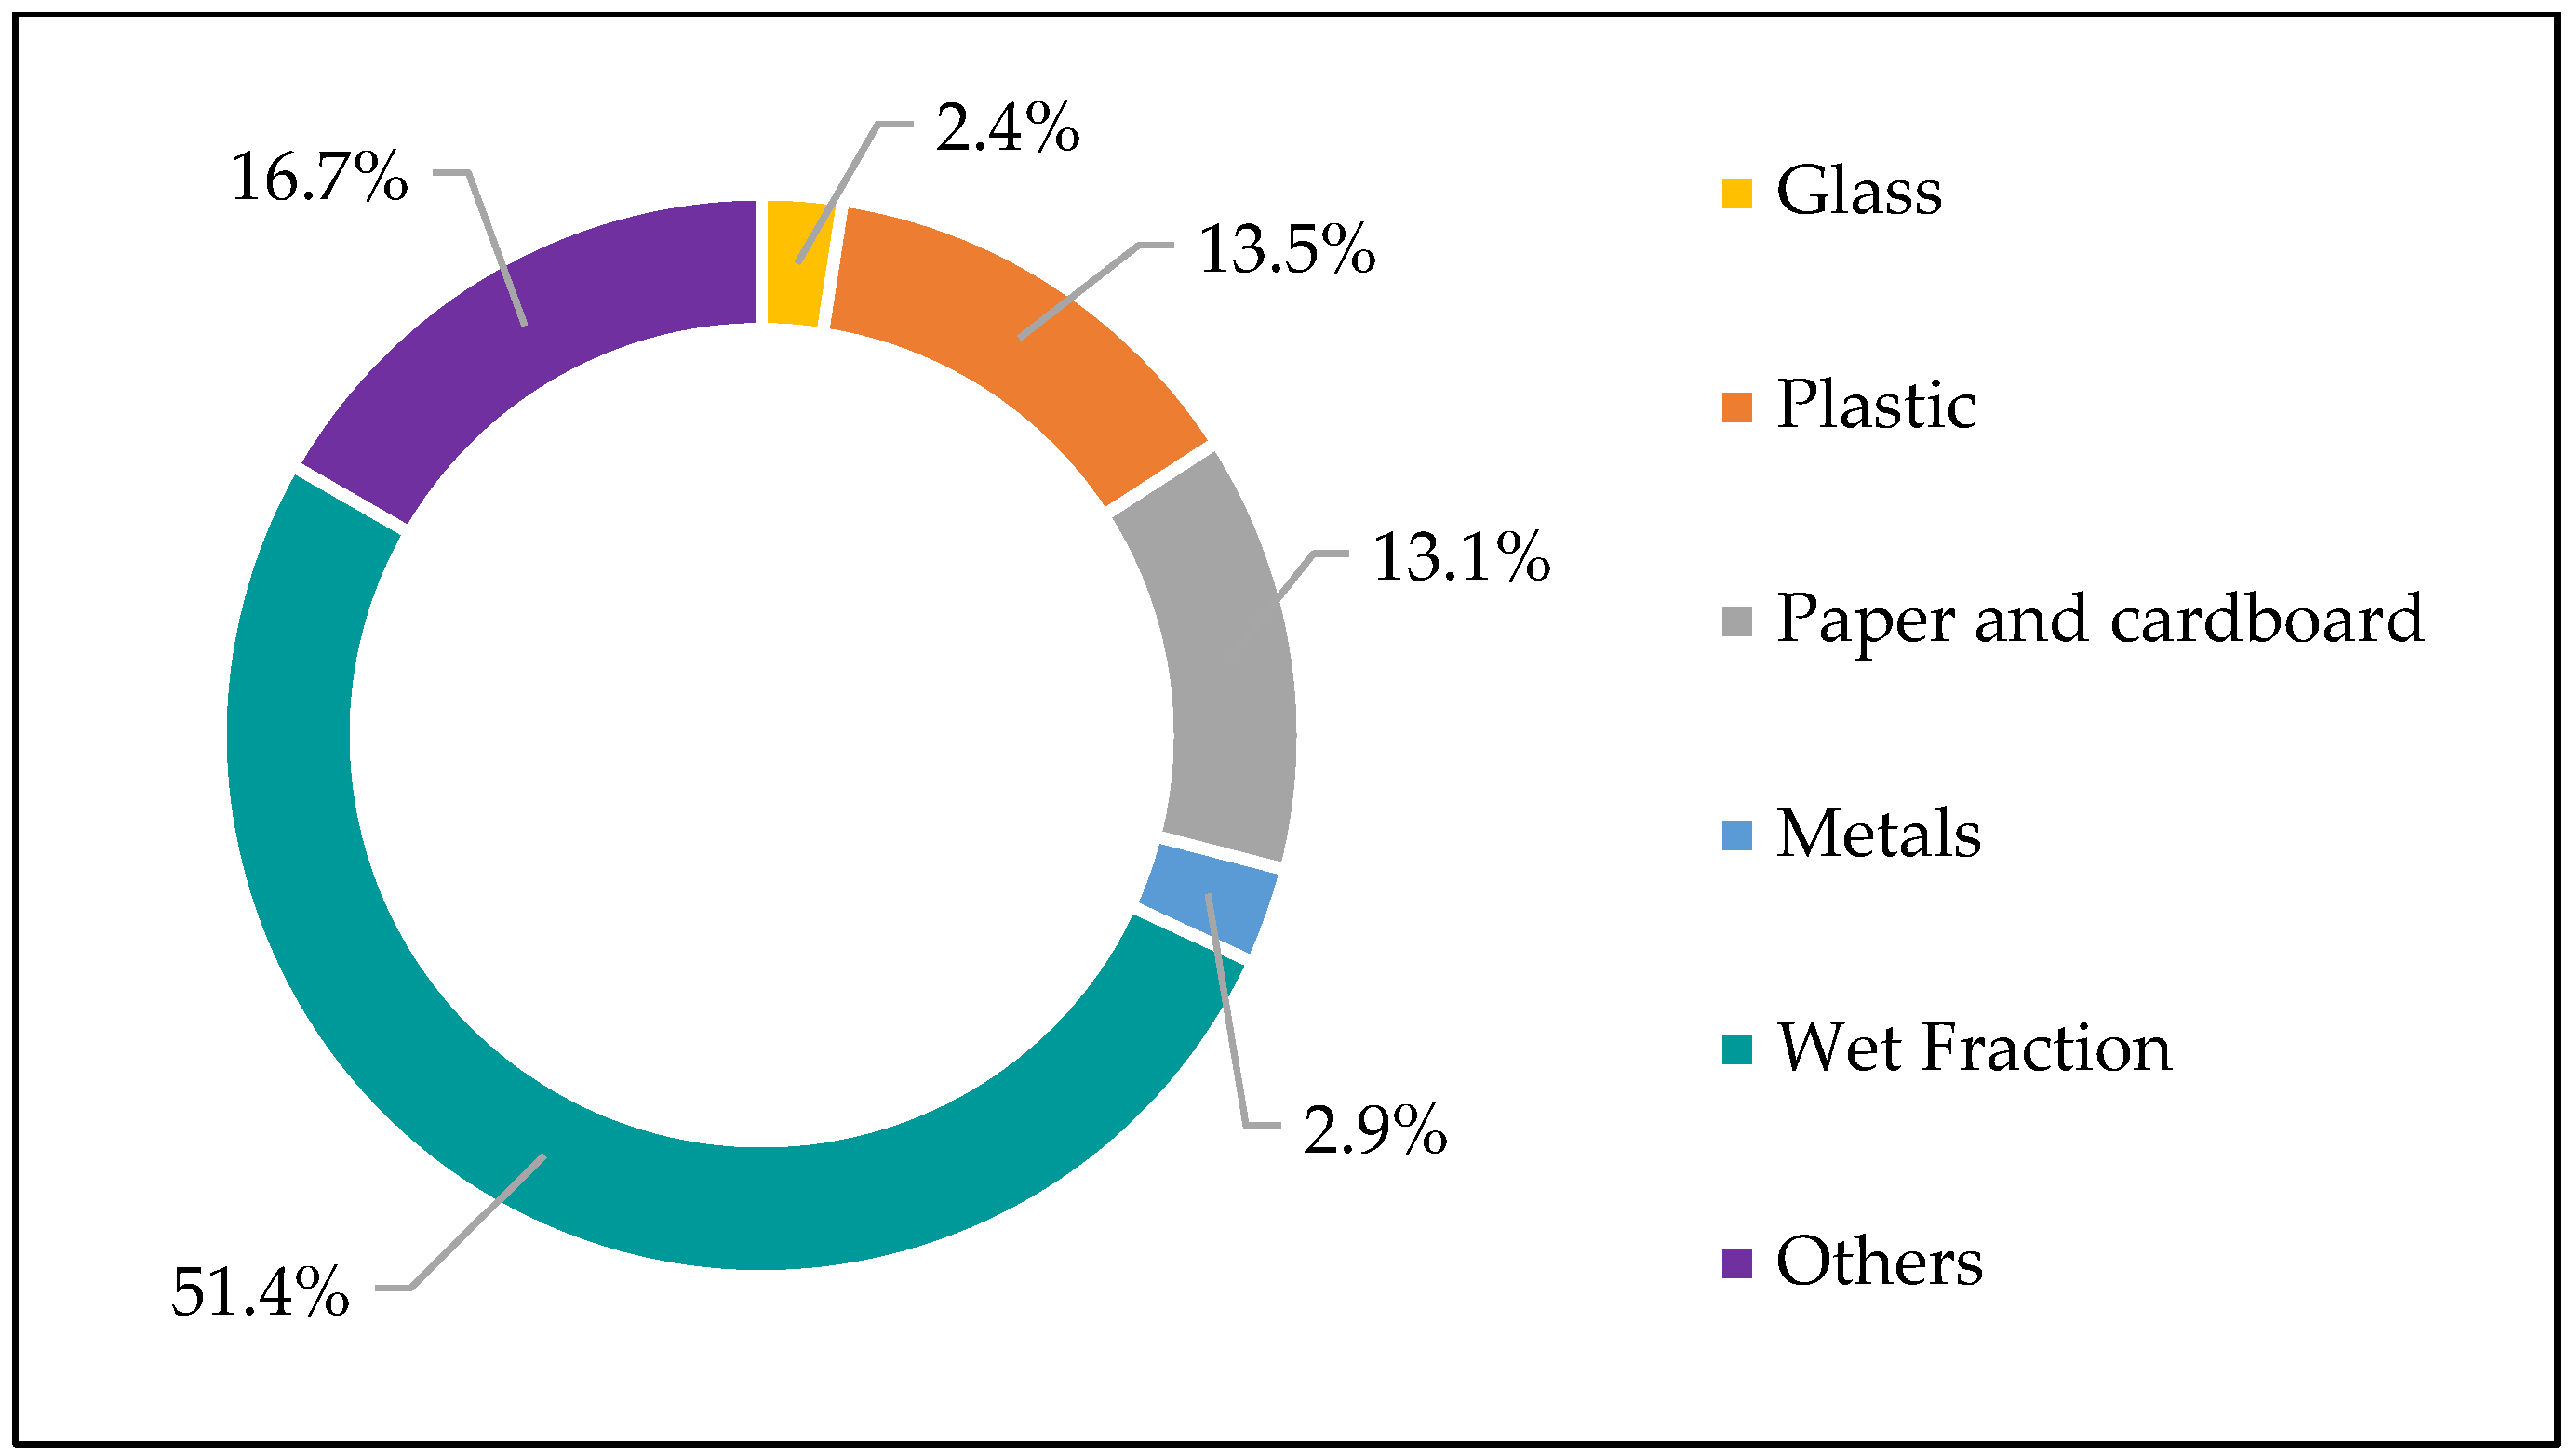
Figure 1 presents the percentage of each component of MSW in Brazil, while
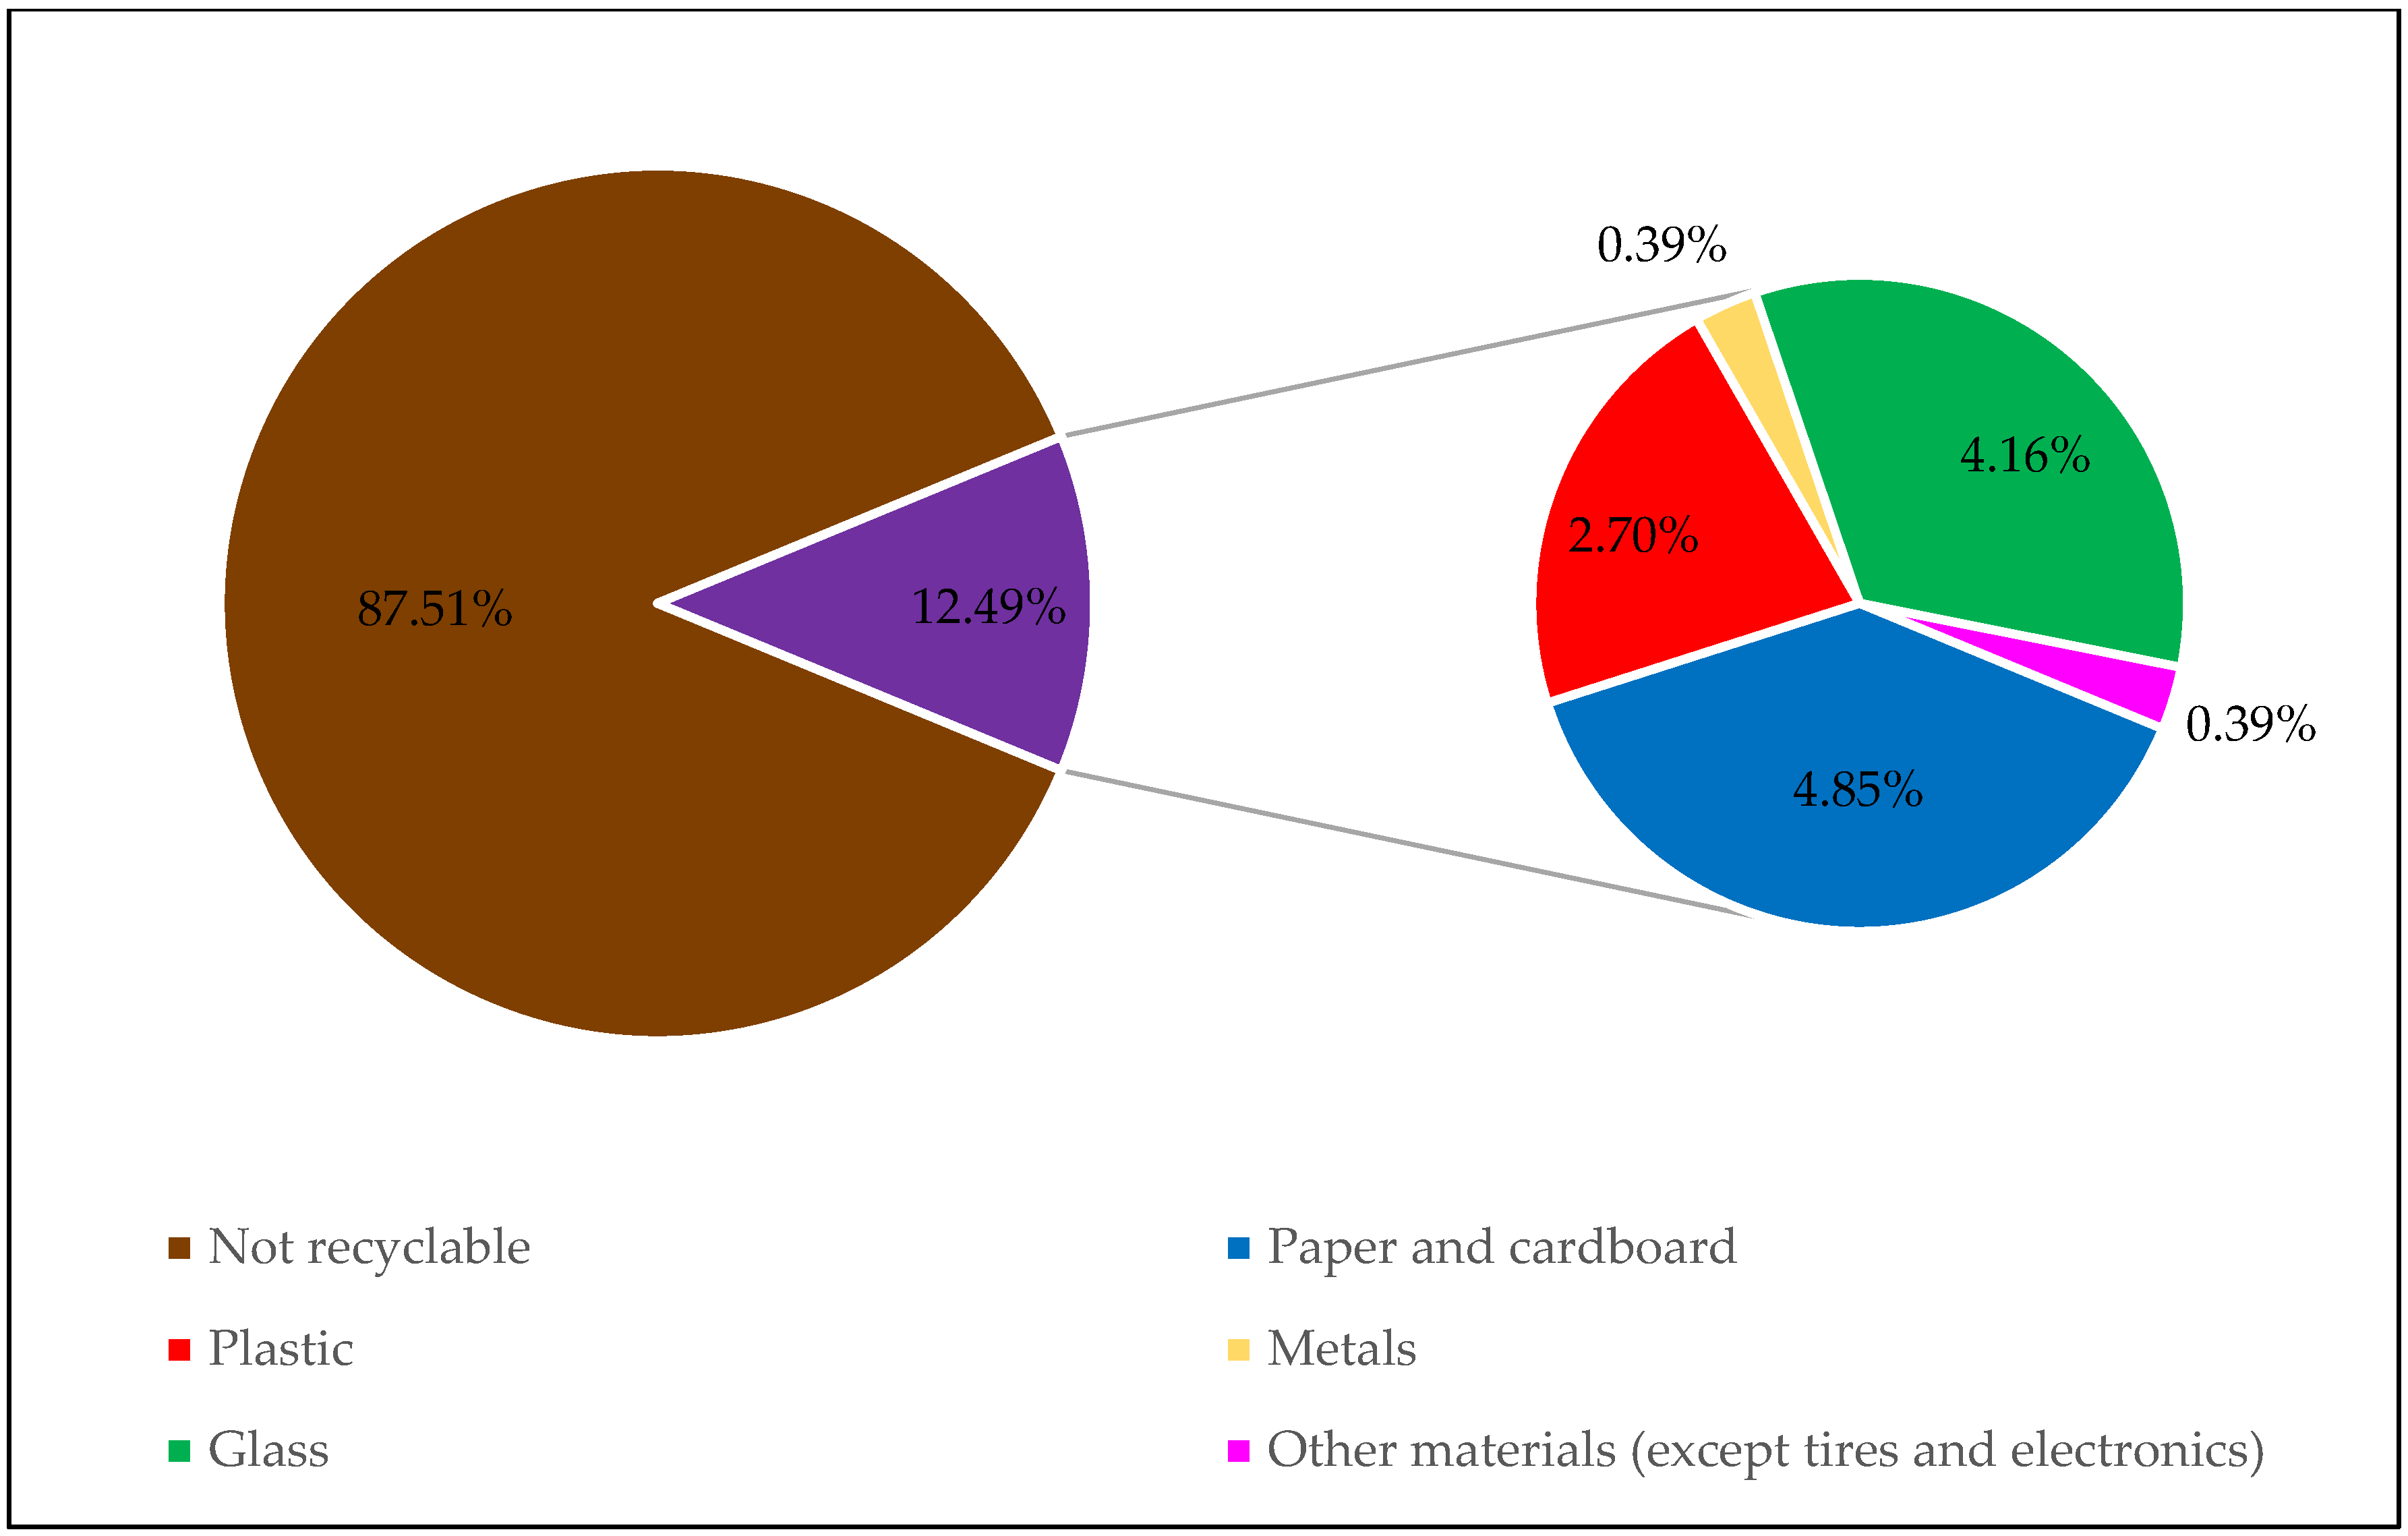
Figure 2 illustrates the percentage of recyclable materials found in the municipality of Tupã, which was analyzed in this study.
As shown in
Figure 1, organic waste—also referred to as the “wet fraction”—is the primary component of MSW in Brazil, accounting for 51.4%. Recyclable waste constitutes 31.9% and primarily consists of plastic (13.5%), paper and cardboard (13.1%), metals (2.9%), and glass (2.4%). The “other” category includes unrecyclable and contaminated waste, as well as miscellaneous unidentified materials.
When waste is subjected to thermochemical conversion processes, characteristics such as moisture content and the Lower Heating Value (LHV) are crucial. The higher the moisture content, the more difficult it is to burn the waste, resulting in a lower heating value.
Table 1 summarizes the feasibility of incineration processes based on the LHV of MSW.
The data indicate that combining MSW with sugarcane straw and eucalyptus bark for thermal energy production in boiler systems improves fuel quality. The resulting RDF becomes more homogeneous and less humid, and has a higher LHV, while also offering improved storage, transport, and handling properties [
24].
In addition to the LHV, Brazilian Standard NBR 16.849/2020 [
1] also requires the assessment of chlorine and mercury content for the classification of MSW intended for energy recovery, given the harmful effects of these elements on human health and the environment.
As shown in
Table 2, a material must have a Lower Heating Value (LHV) of at least 2390 kcal·kg
−1 on a dry basis, and must contain no more than 3.0% chlorine and 1.0 mg·kg
−1 mercury to be considered an MSWEGP (Municipal Solid Waste for Energy Generation Purposes).
In addition to Municipal Solid Waste for Energy Generation Purposes (MSWEGP), as defined by NBR 16.849/2020 [
25], some regulations use the term Refuse-Derived Fuel (RDF). RDFs are classified into seven categories according to the American Society for Testing and Materials (ASTM) [
26], based on the physicochemical characteristics of the materials—specifically, their heating value, and chlorine and mercury contents (
Table 3) [
22].
In industrial applications, the life cycle of Refuse-Derived Fuel (RDF) follows a well-established technological sequence. This sequence includes (i) the collection and transportation of Municipal Solid Waste (MSW) to treatment facilities; (ii) initial sorting, either manually or automatically, to remove recyclables and hazardous or non-combustible rejects; (iii) mechanical and biological treatment, which may involve shredding, screening, magnetic separation, and organic stabilization, in order to reduce moisture content and improve combustion characteristics; (iv) RDF production through densification methods such as granulation or briquetting; (v) storage and transportation of RDF to industrial facilities, such as cement kilns or thermal power plants; (vi) energy recovery through controlled combustion; (vii) proper management of post-combustion residues; and (viii) continuous environmental monitoring throughout the entire cycle. These stages are generally automated and governed by technical standards that ensure efficiency and standardization. Understanding this industrial dynamic is essential to contextualize results obtained at the laboratory scale, where infrastructure limitations may require manual execution of steps such as impurity separation. The review by [
20] provides a comprehensive overview of the technological routes for RDF production and the operational and environmental aspects involved in its life cycle.
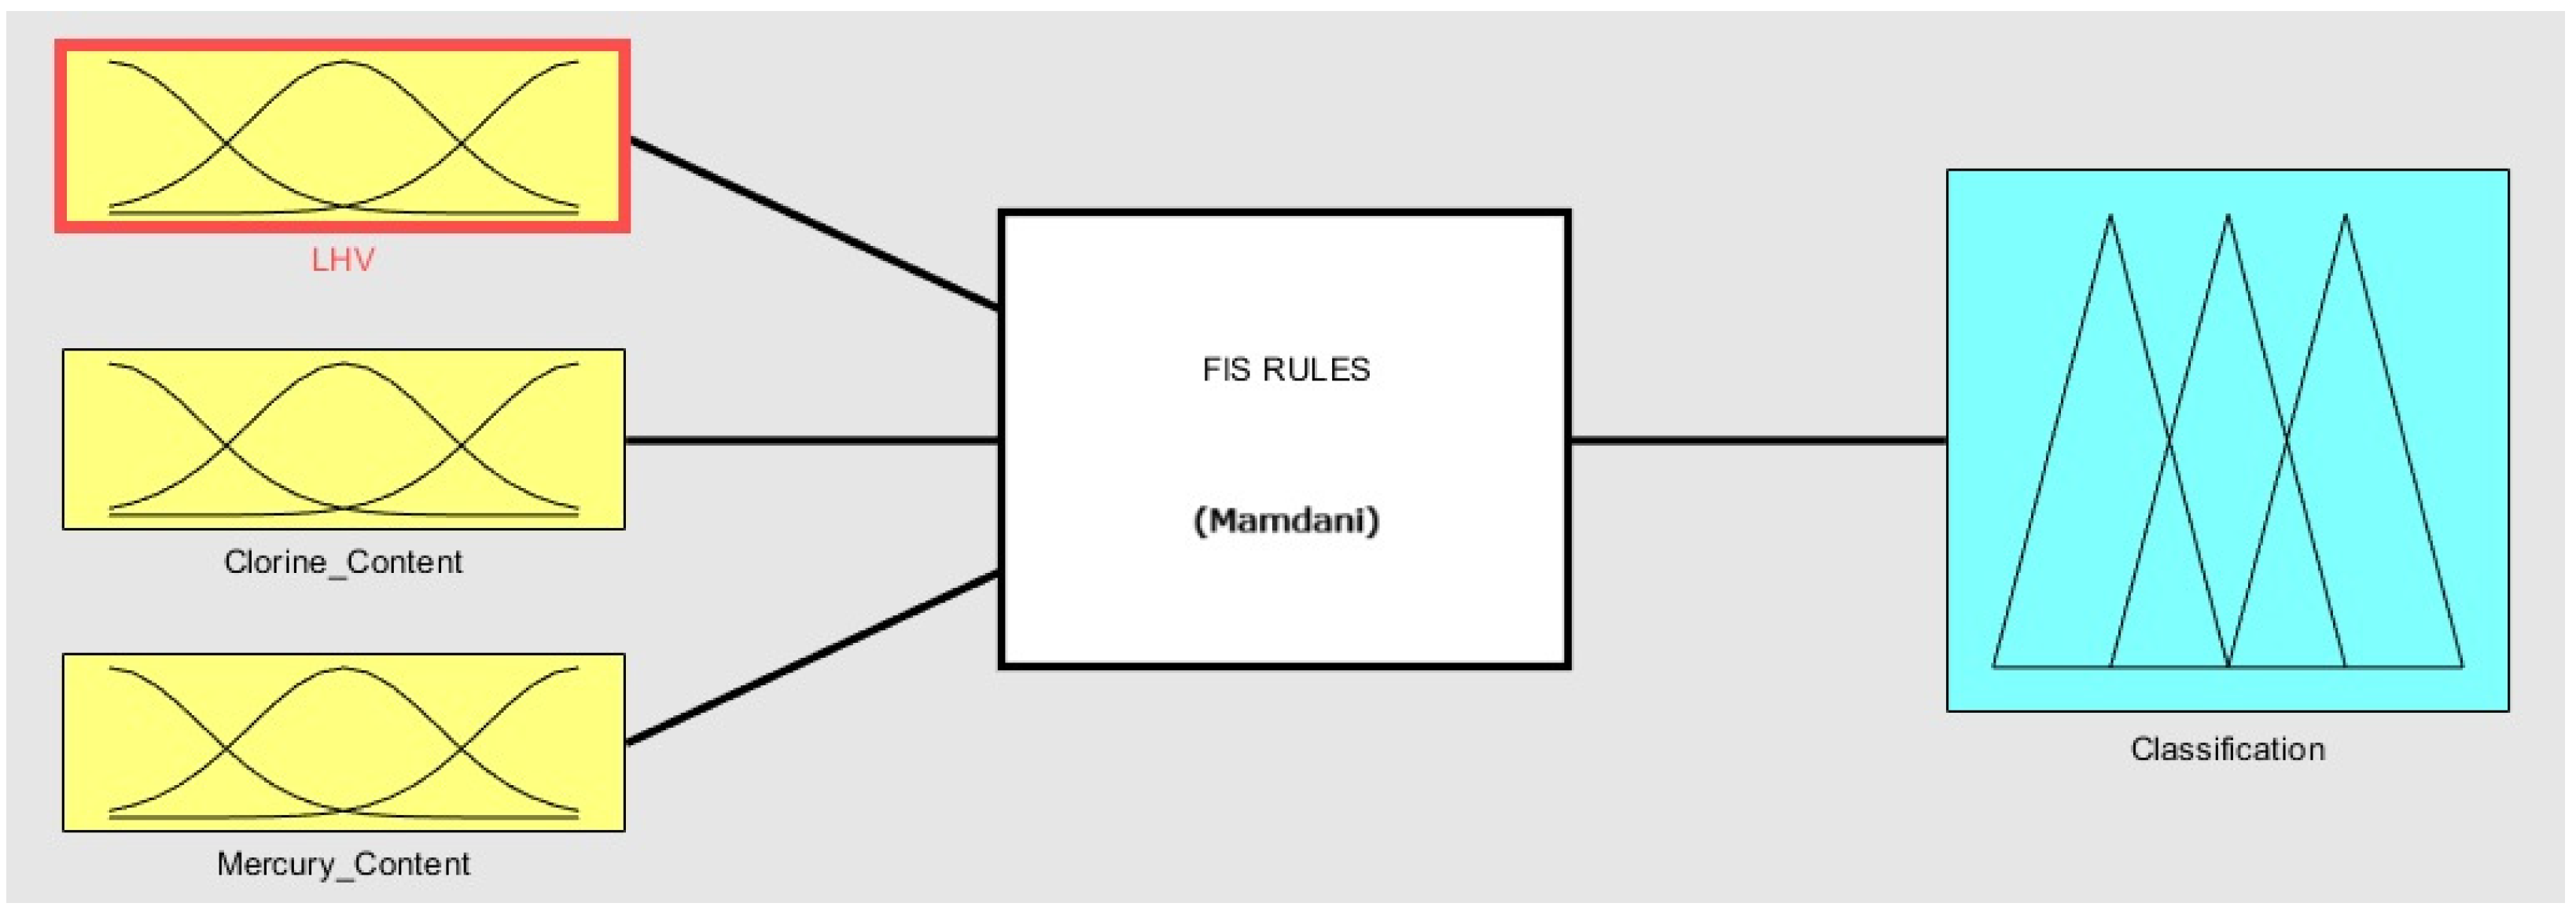
Next, the methodological procedures used in this study will be presented, including the variables considered, the rule set developed for the fuzzy inference process, and the methodology adopted to estimate the values of the study area to be input into the system.
5. Discussion
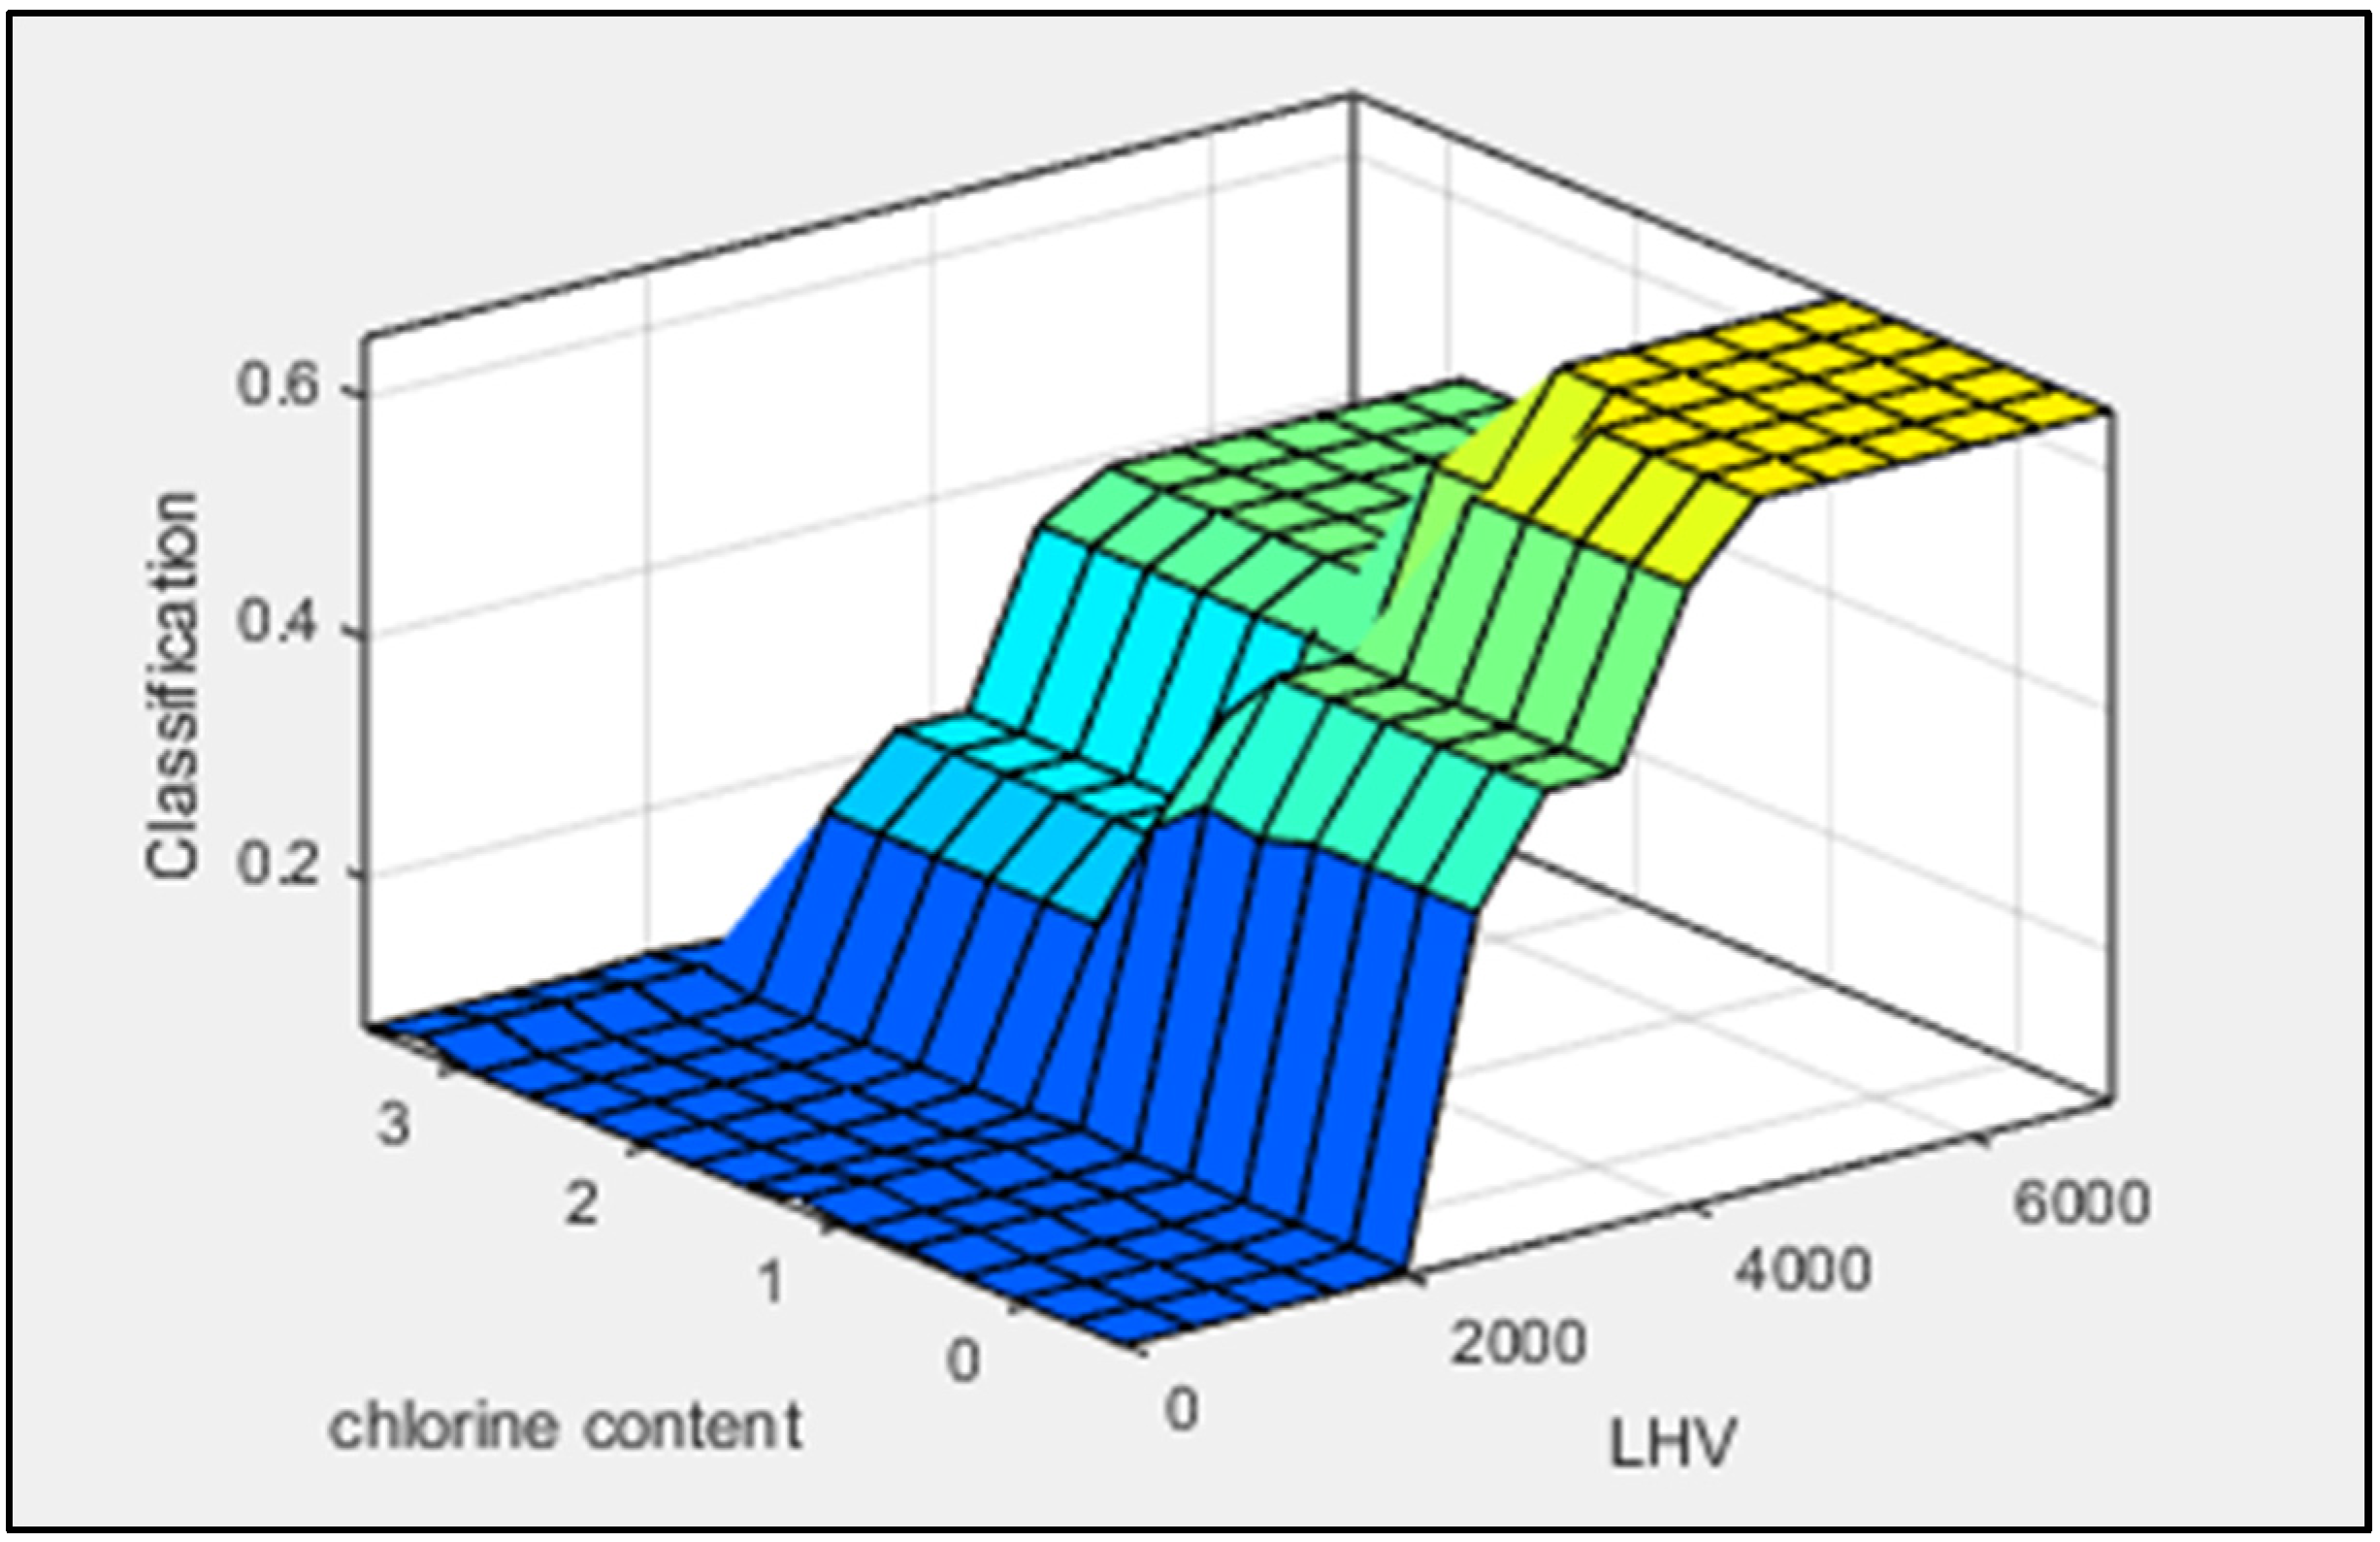
The 3D figures (
Figure 5,
Figure 6 and
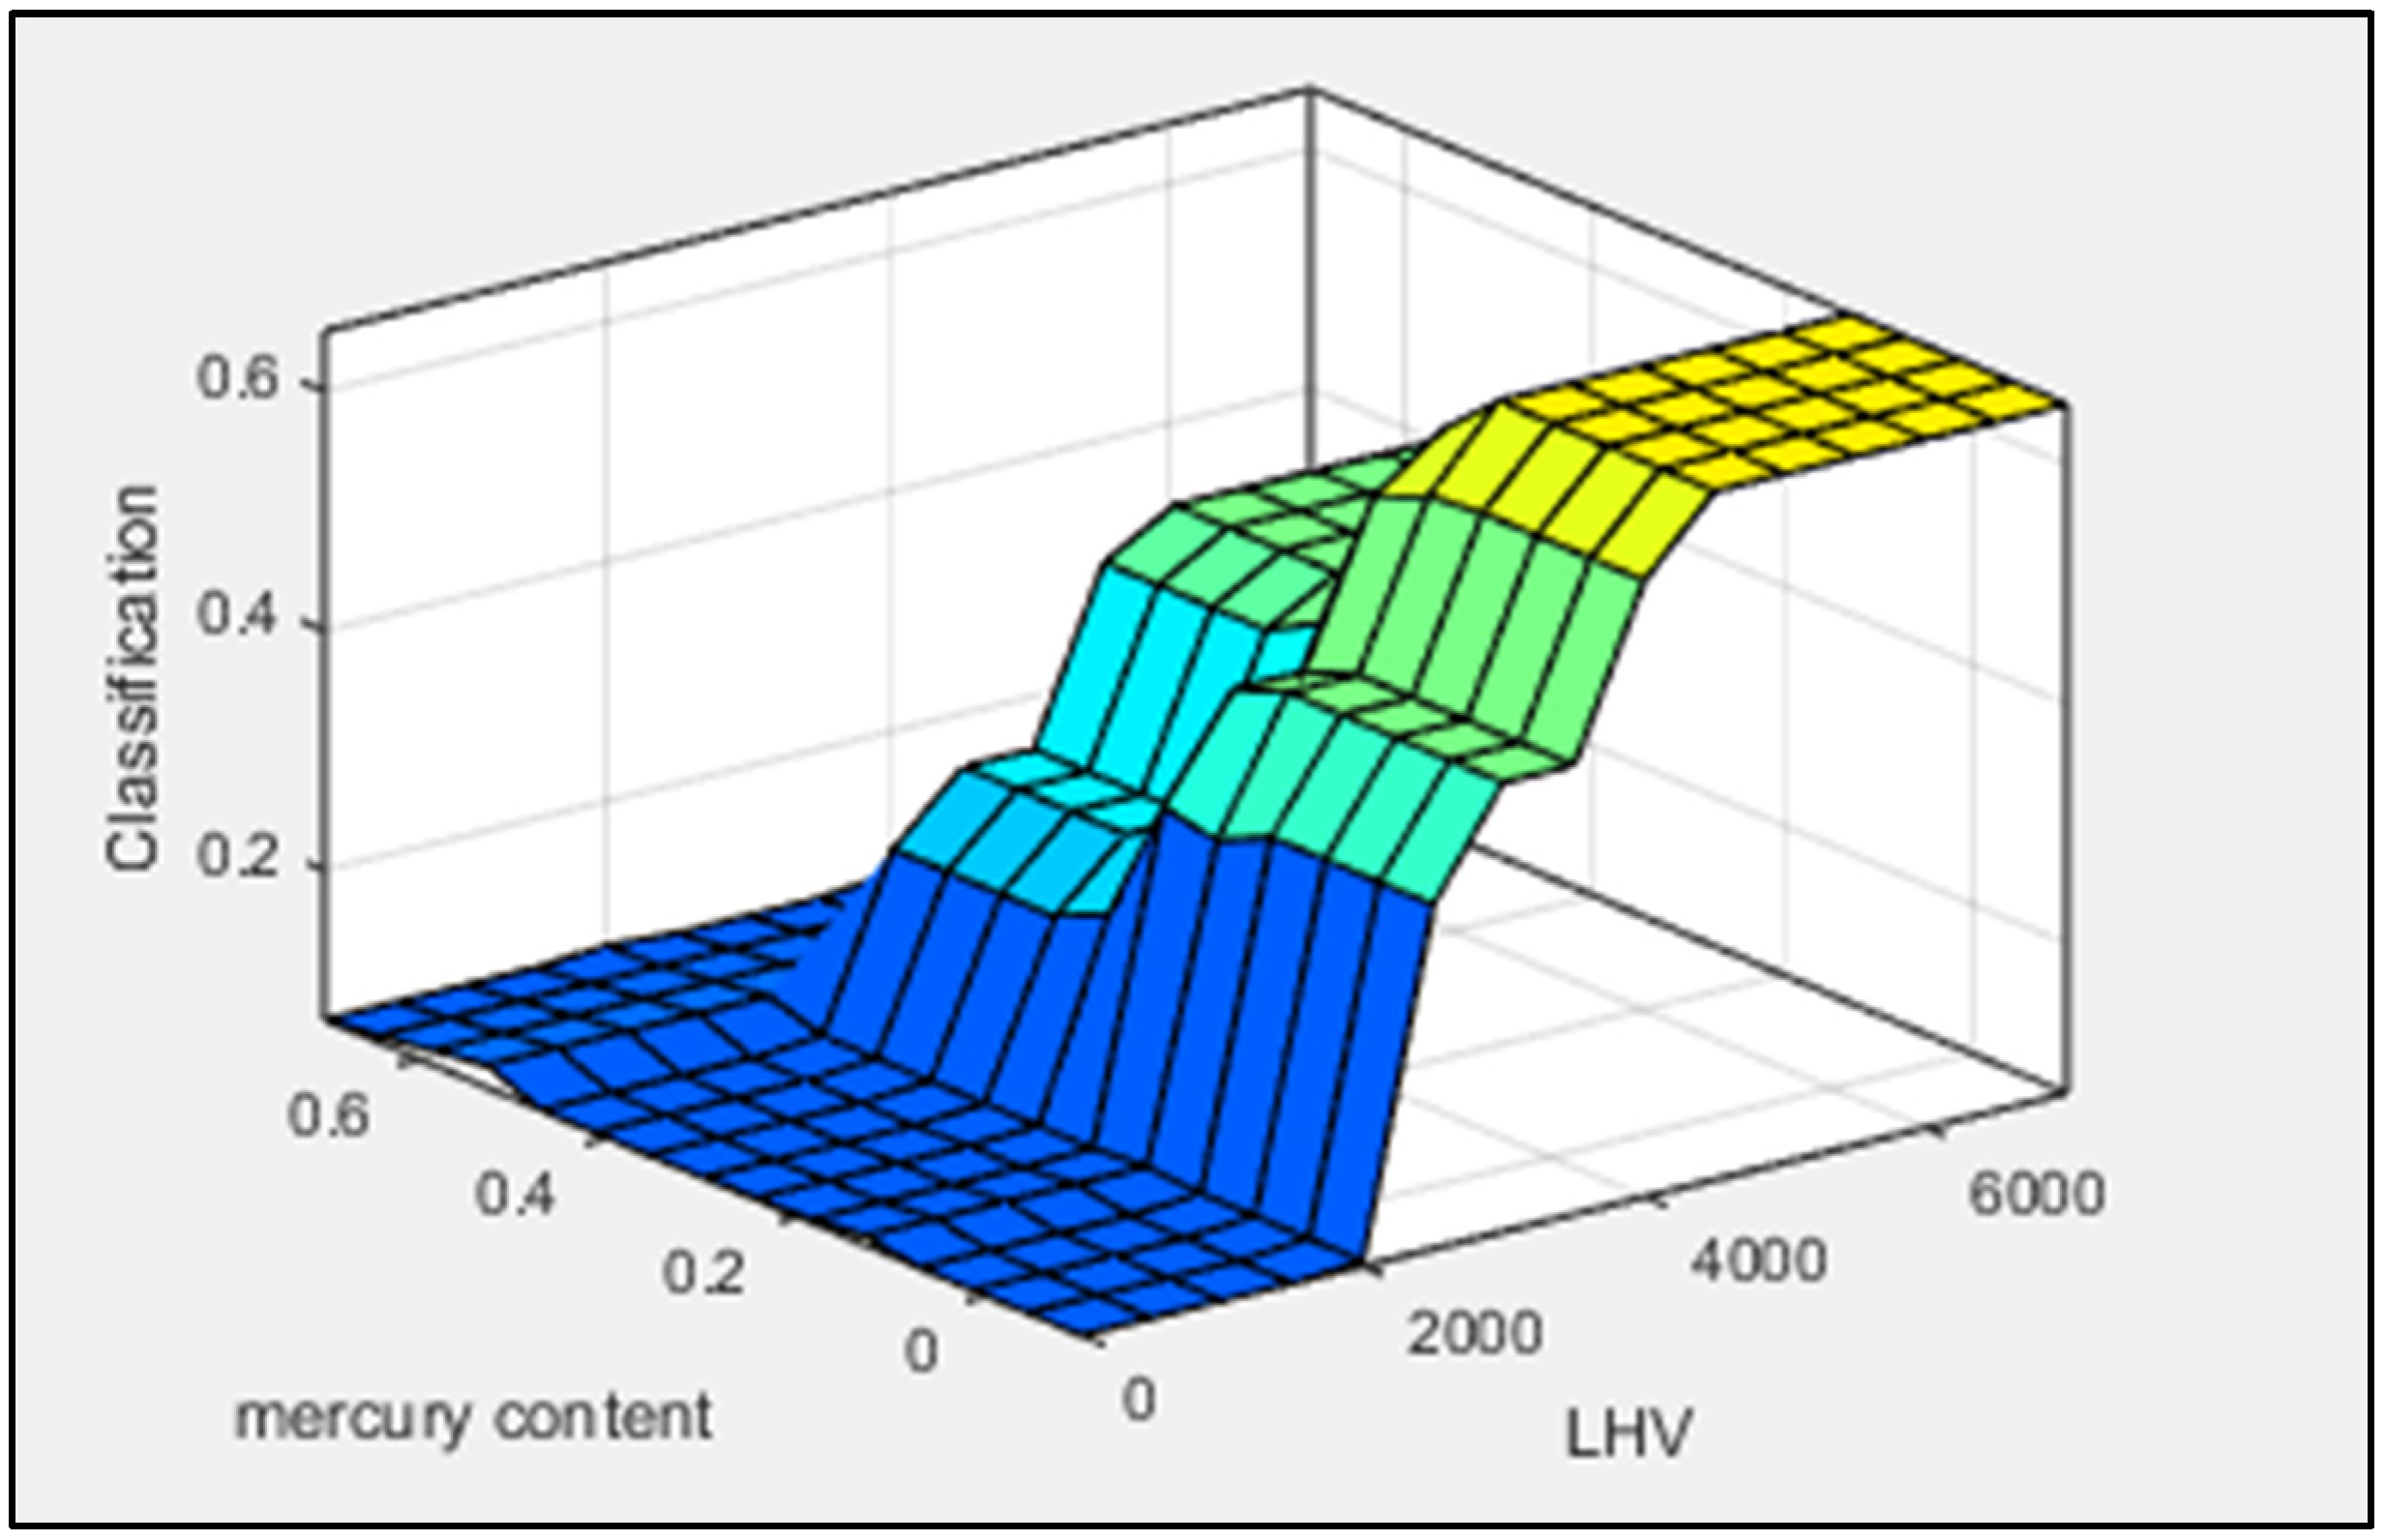
Figure 7) illustrate the interaction between two input variables in RDF classification.
Figure 5 demonstrates that the higher the LHV (Lower Heating Value) and the lower the chlorine content, the better the RDF classification. Similarly,
Figure 6 highlights that the higher the LHV and the lower the mercury content, the better the RDF classification. It is essential to note that for LHV levels below 2390 kcal·kg
−1, regardless of chlorine and mercury contents (as shown in both figures), the compound does not receive an RDF classification, as it is not considered technically viable for combustion. This finding underscores the unfeasibility of the fuel combustion process for such materials. In cases where a compound is deemed unfeasible, as outlined in
Table 1 proposed by [
23], an auxiliary fuel is needed to increase the LHV and transform the compound into an RDF. The data presented in these figures further support the classification suggested by [
22], which was adapted from the American standard ASTM E856-83 and the ERFO website (see
Table 3).
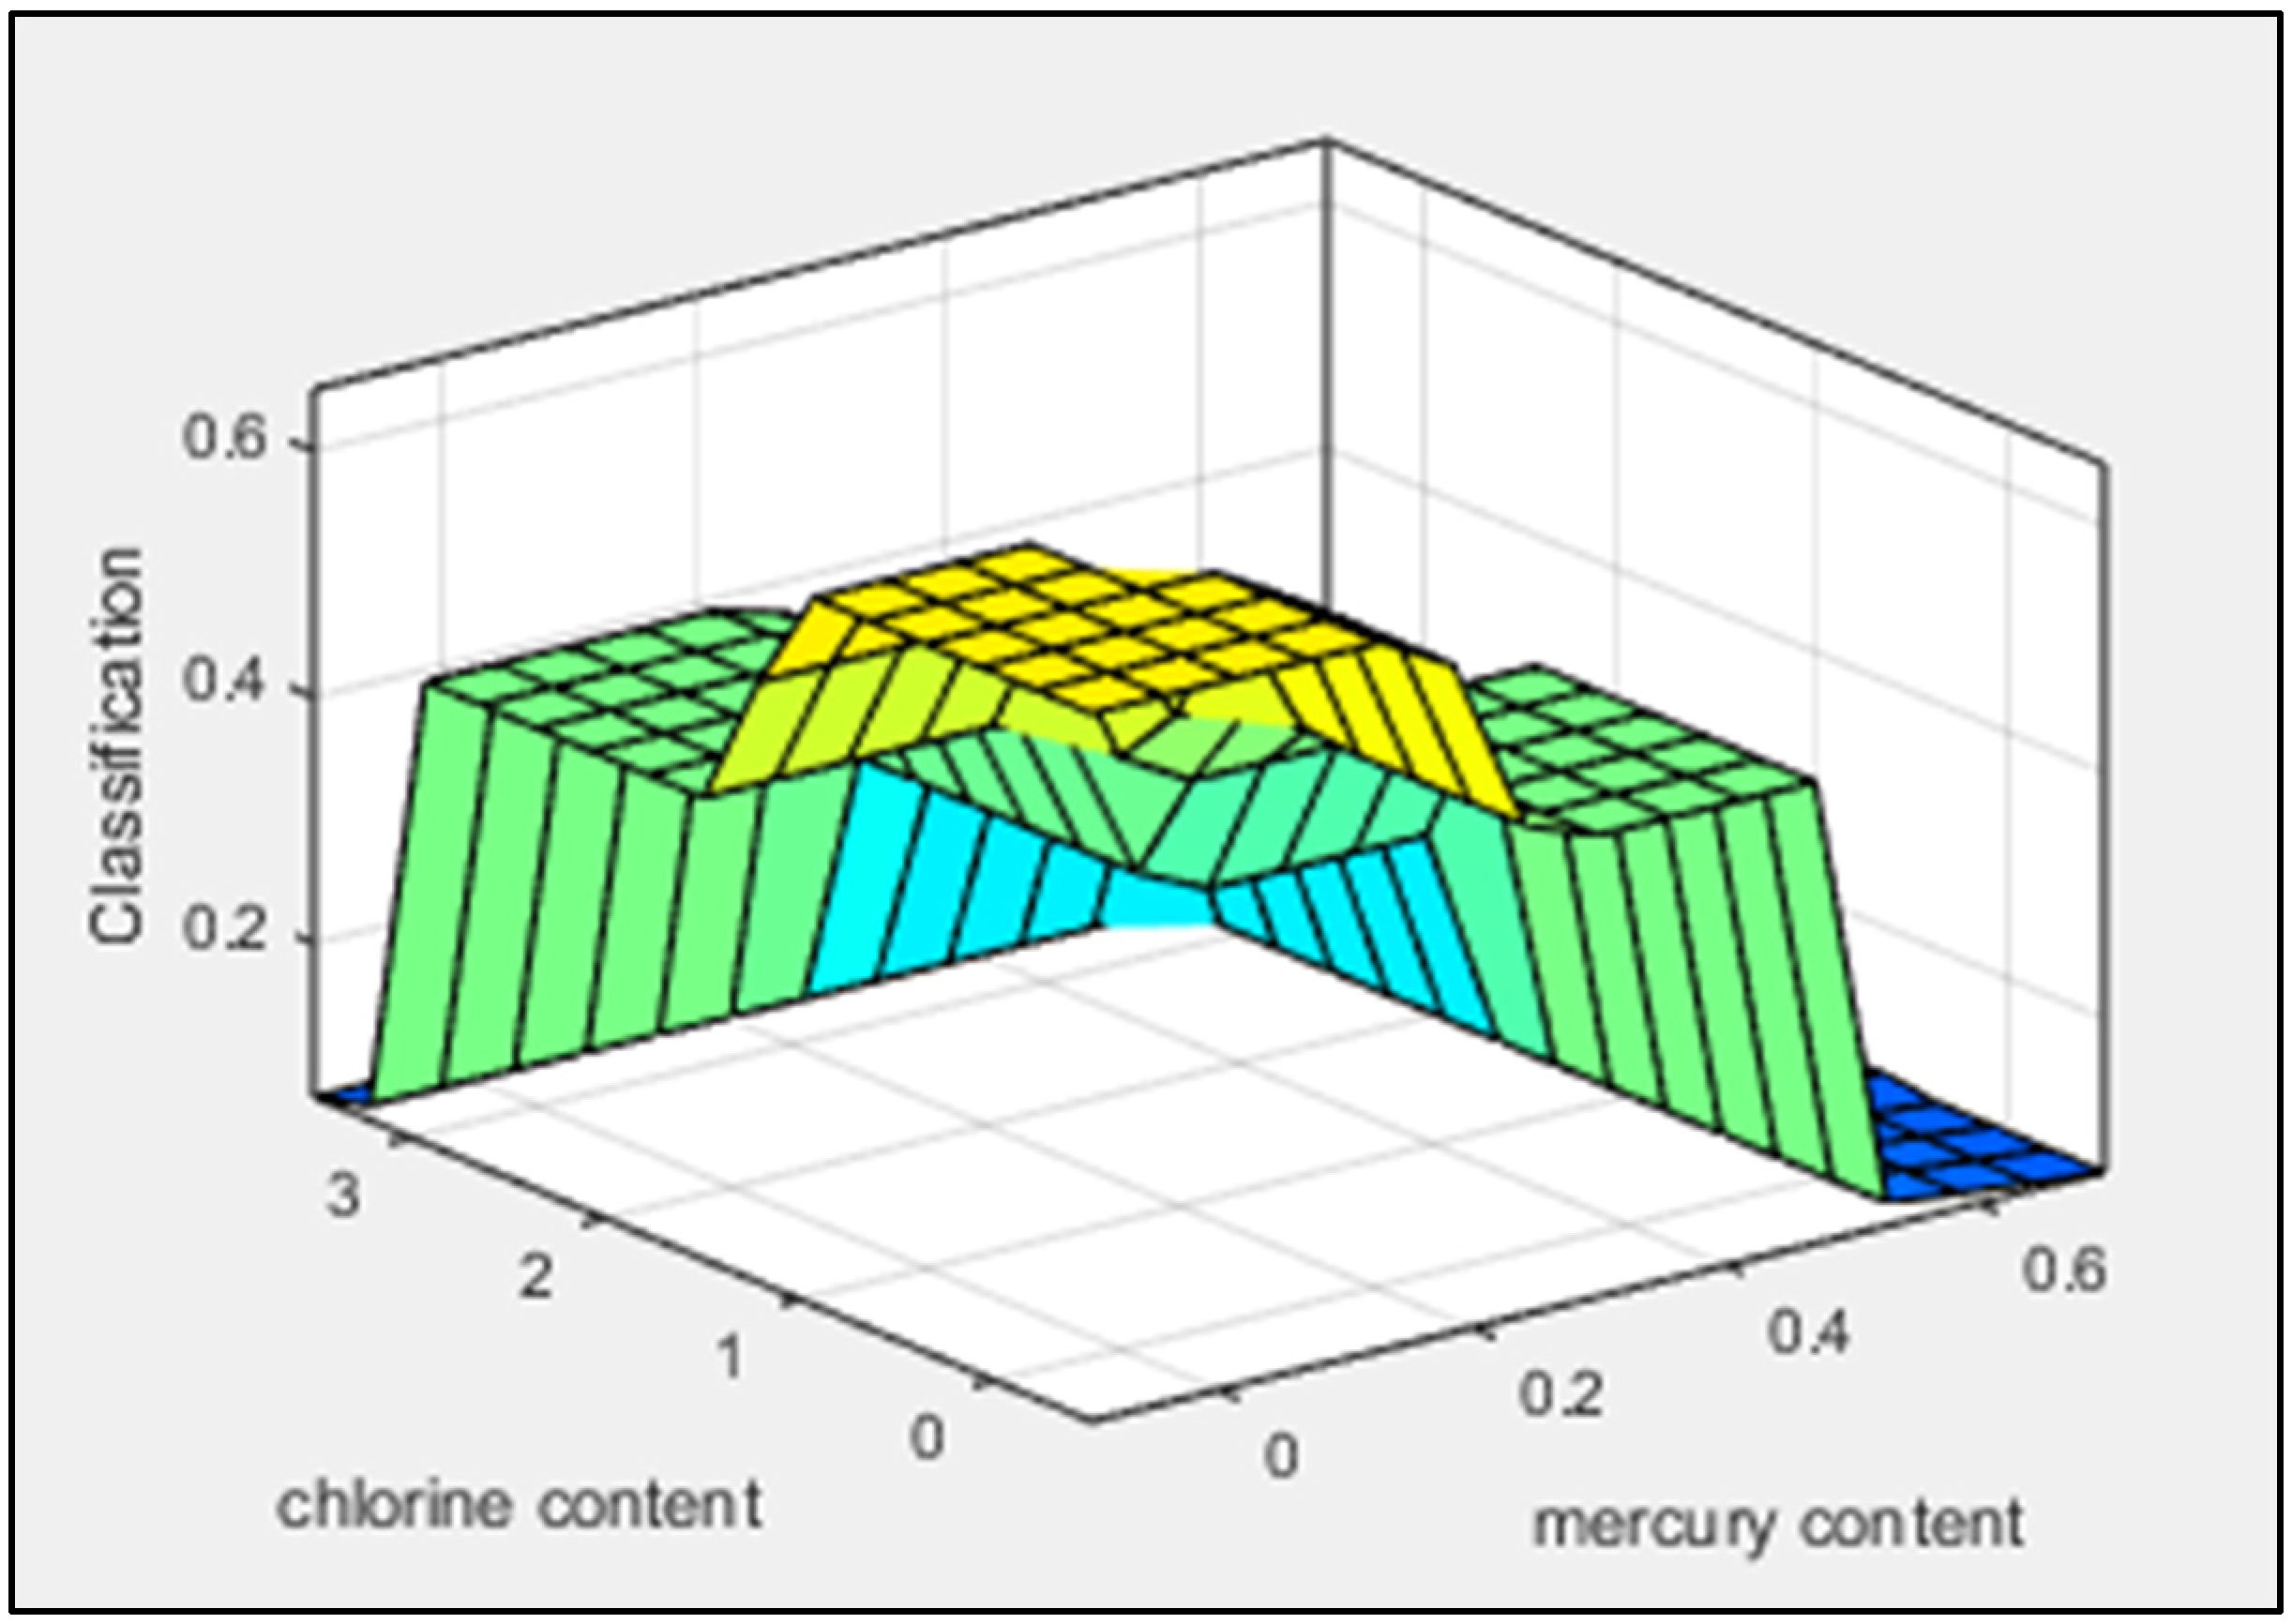
The 3D graph in
Figure 7, however, shows results that are opposite to those in
Figure 5 and
Figure 6. According to NBR 16.849/2020 [
25], the limits for the compound to be considered RDF are higher for chlorine (Cl > 3.0%) and mercury (Hg > 0.5 mg·kg
−1) content levels and lower for LHV (LHV < 2390 kcal·kg
−1). The data from these three surface graphs reveal clear and well-defined classification levels.
Table 9 shows that as the amount of peanut shells in the samples increased, their moisture content decreased and LHV increased, except for the LHV of A
1, which underwent a drying process to reduce moisture so that the RDF could be burned, as previously reported.
The data in
Table 9 corroborate [
24], suggesting that the mixture of sugarcane straw and eucalyptus bark with RDF improves fuel quality, particularly in terms of heating value and moisture content. Therefore, it can be inferred that combining RDF with drier biomass, i.e., materials with lower moisture content, results in a compound with a higher heating value, thereby enhancing its energy viability as a fuel.
Table 10 shows that sample 2 was the only one with a chlorine content of 29.6%. This can be attributed to the highly heterogeneous composition of the samples, as demonstrated in
Figure 1 (percentage of each component of the MSW in Brazil) and further confirmed by
Figure 2 (percentage of recyclable materials found in the municipality of Tupã). The variability in the composition may have contributed to the higher chlorine content in sample 2 compared to the other samples.
Based on an LHV of 5403.69 kcal·kg
−1, chlorine content of 0%, and mercury content of 31.7409 × 10
−6 mg·kg
−1, the system classifies the RDF with a degree of membership of 0.97. Analyzing the degree of membership of the output variable reveals that it holds the highest membership within the optimal fuzzy set, as it falls under Rule 1 (
Table 8). It is important to note that this ideal classification was only achievable due to the prior drying of the material, which aligns with the data presented in
Table 1 [
23] (p. 28), emphasizing the necessity of pre-treatment to enhance the LHV when waste combustion lacks energy viability.
Based on an LHV of 1962.35 kcal·kg−1, chlorine content of 29.6%, and mercury content of 0 mg·kg−1, the system classifies the RDF with a degree of membership of 0.0899. The highly heterogeneous composition of the samples may have contributed to the higher chlorine content in sample 2, as certain materials present in this sample were not found in the others, thus increasing the chlorine content.
Furthermore, it should be noted that this point has a higher degree of membership within the fuzzy set “Not an RDF”, as it corresponds to Rule 61 (
Table 8). This result aligns with the classification in
Table 4, where the LHV is classified as P4 and the chlorine content as C4, meaning that the sample cannot be considered RDF.
If the mercury content value were to reach 31.7409 × 10
−6 mg·kg
−1, as in A
1, the RDF classification would remain unchanged (“Not an RDF”), since the rule base would not be affected (Rule 61, as shown in
Table 8). The only difference would be in the degree of membership, which would decrease to 0.0814.
Another simulation was performed with an LHV of 2736.45 kcal·kg
−1, chlorine content of 0%, and mercury content of 0 mg·kg
−1, resulting in an improved RDF classification. This led to a “Regular” response based on the rule base shown in
Table 8, with a degree of membership of 0.65).
Although chlorine and mercury contents are within their optimal ranges, C1 and H1, respectively, the LHV falls into the worst range, P3, as shown in
Table 4 (adapted from [
25]). As a result, the LHV negatively impacts the overall quality and, consequently, the RDF classification.
If the mercury content value were 31.7409 × 10
−6 mg·kg
−1, as in A
1, the RDF classification would remain the same (“Regular”), since the rule base would not change (Rule 33) as presented in
Table 8, and neither would the degree of membership (0.65).
In sample 4, the LHV was 3287.14 kcal·kg
−1, the chlorine content was 0%, and the mercury content was 0 mg·kg
−1. The scenario for sample 4 was very similar to that for sample 3, as the degree of membership was the same (0.65), resulting in the system response being identical: “Regular” (
Table 8). Therefore, increasing the LHV from 2736.45 kcal·kg
−1 to 3287.14 kcal·kg
−1 while maintaining chlorine and mercury content at zero did not affect the RDF classification.
A simulation was also conducted to determine the effect of a mercury content of 31.7409 × 10
−6 mg·kg
−1 in sample 4. In this scenario, with the mercury content at 31.7409 × 10
−6 mg·kg
−1, the rule base, as shown in
Table 8, would remain unchanged (Rule 33), and the degree of membership (0.65) would also stay the same. Therefore, the RDF classification would remain unchanged as “Regular”.
In the scenario of sample 5, the system simulation activated two rule bases—Rule 17 and Rule 33 (see
Table 8)—resulting in two possible classifications: “Good” and “Regular”. This indicates that the sample falls within an intermediate condition. The final classification was determined to be 0.778. Upon analyzing the degrees of membership for the output variable, it was observed that the sample had a higher degree of membership within the “Good” fuzzy set, thus leading to its classification as “Good”.
Ultimately, a simulation was conducted for sample 5 to assess the impact of a mercury content of 31.7409 × 10
−6 mg·kg
−1. As observed when the mercury content is zero, this value falls within the same classification range. Consequently, the rule bases (Rules 17 and 33 from
Table 8) remained unchanged, as did the degree of membership (0.778). Therefore, the RDF classification continued to be “Good”.
As shown in
Table 12, only sample 1 achieved an “Excellent” RDF classification, as it was composed exclusively of refuse-derived fuel. However, as previously noted, the material had to be dried in order to determine its LHV. This supports the assertion made by [
23] in
Table 1, which states that when the LHV is insufficient, thermal pre-treatment is necessary.
Despite the success achieved with sample 1 after undergoing furnace drying at the laboratory scale, it is likely that, at the industrial level—whether in incineration plants, boilers, clinker kilns, or other facilities—the cost of pre-drying the material would render the process economically unfeasible. This is primarily because drying is among the most significant operational expenses in such industries. Nevertheless, further studies are needed to validate this assumption, particularly those exploring alternative methods such as solar drying.
Another alternative when there is no technical feasibility for burning the material is the addition of an auxiliary fuel to the compound [
23]. In samples 2, 3, and 4, fractions of peanut shells were incorporated to evaluate the increase in LHV and, consequently, the potential improvement in RDF classification.
In sample 2, despite the addition of 10% peanut shells, there was no improvement in LHV classification compared to sample 1, as it remained in range P4 (LHV < 2390 kcal·kg−1). Moreover, the chlorine content was notably high (29.6%), placing it in the worst classification range (C4). It is important to note that having even a single variable in range 4 is sufficient to classify the compound as “Not an RDF”.
In samples 3 (with 25% peanut shells) and 4 (with 50% peanut shells), the RDF classification remained “Regular”. This outcome is due to both chlorine and mercury contents staying within their optimal ranges—C1 and H1, respectively—making the LHV the deciding factor for classification. Although the proportion of peanut shells was doubled, the LHV in both cases remained within the P3 range (2390 kcal·kg−1 ≤ LHV < 3580 kcal·kg−1). Therefore, in this context, increasing the amount of peanut shells did not significantly enhance the LHV or improve the overall fuel classification.
Furthermore, it was observed that sample 5, composed exclusively of peanut shells, showed a significant increase in LHV (3962.26 kcal·kg−1), placing it within the P2 range (3580 kcal·kg−1 ≤ LHV < 4750 kcal·kg−1). This led to an improved RDF classification of “Good”, as both chlorine and mercury contents remained within optimal levels (C1 and H1, respectively). However, the exclusive use of peanut shells raises concerns regarding volume and material availability. While municipal solid waste (MSW) is consistently generated year-round, peanut production is seasonal—occurring primarily during the rainy season and, to a lesser extent, in the dry season, which often requires irrigation. Additionally, climate change and an increasing frequency of extreme weather events (such as heavy rainfall, droughts, wildfires, and floods) can significantly affect agricultural yields, making the reliable supply of peanut shells uncertain.
Based on these results, it can be concluded that, although chlorine and mercury contents remained within their optimal ranges (C1 and H1), the high moisture content—and consequently low LHV—of the waste led to an RDF classification of only “Regular”, even with the addition of peanut shells as an auxiliary fuel. This outcome suggests that raw RDF samples (i.e., without prior drying treatment) are not suitable for use in furnaces and boilers under the conditions examined in this study.
The scenario observed in Brazil closely mirrors the findings of this study. According to data presented in
Figure 1 [
21], more than half (51.4%) of the average particle size composition of municipal solid waste (MSW) in Brazil consists of the wet fraction. This high moisture content significantly impacts the energy viability of RDF production.
Regarding the use of RDF after drying the material, predicting its application is challenging without conducting a financial feasibility analysis, which was beyond the scope of this study. However, future research is recommended to focus on the economic feasibility of drying waste, both with and without the addition of biomass, for use in furnaces and boilers. This is particularly relevant, as positive results were observed in laboratory-scale experiments under similar conditions.
6. Conclusions
This study provided new insights into the use of fuzzy logic for classifying the quality of Refuse-Derived Fuel (RDF) composed of Municipal Solid Waste (MSW), with or without the addition of peanut shells. The proposed fuzzy model demonstrated strong potential for assisting in RDF classification based on key variables—Lower Heating Value (LHV), chlorine content, and mercury content—producing results that closely align with expert evaluations.
The classification outcomes confirmed that untreated MSW samples generally result in RDFs of low energy quality due to their high moisture content. Although the inclusion of peanut shells improved the LHV, most combinations remained classified as “Regular”, emphasizing the limited effectiveness of co-combustion alone when pretreatment (drying) is not applied.
One key contribution was the confirmation that drying significantly enhances RDF quality, as shown in Sample A1. However, industrial-scale drying may face cost and feasibility barriers. Thus, one potential pathway to address this limitation is the integration of residual steam from the combustion process itself to pre-dry MSW, providing a self-sustaining and energy-efficient solution. Future studies should explore this proposition in greater detail, including alternatives such as centrifugation, chemical conditioning, mechanical pressing, or hybrid drying systems.
Furthermore, the application of systemic and hybrid analytical methodologies could improve RDF classification precision. Suggested future directions include (a) Multi-Criteria Analysis (MCA), (b) Computational Modeling and Simulation, (c) Artificial Neural Networks (ANN), (d) System Dynamics, (e) Advanced Statistical Analysis and Machine Learning, and (f) Scenario Methodology. Additionally, fuzzy-based combinatorial approaches—such as fuzzy-morphological analysis or fuzzy-brainstorming—could be explored to enhance decision-making in RDF quality assessments.
Lastly, integrating RDF classification into circular economy strategies could yield broader environmental and economic benefits. Future investigations might evaluate the valorization of RDF combustion byproducts, identifying new applications and markets aligned with sustainable development goals.
In summary, this study contributes an adaptable, rule-based model for RDF classification, laying the groundwork for more robust and interdisciplinary decision-support systems in the field of waste-to-energy technologies.


 ,
, 

