Article

Comprehensive Control Strategy for Hybrid Energy Storage System Participating in Grid Primary Frequency Regulation

1
Shandong Engineering Research Center for High-Efficiency Energy Storage and Hydrogen Energy Utilization, Shandong University, Jinan 250061, China
2
School of Electrical Engineering, Shandong University, Jinan 250061, China
*
Authors to whom correspondence should be addressed.
Energies 2025, 18(10), 2423; https://doi.org/10.3390/en18102423
Submission received: 30 March 2025 / Revised: 30 April 2025 / Accepted: 5 May 2025 / Published: 8 May 2025
(This article belongs to the Special Issue Trends and Challenges in Power System Stability and Control)

Abstract

:
The increasing integration of renewable energy sources has posed significant challenges to grid frequency stability. To maximize the advantages of energy storage in primary frequency regulation, this paper proposes a comprehensive control strategy for a hybrid energy storage system (HESS) based on supercapacitor battery. Firstly, considering the characteristics of the HESS and different control strategies, the battery responds to virtual droop control to reduce frequency deviation, while the supercapacitor responds to inertia control to suppress frequency drops and facilitate frequency recovery. Simultaneously, a reasonable dynamic dead zone is configured to prevent frequent actions of the battery and thermal unit while allowing flexible adjustments according to the load condition. Thirdly, an algebraic S-curve-based adaptive droop coefficient incorporating SOC is proposed, while the inertia coefficient additionally considers load type, enhancing adaptability. Furthermore, to better maintain the battery’s SOC, an improved adaptive recovery strategy within the battery dead zone is proposed, considering both SOC recovery requirements and system frequency deviation constraints. Finally, a simulation validation was conducted in MATLAB/Simulink. Compared to the conventional strategy, the proposed control strategy reduces the frequency drop rate by 17.43% under step disturbance. Under compound disturbances, the RMS of frequency deviation decreases by 13.34%, and the RMS of battery SOC decreases by 68.61%. The economic benefit of this strategy is 3.212 times that of the single energy storage scheme. The results indicate that the proposed strategy effectively alleviates sudden frequency disturbances, suppresses frequency fluctuations, and reduces battery output while maintaining the SOC of both the supercapacitor and the battery, thereby extending the battery lifespan and improving economic performance.

1. Introduction

Under the depletion of fossil energy sources and the development of clean energy sources, the global energy structure is undergoing profound changes, and wind and solar energy are increasing steadily. The rapid development of these clean energy sources provides new impetus for achieving sustainable energy development and environmental protection [1,2].
The high percentage of renewable energy integration results in low inertia characteristics in the system, making it challenging to maintain frequency stability [3,4]. Traditional thermal power units (TPUs) are constrained by ramp rate limitations, and they face challenges such as slow response, poor regulation accuracy, and reverse regulation, and the frequency regulation standards of the grid are hard to satisfy [5]. Energy storage systems (ESSs) are widely used in primary frequency regulation (PFR) applications and have better features such as faster response, bi-directional regulation, and precise tracking capabilities [6]. For example, a universal mathematical model for ESSs was developed in reference [7], laying the groundwork for future studies. Equating ESS to a first-order inertia model simplifies the model without affecting experimental results was also demonstrated in reference [8].
When the system frequency experiences sudden changes, increasing system inertia and adjusting power output based on frequency variation can both reduce frequency deviation (FD) [9]. Virtual droop control (VDC) and virtual inertia control (VIC) were separately introduced in references [10,11]. These strategies enable ESS to simulate the regulation and dynamic characteristics of TPUs, providing a basis for subsequent research. On the one hand, the VDC adjusts the active power output of ESS based on the deviation between the grid frequency and the rated frequency, effectively altering the steady-state value of the FD [12,13]. It was applied to electric vehicles for the purpose of grid PFR, thereby enhancing the voltage stability of DC distribution networks [14]. On the other hand, VIC uses the rate of change in the grid FD as the control signal to simulate the inertia response of conventional generators, effectively mitigating grid frequency degradation. In reference [15], it was proposed that battery energy storage systems (BESSs) could adopt both VIC and VDC methods in PFR. The VIC can respond promptly to large disturbances, thereby preventing the exacerbation of frequency deterioration, but it impedes frequency recovery during the restoration phase [16]. Therefore, virtual negative inertia control (VNIC) was proposed in reference [17]; it is opposite in sign to VIC and can facilitate frequency recovery during the restoration phase. Then, a switching method between VIC and VDC for PFR was employed in references [18,19], where the switching timing is determined through sensitivity analysis. This method combines the advantages of VIC and VDC, but the ESS output experiences a significant jump when switching, which easily causes frequency fluctuations. To smooth the output during switching, the direct switching of output modes was modified in reference [20] by distributing the output ratio between VDC and VIC using a distribution coefficient, thereby ensuring a smoother output transition. However, this approach typically depends on complex functions, making it challenging to implement in engineering practices.
Extensive research has focused on the control coefficients for ESS charging and discharging. The “fixed-K method” was employed in reference [21], which involves a constant VDC coefficient to control the BESS output. In reference [22], the method is improved, which is called the “variable-K method”, and it is categorized into ordinary, conservative, aggressive, and hybrid types. The VDC coefficient considers the SOC of the BESS, as shown in reference [23], enhancing frequency regulation effectiveness while preventing overcharging and over-discharging of the BESS. Most studies determined control coefficients based on the SOC of energy storage systems, employing functions such as hyperbolic tangent [24], piecewise [25], quartic [26], or linear [27,28]. However, these methods were basically adapted to changes in SOC and did not consider variations in control coefficients under different load conditions. Meanwhile, excessively complex curves increase the computational burden during actual operation.
As the requirements for grid frequency stability continue to increase, a single ESS has frequently proved to be inadequate in meeting these demands. ESS can be categorized into power-type storage and energy-type storage [29]. Energy-type electrochemical BESS has the advantages of high energy density and relatively low cost [30]. However, frequent grid frequency fluctuations lead to frequent BESS cycling, significantly shortening the lifespan of the BESS. Power-type energy storage systems, such as the supercapacitor energy storage system (SESS), are widely used. It has extremely high charge/discharge rates and a long cycle life, enabling rapid response, but its low energy density prevents long-duration operation. Currently, no ESS can meet the requirements for both high power density and high energy density [31]. Therefore, HESS can overcome the limitations of a single storage system, providing complementary advantages and more effectively maintaining grid stability.
Existing research on HESS coordination faces the problem of simply combining two types of storage and the lack of flexibility in control strategies. Flywheel ESS and BESS were directly connected in parallel in reference [32] to allow each to leverage the advantages of the respective energy storage types. Reference [33] employed a sliding average filtering method to allocate wind power, where the flywheel absorbs high-frequency power and the lithium battery energy storage system handles low-frequency power. Reference [34] selected a lithium battery and a supercapacitor for ESS frequency regulation, each using VDC, achieving better frequency regulation than a single ESS. However, the selection of control strategies is somewhat limited. References [16,35] simply applied control methods previously used for the BESS to both the BESS and SESS, combining them without addressing the coordination between different energy storage types or solving the problems inherent in the control strategies of individual ESS.
In summary, the deficiencies in the current ESS control strategies for PFR are as follows:
(1)
Current control strategies do not fully leverage the characteristics of ESSs and fundamental control methods;
(2)
Control coefficients for ESS output are fixed or only based on SOC without considering output variations under different operating conditions, while a more reasonable output curve is lacking.
(3)
The potential for SOC recovery within the PFR dead zone is not fully utilized.
To resolve these problems, a comprehensive control strategy for a battery-supercapacitor HESS participating in PFR is presented. The power-type SESS responds to the inertia control with VIC during frequency deterioration and VNIC during frequency recovery, making use of the high power of the SESS and inertia control to rapidly suppress frequency deterioration and facilitate frequency recovery. The large-capacity BESS responds to the VDC signal, continuously supplying power to reduce FD. A dynamically adjustable dead zone based on load conditions is configured, and the SESS is prioritized for power output through reasonable interval settings. To better maintain the SOC while regulating frequency, an algebraic S-curve-based adaptive droop coefficient incorporating SOC is proposed, with the VIC coefficient further considering the load types to enhance adaptability. To address the issue of SOC of BESS deterioration, adaptive recovery of BESS SOC is applied within the dead zone of the BESS, considering both SOC recovery requirements and system frequency deviation constraints. Finally, the comprehensive control strategy was verified through simulations under different disturbances, demonstrating its effectiveness across various metrics. It also reduces the charge/discharge cycles of BESS and enhances its cycle life, yielding better economic performance.

2. PFR Control Model Based on HESS

This section develops a dynamic model for PFR of a regional grid, incorporating HESS. Then, the advantages and disadvantages of VDC, VIC, and VNIC are theoretically analyzed. Finally, two typical types of loads are analyzed and differentiated.

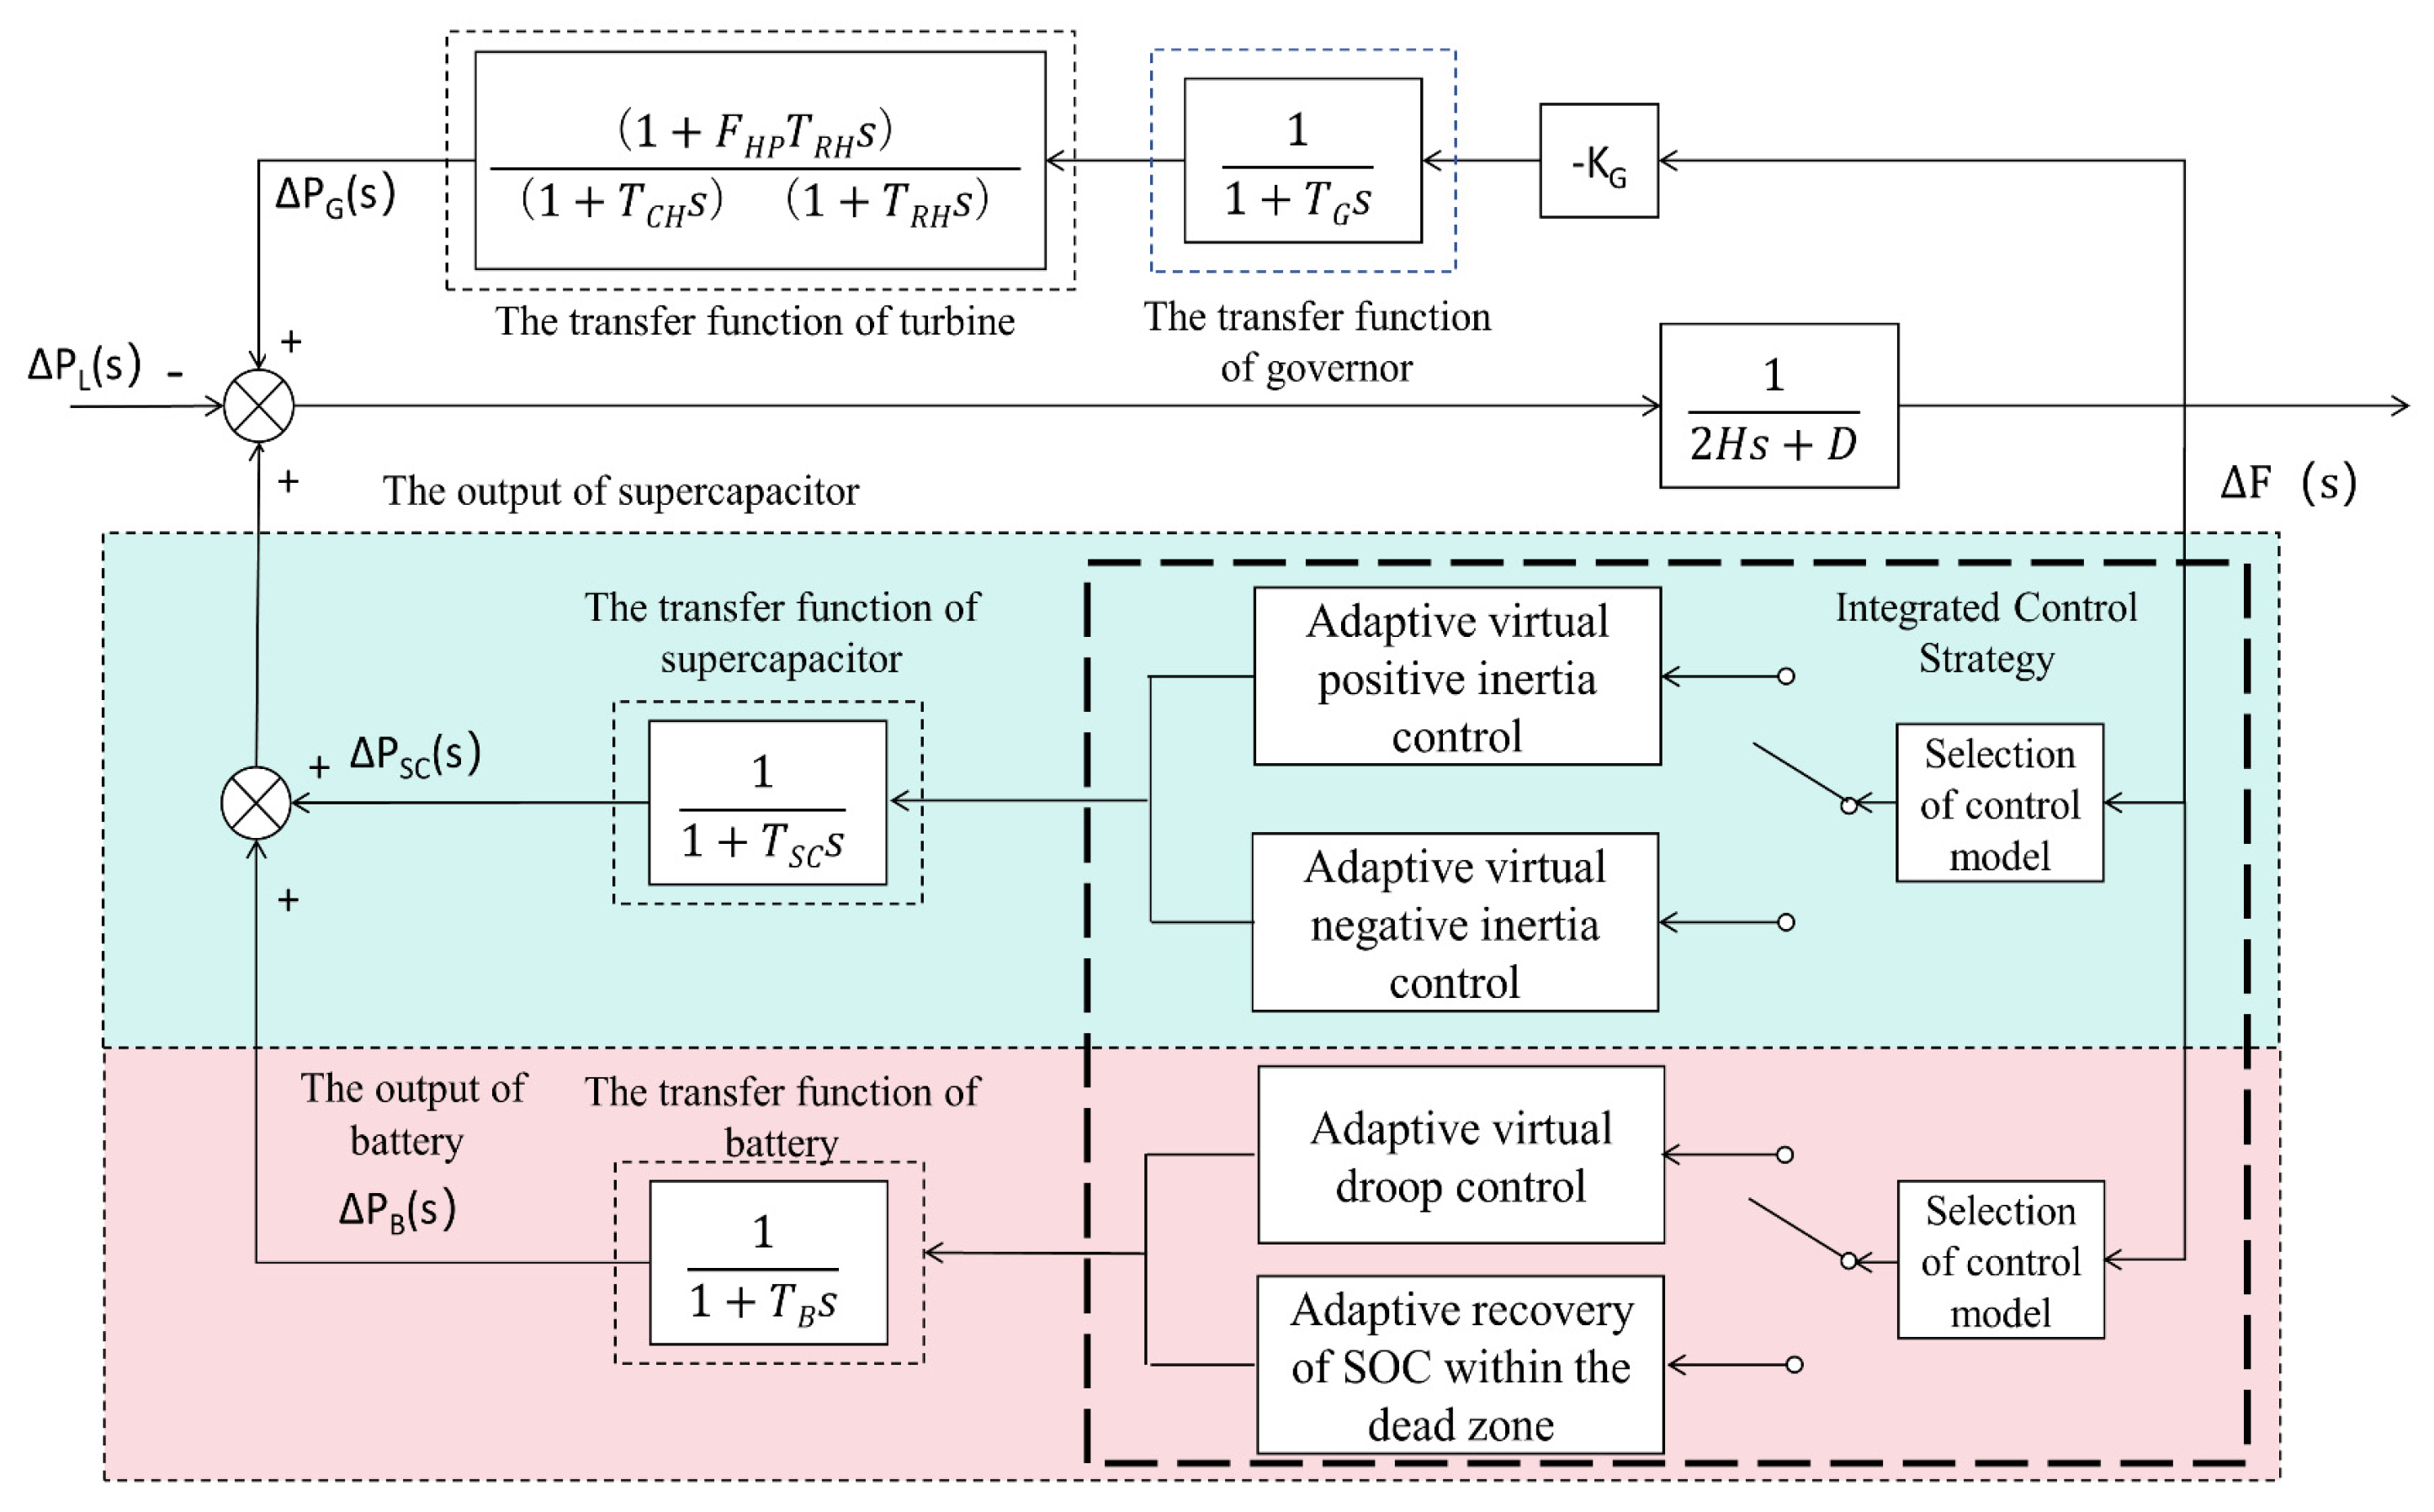
2.1. Primary Frequency Regulation Model

Based on the regional equivalent method, the models of each component within the region are converted into transfer function form. The resulting PFR model is shown in Figure 1. The parameters and units of the model are provided in Table 1.

2.2. Three Control Strategies

Following frequency fluctuations in the power grid, the frequency regulation signal passes through the prime mover and governor of the TPU, leading to a change in the turbine steam inlet flow, which in turn modifies the mechanical power output [36]. ESS can mimic the control of traditional TPUs to offset FD, as shown in Equation (1),
Δ f ( s ) = Δ P G ( s ) + Δ P E ( s ) Δ P L ( s ) 2 H s + D Δ P G ( s ) = K G Δ f ( s ) G g ( s ) G g ( s ) = 1 + F HP T RH s ( 1 + T CH s ) ( 1 + T RH s ) Δ P E ( s ) = Δ P K E ( s ) + Δ P M E ( s ) ,
where Gg(s) represents the transfer function of the TPU, and ΔPE(s) represents the output of the ESS. The output of the VDC and VIC is Δ P M E ( s ) and Δ P K E ( s ) , given by (2). The principle of VNIC resembles VIC, with only the output direction reversed, and therefore does not require separate analysis.
Δ P M E ( s ) = M E s Δ f ( s ) G E ( s ) Δ P K E ( s ) = K E Δ f ( s ) G E ( s ) s Δ f ( s ) = d Δ f ( s ) / d t ,
where sΔf(s) represents the rate of change in the FD, ME represents the VIC coefficient, and KE represents the VDC coefficient. Substituting Equation (2) into Equation (1) yields the following:
Δ f M E ( s ) = Δ P L ( s ) 2 H s + D K G G g ( s ) M E s G E ( s ) Δ f K E ( s ) = Δ P L ( s ) 2 H s + D K G G g ( s ) K E G E ( s ) .
Analyzing the rate of change in frequency deviation Δo0(s) and the quasi-steady-state frequency deviation Δfqs for VDC yields the following:
Δ o 0 = lim s   s s Δ f K E ( s ) = Δ p L 2 H Δ f qs = lim s 0   s Δ f K E ( s ) = Δ p L D + K G + K E .
As shown in Equation (4), VDC effectively reduces the steady-state FD but has no impact on the rate of change in FD.
Analyzing the rate of change in frequency deviation Δo0(s) and the quasi-steady-state frequency deviation Δfqs for VIC yields the following:
Δ o 0 = lim s   s s Δ f M E ( s ) = Δ p L 2 H + M E Δ f qs = lim s 0   s Δ f M E ( s ) = Δ p L D + K G .
As shown in Equation (5), VIC does not impact the final steady-state FD but does influence the rate of change in FD. Positive inertia control can effectively reduce the rate of change in FD, preventing its further deterioration, but it impedes the recovery of the FD. During the frequency recovery phase, VNIC facilitates the restoration of frequency. The proper coordination of VIC and VNIC can better utilize the ESS throughout the entire frequency regulation period.

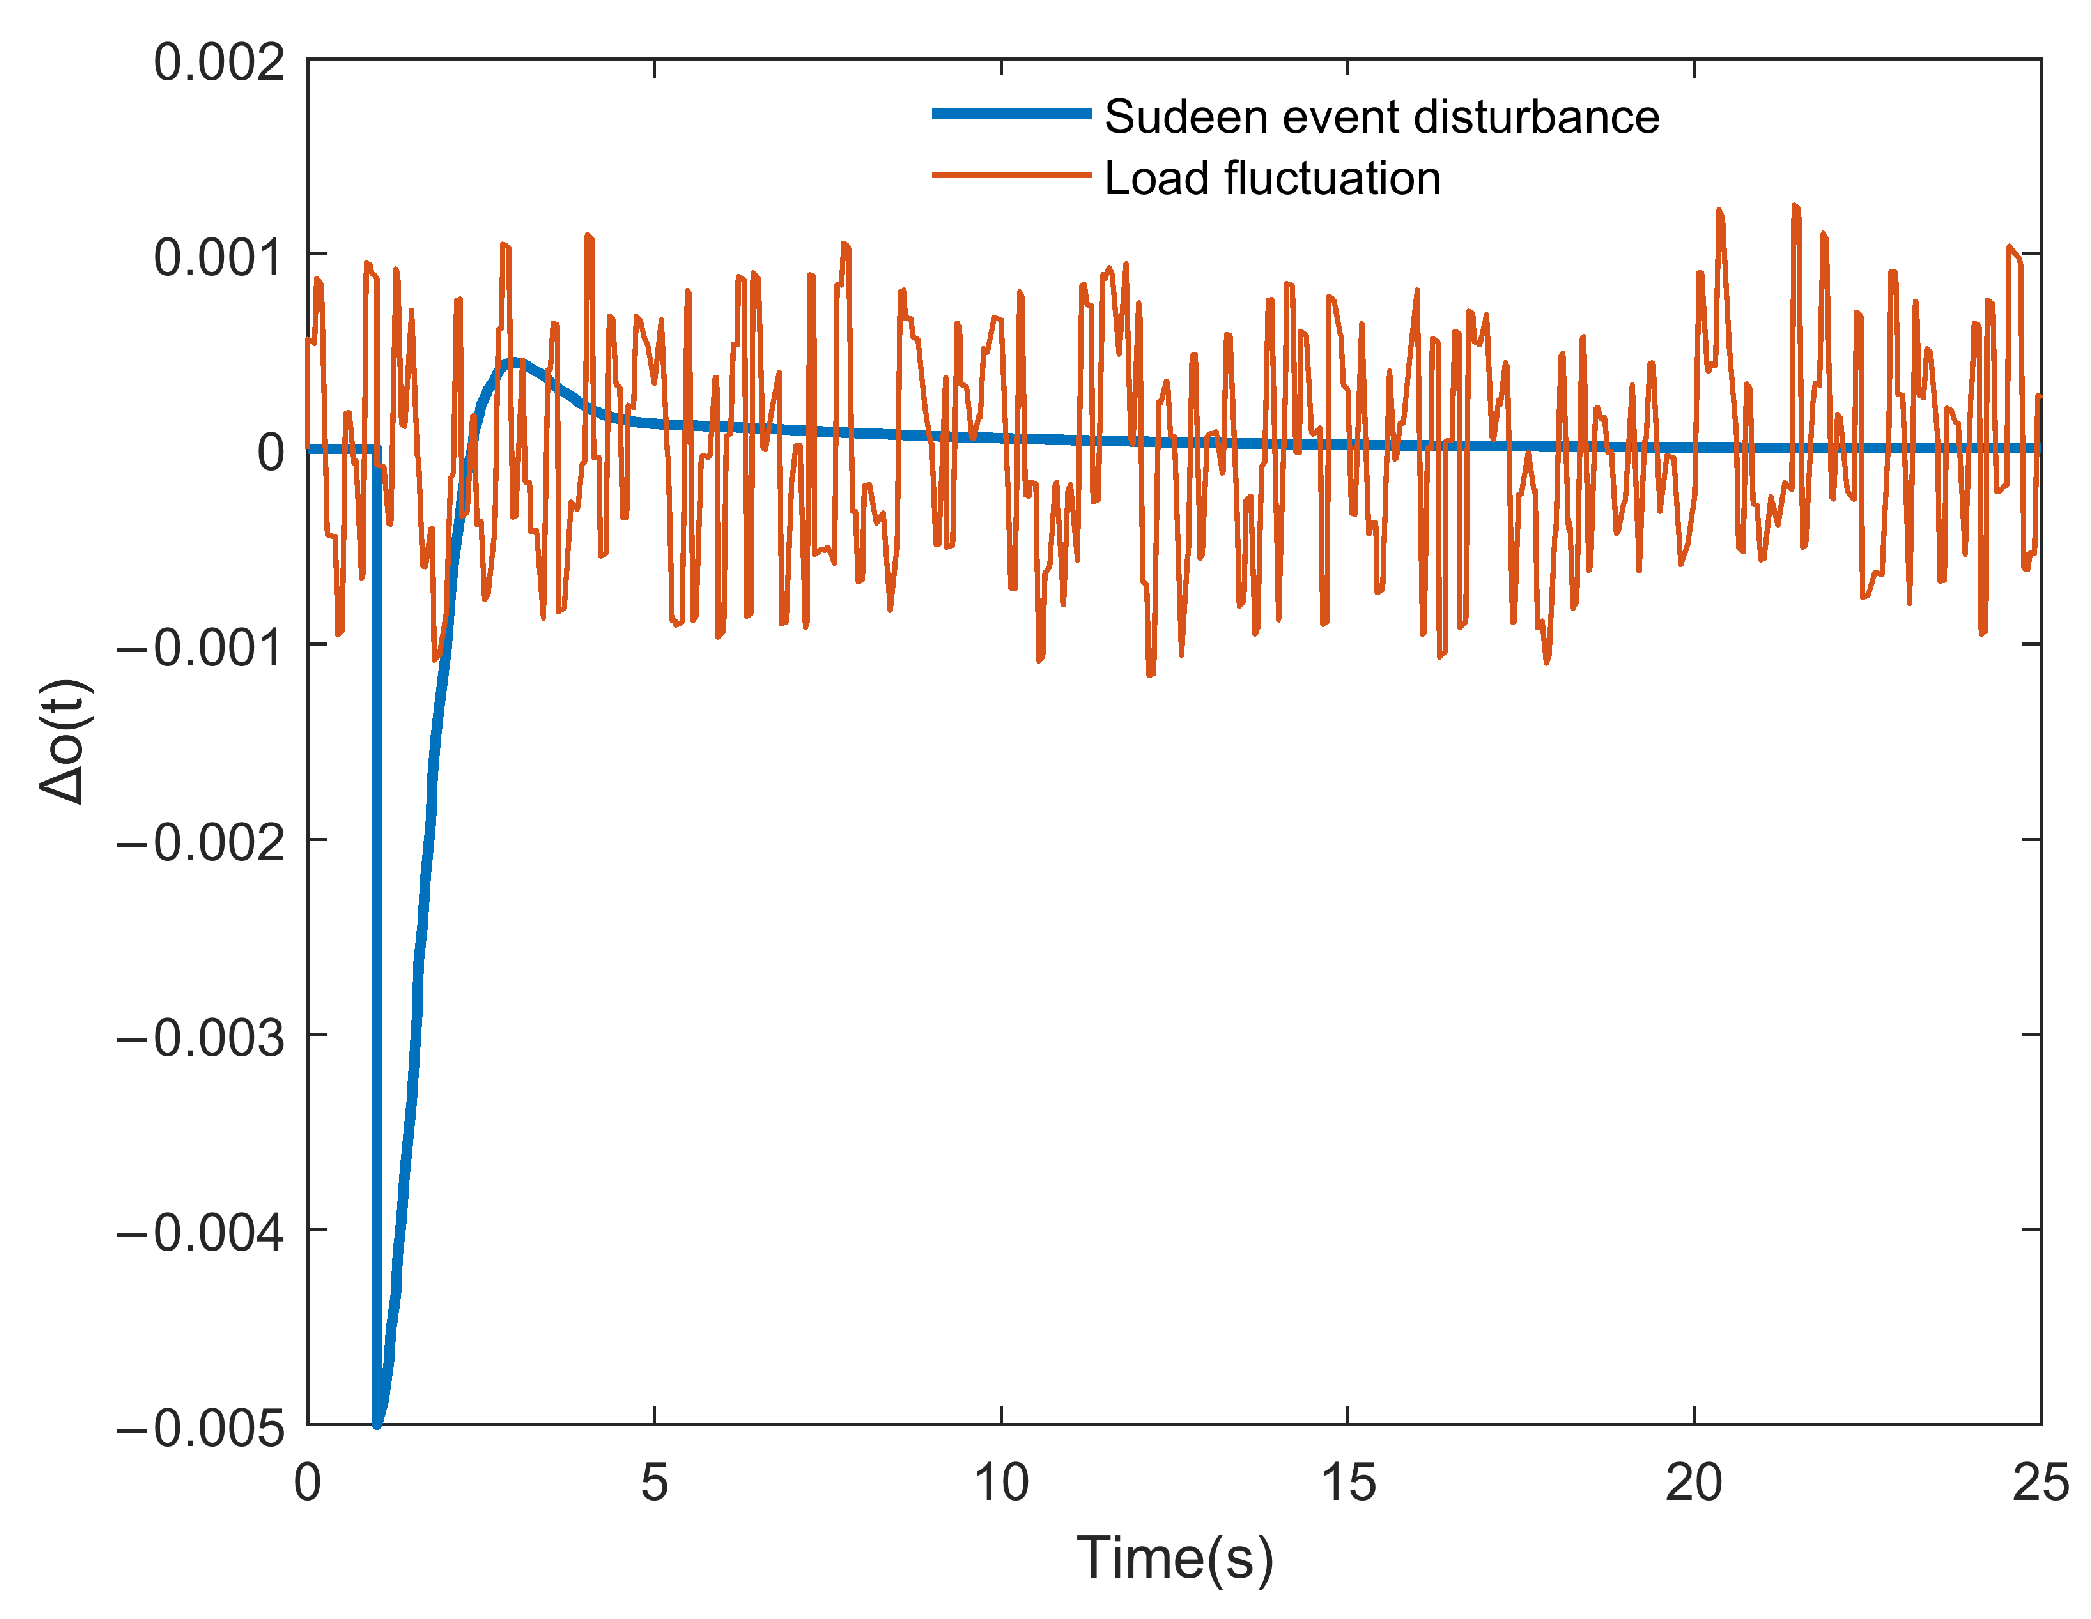
2.3. Analysis of Load Disturbance Types

Substituting Equation (2) into Equation (1) yields the following:
( 2 H + M E ) d Δ f d t + ( D + K E ) Δ f = Δ P G Δ P L .
At the moment the disturbance is introduced into the system at time t0, the TPU has not yet responded, and the frequency has not changed. Therefore, Equation (6) can be expressed as Equation (7), which takes the form of Equation (8).
( 2 H + M E ) d Δ f d t t = t 0 = Δ P L t = t 0 .
d Δ f d t t = t 0 = Δ P L t = t 0 ( 2 H + M E ) .
From this, it can be concluded that the rate of change in system FD is closely related to the type of disturbance introduced into the system.
There are two typical load disturbance scenarios in power grids: one is the sudden event disturbance (which is also called step disturbance), and the other is load fluctuation (which is also called continuous disturbance) [12]. Sudden event disturbances are usually associated with the startup or shutdown of large-capacity motors or load shedding due to grid faults. These disturbances in the power grid are characterized by sudden changes, leading to rapid and significant frequency variations. Load fluctuations are typically caused by the variability of renewable energy, random load variations in the power system, and uncertainties in grid operation. These disturbances are sustained over time, unlike step disturbances that are sudden and significant.
Based on the characteristics of the two load types, the disturbance type can be determined using the rate of change in FD, as illustrated by Equation (9),
Δ o ( t ) = f i f i 1 Δ T ,
where fi and fi−1 denote the frequency at the i-th and the i−1-th sampling point. ΔT is the sampling time interval.
The time-varying curves of Δo(t) under two typical disturbances are shown in Figure 2.
Under a sudden disturbance, Δo(t) rapidly increases to its peak and then quickly returns to zero. Under load fluctuations, Δo(t) fluctuates slightly around zero. Since the Δo(t) caused by sudden events varies across different power grids, the threshold value for determining a sudden disturbance also differs accordingly. In practical applications, the critical empirical value of oref is decided in accordance with the actual conditions of the regional power grid. When Δo(t) > Δoref, it indicates a sudden event disturbance.
Reference [37] theoretically demonstrated that the rate of change in FD at the initial moment under step disturbance can be calculated using Equation (10),
d Δ f d t t = t 0 = f s ( 2 H + M E ) R ,
where Δfs is the FD at steady state after the step disturbance.
GB/T 15945-2008 [38] states that under normal operating conditions of the power system, the absolute value of FD should be within 0.2 Hz, so the steady-state FD should be less than 0.2 Hz. Substituting fs = 0.2 Hz and the relevant parameters of this model (see Section 5.1) into Equation (10), it is determined that when the disturbance causes the rate of change of the FD to reach 0.18 Hz/s, the system’s steady-state deviation will exceed the safe limit. Reference [39] mentions that during the UK blackout incident, the rate of change of the FD at the onset of the disturbance was 0.135 Hz/s. Therefore, for safety considerations, the value of oref should not exceed 0.135 Hz/s.
A quasi-steady-state coefficient δ is introduced to determine whether the frequency reaches a quasi-steady state after a sudden event disturbance. The expression is shown in Equation (11), where δ < δref indicates that the system frequency has entered a quasi-steady state. δref is set to 0.001 [40].
δ = f i f i 1 f i .

3. Control Strategies for ESS Participation in PFR

3.1. Coordinated Control Based on Supercapacitor-Battery HESS

As analyzed before, VDC can provide a continuous output over the entire frequency regulation cycle to eliminate the FD. During the grid frequency drop phase, VIC is required to respond quickly and mitigate frequency changes. During the recovery phase, VNIC is required to support the restoration process. Each of the three control methods has its own characteristics and application scenarios, and achieving optimal frequency regulation requires their coordination throughout the entire regulation cycle. Reference [41] applied VIC and VNIC along with VDC to a single ESS, leveraging the advantages of these three control methods. Reference [42] employed both BESS and SESS for frequency regulation but only used VDC. Reference [16] utilized HESS and coordinated the three control strategies within a single storage device, achieving effective frequency regulation, but did not adequately account for the specific requirements of VIC and VDC on the storage characteristics.
BESS is the most widely used ESS, known for its high energy density, low power density, relatively short cycle life, and low cost. In contrast, SESS exhibits high power density and long cycle life, but its standalone application in PFR is limited due to its smaller capacity and higher cost. Based on the characteristics of the two types of ESS and the three control strategies, SESS, with its high power and rapid response characteristics, is well-suited to respond to inertial signals. BESS, with its high energy density and low cost, is more appropriate for VDC and can operate effectively throughout the entire frequency regulation cycle.
Therefore, to optimally match different ESSs and control methods, this paper proposes a coordination control strategy for HESS participation in PFR. When the FD exceeds the frequency regulation dead zone, the BESS operates with VDC to eliminate the FD. During the frequency deterioration phase, where [dΔf/dt]·Δf > 0, the SESS uses VIC to counteract the frequency decline. In the frequency recovery phase, where [dΔf/dt]·Δf < 0, the SESS employs VNIC to promote frequency recovery.
Figure 3 presents the Bode plots analyzing the magnitude–frequency characteristics under four scenarios: no ESS participation, BESS-only frequency regulation, SESS-only frequency regulation, and HESS frequency regulation.
It can be observed that the BESS, governed by VDC, effectively suppresses frequency deviation in the low-frequency range. The SESS, utilizing VIC, mitigates the impact of high-frequency power fluctuations on system frequency. The HESS strategy integrates the advantages of both control approaches. Across the full frequency spectrum, it yields lower and flatter response curves compared to single strategies. In the low-frequency range, its minimum magnitude ensures optimal steady-state accuracy; in the mid-frequency to high-frequency bands, it smooths out gain peaks of the single strategies, enhancing robustness to multi-frequency disturbances; and the steeper high-frequency attenuation aids in noise suppression.
The gain margins (GM) of the four strategies, calculated using MATLAB (R2022b), are 24.16 dB, 30.05 dB, 24.99 dB, and 32.22 dB, respectively. The HESS approach yields the highest GM, implying superior robustness against gain fluctuations. For the linearized closed-loop systems under all four strategies, all poles are strictly located in the left half of the complex plane, confirming the stability of each strategy.
Additionally, to further leverage the fast response and long cycle life of SESS, its dead zone ΔfSCd is set smaller than that of BESS, ensuring that SESS responds to frequency variations first. This prioritization enables frequency restoration before reaching the dead zone of the BESS (ΔfBd), significantly reducing the number of BESS cycles and mitigating its lifespan degradation due to cycling. Meanwhile, the ΔfBd is set smaller than that of the TPU to prevent frequent start-stop operations, which could lead to mechanical wear.
To account for the varying demands for dead zones under different load types and time periods, a dynamic dead zone is introduced for the ESS in this study. The expression of the dynamic dead zone is shown in Equation (12),
Dead   Zone ( t , Δ f ) = k 1 ( Δ f ) k 2 ( t ) f G d ,
where k1 is the load adjustment coefficient that varies dynamically with the load, and k2 is the time adjustment coefficient that differs between peak and off-peak hours, fGd is the dead zone for the TPU.
The construction rule of k1 is as follows: under high-frequency, low-amplitude fluctuations, a larger dead zone is adopted to reduce ineffective cycling and equipment wear; under low-frequency and large-amplitude disturbances, a smaller dead zone is employed to ensure rapid frequency regulation response. The expression of k1 is provided in Equation (13),
k 1 ( f ) = k 1 min + Δ f th | Δ f | ( k 1 max k 1 min )   | Δ f | Δ f th      k 1 max       | Δ f | < Δ f th ,
where k1max is the maximum value of the load adjustment coefficient (set to 0.6 for the SESS and 0.8 for the BESS), and k1min is the minimum value (0.55 for the SESS and 0.75 for the BESS). Δfₜₕ is the reference value of FD; a deviation greater than Δfₜₕ indicates significant load disturbance. Based on multiple simulation validations, Δfₜₕ is set to 0.1 Hz in this study.
The construction principle of k2 is that during electricity peak hours (generally from 17:00 to 22:00), both residential and commercial areas experience high and fluctuating loads, causing many small-magnitude but frequent short-term disturbances. Appropriately enlarging the dead zone during these times helps ignore small but frequent disturbances within a safe margin, thereby reducing unnecessary switching of storage devices.
The expression of k2 is given in Equation (14),
k 2 ( t ) = 1.1 17 : 00 < t < 22 : 00 1    else time periods .

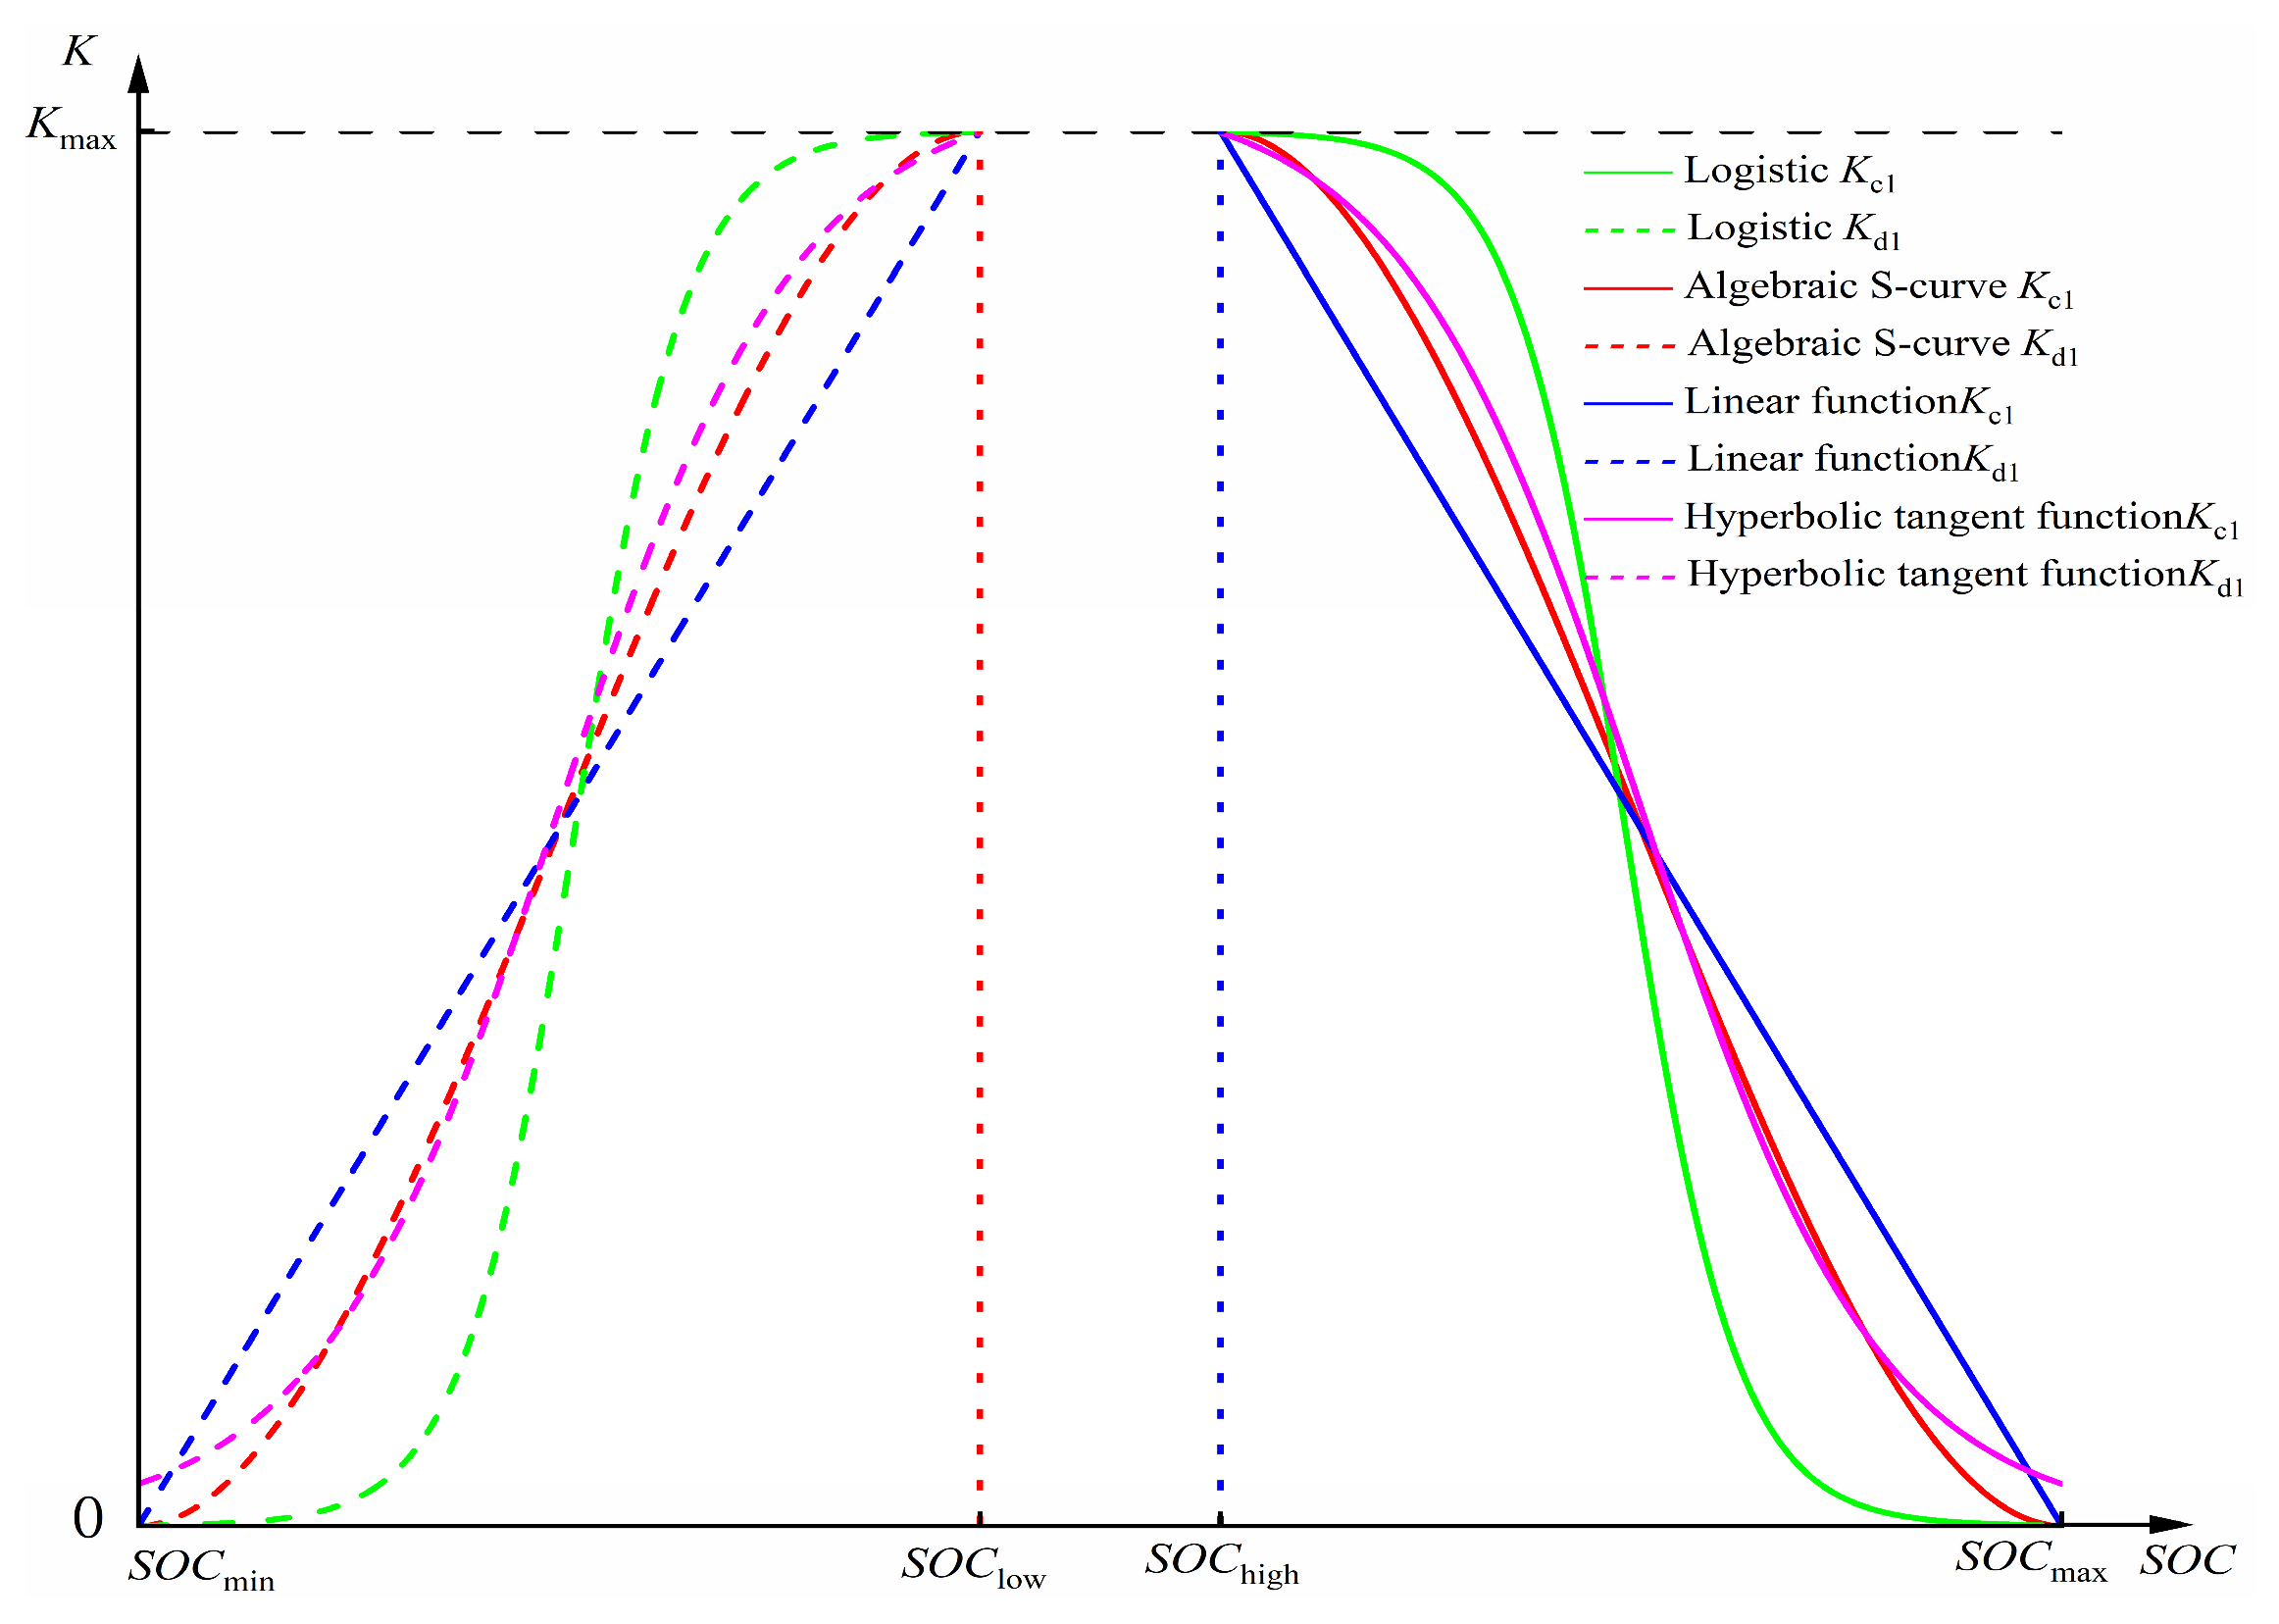
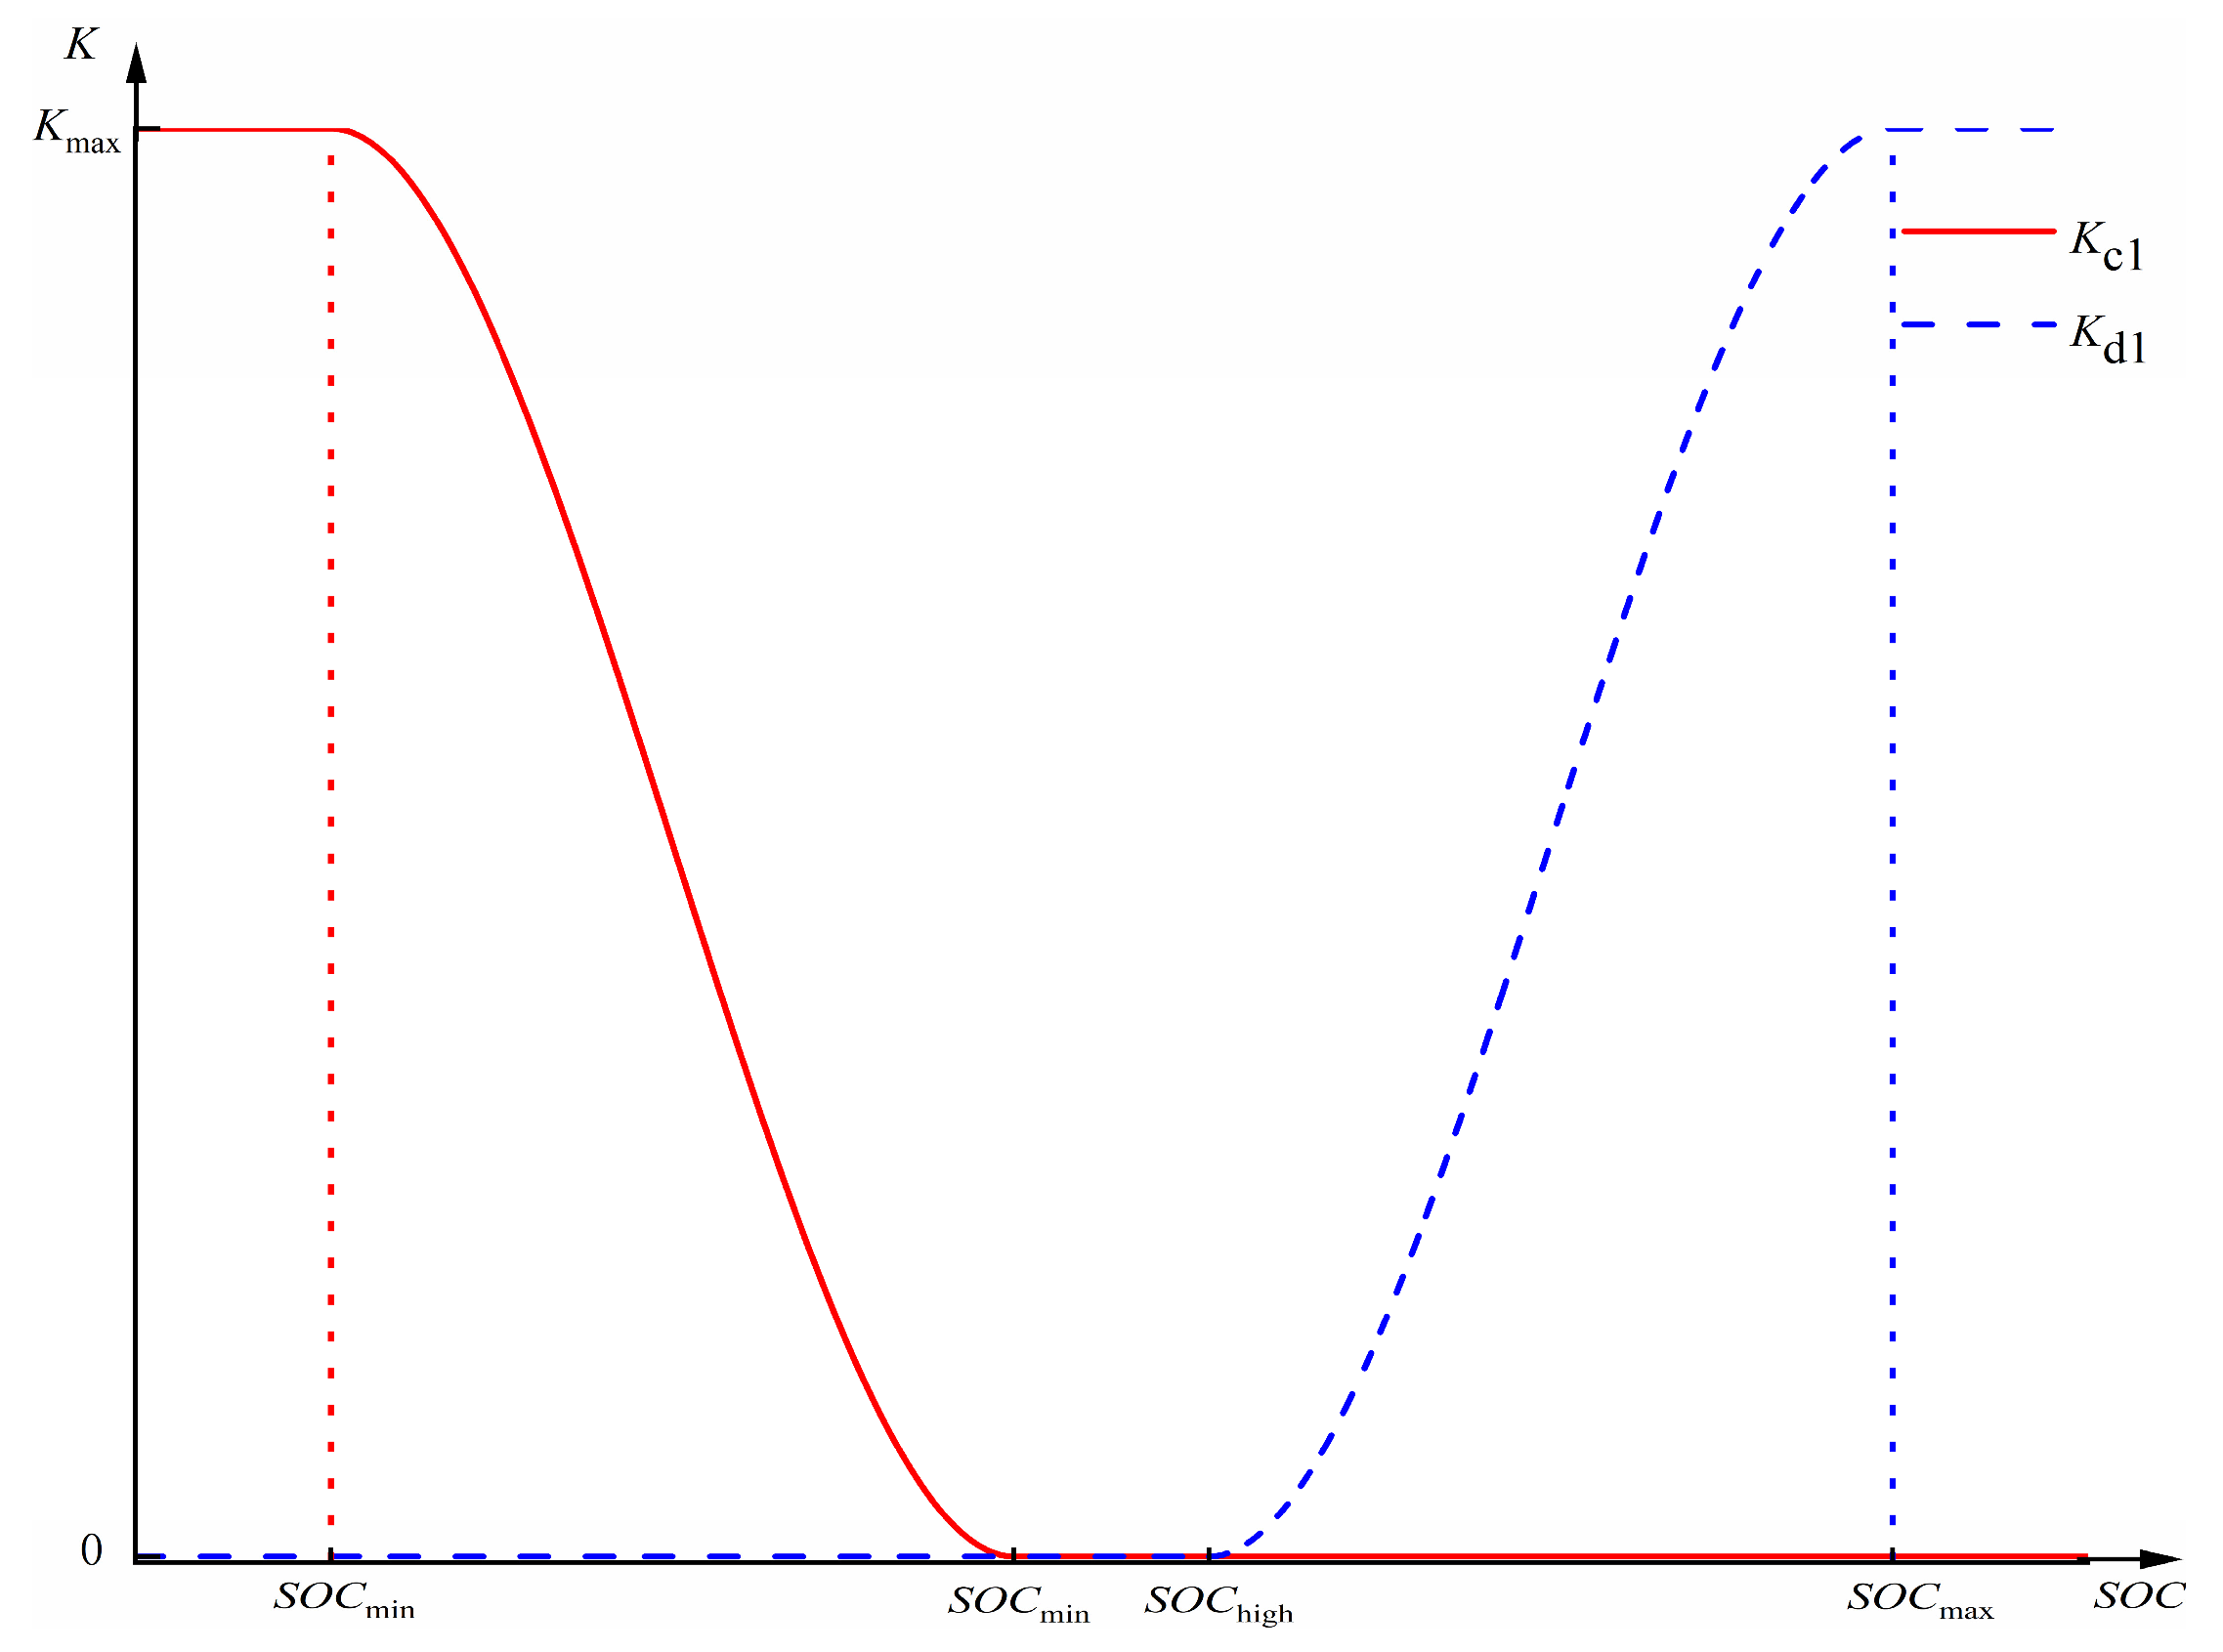
3.2. Adaptive Droop Coefficient Based on SOC Feedback

Traditional virtual droop control often uses fixed droop coefficients, known as the “fixed-K method”. This method maintains a constant power output throughout the entire frequency regulation cycle, achieving good results in the early stages of frequency fluctuation. However, it does not take into account the SOC of the ESS, which can lead to overcharging and over-discharging, significantly affecting the lifetime of the ESS. To ensure effective frequency regulation performance while also considering the SOC of the ESS, using an adaptive virtual droop coefficient that incorporates the SOC is a good choice. When the SOC is within an optimal range, the ESS prioritizes frequency regulation needs, charging and discharging at higher power levels. When the SOC is excessively low or high, the charging/discharging power is reduced to balance frequency regulation performance and the SOC. When the SOC exceeds the threshold, charging and discharging are stopped to prevent overcharging or over-discharging, which could pose a risk to the ESS.
To meet these requirements, most studies employ the logistic function to constrain the power output [43,44,45]. Reference [46] points out that the design of output constraints for ESS should consider the feasibility and engineering convenience in subsequent hardware implementation. Reference [47] states that complex mathematical operations such as exponential functions can cause significant computational burdens in embedded systems, whereas algebraic S-curves offer superior computational efficiency. Reference [48] demonstrates that algebraic S-curves meet the requirements for high-speed and high-precision robot applications. Reference [49] notes that in automatic machinery trajectory planning, algebraic S-curves facilitate a trade-off between smooth motion and computational cost.
The virtual droop coefficient based on the algebraic S-curve is shown in Equations (15) and (16).
When Δf > 0,
K c = K max                             S O C S O C h i g h K max × [ 1 ( 3 ( S O C S O C h i g h S O C max S O C h i g h ) 2 2 ( S O C S O C h i g h S O C max S O C h i g h ) 3 ) ] S O C h i g h < S O C < S O C max 0                              S O C S O C max .
When Δf < 0,
K d = 0                              S O C S O C min K max × [ ( 3 ( S O C S O C min S O C l o w S O C min ) 2 2 ( S O C S O C min S O C l o w S O C min ) 3 ) ] S O C min < S O C < S O C l o w K max                              S O C S O C l o w ,
where Kc and Kd represent the virtual droop coefficient during the charging and discharging of the ESS, respectively. SOC indicates the measured SOC of the ESS. SOCmin, SOClow, SOChigh, and SOCmax represent the minimum, low, high, and maximum SOC levels, respectively, varying with different types of ESS.
The virtual droop coefficients for SESS charging and discharging are KSCc and KSCd, respectively, with SOCmax = 0.9, SOChigh = 0.55, SOClow = 0.45, and SOCmin = 0.1. It should be noted that the SESS in the proposed control strategy does not employ VDC. However, the concept of the virtual droop control coefficient is used to help construct its virtual inertia control coefficient. For BESS charging and discharging, the virtual droop coefficients are KBc and KBd, with SOCmax = 0.8, SOChigh = 0.55, SOClow = 0.45, and SOCmin = 0.2.
Taking the SESS as an example, the relationship between the virtual droop coefficient and SOC is shown in Figure 4.
Figure 5 compares charge–discharge curves over the SOC interval [0.1, 0.45] and [0.55, 0.9] using algebraic S-curves, linear functions, logistic functions, and hyperbolic tangent functions (the values of the hyperbolic tangent function are approximately zero at the endpoints). It can be observed that linear functions exhibit poor adaptability in output curves, whereas algebraic S-curves, logistic functions, and hyperbolic tangent functions can effectively describe the transition from rapid response to steady state, achieving good adaptive performance. In practical engineering applications, the algebraic S-curve can reduce the computational burden and enhance real-time responsiveness without sacrificing control accuracy.

3.3. Adaptive Inertia Coefficient Based on Disturbance Type and SOC

The virtual inertia control coefficient MEP is expressed by Equation (17),
M E P = α β γ K S C c , Δ f 0 α β γ K S C d , Δ f < 0 ,
where α is the output adjustment factor. Since the magnitudes of the FD and the rate of change in FD differ significantly, a proper value of α should be set to ensure comparable outputs of VIC and VDC. In this study, α is set to 0.5 [50,51,52].
β is the load adjustment factor, which varies with the type of load. As analyzed in Section 2.3, under load fluctuation, the rate of change in FD is relatively small; a moderate increase in the inertia coefficient can assist in mitigating frequency fluctuations. At this time, β is set to 1. During a sudden event disturbance, the system FD and its rate of change are large. Using a high inertia coefficient during such instances may result in excessive power injection/absorption, thereby leading to a new frequency fluctuation. At this time, β should take a smaller value of 0.5 [53]. When δ < δref, it implies the FD is stabilizing, permitting β to return to a higher value of 1.
γ is the direction adjustment factor.
Reference [54] presents sensitivity curves for different values of ME and finds that the sensitivity changes from negative to positive and then tends toward zero. Further sensitivity analysis on ME demonstrates that VIC is effective only before the FD reaches its peak. After that, it suppresses frequency recovery; the suppression becomes more significant with a larger ME.
Therefore, γ is introduced to regulate the direction of power output. When dΔf/dt·Δf > 0, indicating that the FD and its rate of change have the same direction, the system is in a frequency deterioration phase, γ takes a positive value, indicating that VIC is applied to mitigate frequency deterioration. When dΔf/dt·Δf ≤ 0, the FD and its rate of change are opposite, the system is in a frequency recovery phase (dΔf/dt·Δf ≤ 0), and γ becomes negative, signifying the use of VNIC to promote frequency recovery.
An extreme disturbance (0.1 p.u.) was introduced into the system using only virtual inertia control; the maximum FD reached 0.15 Hz, staying within the safe limit, demonstrating the robustness of the VID coefficient in this model.

3.4. SOC Recovery Within the BESS Frequency Regulation Dead Zone

Previous research has shown that the SOC of the BESS often struggles to remain stable during large-scale system disturbances [17]. Therefore, in addition to the adaptive BESS output during the frequency regulation phase, an adaptive recovery mechanism is introduced within the BESS’s dead zone. Within the dead zone, where grid frequency remains within acceptable limits, the recovery demand coefficient is calculated according to the SOC. To prevent excessive charging or discharging power during recovery, which could push the frequency outside the dead zone again, a recovery constraint coefficient is derived considering the grid’s tolerance capacity. The SOC recovery coefficient is determined based on both the recovery demand coefficient and the recovery constraint coefficient. SESS, on the other hand, can effectively maintain its SOC under various operating conditions and therefore does not require an additional SOC recovery mechanism.

3.4.1. Recovery Demand Coefficient Determination Based on SOC

Taking the charging recovery demand coefficient Kc1 as an example, when SOC < SOCmin, the SOC is excessively low, which may negatively impact the lifespan of the BESS. Under such conditions, the BESS charges at maximum power, and Kc1 reaches its maximum value. When SOCmin < SOC < SOClow, Kc1 remains relatively high but decreases as SOC increases. In the range SOClow < SOC < SOChigh, the SOC is considered to be within a safe range, and no recovery is required. When SOC > SOChigh, the SOC is already high, and further charging could worsen SOC conditions. Therefore, for SOC > SOClow, Kc1 is set to 0. The specific expressions for the charging and discharging recovery demand coefficients Kc1 and Kd1 are given in Equations (18) and (19).
K c 1 = K max                              S O C S O C min K max × [ 1 ( 3 ( S O C S O C min S O C low S O C min ) 2 2 ( S O C S O C min S O C low S O C min ) 3 ) ] S O C min < S O C < S O C low 0                              S O C S O C low .
K d 1 = 0                              S O C S O C high K max × [ ( 3 ( S O C S O C high S O C max S O C high ) 2 2 ( S O C S O C high S O C max S O C high ) 3 ) ] S O C high < S O C < S O C max K max                              S O C S O C max .
The recovery demand coefficients for charge/discharge are illustrated in Figure 6.

3.4.2. Recovery Constraint Coefficient Based on Δf

The FD is classified into six states: −Δfd, −Δfhigh, −Δflow, Δflow, Δfhigh and Δfd, where Δflow, Δfhigh and Δfd correspond to the lower value, higher value, and upper dead zone limit of the FD, respectively.
Taking the charging recovery constraint coefficient Kc2 as an example, the principle is as follows: when Δf is less than −Δfhigh, the grid frequency is in a dangerous state with a risk of exiting the dead zone, and the discharge of the BESS is required to adjust the FD; hence, Kc2 is set to 0. When Δf lies between −Δfhigh and −Δflow, the grid frequency is relatively safe, and Kc2 increases as the absolute value of the FD decreases. When Δf lies between −Δflow and Δflow, the frequency is within a safe range. When Δf exceeds Δflow, the grid requires the BESS charging. Therefore, for Δf > −Δflow, Kc2 reaches its maximum value. The charge/discharge recovery constraint coefficients Kc2 and Kd2 are constructed using a cosine function, with their specific expressions shown in Equations (20) and (21).
K c 2 = 0                 f d < f < f high K max × 1 cos π f ( f high ) f low ( f high ) 2 f high f f low K max                f low < f < f d .
K d 2 = K max            f d < f < f low K max × 1 + cos π f f l o w f high f low 2 f low f f high 0             f high < f < f d .
The recovery constraint coefficients for charge/discharge are illustrated in Figure 7.

3.4.3. Determination of the Recovery Coefficient

To balance the SOC recovery demand of the BESS with the FD constraint of the grid, most studies selected the smaller value between the recovery demand coefficient and the recovery constraint coefficient as the SOC recovery coefficient of the BESS [55,56,57]. However, this approach leads to abrupt changes in BESS output during recovery, causing secondary disturbances to the system. Moreover, selecting the minimum value imposes excessive restrictions on recovery power, making the strategy overly conservative. To achieve smoother power output during battery recovery, a demand-constraint dynamically coupled recovery coefficient is adopted, as expressed in Equation (22).
K requ = a K c 1 + ( 1 a ) K c 2 S S O C l o w 0 S O C l o w < S < S O C h i g h a K d 1 + ( 1 a ) K d 2 S S O C h i g h .
The value of a is determined by Equation (23),
a = 1 1 + e k 1 ( S O C 0.5 ) × 1 | Δ f | Δ f d k 2 ,
where k1 and k2 are tuning coefficients used to adjust the magnitude of a.
When the SOC deviates significantly from 0.5 while the frequency remains within a safe range, a approaches 1, prioritizing the SOC recovery demand. When the SOC is close to 0.5 but the FD is about to exceed the dead zone, a tends toward 0, prioritizing frequency constraints. In intermediate states, a varies between 0 and 1, with its weight determined based on the deviations of SOC and Δf.
The calculation of the BESS recovery output Prequ within the dead zone is expressed in Equation (24),
Δ P requ = K requ | Δ f | .

4. Comprehensive Control Strategy and Evaluation Metrics

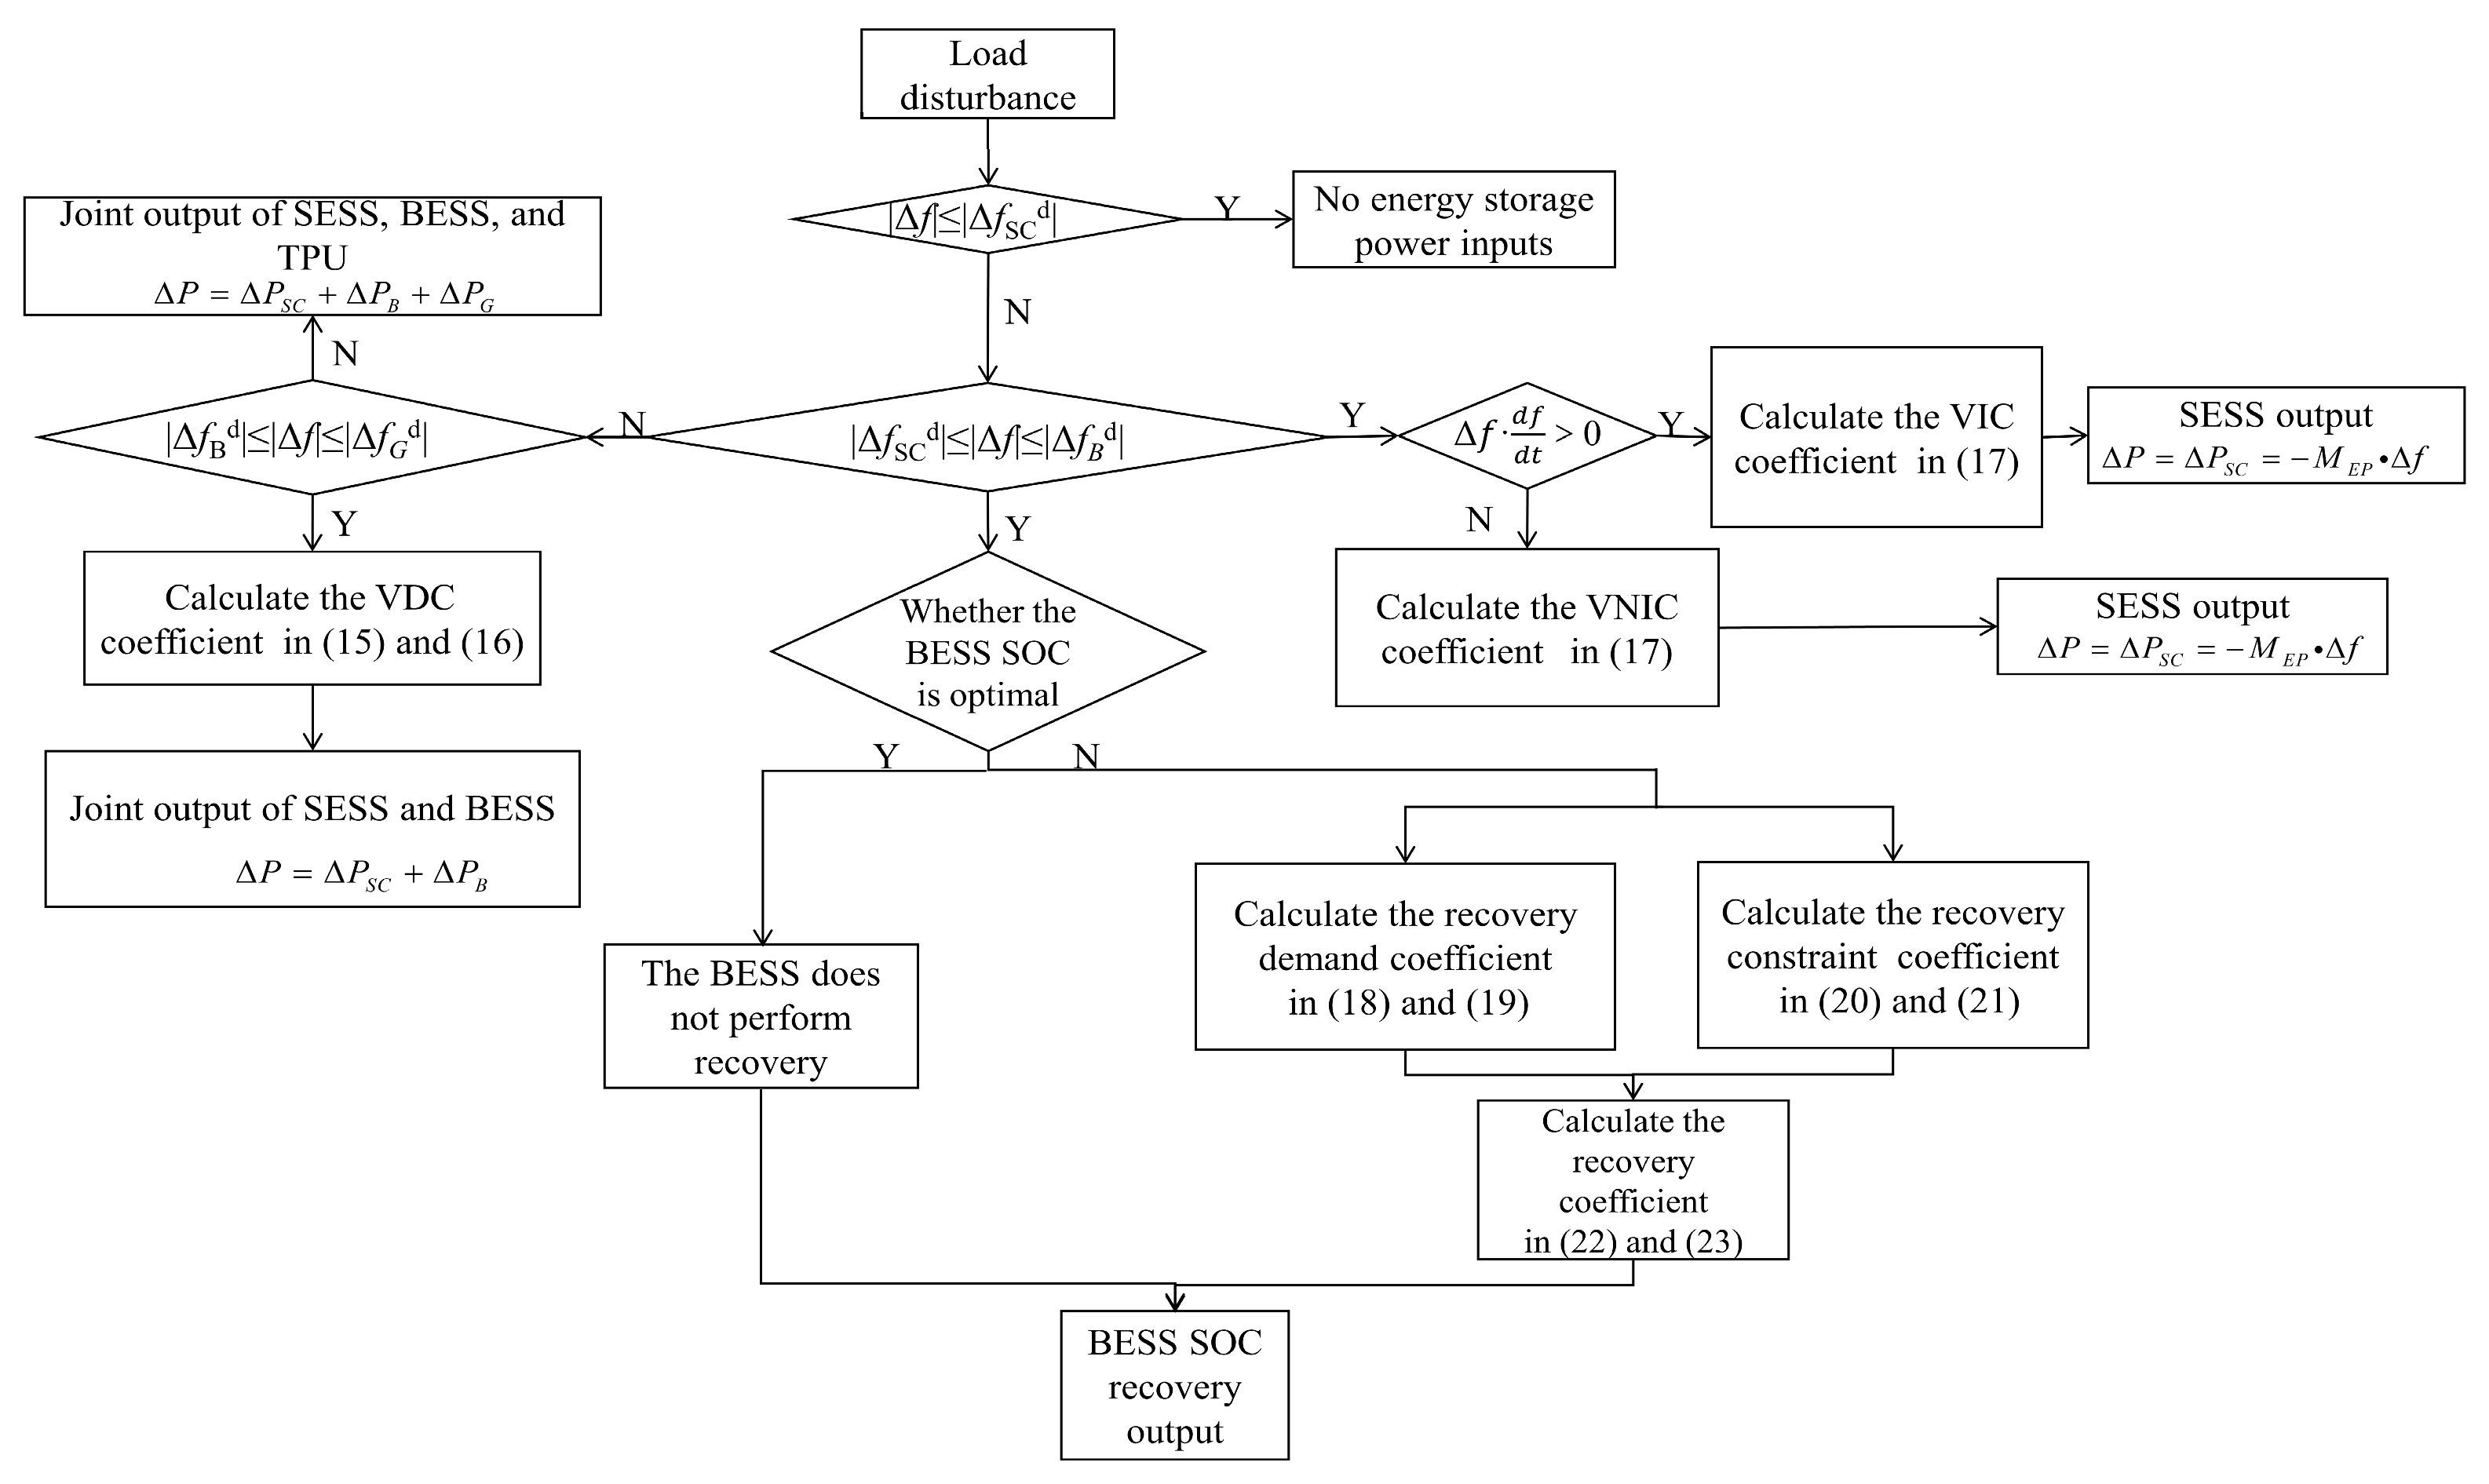
4.1. Comprehensive Control Strategy

This study puts forward a comprehensive control method for HESS to participate in PFR by considering the characteristics of SESS and BESS, flexibly adopting the three control strategies, and integrating adaptive control rules based on SOC and load type. The specific control strategy is illustrated in Figure 8.
Taking the case where Δf > 0, indicating that the BESS needs to absorb power for frequency regulation, yields the following:
(1)
When Δf < ΔfSCd, the FD lies within a safe range, so no frequency regulation is required.
(2)
When ΔfSCd ≪ Δf ≪ ΔfBd, the SESS is employed for frequency regulation, while the BESS decides whether to restore its SOC based on its current status.
① The participation of the SESS in grid frequency regulation can be categorized as follows:
(a)
When dΔf/dt > 0: At this stage, the FD and its rate of change are in the same direction, indicating a worsening frequency condition. The SESS determines the VIC coefficient based on (17) and applies adaptive VIC to mitigate frequency deterioration.
(b)
When dΔf/dt ≪ 0: Here, the FD and its rate of change are in opposite directions, indicating a frequency recovery phase. The SESS determines the VNIC coefficient based on (17) and employs adaptive VNIC to speed up frequency recovery.
② The recovery of BESS SOC within the dead zone is governed by the following principles:
(a)
When the SOC of the BESS is in a satisfactory condition, the recovery of SOC is deemed unnecessary.
(b)
When the SOC of the BESS is suboptimal, the recovery demand coefficient is determined based on (18) and (19), while the recovery constraint coefficient is calculated based on (20) and (21). Considering both the recovery demand and recovery constraint, the recovery coefficient is determined according to Equations (22) and (23), which is then used to calculate the SOC recovery power output of the BESS.
(3)
For ΔfBd ≪ Δf ≪ ΔfGd, the SESS and BESS collaborate for frequency regulation. The BESS participates in grid frequency regulation using VDC, with the VDC coefficient calculated according to (15) and (16). While the SESS continues to apply positive or negative inertia control based on the product of the FD and its rate of change.
(4)
For Δf > ΔfGd, the FD is large, and the HESS collaborates with the TPU to generate power.
From the above process, it can be seen that the proposed comprehensive control strategy divides the output timing of HESS and TPUs through dead zones, determines the output mode and direction based on FD and its rate of change, and adapts the droop and inertia coefficients according to SOC and disturbance type.

4.2. Evaluation Metrics

For step disturbance loads, the commonly used evaluation metrics are as follows: Δfm and tm represent the maximum FD and the corresponding time after the disturbance, while Δfs and ts represent the steady-state FD and the corresponding time. vm denotes the rate of frequency decline, and vm = |Δfm|/tm. A lower Δfm implies a less significant frequency drop, a smaller vm reflects a slower rate of frequency decline, while a smaller Δfs signifies better frequency recovery. Consequently, the smaller the values of these three parameters, the more effective the frequency regulation method.
For continuous disturbance signals, the root mean square (RMS) of FD, termed findex, and the RMS of SOC deviation, termed SOCindex, are utilized as evaluation indicators, with the specific forms provided in Equations (25) and (26),
f index = 1 n i = 1 n Δ f i 2 ,
S O C index = 1 n i = 1 n ( S O C i S O C 0 ) 2 ,
where Δfi represents the FD at the i-th sampling point, SOCi represents the SOC at the i-th sampling point, SOC0 is the set reference value, which is taken as 0.5, and N signifies the total number of sampling points. findex and SOCindex reflect the degree of dispersion of frequency and SOC, respectively. It is evident that the smaller the values of these indices, the smaller the deviation of frequency and SOC from the reference standard, indicating better frequency regulation and SOC maintenance performance of the system.
To evaluate the economic performance, an economic assessment model was established based on the life cycle cost theory and estimated benefits of ESS participation in PFR.
The cost present value CLCC is expressed as shown in Equation (27),
C LCC = C inv + C O & M + C scr + C β + C α ,
where Cinv is the life cycle investment cost of ESS, CO&M is the operation and maintenance cost, Cscr is the disposal cost, Cβ is the penalty cost due to deficiencies, and Cα is the cost of curtailed energy. The detailed formulation can be found in reference [54].
The net revenue present value NRES is calculated as in Equation (28),
N REG = R REG × E R E G ,
where RREG is the market compensation for PFR and EREG is the regulation energy.
The net present benefit PNET is given in Equation (29),
P NET = N RES C LCC .
A higher PNET indicates better economic performance of the proposed control strategy.

5. Simulation Verification

5.1. Simulation Model

To evaluate the effectiveness of the proposed control strategy, a PFR simulation model for a regional power grid, as illustrated in Figure 1, was constructed in MATLAB/Simulink (R2022b). The thermal power unit has a rated capacity of 1000 MW, with the SESS configured at 25 MW/0.5 MW·h and the BESS capacity set at 10 MW/1 MW·h. To better capture the variations in the SOC of the ESSs, the ESSs were configured with relatively small capacities. The system reference frequency is 50 Hz, and the primary PFR dead zone for the TPU was set at ±0.033 Hz. The remaining parameters were converted into per-unit values based on the rated frequency and rated capacity of the unit. Specifically, the FHP value was set to 0.3; TG, TRH, and TCH were set to 0.1, 10, and 0.3 s, respectively; H was set to 5; D was set to 4; and TSC and TB were set to 0.2 and 0.3, respectively.
To explore the appropriate value for oref, a segment of actual grid load data shown in Figure 9 was introduced to the HESS, and the recognition effectiveness of the step disturbance signal was tested at three values of 0.05 Hz/s, 0.1 Hz/s, and 0.135 Hz/s.
Under the same load disturbance, the system with oref set to 0.05 Hz/s identified 8262 sudden disturbance events, resulting in a very high false detection rate, which was completely unacceptable. The system with oref set to 0.135 Hz/s failed to recognize any sudden disturbance events, resulting in a high miss detection rate, which could not meet the requirements. The system with oref set to 0.1 Hz/s recognized five sudden disturbance events, which was more in line with the actual grid situation.
To investigate the impact of different oref values on system stability, a typical step disturbance signal was added to systems with oref values of 0.05 Hz/s, 0.1 Hz/s, and 0.135 Hz/s, and the resulting frequency deviations are shown in Figure 10. The curves for oref values of 0.05 Hz/s and 0.1 Hz/s overlap, both effectively identifying the step disturbance signal and promptly reducing the VIC coefficient, thus maintaining system stability. The system with oref set to 0.135 Hz/s failed to effectively recognize the step disturbance signal, resulting in excessive system inertia and causing frequency fluctuations.
In conclusion, selecting 0.1 Hz/s as the oref value for the proposed control strategy strikes a balance between recognizing step signals and maintaining system stability.

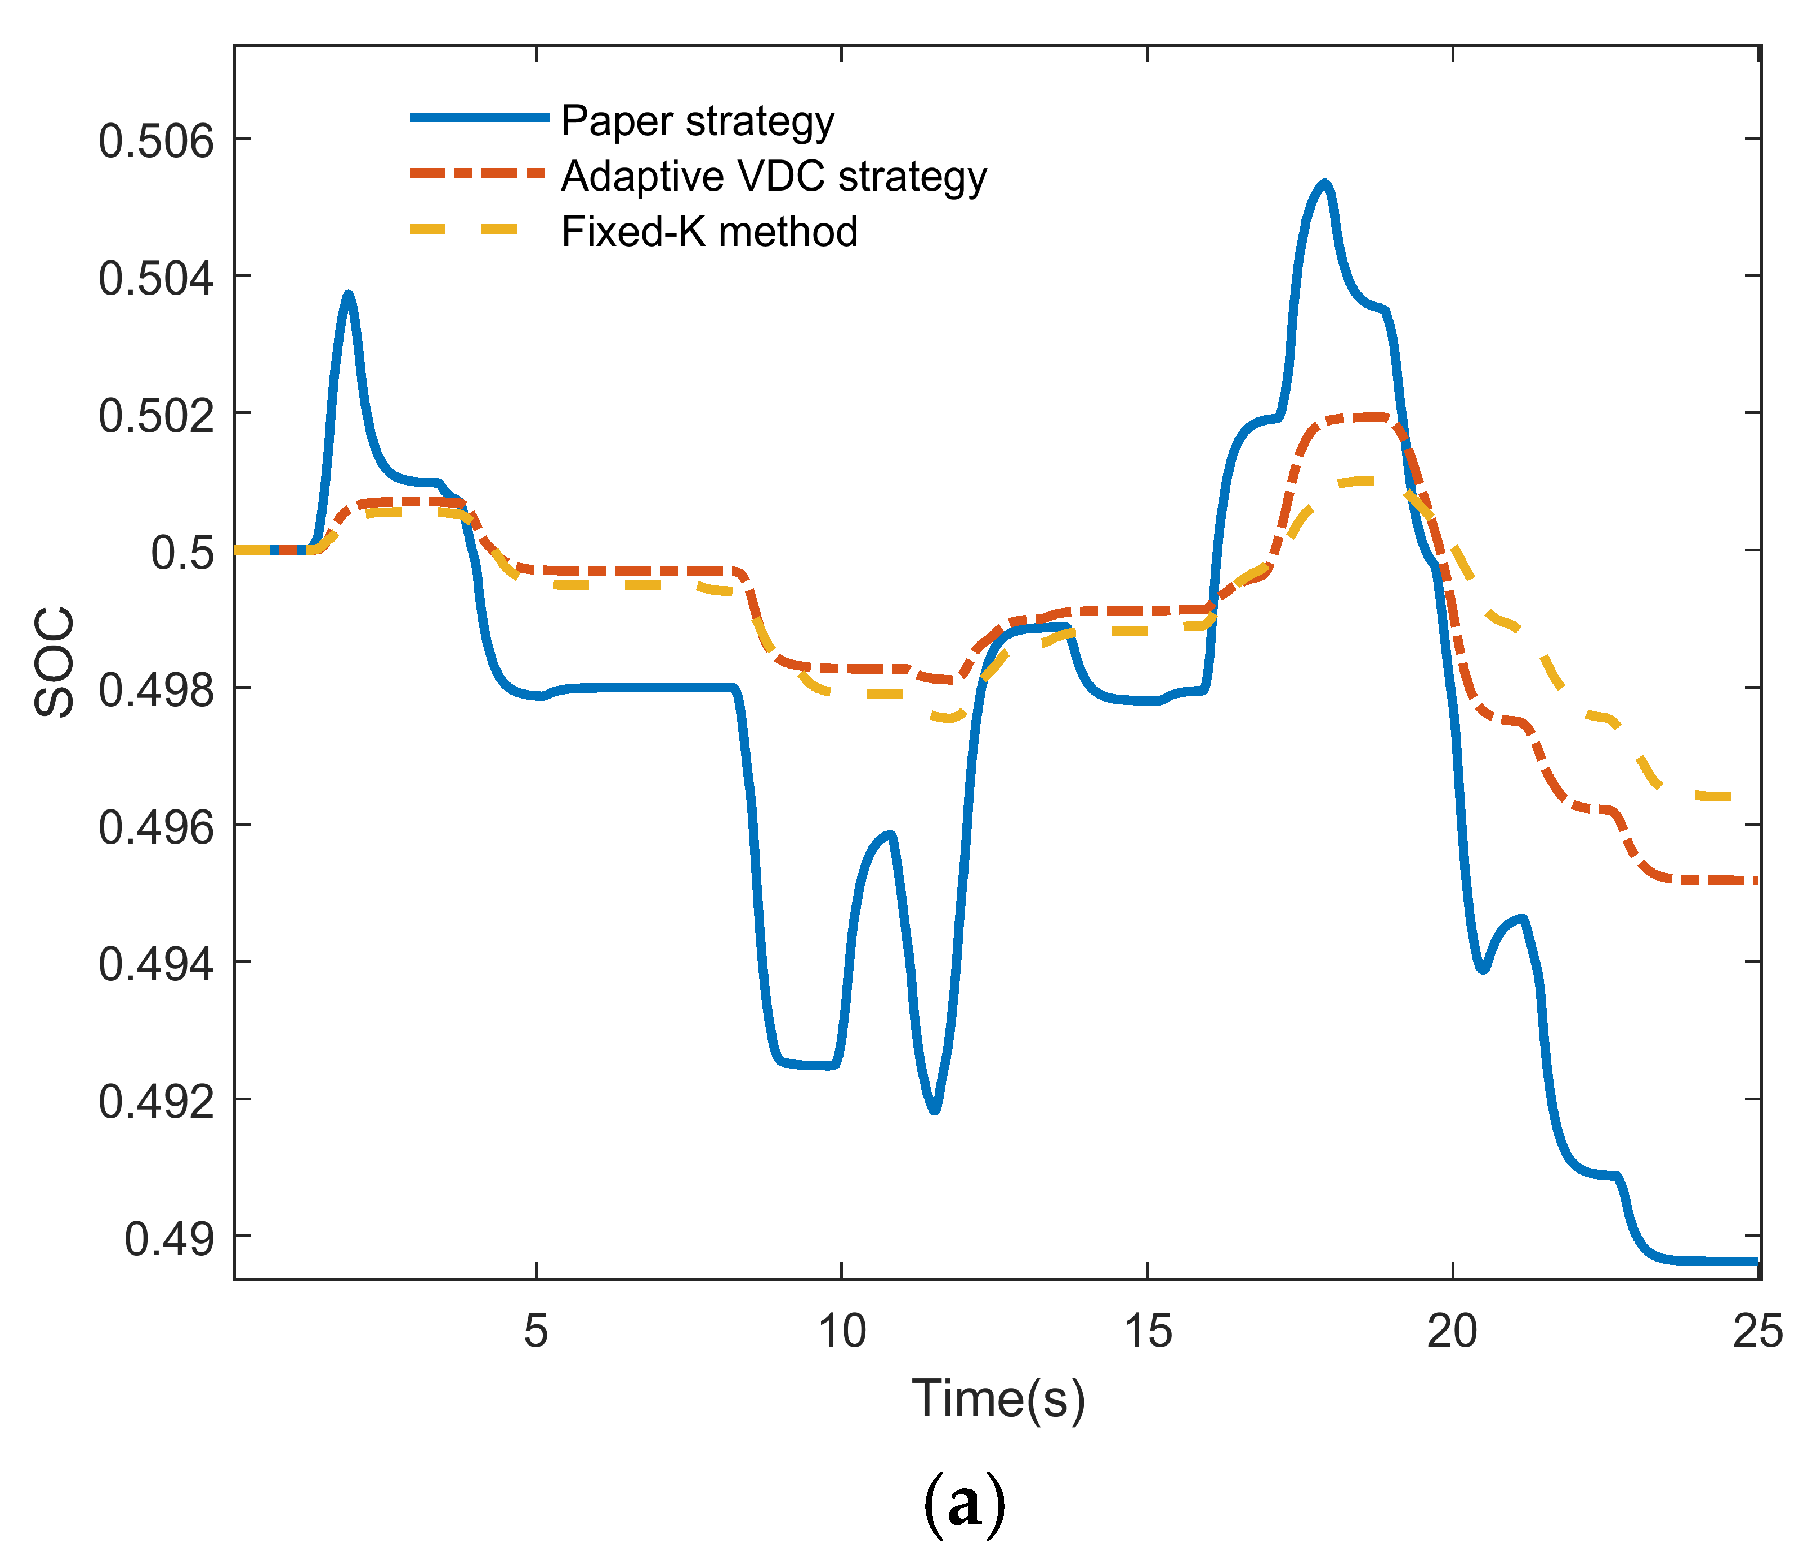
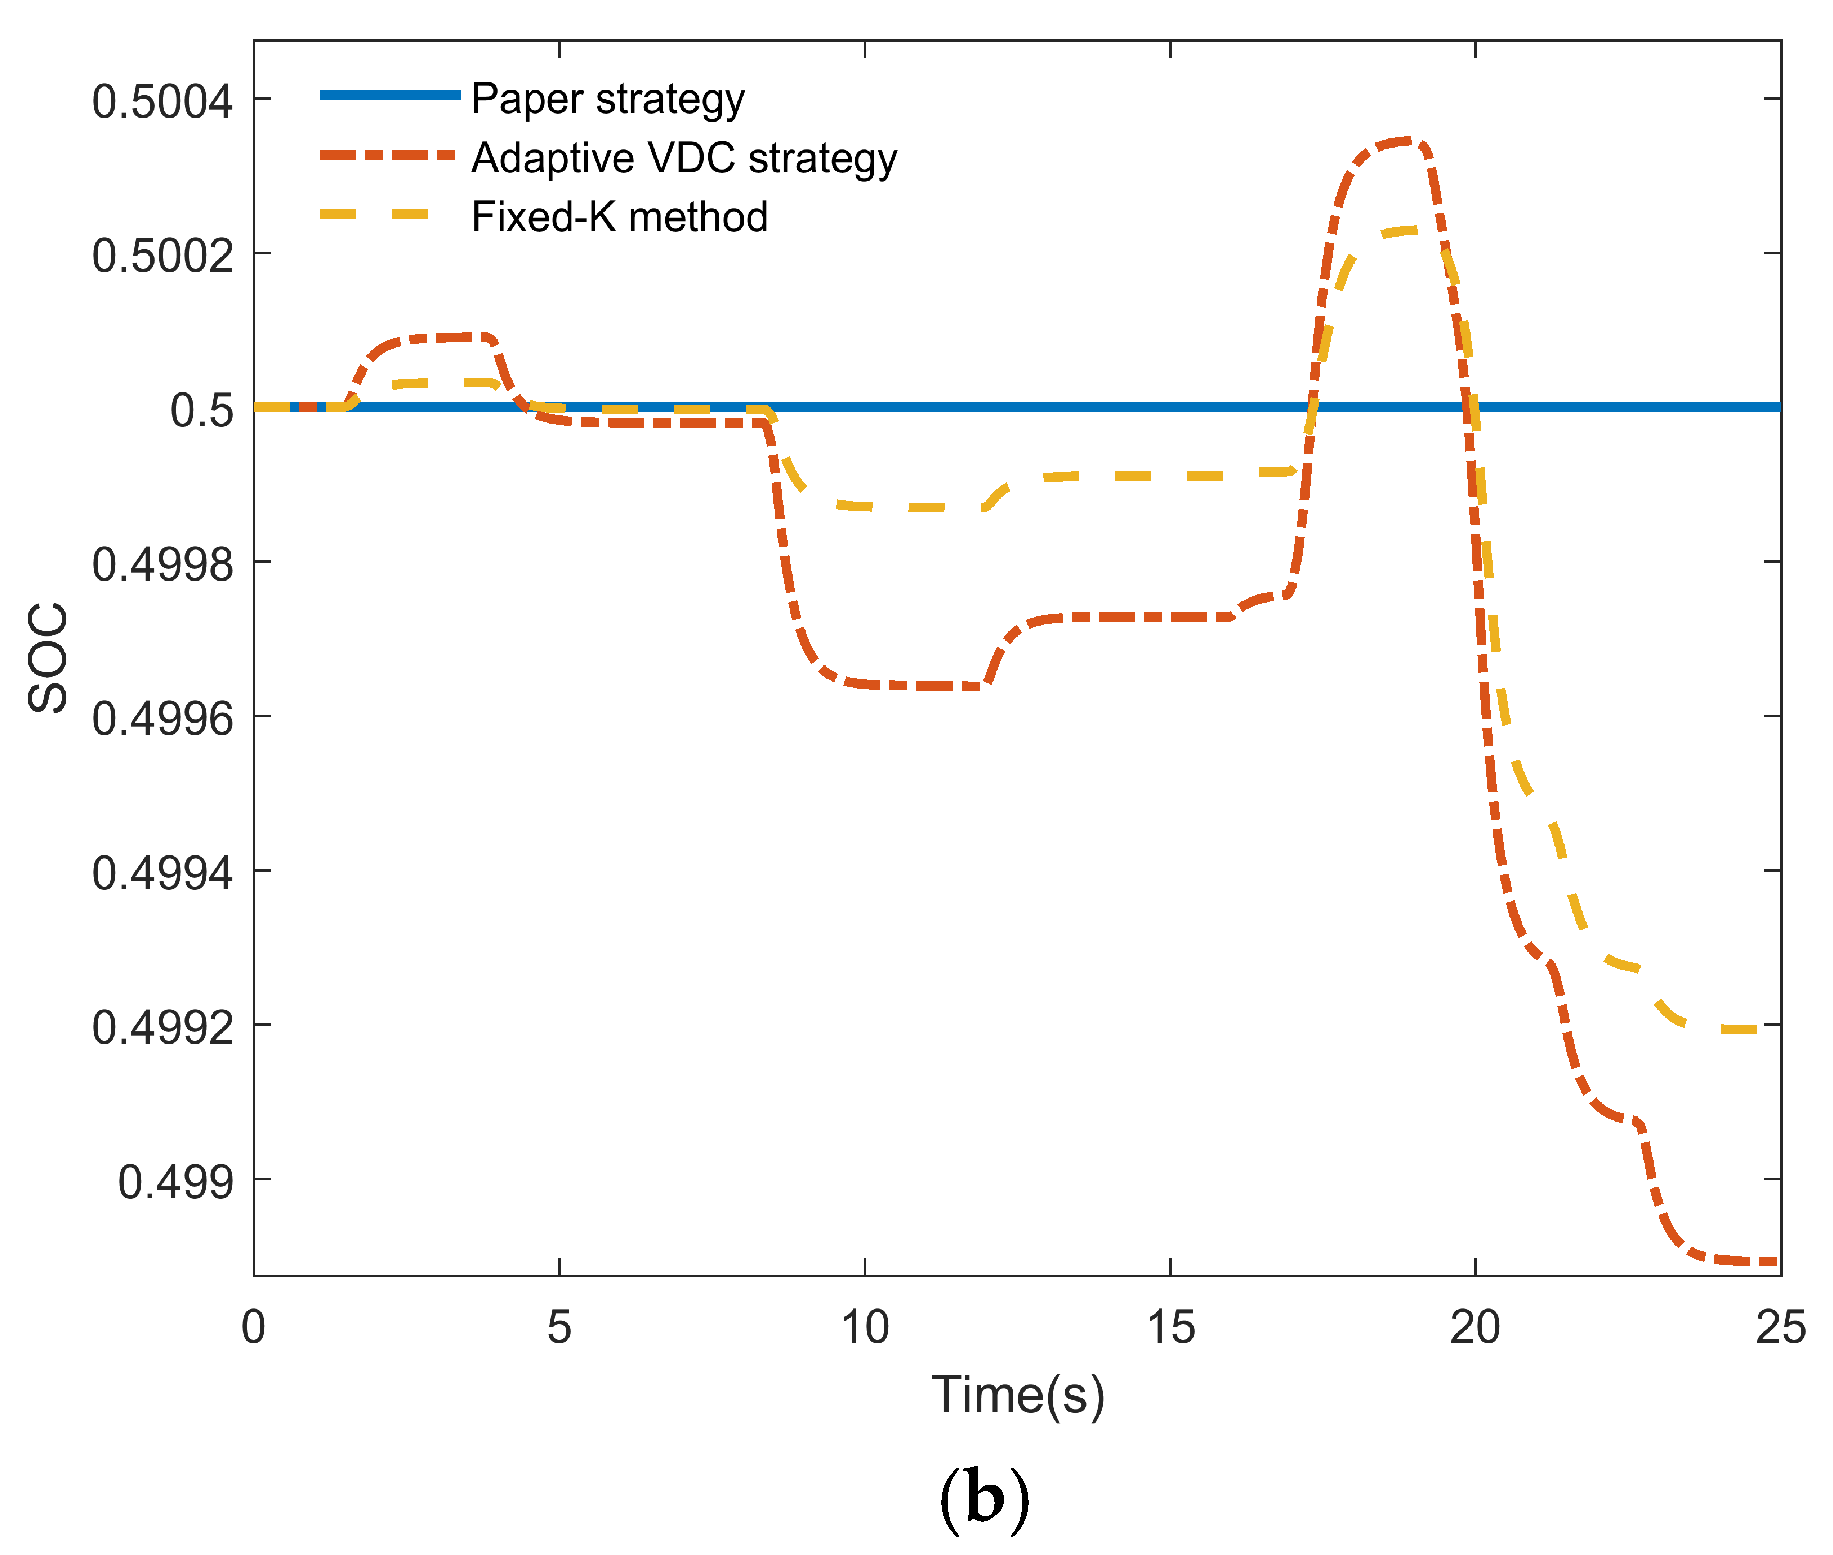
5.2. Simulation and Analysis of Step Load Disturbance

A step disturbance signal of 0.05 p.u. was employed for the model under four scenarios: the method proposed in this study (“Paper strategy”), the adaptive VDC strategy outlined in reference [58] (“Adaptive VDC strategy”) (also called the conventional strategy), the fixed-K method (“Fixed-K method”), and the condition without ESS (“No ESS”). The resulting FD curves are illustrated in Figure 11, the SOC variation curves are illustrated in Figure 12a,b, and the PFR performance metrics are summarized in Table 2.
As illustrated in Figure 11, the frequency of all four systems experiences a rapid decline at the initial stage of the disturbance. The system without energy storage exhibits the most significant frequency reduction, whereas the three systems with energy storage demonstrate comparatively minor declines. Although adaptive VDC achieves the smallest initial frequency drop, it experiences a secondary drop in the subsequent phase. This reveals the limitation of using VDC alone, where ESS cannot flexibly adjust its output during sudden events, leading to rapid energy depletion and an inability to continue output, causing a secondary frequency drop. The proposed control strategy achieves a smaller maximum FD compared to the other two methods. This is due to the fact that VIC can suppress the deterioration of frequency. Subsequently, the frequencies of all systems recover relatively quickly. Given that PFR is a proportional control, the FD cannot be entirely eliminated without considering the secondary frequency regulation, leaving each system’s FD stabilized at a specific value. Among these, the proposed control strategy attains the smallest steady-state deviation. This demonstrates the role of using VNIC in frequency recovery. As shown in Table 2, compared to traditional TPU frequency regulation, the steady-state FD in this control strategy decreased by 25.27%, and the maximum FD decreased by 14.35%. The proposed control strategy effectively suppresses the frequency drop and facilitates frequency recovery. Compared to the other three control strategies, this strategy has the slowest frequency decline rate, with reductions of 17.43%, 29.31%, and 46.89%, respectively. Additionally, it achieves the shortest recovery time, reducing recovery time by 11.39%, 12.78%, and 13.96%, respectively. This is attributed to the combination of SESS and inertial control, which enables rapid response and adjustment.
The minimal maximum FD and absence of secondary drop indicate that this strategy effectively mitigates the impact of sudden disturbances on system frequency. Moreover, the smallest steady-state FD confirms its superior ability to mitigate the impact of sudden disturbances on grid frequency.
As illustrated in Figure 12a, under the adaptive VDC strategy, the SOC of the SESS drops significantly. This is because when only droop control is used, the ESS continues to output during large disturbances, making it difficult to maintain its SOC. Both the proposed control strategy and the fixed-K method stabilize the SOC decline of the SESS. Although the proposed strategy slightly underperforms the fixed-K method in maintaining the SOC, the difference is negligible, and the SOC remains within the safe range. Under large load disturbances, the primary task of ESS is to maintain frequency stability. Therefore, the proposed control strategy in this paper outputs more power than the fixed-K method. Sacrificing SOC within a reasonable range to achieve better frequency regulation is highly worthwhile.
As illustrated in Figure 12b, during the BESS frequency regulation process, the fixed-K method exhibits poor adaptability, causing the SOC to continuously decline beyond the acceptable range. This demonstrates the superiority of adaptive output. In contrast, both the proposed control strategy and the adaptive VDC strategy effectively stabilize the SOC decline of the BESS. The SOC maintenance capability of the proposed control strategy is nearly identical to that of the adaptive VDC strategy, slightly outperforming it, and far surpassing the fixed-K method.
Based on the preceding analysis, it can be inferred that the proposed control strategy effectively maintains the grid frequency under step disturbances and ensures the SOC stability of both the SESS and the BESS.

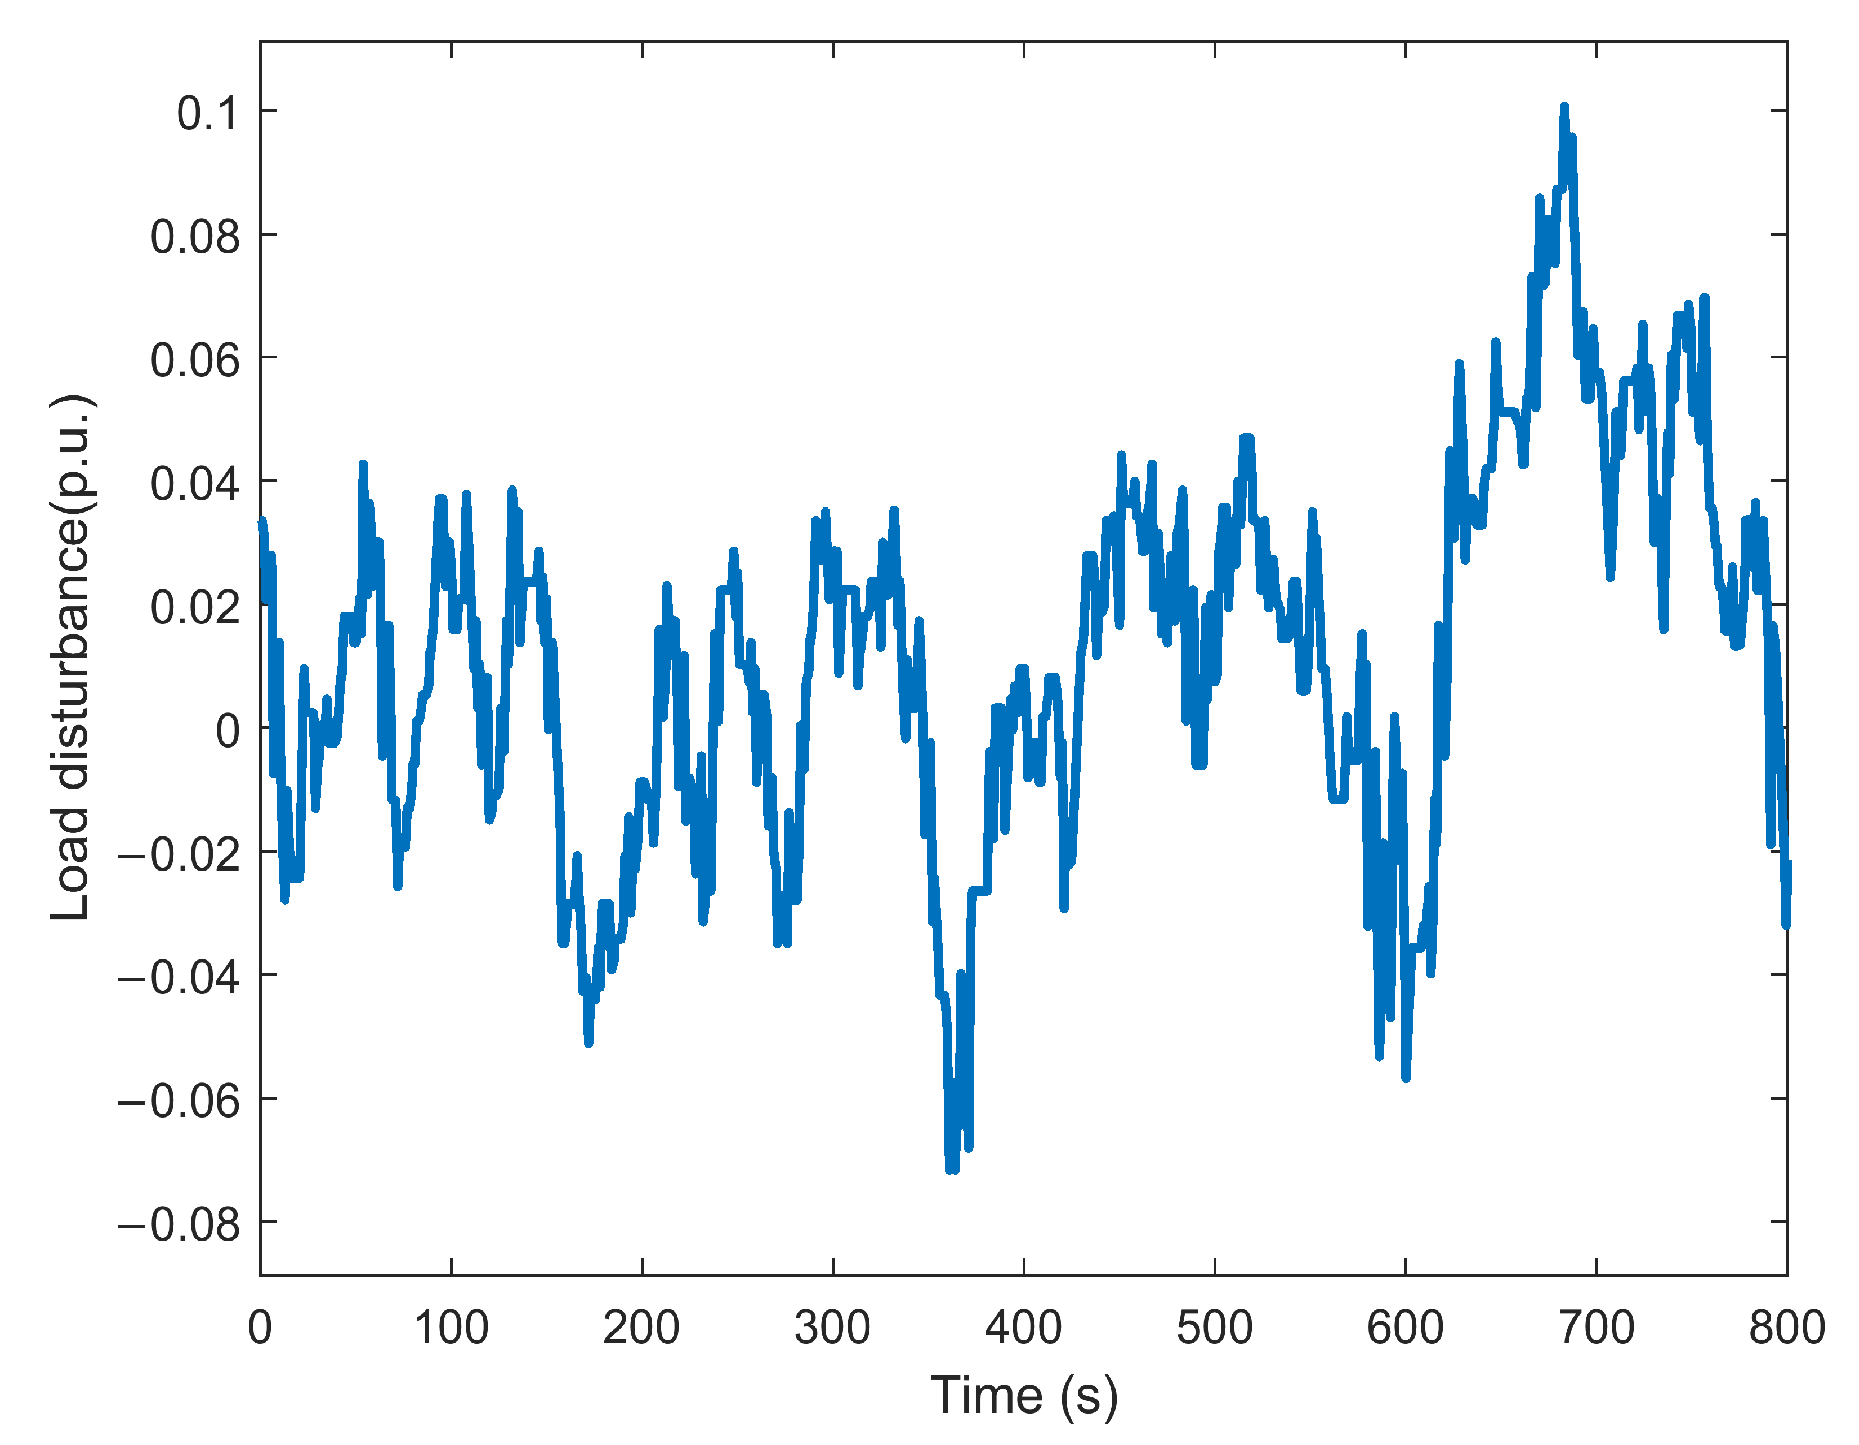
5.3. Simulation Analysis of Continuous Load Disturbance

To verify the PFR performance of the proposed control strategy under short-term continuous disturbance signals, a 25 s continuous disturbance signal, as shown in Figure 13, was introduced into the system. The corresponding FD is illustrated in Figure 14, while the SOC of the SESS and BESS are shown in Figure 15, and the corresponding performance metrics are listed in Table 3.
As shown in Figure 14 and Table 3, the proposed control strategy achieves the smallest frequency fluctuation, and the conclusion is supported by the lowest RMS value of the frequency. Compared to the other three control strategies, the RMS of FD decreased by 25.57%, 33.34%, and 45.62%, respectively. Meanwhile, Figure 15a and Table 3 reveal that the SOC maintenance ability of the SESS under the proposed strategy is slightly inferior to that of the fixed-K method and adaptive VDC method, but the difference in SOC’s RMS is minimal, and the maximum SOC fluctuation does not exceed 0.1, ensuring the SESS operates in a highly safe charge state. The SOC of the BESS remains consistently stable at 0.5, showing that the BESS does not need to be discharged under minor short-term disturbances. The BESS’s SOC RMS further confirms that the proposed strategy adequately safeguards the SOC of the BESS. This demonstrates that the priority output of SESS significantly reduces the losses of the BESS.
This result shows that under continuous load disturbances, the proposed control strategy exhibits superiority in both frequency regulation and maintaining the SOC of the ESS.

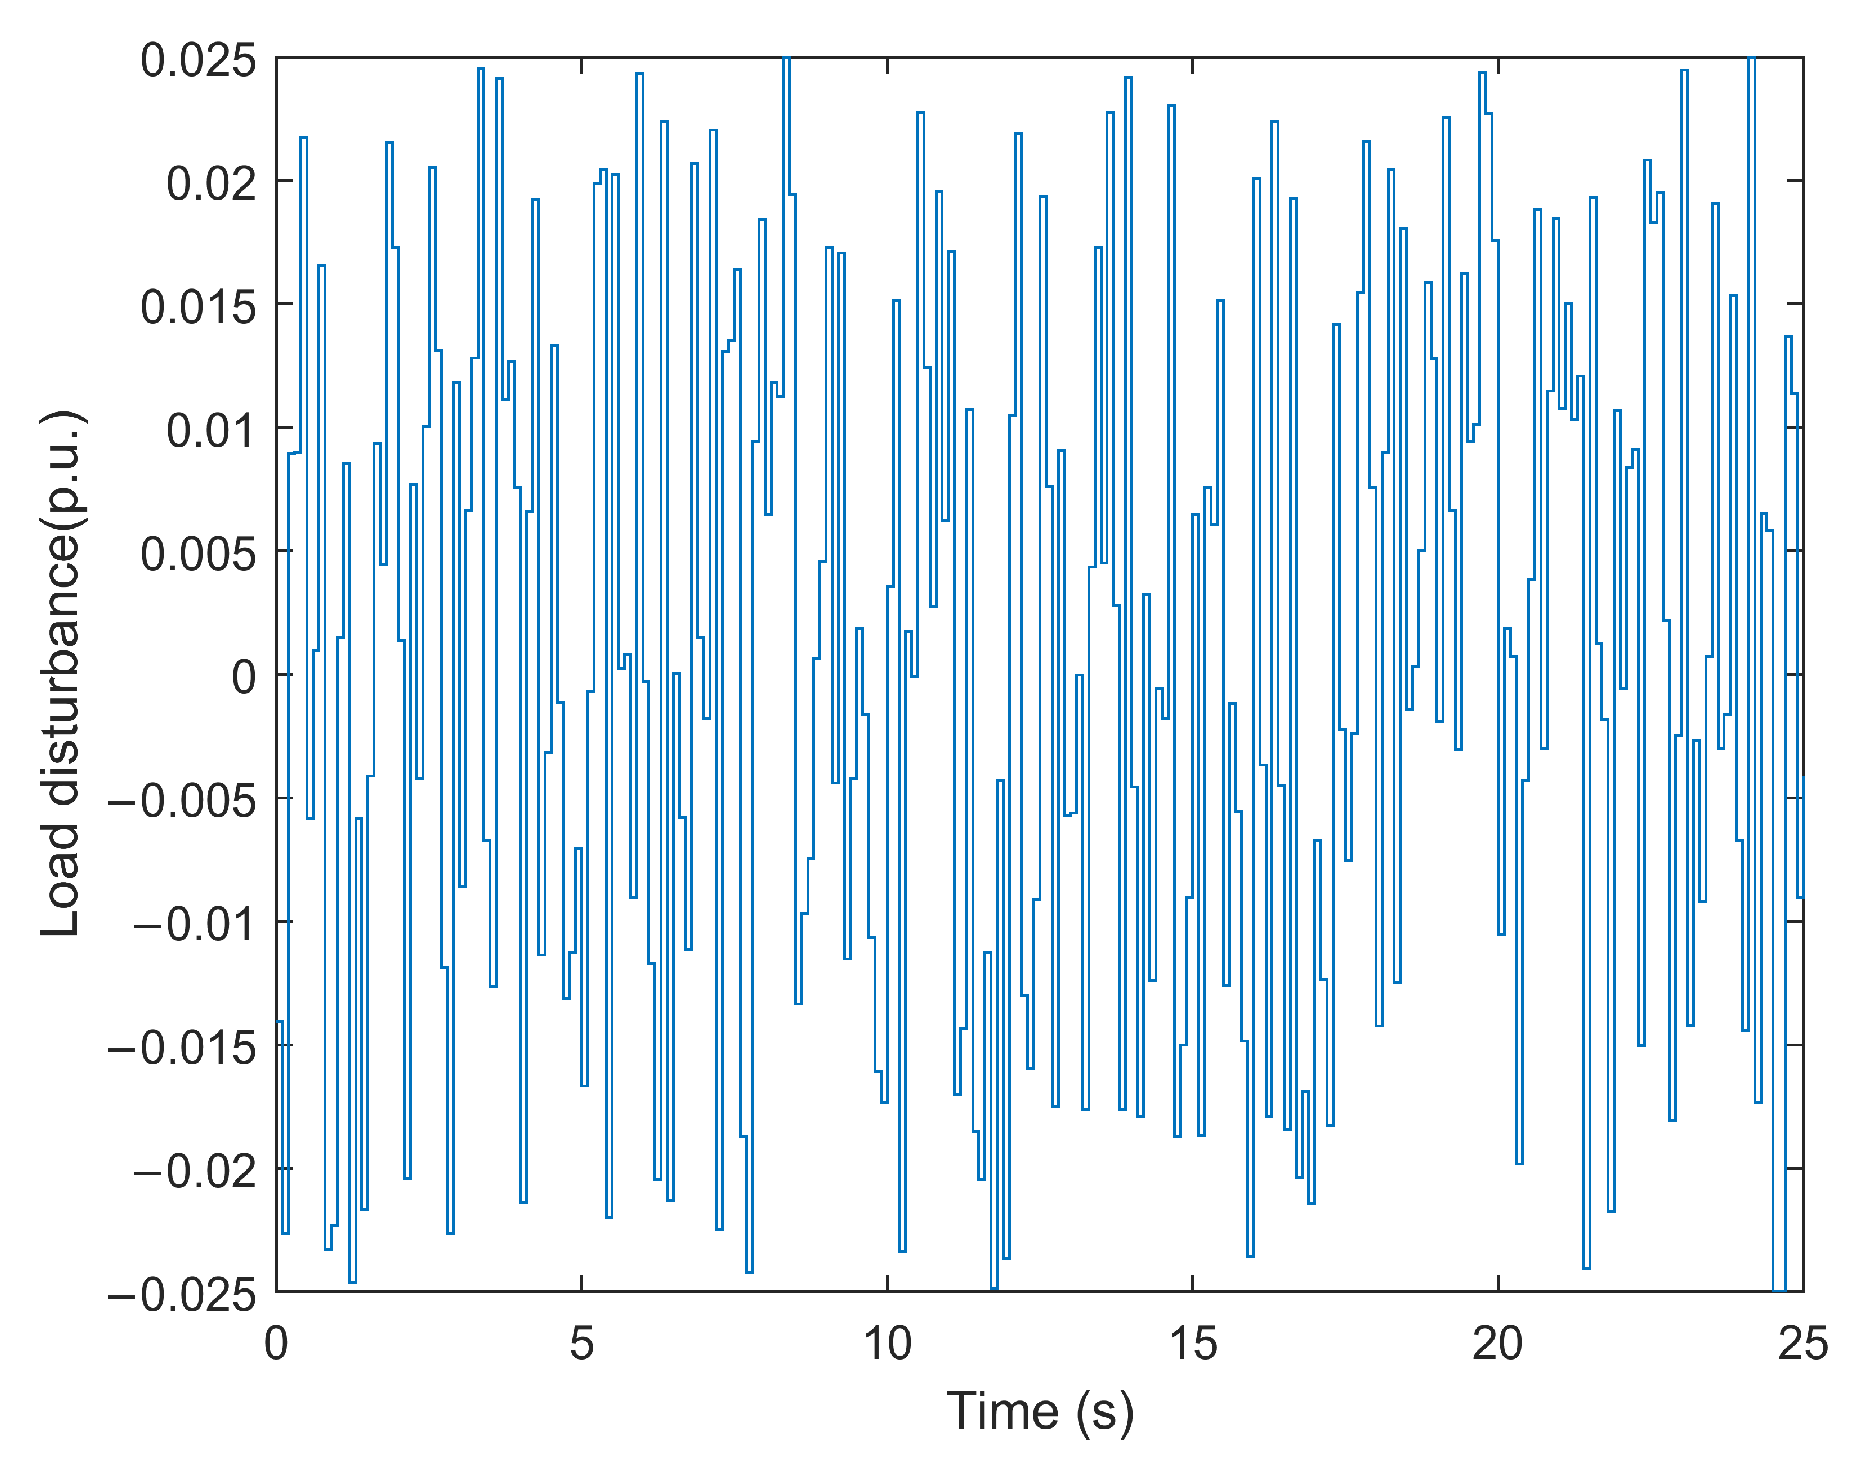
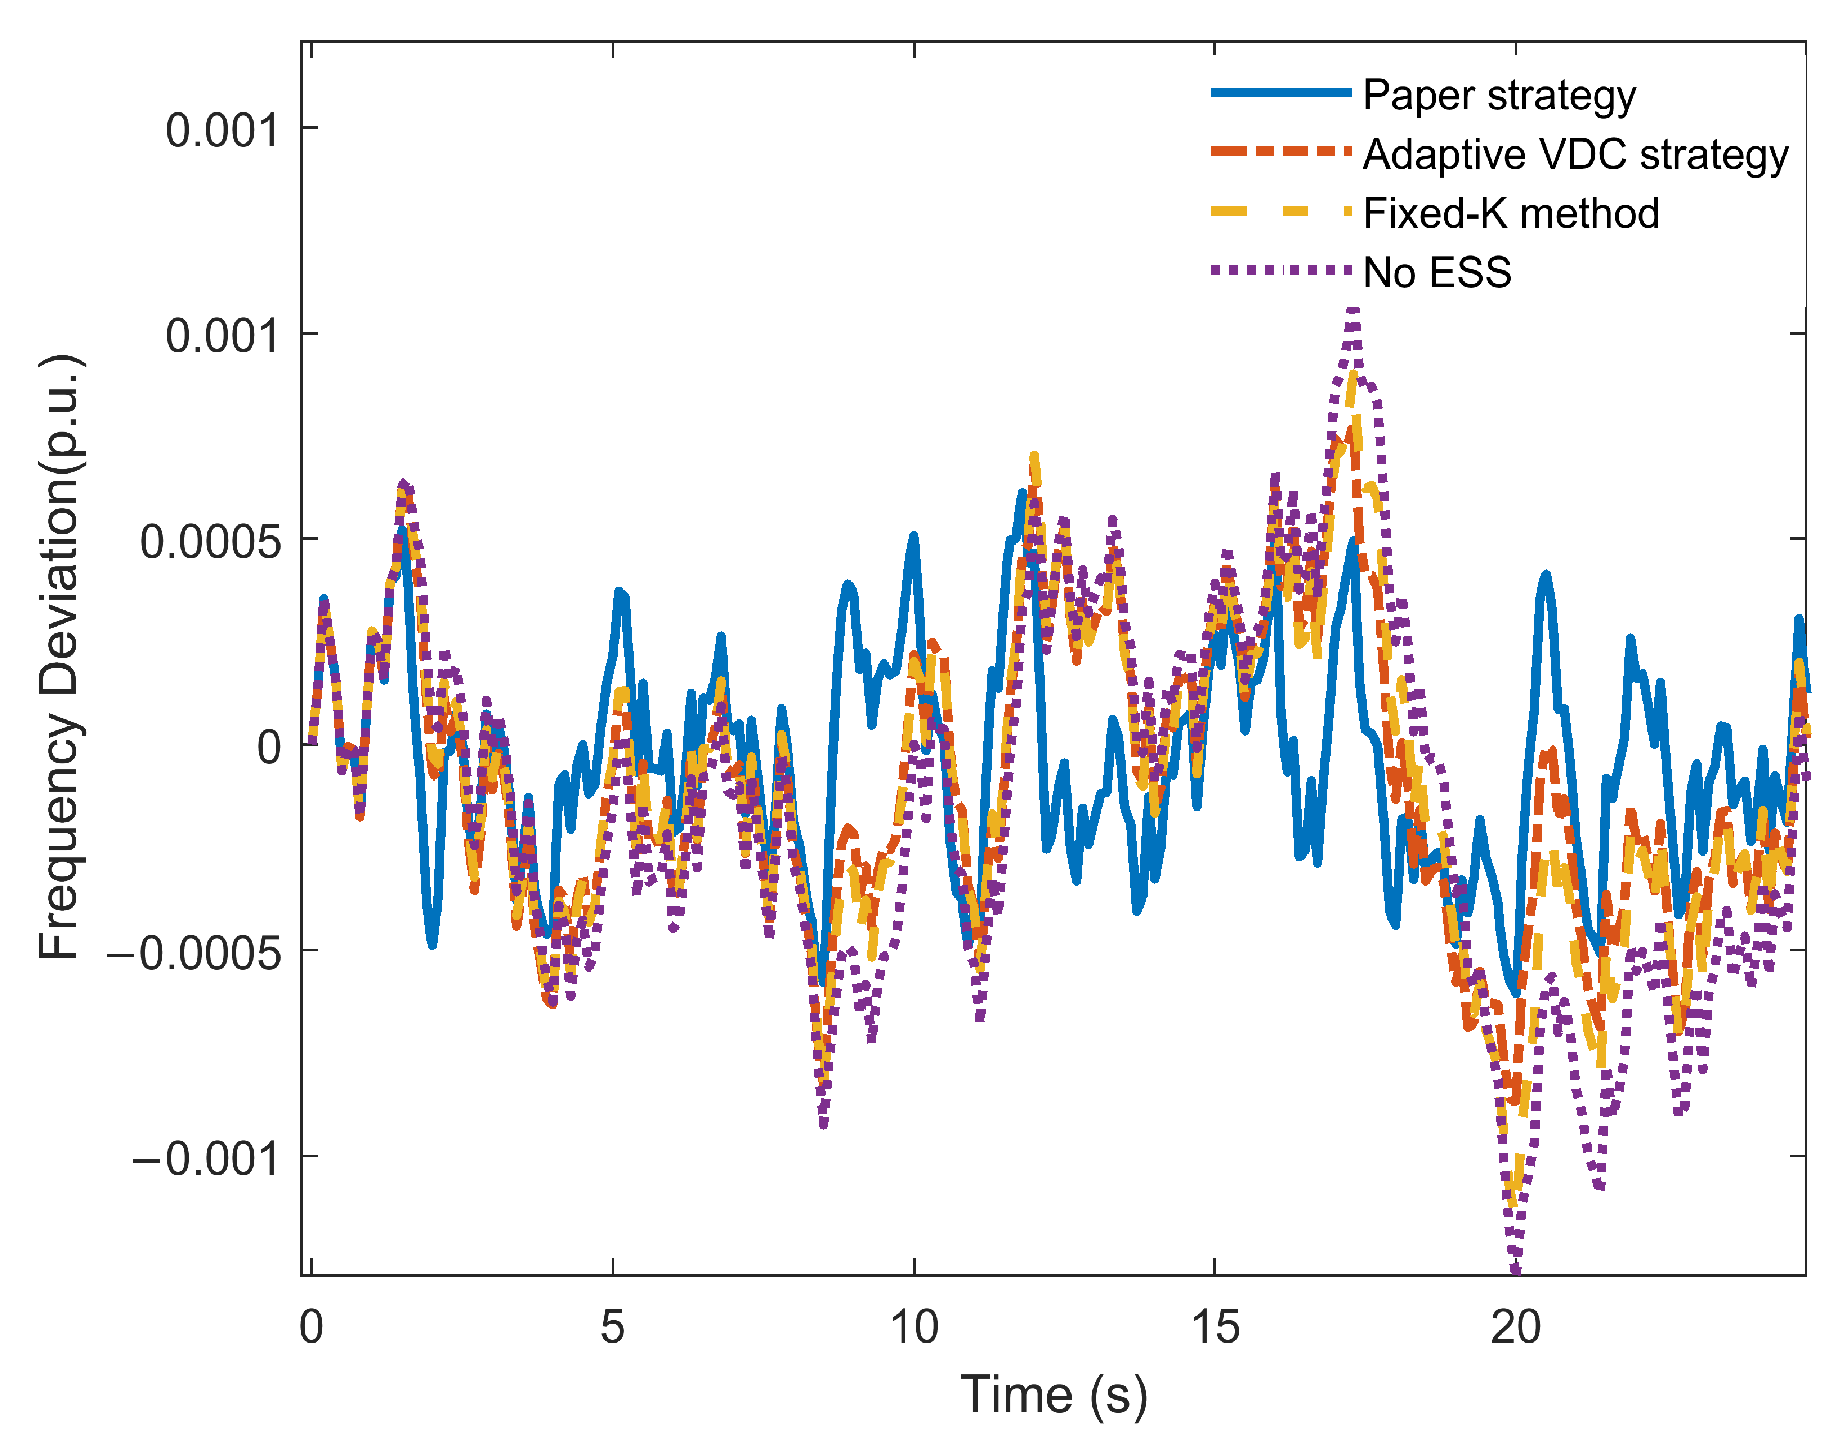
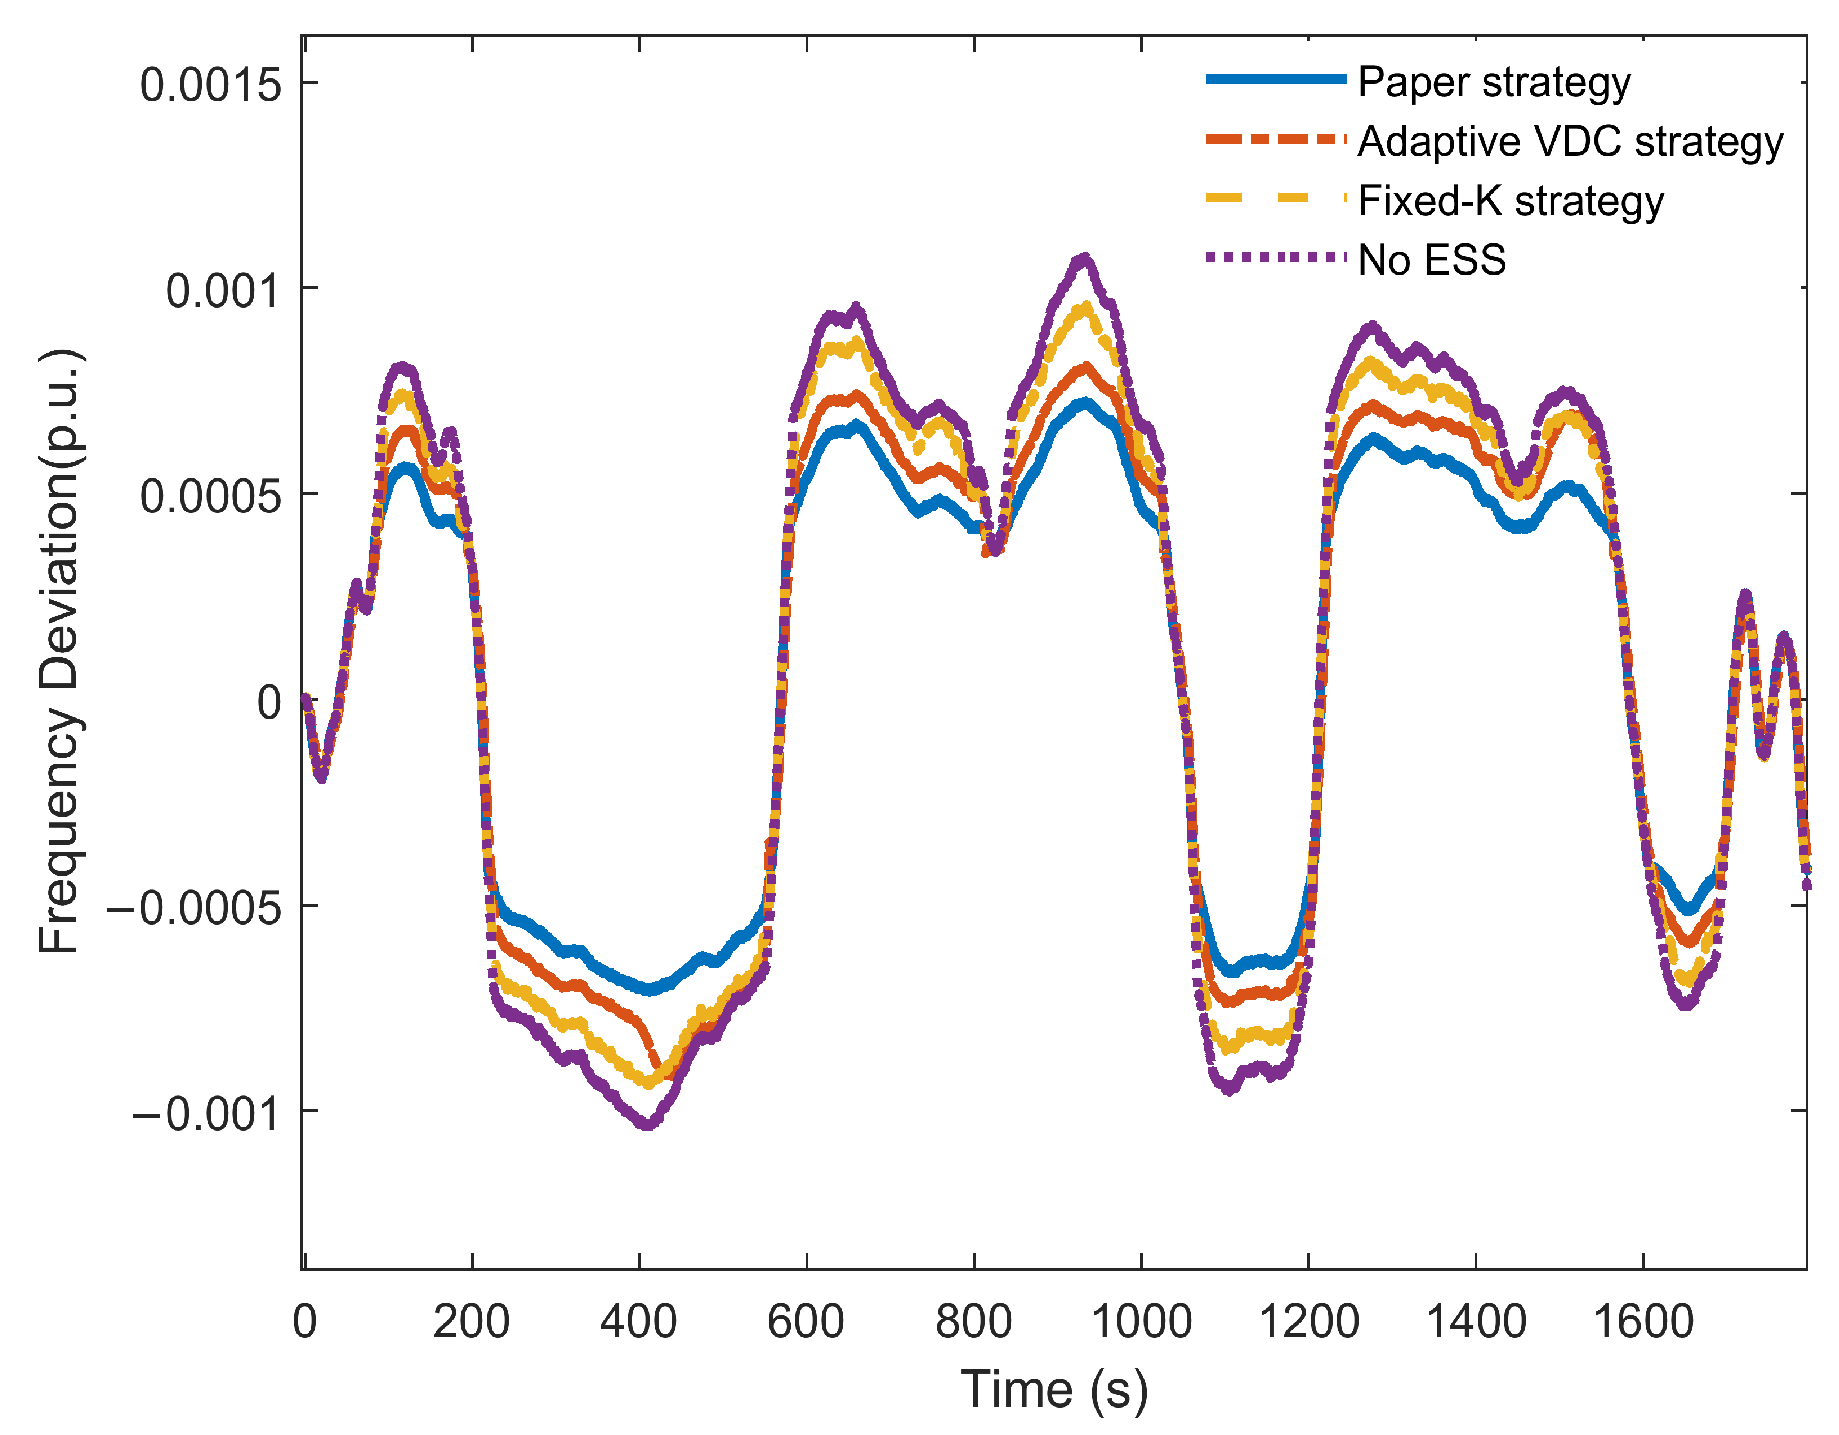
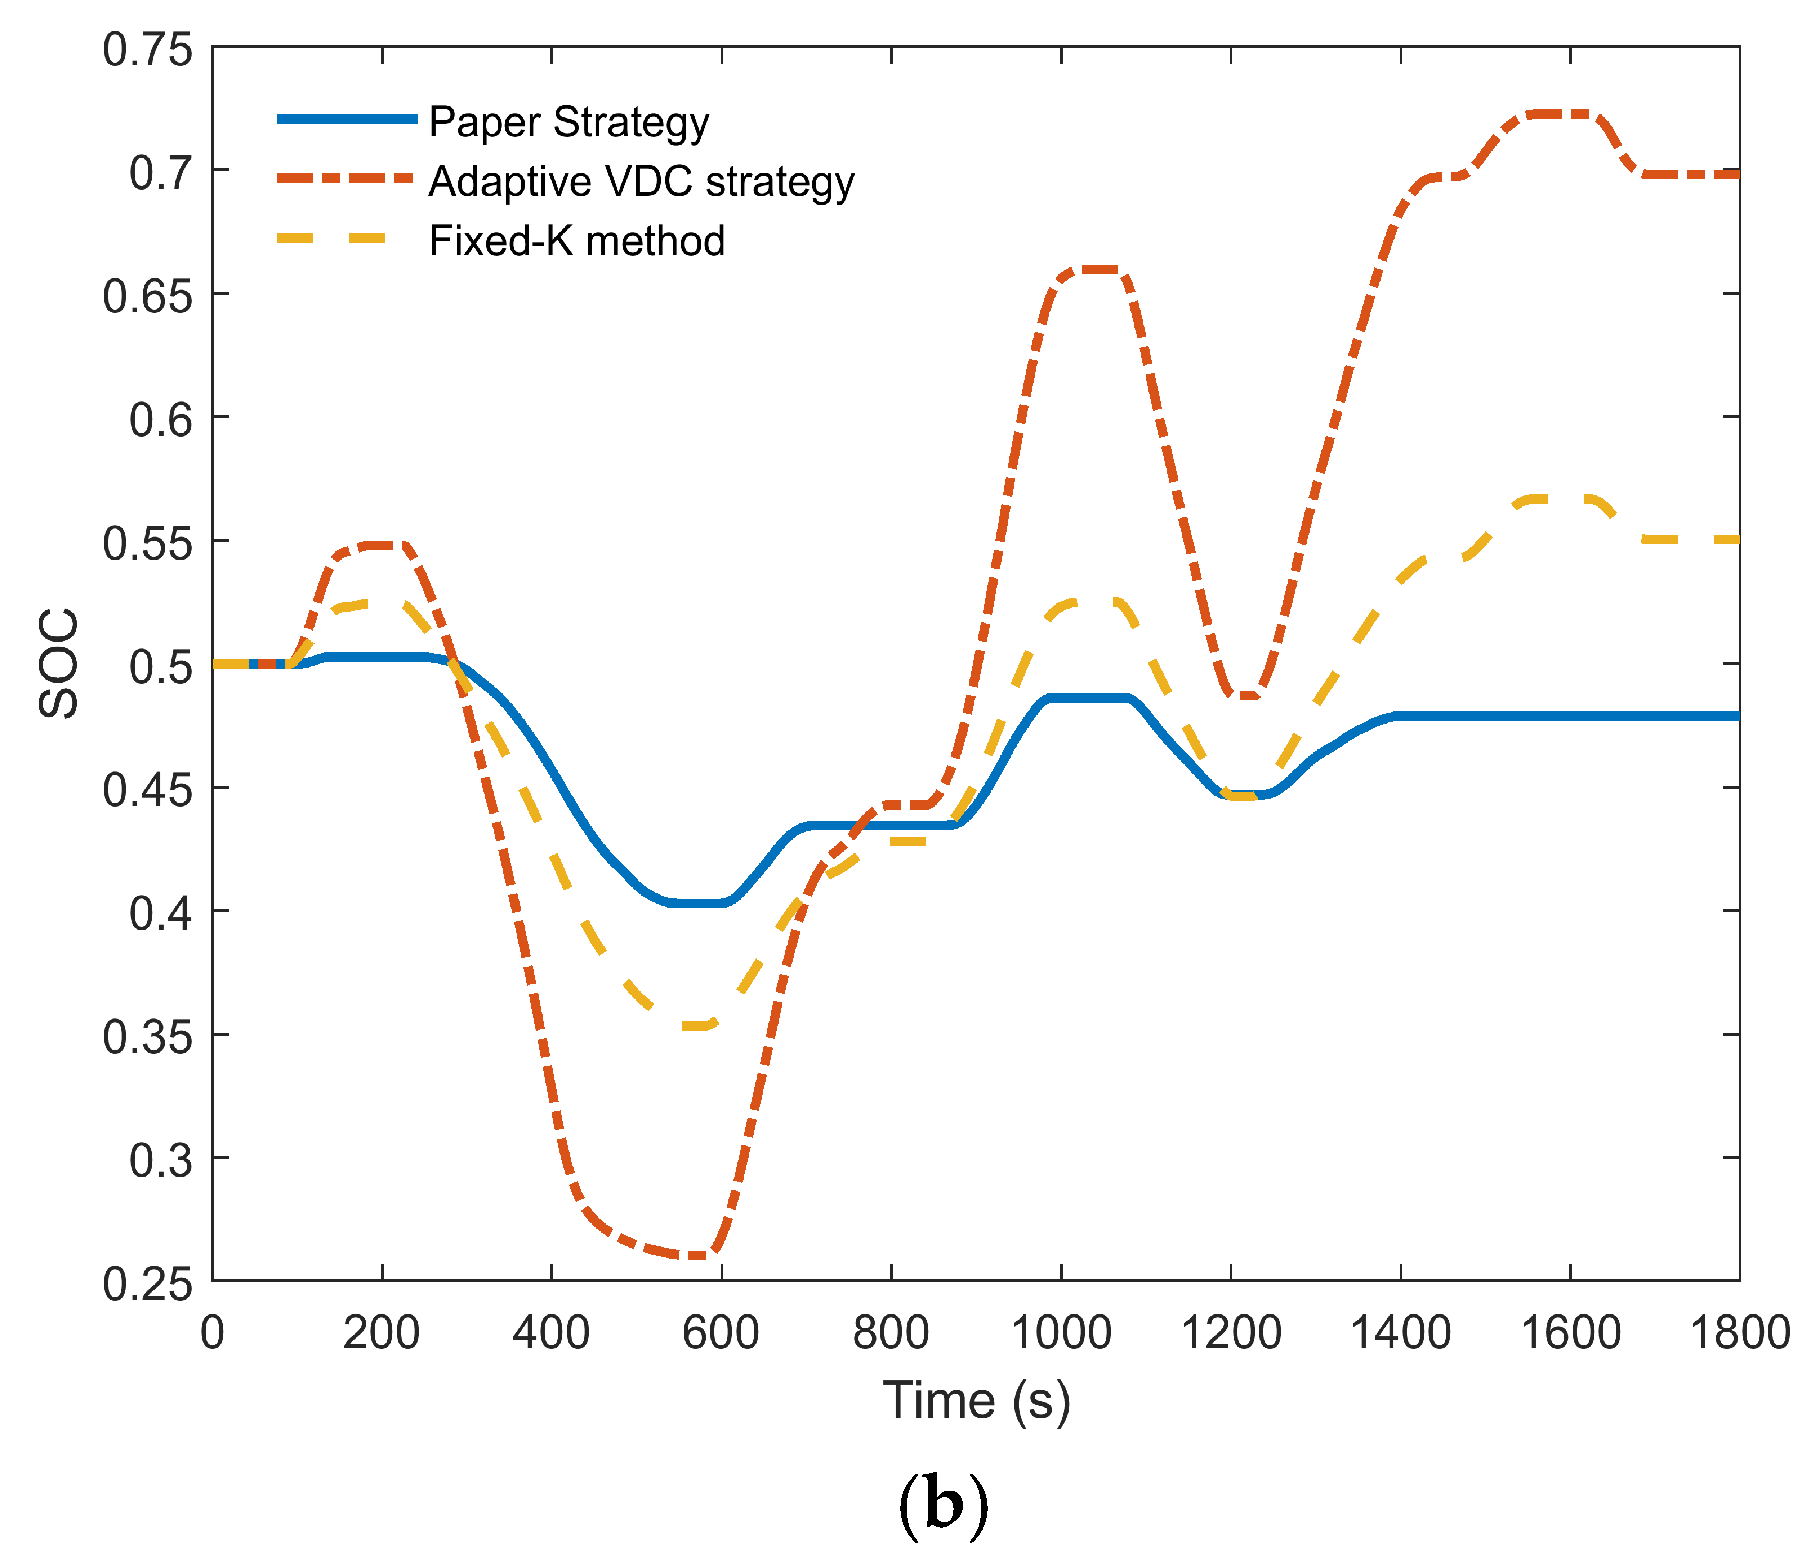
5.4. Simulation Analysis of Combined Disturbances

To further evaluate the PFR performance of the system under long-duration disturbance conditions and simulate a more realistic power grid environment, a semi-realistic composite disturbance signal based on historical datasets, as illustrated in Figure 16, was applied to the system. The FD curve and the SOC of the ESSs are illustrated in Figure 17 and Figure 18, respectively. The corresponding performance metrics are shown in Table 4.
As shown in Figure 17, the system without ESS experiences the most severe frequency fluctuations. As shown in Table 4, compared to the other three control strategies, the RMS of FD decreased by 15.39%, 21.89%, and 40.34%, respectively. This indicates that this control strategy effectively stabilizes frequency fluctuations during daily grid operations and offers strong engineering applicability.
As illustrated in Figure 18a, the proposed control strategy is less effective in maintaining the SOC of the SESS compared to the other two systems. However, the SOC fluctuations remain within the safe range, so the disadvantage is not significant. As shown in Figure 18b and Table 4, the SOC of the BESS exhibits minimal fluctuations under the combined disturbances. Compared to the other two strategies, the RMS of BESS’s SOC decreased by 68.61% and 29.75%, respectively. This is attributed to the narrow dead zone of the SESS, which enables it to respond promptly and suppress most frequency fluctuations within the BESS’s dead zone. Therefore, under this strategy, the SESS can independently respond to continuous small-scale disturbances most of the time, significantly reducing the frequency of BESS discharge. This enhances the lifespan of the BESS while leveraging the long cycle life of the SESS.
Combined frequency disturbances more closely resemble real-world grid conditions, and simulation results show that the proposed control strategy better maintains grid frequency while effectively preserving the SOC of the SESS and extending the life of the BESS.

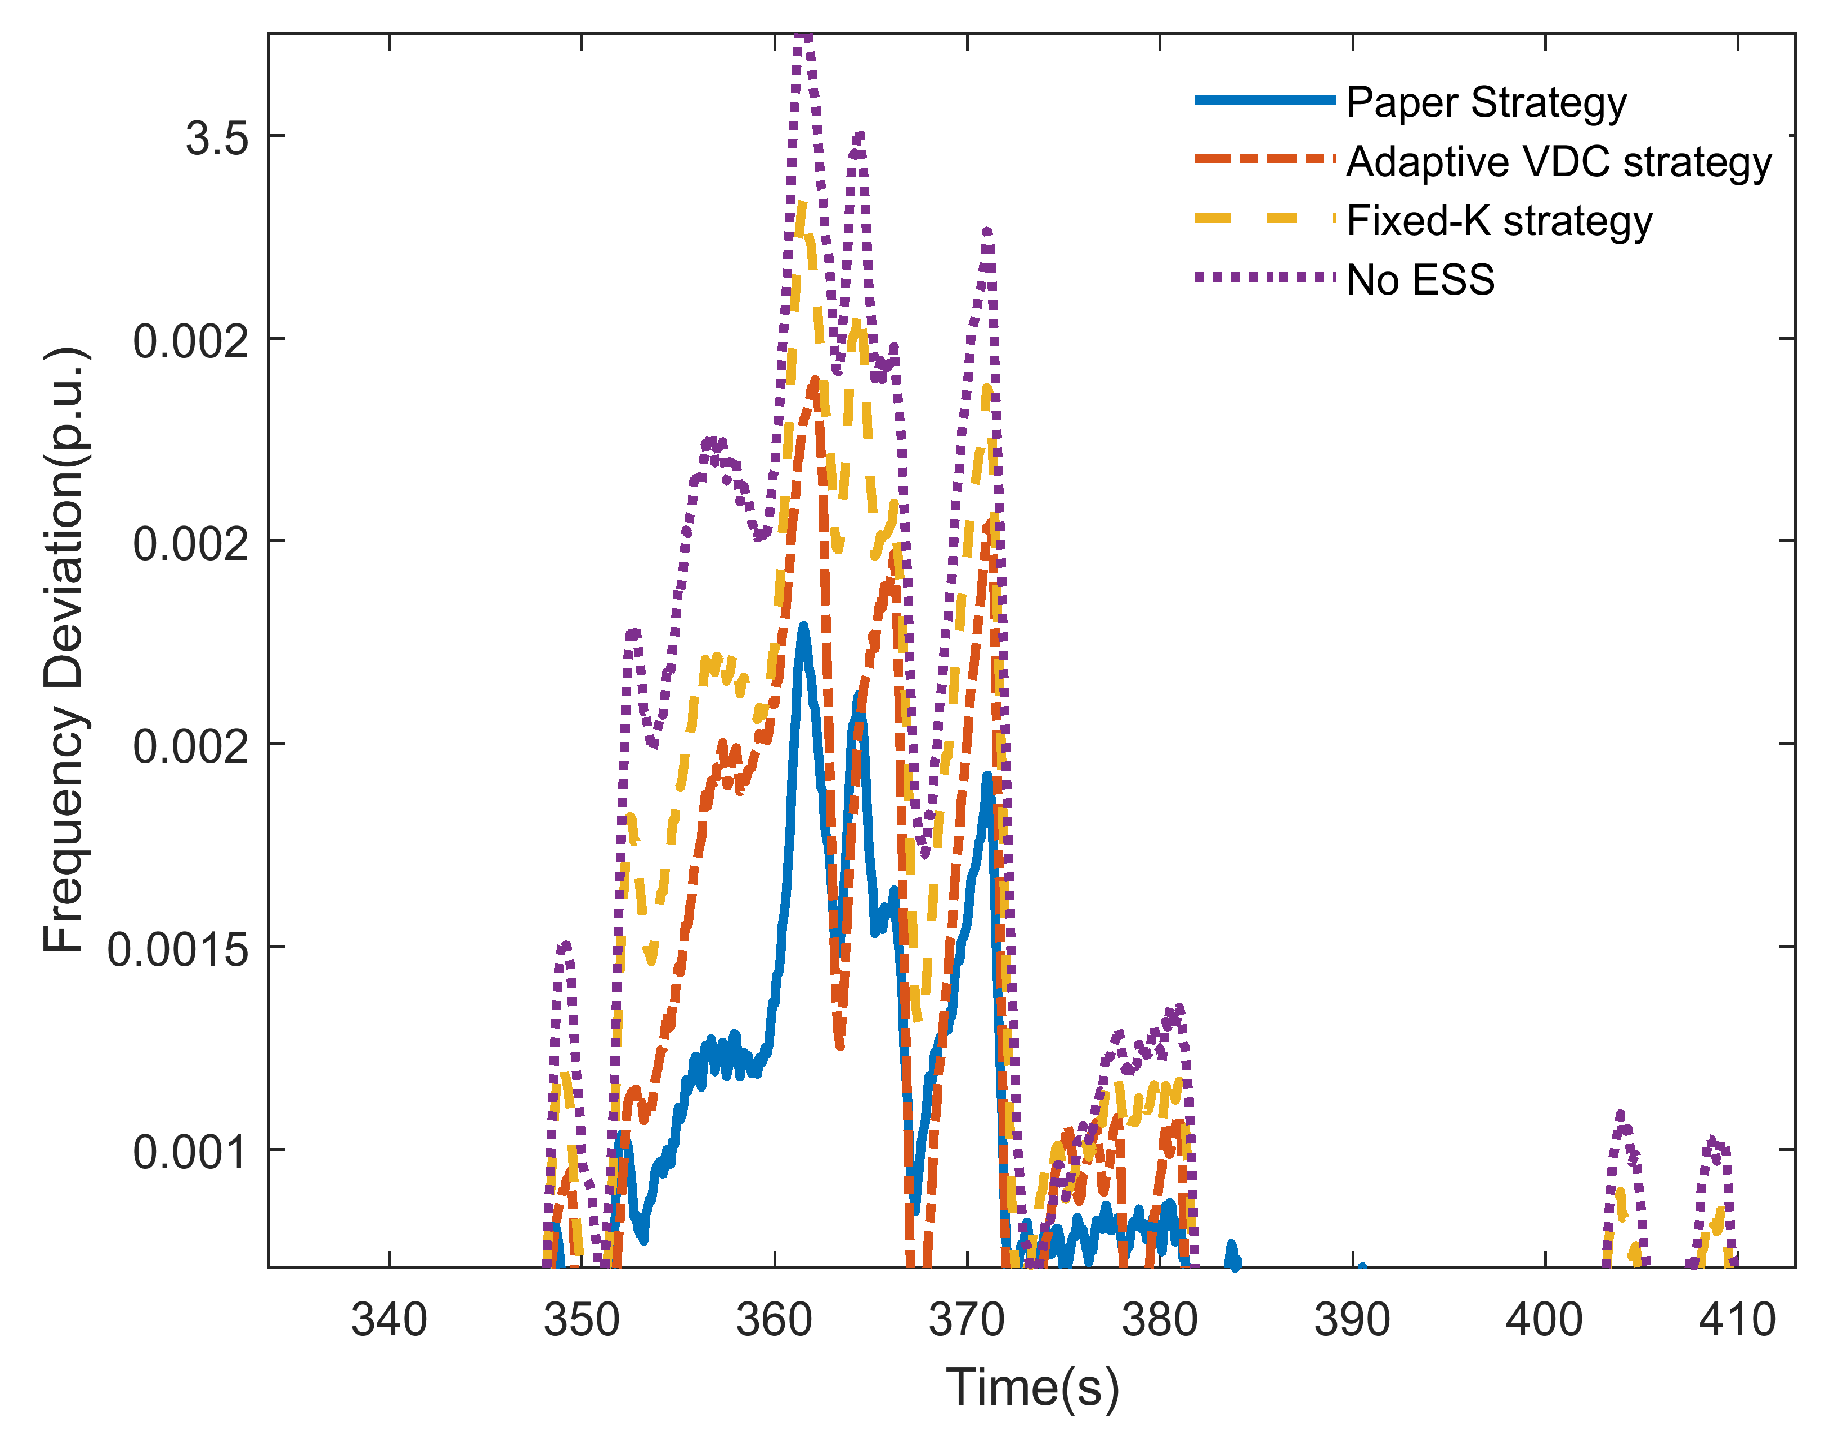
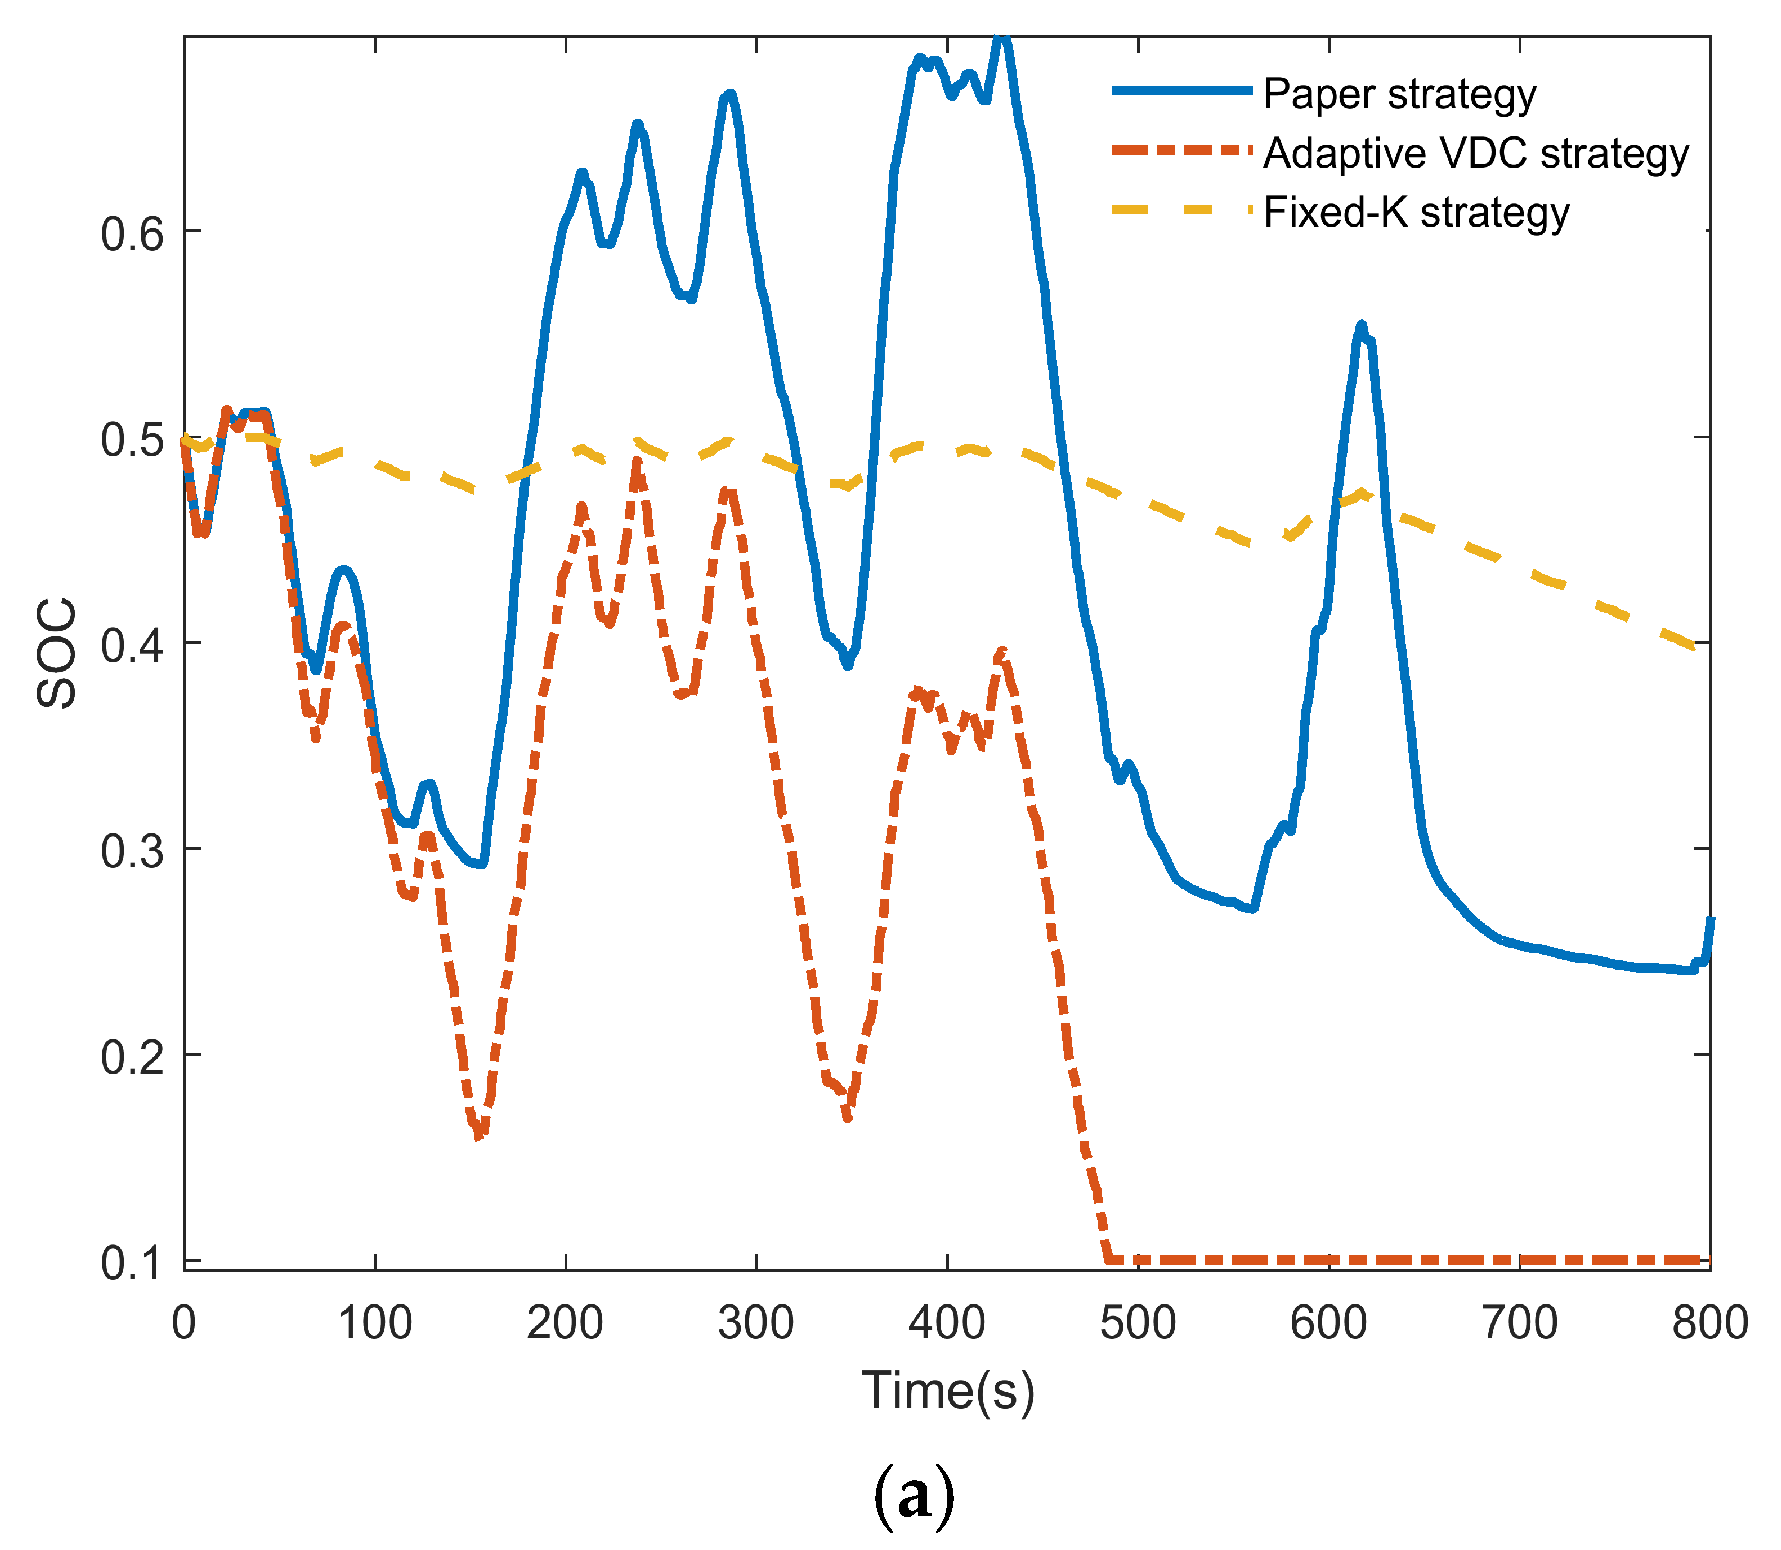
5.5. Simulation Analysis of Commercial Load Disturbance

To further evaluate the system’s PFR performance under commercial loads with random characteristics, a random disturbance of ±0.005 p.u. is added to the real load shown in Figure 9, simulating a more variable commercial load. The FD curve and the SOC of the ESSs are illustrated in Figure 19 and Figure 20, respectively. The corresponding performance metrics are shown in Table 5.
Due to the intense random fluctuations in commercial loads, the complete FD graph can not intuitively show the advantages and disadvantages of the four control strategies in terms of PFR. However, by observing the localized zoom of the FD in Figure 19 along with the RMS value of FD in Table 5, it is clear that the proposed control strategy achieves the best PFR performance under commercial loads. Compared to the other three control strategies, the RMS of FD decreased by 7.69%, 20%, and 33.33%, respectively. As shown in Figure 20a,b and Table 5, similar to the composite disturbance case, under commercial loads, the proposed control strategy’s SESS lacks an advantage in maintaining SOC but can effectively maintain the SOC of the BESS. Compared to the other two strategies, the RMS of BESS’s SOC decreased by 21.36% and 23.65%, respectively.
The performance of the FD and the SOC of the ESS demonstrates the applicability of the proposed control strategy under the random characteristics of commercial load.

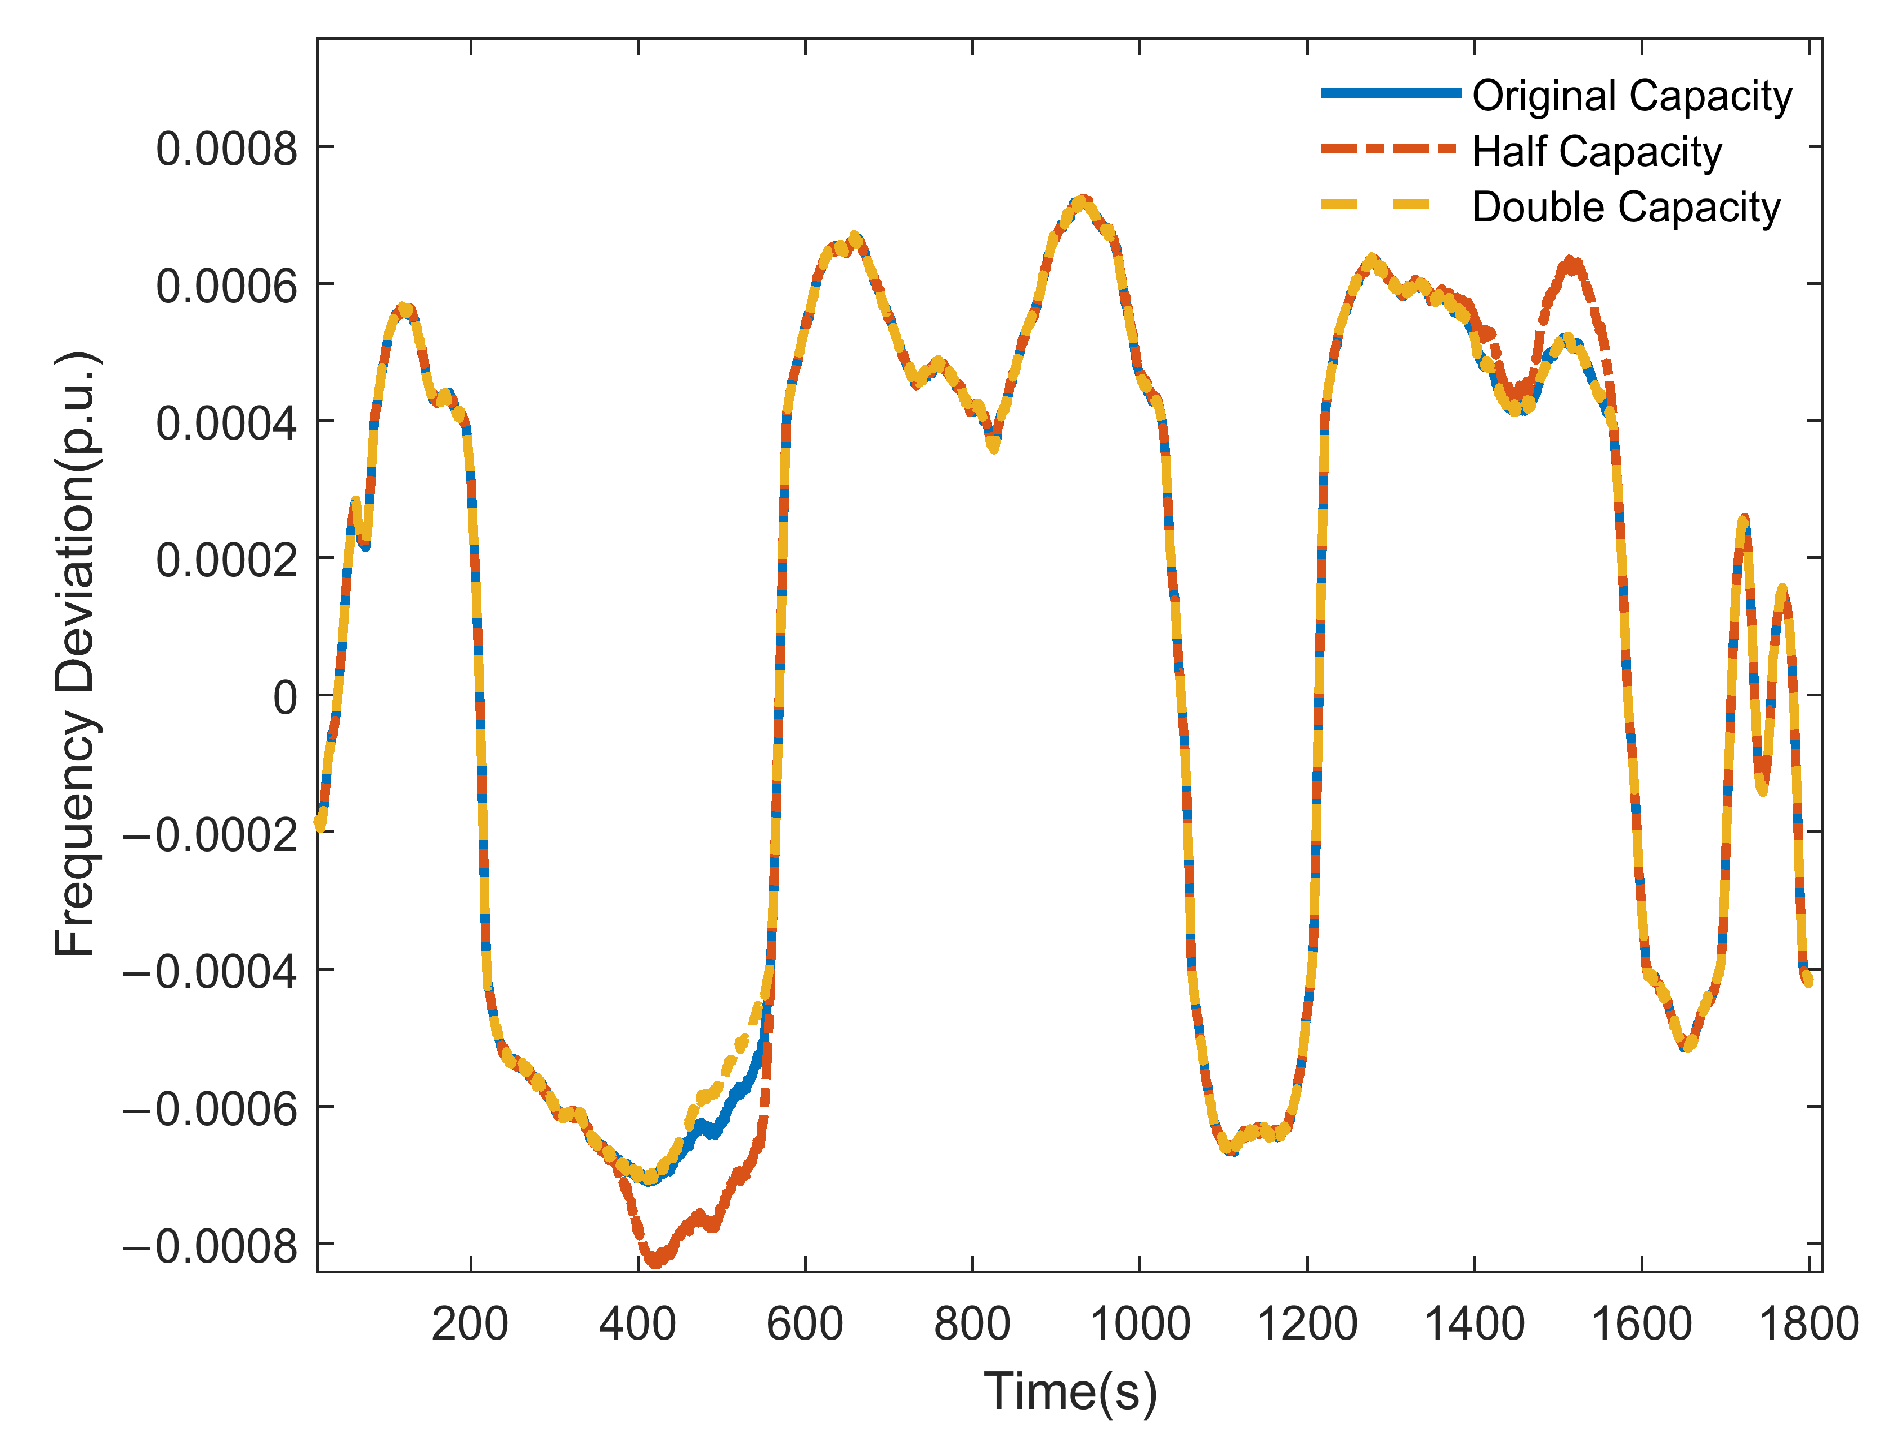
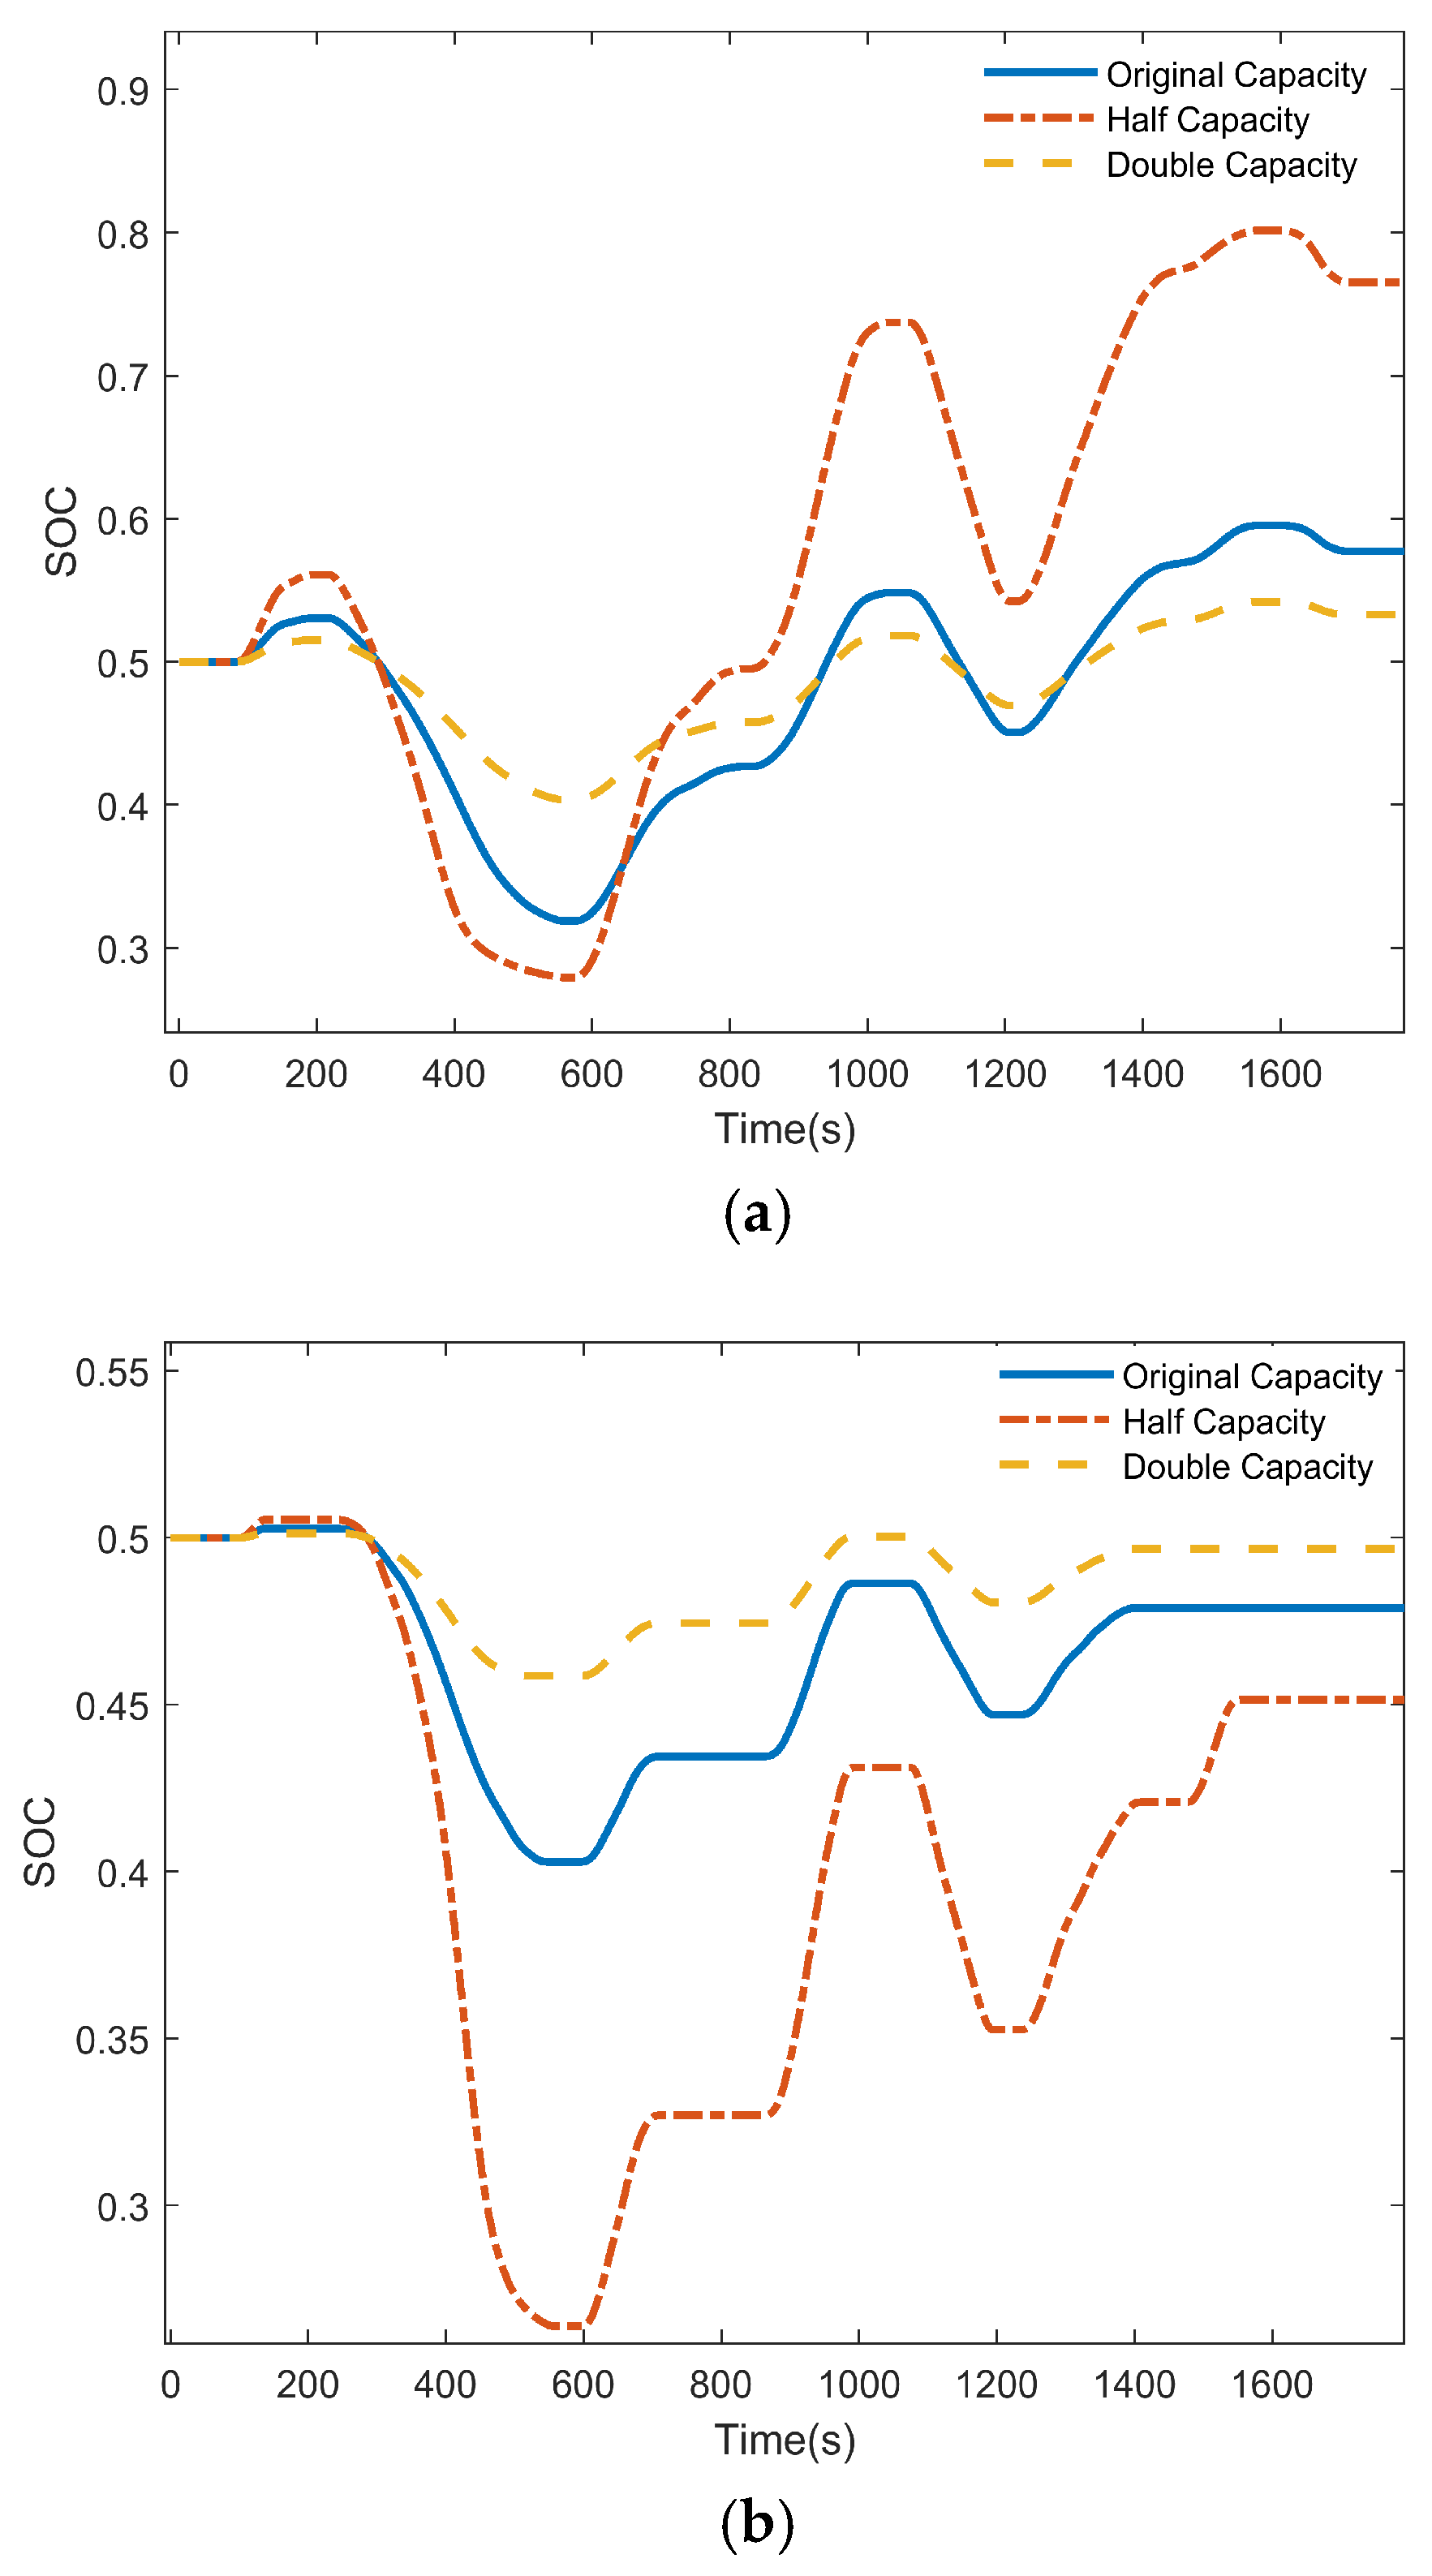
5.6. Simulation Analysis of Different Capacity Configurations

To further demonstrate the scalability and adaptability of the proposed control strategy, the 1800 s combined disturbance load shown in Figure 16 was applied to models with three different capacity configurations: the original capacity (“Origin Capacity”), half of the original capacity (“Half Capacity”), and twice the original capacity (“Double Capacity”). The FD curve and the SOC of the ESSs are illustrated in Figure 21 and Figure 22, respectively.
As shown in Figure 21, the proposed control strategy can effectively mitigate FD under different capacity configurations. As shown in Figure 22a,b, both the SESS and BESS are able to maintain the SOC within a reasonable range under different capacity configurations. The capacity configuration adopted by the proposed control strategy results in relatively low HESS energy consumption while achieving good frequency regulation performance and avoiding high initial investment costs, demonstrating its rationality.

5.7. Economic Analysis

The composite disturbance illustrated in Figure 15 is introduced into the systems with HESS and BESS-only primary frequency regulation, respectively. The rain flow counting method is used to calculate the number of cycles at various depths of charge and discharge, which are then converted to equivalent full cycles at a depth-of-discharge (DoD) of 1. The actual lifespan of the ESS is then estimated based on its cycle life.
In this simulation case, the BESS-alone PFR leads to 0.7254 equivalent cycles within 1800 s, yielding a BESS lifespan of about 143.61 days. After integrating the SESS, the BESS output is reduced, and the equivalent number of cycles over 1800 s drops to 0.5033, extending the BESS lifespan to 206.96 days. This significantly reduces the operating and maintenance costs of the BESS.
The effectiveness of SESS in mitigating BESS capacity degradation can be qualitatively inferred from Equation (30),
Q loss = B exp 31700 + 370.3 × C rate R T ( N cycle × D o D × 2 × C rate ) 0.55 ,
where Qloss represents the percentage of capacity loss, Ncycle is the equivalent full cycle count, DoD is the depth of discharge, Crate is the rated capacity, and B, R, and T are the pre-exponential factor, gas constant, and absolute temperature, respectively.
Compared with BESS-only frequency regulation, the HESS reduces both the equivalent cycle count and DoD, thereby slowing capacity degradation and extending service life.
To verify the economic efficiency and engineering practicality of the proposed control strategy, the net present benefit PNET was calculated for both the proposed strategy and the strategy where only the BESS participates in PFR. The economic parameters for the SESS and BESS are adopted from reference [59]. The calculation results are shown in Table 6.
As clearly illustrated in Table 6, the economic benefit of HESS participating in PFR is 3.212 times that of using only BESS.
The point at which the PNET becomes zero corresponds to when the benefits outweigh the costs, which defines the economic lifetime [60]. The calculated economic lifetime is 1.4776 years for the HESS and 4.7137 years for the BESS-only system. The proposed strategy shortens the economic lifetime by approximately 3.23 years, significantly enhancing the economic viability of ESS-based frequency regulation.

5.8. Discussion on Simulation Verification

The above analysis, based on simulation experiments under various operating conditions and capacities, as well as economic evaluation, demonstrates the effectiveness and economic benefits of the proposed coordinated control strategy for PFR.
It is important to eliminate potential errors that may affect the reliability of the simulation conclusions. The four simulated strategies in this paper employ a simplified equivalent ESS model, where the ESS behavior is represented by the product of a first-order inertia element and a control gain, without considering other device parameters [61]. This simplification introduces deviations between the simulation outcomes and actual system performance. Reference [62] has demonstrated that neglecting internal battery characteristics and using a simplified equivalent model can enhance simulation efficiency while maintaining adequate accuracy. Since all four strategies adopt the same storage model configuration, the impact of model precision on the simulation results is ruled out.
Practical implementation of this control strategy should consider real-world factors such as technical limitations, sensor requirements, and controller response times.
Firstly, the design of BESS output in this paper assumes a constant rated power throughout its operation. Reference [63] points out that lithium-ion batteries experience degradation during repeated cycling, primarily in the form of capacity loss and increased internal resistance, which results in reduced power output and weakened frequency regulation performance over time. Therefore, in practical applications, frequency regulation commands should accommodate the gradual performance degradation of batteries.
Secondly, accurate measurement of system frequency and its rate of change is fundamental for both VIC and VDC. Accurate frequency tracking requires high-precision frequency sensors. In addition, applying anti-aliasing or moving average filtering prior to sampling facilitates the delivery of accurate frequency regulation signals to the HESS [64].
Moreover, controller response time may be constrained by computational load and communication delays in real systems. Therefore, optimizing the control algorithm and improving controller performance is essential to reduce response time and enhance dynamic performance [65].

6. Conclusions

This paper proposes an HESS adaptive PFR control strategy that incorporates the frequency regulation dead zone of ESS. The conclusions are outlined as follows:
(1)
The proposed control combines the advantages of VDC and VIC with the distinct characteristics of power-type and energy-type storage systems. The high-power SESS is designed to respond to inertial control signals, while the high-capacity BESS responds to VDC signals. Compared to the conventional strategy, the proposed control strategy reduces the frequency drop rate by 17.43% under step disturbance. Under compound disturbances, the RMS of frequency deviation decreases by 13.34% and the RMS of BESS’s SOC decreases by 68.61%. The economic benefit of this strategy is 3.212 times that of the single-energy-storage scheme. This approach maximizes the advantages of different ESSs, exhibits superior performance in PFR and economic benefits, strengthens frequency stability of the, power grid, supports greater integration of renewable energy sources, and contributes to reducing fossil fuel dependence and carbon emissions.
(2)
The strategy effectively protects the lifespan of ESSs, reduces the start/stop frequency of the TPU, and reduces the costs associated with BESS replacement, disposal of retired BESS, and TPU maintenance. By appropriately setting dead zones, the SESS is prioritized for output following the BESS, with the TPU acting as a last resort. This approach leverages the long cycle life of SESS, avoiding excessive BESS charge–discharge cycles and start/stop frequency of TPU. Additionally, to prevent over-charging and over-discharging, which could irreversibly damage the storage system, the output coefficient of ESS is adaptively controlled according to the SOC. Compared with the fixed-K method, the proposed strategy better maintains the SOC of ESSs.
(3)
The proposed control strategy better adapts to the impact of different loads. The inertia coefficient and the dead zone of the ESS are flexibly adjusted according to the load type, enhancing adaptability to various operating conditions.
(4)
The proposed control strategy fully utilizes SOC recovery within the dead zone for the BESS. During the SOC recovery phase of the BESS, it introduces a recovery demand coefficient determined by the SOC and a recovery constraint coefficient determined by the FD. These coefficients are used to establish an SOC recovery coefficient within the frequency dead zone, ensuring effective SOC recovery while preventing secondary frequency drops. Simulations demonstrate no occurrence of secondary frequency drops, and the SOC remains in good condition.
Nonetheless, this study still has some limitations. For instance, the power and capacity of the energy storage system are configured based on empirical values, lacking a more reasonable optimization scheme to achieve the best economic performance.
At the same time, in low-inertia grids or grids with a high proportion of uncontrollable renewable energy, the frequency and depth of frequency regulation tasks for the ESS will significantly increase. This accelerates the degradation of the ESS’s capacity, further restricting its long-term frequency regulation performance. If the capacity configuration of the ESS cannot meet such high-intensity frequency regulation demands, the HESS may fail to provide stable and continuous frequency regulation services under frequent fluctuations in renewable energy, which could impact the overall frequency stability of the grid. Therefore, under low inertia or high renewable energy penetration conditions, the limitation of this strategy lies in the need for higher capacity configuration.
In addition, the BESS in this paper is treated as an integrated unit during the design phase. In practice, however, numerous battery cells must be grouped together for frequency regulation. Inconsistent output among the cells during operation may lead to premature aging of certain cells, shortening the overall lifespan of the BESS, causing capacity degradation, and even posing safety risks.
Additionally, this study establishes a simplified active power–frequency control model for HESS participating in PFR, based on the concepts of area equivalence and the flat-voltage assumption. This model omits inverter voltage loops and reactive power dynamics to highlight the active power–frequency coupling and reduce simulation complexity. As a future extension, we plan to embed Q–V droop control and virtual synchronous generator (VSG) techniques into a detailed inverter-level model. Simulations under transient load switching and three-phase fault scenarios will be conducted to quantitatively assess the impact of the proposed strategy on bus voltage sag, recovery time, and reactive power injection, thereby systematically validating the role of HESS in enhancing voltage stability and reactive power support.

Author Contributions

H.J. conceptualized the research and wrote the initial draft. K.H. supervised the study and participated in data organization. Y.L. acquired the funding. Y.L. and W.B. participated in reviewing and editing the manuscript. All authors have read and agreed to the published version of the manuscript.

Funding

This research was funded by the Postdoctoral Fellowship Program of CPSF, grant number GZC20240909.

Data Availability Statement

The original contributions presented in this study are included in the article. Further inquiries can be directed to the corresponding authors.

Conflicts of Interest

The authors declare no conflicts of interest. Although Y.L. secured funding and participated in reviewing and editing the manuscript, the funders had no role in the design of the study; in the collection, analyses, or interpretation of data; in the writing of the manuscript; or in the decision to publish the results.

Abbreviations

The following abbreviations are used in this manuscript:
HESShybrid energy storage system
SOCstate of charge
TPUsthermal power units
ESSsenergy storage systems
PFRprimary frequency regulation
FDfrequency deviation
VDCvirtual droop control
VICvirtual inertia control
BESSsbattery energy storage systems
VNICvirtual negative inertia control
SESSsupercapacitor energy storage system
RMSroot mean square
DoDdepth-of-discharge

References

  1. Yan, G.G.; Li, D.Y.; Liu, J.H.; Mao, G. A Cost Accounting Method of the Li-ion Battery Energy Storage System for Frequency Regulation Considering the Effect of Life Degradation. Prot. Control Mod. Power Syst. 2018, 3, 1–9. [Google Scholar] [CrossRef]
  2. Ma, Y.X.; Hu, Z.C.; Song, Y.H. Hour-Ahead Optimization Strategy for Shared Energy Storage of Renewable Energy Power Stations to Provide Frequency Regulation Service. IEEE Trans. Sustain. Energy 2022, 13, 2331–2342. [Google Scholar] [CrossRef]
  3. Dang, J.; Seuss, J.; Suneja, L.; Harley, R.G. SoC Feedback Control for Wind and ESS Hybrid Power System Frequency Regulation. IEEE J. Emerg. Sel. Top. Power Electron. 2014, 2, 79–86. [Google Scholar] [CrossRef]
  4. Li, P.Q.; Tan, Z.X.; Zhou, Y.J.; Li, C.B.; Li, R.; Qi, X.Z. Secondary Frequency Regulation Strategy With Fuzzy Logic Method and Self-Adaptive Modification of State of Charge. IEEE Access 2018, 6, 43575–43585. [Google Scholar] [CrossRef]
  5. Delille, G.; François, B.; Malarange, G. Dynamic Frequency Control Support by Energy Storage to Reduce the Impact of Wind and Solar Generation on Isolated Power System’s Inertia. IEEE Trans. Sustain. Energy 2012, 3, 931–939. [Google Scholar] [CrossRef]
  6. Chen, W.; Sun, N.; Ma, Z.C.; Liu, W.F.; Dong, H.Y. A Two-Layer Optimization Strategy for Battery Energy Storage Systems to Achieve Primary Frequency Regulation of Power Grid. Energies 2023, 16, 2811. [Google Scholar] [CrossRef]
  7. Yan, L.; Jiang, P.P.; Li, W.; Xu, Y.S.; Yang, Z.T.; Zhang, B.H.; Mao, C.X. A Mathematical Model of Versatile Energy Storage System and Its Modeling by Power System Analysis Software Package. Power Syst. Technol. 2012, 36, 51–57. [Google Scholar]
  8. Mu, Y.F.; Wu, J.Z.; Ekanayake, J.; Jenkins, N.; Jia, H.J. Primary Frequency Response From Electric Vehicles in the Great Britain Power System. IEEE Trans. Smart Grid 2013, 4, 1142–1150. [Google Scholar] [CrossRef]
  9. Feng, Y.H. Research on Energy Storage Battery Participating in Primary Frequency Control Strategy of Power System. Master’s Thesis, Hunan University, Changsha, China, 2019. [Google Scholar]
  10. Knap, V.; Chaudhary, S.K.; Stroe, D.I.; Swierczynski, M.; Craciun, B.I.; Teodorescu, R. Sizing of an Energy Storage System for Grid Inertial Response and Primary Frequency Reserve. IEEE Trans. Power Syst. 2016, 31, 3447–3456. [Google Scholar] [CrossRef]
  11. Yang, P.H.; Dong, X.L.; Li, Y.; Kuang, L.; Zhang, J.H.; He, B.; Wang, Y. Research on Primary Frequency Regulation Control Strategy of Wind-thermal Power Coordination. IEEE Access 2019, 7, 144766–144776. [Google Scholar] [CrossRef]
  12. Gao, S.; Li, J.; Song, H.; Ding, L.; Zhang, C. An integrated thermal power-energy storage system for improving primary frequency regulation performance of thermal power units. Power Syst. Prot. Control 2023, 51, 116–125. [Google Scholar]
  13. Shui, T. Research on Integrated Control Strategy Considering Hybrid Energy Storage Participation in Grid Frequency Regulation. Master’s Thesis, Shanxi University, Taiyuan, China, 2023. [Google Scholar]
  14. Zhang, J.C. Research on Optimal Control Strategy of Electrochemical Energy Storage System Participating in Power Grid Primary Frequency Regulation. Master’s Thesis, Changsha University of Science and Technology, Changsha, China, 2022. [Google Scholar]
  15. He, L.; Guo, L.Q.; Tan, Z.X.; Chen, C.Y.; Li, X.R.; Huang, J.Y.; Li, X.Y. Dynamic Performance Improving Strategy for Primary Frequency Regulation With Energy Storages in High Penetration of RESs Power System. IEEE Access 2024, 12, 139560–139572. [Google Scholar] [CrossRef]
  16. Yan, L.Q.; Shui, T.; Xue, T.L.; Wang, M.; Ma, N.; Li, K.Y. Comprehensive Control Strategy Considering Hybrid Energy Storage for Primary Frequency Modulation. Energies 2022, 15, 4079. [Google Scholar] [CrossRef]
  17. Liu, Y.Q.; Chen, M.R.; Xie, B.; Ban, M.F. Integrated control strategy of BESS in primary frequency modulation considering SOC recovery. IET Renew. Power Gener. 2024, 18, 875–886. [Google Scholar] [CrossRef]
  18. Huang, J.Y.; Li, X.R.; Cao, Y.J.; Liu, W.J. Capacity Allocation of Energy Storage System Considering Its Action Moment and Output Depth in Rapid Frequency Regulation. Trans. China Electrotech. Soc. 2015, 30, 454–464. [Google Scholar]
  19. Fang, C.X.; Tang, Y.C.; Ye, R.; Lin, Z.S.; Zhu, Z.S.; Wen, B.Y.; Ye, C.T. Adaptive Control Strategy of Energy Storage System Participating in Primary Frequency Regulation. Processes 2020, 8, 687. [Google Scholar] [CrossRef]
  20. Li, X.R.; Cui, X.W.; Huang, J.Y.; Li, S.J.; Meng, Y.P. The Self-Adaption Control Strategy of Energy Storage Batteries Participating in the Primary Frequency Regulation. Trans. China Electrotech. Soc. 2019, 34, 3897–3908. [Google Scholar]
  21. Lopes, J.A.P.; Almeida, P.M.R.; Soares, F.J. Using Vehicle-to-Grid to Maximize the Integration of Intermittent Renewable Energy Resources in Islanded Electric Grids. In Proceedings of the 2009 International Conference on Clean Electrical Power (ICCEP 2009), Capri, Italy, 9–11 June 2009. [Google Scholar]
  22. Wu, Q.F.; Song, X.L.; Zhang, J.R.; Yu, H.F.; Huang, J.D.; Dai, H.Y. Study on Self-Adaptation Comprehensive Strategy of Battery Energy Storage in Primary Frequency Regulation of Power Grid. Power Syst. Technol. 2020, 44, 3829–3836. [Google Scholar]
  23. Li, X.R.; Deng, T.; Huang, J.Y.; Li, S.J.; Yang, J.; Deng, M. Battery Energy Storage System Self-Adaptation Control Strategy in Fast Frequency Regulation. High Volt. Eng. 2017, 43, 2362–2369. [Google Scholar]
  24. Ma, J.; Pan, J.; Wu, Y.; Wang, H.; Zhang, P. Improved flexible virtual inertial control considering SOC of energy storage and characteristics of frequency recovery. Electr. Power Autom. Equip. 2020, 40, 100–107. [Google Scholar]
  25. Wei, W.; Bin, H.; Ai, F.Z.; Chen, Z.F.; Xu, R.J.; Ren, Y.F. Research on battery energy storage in cooperation with thermal power units to participate in system frequency regulation control strategy. China Meas. Test 2022, 48, 1–7. [Google Scholar]
  26. Tian, S.J. Research on Control Strategy of Battery Energy Storage System Under Primary Frequency Regulation of Power Grid and Unbalanced Grid Voltage. Master’s Thesis, North China Electric Power University, Baoding, China, 2022. [Google Scholar]
  27. Zhao, X.L.; Zhang, D.H.; Gui, Y.; Li, P.; Tan, S.Y. An Integrated Control Strategy for Energy Storage Participating in Primary Frequency Regulation Considering State of Charge Constraint. Mod. Electr. Power 2022, 39, 95–103. [Google Scholar]
  28. Bi, L. Optimal Control Strategy of Energy Storage Assisting Wind for Power Grid in the Primary Frequency Regulation. Master’s Thesis, North China Electric Power University, Baoding, China, 2020. [Google Scholar]
  29. Zhang, Z.Y.; Ding, T.; Zhou, Q.; Sun, Y.G.; Qu, M.; Zeng, Z.Y.; Ju, Y.T.; Li, L.; Wang, K.; Chi, F.D. A review of technologies and applications on versatile energy storage systems. Renew. Sust. Energ. Rev. 2021, 148, 31. [Google Scholar] [CrossRef]
  30. Guerrero, J.M.; Vasquez, J.C.; Matas, J.; de Vicuña, L.G.; Castilla, M. Hierarchical Control of Droop-Controlled AC and DC Microgrids-A General Approach Toward Standardization. IEEE Trans. Ind. Electron. 2011, 58, 158–172. [Google Scholar] [CrossRef]
  31. Yoon, M.; Lee, J.; Song, S.; Yoo, Y.; Jang, G.; Jung, S.; Hwang, S. Utilization of Energy Storage System for Frequency Regulation in Large-Scale Transmission System. Energies 2019, 12, 3898. [Google Scholar] [CrossRef]
  32. Liu, Z.L. Research on Frequency Regulation Characteristics of Hybrid Energy Storage Assisted Heating Units. Master’s Thesis, North China Electric Power University, Baoding, China, 2023. [Google Scholar]
  33. Man, Y. Research on Primary Frequency Modulation Control Method of New Energy Power Station Assisted by “Flywheel +Lithium” Hybrid Energy Storage System. Master’s Thesis, Shandong University, Jinan, China, 2023. [Google Scholar]
  34. Fang, H.Y. Research on Control Strategies for Hybrid Energy Storage in System Frequency Regulation. Master’s Thesis, Qingdao University, Qingdao, China, 2022. [Google Scholar]
  35. Liu, H.; Liu, J.; Zhao, L.; Li, Y. Adaptive Control Strategy for Primary Frequency Modulation of Hybrid Energy Storage Considering State of Charge Recovery. In Proceedings of the 2022 International Conference on Energy Materials and Electrical Engineering (ICEMEE 2022), Guilin, China, 22–24 July 2022. [Google Scholar]
  36. Elkasem, A.H.A.; Kamel, S.; Khamies, M.; Nasrat, L. Frequency regulation in a hybrid renewable power grid: An effective strategy utilizing load frequency control and redox flow batteries. Sci. Rep. 2024, 14, 33. [Google Scholar] [CrossRef]
  37. Zhao, X.L.; Li, P.; Fu, B. Frequency Regulation Method Assisted by Energy Storage Based on Frequency Response Characteristics. Electr. Power Eng. Technol. 2024, 43, 41–49. [Google Scholar]
  38. GB/T 15945-2008; Power Quality—Frequency Deviation for Power System. Standards Press of China: Beijing, China, 2008.
  39. Sun, H.D.; Xu, T.; Guo, Q.; Li, Y.L.; Lin, W.F.; Yi, J.; Li, W.F. Analysis on Blackout in Great Britain Power Grid on August 9th, 2019 and Its Enlightenment to Power Grid in China. Proc. CSEE 2019, 39, 6183–6192. [Google Scholar]
  40. Meng, Y.; Li, X.R.; Liu, X.L.; Cui, X.W.; Xu, P.A.; Li, S.J. A Control Strategy for Battery Energy Storage Systems Participating in Primary Frequency Control Considering the Disturbance Type. IEEE Access 2021, 9, 102004–102018. [Google Scholar] [CrossRef]
  41. Li, L.; Liu, X.P. Study on Frequency Modulation Control Strategy of Energy Storage Auxiliary Thermal Power Unit Considering Frequency Difference Zone. J. North China Electr. Power Univ. 2024, 51, 126–133+142. [Google Scholar]
  42. Wei, N.; Yan, X.; Han, X.; Ma, X.; Cui, J.; Sun, W. Research on Control Strategy of Hybrid Energy Storage System Participating in Primary Frequency Regulation of Power Grid. J. Phys. Conf. Ser. 2023, 2592, 012061. [Google Scholar] [CrossRef]
  43. Li, J.H.; Guo, Z.; Yang, H.; Li, L.; Sun, B.X.; Fan, X.K. Primary Frequency Regulation Control Strategy of Energy Storage Based on Dynamic Droop Coefficient and SOC Reference. Power Syst. Prot. Control 2021, 49, 1–10. [Google Scholar]
  44. Xu, Y.H.; Li, H.Q.; Qin, J.X.; Wang, K.C.; Han, J.H. Frequency Control of Hybrid Energy Storage Assisted Thermal Power Units Based on SOC State. Autom. Appl. 2023, 64, 78–83. [Google Scholar]
  45. Li, P.Q.; Fu, Y.H.; Liu, X.R.; Tan, Z.Z.; Yang, B.; Han, J.Y. Control Strategy for Energy Storage Battery Participating in Primary Frequency Regulation of Power Grid Considering Ultra-short-term Load Forecasting. Autom. Electr. Power Syst. 2019, 43, 87–93. [Google Scholar]
  46. Ma, Z.H.; Li, X.R.; Tang, Z.X.; Huang, J.Y.; Li, H. Integrated Control of Primary Frequency Regulation Considering Dead Band of Energy Storage. Trans. China Electrotech. Soc. 2019, 34, 2102–2115. [Google Scholar]
  47. Wuraola, A.; Patel, N.; Nguang, S.K. Efficient Activation Functions for Embedded Inference Engines. Neurocomputing 2021, 442, 73–88. [Google Scholar] [CrossRef]
  48. Fang, Y.; Hu, J.Y.; Liu, W.H.; Shao, Q.Q.; Qi, J.; Peng, Y.H. Smooth and Time-Optimal S-Curve Trajectory Planning for Automated Robots and Machines. Mech. Mach. Theory 2019, 137, 127–153. [Google Scholar] [CrossRef]
  49. Liu, T.Y.; Cui, J.K.; Li, Y.H.; Gao, S.Y.; Zhu, M.C.; Chen, L.H. Time-Optimal Asymmetric S-Curve Trajectory Planning of Redundant Manipulators under Kinematic Constraints. Sensors 2023, 23, 3074. [Google Scholar] [CrossRef]
  50. Liu, Y.P.; Tian, S.J.; Liang, H.P.; Xie, Y.; Huo, Q.D.; Tang, X.J. Control Strategy of a Battery Energy Storage System Considering SOC in Primary Frequency Regulation of Power Grid. Power Syst. Prot. Control 2022, 50, 107–118. [Google Scholar]
  51. Deng, X.; Sun, W.; Xiao, H.W. Integrated Control Method of Battery Energy Storage Participating in Primary Frequency Regulation. High Volt. Eng. 2018, 44, 1157–1165. [Google Scholar]
  52. Wang, Y.F.; Yang, M.C.; Xue, H.; Zhang, Y.H.; Mi, Y. Adaptive Integrated Control Strategy for Battery Energy Storage System Considering SOC in Primary Frequency Regulation. Electr. Power Autom. Equip. 2021, 41, 192–198, 219. [Google Scholar]
  53. Ju, P.; Li, H.Y.; Gan, C.; Liu, Y.; Yu, Y.P.; Liu, Y.L. Analytical Assessment for Transient Stability Under Stochastic Continuous Disturbances. IEEE Trans. Power Syst. 2018, 33, 2004–2014. [Google Scholar] [CrossRef]
  54. Huang, J.Y.; Li, X.R.; Chang, M.; Li, S.J.; Liu, W.J. Capacity Allocation of Battery Energy Storage System in Primary Frequency Regulation Considering Its Technical-Economic Model. High Volt. Eng. 2017, 32, 112–121. [Google Scholar]
  55. Li, J.H.; Tao, H.; Mu, G.; Yan, G.; Li, C.; He, D.C. Primary frequency regulation strategy with energy storage system based on weight factors and state of charge recovery. Autom. Electr. Power Syst. 2020, 44, 63–72. [Google Scholar]
  56. Liu, J. Hybrid Energy Storage for Frequency Modulation Cooperative Control of Power Grid. Master’s Thesis, North China Electric Power University, Baoding, China, 2022. [Google Scholar]
  57. Zhou, D.; Zou, Z.W.; Dan, Y.Q.; Wang, C.X.; Teng, C.Y.; Zhu, Y.L. An Integrated Strategy for Hybrid Energy Storage Systems to Stabilize the Frequency of the Power Grid Through Primary Frequency Regulation. Energies 2025, 18, 246. [Google Scholar] [CrossRef]
  58. Fang, H.Y.; Ma, P. Adaptive Droop Control Strategy Considering Frequency Modulation Dead Band of Hybrid Energy Storage. J. Electr. Eng. 2021, 16, 213–222. [Google Scholar]
  59. Zhang, Q.; Li, X.R.; Yang, M.; Cao, Y.J.; Li, P.Q. Capacity Allocation Method of Hybrid Energy Storage System for Smoothing Wind Power Fluctuations with Maximum Net Benefit. Trans. China Electrotechn. Soc. 2016, 31, 40–48. [Google Scholar]
  60. Zizlavsky, O. Net Present Value Approach: Method for Economic Assessment of Innovation Projects. In Proceedings of the 19th International Scientific Conference on Economics and Management (ICEM), Riga, Latvia, 23–25 April 2014. [Google Scholar]
  61. Ye, L.; Wang, K.F.; Lai, Y.N.; Chen, H.; Zhao, Y.N.; Xu, X.; Lu, P.; Jin, Y.F. Analysis of Frequency Characteristics and Control Strategies of Battery Energy Storage Frequency Regulation in Power Systems Under Low Inertia. Power Syst. Technol. 2023, 47, 446–464. [Google Scholar]
  62. Huang, J.Y.; Li, X.R.; Cao, Y.J.; Zhang, Q.; Liu, W.J. Simulation Model of Battery Energy Storage System for Grid Frequency Regulation. Autom. Electr. Power Syst. 2015, 39, 20–24, 74. [Google Scholar]
  63. Vermeer, W.; Mouli, G.R.C.; Bauer, P. A Comprehensive Review on the Characteristics and Modeling of Lithium-Ion Battery Aging. IEEE Trans. Transp. Electrif. 2022, 8, 2205–2232. [Google Scholar] [CrossRef]
  64. Deng, X.Y.; Mo, R.; Wang, P.L.; Chen, J.R.; Nan, D.L.; Liu, M.Y. Review of RoCoF Estimation Techniques for Low-Inertia Power Systems. Energies 2023, 16, 3708. [Google Scholar] [CrossRef]
  65. Jabari, M.; Ekinci, S.; Izci, D.; Bajaj, M.; Zaitsev, I. Efficient DC Motor Speed Control Using a Novel Multi-Stage FOPD(1 + PI) Controller Optimized by the Pelican Optimization Algorithm. Sci. Rep. 2024, 14, 22442. [Google Scholar] [CrossRef] [PubMed]
Figure 1. Dynamic model of PFR in regional power grid with HESS.
Energies 18 02423 g001
Figure 2. Curves of the rate of change in FD under different disturbances.
Energies 18 02423 g002
Figure 3. Amplitude–frequency characteristic of different strategies.
Energies 18 02423 g003
Figure 4. Relationship between VDC coefficient and SOC.
Energies 18 02423 g004
Figure 5. Comparison of different VDC curves.
Energies 18 02423 g005
Figure 6. The coefficient of demand for charge/discharge recovery.
Energies 18 02423 g006
Figure 7. The coefficient of constraint for charge/discharge recovery.
Energies 18 02423 g007
Figure 8. Comprehensive control method of HESS participating in PFR of power grid.
Energies 18 02423 g008
Figure 9. Variation curve of realistic load disturbance curve for 800 s.
Energies 18 02423 g009
Figure 10. FD variation curves for different oref values under typical step disturbance.
Energies 18 02423 g010
Figure 11. FD curve under 0.05 p.u. step disturbance.
Energies 18 02423 g011
Figure 12. SOC variation curve of ESS under 0.05 p.u. step disturbance. (a) SOC variation curve of SESS under 0.05 p.u. step disturbance. (b) SOC variation curve of BESS under 0.05 p.u. step disturbance.
Energies 18 02423 g012
Figure 13. Variation curve of load disturbance for 25 s.
Energies 18 02423 g013
Figure 14. FD curve under 25 s continuous disturbance.
Energies 18 02423 g014
Figure 15. SOC variation curve of ESS under 25 s continuous disturbance. (a) SOC variation curve of SESS under 25 s continuous disturbance. (b) SOC variation curve of BESS under 25 s continuous disturbance.
Energies 18 02423 g015aEnergies 18 02423 g015b
Figure 16. Variation curve of combined disturbance for 1800 s.
Energies 18 02423 g016
Figure 17. FD curve under 1800 s combined disturbance.
Energies 18 02423 g017
Figure 18. SOC variation curve of ESS under 1800 s combined disturbance. (a) SOC variation curve of SESS under 1800 s combined disturbance. (b) SOC variation curve of BESS under 1800 s combined disturbance.
Energies 18 02423 g018aEnergies 18 02423 g018b
Figure 19. Local magnified curve of FD variation under commercial load.
Energies 18 02423 g019
Figure 20. SOC variation curve of ESS under 800 s commercial disturbance. (a) SOC variation curve of SESS under 800 s commercial disturbance. (b) SOC variation curve of BESS under 800 s commercial disturbance.
Energies 18 02423 g020aEnergies 18 02423 g020b
Figure 21. FD curve of different capacity configurations under 1800 s combined disturbance.
Energies 18 02423 g021
Figure 22. SOC variation curve of different capacity configurations under 1800 s combined disturbance. (a) SOC variation curve of SESS of different capacity configurations under 1800 s combined disturbance. (b) SOC variation curve of BESS of different capacity configurations under 1800 s combined disturbance.
Energies 18 02423 g022
Table 1. Definition of parameters in the model.
ParametersDefinitionUnit
ΔPG(s)PFR output of the TPUMW
ΔPSC(s)SESS PFR power outMW
ΔPB(s)BESS PFR power outMW
ΔPL(s)Load disturbanceMW
KGPFR factor for TPU-
HInertia TC of the power grid-
DLoad damping coefficient-
FHPReheater gain-
TGGovernor TC of the TPUs
TRHReheater TCs
TCHTurbine TCs
TSCInertia TC of SESSs
TBInertia TC of BESSs
Where the TC presents the time constant.
Table 2. PFR evaluation index under 0.05 p.u. step disturbance.
Control Policiesfm|/10−3 p.u.tmfs|/10−3 p.u.tsvm/10−3
Paper strategy2.7393.4431.98120.8850.796
Adaptive VDC strategy1.6491.7101.99923.5710.964
Fixed-K method2.9462.6162.00123.9461.126
No ESS3.6652.4912.31324.2741.471
Table 3. PFR evaluation index under 25 s continuous disturbance.
Control Policiesfindex/10−4 p.u.SOCSCindexSOCBindex/10−4
Paper strategy2.94780.00490
Adaptive VDC strategy4.01430.00194.3488
Fixed-K method4.42230.00152.9782
No ESS5.4207--
Table 4. Evaluation index of PFR under 250 s continuous combined load disturbance.
Control Policiesfindex/10−4 p.u.SOCSCindexSOCBindex
Paper strategy5.13550.08090.0458
Adaptive VDC strategy5.92580.02240.1459
Fixed-K method6.57550.02170.0652
No ESS7.2071--
Table 5. Evaluation index of PFR under 800 s continuous commercial disturbance.
Control Policiesfindex/p.u.SOCSCindexSOCBindex
Paper strategy0.00120.16060.1156
Adaptive VDC strategy0.00130.28080.1470
Fixed-K method0.00150.00390.1514
No ESS0.0018--
Table 6. Economic indicators for various ESSs participating in PFR.
BESS in HESSBESS in HESSBESS Only
CLCC/USD7.8426 ×1071.728 × 1079.857 × 107
NRES/USD2.0394 × 1085.1281 × 1082.9188 × 108
PNET/USD1.2551 × 1084.9553 × 1081.9331 × 108
Disclaimer/Publisher’s Note: The statements, opinions and data contained in all publications are solely those of the individual author(s) and contributor(s) and not of MDPI and/or the editor(s). MDPI and/or the editor(s) disclaim responsibility for any injury to people or property resulting from any ideas, methods, instructions or products referred to in the content.

