The multi-stage installation of PMUs uses a phased approach to deploy PMUs across power systems, allowing for incremental monitoring and performance assessment. This strategy helps operators prioritize high-impact areas based on factors like bus criticality and system topology, ultimately managing costs more effectively while minimizing disruptions. With each phase, utilities gain valuable feedback and data, enabling them to adjust future installations based on real-time observations, leading to a more efficient monitoring network.
The performance of various optimization algorithms for PMU allocation is analyzed across multiple IEEE bus systems, including IEEE 14, IEEE 30, New England 39, IEEE 57, and IEEE 118. The primary metrics considered were the number of PMUs required for complete network observability, the BCI to evaluate whether the network is completely observed or not, and the SORI to evaluate redundant observations within the network. These metrics reflect the effectiveness of each algorithm in achieving full observability of the power grid. The performance of four optimization methods (exhaustive binary search (EBS) [
10,
29], particle swarm optimization (PSO) [
8], genetic algorithm (GA) [
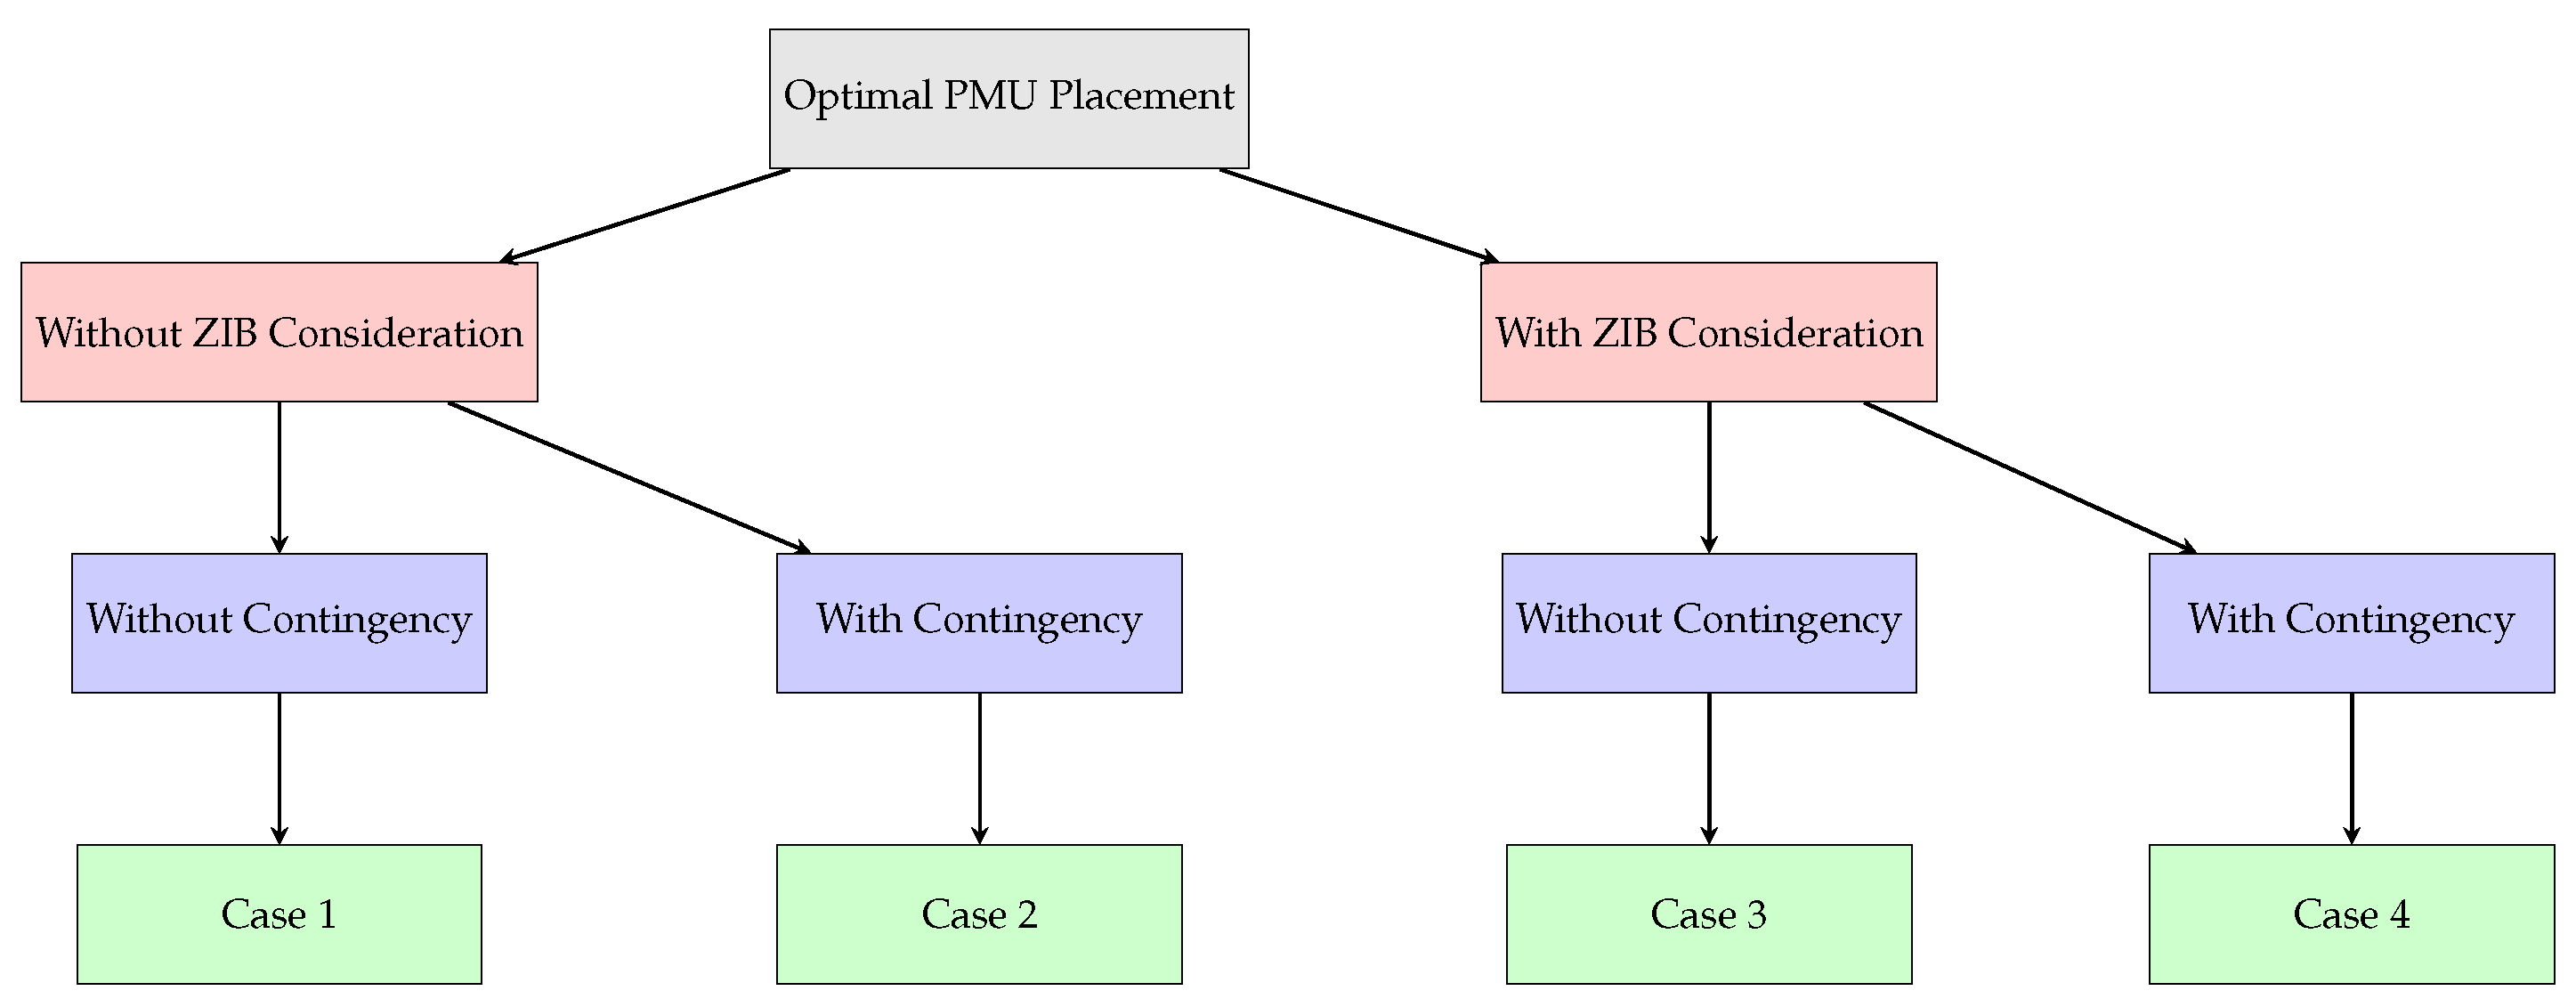
7], and the proposed integer linear programming (ILP)) are compared for PMU placement across several IEEE test bus systems. This work examines the results under four different cases, as shown in
Figure 6. The results of the phasing, number of PMUs, BCI, and SORI of four different cases of OPP solved using the proposed ILP approach are shown in
Table 2,
Table 3,
Table 4 and
Table 5.
4.1. PMU Allocation with Comprehensive Observability Constraint
PMU allocation with an observability constraint only is the first case for comparing different methods and test bus systems.
Table 2 provides the following inferences. In terms of the number of PMUs, fewer devices indicate a more efficient result. Across all test systems (New England 39, IEEE 14, 30, 57, and 118), the proposed ILP method consistently uses the same PMUs as EBS and PSO. In the IEEE 118 bus system, PSO gives 31 PMUs, but, as can be seen from the value of BCI in
Table 2, the system is not completely observed.
The BCI indicates how well each bus in the system is covered, with a value closer to 1 being optimal. In the IEEE 14, IEEE 30, New England 39, and IEEE 57, algorithms EBS, PSO, and proposed ILP achieved similar BCI values equal to 1, indicating that all buses are well covered. In the last IEEE 118, the algorithm PSO, [
8] failed to have a value equal to 1, which means that the system is not completely observed. They claimed to have PMUs at locations (3, 5, 9, 12, 15, 17, 21, 23, 28, 30, 36, 40, 44, 46, 51, 54, 57, 62, 64, 68, 71, 75, 80, 85, 86, 91, 94, 101, 105, 110, and 114). The unobserved buses were found to be (76, 78, and 82) using the proposed index BCI. However, for the IEEE 118 network, the ILP method achieved a BCI of 1, matching the best result, which indicates that the entire network was covered efficiently with the least number of PMUs.
The SORI is highest when system redundancy is maximized. The ILP method performed competitively in all cases, achieving similar or higher SORI values compared to EBS and PSO, especially in cases where the number of PMUs was the same. For example, in the IEEE 118 system, the ILP method achieved an SORI of 164, which was higher than the PSO’s 148. Given that the result found using the proposed ILP is highly efficient.
4.3. PMU Allocation with Comprehensive Observability and ZIB Constraint
The allocation of PMUs with observability and ZIB constraints is the third case for comparing various methods and test bus systems, as ZIBs help reduce the number of PMUs required. The following insights are drawn from the results presented in
Table 4.
Introducing ZIBs reduces the number of PMUs needed to maintain observability. The proposed ILP method and GA showed equal PMUs in all networks compared to other EBS and PSO. For the IEEE 57 bus system, the proposed ILP and GA lead the other two techniques by using fewer PMUs.
The BCI values for all the methods are equal to 1 except for GA in one network. Castro et al. [
7] claimed to have complete network observability in the New England 39 bus system and placed PMUs at locations (2, 5, 8, 10, 16, 19, 23, 26) but failed to observe buses (12, 14, and 18) found using the proposed BCI, meaning that the algorithm needs further tuning to ensure a BCI value equal to 1.
Although the SORI was slightly lower in some systems, the number of PMUs was also reduced, making the ILP method more optimal overall. For example, in the IEEE 57 bus system, the ILP method achieved an SORI of 61 with 11 PMUs, compared to PSO’s 64, but using 13 PMUs made the ILP solution more efficient.
4.4. PMU Allocation with Comprehensive Observability, Contingency, and ZIB Constraint
The allocation of PMUs with observability, contingency, and ZIB constraints is the fourth case for comparing different methods and test bus systems. ZIBs help reduce the number of required PMUs, while contingency constraints ensure the system’s observability under failures. The following insights are derived from the results shown in
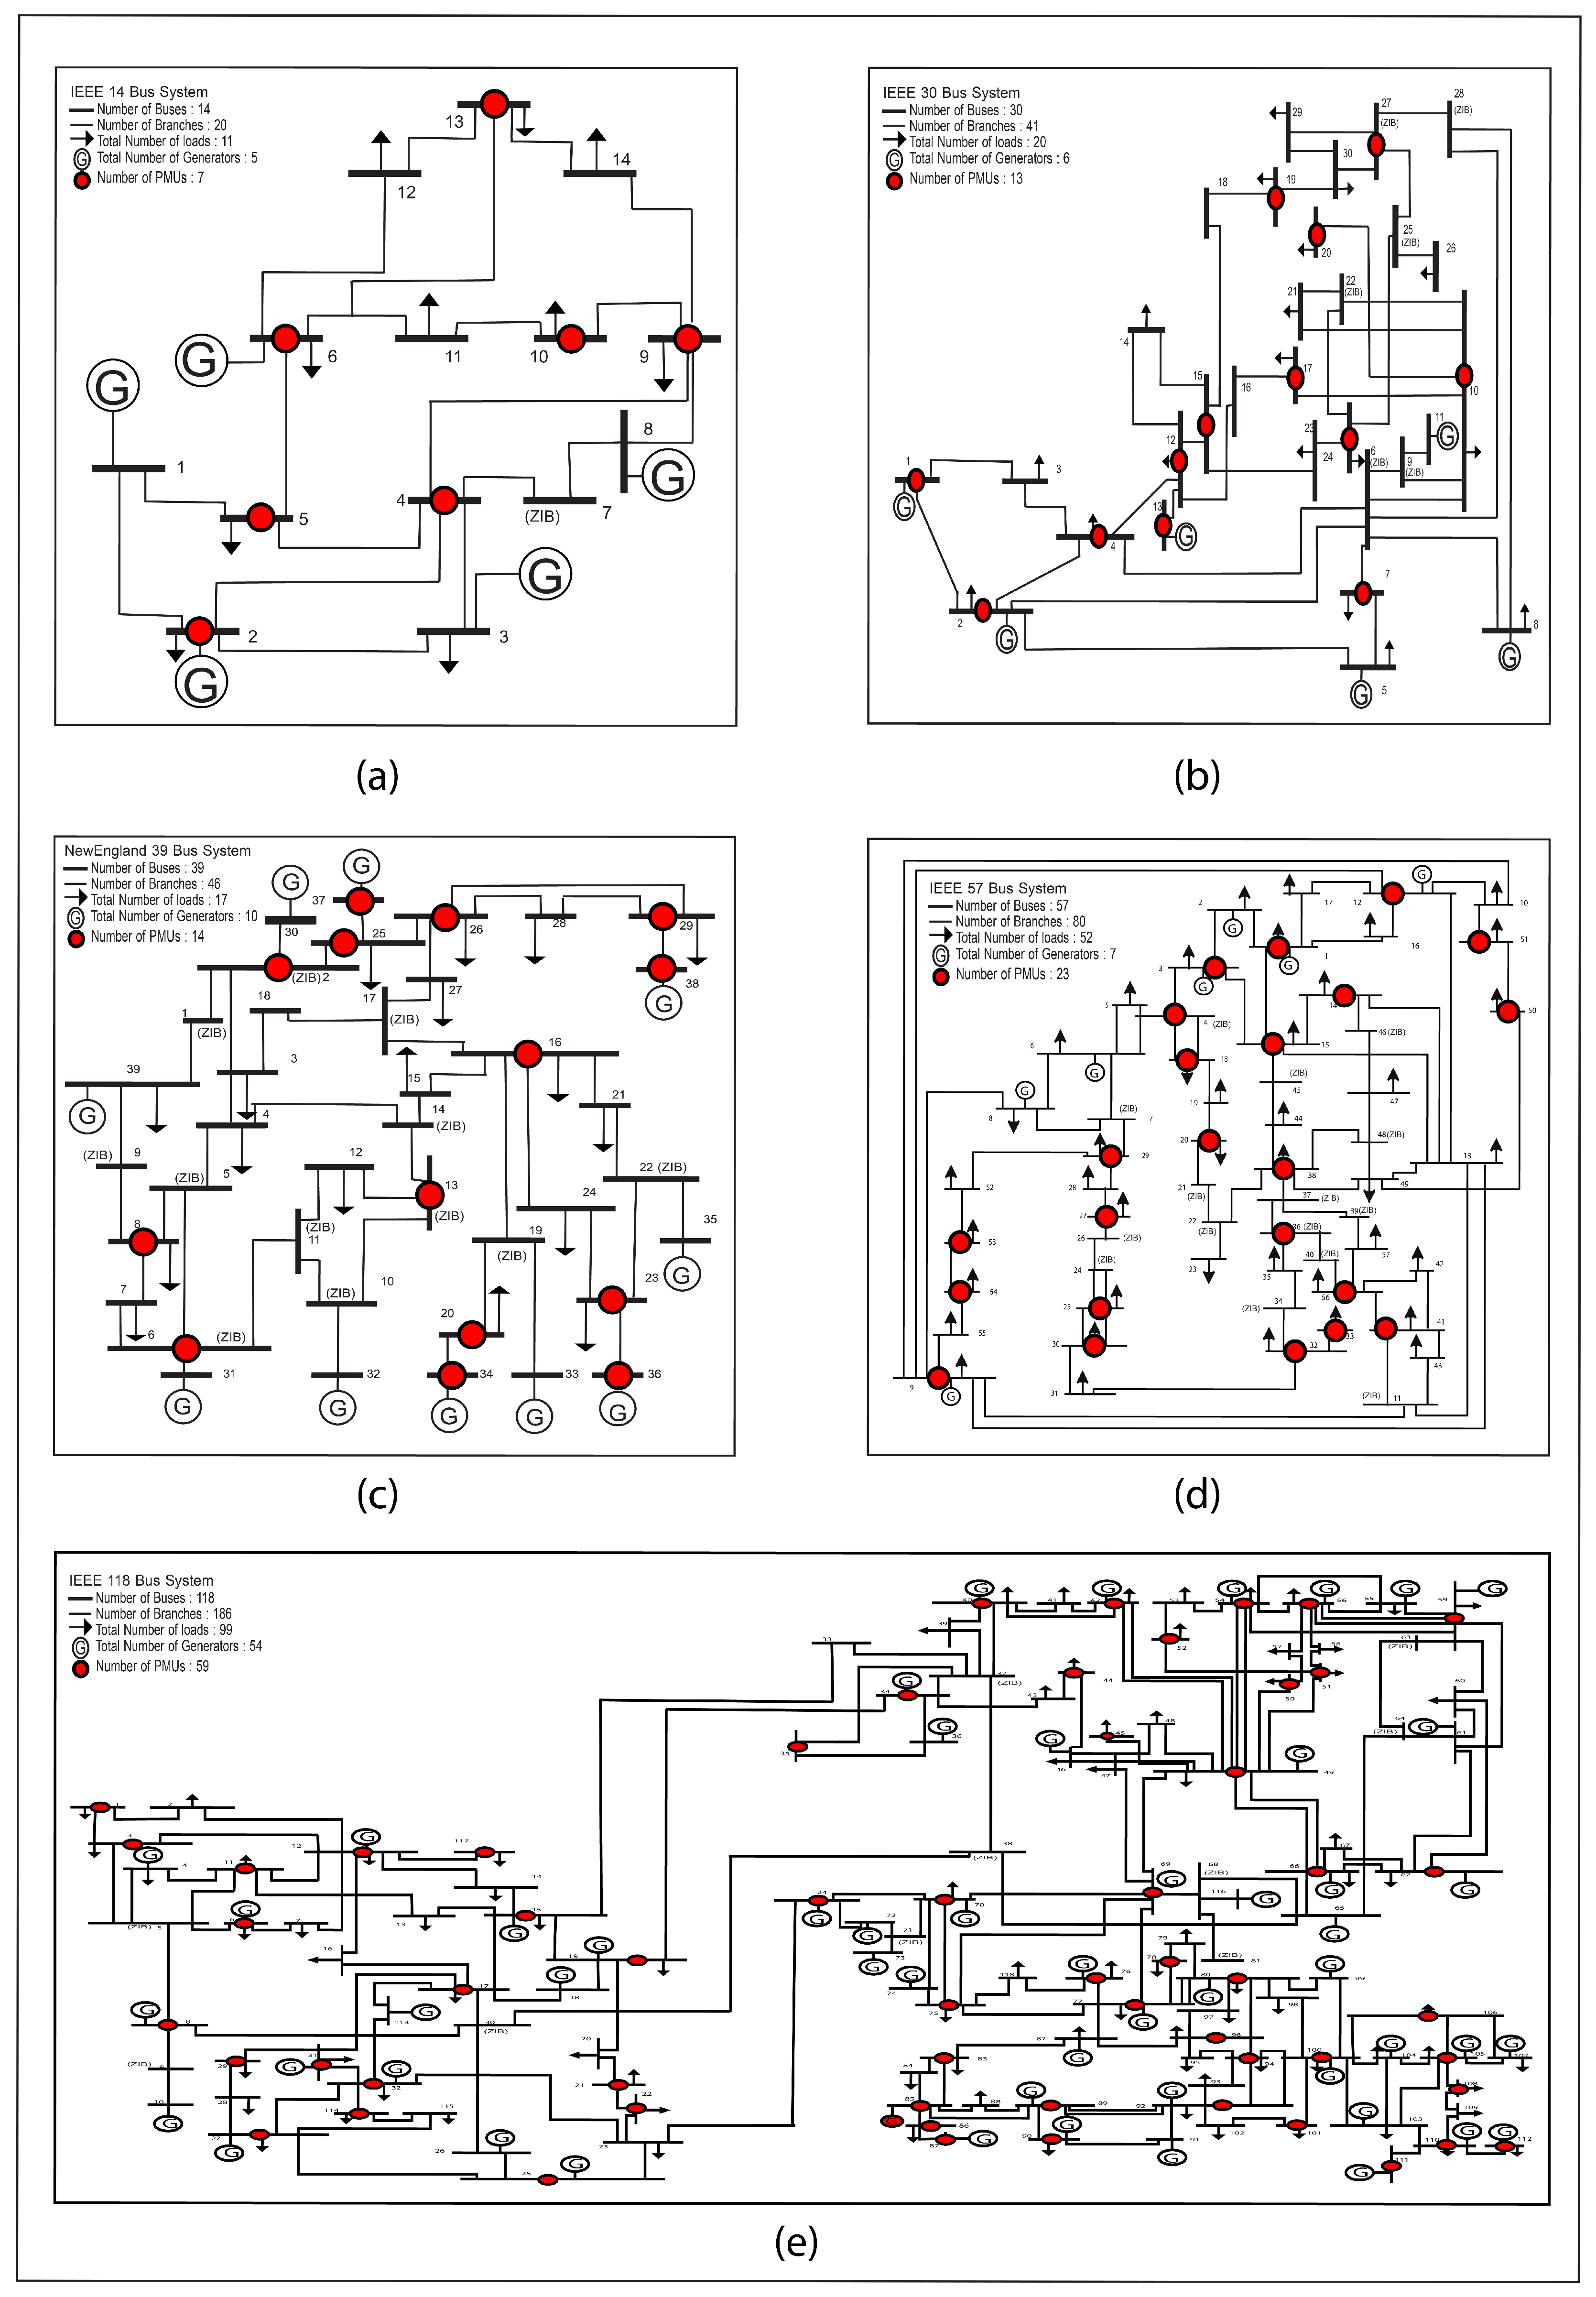
Table 5. The optimal results found considering this case are presented in
Figure 7 so that results can be directly seen.
In the most complex scenario, considering both contingencies and ZIBs, the ILP method again showed its effectiveness. In the New England 39, IEEE 30, 57, and 118 bus systems, the ILP method used fewer PMUs, giving the best result when compared to GA.
The BCI values achieved by the ILP method were optimal across all systems, maintaining near-total observability despite the additional constraints. Castro et al. [
7] claimed complete observability by placing PMUs at locations (1, 2, 3, 4, 7, 8, 10, 11, 16, 19, 20, 22, 23, 26, 29) but failed to observe bus (37) found using the proposed BCI, which means that the proposed ILP is superior.
Meanwhile, the SORI values for ILP were comparable to those of other methods. Although the SORI was slightly lower in some systems, the number of PMUs was also reduced, making the ILP method more optimal overall. In the IEEE 118 system, ILP improved SORI and reduced the number of PMUs. It achieved an SORI of 280 with 59 PMUs, outperforming other methods.
4.5. Algorithm-Specific Observations
The EBS algorithm consistently achieved a minimal number of PMUs across various bus systems. Chakrabarti et al. [
10,
29] claimed that EBS outperforms PSO, GA, and ILP despite being more computationally intensive. While this assertion holds for PSO and GA, it is not entirely accurate for ILP. When properly formulated, ILP can provide optimal solutions without imposing excessive computational demands on the system and is better than the EBS algorithm.
The PSO algorithm performed comparably to EBS in terms of the number of PMUs required. However, its ability to maintain SORI varied slightly, particularly in larger bus systems. Ahmadi et al. [
8] claimed to have optimal results, but when a comparison between the conventional method solved using PSO and the proposed formulation solved using ILP is made, it is revealed that PSO-based solutions have a lower SORI value. Therefore, the proposed formulation is more effective than the conventional approach for solving the PMU placement problem using the ILP algorithm.
The results from the GA showed more significant variability in both the number of PMUs and observability metrics. Castro et al. [
7] claimed to have complete network observability, but it failed in the New England 39 bus system found using the proposed BCI. Its performance was inconsistent, indicating a need for further tuning or modifications to improve scalability. Additionally, GA struggled to achieve complete network observability, highlighting an area that requires improvement. Therefore, ILP leads, when the proposed formulation is solved, to the GA.
It is inferred from the above discussion that the EBS algorithm consistently achieved lower PMU counts while maintaining high observability across all bus systems. PSO delivered similar results but showed variability in SORI, suggesting a balance between redundancy and PMU count. GA performed well in smaller networks but required optimization for larger systems. Overall, the ILP method outperformed or matched PSO, GA, and EBS in minimizing PMUs while ensuring high SORI and BCI values of 1. Its robust performance across different IEEE test systems, including the larger 118 bus system, highlights its effectiveness for practical PMU placement under varying constraints.
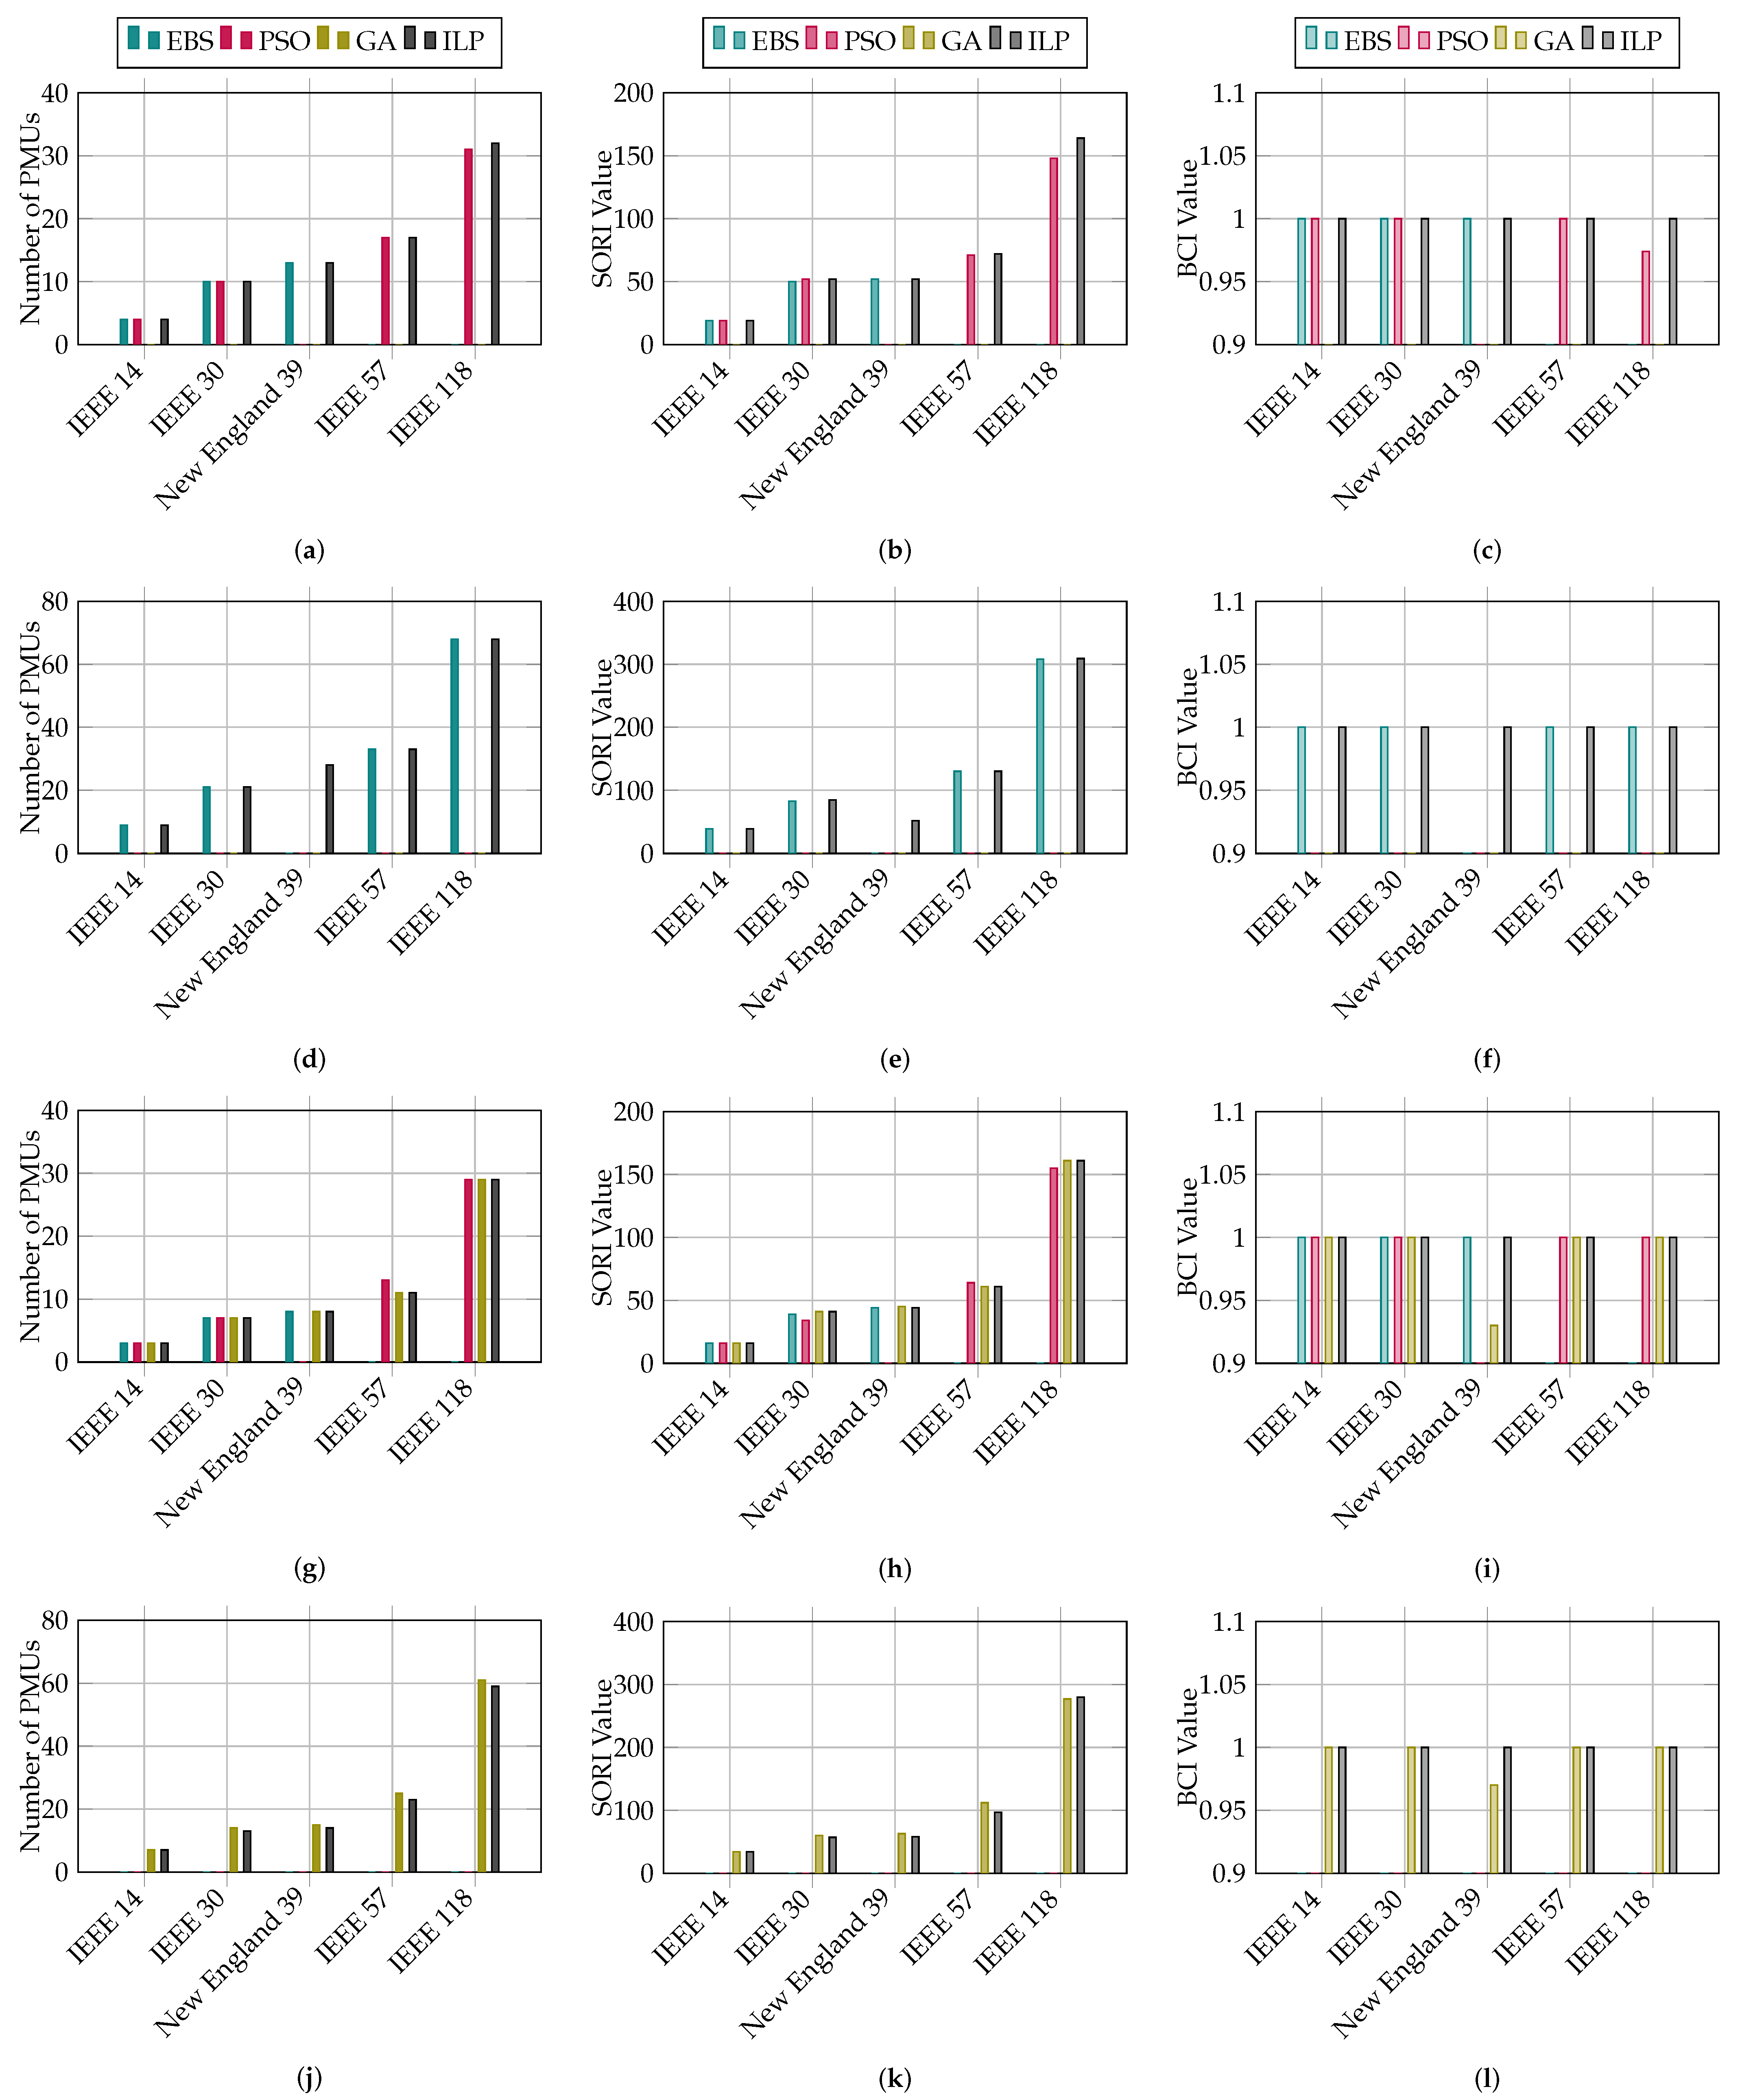
The comparative analysis of all four cases is presented in
Figure 8. The twelve sub-figures present the results of evaluating four methods (EBS, PSO, GA, and the proposed ILP) across four cases, focusing on three key metrics: the number of PMUs required, the SORI value, and the BCI value. Overall, it can be seen that ILP always provides full system observability with the same number of PMUs while also obtaining the highest SORI and BCI score for large networks of Case 1, as shown in
Figure 8a–c. In Case 2, ILP performed better in terms of SORI than EBS in IEEE 30 and IEEE 118 bus systems, as can be seen in
Figure 8d–f. In Case 3, the results are the same as GA, but better than EBS and PSO. In this case, for New England, the test bed system GA fails to have complete network observability, but ILP techniques give PMUs that completely monitor the network, as can be seen in
Figure 8g–i. In the last case, where contingency and ZIB effects are considered for complete network observability, a direct comparison is made between the proposed ILP and GA, as other algorithm results were not available. It reveals that ILP outperformed in reducing the number of PMUs in IEEE 30, New England 39, IEEE 57, and IEEE 118 bus systems, satisfying complete network observability, as can be seen in
Figure 8j–l.
The simulations were conducted on a system equipped with an Intel(R) Core(TM) i7-5500U CPU running at a base speed of 2.40 GHz, featuring two cores and four logical processors. The system also included 12 GB of DDR3 RAM and an Intel(R) HD Graphics 5500 GPU. This setup provided a robust environment for efficiently handling the computational demands of the optimization problem. The times consumed by different cases are presented below in
Table 6.
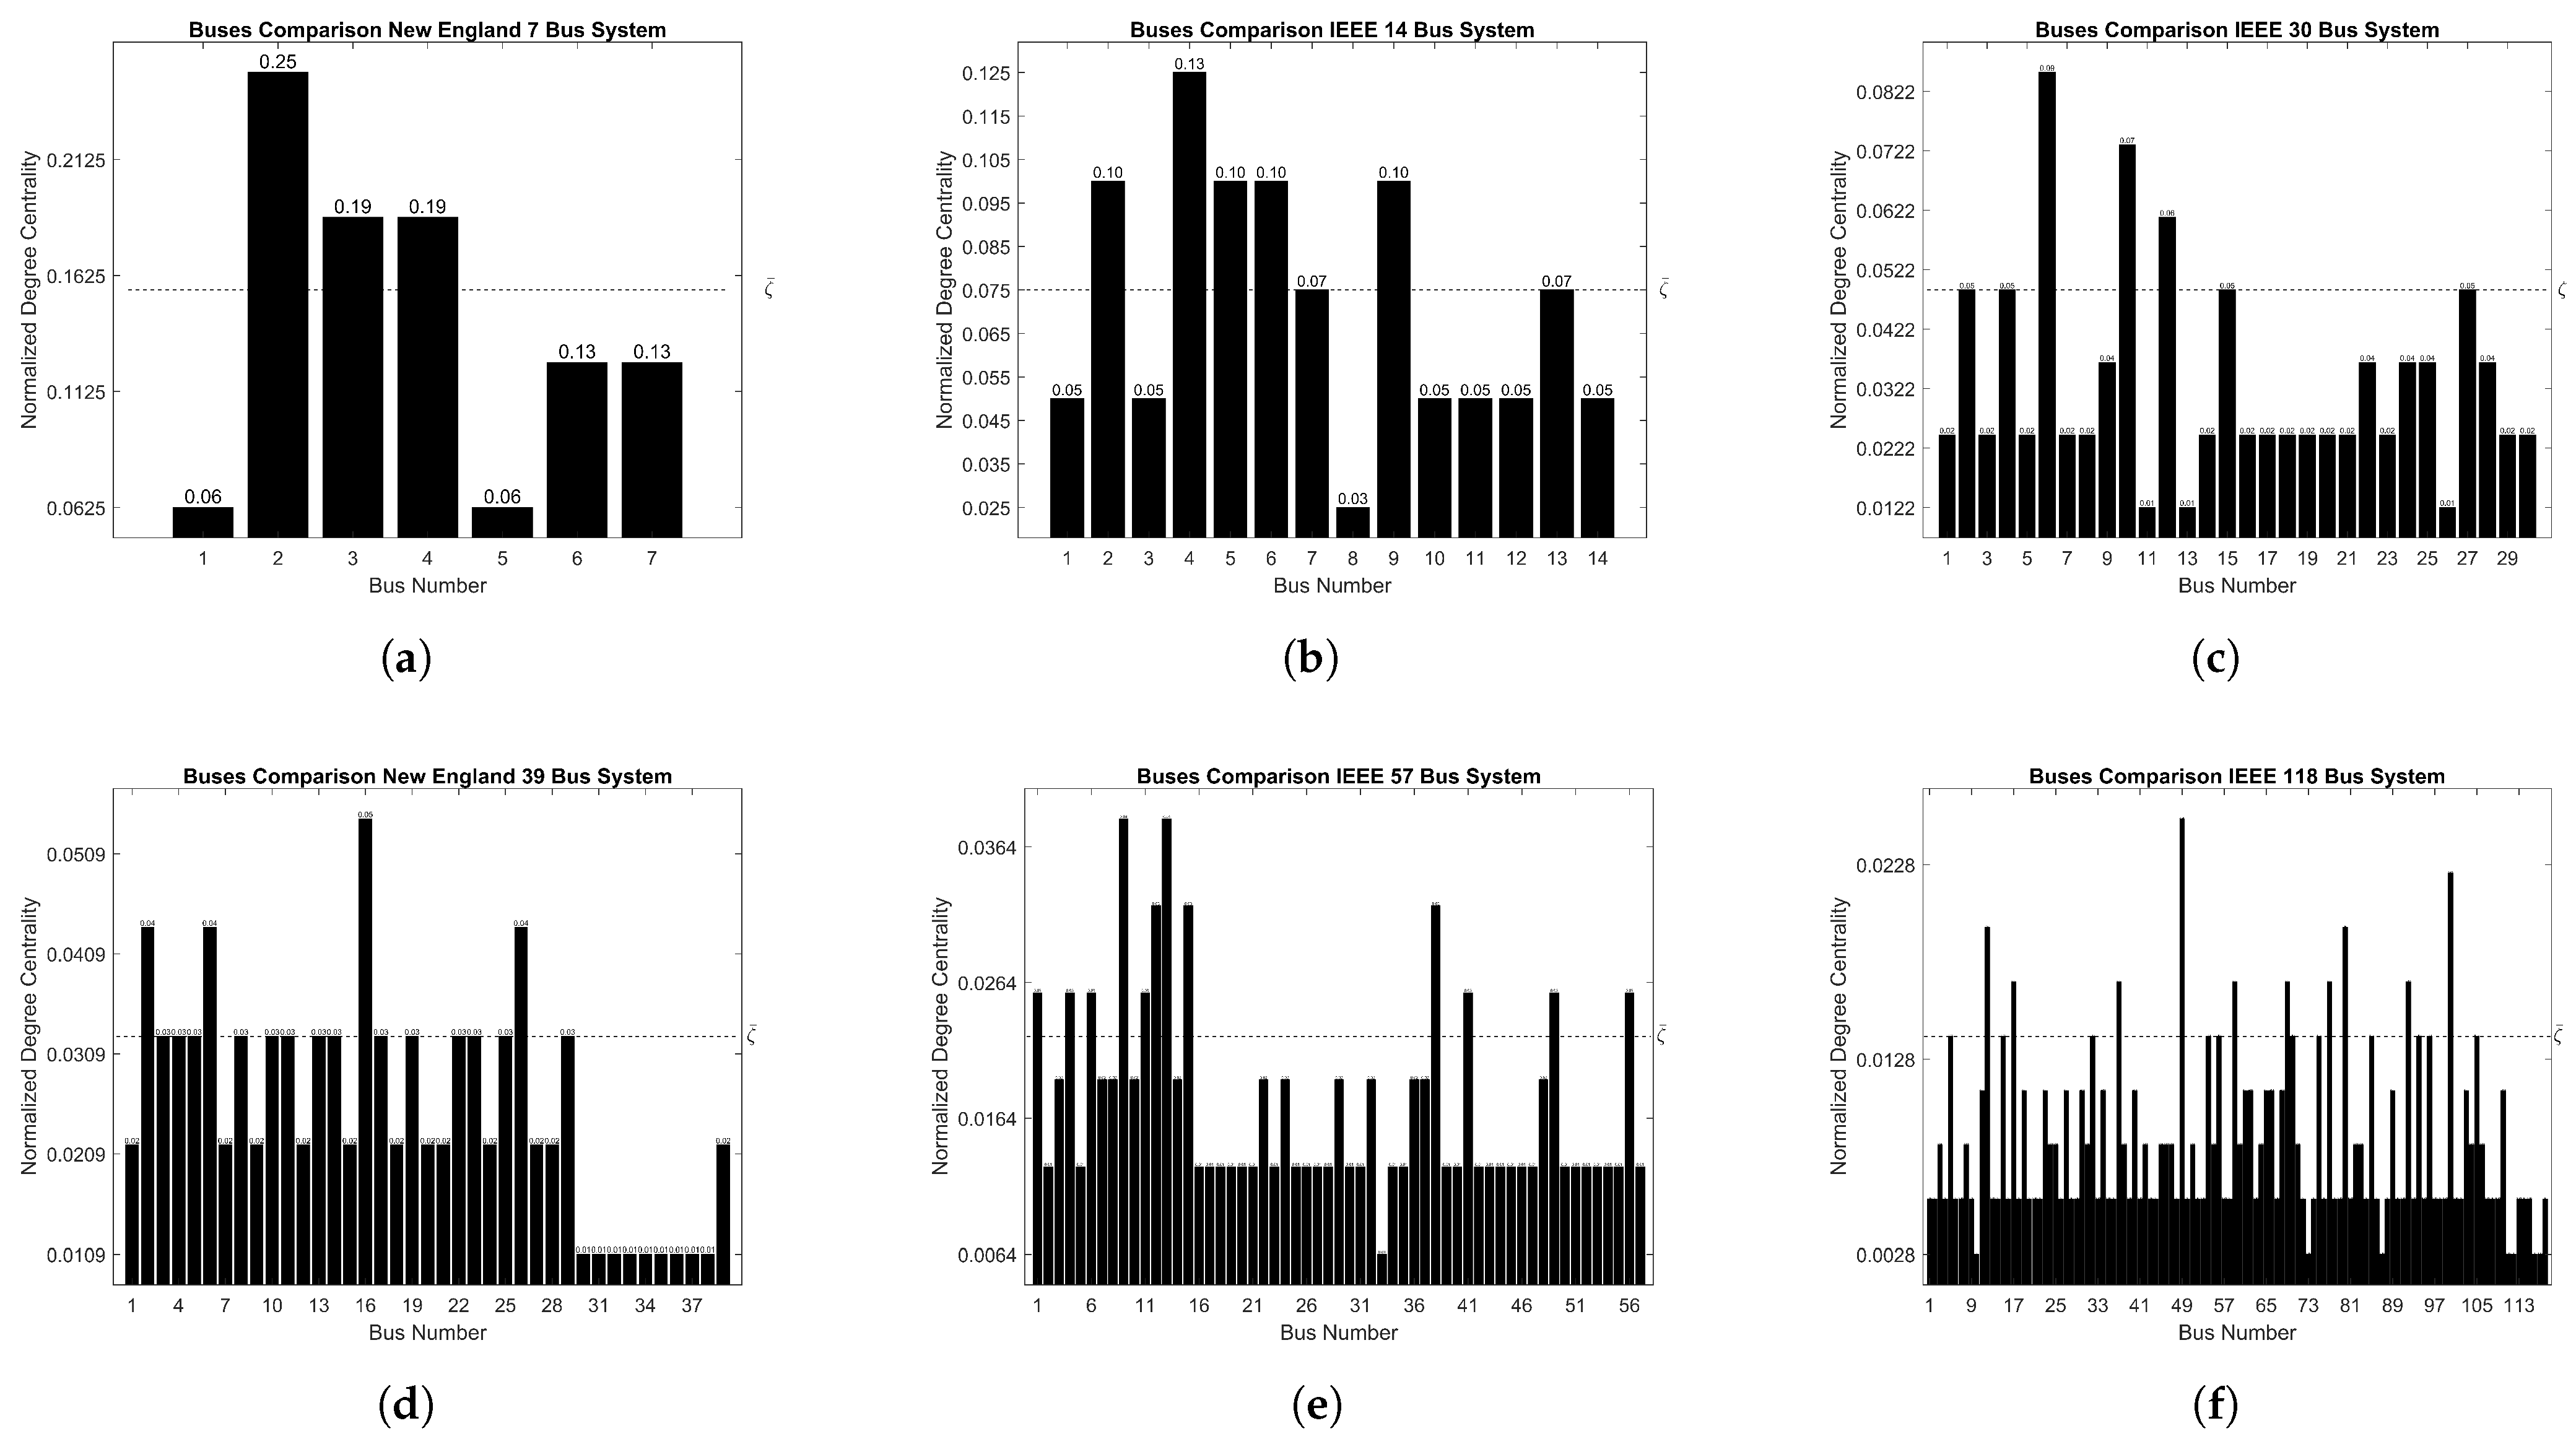
From the above results and discussion, it is found that placing PMUs based on the normalized degree of centrality is an optimal way to enhance observability. By focusing on the most connected buses, it is possible to strategically position PMUs to cover the maximum area with fewer units. The simulations show a significant reduction in the number of PMUs needed compared to traditional methods, improving both observability and efficiency. This approach also strengthens the system’s resilience during contingencies, as PMUs at central vertices maintain observability even if parts of the network fail. Additionally, it aligns well with zero-injection bus (ZIB) considerations, allowing for effective monitoring of nearby ZIBs and further reducing PMU requirements. When compared to other methods like EBS, PSO, and GA, this strategy consistently delivers solid performance metrics, including high SORI and BCI values, making it especially effective for larger networks where achieving comprehensive observability is crucial.
The main limitation of this study is that the results of EBS, PSO, and GA are compared with ILP, but they are based on different formulations. The ILP method uses a normalized degree of centrality-based formulation that combines cost and critical buses. In contrast, the EBS, PSO, and GA methods are based on a traditional formulation that focuses only on reducing PMU installation costs. Because of this difference, the comparison between the algorithms is not entirely direct. In future work, EBS, PSO, and GA should be solved using the same normalized degree of centrality-based formulation. It will allow for a fair and direct comparison of all algorithms under the same mathematical framework.


 ,
, 

