
Photovoltaic Farms: Economic Efficiency of Investments in South-East Poland

 , , ,
, , ,
Abstract
1. Introduction
- What was the scale of support for large-scale photovoltaic projects under the Regional Operational Program of the Lublin Voivodeship 2007–2013?
- Is public support for the development of large-scale solar power generation justified?
- What was the variation in the level of capital expenditures, operating costs and economic efficiency of investments depending on the installed capacity?
- Is the production of electricity in photovoltaic installations economically an alternative to its production in conventional sources?
2. Materials and Methods
- (a)
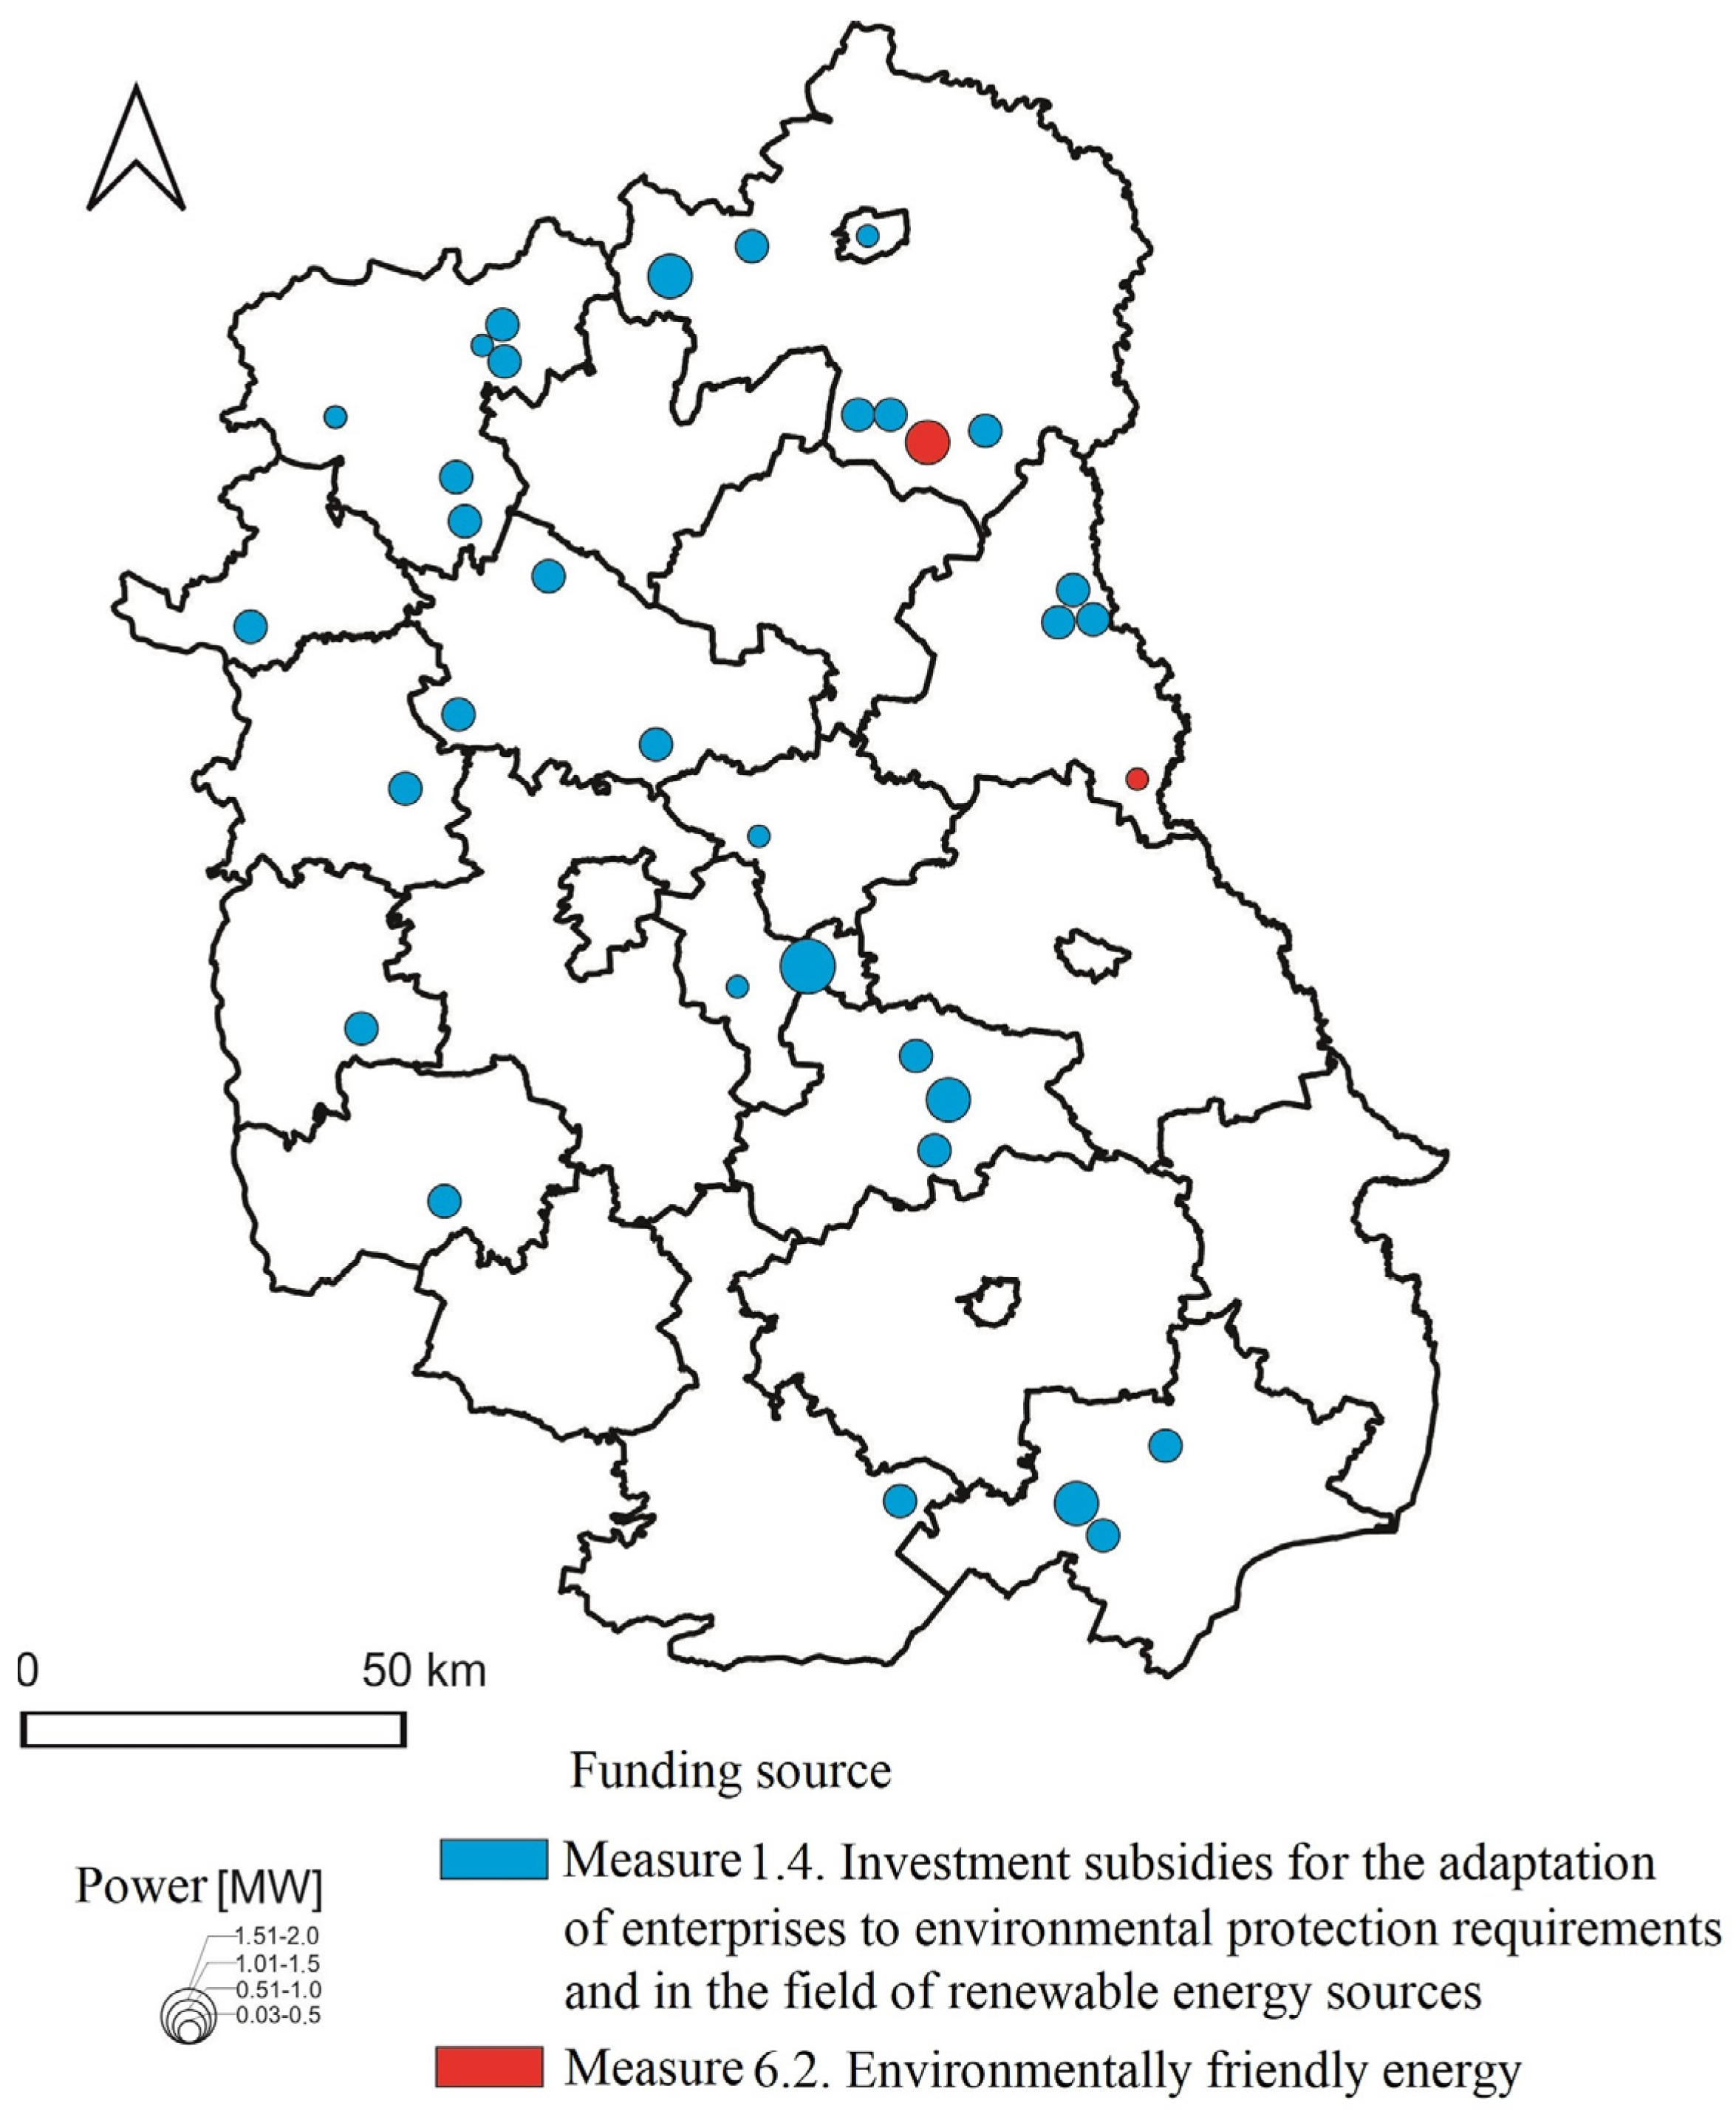
- Priority Axis I. Entrepreneurship and innovation (29 projects):
- Measure 1.4 Investment subsidies for adaptation of enterprises to environmental requirements and renewable energy sources.
- (b)
- Priority Axis VI. Environment and clean energy (2 projects):
- Measure 6.2 Environmentally friendly energy.
- investments (pre-feasibility and pre-production phases, fixed and current assets);
- revenues from the launched business;
- expenses (operating costs).
- simple evaluation methods (do not take into account the change in the time value of money): simple payback period of capital expenditures, simple and accounting rate of return, break-even analysis;
- discount methods: net present value (NPV), internal rate of return (IRR).
- (a)
- Return on investment (ROI)
- (b)
- Simple Payback Period (SPP)
- NP—net profit;
- IC—investment cost.
- NPV;
- IRR;
- discounted payback period DPBT (Dynamic Pay Back Time);
- Levelized Cost of Electricity (LCOE).
- NPV—net present value;
- Fn—net cash flow in year n;
- N—analysis period;
- d—annual discount rate.
- IC—investment cost;
- Fn—net cash flow in year n;
- N—analysis period;
- d—annual discount rate.
- It—capital expenditures in year t (depreciation and cost of capital) [PLN],
- Mt—other costs in year t [PLN],
- Eet—the amount of electricity generated in year t [MWh],
- r—average discount rate [%],
- n—the planned lifetime of the photovoltaic system [years].
Case Study
- (a)
- Priority Axis I. Entrepreneurship and innovation (29 projects):
- Measure 1.4. Investment subsidies for adaptation of enterprises to environmental requirements and renewable energy sources.
- (b)
- Priority Axis VI. Environment and clean energy (2 projects):
- Measure 6.2 Environmentally friendly energy.
- Investments in the development and use of renewable energy sources such as wind, water (taking into account the needs of nature conservation and ecological aspects of river maintenance), biomass, solar and geothermal energy, and others;
- Investments to reduce emissions of biogas generated at wastewater treatment plants and landfills through its energetic use;
- Modernization of boiler rooms fired by solid fuel to those fueled by ecological fuels, with particular attention to tasks carried out in educational and educational institutions, cultural institutions, and hospitals.
3. Results
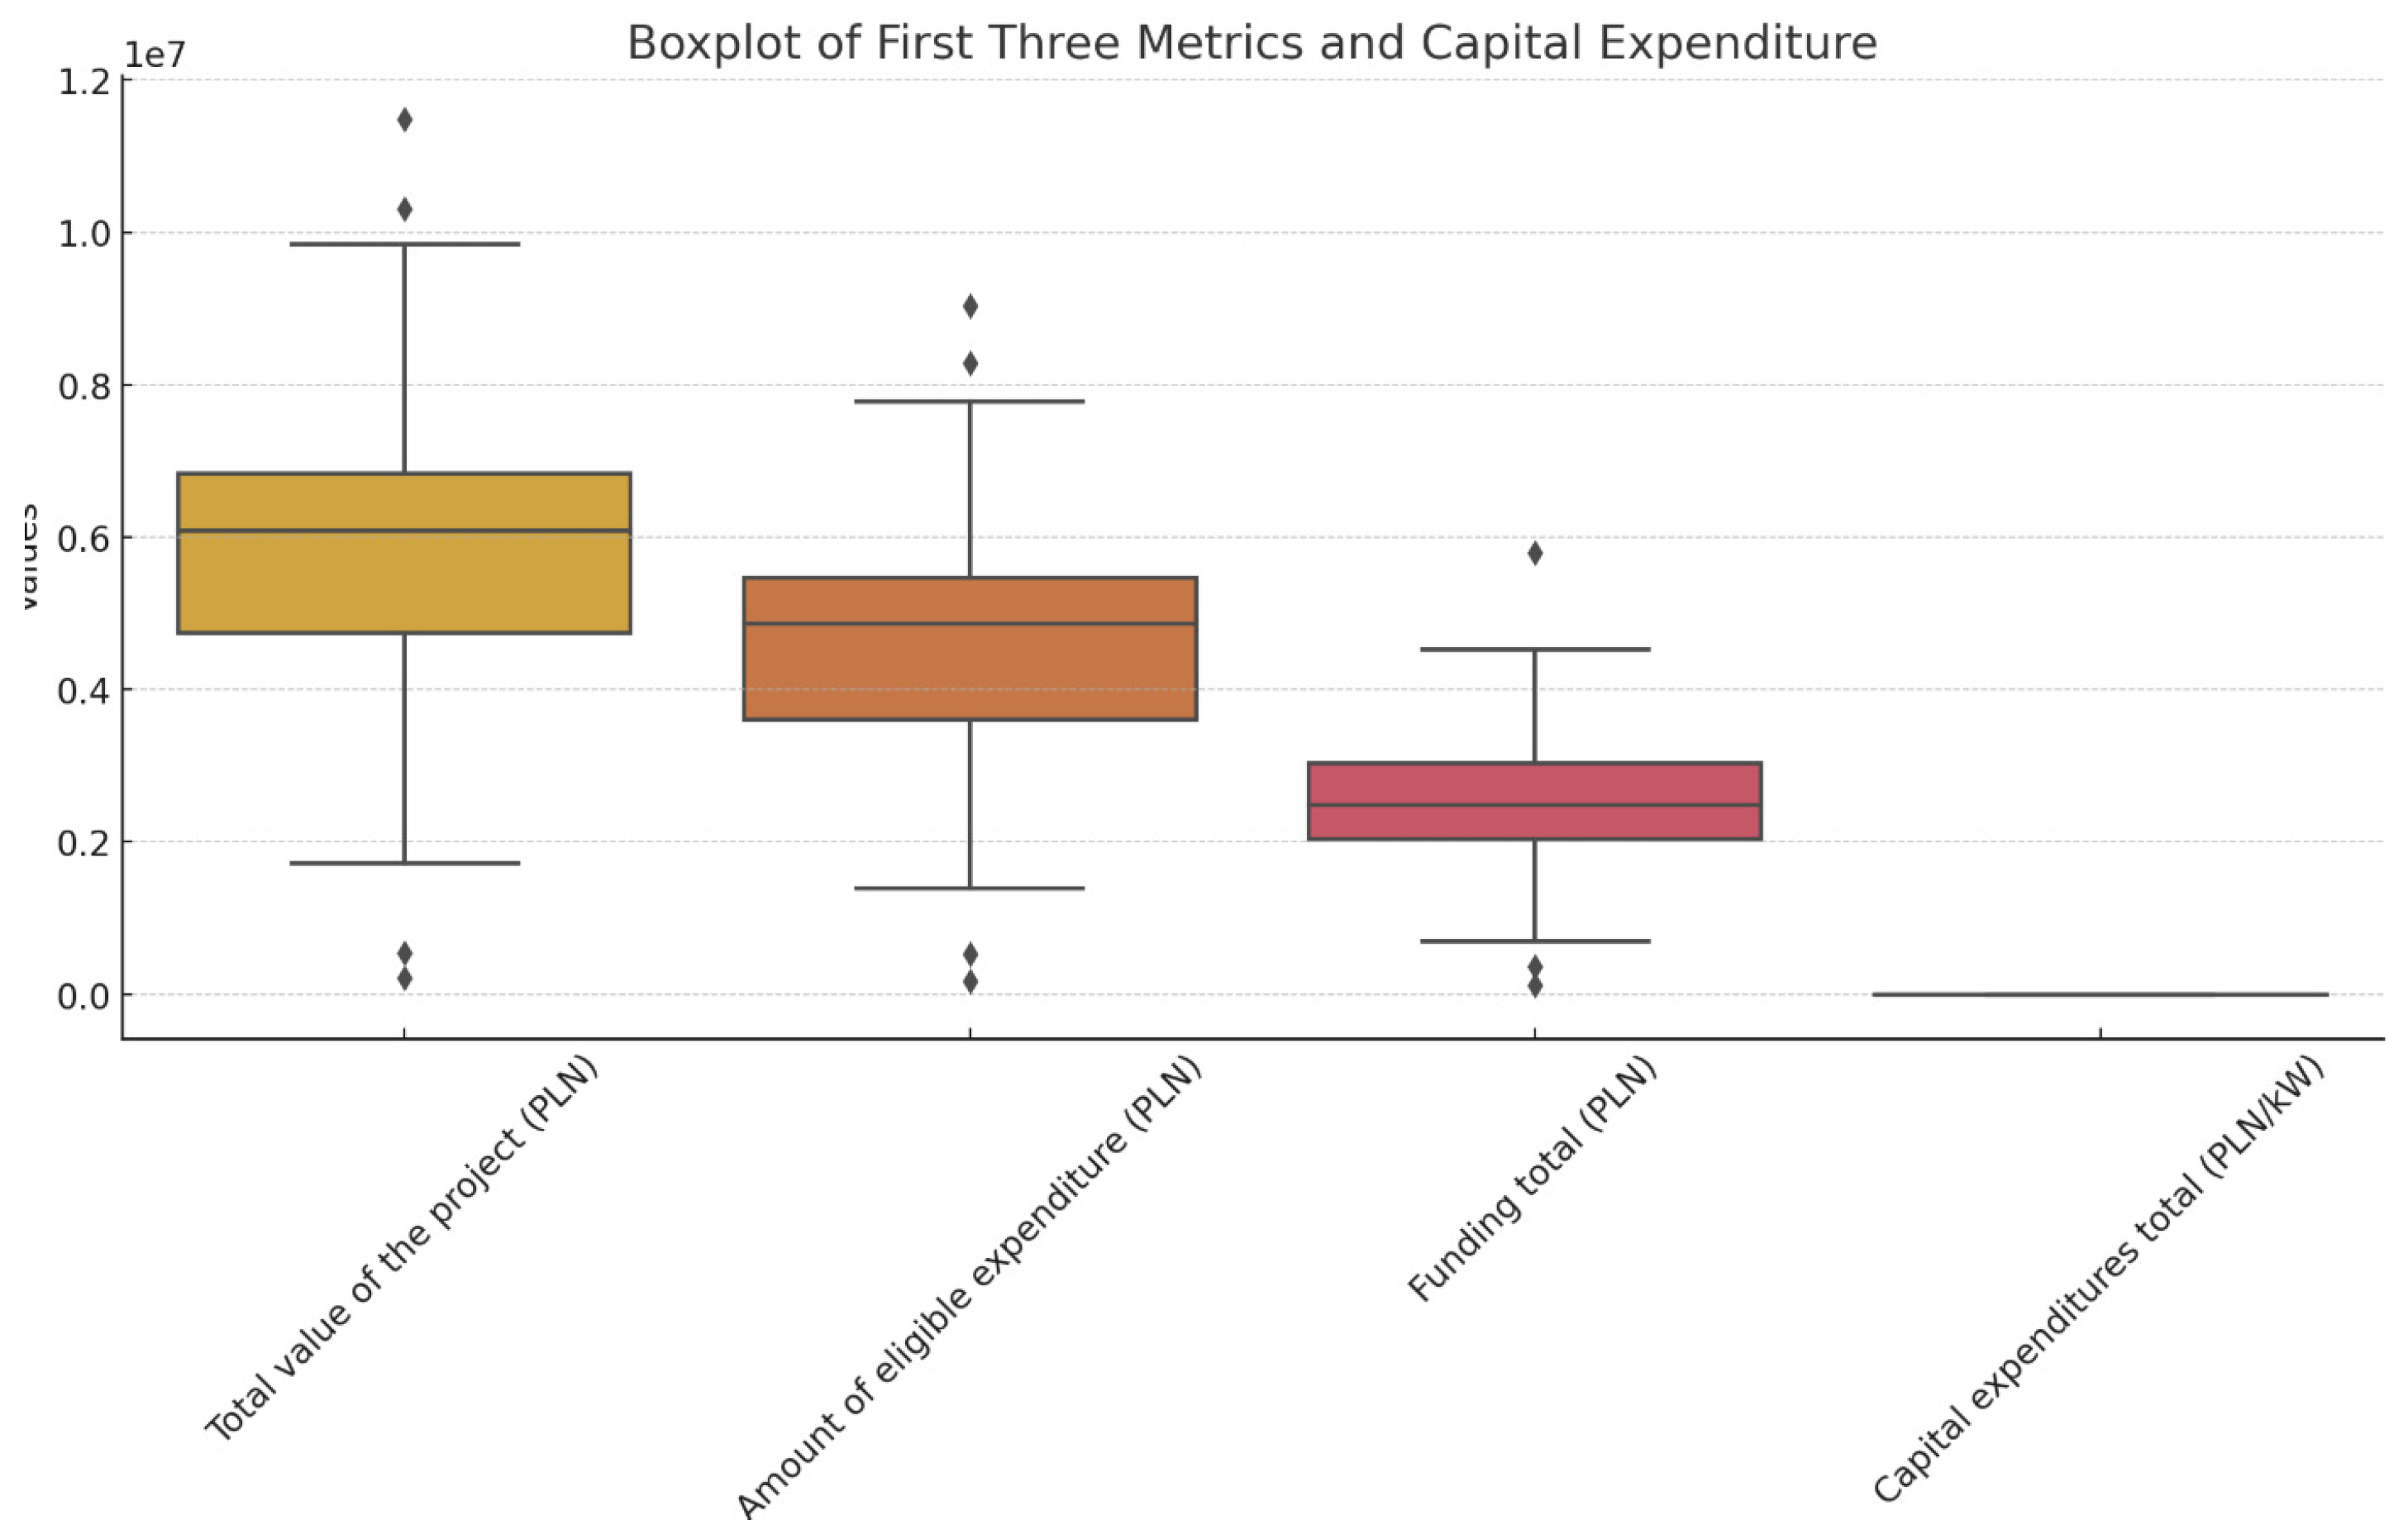
3.1. Capital Expenditures
- buildings and structures (including buildings and premises and civil engineering works), including, but not limited to, construction and erection works, design and cost documents;
- machinery, technical equipment, and tools (including instruments, movable property and equipment);
- means of transport;
- other, i.e., water reclamation, land improvement (enhancement), livestock (core stock), perennial planting, and interest on loans and investment credits during the investment period.
- costs of preparatory work related to the preparation of the project, e.g., preparation of the application for funding, fees associated with the need to obtain the necessary administrative decisions at the stage of project preparation, development of functional-utility programs, construction concept;
- costs of purchasing undeveloped land property above the level of 10% of the value of the total eligible expenses of the project;
- the costs of building electricity connections and grid connection fees.
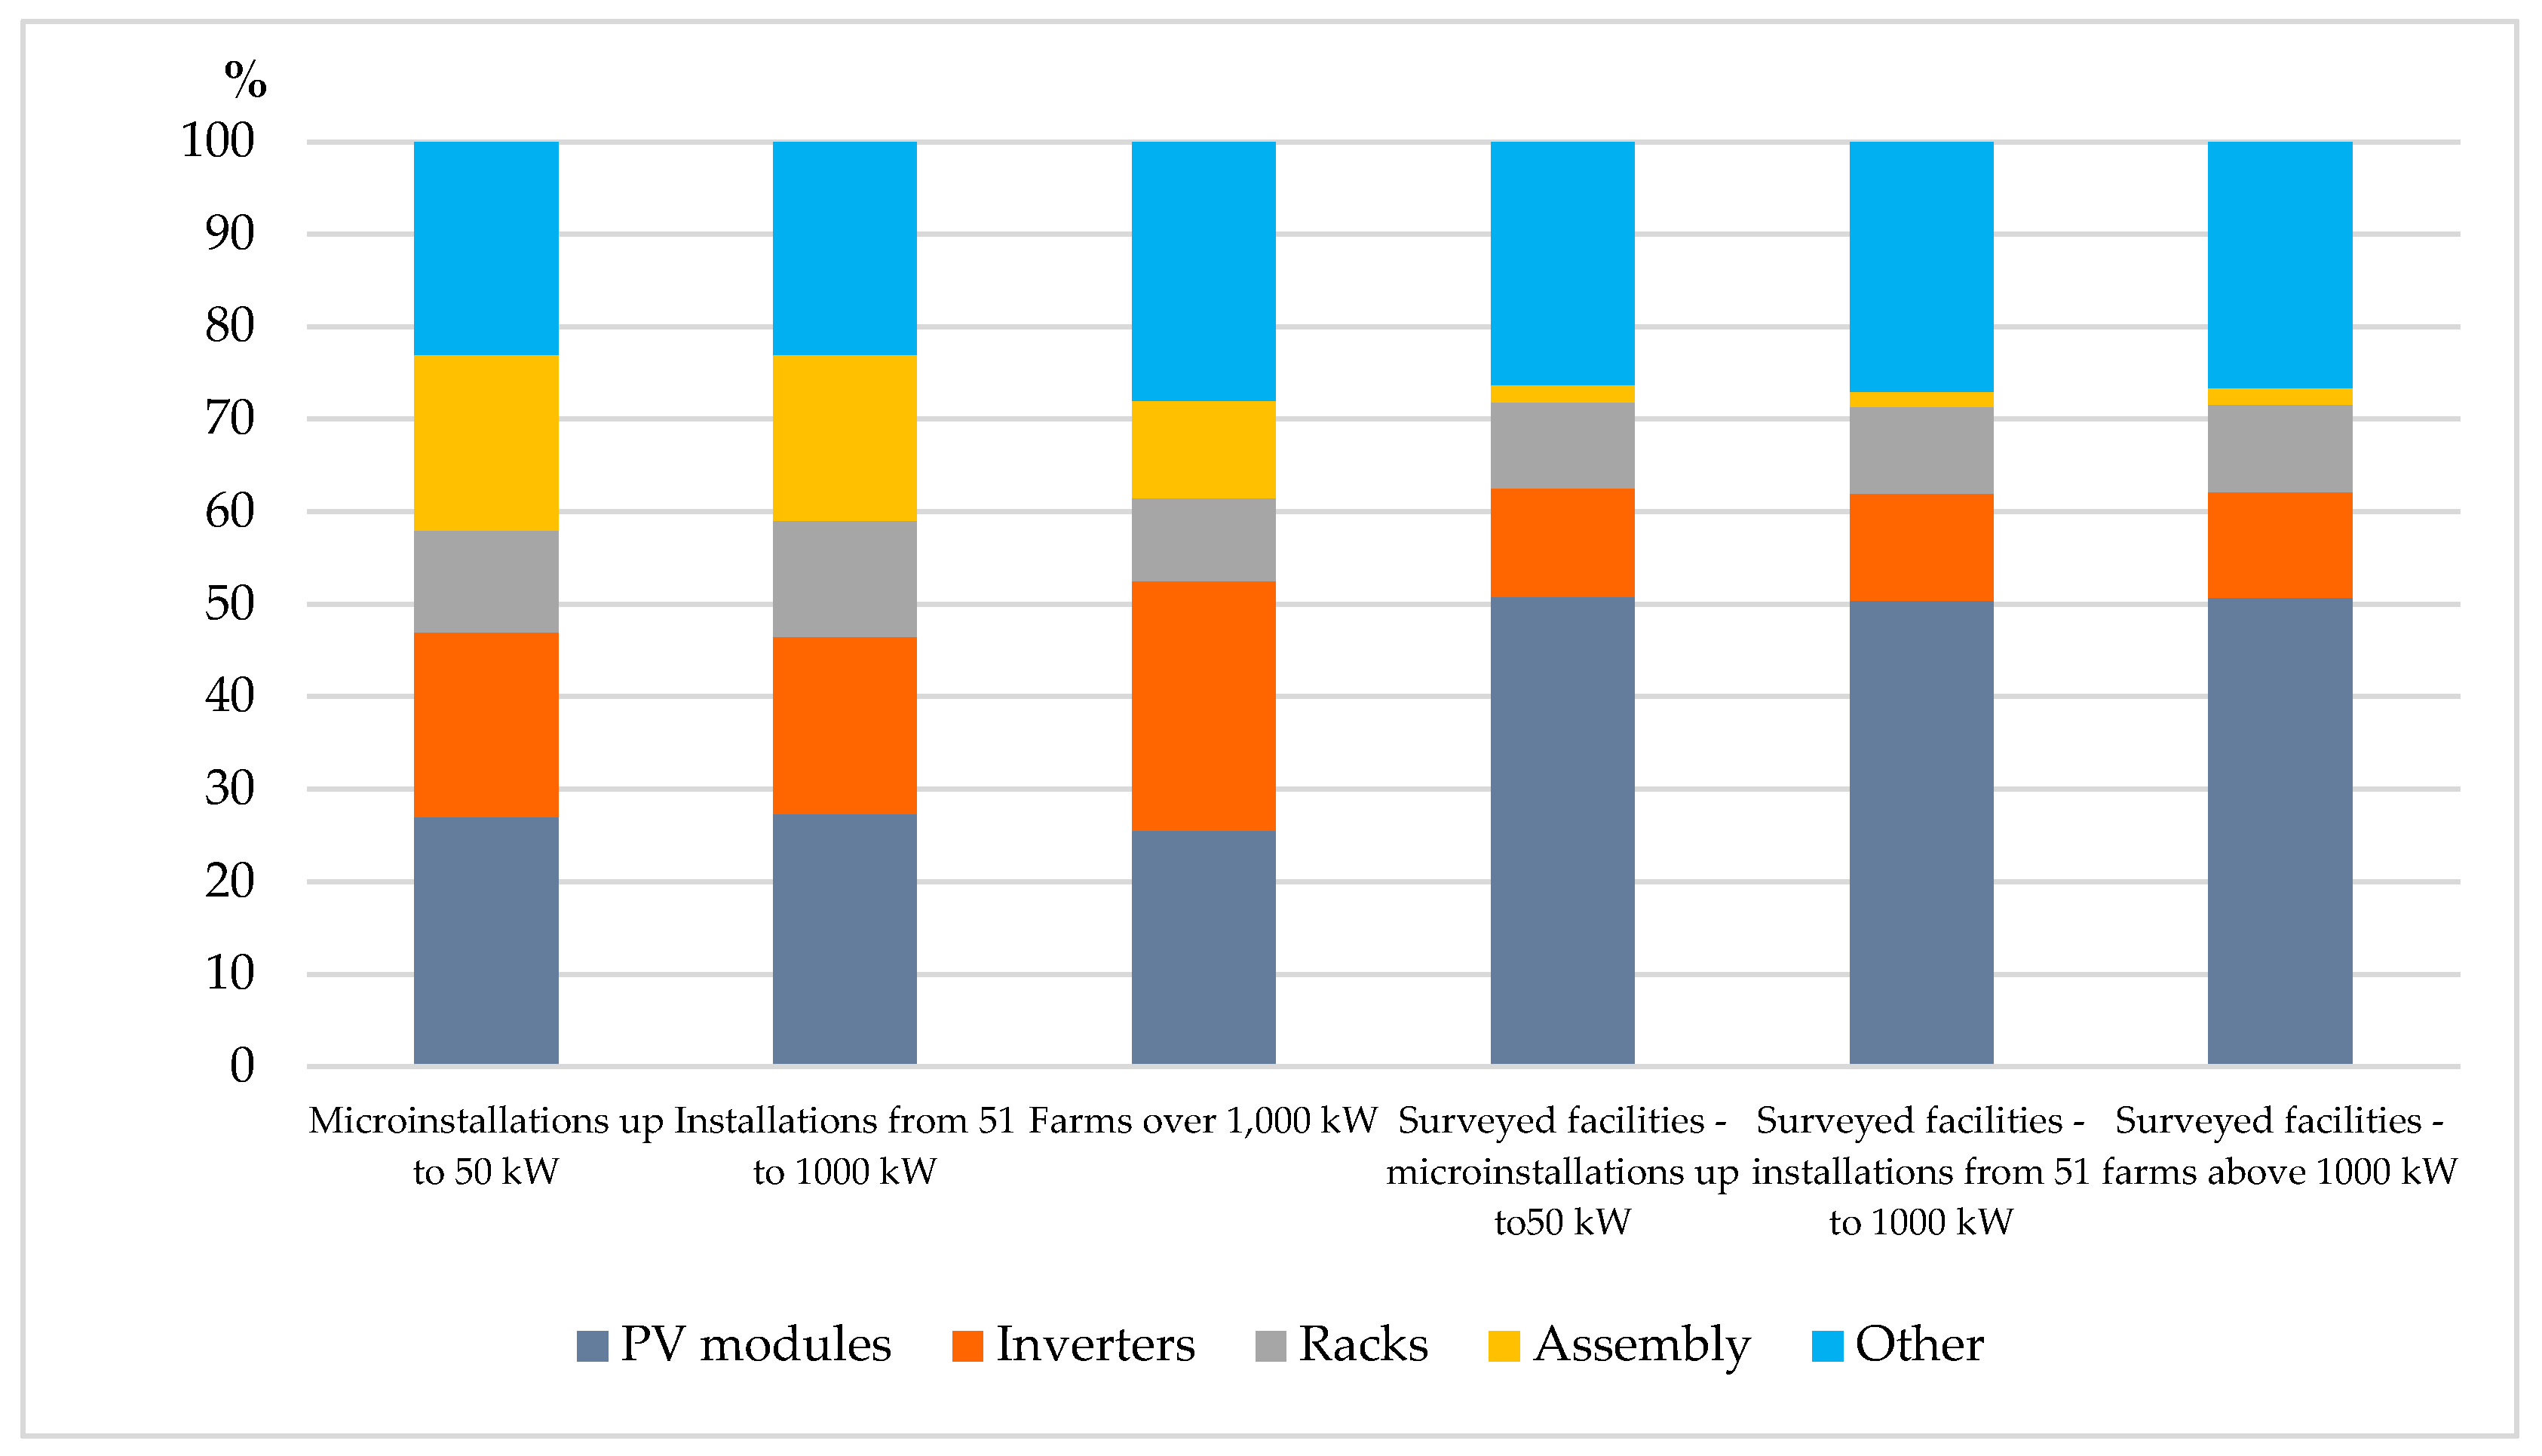
- photovoltaic modules (PV);
- wiring (Cables);
- inverters (Inver.);
- frames (Frame);
- trafostations (Trafo);
- electricity connections and services (Attached.);
- earthworks, fencing (Fence);
- land acquisition (Land);
- investor supervision (Supervision);
- business plans, feasibility studies, project documentation (Studies);
- other costs: surveying work, project promotion, training, consulting services and others (Other).
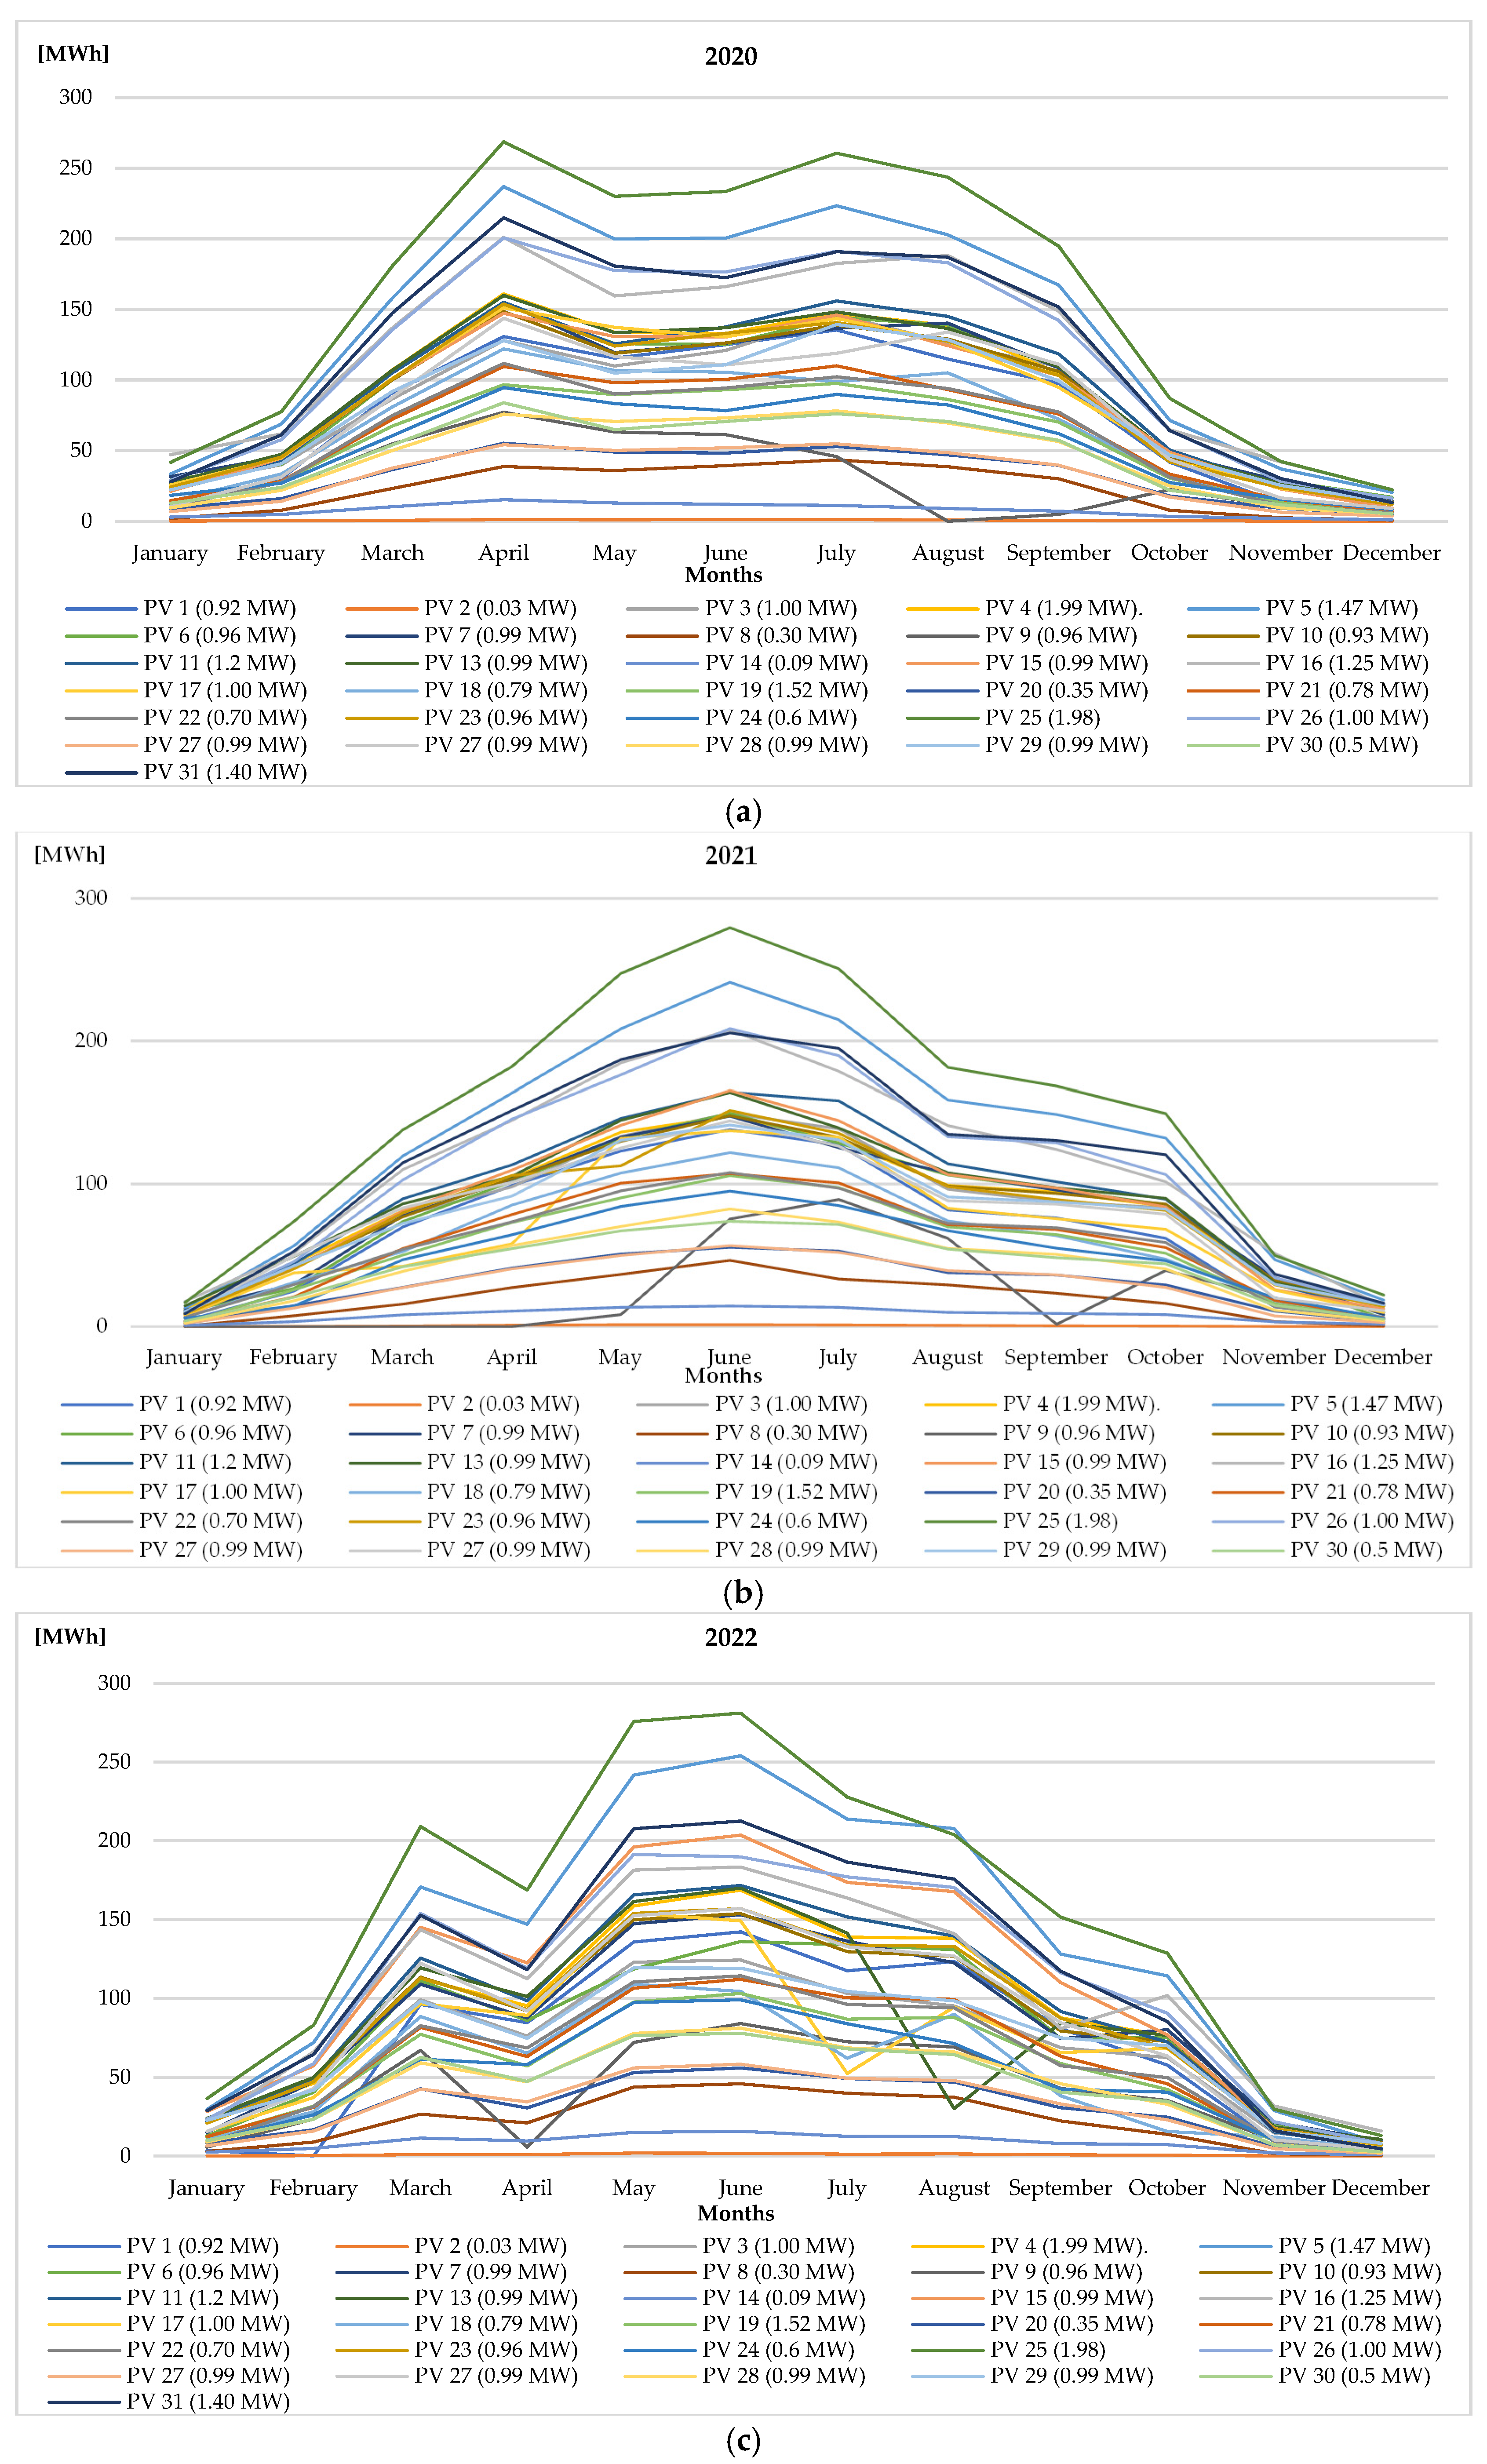
3.2. Production and Revenue
- revenues from the sale of electricity generated in the studied photovoltaic systems and property rights to certificates of origin (COR);
- the value of generated and consumed electricity for investors’ use.
3.3. Operating Costs
- depreciation;
- materials;
- third-party services;
- taxes and other fees;
- salaries;
- insurance;
- other costs.
3.4. Assessment of the Profitability of the Investment Projects Studied
- simple return on investment (ROI);
- simple payback period (SPP);
- net present value of investment (NPV);
- internal rate of return on investment (IRR);
- DPBT discounted payback period;
- averaged unit cost of electricity generation (LCOE).
- based on the forecasts of the Energy Regulatory Office, it was assumed that the average baseline annual increase in the sales price of electricity injected into the distribution system operator’s grid in a non-auction procedure would be 2%/year. The exact rate was assumed for the prices of generated energy, which investors used for their own needs (the reference level was the corresponding average electricity prices in 2021–2022);
- increase in the price of property rights to energy certificates of origin—2%/year of needs (the reference level was the average price in 2021–2022); it was assumed that the period of their granting began on 1 January 2017 and will be completed on 31 December 2031;
- like other technical infrastructure equipment, photovoltaic plants are characterized by gradually decreasing efficiency over time. For the long-term analysis, a constant decline in the level of efficiency of electricity generation for the plants under study was assumed at 0.7% per year starting in 2023. This is the average rate of efficiency decline declared by panel manufacturers. The reference level was the average annual volume of electricity generated in 2017–2022;
- the operation of freestanding photovoltaic power plants involves incurring operating costs, such as, but not limited to: maintenance, purchase of materials, repairs, land lease (optional), accounting services, taxes, insurance, etc. For this group of costs, an annual price increase of 3.03% was assumed (NBP projection data—an average of 3 years 2021–2023);
- preparation of the forecast involves adopting a particular value of the discount rate; based on information collected from investors, its value was set at 3%.
4. Discussion
5. Conclusions
- Due to significant technological advances in the RES industry, resulting in increasingly lower equipment costs and higher energy efficiency, there is growing interest in using solar energy. Observation of the growth rate of this sector shows that it is much faster than assumed in the forecasts of “Poland’s Energy Policy until 2040”. From the estimates made based on the report “Photovoltaic Market in Poland 2023” and assuming that the efficiency of photovoltaic panels will be at the same level as in 2018–2020, the amount of electricity generated by this sector in 2022 will be as much as programmed for 2025;
- As of 31 December 2021, the installed electrical capacity of photovoltaic sources amounted to 7637.70 MW, including 5836.60 MW at prosumers. As recently as 2018, these values were many times lower: 565.56 MW and 275.54 MW, respectively. During the same period, the number of prosumers increased from 51,016 to 845,730. Such a significant development of photovoltaics in 2018–2021 contributed to an unprecedented increase in the share of electricity from this source to its total production, from 0.18% to 2.19%;
- However, such dynamic development of the entire RES sector would not have been possible without allocating public funds for this purpose. These funds were primarily allocated under the “Infrastructure and Environment” operational program, regional operational programs, the Rural Development Program, as well as the National and Provincial Funds for Environmental Protection and Water Management;
- The property rights system is an essential factor affecting investments’ profitability. However, it is imperfect, as producers cannot predict the value of the change in these prices, which involves uncertainty and some risk in managing the investment. These prices have fluctuated over the past decade, reaching values ranging from PLN 22.46 to PLN 300.42;
- In the European Union, energy acquisition from renewable sources increased more than two and a half times between 2000 and 2022. Most energy was generated from photovoltaic installations, solar panels, wind farms, heat pumps, biogas, bioethanol, and biodiesel. The primary factor for such significant growth in the renewable energy sector is the consistent implementation of the EU’s ambitious climate and energy policy;
- Aspects that positively affect the economic efficiency of the investment are the increase in the efficiency of photovoltaic panels and the decrease in their price;
- All the analyses show that the decisive influence on the economic effects of the photovoltaic installations studied was the value of the financial support provided and the scale of the investment project.
Author Contributions
Funding
Data Availability Statement
Conflicts of Interest
Abbreviations
References
- Yergin, D. The New Map. Energy, Climate, and the Clash of Nations; Penguin Books: London, UK, 2021. [Google Scholar]
- Sovacool, B.K.; Valentine, S.V. The National Politics of Nuclear Power: Economics, Security, and Governance; Routledge: New York, NY, USA, 2012. [Google Scholar]
- Bresnahan, T.F.; Ramey, V.A. Segment shifts and capacity utilization in the US automobile industry. Am. Econ. Rev. 1993, 83, 213–218. [Google Scholar]
- FAO. The Impact of Disasters on Agriculture and Food Security 2023—Avoiding and Reducing Losses Through Investment in Resilience, 2021; FAO: Rome, Italy, 2023. [Google Scholar] [CrossRef]
- Newman, R.; Noy, I. The global costs of extreme weather that are attributable to climate change. Nat. Commun. 2023, 14, 6103. [Google Scholar] [CrossRef] [PubMed]
- Stern, N. Stern Review: The Economics of Climate Change; Cambridge University Press: Cambridge, UK, 2006. [Google Scholar]
- Zimniewicz, K. Globalne ocieplenie. Wątpliwy sojusz nauki z polityką, ideologią i biznesem. Ekon. Sr. 2011, 1, 25–33. [Google Scholar]
- Hansen, J.; Sato, M.; Ruedy, R.; Lo, K.; Lea, D.W.; Medina-Elizade, M. Global temperature change. Proc. Natl. Acad. Sci. USA 2006, 103, 14288–14293. [Google Scholar] [CrossRef] [PubMed]
- UN. Transforming Our World: 2030 Agenda for Sustainable Development. Available online: https://www.unic.un.org.pl/files/164/Agenda%202030_pl_2016_ostateczna.pdf (accessed on 7 November 2024).
- Paris Agreement to the United Nations Framework Convention on Climate Change, Dec. 12, 2015, T.I.A.S. No. 16-1104. Available online: https://unfccc.int/sites/default/files/resource/parisagreement_publication.pdf (accessed on 7 November 2024).
- IEA. World Energy Outlook 2022. Available online: https://iea.blob.core.windows.net/assets/830fe099-5530-48f2-a7c1-11f35d510983/WorldEnergyOutlook2022.pdf (accessed on 7 November 2024).
- European Commission. Communication from the Commission to the European Parliament, the Council, the European Economic and Social Committee and the Committee of the Regions. EU Solar Energy Strategy. 2022. Available online: https://eur-lex.europa.eu/legal-content/EN/TXT/HTML/?uri=CELEX:52022DC0221 (accessed on 7 November 2024).
- Odum, H.T. Environmental Accounting: Emergy and Environmental Decision Making; Wiley: New York, NY, USA, 1996. [Google Scholar]
- Weiss, W.; Spörk-Dür, M. Solar Heat Worldwide; Federal Ministry Republic of Austria: Gleisdorf, Austria, 2023. [Google Scholar]
- Energy Institute. Statistical Review of World Energy. Available online: https://www.energyinst.org/__data/assets/pdf_file/0006/1542714/684_EI_Stat_Review_V16_DIGITAL.pdf (accessed on 7 November 2024).
- Eurostat. Energy Balances. Available online: https://ec.europa.eu/eurostat/cache/infographs/energy_balances/enbal.html (accessed on 7 November 2024).
- Ministry of Climate and Environment; Energy Market Agency S.A. Statistics of Polish Electricity Generation. Available online: https://www.are.waw.pl/en/oferta/wydawnictwa#statystyka-elektroenergetyki-polskiej (accessed on 7 November 2024).
- Woś, A.; Zegar, J. Rolnictwo Społecznie Zrównoważone; IERiGŻ: Warsaw, Poland, 2002. [Google Scholar]
- European Commission. Communication from the Commission Energy for the Future: Renewable Sources of Energy. 1998. Available online: https://eur-lex.europa.eu/legal-content/EN/TXT/PDF/?uri=CELEX:51997DC0599 (accessed on 7 November 2024).
- Gradziuk, P.; Gradziuk, B.; Us, A. Tendencje kształtowania się kosztów inwestycyjnych w sektorze fotowoltaicznym. Rocz. Nauk. SERiA 2018, XX, 44–49. [Google Scholar]
- Żylicz, T. Ekonomia wobec wspierania odnawialnych źródeł energii. In Generacja Rozproszona w Nowoczesnej Polityce Energetycznej (Wybrane Problemy i Wyzwania); Rączka, J., Swora, M., Stawiany, W., Eds.; Narodowy Fundusz Ochrony Środowiska i Gospodarki Wodnej: Warsaw, Poland, 2012; pp. 46–50. [Google Scholar] [CrossRef]
- Kulawik, J. Efektywność finansowa w rolnictwie. Istota, pomiar i perspektywy. Zagadnienia Ekon. Rolnej 2008, 2, 33–53. Available online: https://open.icm.edu.pl/handle/123456789/5663 (accessed on 7 November 2024).
- Kozun-Cieślak, G. Efektywność—Rozważania nad istotą i typologią. Kwart. Kol. Ekon.-Społecznego Stud. I Pr. 2013, 4, 13–42. [Google Scholar] [CrossRef]
- Samuelson, P.A.; Nordhaus, W.D. Ekonomia; Wydawnictwo Naukowe PWN: Warsaw, Poland, 1999. [Google Scholar]
- Stoner, J.A.F.; Freeman, R.E.; Gilbert, D.R. Kierowanie; PWE: Warsaw, Poland, 1997. [Google Scholar]
- Dudycz, T.; Tomaszewicz, Ł. Efektywność—Rozważania Nad Istotą i Pomiarem; Wydawnictwo Akademii Ekonomicznej: Wrocław, Poland, 2007. [Google Scholar]
- Debreu, G. The Coefficient of Resource Utilization. Econometrica 1951, 19, 273–292. [Google Scholar] [CrossRef]
- Farrell, M.J. The Measurement of Productive Efficiency. J. R. Stat. Soc. Ser. A 1957, 120, 253–290. [Google Scholar] [CrossRef]
- Kamerschen, D.R.; McKenzie, R.B.; Nardinelli, C. Ekonomia; Fundacja Gospodarcza NSZZ "Solidarność”: Gdańsk, Poland, 1991. [Google Scholar]
- Zieleniewski, J. Organizacja i Zarządzanie; PWN: Warsaw, Poland, 1969. [Google Scholar]
- Rajtar, J. Efektywność gospodarowania. In Encyclopedia Ekonomiczno-Rolnicza; Państwowe Wydawnictwo Rolnicze i Leśne: Warsaw, Poland, 1984. [Google Scholar]
- Kowalski, Z. Kategorie efektywności produkcji [w świetle funkcji produkcji]. Zagadnienia Ekon. Rolnej 1992, 4, 18–31. [Google Scholar]
- Penc, J. Leksykon Biznesu; Placet: Warsaw, Poland, 1997. [Google Scholar]
- Nowak, E. Ocena Efektywności Przedsięwzięć Gospodarczych; Wydawnictwo Akademii Ekonomicznej im. Oskara Langego: Wrocław, Poland, 1998. [Google Scholar]
- Jóźwiak, W. Efektywność gospodarowania w rolnictwie. In Encyklopedia Agrobiznesu; Woś, A., Ed.; Fundacja Innowacja: Warsaw, Poland, 1998. [Google Scholar]
- Sierpińska, M.; Jachna, T. Ocena Przedsiębiorstwa Według Standardów Światowych; PWN: Warsaw, Poland, 2004. [Google Scholar]
- Szymańska, E. Efektywność przedsiębiorstw—Definiowanie i pomiar. Rocz. Nauk. Rol. Ser. G 2010, 97, 152–164. [Google Scholar] [CrossRef]
- Gerlach, J.; Gil, M. Efektywność przedsiębiorstwa w teorii ekonomii—Która z definicji najlepiej oddaje istotę zagadnienia? Zesz. Nauk. Uniw. Szczecińskiego 2018, 2, 13–22. [Google Scholar]
- United Nations Industrial Development Organization. Manual for the Preparation of Industrial Feasibility Studies. Available online: https://www.unido.org/sites/default/files/files/2021-02/manual_for_the_preparation_of_industrial_feasibility_studies.pdf (accessed on 7 November 2024).
- Behrens, W.; Hawranek, P.M. Manual for the Preparation of Industrial Feasibility Studies. Newly Revised and Expanded Edition; United Nations Industrial Development Organization: Vienna, Austria, 1991. [Google Scholar]
- Mikolajuk, H.; Duda, M.; Radović, U.; Skwierz, S.; Lewarski, M.; Kowal, I. Aktualizacja Analizy Porównawczej Kosztów Wytwarzania Energii Elektrycznej w Elektrowniach Jądrowych, Węglowych i Gazowych Oraz Odnawialnych Źródłach Energii; Agencja Rynku Energii S.A.: Warsaw, Poland, 2016. [Google Scholar]
- Sandvall, A.F.; Ahlgren, E.O.; Ekvall, T. Cost-efficiency of urban heating strategies - Modelling scale effects of low-energy building heat supply. Energy Strategy Rev. 2017, 18, 212–223. [Google Scholar] [CrossRef]
- Zarząd Województwa Lubelskiego. Szczegółowy Opis Osi Priorytetowych Regionalnego Programu Operacyjnego Województwa Lubelskiego na lata 2007–2013—Uszczegółowenie Programu. Available online: http://rpo2016.rpo.lubelskie.pl/front/page/get/259/ (accessed on 7 November 2024).
- Urząd Marszałkowski Województwa Lubelskiego w Lublinie. Wojewódzki Program Rozwoju Alternatywnych Źródeł Energii dla Województwa Lubelskiego. Available online: https://umwl.bip.lubelskie.pl/upload/pliki/Zalacznik_do_Uchwaly.pdf (accessed on 7 November 2024).
- Dziennik Ustaw 2009 Nr 19 poz. 100. Ustawa z Dnia 19 Grudnia 20008 r. o Partnerstwie Publiczno-Prywatnym. Available online: https://isap.sejm.gov.pl/isap.nsf/download.xsp/WDU20090190100/U/D20090100Lj.pdf (accessed on 7 November 2024).
- Urząd Marszałkowski Województwa Lubelskiego w Lublinie. Program Rozwoju Odnawialnych Źródeł Energii dla Województwa Lubelskiego. Available online: https://umwl.bip.lubelskie.pl/upload/pliki/Program_rozwoju_OZE__dla_Woj._Lub.zip (accessed on 7 November 2024).
- Kossowski, T. Regionalne programy operacyjne jako czynnik stymulujący wykorzystanie odnawialnych źródeł energii. Rocz. Nauk. Stowarzyszenia Ekon. Rol. I Agrobiznesu 2016, XVIII, 99–104. [Google Scholar]
- Statistics Poland. Zarządzenie Nr 9 Prezesa Głównego Urzędu Statystycznego z Dnia 28 Lutego 1990 r. w Sprawie Zasad Metodycznych Statystyki Inwestycji. Available online: https://sip.lex.pl/akty-prawne/dzienniki-resortowe/zasady-metodyczne-statystyki-inwestycji-34313017 (accessed on 7 November 2024).
- Statistics Poland. Statistical Yearbook of Industry Poland 2023. Available online: https://stat.gov.pl/download/gfx/portalinformacyjny/en/defaultaktualnosci/3328/5/17/1/statistical_yearbook_of_industry_poland_2023.pdf (accessed on 7 November 2024).
- Sejmik Województwa Lubelskiego. Załącznik do Uchwały nr XLIII/633/2022 Sejmiku Województwa Lubelskiego z dnia 19 Grudnia 2022 r. Statut Lubelskiej Agencji Wspierania Przedsiębiorczości w Lublinie. Available online: https://lawplublin.bip.lubelskie.pl/upload/pliki/statut-lubelskiej-agencji-wspierania-przedsiebiorczopsci-w-lublinie-19-grudnia-2022.pdf (accessed on 7 November 2024).
- Urząd Marszałkowski Województwa Lubelskiego w Lublinie. Wytyczne Dotyczące Kwalifikowania Wydatków w Ramach RPO WL na lata 2007–2013. Podręcznik Kwalifikowania Wydatków. Available online: http://rpo2016.rpo.lubelskie.pl/widget/file/get/1428584108204990.pdf/Wytyczne%2Bdotycz%25C4%2585ce%2Bkwalifikowania%2Bwydatk%25C3%25B3w%2Bw%2Bramach%2BRPO%2BWL%2B2007-2013%2B-%2BPodr%25C4%2599cznik%2Bkwalifikowania%2Bwydatk%25C3%25B3w_v11353/ (accessed on 7 November 2024).
- Instytut Energetyki Odnawialnej. Rynek Fotowoltaiki w Polsce 2024; Instytut Energetyki Odnawialnej: Warsaw, Poland, 2024. [Google Scholar]
- Brodzinski, Z.; Brodzinska, K.; Szadziun, M. Photovoltaic Farms-Economic Efficiency of Investments in North-East Poland. Energies 2021, 14, 2087. [Google Scholar] [CrossRef]
- Gradziuk, P.; Gradziuk, B. Renewable Energy Sources as a Development Opportunity for Peripheral Areas. Econ. Reg. Stud. 2020, 13, 184–198. [Google Scholar] [CrossRef]
- Krac, E.; Górecki, K. Wpływ wybranych czynników na produktywność rzeczywistych instalacji fotowoltaicznych. Przegląd Elektrotechniczny 2023, 1, 246–249. [Google Scholar] [CrossRef]
- Gradziuk, P.; Gradziuk, B. An Attempt to Assess the Absorption of Funds from European Funds for the Development of Renewable Energy Sources in the Lublin Voivodeship. Rocz. Nauk. Ekon. Rol. I Rozw. Obsz. Wiej. 2017, 104, 95–105. [Google Scholar] [CrossRef]
- Rogowski, W. Rachunek Efektywności Inwestycji. Wyzwania Teorii i Potrzeby Praktyki; Wydawnictwo Nieoczywiste: Warsaw, Poland, 2022. [Google Scholar]
- Duffie, J.A.; Beckman, W.A. Solar Engineering of Thermal Processes; Chapter 11: Solar Process Economics; Wiley: Hoboken, NJ, USA, 2013. [Google Scholar]
- Gradziuk, P.; Gradziuk, B. Economic profitability of investment in a photovoltaic plant in south-east Poland. Ann. Pol. Assoc. Agric. Agribus. Econ. 2019, XXI, 124–133. [Google Scholar] [CrossRef]
- Klepacka, A.; Pawlik, K. Return on Investment in PV Power Plants Under Changing Support Regimes (Schemes). Probl. Agric. Econ. 2018, 3, 168–191. [Google Scholar] [CrossRef]
- Trela, G. Analiza opłacalności projektów fotowoltaicznych. Czysta Energ. 2013, 3, 26–28. [Google Scholar]
- Schindele, S.; Trommsdorff, M.; Schlaak, A.; Obergfell, T.; Bopp, G.; Reise, C.; Braun, C.; Weselek, A.; Bauerle, A.; Högy, P.; et al. Implementation of agrophotovoltaics: Techno-economic analysis of the price-performance ratio and its policy implications. Appl. Energy 2020, 265, 114737. [Google Scholar] [CrossRef]
- Vartiainen, E.; Masson, G.; Breyer, C.; Moser, D.; Medina, E.R. Impact of weighted average cost of capital, capital expenditure, and other parameters on future utility-scale PV levelized cost of electricity. Prog. Photovolt. Res. Appl. 2020, 28, 439–453. [Google Scholar] [CrossRef]
- Ran, F.; Feldman, D.; Margolis, R.; Woodhouse, M.; Ardani, K.U.S. Solar Photovoltaic System Cost Benchmark: Q1 2017; National Renewable Energy Laboratory: Denver, CO, USA, 2017. [Google Scholar]
- Gembarzewski, O.; Wróbel, K. Porównanie efektywności inwestycyjnych wybranych farm PV w Bułgarii. Annu. Set Environ. Prot. 2016, 18, 1025–1038. [Google Scholar]
- Filipiak, M.; Nawrowski, R.; Kurz, D.; Pierzchała, R. Analiza opłacalności stosowania instalacji fotowoltaicznej we współpracy z magazynem energii dla domu jednorodzinnego. Przegląd Elektrotechniczny 2022, 1, 253–258. [Google Scholar] [CrossRef]
- Bukowski, M.; Majewski, J.; Sobolewska, A.; Stawicka, E.; Suchoń, A. Wybrane Ekonomiczne i Prawne Aspekty Wytwarzania Energii z Instalacji Fotowoltaicznych w Gospodarstwach Rolnych Województwa Mazowieckiego; Wydawnictwo SGGW: Warsaw, Poland, 2022. [Google Scholar]
- Igliński, B.; Piechota, G.; Kiełkowska, U.; Kujawski, W.; Pietrzak, M.B.; Skrzatek, M. The assessment of solar photovoltaic in Poland: The photovoltaics potential, perspectives and development. Clean Technol. Environ. Policy 2023, 25, 281–298. [Google Scholar] [CrossRef]
- Dubel, A.; Trela, M. Financial efficiency analysis of pv plants in Poland under the evolving support scheme. Ekon. I Sr. 2019, 4, 38–55. [Google Scholar] [CrossRef]
- Kwaśniewski, D.; Akdenizb, C.; Durmazc, F.; Kömekçi, F. Economic analysis of the photovoltaic installation use possibilities in farms. Agric. Eng. 2020, 24, 47–60. [Google Scholar] [CrossRef]
- Alashqar, M.; Xue, Y.; Yang, C.; Zhang, X.-P. Comprehensive economic analysis of PV farm—A case study of Alkarsaah PV farm in qatar. Front. Energy Res. 2022, 10, 987773. [Google Scholar] [CrossRef]
- Augustowski, Ł.; Kułyk, P. The Economic Profitability of Photovoltaic Installations in Households in Poland from a New Policy Perspective. Energies 2023, 16, 7595. [Google Scholar] [CrossRef]
- Trypolska, G.; Gradziuk, P.; Semeniuk, A.; Podolets, R.; Diachuk, O. Advancing Heat Pump Adoption in Ukraine’s Low-Carbon Energy Transition. Energies 2024, 17, 6110. [Google Scholar] [CrossRef]
- Gradziuk, P.; Trocewicz, A. Ekonomiczna efektywność zastosowania magazynu energii w prosumenckiej instalacji fotowoltaicznej. Ann. Pol. Assoc. Agric. Agribus. Econ. 2023, XXV, 76–91. [Google Scholar] [CrossRef]
- Olczak, P.; Matuszewska, D.; Lishchenko, A.; Zhydyk, I.; Koval, V.; Iermakova, O. The economic efficiency of photovoltaic energy for energy prosumers. Energy Policy J. 2022, 25, 95–114. [Google Scholar] [CrossRef]


| No. | The Total Value of the Project | Amount of Eligible Expenditure | Funding | Power | Capital Expenditures | Share of Own Funds [%] | Share of Total Subsidies [%] | Share of ROP WL Grants [%] | ||
|---|---|---|---|---|---|---|---|---|---|---|
| Total | WL ROP | Total | Own | |||||||
| [PLN] | MW | PLN/kW | ||||||||
| 1. | 5,839,638.04 | 4,644,540.00 | 2,786,723.99 | 2,368,715.39 | 0.92 | 6347 | 3318 | 52.28% | 47.72% | 40.56% |
| 2. | 209,100.00 | 167,500.00 | 117,250.00 | 99,662.50 | 0.03 | 6970 | 3062 | 43.93% | 56.07% | 47.66% |
| 3. | 7,128,240.87 | 4,998,000.00 | 2,998,799.99 | 2,548,979.98 | 1.00 | 7128 | 4129 | 57.93% | 42.07% | 35.76% |
| 4. | 11,487,661.19 | 9,032,598.83 | 4,516,299.41 | 3,838,854.49 | 1.99 | 5773 | 3503 | 60.69% | 39.31% | 33.42% |
| 5. | 9,839,883.17 | 7,776,431.00 | 4,277,037.04 | 3,635,481.48 | 1.47 | 6694 | 3784 | 56.53% | 43.47% | 36.95% |
| 6. | 6,230,854.71 | 4,946,339.10 | 2,473,169.55 | 2,102,194.11 | 0.96 | 6490 | 3914 | 60.31% | 39.69% | 33.74% |
| 7. | 5,442,690.39 | 4,330,885.00 | 2,598,530.99 | 2,208,751.34 | 0.99 | 5498 | 2873 | 52.26% | 47.74% | 40.58% |
| 8. | 1,717,080.00 | 1,396,000.00 | 697,999.99 | 593,299.99 | 0.30 | 5724 | 3397 | 59.35% | 40.65% | 34.55% |
| 9. | 5,300,576.94 | 4,459,855.52 | 2,229,927.75 | 1,895,438.58 | 0.96 | 5521 | 3199 | 57.93% | 42.07% | 35.76% |
| 10. | 6,197,126.84 | 4,878,000.00 | 2,439,000.00 | 2,073,150.00 | 0.93 | 6664 | 4041 | 60.64% | 39.36% | 33.45% |
| 11. | 6,455,004.83 | 4,981,790.37 | 2,490,895.18 | 2,117,260.90 | 1.20 | 5379 | 3303 | 61.41% | 38.59% | 32.80% |
| 12. | 6,499,848.84 | 3,332,235.56 | 1,666,117.78 | 1,416,200.11 | 0.99 | 6566 | 4883 | 74.37% | 25.63% | 21.79% |
| 13. | 5,712,644.31 | 4,549,413.11 | 2,274,706.53 | 1,933,500.54 | 0.99 | 5770 | 3473 | 60.18% | 39.82% | 33.85% |
| 14. | 537,755.53 | 524,513.20 | 367,159.24 | 312,085.35 | 0.09 | 5975 | 1896 | 31.72% | 68.28% | 58.03% |
| 15. | 6,877,706.54 | 5,510,700.00 | 3,306,420.00 | 2,810,457.00 | 0.99 | 6947 | 3607 | 51.93% | 48.07% | 40.86% |
| 16. | 8,732,726.33 | 6,826,598.78 | 3,413,299.39 | 2,901,304.48 | 1.25 | 6986 | 4256 | 60.91% | 39.09% | 33.22% |
| 17. | 6,075,954.33 | 5,814,931.34 | 2,907,465.66 | 2,471,345.79 | 1.00 | 6076 | 3168 | 52.15% | 47.85% | 40.67% |
| 18. | 4,652,015.26 | 4,490,756.09 | 2,245,378.02 | 1,908,571.31 | 0.79 | 5889 | 3046 | 51.73% | 48.27% | 41.03% |
| 19. | 8,929,384.88 | 6,272,337.50 | 3,136,168.72 | 2,665,743.39 | 1.52 | 5875 | 3811 | 64.88% | 35.12% | 29.85% |
| 20. | 2,290,014.00 | 1,746,669.10 | 873,334.55 | 742,334.36 | 0.35 | 6543 | 4048 | 61.86% | 38.14% | 32.42% |
| 21. | 4,823,857.79 | 3,880,365.60 | 1,940,182.80 | 1,649,155.38 | 0.78 | 6184 | 3697 | 59.78% | 40.22% | 34.19% |
| 22. | 4,290,078.64 | 3,268,480.00 | 2,124,512.00 | 1,805,835.19 | 0.70 | 6129 | 3094 | 50.48% | 49.52% | 42.09% |
| 23. | 5,498,551.93 | 4,968,747.83 | 3,478,123.47 | 2,956,404.94 | 0.96 | 5728 | 2105 | 36.74% | 63.26% | 53.77% |
| 24. | 4,371,298.33 | 2,333,205.34 | 1,633,243.72 | 1,388,257.16 | 0.60 | 7285 | 4563 | 62.64% | 37.36% | 31.76% |
| 25. | 10,313,321.46 | 8,282,090.60 | 5,797,463.40 | 4,927,843.87 | 1.98 | 5209 | 2281 | 43.79% | 56.21% | 47.78% |
| 26. | 4,919,355.00 | 4,871,360.00 | 2,435,680.00 | 2,070,328.00 | 1.00 | 4919 | 2484 | 50.49% | 49.51% | 42.09% |
| 27. | 6,299,814.00 | 5,034,300.00 | 3,020,580.00 | 2,567,493.00 | 0.99 | 6363 | 3312 | 52.05% | 47.95% | 40.76% |
| 28. | 6,090,243.82 | 4,867,724.99 | 2,920,634.97 | 2,482,539.72 | 0.99 | 6152 | 3202 | 52.04% | 47.96% | 40.76% |
| 29. | 6,777,059.67 | 5,435,885.84 | 2,717,942.91 | 2,310,251.46 | 0.99 | 6846 | 4100 | 59.89% | 40.11% | 34.09% |
| 30. | 3,075,983.56 | 2,425,144.11 | 1,212,572.05 | 1,030,686.23 | 0.50 | 6152 | 3727 | 60.58% | 39.42% | 33.51% |
| 31. | 7,639,072.57 | 6,085,694.38 | 3,042,847.19 | 2,586,420.11 | 1.40 | 5456 | 3283 | 60.17% | 39.83% | 33.86% |
| Total | 180,254,543.77 | 142,133,093.19 | 78,139,466.29 | 66,418,546.15 | 29.61 | 6088 | 3449 | 56.65% | 43.35% | 36.85% |
| Specification | Est. | S. E. | t-Val. | R2 | |
|---|---|---|---|---|---|
| (Intercept) | 6557.329 | 252.923 | 25.926 | 0.000 | 0.0891 |
| X | −406.592 | 240.782 | −1.689 | 0.102 |
| No. | PV | Cables | Inver. | Frame | Trafo | Attached. | Fence | Land | Supervision | Study | Other | Total |
|---|---|---|---|---|---|---|---|---|---|---|---|---|
| 1. | 51.65 | 14.38 | 11.44 | 8.61 | 4.87 | 3.18 | 1.92 | 1.46 | 0.77 | 0.81 | 0.90 | 100.00 |
| 2. | 52.01 | 14.16 | 10.70 | 8.92 | 4.96 | 3.58 | 1.93 | 1.29 | 0.83 | 0.84 | 0.77 | 100.00 |
| 3. | 50.35 | 14.95 | 11.42 | 9.00 | 5.15 | 3.77 | 1.58 | 1.30 | 0.78 | 0.85 | 0.86 | 100.00 |
| 4. | 50.37 | 13.80 | 11.93 | 9.21 | 5.17 | 3.46 | 1.73 | 1.51 | 1.04 | 1.04 | 0.74 | 100.00 |
| 5. | 51.97 | 13.51 | 10.82 | 9.40 | 5.15 | 3.36 | 1.84 | 1.33 | 0.93 | 0.85 | 0.82 | 100.00 |
| 6. | 49.45 | 15.38 | 11.11 | 9.59 | 5.16 | 3.27 | 1.92 | 1.11 | 1.00 | 0.77 | 1.23 | 100.00 |
| 7. | 50.94 | 14.30 | 12.27 | 9.67 | 5.01 | 3.35 | 1.30 | 0.00 | 0.91 | 0.91 | 1.35 | 100.00 |
| 8. | 48.90 | 13.95 | 12.21 | 9.47 | 5.04 | 3.59 | 1.74 | 1.56 | 0.99 | 0.88 | 1.66 | 100.00 |
| 9. | 51.50 | 14.09 | 12.09 | 9.75 | 5.12 | 3.26 | 1.25 | 0.00 | 1.09 | 0.81 | 1.05 | 100.00 |
| 10. | 48.78 | 14.98 | 11.02 | 9.29 | 5.32 | 3.68 | 1.95 | 1.90 | 1.01 | 0.84 | 1.23 | 100.00 |
| 11. | 50.74 | 14.23 | 11.96 | 9.83 | 5.18 | 3.26 | 1.30 | 0.00 | 1.08 | 0.93 | 1.49 | 100.00 |
| 12. | 50.41 | 13.72 | 11.37 | 9.32 | 4.93 | 3.76 | 2.18 | 1.66 | 0.97 | 0.94 | 0.74 | 100.00 |
| 13. | 51.80 | 13.70 | 12.13 | 9.36 | 5.03 | 3.26 | 1.34 | 0.00 | 0.97 | 0.87 | 1.55 | 100.00 |
| 14. | 50.19 | 14.06 | 12.29 | 9.11 | 5.07 | 3.06 | 1.73 | 1.55 | 0.93 | 0.83 | 1.18 | 100.00 |
| 15. | 50.73 | 14.82 | 10.94 | 9.09 | 5.10 | 3.60 | 1.80 | 1.19 | 0.98 | 0.94 | 0.82 | 100.00 |
| 16. | 49.87 | 14.98 | 10.86 | 9.02 | 5.01 | 3.70 | 2.08 | 1.59 | 1.04 | 0.88 | 0.97 | 100.00 |
| 17. | 49.35 | 15.28 | 11.99 | 8.98 | 4.94 | 3.27 | 2.03 | 1.62 | 1.00 | 0.98 | 0.55 | 100.00 |
| 18. | 51.62 | 13.57 | 11.10 | 9.24 | 5.06 | 3.19 | 2.06 | 1.19 | 0.95 | 0.83 | 1.20 | 100.00 |
| 19. | 51.58 | 13.62 | 10.72 | 9.25 | 5.11 | 3.06 | 2.28 | 1.33 | 0.98 | 0.82 | 1.25 | 100.00 |
| 20. | 50.44 | 14.48 | 11.40 | 9.42 | 5.10 | 3.59 | 2.02 | 1.04 | 0.92 | 0.92 | 0.68 | 100.00 |
| 21. | 50.45 | 14.55 | 11.79 | 9.18 | 5.06 | 3.07 | 1.61 | 1.59 | 0.97 | 0.89 | 0.84 | 100.00 |
| 22. | 49.91 | 14.74 | 11.91 | 9.28 | 4.91 | 2.93 | 1.83 | 1.43 | 0.98 | 0.84 | 1.23 | 100.00 |
| 23. | 52.20 | 13.94 | 11.62 | 9.41 | 4.86 | 2.99 | 1.55 | 0.00 | 0.99 | 0.87 | 1.57 | 100.00 |
| 24. | 49.72 | 15.01 | 11.32 | 8.86 | 4.90 | 3.52 | 1.99 | 1.99 | 1.01 | 0.96 | 0.71 | 100.00 |
| 25. | 51.12 | 15.12 | 11.73 | 9.86 | 4.88 | 2.76 | 1.34 | 0.00 | 0.96 | 0.88 | 1.35 | 100.00 |
| 26. | 49.57 | 15.56 | 12.19 | 10.16 | 5.06 | 2.82 | 1.20 | 0.00 | 1.00 | 1.14 | 1.29 | 100.00 |
| 27. | 49.01 | 14.96 | 11.82 | 9.57 | 5.11 | 3.12 | 1.96 | 1.60 | 0.94 | 1.23 | 0.67 | 100.00 |
| 28. | 48.24 | 15.66 | 11.87 | 9.81 | 5.20 | 3.07 | 1.95 | 1.25 | 0.94 | 0.98 | 1.02 | 100.00 |
| 29. | 51.42 | 14.61 | 10.84 | 9.17 | 5.16 | 2.82 | 1.82 | 1.12 | 0.67 | 0.99 | 1.38 | 100.00 |
| 30. | 52.35 | 14.14 | 11.86 | 9.82 | 4.87 | 2.91 | 1.95 | 0.00 | 0.63 | 0.77 | 0.68 | 100.00 |
| 31. | 49.59 | 14.57 | 11.52 | 9.70 | 5.38 | 2.93 | 2.09 | 1.62 | 1.05 | 0.78 | 0.75 | 100.00 |
| Total | 50.52 | 14.49 | 11.53 | 9.34 | 5.06 | 3.28 | 1.80 | 1.11 | 0.94 | 0.90 | 1.03 | 100.00 |
| Market Segments | 2016 | 2017 | 2018 | 2019 | 2020 | 2021 | 2022 | 2023 |
|---|---|---|---|---|---|---|---|---|
| Micro-installations up to 50 kW | 6344 | 5951 | 5712 | 5241 | 4719 | 4855 | 4958 | 4707 |
| Installation from 51 to 1000 kW | 5236 | 4819 | 4623 | 4412 | 4129 | 4253 | 3907 | 3735 |
| Farms over 1000 kW | 4768 | 4541 | 4287 | 4011 | 3873 | 3978 | 3387 | 2948 |
| Power | Average | Minimal | Maximum | Median |
|---|---|---|---|---|
| Total | 1040.98 | 783.87 | 1180.11 | 1047.51 |
| Less than 0.1 MW | 1069.72 | 971.22 | 1161.32 | 1052.81 |
| 0.1 to 1 MW | 1036.15 | 783.87 | 1158.09 | 1044.01 |
| above 1 MW | 1049.34 | 937.42 | 1180.11 | 1067.49 |
| No. | Power | Amount of Electricity Generated (MWh) | Amount of Electricity Injected into the Grid (MWh) | Electricity Input to Electricity Produced (%) | Productivity MWh/1MW of Installed Capacity | ||||||||||||||||||||
|---|---|---|---|---|---|---|---|---|---|---|---|---|---|---|---|---|---|---|---|---|---|---|---|---|---|
| MW | 2017 | 2018 | 2019 | 2020 | 2021 | 2022 | 2017 | 2018 | 2019 | 2020 | 2021 | 2022 | 2017 | 2018 | 2019 | 2020 | 2021 | 2022 | 2017 | 2018 | 2019 | 2020 | 2021 | 2022 | |
| 1. | 0.92 | 834.8 | 929.5 | 944.7 | 912.5 | 825.6 | 854.6 | 834.8 | 929.5 | 944.7 | 912.5 | 825.6 | 854.6 | 100.0 | 100.0 | 100.0 | 100.0 | 100.0 | 100.0 | 907 | 1010 | 1027 | 992 | 897 | 929 |
| 2. | 0.03 | 32.2 | 31.1 | 29.9 | 32.1 | 30.6 | 31.1 | 5.2 | 6.3 | 6.3 | 6.7 | 6.8 | 8.7 | 16.1 | 20.3 | 21.1 | 20.9 | 22.2 | 28.0 | 1073 | 1037 | 997 | 1070 | 1020 | 1037 |
| 3. | 1 | 978.1 | 1069.3 | 1003.2 | 977.3 | 961.2 | 838.2 | 978.1 | 1069.3 | 1003.2 | 977.3 | 961.2 | 838.2 | 100.0 | 100.0 | 100.0 | 100.0 | 100.0 | 100.0 | 978 | 1069 | 1003 | 977 | 961 | 838 |
| 4. | 1.99 | 2137.1 | 2348 | 2282.9 | 2311.4 | 2198.7 | 2098.7 | 1007.2 | 1091.6 | 1095.2 | 1080 | 978.6 | 1071.7 | 47.1 | 46.5 | 48.0 | 46.7 | 44.5 | 35.9 | 1074 | 1180 | 1147 | 1162 | 1105 | 1049 |
| 5. | 1.47 | 1501.2 | 1640.3 | 1536.9 | 1619.8 | 1522.9 | 1616.3 | 1501.2 | 1640.3 | 1536.9 | 1619.8 | 1522.9 | 1616.3 | 100.0 | 100.0 | 100.0 | 100.0 | 100.0 | 100.0 | 1021 | 1116 | 1046 | 1102 | 1036 | 1100 |
| 6. | 0.96 | 932.4 | 1080 | 1062.2 | 1059.2 | 950.2 | 946.2 | 932.4 | 1080 | 1062.2 | 1059.2 | 950.2 | 946.2 | 100.0 | 100.0 | 100.0 | 100.0 | 100.0 | 100.0 | 971 | 1125 | 1106 | 1103 | 990 | 986 |
| 7. | 0.99 | 971.3 | 1038.4 | 1066.2 | 1058.8 | 959.5 | 1003.9 | 971.3 | 1038.4 | 1066.2 | 1058.8 | 959.5 | 1003.9 | 100.0 | 100.0 | 100.0 | 100.0 | 100.0 | 100.0 | 981 | 1049 | 1077 | 1069 | 969 | 1014 |
| 8. | 0.3 | 295.2 | 334 | 347.4 | 337.3 | 319.4 | 322.1 | 230.5 | 249.8 | 260.3 | 269.3 | 239.9 | 263.2 | 78.1 | 74.8 | 74.9 | 79.8 | 75.1 | 81.7 | 984 | 1113 | 1158 | 1124 | 1065 | 1074 |
| 9. | 0.96 | 983.5 | 1006.9 | 1073.2 | 1093.1 | 989.4 | 1012.6 | 331.3 | 251.2 | 586.7 | 381.1 | 297.9 | 489.4 | 33.7 | 24.9 | 54.7 | 34.9 | 30.1 | 48.3 | 1024 | 1049 | 1118 | 1139 | 1031 | 1055 |
| 10. | 0.93 | 971.5 | 1060.4 | 1039.9 | 1023.1 | 967.6 | 1013.5 | 971.5 | 1060.4 | 1039.9 | 1023.1 | 967.6 | 1013.5 | 100.0 | 100.0 | 100.0 | 100.0 | 100.0 | 100.0 | 1045 | 1140 | 1118 | 1100 | 1040 | 1090 |
| 11. | 1.2 | 1234.1 | 1287.8 | 1300.9 | 1124.6 | 1188.4 | 1206.3 | 1014.8 | 1117.9 | 1128.9 | 1093.7 | 1068.9 | 1108.2 | 82.2 | 86.8 | 86.8 | 97.3 | 89.9 | 91.9 | 1028 | 1073 | 1084 | 937 | 990 | 1005 |
| 12. | 0.99 | 948.6 | 1111.2 | 949.4 | 933.5 | 923.2 | 1004.1 | 948.6 | 1111.2 | 949.4 | 933.5 | 923.2 | 1004.1 | 100.0 | 100.0 | 100.0 | 100.0 | 100.0 | 100.0 | 958 | 1122 | 959 | 943 | 933 | 1014 |
| 13. | 0.99 | 1017.6 | 1122.1 | 1124.5 | 1093.9 | 1045.3 | 986.7 | 1017.6 | 1122.1 | 1124.5 | 1093.9 | 1045.3 | 986.7 | 100.0 | 100.0 | 100.0 | 100.0 | 100.0 | 100.0 | 1028 | 1133 | 1136 | 1105 | 1056 | 997 |
| 14. | 0.09 | 87.4 | 102.6 | 104.5 | 91.0 | 96.9 | 100.8 | 87.4 | 102.6 | 104.5 | 91.0 | 96.9 | 100.8 | 100.0 | 100.0 | 100.0 | 100.0 | 100.0 | 100.0 | 971 | 1140 | 1161 | 1011 | 1077 | 1120 |
| 15. | 0.99 | 931.2 | 1129.3 | 1119.5 | 1029.4 | 1015.5 | 1305.3 | 931.2 | 1129.3 | 1119.5 | 1029.4 | 1015.5 | 1305.3 | 100.0 | 100.0 | 100.0 | 100.0 | 100.0 | 100.0 | 941 | 1141 | 1131 | 1040 | 1026 | 1318 |
| 16. | 1.25 | 1372.2 | 1452.2 | 1444.3 | 1420.6 | 1327.5 | 1242.9 | 1372.2 | 1452.2 | 1444.3 | 1420.6 | 1327.5 | 1242.9 | 100.0 | 100.0 | 100.0 | 100.0 | 100.0 | 100.0 | 1098 | 1162 | 1155 | 1136 | 1062 | 994 |
| 17. | 1 | 929.1 | 1079.7 | 1081.1 | 1039.5 | 1118.2 | 1092.7 | 929.1 | 1079.7 | 1081.1 | 1039.5 | 810.5 | 846.8 | 100.0 | 100.0 | 100.0 | 100.0 | 72.5 | 77.5 | 929 | 1080 | 1081 | 1040 | 1118 | 1093 |
| 18. | 0.79 | 773.3 | 864.1 | 789.4 | 792.7 | 814.4 | 799.5 | 773.3 | 864.1 | 789.4 | 792.7 | 725.8 | 626.6 | 100.0 | 100.0 | 100.0 | 100.0 | 89.1 | 78.4 | 979 | 1094 | 999 | 1003 | 1031 | 1012 |
| 19. | 1.52 | 1673.1 | 1723.9 | 1672.7 | 1567.2 | 1622.7 | 1554 | 640.2 | 746.9 | 723.7 | 690.7 | 651.7 | 666.8 | 38.3 | 43.3 | 43.3 | 44.1 | 40.2 | 42.9 | 1101 | 1134 | 1100 | 1031 | 1068 | 1022 |
| 20. | 0.35 | 335 | 386.3 | 399.2 | 385 | 362.6 | 365.6 | 335 | 386.3 | 399.2 | 385 | 362.6 | 365.6 | 100.0 | 100.0 | 100.0 | 100.0 | 100.0 | 100.0 | 957 | 1104 | 1141 | 1100 | 1036 | 1045 |
| 21. | 0.78 | 711 | 788.9 | 843.7 | 822.5 | 803.3 | 799.2 | 711 | 788.9 | 607.1 | 757.5 | 685.9 | 728.5 | 100.0 | 100.0 | 72.0 | 92.1 | 85.4 | 91.2 | 912 | 1011 | 1082 | 1054 | 1030 | 1025 |
| 22. | 0.7 | 669.6 | 763.3 | 737.8 | 730.3 | 683.6 | 725.3 | 669.6 | 763.3 | 737.8 | 730.3 | 683.6 | 725.3 | 100.0 | 100.0 | 100.0 | 100.0 | 100.0 | 100.0 | 957 | 1090 | 1054 | 1043 | 977 | 1036 |
| 23. | 0.96 | 896.7 | 955.1 | 1037.3 | 1030 | 947.1 | 1031.7 | 896.7 | 955.1 | 1037.3 | 1030 | 947.1 | 1031.7 | 100.0 | 100.0 | 100.0 | 100.0 | 100.0 | 100.0 | 934 | 995 | 1081 | 1073 | 987 | 1075 |
| 24. | 0.6 | 478 | 469.9 | 581 | 646.7 | 590 | 603.2 | 478.2 | 469.9 | 58.01 | 646.7 | 590 | 603.2 | 100.0 | 100.0 | 10.0 | 100.0 | 100.0 | 100.0 | 797 | 783 | 968 | 1078 | 983 | 1005 |
| 25. | 1.98 | 1911.6 | 2154.7 | 2140.7 | 2049.9 | 1906 | 1942.8 | 1911.6 | 2154.7 | 2140.7 | 2049.9 | 1906 | 1942.8 | 100.0 | 100.0 | 100.0 | 100.0 | 100.0 | 100.0 | 965 | 1088 | 1081 | 1035 | 963 | 981 |
| 26. | 1 | 1271.2 | 1487.9 | 1427.9 | 1401.8 | 1296.7 | 1320.2 | 1271.2 | 1487.9 | 1427.9 | 1401.8 | 1296.7 | 1320.2 | 100.0 | 100.0 | 100.0 | 100.0 | 100.0 | 100.0 | 1271 | 1488 | 1428 | 1402 | 1297 | 1320 |
| 27. | 0.99 | 1034.9 | 1068 | 999.5 | 1083.6 | 1044 | 1076.2 | 351.3 | 411.7 | 401.3 | 384.4 | 354.9 | 372.3 | 33.9 | 38.5 | 40.2 | 35.5 | 34.0 | 34.6 | 1045 | 1079 | 1010 | 1095 | 1055 | 1087 |
| 28. | 0.99 | 1014.1 | 1076.6 | 1011.1 | 1044.2 | 1085.4 | 1076.2 | 493.3 | 576.3 | 567.4 | 544.5 | 503.6 | 519.5 | 48.6 | 53.5 | 56.1 | 52.1 | 46.4 | 48.3 | 1024 | 1087 | 1021 | 1055 | 1096 | 1087 |
| 29. | 0.99 | 971.3 | 1030.6 | 1090 | 1057.8 | 959.5 | 1000.2 | 907.5 | 1025.2 | 1027.6 | 950.9 | 925.9 | 847.4 | 93.4 | 99.5 | 94.3 | 89.9 | 96.5 | 84.7 | 981 | 1041 | 1101 | 1068 | 969 | 1010 |
| 30. | 0.5 | 503.2 | 579 | 564.1 | 552.3 | 500.2 | 514 | 503.2 | 579 | 564.1 | 552.3 | 500.2 | 514 | 100.0 | 100.0 | 100.0 | 100.0 | 100.0 | 100.0 | 1006 | 1158 | 1128 | 1105 | 1000 | 1028 |
| 31. | 1.4 | 1321.9 | 1493.1 | 1524.7 | 1439.2 | 1354.5 | 1370 | 1321.9 | 1493.1 | 1524.7 | 1439.2 | 1354.5 | 1370 | 100.0 | 100.0 | 100.0 | 100.0 | 100.0 | 100.0 | 944 | 1067 | 1089 | 1028 | 968 | 979 |
| Specification | 2017 | 2018 | 2019 | 2020 | 2021 | 2022 | 2022 (2017 = 100) |
|---|---|---|---|---|---|---|---|
| Energy sales prices (PLN/MWh) | 180 | 199 | 202 | 303 | 279 | 354 | 196.7 |
| Consumed energy prices | 361 | 571 | 731 | 718 | 912 | 1027 | 284.5 |
| own purposes (PLN/MWh) | 39 | 129 | 145 | 137 | 204 | 227 | 582.1 |
| No. | Revenues from the Sale of Electricity | Value of Energy Consumed for Own Use | Revenue from Sales of PMSP | Total Revenues | ||||||||||||||||||||
|---|---|---|---|---|---|---|---|---|---|---|---|---|---|---|---|---|---|---|---|---|---|---|---|---|
| 2017 | 2018 | 2019 | 2020 | 2021 | 2022 | 2017 | 2018 | 2019 | 2020 | 2021 | 2022 | 2017 | 2018 | 2019 | 2020 | 2021 | 2022 | 2017 | 2018 | 2019 | 2020 | 2021 | 2022 | |
| 1. | 150.3 | 185.0 | 190.8 | 276.5 | 230.3 | 302.5 | 0.0 | 0.0 | 0.0 | 0.0 | 0.0 | 0.0 | 26.7 | 113.4 | 137.0 | 126.8 | 171.7 | 206.0 | 177.0 | 298.4 | 327.8 | 403.3 | 402.1 | 508.5 |
| 2. | 0.9 | 1.2 | 1.3 | 2.0 | 1.8 | 3.0 | 9.7 | 14.2 | 17.3 | 18.2 | 21.7 | 23.0 | 0.2 | 0.8 | 0.9 | 0.9 | 1.4 | 2.0 | 10.9 | 16.2 | 19.4 | 21.1 | 24.9 | 28.0 |
| 3. | 176.1 | 212.8 | 202.6 | 296.1 | 268.2 | 296.7 | 0.0 | 0.0 | 0.0 | 0.0 | 0.0 | 0.0 | 38.1 | 137.9 | 145.5 | 133.9 | 196.1 | 190.3 | 214.2 | 350.7 | 348.1 | 430.0 | 464.3 | 487.0 |
| 4. | 187.3 | 227.1 | 220.1 | 317.5 | 270.1 | 373.0 | 407.9 | 717.4 | 868.2 | 884.1 | 1112.7 | 1054.7 | 36.3 | 153.9 | 170.9 | 150.1 | 198.7 | 227.2 | 631.5 | 1098.4 | 1259.2 | 1351.8 | 1581.5 | 1654.9 |
| 5. | 276.2 | 326.4 | 315.1 | 489.2 | 438.6 | 601.3 | 0.0 | 0.0 | 0.0 | 0.0 | 0.0 | 0.0 | 66.1 | 210.0 | 235.1 | 217.1 | 310.7 | 342.7 | 342.3 | 536.4 | 550.2 | 706.2 | 749.3 | 943.9 |
| 6. | 166.0 | 218.2 | 211.4 | 315.6 | 262.3 | 325.5 | 0.0 | 0.0 | 0.0 | 0.0 | 0.0 | 0.0 | 36.4 | 123.1 | 156.1 | 150.4 | 188.1 | 218.6 | 202.3 | 341.3 | 367.5 | 466.0 | 450.4 | 544.1 |
| 7. | 174.8 | 206.6 | 215.4 | 320.8 | 267.7 | 355.4 | 0.0 | 0.0 | 0.0 | 0.0 | 0.0 | 0.0 | 37.9 | 134.0 | 154.6 | 145.1 | 195.7 | 227.9 | 212.7 | 340.6 | 370.0 | 465.9 | 463.4 | 583.3 |
| 8. | 41.5 | 49.7 | 52.6 | 81.6 | 66.9 | 93.2 | 23.4 | 48.1 | 63.7 | 48.8 | 72.5 | 60.5 | 9.0 | 32.2 | 37.7 | 36.9 | 48.9 | 59.7 | 73.8 | 130.0 | 154.0 | 167.3 | 188.4 | 213.4 |
| 9. | 59.6 | 50.0 | 118.5 | 115.5 | 83.1 | 173.2 | 235.4 | 431.5 | 355.6 | 511.2 | 630.6 | 537.3 | 12.9 | 32.4 | 85.1 | 52.2 | 60.8 | 111.1 | 308.0 | 513.9 | 559.2 | 678.9 | 774.5 | 821.7 |
| 10. | 174.9 | 211.0 | 210.1 | 310.0 | 270.0 | 358.8 | 0.0 | 0.0 | 0.0 | 0.0 | 0.0 | 0.0 | 37.9 | 136.8 | 150.8 | 140.2 | 197.4 | 230.1 | 212.8 | 347.8 | 360.8 | 450.2 | 467.4 | 588.8 |
| 11. | 182.7 | 225.8 | 211.1 | 343.4 | 290.7 | 386.8 | 79.2 | 97.0 | 125.7 | 22.2 | 109.0 | 100.7 | 51.8 | 130.8 | 144.5 | 152.0 | 222.3 | 267.1 | 313.6 | 453.6 | 481.3 | 517.6 | 622.1 | 754.6 |
| 12. | 170.7 | 221.1 | 191.8 | 282.9 | 257.6 | 355.5 | 0.0 | 0.0 | 0.0 | 0.0 | 0.0 | 0.0 | 37.0 | 143.3 | 137.7 | 127.9 | 188.3 | 227.9 | 207.7 | 364.5 | 329.4 | 410.7 | 445.9 | 583.4 |
| 13. | 183.2 | 223.3 | 227.1 | 331.5 | 291.6 | 349.3 | 0.0 | 0.0 | 0.0 | 0.0 | 0.0 | 0.0 | 39.7 | 144.8 | 163.1 | 149.9 | 213.2 | 224.0 | 222.9 | 368.0 | 390.2 | 481.3 | 504.9 | 573.3 |
| 14. | 15.7 | 20.4 | 21.1 | 27.6 | 27.0 | 35.7 | 0.0 | 0.0 | 0.0 | 0.0 | 0.0 | 0.0 | 3.4 | 13.2 | 15.2 | 12.5 | 19.8 | 22.9 | 19.1 | 33.7 | 36.3 | 40.0 | 46.8 | 58.6 |
| 15. | 172.3 | 237.2 | 228.4 | 330.4 | 306.7 | 475.1 | 0.0 | 0.0 | 0.0 | 0.0 | 0.0 | 0.0 | 39.1 | 155.8 | 161.2 | 146.2 | 211.2 | 305.4 | 211.4 | 393.0 | 389.6 | 476.6 | 517.9 | 780.6 |
| 16. | 247.0 | 289.0 | 291.7 | 430.4 | 370.4 | 440.0 | 0.0 | 0.0 | 0.0 | 0.0 | 0.0 | 0.0 | 53.5 | 187.3 | 209.4 | 194.6 | 270.8 | 282.1 | 300.5 | 476.3 | 501.2 | 625.1 | 641.2 | 722.1 |
| 17. | 167.2 | 214.9 | 218.4 | 315.0 | 226.1 | 299.8 | 0.0 | 0.0 | 0.0 | 0.0 | 280.6 | 252.5 | 36.2 | 139.3 | 156.8 | 142.4 | 165.3 | 192.2 | 203.5 | 354.1 | 375.1 | 457.4 | 672.1 | 744.5 |
| 18. | 139.2 | 172.0 | 159.5 | 240.2 | 202.5 | 221.8 | 0.0 | 0.0 | 0.0 | 0.0 | 80.8 | 177.6 | 30.2 | 111.5 | 114.5 | 108.6 | 148.1 | 142.2 | 169.4 | 283.4 | 273.9 | 348.8 | 431.4 | 541.6 |
| 19. | 115.2 | 148.6 | 146.2 | 209.3 | 181.8 | 236.0 | 372.9 | 557.9 | 693.7 | 629.3 | 885.6 | 911.2 | 25.0 | 96.4 | 104.9 | 94.6 | 132.9 | 151.4 | 513.1 | 802.9 | 944.8 | 933.2 | 1200.3 | 1298.6 |
| 20. | 60.3 | 76.9 | 80.6 | 116.7 | 101.2 | 129.4 | 0.0 | 0.0 | 0.0 | 0.0 | 0.0 | 0.0 | 13.1 | 49.8 | 57.9 | 52.7 | 74.0 | 83.0 | 73.4 | 126.7 | 138.5 | 169.4 | 175.1 | 212.4 |
| 21. | 123.7 | 148.3 | 120.2 | 233.3 | 200.3 | 254.2 | 0.0 | 0.0 | 173.0 | 46.7 | 107.1 | 72.6 | 22.8 | 111.2 | 91.7 | 97.7 | 138.6 | 154.4 | 146.5 | 259.5 | 384.8 | 377.7 | 445.9 | 481.3 |
| 22. | 121.9 | 146.6 | 150.5 | 213.2 | 187.3 | 255.3 | 0.0 | 0.0 | 0.0 | 0.0 | 0.0 | 0.0 | 25.4 | 97.7 | 102.6 | 104.4 | 131.9 | 163.2 | 147.3 | 244.3 | 253.1 | 317.7 | 319.2 | 418.5 |
| 23. | 161.4 | 190.1 | 209.5 | 312.1 | 264.2 | 365.2 | 0.0 | 0.0 | 0.0 | 0.0 | 0.0 | 0.0 | 35.0 | 123.2 | 150.4 | 141.1 | 193.2 | 234.2 | 196.4 | 313.3 | 359.9 | 453.2 | 457.4 | 599.4 |
| 24. | 86.1 | 93.5 | 11.7 | 196.0 | 164.6 | 213.5 | −0.1 | 0.0 | 382.3 | 0.0 | 0.0 | 0.0 | 18.6 | 60.6 | 8.4 | 88.6 | 120.4 | 136.9 | 104.7 | 154.1 | 402.4 | 284.5 | 285.0 | 350.5 |
| 25. | 342.2 | 435.2 | 445.3 | 610.9 | 522.2 | 703.3 | 0.0 | 0.0 | 0.0 | 0.0 | 0.0 | 0.0 | 76.5 | 293.0 | 314.7 | 272.6 | 392.6 | 435.2 | 418.6 | 728.3 | 759.9 | 883.5 | 914.9 | 1138.5 |
| 26. | 228.8 | 296.1 | 288.4 | 424.7 | 361.8 | 467.4 | 0.0 | 0.0 | 0.0 | 0.0 | 0.0 | 0.0 | 49.6 | 191.9 | 207.0 | 192.0 | 264.5 | 299.7 | 278.4 | 488.0 | 495.5 | 616.8 | 626.3 | 767.0 |
| 27. | 63.2 | 81.9 | 81.1 | 116.5 | 99.0 | 131.8 | 246.8 | 374.7 | 437.3 | 502.0 | 628.5 | 722.9 | 13.7 | 53.1 | 58.2 | 52.7 | 72.4 | 84.5 | 323.7 | 509.8 | 576.5 | 671.2 | 799.9 | 939.2 |
| 28. | 88.8 | 114.7 | 114.6 | 165.0 | 140.5 | 183.9 | 188.0 | 285.7 | 324.3 | 358.8 | 530.6 | 571.7 | 19.2 | 74.3 | 82.3 | 74.6 | 102.7 | 117.9 | 296.0 | 474.7 | 521.2 | 598.4 | 773.8 | 873.6 |
| 29. | 156.1 | 203.0 | 207.6 | 296.7 | 248.1 | 289.8 | 23.0 | 3.1 | 45.6 | 76.8 | 30.6 | 156.9 | 28.1 | 132.3 | 155.2 | 121.7 | 192.6 | 206.8 | 207.3 | 338.3 | 408.4 | 495.2 | 471.4 | 653.5 |
| 30. | 92.6 | 118.7 | 118.5 | 164.6 | 141.1 | 187.1 | 0.0 | 0.0 | 0.0 | 0.0 | 0.0 | 0.0 | 22.1 | 70.1 | 77.8 | 72.4 | 106.0 | 125.4 | 114.7 | 188.8 | 196.3 | 236.9 | 247.1 | 312.5 |
| 31. | 236.6 | 298.6 | 304.9 | 439.0 | 373.8 | 486.4 | 0.0 | 0.0 | 0.0 | 0.0 | 0.0 | 0.0 | 48.9 | 195.6 | 216.5 | 202.9 | 269.5 | 283.6 | 285.5 | 494.2 | 521.4 | 641.9 | 643.4 | 769.9 |
| No. | Depreciation | Materials | Third-Party Services | Taxes and Other Fees | ||||||||||||||||||||
| 2017 | 2018 | 2019 | 2020 | 2021 | 2022 | 2017 | 2018 | 2019 | 2020 | 2021 | 2022 | 2017 | 2018 | 2019 | 2020 | 2021 | 2022 | 2017 | 2018 | 2019 | 2020 | 2021 | 2022 | |
| 1. | 82.4 | 80.5 | 80.9 | 75.2 | 74.7 | 71.4 | 3.6 | 3.2 | 3.0 | 5.3 | 4.3 | 4.3 | 1.0 | 1.1 | 1.5 | 1.5 | 1.7 | 5.0 | 6.2 | 6.0 | 7.0 | 7.5 | 7.7 | 8.0 |
| 2. | 45.4 | 46.4 | 47.5 | 42.4 | 41.8 | 37.5 | 21.6 | 19.3 | 25.4 | 25.3 | 16.4 | 16.5 | 4.9 | 7.2 | 2.3 | 2.5 | 4.5 | 6.7 | 9.2 | 9.4 | 10.7 | 11.1 | 14.4 | 17.0 |
| 3. | 83.4 | 83.4 | 83.1 | 81.3 | 78.2 | 75.4 | 5.5 | 2.7 | 3.1 | 3.2 | 4.1 | 4.2 | 0.8 | 1.0 | 1.3 | 1.2 | 1.4 | 2.2 | 5.2 | 5.5 | 6.1 | 6.5 | 6.7 | 7.6 |
| 4. | 82.4 | 81.1 | 78.4 | 77.1 | 73.8 | 73.2 | 4.9 | 3.0 | 3.0 | 2.6 | 3.2 | 3.7 | 0.8 | 1.1 | 1.6 | 1.7 | 1.9 | 3.5 | 6.0 | 6.1 | 8.1 | 8.1 | 9.0 | 7.9 |
| 5. | 85.5 | 82.8 | 81.5 | 81.5 | 80.3 | 75.4 | 3.2 | 2.7 | 3.7 | 3.9 | 3.3 | 3.7 | 0.8 | 1.0 | 1.4 | 1.2 | 1.6 | 4.2 | s5.4 | 5.4 | 5.8 | 5.4 | 5.7 | 7.1 |
| 6. | 82.7 | 80.5 | 78.6 | 78.5 | 77.2 | 70.9 | 4.1 | 3.4 | 5.0 | 4.8 | 3.9 | 4.8 | 1.0 | 1.1 | 1.5 | 1.3 | 1.6 | 4.8 | 6.0 | 5.8 | 6.7 | 6.1 | 6.9 | 7.7 |
| 7. | 75.6 | 72.7 | 70.7 | 69.2 | 67.6 | 63.5 | 5.1 | 4.3 | 5.8 | 6.2 | 5.8 | 5.5 | 1.4 | 1.6 | 2.1 | 2.2 | 2.5 | 6.1 | 8.8 | 8.4 | 9.4 | 9.5 | 9.9 | 10.8 |
| 8. | 74.8 | 70.7 | 66.9 | 65.8 | 63.3 | 56.2 | 8.2 | 6.5 | 8.5 | 6.7 | 6.6 | 7.0 | 1.3 | 1.9 | 2.5 | 2.3 | 2.9 | 7.2 | 6.9 | 7.6 | 10.1 | 11.9 | 12.4 | 13.7 |
| 9. | 75.4 | 73.1 | 71.3 | 69.3 | 67.9 | 65.3 | 6.1 | 4.4 | 3.8 | 5.3 | 4.9 | 5.5 | 1.4 | 1.7 | 2.2 | 2.2 | 2.2 | 3.6 | 8.3 | 8.4 | 10.2 | 10.1 | 11.7 | 11.3 |
| 10. | 80.7 | 77.6 | 75.3 | 75.6 | 72.4 | 69.4 | 6.3 | 5.1 | 5.1 | 3.8 | 4.1 | 5.5 | 0.9 | 1.2 | 1.6 | 1.5 | 2.0 | 3.4 | 5.9 | 6.5 | 7.9 | 8.0 | 8.5 | 9.4 |
| 11. | 77.0 | 72.1 | 70.7 | 69.9 | 70.2 | 67.4 | 5.6 | 5.5 | 4.5 | 4.7 | 4.8 | 5.3 | 1.3 | 1.4 | 2.2 | 1.9 | 1.7 | 3.6 | 7.8 | 8.5 | 9.4 | 9.9 | 10.5 | 10.2 |
| 12. | 82.9 | 80.4 | 78.8 | 75.8 | 75.0 | 71.8 | 3.9 | 4.7 | 4.9 | 5.5 | 4.9 | 5.3 | 0.9 | 1.1 | 1.6 | 1.7 | 1.8 | 3.2 | 5.6 | 5.3 | 6.8 | 8.0 | 8.5 | 8.7 |
| 13. | 76.3 | 73.1 | 70.0 | 69.1 | 67.3 | 65.6 | 5.3 | 5.8 | 5.8 | 5.0 | 5.2 | 5.9 | 1.3 | 1.5 | 2.2 | 2.3 | 2.4 | 3.6 | 8.5 | 8.0 | 9.8 | 10.4 | 11.3 | 10.8 |
| 14. | 67.2 | 59.9 | 63.0 | 60.6 | 53.3 | 45.8 | 13.1 | 16.2 | 14.1 | 15.2 | 17.1 | 17.1 | 2.2 | 2.2 | 2.6 | 3.4 | 4.0 | 5.1 | 6.9 | 7.0 | 9.7 | 7.3 | 9.7 | 12.8 |
| 15. | 81.7 | 82.2 | 80.7 | 80.0 | 78.4 | 75.5 | 5.8 | 4.6 | 4.5 | 4.2 | 3.9 | 4.4 | 0.9 | 1.0 | 1.4 | 1.5 | 1.8 | 2.6 | 5.7 | 5.2 | 5.8 | 5.8 | 6.4 | 8.0 |
| 16. | 85.3 | 83.1 | 81.2 | 80.8 | 80.1 | 77.2 | 3.2 | 3.9 | 4.0 | 3.8 | 3.5 | 3.9 | 0.9 | 0.9 | 1.2 | 1.3 | 1.6 | 2.7 | 5.3 | 4.8 | 5.8 | 5.5 | 6.0 | 6.3 |
| 17. | 79.1 | 77.1 | 75.1 | 73.8 | 72.6 | 68.9 | 5.7 | 5.2 | 5.0 | 5.4 | 4.6 | 5.1 | 1.1 | 1.2 | 1.8 | 1.9 | 2.2 | 5.2 | 6.6 | 6.4 | 7.1 | 7.3 | 8.8 | 9.2 |
| 18. | 79.0 | 77.8 | 75.4 | 74.3 | 74.8 | 70.4 | 5.1 | 6.1 | 5.9 | 5.1 | 4.5 | 5.1 | 1.2 | 1.2 | 1.4 | 1.5 | 1.9 | 4.5 | 7.3 | 6.1 | 7.1 | 6.6 | 7.2 | 7.3 |
| 19. | 82.1 | 80.9 | 79.9 | 77.6 | 76.7 | 74.5 | 4.5 | 4.0 | 4.0 | 4.0 | 4.0 | 4.2 | 0.9 | 1.1 | 1.4 | 1.5 | 1.7 | 2.7 | 6.2 | 5.7 | 6.3 | 6.5 | 7.9 | 7.9 |
| 20. | 78.0 | 75.0 | 72.1 | 68.4 | 67.9 | 61.4 | 3.4 | 2.5 | 2.4 | 4.5 | 3.0 | 4.0 | 1.4 | 1.5 | 2.0 | 2.0 | 2.5 | 6.0 | 8.4 | 8.1 | 9.4 | 9.9 | 10.9 | 13.1 |
| 21. | 81.2 | 81.2 | 79.5 | 78.4 | 79.0 | 75.2 | 4.9 | 3.8 | 4.6 | 4.1 | 3.3 | 3.8 | 1.0 | 1.2 | 1.4 | 1.5 | 1.7 | 4.6 | 6.4 | 5.8 | 6.2 | 6.6 | 6.5 | 6.7 |
| 22. | 79.7 | 76.1 | 75.2 | 75.9 | 73.8 | 70.4 | 4.6 | 6.5 | 6.3 | 3.9 | 4.8 | 5.7 | 1.2 | 1.2 | 1.6 | 2.0 | 2.3 | 5.0 | 7.4 | 6.3 | 7.1 | 7.3 | 7.4 | 6.1 |
| 23. | 78.2 | 73.4 | 71.2 | 71.4 | 68.2 | 66.1 | 4.1 | 5.7 | 5.7 | 4.5 | 4.8 | 5.0 | 1.3 | 1.5 | 2.1 | 2.5 | 2.6 | 4.3 | 8.1 | 7.7 | 9.0 | 9.2 | 10.8 | 10.1 |
| 24. | 82.5 | 82.3 | 80.4 | 81.3 | 79.2 | 75.6 | 4.4 | 6.1 | 6.0 | 2.8 | 3.4 | 4.0 | 0.9 | 0.8 | 1.2 | 1.6 | 2.0 | 3.8 | 6.0 | 4.3 | 5.2 | 5.8 | 5.4 | 5.6 |
| 25. | 76.4 | 73.9 | 73.6 | 72.5 | 68.5 | 65.3 | 4.5 | 4.4 | 3.5 | 3.1 | 4.0 | 4.4 | 1.4 | 1.5 | 2.0 | 2.1 | 2.4 | 4.4 | 8.8 | 8.2 | 9.5 | 10.2 | 10.2 | 10.5 |
| 26. | 75.0 | 71.4 | 68.2 | 67.0 | 63.5 | 60.3 | 5.5 | 6.2 | 6.3 | 5.0 | 5.6 | 6.0 | 1.4 | 1.6 | 2.2 | 2.8 | 3.2 | 6.0 | 9.3 | 8.5 | 10.6 | 11.4 | 11.8 | 10.4 |
| 27. | 82.0 | 83.1 | 80.5 | 80.4 | 78.3 | 73.6 | 4.5 | 3.2 | 4.8 | 3.9 | 3.5 | 4.0 | 0.9 | 1.2 | 1.4 | 1.5 | 1.8 | 3.0 | 6.2 | 4.8 | 5.8 | 6.1 | 6.3 | 7.6 |
| 28. | 81.9 | 81.1 | 78.6 | 77.9 | 75.0 | 73.9 | 4.3 | 3.5 | 5.0 | 3.4 | 3.6 | 3.6 | 0.9 | 1.1 | 1.5 | 1.6 | 1.8 | 2.9 | 6.4 | 5.9 | 6.5 | 7.6 | 8.6 | 8.4 |
| 29. | 82.3 | 80.3 | 81.7 | 80.8 | 79.5 | 76.7 | 5.6 | 7.3 | 4.5 | 3.8 | 3.5 | 3.9 | 0.8 | 1.1 | 1.3 | 1.4 | 1.8 | 2.4 | 5.7 | 4.5 | 5.6 | 6.0 | 6.6 | 6.5 |
| 30. | 80.0 | 78.0 | 73.3 | 73.1 | 70.2 | 68.3 | 5.3 | 4.6 | 5.7 | 4.6 | 4.7 | 5.4 | 1.0 | 1.2 | 1.6 | 2.2 | 2.7 | 3.1 | 6.6 | 6.5 | 8.3 | 7.5 | 8.8 | 8.9 |
| 31. | 82.4 | 81.2 | 81.0 | 77.6 | 75.1 | 70.2 | 3.4 | 2.0 | 2.0 | 4.0 | 4.7 | 4.8 | 1.0 | 1.1 | 1.6 | 1.6 | 1.6 | 5.8 | 6.7 | 6.5 | 7.3 | 7.4 | 7.2 | 7.1 |
| No. | Salaries | Insurance | Other costs | Total | ||||||||||||||||||||
| 2017 | 2018 | 2019 | 2020 | 2021 | 2022 | 2017 | 2018 | 2019 | 2020 | 2021 | 2022 | 2017 | 2018 | 2019 | 2020 | 2021 | 2022 | 2017 | 2018 | 2019 | 2020 | 2021 | 2022 | |
| 1. | 4.5 | 6.5 | 5.5 | 7.8 | 8.8 | 8.3 | 0.2 | 0.3 | 0.3 | 0.5 | 0.6 | 0.6 | 2.1 | 2.3 | 1.9 | 2.2 | 2.2 | 2.4 | 100.0 | 100.0 | 100.0 | 100.0 | 100.0 | 100.0 |
| 2. | 10.3 | 9.4 | 10.7 | 13.6 | 14.4 | 10.7 | 0.5 | 0.6 | 0.6 | 0.5 | 1.0 | 0.9 | 8.1 | 7.7 | 2.8 | 4.5 | 7.5 | 10.7 | 100.0 | 100.0 | 100.0 | 100.0 | 100.0 | 100.0 |
| 3. | 3.5 | 5.4 | 4.7 | 5.6 | 7.2 | 8.1 | 0.2 | 0.3 | 0.3 | 0.4 | 0.5 | 0.6 | 1.4 | 1.6 | 1.6 | 1.8 | 1.8 | 1.9 | 100.0 | 100.0 | 100.0 | 100.0 | 100.0 | 100.0 |
| 4. | 4.0 | 6.5 | 6.4 | 7.8 | 9.1 | 8.5 | 0.2 | 0.4 | 0.4 | 0.5 | 0.7 | 0.6 | 1.7 | 1.8 | 2.1 | 2.1 | 2.3 | 2.6 | 100.0 | 100.0 | 100.0 | 100.0 | 100.0 | 100.0 |
| 5. | 3.5 | 5.7 | 5.8 | 6.2 | 6.7 | 7.0 | 0.2 | 0.3 | 0.2 | 0.3 | 0.5 | 0.5 | 1.5 | 2.1 | 1.6 | 1.4 | 1.9 | 2.2 | 100.0 | 100.0 | 100.0 | 100.0 | 100.0 | 100.0 |
| 6. | 4.3 | 6.4 | 6.1 | 7.1 | 7.7 | 8.5 | 0.2 | 0.3 | 0.3 | 0.4 | 0.5 | 0.6 | 1.8 | 2.5 | 1.8 | 1.8 | 2.1 | 2.6 | 100.0 | 100.0 | 100.0 | 100.0 | 100.0 | 100.0 |
| 7. | 6.1 | 9.3 | 9.1 | 9.4 | 10.8 | 10.6 | 0.3 | 0.5 | 0.4 | 0.6 | 0.7 | 0.8 | 2.7 | 3.3 | 2.5 | 2.9 | 2.7 | 2.7 | 100.0 | 100.0 | 100.0 | 100.0 | 100.0 | 100.0 |
| 8. | 4.5 | 8.8 | 9.0 | 9.5 | 10.0 | 10.8 | 0.2 | 0.4 | 0.4 | 0.6 | 0.7 | 0.8 | 4.1 | 4.1 | 2.6 | 3.3 | 4.1 | 4.3 | 100.0 | 100.0 | 100.0 | 100.0 | 100.0 | 100.0 |
| 9. | 6.0 | 9.0 | 9.4 | 9.8 | 10.1 | 11.0 | 0.3 | 0.5 | 0.4 | 0.6 | 0.8 | 0.8 | 2.6 | 3.0 | 2.8 | 2.8 | 2.4 | 2.5 | 100.0 | 100.0 | 100.0 | 100.0 | 100.0 | 100.0 |
| 10. | 4.0 | 6.6 | 7.7 | 8.6 | 9.9 | 8.9 | 0.2 | 0.4 | 0.3 | 0.4 | 0.7 | 0.7 | 1.9 | 2.6 | 2.0 | 2.1 | 2.5 | 2.7 | 100.0 | 100.0 | 100.0 | 100.0 | 100.0 | 100.0 |
| 11. | 5.6 | 9.4 | 10.4 | 10.6 | 9.9 | 10.2 | 0.3 | 0.5 | 0.4 | 0.5 | 0.7 | 0.8 | 2.5 | 2.6 | 2.5 | 2.5 | 2.2 | 2.6 | 100.0 | 100.0 | 100.0 | 100.0 | 100.0 | 100.0 |
| 12. | 3.9 | 5.8 | 5.8 | 6.8 | 6.9 | 8.0 | 0.2 | 0.3 | 0.3 | 0.4 | 0.5 | 0.6 | 2.7 | 2.3 | 1.8 | 1.9 | 2.3 | 2.4 | 100.0 | 100.0 | 100.0 | 100.0 | 100.0 | 100.0 |
| 13. | 5.7 | 8.6 | 9.0 | 9.9 | 10.3 | 10.7 | 0.3 | 0.5 | 0.4 | 0.6 | 0.7 | 0.8 | 2.6 | 2.5 | 2.7 | 2.7 | 2.7 | 2.7 | 100.0 | 100.0 | 100.0 | 100.0 | 100.0 | 100.0 |
| 14. | 5.0 | 6.7 | 7.9 | 8.2 | 8.4 | 8.5 | 0.3 | 0.6 | 0.3 | 0.6 | 0.7 | 0.6 | 5.3 | 7.5 | 2.3 | 4.8 | 6.7 | 10.0 | 100.0 | 100.0 | 100.0 | 100.0 | 100.0 | 100.0 |
| 15. | 4.0 | 5.5 | 5.8 | 6.5 | 7.1 | 7.0 | 0.2 | 0.3 | 0.3 | 0.3 | 0.5 | 0.5 | 1.7 | 1.4 | 1.5 | 1.7 | 1.9 | 2.1 | 100.0 | 100.0 | 100.0 | 100.0 | 100.0 | 100.0 |
| 16. | 3.5 | 5.4 | 6.0 | 6.4 | 6.4 | 7.1 | 0.2 | 0.3 | 0.3 | 0.3 | 0.5 | 0.5 | 1.7 | 1.6 | 1.6 | 1.8 | 2.0 | 2.1 | 100.0 | 100.0 | 100.0 | 100.0 | 100.0 | 100.0 |
| 17. | 4.8 | 7.2 | 8.6 | 9.1 | 8.8 | 8.6 | 0.2 | 0.4 | 0.3 | 0.5 | 0.6 | 0.6 | 2.5 | 2.4 | 1.9 | 2.1 | 2.4 | 2.4 | 100.0 | 100.0 | 100.0 | 100.0 | 100.0 | 100.0 |
| 18. | 4.8 | 6.4 | 8.0 | 10.2 | 8.4 | 9.3 | 0.3 | 0.3 | 0.3 | 0.4 | 0.6 | 0.7 | 2.4 | 2.1 | 1.8 | 2.0 | 2.5 | 2.8 | 100.0 | 100.0 | 100.0 | 100.0 | 100.0 | 100.0 |
| 19. | 4.3 | 6.2 | 6.5 | 8.2 | 7.2 | 7.9 | 0.2 | 0.3 | 0.3 | 0.4 | 0.5 | 0.6 | 1.9 | 1.8 | 1.7 | 1.8 | 2.1 | 2.2 | 100.0 | 100.0 | 100.0 | 100.0 | 100.0 | 100.0 |
| 20. | 5.5 | 8.8 | 11.3 | 11.8 | 12.2 | 12.1 | 0.3 | 0.5 | 0.4 | 0.5 | 0.7 | 0.7 | 3.1 | 3.8 | 2.4 | 2.8 | 2.7 | 2.9 | 100.0 | 100.0 | 100.0 | 100.0 | 100.0 | 100.0 |
| 21. | 4.2 | 6.0 | 6.3 | 7.1 | 7.6 | 7.7 | 0.2 | 0.3 | 0.3 | 0.4 | 0.5 | 0.5 | 2.0 | 1.6 | 1.7 | 1.9 | 1.4 | 1.6 | 100.0 | 100.0 | 100.0 | 100.0 | 100.0 | 100.0 |
| 22. | 4.7 | 7.4 | 7.6 | 8.3 | 8.6 | 9.5 | 0.2 | 0.4 | 0.3 | 0.4 | 0.6 | 0.6 | 2.1 | 2.1 | 1.9 | 2.2 | 2.5 | 2.7 | 100.0 | 100.0 | 100.0 | 100.0 | 100.0 | 100.0 |
| 23. | 5.6 | 8.5 | 9.2 | 9.4 | 10.3 | 11.1 | 0.2 | 0.4 | 0.4 | 0.5 | 0.7 | 0.7 | 2.5 | 2.8 | 2.4 | 2.5 | 2.5 | 2.9 | 100.0 | 100.0 | 100.0 | 100.0 | 100.0 | 100.0 |
| 24. | 3.9 | 4.7 | 5.6 | 6.4 | 7.4 | 8.1 | 0.2 | 0.2 | 0.2 | 0.3 | 0.5 | 0.5 | 2.1 | 1.6 | 1.4 | 1.8 | 2.2 | 2.4 | 100.0 | 100.0 | 100.0 | 100.0 | 100.0 | 100.0 |
| 25. | 6.0 | 8.9 | 8.5 | 8.8 | 11.1 | 11.4 | 0.3 | 0.5 | 0.4 | 0.6 | 0.8 | 0.7 | 2.6 | 2.6 | 2.6 | 2.8 | 3.0 | 3.3 | 100.0 | 100.0 | 100.0 | 100.0 | 100.0 | 100.0 |
| 26. | 6.2 | 9.2 | 9.5 | 9.9 | 11.7 | 11.8 | 0.3 | 0.5 | 0.5 | 0.6 | 0.8 | 0.7 | 2.3 | 2.6 | 2.8 | 3.2 | 3.4 | 4.8 | 100.0 | 100.0 | 100.0 | 100.0 | 100.0 | 100.0 |
| 27. | 4.4 | 5.4 | 5.7 | 5.8 | 7.4 | 8.7 | 0.2 | 0.3 | 0.3 | 0.4 | 0.5 | 0.5 | 1.9 | 2.0 | 1.6 | 2.0 | 2.3 | 2.6 | 100.0 | 100.0 | 100.0 | 100.0 | 100.0 | 100.0 |
| 28. | 4.5 | 6.2 | 6.3 | 7.0 | 8.2 | 8.2 | 0.2 | 0.3 | 0.3 | 0.4 | 0.5 | 0.5 | 1.8 | 1.9 | 1.8 | 2.1 | 2.3 | 2.5 | 100.0 | 100.0 | 100.0 | 100.0 | 100.0 | 100.0 |
| 29. | 3.7 | 4.7 | 5.2 | 5.8 | 6.1 | 7.7 | 0.2 | 0.3 | 0.2 | 0.3 | 0.5 | 0.6 | 1.8 | 1.8 | 1.5 | 1.9 | 2.0 | 2.2 | 100.0 | 100.0 | 100.0 | 100.0 | 100.0 | 100.0 |
| 30. | 5.0 | 7.5 | 8.7 | 9.6 | 10.1 | 10.3 | 0.2 | 0.4 | 0.4 | 0.5 | 0.6 | 0.7 | 1.9 | 1.8 | 2.1 | 2.5 | 2.9 | 3.4 | 100.0 | 100.0 | 100.0 | 100.0 | 100.0 | 100.0 |
| 31. | 4.6 | 7.0 | 5.9 | 7.1 | 9.0 | 9.6 | 0.2 | 0.4 | 0.3 | 0.5 | 0.6 | 0.7 | 1.8 | 1.8 | 1.9 | 1.9 | 1.8 | 1.7 | 100.0 | 100.0 | 100.0 | 100.0 | 100.0 | 100.0 |
| Specification | 2017 | 2018 | 2019 | 2020 | 2021 | 2022 |
|---|---|---|---|---|---|---|
| Lignite-fired utility power plants | 133.5 | 120.7 | 243.5 | 165.0 | 145.2 | 158.7 |
| Hard coal-fired utility power plants | 155.3 | 203.9 | 203.3 | 215.1 | 218.6 | 351.8 |
| Thermal coal-fired combined heat and power plants | 137.2 | 160.4 | 163.9 | 191.5 | 180.9 | 280.7 |
| Gas-fired combined heat and power plants | 219.4 | 213.5 | 215.4 | 167.6 | 200.3 | 602.6 |
| Commercial biomass/biogas power plants and combined heat and power plants | 417.4 | 284.8 | 345.6 | 329.9 | 301.3 | 616.1 |
| Hydroelectric power plants—natural tributary | 110.3 | 98.1 | 146.8 | 137.3 | 138.9 | 244.9 |
| Wind power plants * | 197.7 | 114.7 | 131.0 | 154.7 | 184.7 | 193.2 |
| Photovoltaic power plants * | - | - | - | - | - | 172.0 |
| Results based on surveyed photovoltaic installations without subsidies | ||||||
| Total | 301.5 | 281.5 | 290.5 | 300.4 | 332.7 | 339.7 |
| Less than 0.1 MW | 422.2 | 403.9 | 385.4 | 431.4 | 473.7 | 525.4 |
| 0.1 to 1 MW | 314.5 | 291.0 | 300.1 | 307.7 | 330.6 | 349.5 |
| Above 1 MW | 278.8 | 264.1 | 273.0 | 286.5 | 335.1 | 320.1 |
| Results based on surveyed photovoltaic installations with subsidies | ||||||
| Total | 196.4 | 185.8 | 193.8 | 201.9 | 226.5 | 238.4 |
| Less than 0.1 MW | 260.0 | 258.8 | 241.1 | 273.8 | 321.6 | 378.3 |
| 0.1 to 1 MW | 204.0 | 191.2 | 199.6 | 206.1 | 224.1 | 245.9 |
| Above 1 MW | 183.1 | 175.9 | 183.4 | 194.0 | 229.7 | 223.4 |
| No. | Without Subsidies | With the Grant | ||||||||||
|---|---|---|---|---|---|---|---|---|---|---|---|---|
| ROI | SPP | NPV | IRR | DPBT | LCOE | ROI | SPP | NPV | IRR | DPBT | LCOE | |
| % | Years | PLN Thousands | % | Years | PLN/MWh | % | Years | PLN Thousands | % | Years | PLN/MWh | |
| 1. | 7.0 | 14.3 | −29.7 | 3.5 | 25.1 | 242.0 | 13.3 | 7.5 | 2757.0 | 2.7 | 13.1 | 164.3 |
| 2. | 5.6 | 17.7 | −40.9 | 3.6 | 31.1 | 490.8 | 12.9 | 7.8 | 76.4 | 2.6 | 13.6 | 400.2 |
| 3. | 5.6 | 18.0 | −1470.5 | 4.1 | 31.5 | 274.3 | 9.6 | 10.4 | 1528.3 | 3.7 | 18.2 | 191.6 |
| 4. | 13.2 | 7.6 | 10,146.8 | 2.2 | 13.3 | 187.5 | 21.8 | 4.6 | 14,663.1 | 2.0 | 8.1 | 136.6 |
| 5. | 8.2 | 12.2 | 1683.7 | 2.9 | 21.3 | 205.3 | 14.5 | 6.9 | 5960.7 | 2.4 | 12.1 | 141.3 |
| 6. | 7.0 | 14.2 | 29.8 | 3.4 | 24.9 | 232.5 | 11.7 | 8.6 | 2503.0 | 2.9 | 15.0 | 170.7 |
| 7. | 8.2 | 12.2 | 909.7 | 2.8 | 21.4 | 220.9 | 15.7 | 6.4 | 3508.2 | 2.5 | 11.2 | 158.8 |
| 8. | 9.1 | 11.0 | 509.0 | 2.9 | 19.3 | 246.9 | 15.3 | 6.5 | 1207.0 | 2.8 | 11.4 | 195.0 |
| 9. | 13.5 | 7.4 | 4864.1 | 2.4 | 13.0 | 207.3 | 23.2 | 4.3 | 7094.0 | 2.3 | 7.6 | 154.5 |
| 10. | 7.6 | 13.2 | 492.4 | 3.1 | 23.2 | 226.0 | 12.5 | 8.0 | 2931.4 | 2.9 | 14.0 | 168.1 |
| 11. | 9.6 | 10.4 | 2364.2 | 2.9 | 18.3 | 204.9 | 15.6 | 6.4 | 4855.1 | 2.5 | 11.2 | 155.5 |
| 12. | 7.2 | 13.8 | 206.5 | 3.3 | 24.2 | 231.3 | 9.7 | 10.3 | 1872.6 | 2.9 | 18.0 | 191.1 |
| 13. | 7.8 | 12.8 | 651.5 | 3.1 | 22.4 | 224.3 | 13.0 | 7.7 | 2926.2 | 2.6 | 13.5 | 170.0 |
| 14. | 5.5 | 18.2 | −116.5 | 3.8 | 31.9 | 310.6 | 17.3 | 5.8 | 250.7 | 3.4 | 10.1 | 222.2 |
| 15. | 9.8 | 10.2 | 2692.5 | 2.9 | 18.0 | 184.8 | 18.8 | 5.3 | 5998.9 | 2.6 | 9.3 | 121.2 |
| 16. | 7.2 | 14.0 | 169.9 | 3.2 | 24.5 | 223.7 | 11.7 | 8.5 | 3583.2 | 2.3 | 14.9 | 159.4 |
| 17. | 10.2 | 9.8 | 2728.7 | 2.7 | 17.3 | 208.9 | 19.5 | 5.1 | 5636.2 | 2.3 | 9.0 | 144.4 |
| 18. | 9.7 | 10.3 | 1775.5 | 2.9 | 18.1 | 211.5 | 18.7 | 5.3 | 4020.9 | 2.4 | 9.4 | 144.1 |
| 19. | 13.4 | 7.5 | 8067.4 | 2.3 | 13.1 | 193.5 | 20.6 | 4.9 | 11,203.6 | 2.2 | 8.5 | 145.7 |
| 20. | 6.5 | 15.4 | −166.3 | 3.6 | 27.0 | 263.0 | 10.5 | 9.5 | 707.0 | 3.2 | 16.7 | 205.8 |
| 21. | 8.7 | 11.5 | 1144.6 | 3.2 | 20.2 | 204.2 | 14.5 | 6.9 | 3084.8 | 2.5 | 12.1 | 145.7 |
| 22. | 7.9 | 12.7 | 537.7 | 3.5 | 22.2 | 216.0 | 15.6 | 6.4 | 2662.2 | 2.7 | 11.2 | 145.5 |
| 23. | 8.6 | 11.7 | 1220.2 | 2.9 | 20.5 | 211.2 | 23.3 | 4.3 | 4698.3 | 2.4 | 7.5 | 129.2 |
| 24. | 6.8 | 14.8 | −163.3 | 3.8 | 26.0 | 247.1 | 10.8 | 9.3 | 1469.9 | 3.2 | 16.3 | 180.9 |
| 25. | 8.8 | 11.4 | 2581.7 | 2.7 | 20.0 | 207.9 | 20.0 | 5.0 | 8379.2 | 2.4 | 8.8 | 136.9 |
| 26. | 12.8 | 7.8 | 4088.1 | 2.6 | 13.7 | 159.7 | 25.4 | 3.9 | 6523.8 | 2.6 | 6.9 | 115.8 |
| 27. | 13.5 | 7.4 | 5815.0 | 2.5 | 13.0 | 202.8 | 25.9 | 3.9 | 8835.6 | 2.4 | 6.8 | 134.9 |
| 28. | 12.9 | 7.8 | 5110.5 | 2.7 | 13.6 | 196.1 | 24.8 | 4.0 | 8031.1 | 2.4 | 7.1 | 130.5 |
| 29. | 8.3 | 12.0 | 1243.5 | 3.2 | 21.1 | 222.7 | 13.9 | 7.2 | 3961.4 | 2.7 | 12.7 | 157.6 |
| 30. | 8.1 | 12.3 | 491.5 | 3.6 | 21.6 | 223.1 | 13.4 | 7.4 | 1704.1 | 3.2 | 13.1 | 167.0 |
| 31. | 8.4 | 11.9 | 1480.2 | 3.2 | 20.9 | 200.4 | 13.9 | 7.2 | 4523.0 | 2.4 | 12.6 | 147.5 |
| Power | Without Subsidies | With the Grant | ||||||||||
|---|---|---|---|---|---|---|---|---|---|---|---|---|
| ROI | SPP | NPV | IRR | DPBT | LCOE | ROI | SPP | NPV | IRR | DPBT | LCOE | |
| % | Years | PLN Thousands | % | Years | PLN/MWh | % | Years | PLN Thousands | % | Years | PLN/MWh | |
| Total | 8.9 | 12.0 | 1904 | 3.1 | 21 | 228.4 | 16.4 | 6.6 | 4424 | 2.6 | 11.6 | 165.5 |
| Less than 0.1 MW | 5.6 | 18.0 | −79 | 3.7 | 32 | 400.7 | 15.1 | 6.8 | 163.6 | 3.0 | 11.9 | 311.2 |
| 0.1 to 1 MW | 8.9 | 11.8 | 1486 | 3.1 | 20.8 | 220.8 | 16.3 | 6.7 | 3803 | 2.7 | 11.8 | 158.5 |
| Above 1 MW | 9.8 | 10.7 | 3764 | 2.8 | 18.8 | 203.3 | 16.9 | 6.2 | 7595 | 2.3 | 10.9 | 146.1 |
| No. | Conservative | Base | Optimistic | |||||||||||||||||||||
|---|---|---|---|---|---|---|---|---|---|---|---|---|---|---|---|---|---|---|---|---|---|---|---|---|
| Without Subsidies | With Subsidy | Without Subsidies | With Subsidy | Without Subsidies | With Subsidy | |||||||||||||||||||
| NPV | IRR | DBPT | LCOE | NPV | IRR | DBPT | LCOE | NPV | IRR | DBPT | LCOE | NPV | IRR | DBPT | LCOE | NPV | IRR | DBPT | LCOE | NPV | IRR | DBPT | LCOE | |
| 1. | −1004.0 | 5.2 | 30.2 | 291.3 | 1782.7 | 3.3 | 15.8 | 197.8 | −29.7 | 3.5 | 25.1 | 242.0 | 2757.0 | 2.7 | 13.1 | 164.3 | 1153.6 | 3.5 | 20.9 | 201.4 | 3940.3 | 2.9 | 10.9 | 136.7 |
| 2. | −69.1 | 4.0 | 37.3 | 590.7 | 48.2 | 3.7 | 16.4 | 481.6 | −40.9 | 3.6 | 31.1 | 490.8 | 76.4 | 3.6 | 13.6 | 400.2 | −6.6 | 3.6 | 25.8 | 408.5 | 110.7 | 3.7 | 11.3 | 333.0 |
| 3. | −2419.3 | 6.8 | 37.8 | 330.2 | 579.5 | 3.4 | 21.9 | 230.7 | −1470.5 | 4.1 | 31.5 | 274.3 | 1528.3 | 2.7 | 18.2 | 191.6 | −318.3 | 4.1 | 26.2 | 228.3 | 2680.5 | 3.1 | 15.2 | 159.5 |
| 4. | 6518.8 | 2.8 | 15.9 | 225.7 | 11,035.1 | 2.6 | 9.7 | 164.4 | 10,146.8 | 2.2 | 13.3 | 187.5 | 14,663.1 | 1.9 | 8.1 | 136.6 | 14,553.0 | 2.2 | 11.0 | 156.1 | 19,069.3 | 1.8 | 6.7 | 113.7 |
| 5. | −248.8 | 4.7 | 25.6 | 247.1 | 4028.2 | 2.8 | 14.5 | 170.0 | 1683.7 | 2.9 | 21.3 | 205.3 | 5960.7 | 2.2 | 12.1 | 141.3 | 4030.6 | 2.9 | 17.7 | 170.9 | 8307.6 | 2.1 | 10.0 | 117.6 |
| 6. | −1020.1 | 5.3 | 29.9 | 279.9 | 1453.1 | 3.5 | 18.0 | 205.4 | 29.8 | 3.4 | 24.9 | 232.5 | 2503.0 | 2.6 | 15.0 | 170.7 | 1304.9 | 3.4 | 20.7 | 193.5 | 3778.1 | 2.4 | 12.5 | 142.1 |
| 7. | −155.5 | 4.3 | 25.7 | 265.9 | 2443.0 | 3.2 | 13.4 | 191.2 | 909.7 | 2.8 | 21.4 | 220.9 | 3508.2 | 2.4 | 11.2 | 158.8 | 2203.5 | 2.8 | 17.8 | 183.8 | 4802.0 | 2.6 | 9.3 | 132.2 |
| 8. | 135.7 | 3.6 | 23.2 | 297.2 | 833.7 | 3.3 | 13.8 | 234.7 | 509.0 | 2.9 | 19.3 | 246.9 | 1207.0 | 2.8 | 11.4 | 195.0 | 962.4 | 2.9 | 16.0 | 205.5 | 1660.4 | 3.4 | 9.5 | 162.3 |
| 9. | 3159.5 | 7.2 | 15.7 | 249.5 | 5389.4 | 2.9 | 9.1 | 186.0 | 4864.1 | 2.4 | 13.0 | 207.3 | 7094.0 | 2.3 | 7.6 | 154.5 | 6934.3 | 2.4 | 10.8 | 172.5 | 9164.2 | 2.0 | 6.3 | 128.6 |
| 10. | −629.4 | 5.9 | 27.8 | 272.0 | 1809.6 | 3.1 | 16.9 | 202.4 | 492.4 | 3.1 | 23.2 | 226.0 | 2931.4 | 2.9 | 14.0 | 168.1 | 1854.8 | 3.1 | 19.2 | 188.1 | 4293.8 | 2.3 | 11.7 | 139.9 |
| 11. | 885.3 | 4.0 | 22.0 | 246.7 | 3376.2 | 2.9 | 13.5 | 187.1 | 2364.2 | 2.9 | 18.3 | 204.9 | 4855.1 | 2.5 | 11.2 | 155.5 | 4160.4 | 2.9 | 15.2 | 170.6 | 6651.3 | 2.1 | 9.3 | 129.4 |
| 12. | −918.1 | 5.3 | 29.1 | 278.4 | 748.0 | 3.4 | 21.6 | 230.0 | 206.5 | 3.3 | 24.2 | 231.3 | 1872.6 | 2.9 | 18.0 | 191.1 | 1572.4 | 3.3 | 20.1 | 192.5 | 3238.5 | 2.5 | 15.0 | 159.1 |
| 13. | −415.8 | 5.1 | 27.0 | 270.0 | 1858.9 | 3.1 | 16.2 | 204.6 | 651.5 | 3.1 | 22.4 | 224.3 | 2926.2 | 2.6 | 13.5 | 170.0 | 1947.6 | 3.1 | 18.6 | 186.7 | 4222.3 | 2.3 | 11.2 | 141.5 |
| 14. | −187.1 | 4.7 | 38.3 | 373.8 | 180.1 | 3.6 | 12.2 | 267.5 | −116.5 | 3.8 | 31.9 | 310.6 | 250.7 | 3.7 | 10.1 | 222.2 | −30.6 | 3.8 | 26.5 | 258.5 | 336.6 | 3.8 | 8.4 | 185.0 |
| 15. | 1087.6 | 4.1 | 21.6 | 222.4 | 4394.0 | 2.6 | 11.2 | 145.9 | 2692.5 | 2.9 | 18.0 | 184.8 | 5998.9 | 2.6 | 9.3 | 121.2 | 4641.6 | 2.9 | 14.9 | 153.8 | 7948.0 | 2.2 | 7.8 | 100.9 |
| 16. | −1323.1 | 6.3 | 29.5 | 269.2 | 2090.2 | 2.9 | 17.9 | 191.9 | 169.9 | 3.2 | 24.5 | 223.7 | 3583.2 | 2.4 | 14.9 | 159.4 | 1983.0 | 3.2 | 20.4 | 186.2 | 5396.3 | 2.4 | 12.4 | 132.7 |
| 17. | 1252.2 | 3.6 | 20.7 | 251.4 | 4159.7 | 2.5 | 10.8 | 173.8 | 2728.7 | 2.7 | 17.3 | 208.9 | 5636.2 | 2.3 | 9.0 | 144.4 | 4521.9 | 2.7 | 14.3 | 173.8 | 7429.4 | 2.1 | 7.5 | 120.2 |
| 18. | 697.6 | 4.1 | 21.7 | 254.6 | 2943.0 | 2.9 | 11.2 | 173.5 | 1775.5 | 2.9 | 18.1 | 211.5 | 4020.9 | 2.4 | 9.4 | 144.1 | 3084.5 | 2.9 | 15.0 | 176.1 | 5329.9 | 2.2 | 7.8 | 120.0 |
| 19. | 5217.1 | 3.1 | 15.8 | 232.9 | 8353.3 | 2.3 | 10.2 | 175.3 | 8067.4 | 2.3 | 13.1 | 193.5 | 11,203.6 | 2.0 | 8.5 | 145.7 | 11,529.0 | 2.3 | 10.9 | 161.1 | 14,665.2 | 1.8 | 7.1 | 121.2 |
| 20. | −522.4 | 5.3 | 32.4 | 316.5 | 350.9 | 3.7 | 20.0 | 247.7 | −166.3 | 3.6 | 27.0 | 263.0 | 707.0 | 2.2 | 16.7 | 205.8 | 266.3 | 3.6 | 22.4 | 218.9 | 1139.6 | 3.2 | 13.9 | 171.3 |
| 21. | 143.7 | 4.5 | 24.3 | 245.8 | 2083.9 | 3.2 | 14.5 | 175.4 | 1144.6 | 3.2 | 20.2 | 204.2 | 3084.8 | 2.9 | 12.1 | 145.7 | 2360.1 | 3.2 | 16.8 | 169.9 | 4300.3 | 2.6 | 10.0 | 121.3 |
| 22. | −271.9 | 4.9 | 26.7 | 260.0 | 1852.6 | 3.3 | 13.5 | 175.1 | 537.7 | 3.5 | 22.2 | 216.0 | 2662.2 | 3.0 | 11.2 | 145.5 | 1521.0 | 3.5 | 18.5 | 179.8 | 3645.5 | 2.7 | 9.3 | 121.1 |
| 23. | 93.5 | 4.7 | 24.6 | 254.2 | 3571.6 | 2.8 | 9.0 | 155.5 | 1220.2 | 2.9 | 20.5 | 211.2 | 4698.3 | 2.4 | 7.5 | 129.2 | 2588.6 | 2.9 | 17.0 | 175.8 | 6066.7 | 2.2 | 6.2 | 107.5 |
| 24. | −869.0 | 5.9 | 31.2 | 297.5 | 764.2 | 3.2 | 19.5 | 217.7 | −163.3 | 3.8 | 26.0 | 247.1 | 1469.9 | 3.2 | 16.3 | 180.9 | 693.7 | 3.8 | 21.6 | 205.7 | 2326.9 | 2.8 | 13.5 | 150.6 |
| 25. | 419.2 | 4.3 | 24.0 | 250.3 | 6216.7 | 2.7 | 10.5 | 164.8 | 2581.7 | 2.7 | 20.0 | 207.9 | 8379.2 | 2.1 | 8.8 | 136.9 | 5207.9 | 2.7 | 16.6 | 173.1 | 11,005.4 | 2. | 7.3 | 113.9 |
| 26. | 2577.6 | 3.5 | 16.4 | 192.2 | 5013.3 | 2.8 | 8.3 | 139.3 | 4088.1 | 2.6 | 13.7 | 159.7 | 6523.8 | 2.2 | 6.9 | 115.8 | 5922.6 | 2.6 | 11.3 | 132.9 | 8358.3 | 2.1 | 5.7 | 96.3 |
| 27. | 3783.4 | 3.3 | 15.6 | 244.1 | 6804.0 | 2.5 | 8.1 | 162.4 | 5815.0 | 2.5 | 13.0 | 202.8 | 8835.6 | 2.0 | 6.8 | 134.9 | 8282.4 | 2.5 | 10.8 | 168.8 | 11,303.0 | 1.9 | 5.6 | 112.3 |
| 28. | 3232.2 | 3.5 | 16.3 | 236.1 | 6152.8 | 2.5 | 8.5 | 157.1 | 5110.5 | 2.7 | 13.6 | 196.1 | 8031.1 | 2.1 | 7.1 | 130.5 | 7391.7 | 2.7 | 11.3 | 163.2 | 10,312.3 | 1.9 | 5.9 | 108.6 |
| 29. | −101.5 | 5.4 | 25.4 | 268.0 | 2616.4 | 3.1 | 15.2 | 189.7 | 1243.5 | 3.2 | 21.1 | 222.7 | 3961.4 | 2.7 | 12.7 | 157.6 | 2877.1 | 3.2 | 17.5 | 185.3 | 5595.0 | 2.5 | 10.5 | 131.2 |
| 30. | −106.8 | 5.5 | 25.9 | 268.5 | 1105.8 | 3.4 | 15.7 | 201.0 | 491.5 | 3.6 | 21.6 | 223.1 | 1704.1 | 3.2 | 13.1 | 167.0 | 1218.0 | 3.6 | 17.9 | 185.7 | 2430.6 | 2.7 | 10.8 | 139.0 |
| 31. | −49.1 | 5.1 | 25.2 | 241.2 | 2993.7 | 2.9 | 15.1 | 177.5 | 1480.2 | 3.2 | 20.9 | 200.4 | 4523.0 | 2.5 | 12.6 | 147.5 | 3337.5 | 3.2 | 17.4 | 166.8 | 6380.3 | 2.4 | 10.5 | 122.7 |
| NPV | IRR | DBPT | LCOE | ||
| Conservative | min | 48.2 | 45,294.0 | 9.0 | 139.3 |
| average | 609.4 | 42,472.2 | 32,268.8 | 274.9 | |
| max | 11,035.1 | 45,537.0 | 45,556.0 | 481.6 | |
| Base | min | 76.4 | 2.0 | 9.0 | 115.8 |
| average | 4424.4 | 41,020.0 | 39,539.6 | 165.5 | |
| max | 14,663.1 | 45,537.0 | 45,549.0 | 400.2 | |
| Optimistic | min | 110.7 | 2.0 | 10.0 | 96.3 |
| average | 5996.4 | 42,477.0 | 41,027.8 | 137.8 | |
| max | 19,069.3 | 45,537.0 | 45,548.0 | 333.0 | |
Disclaimer/Publisher’s Note: The statements, opinions and data contained in all publications are solely those of the individual author(s) and contributor(s) and not of MDPI and/or the editor(s). MDPI and/or the editor(s) disclaim responsibility for any injury to people or property resulting from any ideas, methods, instructions or products referred to in the content. |
© 2025 by the authors. Licensee MDPI, Basel, Switzerland. This article is an open access article distributed under the terms and conditions of the Creative Commons Attribution (CC BY) license (https://creativecommons.org/licenses/by/4.0/).
Share and Cite
Żurakowska-Sawa, J.; Gromada, A.; Trocewicz, A.; Wojciechowska, A.; Wysokiński, M.; Zielińska, A. Photovoltaic Farms: Economic Efficiency of Investments in South-East Poland. Energies 2025, 18, 170. https://doi.org/10.3390/en18010170
Żurakowska-Sawa J, Gromada A, Trocewicz A, Wojciechowska A, Wysokiński M, Zielińska A. Photovoltaic Farms: Economic Efficiency of Investments in South-East Poland. Energies. 2025; 18(1):170. https://doi.org/10.3390/en18010170
Chicago/Turabian StyleŻurakowska-Sawa, Joanna, Arkadiusz Gromada, Anna Trocewicz, Adrianna Wojciechowska, Marcin Wysokiński, and Anetta Zielińska. 2025. "Photovoltaic Farms: Economic Efficiency of Investments in South-East Poland" Energies 18, no. 1: 170. https://doi.org/10.3390/en18010170
APA StyleŻurakowska-Sawa, J., Gromada, A., Trocewicz, A., Wojciechowska, A., Wysokiński, M., & Zielińska, A. (2025). Photovoltaic Farms: Economic Efficiency of Investments in South-East Poland. Energies, 18(1), 170. https://doi.org/10.3390/en18010170