2. Materials and Methods
An analysis of algorithms for protecting helicopter TE during surge in starting mode [
17,
18] reveals several key points that justify the need for a new approach. The sequential stages of use, including metered fuel supply [
20], compressor condition monitoring [
21], and rotor speed adjustment [
22], allow for a high degree of control over the engine starting process. Each stage is aimed at preventing damage caused by unstable operation, which is especially critical for helicopter TE subject to high loads and sudden changes in operating conditions. Special attention should be paid to algorithms designed to monitor and record the compressor operating condition [
23]. This is important since traditional diagnostic methods may not have time to respond to rapidly changing conditions. The temperature and speed derivatives ratio using [
21] allows for promptly identifying deviations from the norm and responding to them, which is a significant improvement over simpler threshold algorithms that do not take into account the dynamics of changes. However, such algorithms may struggle with low signal levels, requiring fine-tuning of thresholds and potential use of additional sensors to improve robustness.
Fuel control and ignition unit activation also demonstrate the system’s adaptive capability importance [
25,
27]. The ability to temporarily stop fuel supply and switch to reduced power helps avoid fuel overruns and possible overheating [
26] but can also lead to the system’s excessive sensitivity to changes in operating conditions. If timing parameters are not adapted to specific starting conditions, this can cause delays in system response. However, despite all these advantages, those algorithms that rely on fixed dependent functions and thresholds may not withstand the external factors influence, such as changes in temperature, pressure, and fuel characteristics.
Thus, to simulate the helicopter TE protection during surge in the starting mode [
17] with metered fuel supply [
23] and the compressor operation stability maintaining [
26], a mathematical model is proposed based on the sequential actions and specified dependencies algorithm.
Stage 1. Fuel supply according to the program. In the starting beginning, fuel is supplied to the helicopter TE combustion chamber according to the program with the flow rate
according to the dependence, calculated as follows:
Stage 2. The unstable compressor operation signal formation.
At this stage, unstable compressor operation is recorded through the gas temperature in front of the compressor turbine
and the gas generator rotor speed
nTC first derivatives ratio according to the following expression:
If
R exceeds a given threshold value, an unstable operation signal is generated, i.e., the following becomes valid:
Stage 3. Stopping the fuel supply and turning on the ignition unit. When an unstable operation signal is generated, the fuel supply to the combustion chamber is stopped for a specific time Δ
tfuel, and the ignition unit is turned on for a time Δ
tign. After this, the fuel supply is resumed with a reduced flow rate
, calculated as follows:
Remark 1. Changing the fuel supply and ignition unit control algorithm when starting helicopter TE, aimed at minimizing voltage surges, can have a positive effect on the overall system performance. Reducing voltage surges reduces the electrical network’s overloading risk, increases the compressor stability, and improves the fuel flammability. This approach helps maintain the gas generator’s stability and reduces its surge likelihood, which ultimately increases the system’s reliability as a whole [28]. Stage 4. The metered fuel supply restoration. After the unstable operation signal is removed, the fuel supply is restored linearly from
to
, according to a linear dependence over a specified time Δ
trest. The linear change in fuel consumption is described as follows:
Stage 5. Determining the software dependence
. Before the compressor’s unstable operation signal appears, the gas generator rotor speed software dependence on its current value is established, calculated as follows:
where
f is a function that determines the rotor speed change dynamics depending on the current value.
Stage 6. Adjustment when the ignition unit is turned on. When the ignition unit is turned on, the
nTC frequency is adjusted downwards by 28…32%. The adjusted dependence takes the following form:
where
Remark 2. The nTC reduction by 28…32% when the ignition unit is turned on is based on the need to prevent overheating and ensure stable compressor operation under high temperatures and loads at the starting time. This reduction helps control the flow dynamics and temperature conditions, which reduces the unstable compressor operation risk. This practice is supported by research results, for example [29]. Stage 7. The starting modes end. The corrected frequency dependence (8) is maintained until the engine starting mode ends, after which the system switches to normal operation mode.
Thus, the helicopter TE protection algorithm developed a mathematical model determined by analytical expressions (1)–(8), which include dynamic fuel supply, compressor parameter monitoring, and rotor speed adjustment. The helicopter TE developed a mathematical model protection during the surge in the starting mode, which represents an innovative approach that allows dynamic adapting of the fuel supply and compressor rotor speed to prevent unstable operation. The developed mathematical model is implemented with a structural diagram, as shown in
Figure 1.
According to
Figure 1, unit 1 calculates
according to (2), unit 2 compares
with the threshold value
according to (3), and when
, it generates a signal H1 = 1 for unstable compressor operation. Unit 3 is a timer set for
t = 0.3…0.4 s. Unit 3 generates a signal
H2 = 1. After 0.3…0.4 s [
29], it removes the signal (
H2 = 0). Unit 4 is a logical device “AND” that generates a signal to stop the fuel supply to the engine combustion chamber at
H1 = 1 and
H2 = 1. Unit 5 is a logical device “AND” that generates a signal
H3 = 1 to turn on the ignition unit at
H1 = 1 and
H2 = 0; it initiates the start cyclogram after stopping the fuel supply (cutoff) for a time of
t = 0.3…0.4 s [
29]. Unit 6 is a device that corrects the fuel consumption reduction program
according to (4). Unit 6, based on the signal
H3 = 1, generates an analogue correction signal
H4, which is fed to unit 7, which is a multiplying (multiplicative) device that produces the fuel consumption
reduced (corrected) value to the metering needle. Unit 8, based on signal
H3 = 1, generates a corrected dependence
according to (7) at starting and sends a signal to the gas generator rotor speed controller.
Unit 1 receives data on the
nTC and
current values, where the ratio
value is formed according to (2); information about which is sent to the comparison unit 2 first input. At the same time, information about the threshold value
is sent to unit 2’s input. When
, signal
H1 = 1 is formed, characterizing unstable operation of the compressor (“surge”). Signal
H1 is fed to units 4 and 5, the first and timer three inputs. When signal
H1 = 1 appears, timer 3 starts counting down time
t = 0.3…0.4 s [
29] and generates a control signal,
H2 = 1, fed to the inputs of units 4 and 5. At the end of the periods’ of 0.3…0.4, the timer removes control signal
H2 (
H2 = 0). When
H1 = 1 and
H2 = 0, unit 5 generates signal
H3 = 1 to the control system to perform the starting cyclogram after the fuel cutoff is terminated. In this case, a repeated start occurs with the starting program correction performed by units 6, 7, and 8. Block 6, based on signal
H3 = 1, generates analogue correction signal
H4, changing from a value of 0.9 to 1.0 within ~10 s. The analogue correction signal
H4 from the unit 6 output is fed to the first input of multiplying unit 7. In this case, the data on the standard value
are fed to unit 7’s input. Unit 7 multiplies the
value and the correction signal I4, forming the corrected value of the fuel consumption value
according to (4). At the same time, using the signal
H3 = 1, unit 8 corrects the software dependence
according to (7), towards decreasing the value by 28…32 % [
29]. Unit 8 sends a signal to the gas generator rotor speed controller, which maintains the starting mode completion corrected dependence
.
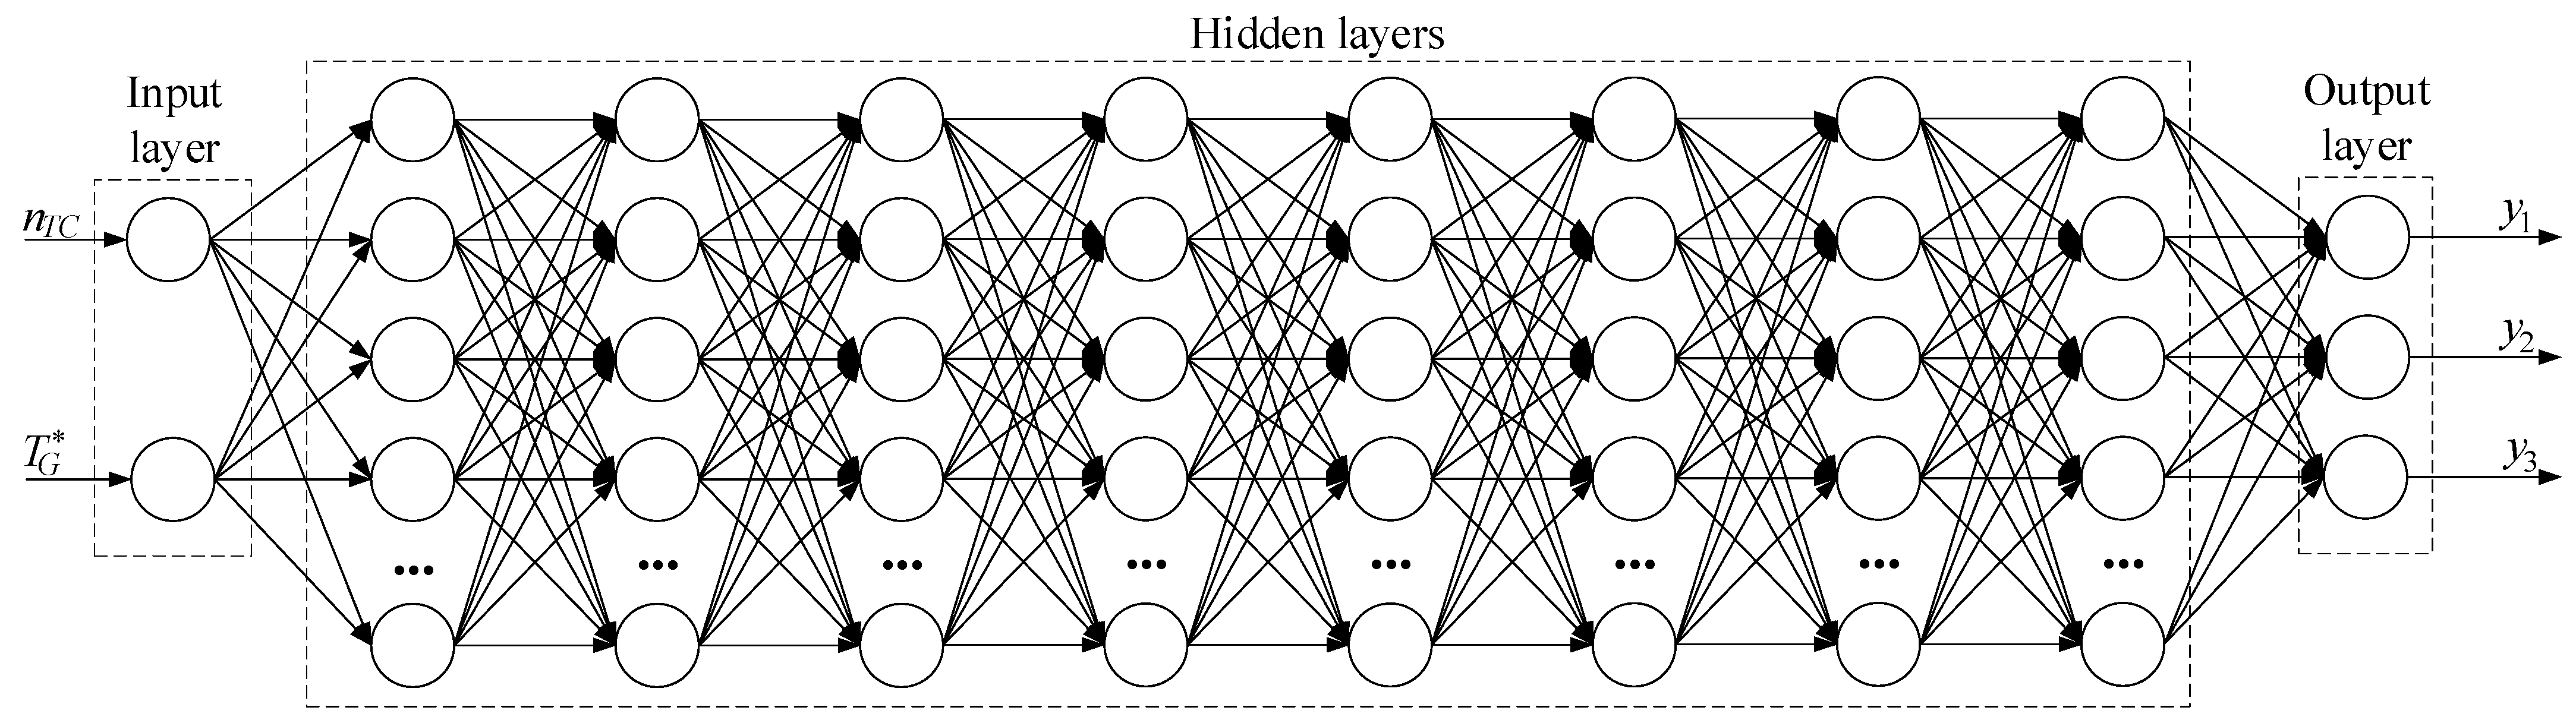
To implement the protecting helicopter TE during a surge-developed method, a neural network is proposed (
Figure 2), which performs the control, signal processing and logical control specified functions and consists of several specialized layers simulating the operation of units 1–8 (according to
Figure 2).
In the input layer, the gas temperature in front of the compressor turbine and the gas generator rotor speed nTC current values are recorded and transmitted to the next layer for processing.
The layer for calculating derivative values ensures unit 1’s operation. In this layer, the
and
derivatives are calculated based on the input data, as well as their ratio
according to (2), which value is passed to the next layer. This layer is the recurrent elements (e.g., LSTM [
30]) layer since the
and
derivative values depend on changes in temperature and rotor speed over time.
The threshold comparison layer ensures the operation of unit 2. In this layer, the current value is compared with the threshold value , based on which the logical signal H1 = 1 is output if . This layer is dense with a sigmoid activation function, representing the threshold function. The sigmoid function transforms the comparison result into a binary value H1.
The timer layer, which ensures the operation of unit 2, is a time delay layer. In this layer, when the signal
H1 = 1 is received, the time countdown
t = 0.3…0.4 s [
29] begins, after which the signal
H2 = 1 is formed, and after the specified time, the signal
H2 = 0 is removed. This layer function is to withstand the time delay for the necessary commands’ formation for subsequent blocks.
The logical “AND” layer for stopping the fuel supply (Unit 4) is a logical layer that models the “AND” operation, in which, upon receipt of signals
H1 = 1 and
H2 = 1, a command is generated to stop the fuel supply, that is, the following logical condition is realized:
The logical “AND” layer for turning on the ignition unit (Unit 5) is also a logical layer simulating the “AND” operation, in which, when
H1 = 1 and
H2 = 0, the signal
H3 = 1 is activated to start the ignition unit, which initiates the start cyclogram after the fuel cutoff, that is, the following condition for turning on the ignition is realized:
In the fuel consumption correction layer (Unit 6), the
H3 = 1 signal generates the
H4 correction signal, changing from 0.9 to 1.0 over 10 s [
29], i.e., the fuel consumption correction
is performed depending on time. This layer is dense with the SmoothReLU activation function [
31], generating an analogue correction signal capable.
The multiplication layer that ensures the unit 7 operation is a multiplying layer in which the corrected fuel consumption value
is multiplied by the correction signal
H4, obtaining the final fuel consumption value. Thus, the fuel consumption correction is calculated as follows:
The rotor speed dependence correction layer (Unit 8) is a layer with a dense structure and recurrent elements, in which, based on the signal
H3 = 1, the dependence
is corrected downwards by 28…32% [
29]. Thus, when the signal
H3 = 1 is activated in this layer, the target frequency value changes dynamically, ensuring the engines’ stable operation in the specified modes.
The proposed neural network architecture (
Figure 2) allows helicopter TE protection automation and control under unstable operating conditions, implementing the developed surge protection method in the sequential logical and mathematical control format.
A specialized algorithm is proposed to train the developed neural network (
Figure 2), the helicopter TE protection system during surge operation simulating, including the data generation stages, setting up time dependencies, logical conditions, and parameter correction. The developed neural network training includes simulating signals and logical states for the neural network functions’ accurate execution related to fuel cutoff conditions, flow rate adjustment, and starting.
The input data were simulated at the initial stage of neural network training. It is assumed that the input data include the gas temperature in front of the compressor turbine
and the gas generator rotor speed
nTC current values, for which the derivatives are set as follows:
The input data for the model include pairs (
and
nTC) and their derivatives (
and
). Next, the surge event is modeled by defining a surge as a situation when
. After that, the initial weights and thresholds
W and
b are specified for all the networks’ layers. The initial distribution is specified, for example, as follows:
where
σ is the standard deviation.
Backpropagation through time is used to train temporal dependencies in a neural network. For each time step
t, an input vector
is formed, with the help of which the neural networks’ hidden states are updated, for example, in the recurrent layer (e.g., LSTM [
30]) case as follows:
where
ht is the hidden layers’ state at step
t.
To generate a signal
H1 = 1 if the surge condition is met, the neural network is trained in such a way that the target error function takes into account the logical condition, which is calculated as follows:
where
y is the real value (0 or 1), and
is neural network prediction value.
When
H1 = 1, the timer is activated and generates a signal
H2 = 1 for
t = 0.3…0.4 s [
29]. In this case, the time
t is set for the timer, written as follows:
and is controlled by a delay. Next, the neural network is trained to hold
H2 = 1 for the required time.
At the next stage, the correction signal
H4 is formed, which, when
H3 = 1, changes according to a linear law, written as follows:
where
H4 → 1.0 after 10 s.
The
H4 signal adjusts the fuel consumption according to (11). The gas generator rotor speed is adjusted as follows:
where
k = 0.28…0.32 (a reduction by 28…32%).
The overall loss function includes errors for each unit and is defined as:
where
Llog is the loss for logical conditions,
Ltimer is the loss for time delays, and
Lcorrection is the loss for correction signals.
The loss function
Llog minimizes the error for the logical signals’ operation, corresponding to the required logical conditions. Logical conditions take into account the surge signals’ operation. If the network output
does not correspond to the required logical value
H1, an error occurs. To minimize the error in signal operation, binary cross-entropy (15) is used, calculated as follows:
where
H1 ∈ {0, 1} is the actual value of the signal (for example, operation during surge), and
is the signal-predicted value by the neural network.
The loss function
Ltimer minimizes the actual signal activation time deviation from the target interval [0.3, 0.4], thereby increasing the timer accuracy. The timer function is to hold the signal
H2 = 1 for a given interval
ttimer ∈ [0.3, 0.4] seconds [
29]. To ensure high accuracy, a penalty for deviation from the target response time is added to the delay. Thus, the following analytical expression for the loss for the timer includes the difference between the actual delay duration tactual and the target duration
ttarget, as well as the penalty coefficient
λ for duration errors:
where
is the signals’
H2 activation/deactivation prediction error,
ttimer is the timer response actual duration,
ttarget is the
ttimer duration target value, and
λt is the penalty coefficient for errors in the delay duration.
The correction signals’ loss function helps the neural network to smoothly adjust the correction signal
H4 by the required linear dependence, reaching a value of 1.0 after 10 s. The correction signal
H4 should smoothly change from a 0.9 to a 1.0 value over a 10-second period. We use a quadratic loss function to minimize the
deviation from the target value
H4 at each time moment, calculated as follows:
where
T is the total number of time steps in the correction process,
H4(
t) is the correction signals’ target value at time
t, and
performs the neural network prediction for the correction signals’ value at time
t.
To optimize the neural network weights and achieve the required time accuracy, the Adam optimization algorithm [
32,
33] is used, which is a preferred algorithm compared to RMSprop [
34] for a problem involving time and logic conditions, as well as smooth signal adjustments, since its adaptive training rate and moment accounting allow stable weight control, which is critical for fine-tuning time delays and logic conditions. In the Adam algorithm [
33], the first moments (average gradients) are updated as follows:
where
mt is the first moment,
β1 is the coefficient for the first moment, and ∇
θLt is the loss gradient for the weights
θ at step
t.
The second moment update (the gradients’ direct movement) is as follows:
where
vt is the second moment, and
β2 is the coefficient for the second moment.
The offset correction for moments is defined as follows:
The weights are updated as follows:
where
α is the training rate, and
ϵ is a small number to prevent division by zero.
To combat overfitting and improve generalization ability, L2 regularization is applied by adding it to the loss function [
35], calculated as follows:
where
Ltotal is the original loss function calculated according to (19), and
λ is the regularization coefficient, which regulates the penalty strength for large weights.
To optimize hyperparameters, such as the training rate
α, moment coefficients
β1,
β2, and regularization coefficient
λ, Bayesian optimization is used, which consists of constructing a probabilistic model for the hyperparameters and choosing the next point based on an assessment of its utility, calculated as follows:
where AcquisitionFunction(
θ) is a function that evaluates the hyperparameters
θ different combinations effectiveness to improve the model.
To achieve the time delays required accuracy, additional hyperparameters are introduced to control timers and logic units, calculated as follows:
where
ttimer is the delay time,
ttarget is the target delay,
λ is the penalty coefficient for the time error.
Taking into account the above, (19) takes the following form:
The developed training algorithm is unique in its adaptability to time and logic constraints, which is critical for helicopter TE control in operational mode. It combines optimization by logical conditions and delay metrics, ensuring accuracy considering operational requirements. Including special losses for time delays and logical conditions allows the algorithm to learn reliably, maintaining stability and accuracy when detecting surges in real time.
3. Results
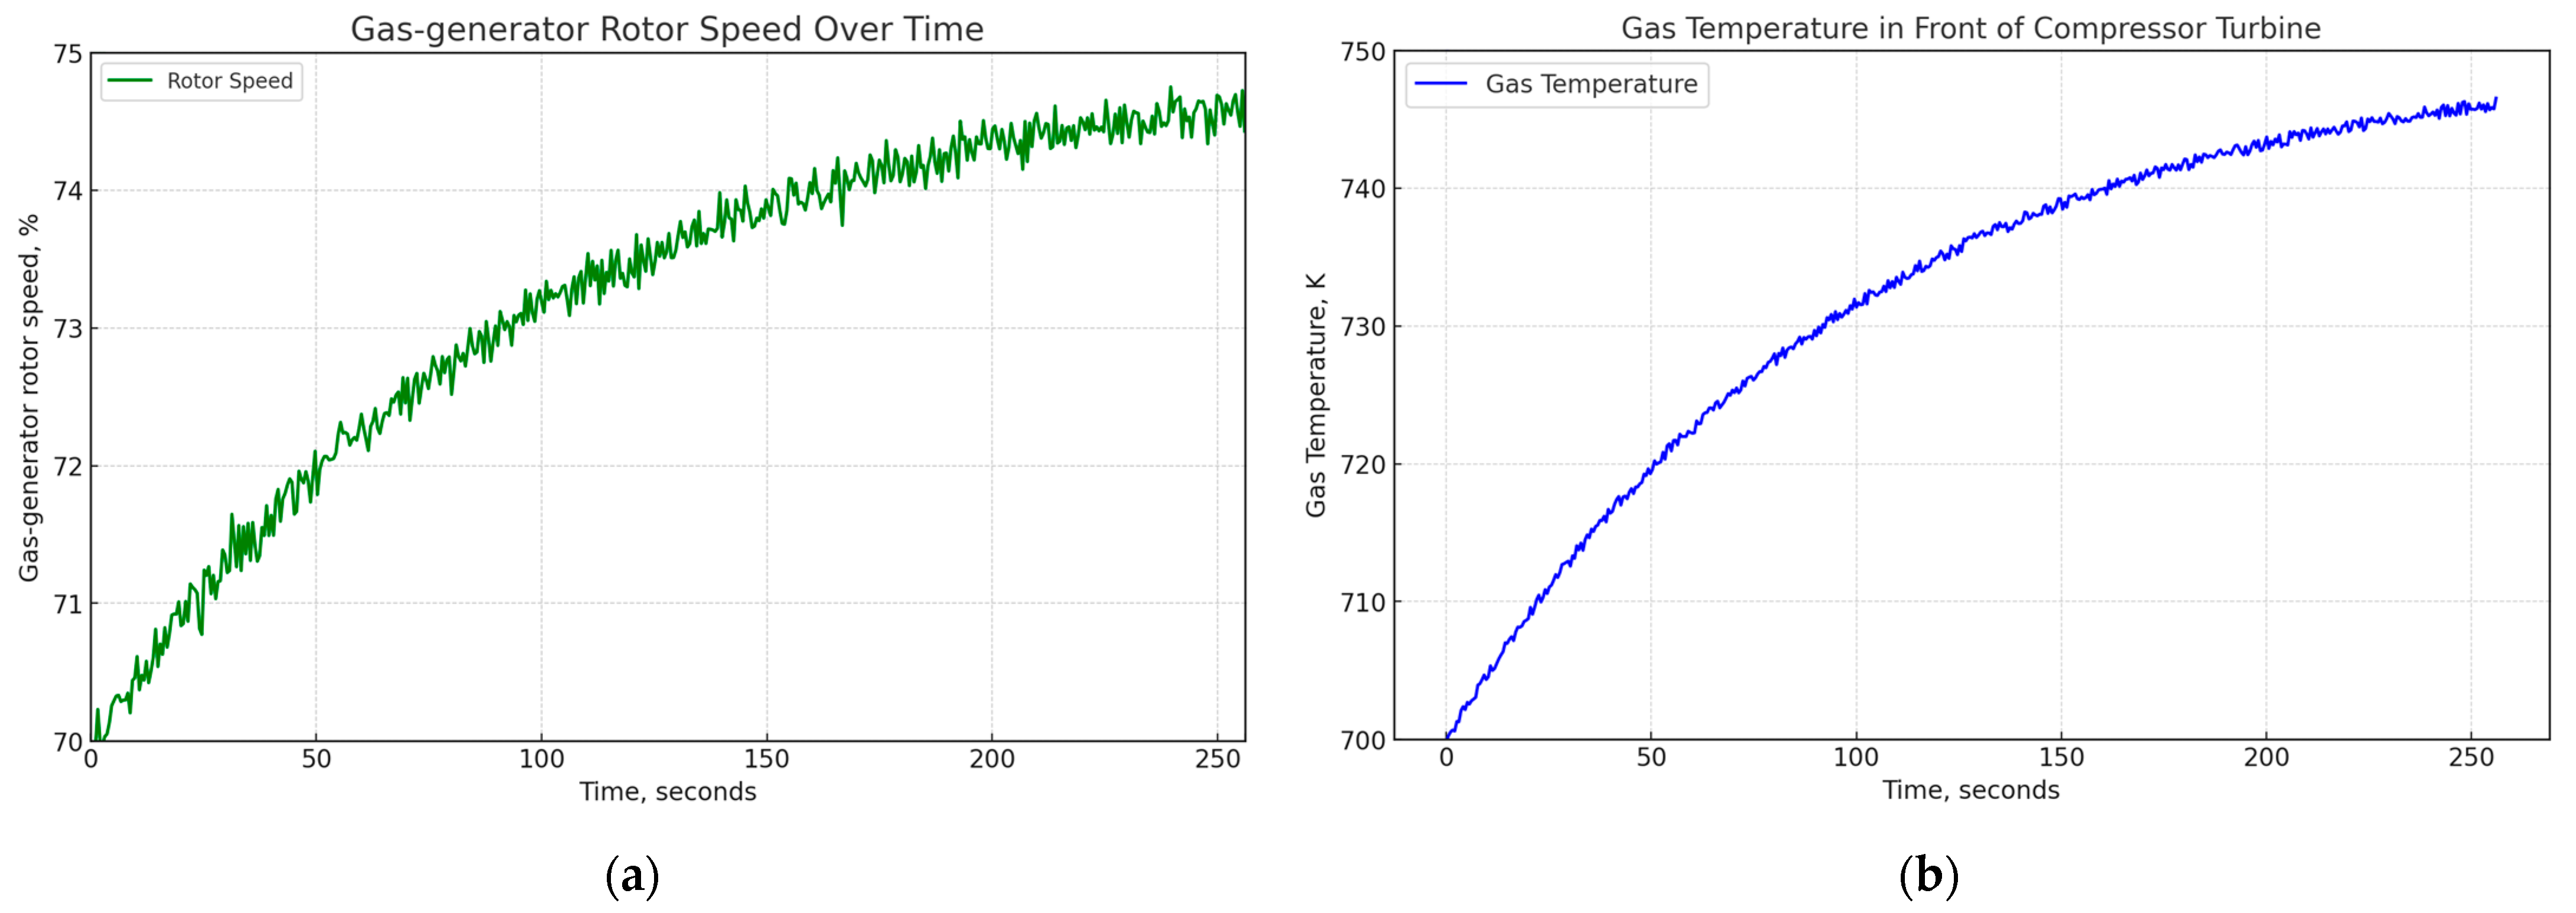
To conduct the computational experiment, the TV3-117 TE [
36], which is part of the Mi-8MTV helicopter power plant, was selected as the research object [
37]. The TV3-117 TE parameters (
nTC,
, etc.) required for the computational experiment were obtained exclusively from the flight data obtained during the Mi-8MTV helicopter engines’ start (
Figure 3). Data recording was carried out on board using D-2M sensors and 14 dual T-101 thermocouples [
31] (data recording took place for 256 s in actual flight with a sampling period of 1 s). The specified data were provided at the authors’ team’s official request to the Ministry of Internal Affairs of Ukraine and are intended for the project “Theoretical and Applied Aspects of Aviation Sphere” implementation, officially registered in Ukraine under number 0123U104884.
As can be seen in
Figure 3, the gas temperature in front of the compressor turbine
≈ 770 K, and the gas generator rotor speed
nTC ≈ 79%. To form the training dataset (
Table 1),
z-normalization of the data was carried out, with the help of which each value of the variables
nTC and
was transformed so that they are expressed in standard deviation units from the mean. It allowed us to bring the
nTC and
data to a form with a mean value of 0 and a standard deviation of 1, which is essential for improving the convergence of some machine learning algorithms and for the correct comparison of data with different scales. The
nTC and
z-normalization was carried out according to the following expression:
where
N = 256.
To calculate the
nTC and
z-normalized values time derivative, given that the data were sampled at a sampling rate of 1 s (i.e., the
and
of each sample) which occurred at one second, the finite difference method approximates the derivative. Thus, we obtained the following:
where Δ
t = 1 s, since the sampling frequency is 1 Hz (one sample per second),
I = 1, 2, …, 255, since 256 samples were used.
The training dataset homogeneity [
38,
39] was assessed using the Fisher–Pearson [
40] and Fisher–Snedecor [
41] criteria at a significance level of α = 0.01 (
Table 2) [
42,
43]. The significance level of 0.01 was chosen in the helicopter TE protection during the surge in the starting mode problem to ensure the statistical conclusion of high reliability, which is especially important in helicopter flight safety. This strict criterion minimizes the type I error probability, contributing to more accurate and safe control of helicopter Tes under operating conditions [
44] (in the starting mode).
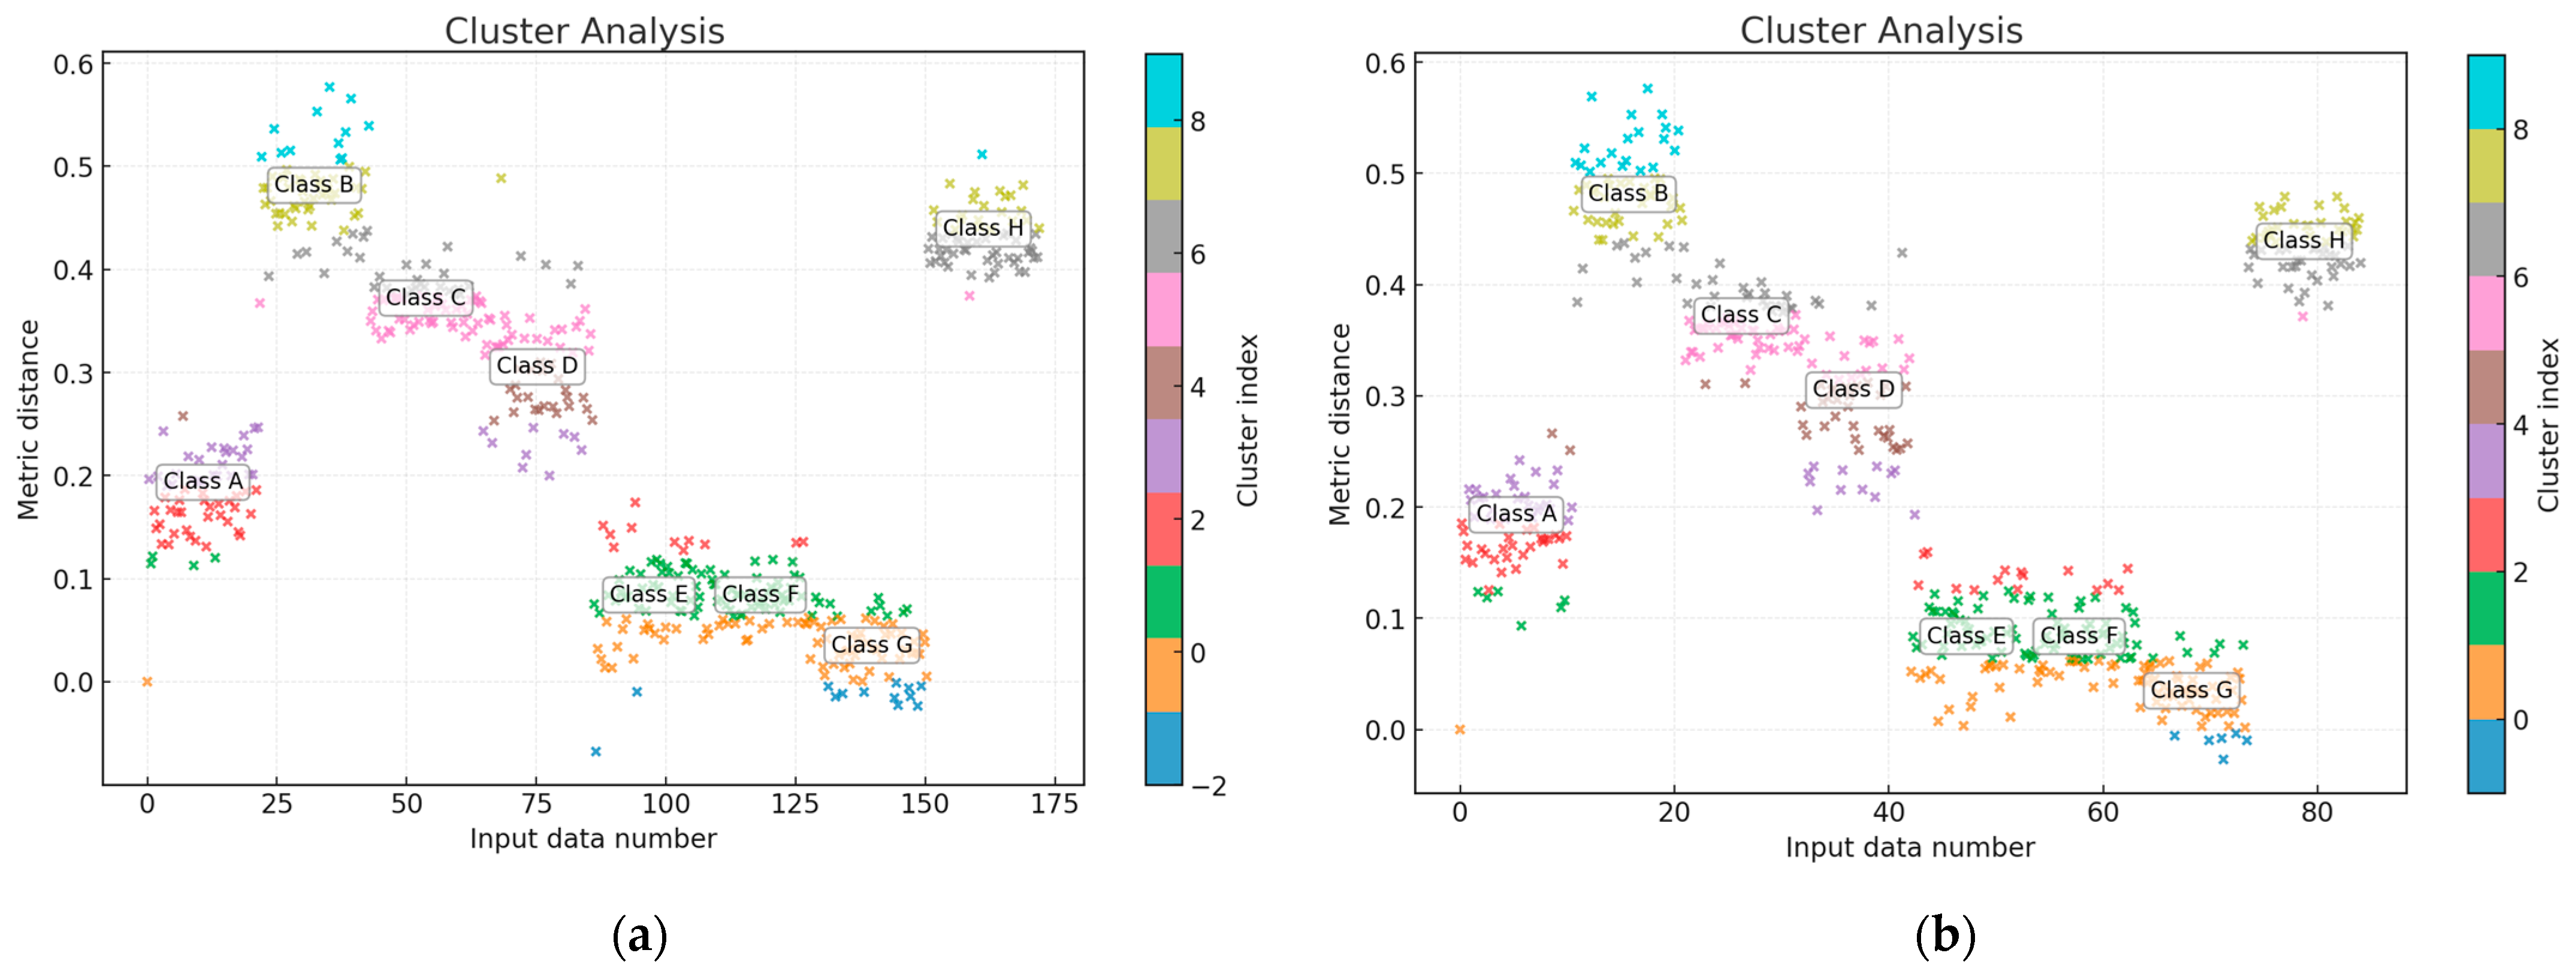
The training and test datasets’ representativeness was assessed using cluster analysis (k-means method) [
45], which involved dividing the input dataset
(
Table 1) into
k groups (clusters), where each value belongs to the cluster with the nearest mean value [
46,
47]. The algorithm repeats the point distribution, minimizing the distance between them and their centroids until the clusters stabilize [
46]. The training data (
Table 1) cluster analysis revealed eight clusters (I…VIII). The training and test datasets were randomly generated in a 2:1 ratio (67% and 33%, respectively), and the same eight clusters were observed in both sets, indicating their structural similarity. The distances between the clusters in the training and test datasets were almost the same, confirming their similarity (
Figure 4).
Thus, the training dataset was 256 elements (100%), the control dataset was 172 elements (67% of the training dataset size), and the test dataset was 84 elements (33% of the training dataset size) optimal size.
The research involved a computational experiment (simulation modeling) using the developed neural network method for protecting helicopter TEs during the surge in the TV3-117 TE starting mode on a semi-naturalistic modeling stand (
Figure 5), which is designed to reproduce and analyze actual engine operating conditions, including various load, temperature, and pressure modes [
48]. It allows for testing control systems, practicing control and diagnostic algorithms, and assessing the stability of helicopter TE operations under various external influences.
The data processing and analysis module is the central element that connects all sensors with connected modules and knowledge bases, ensuring their interaction to improve the helicopter Tes monitoring and control efficiency.
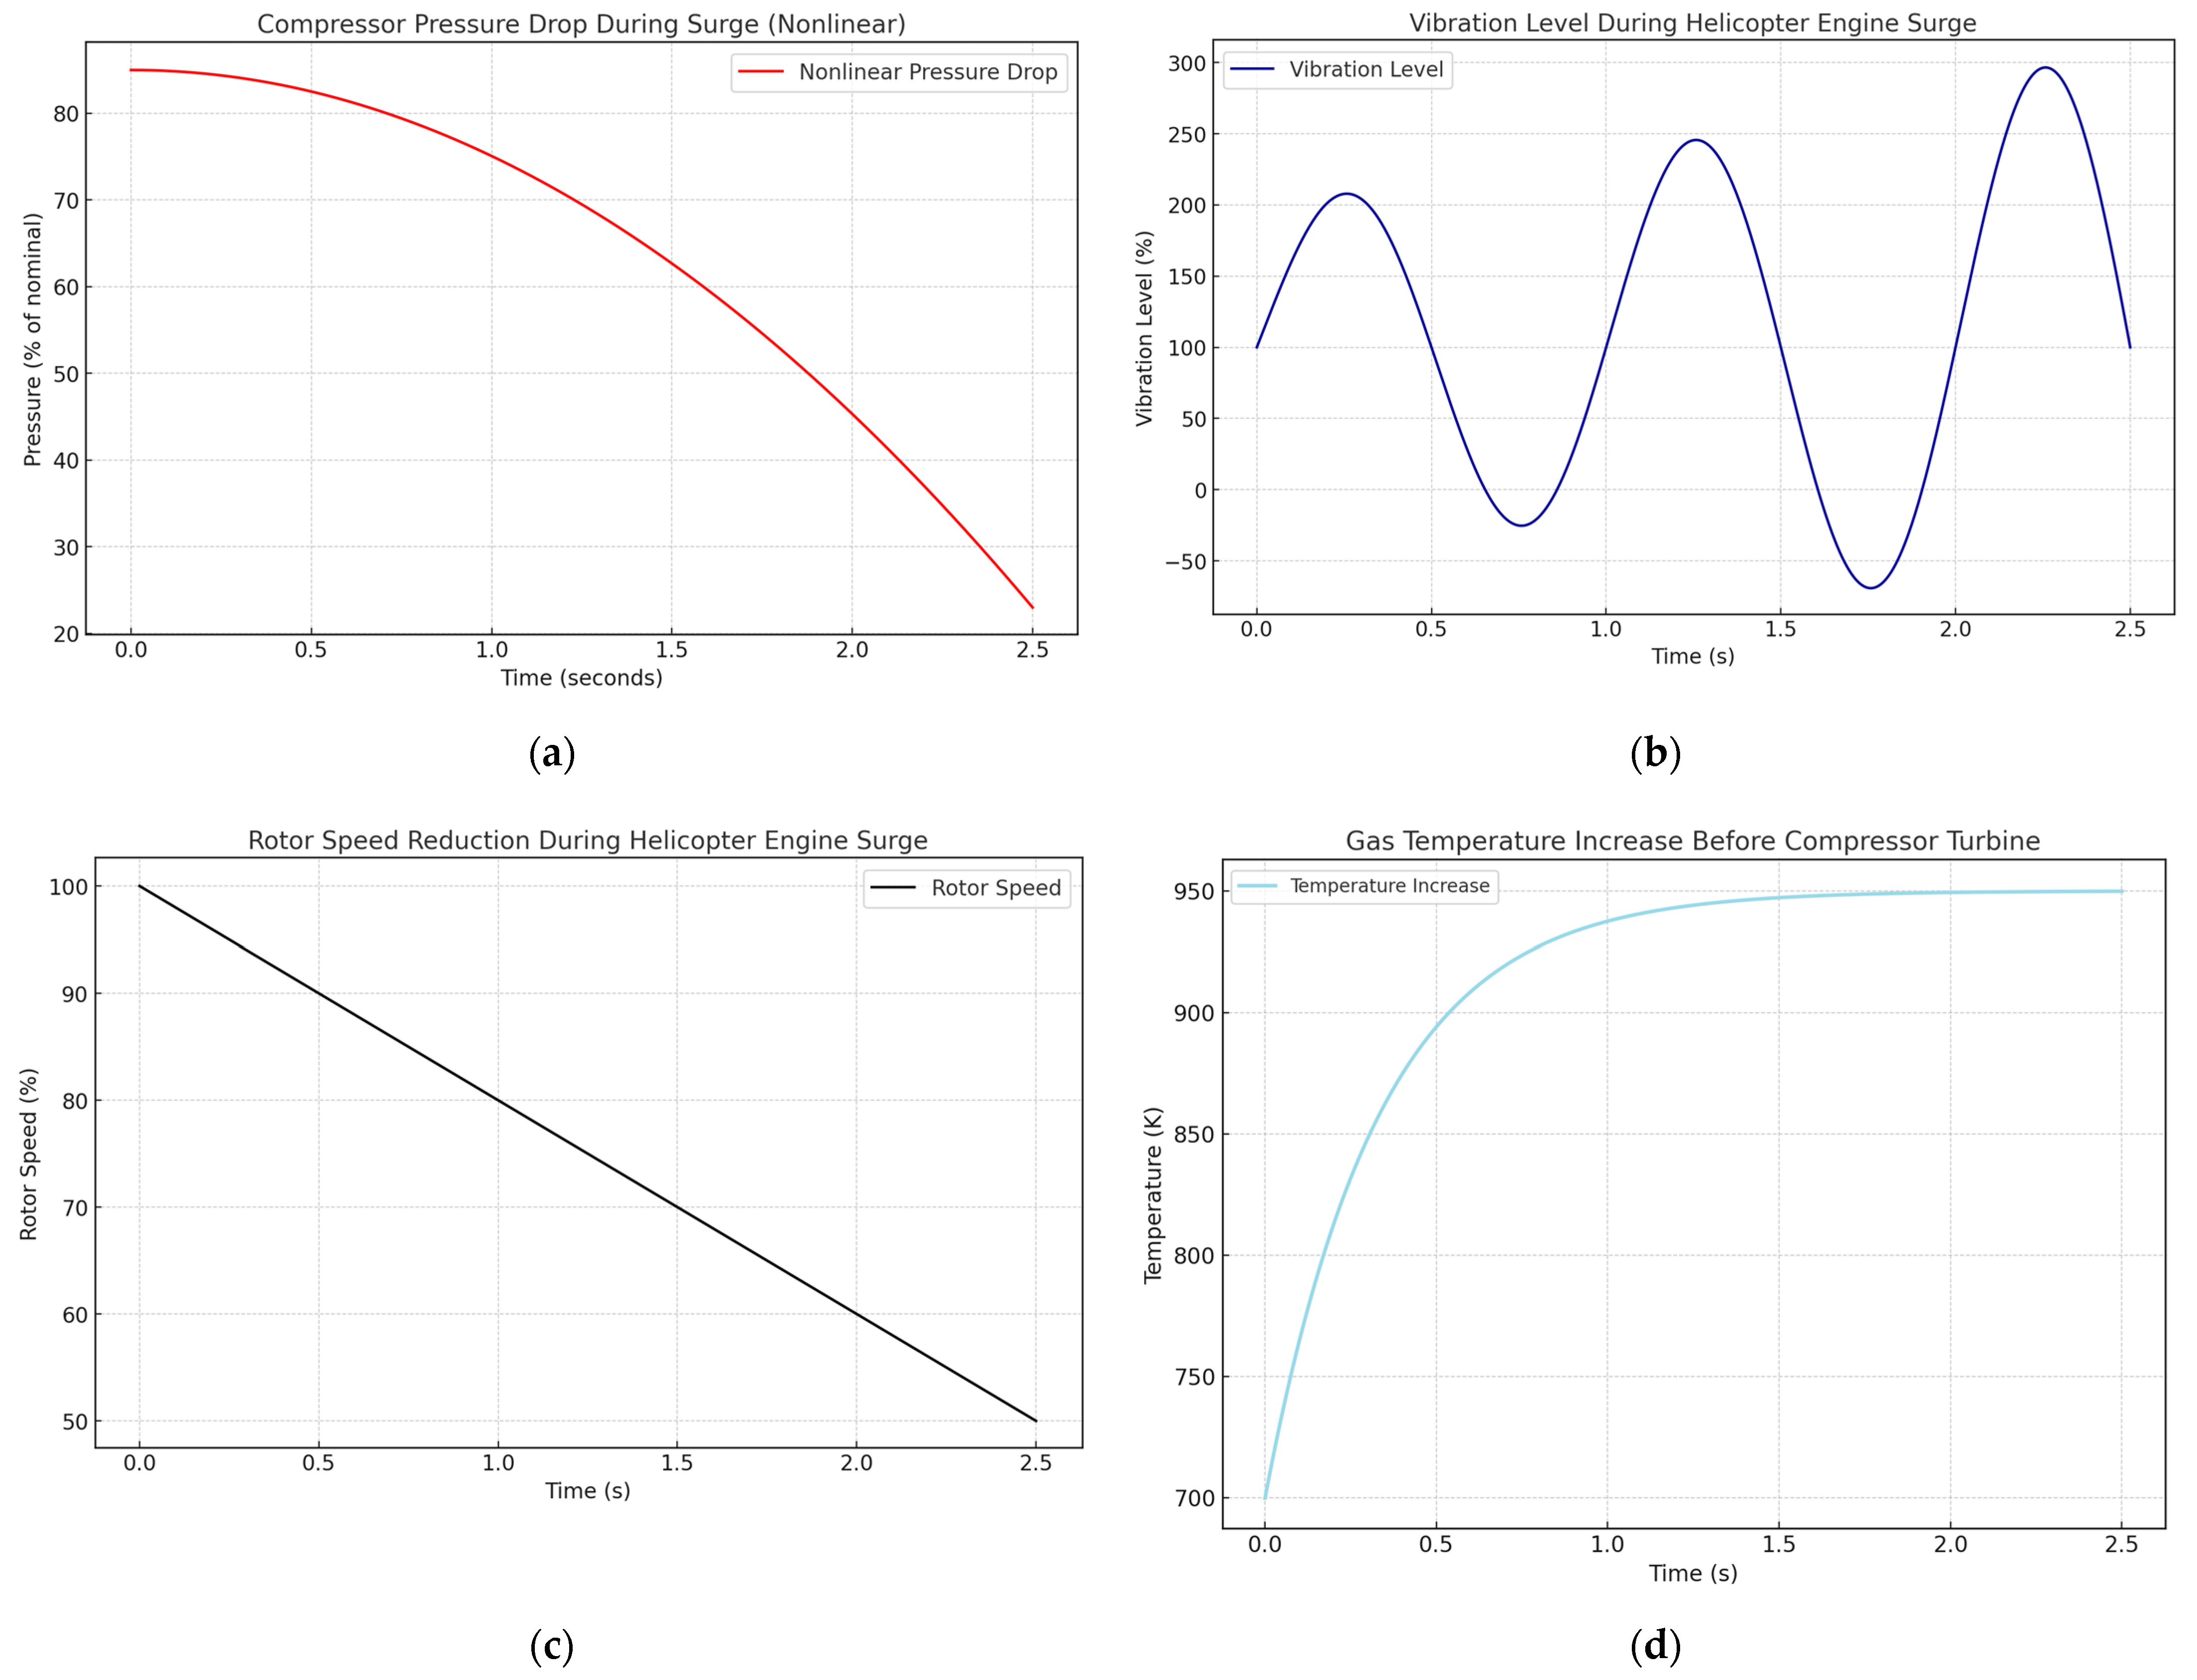
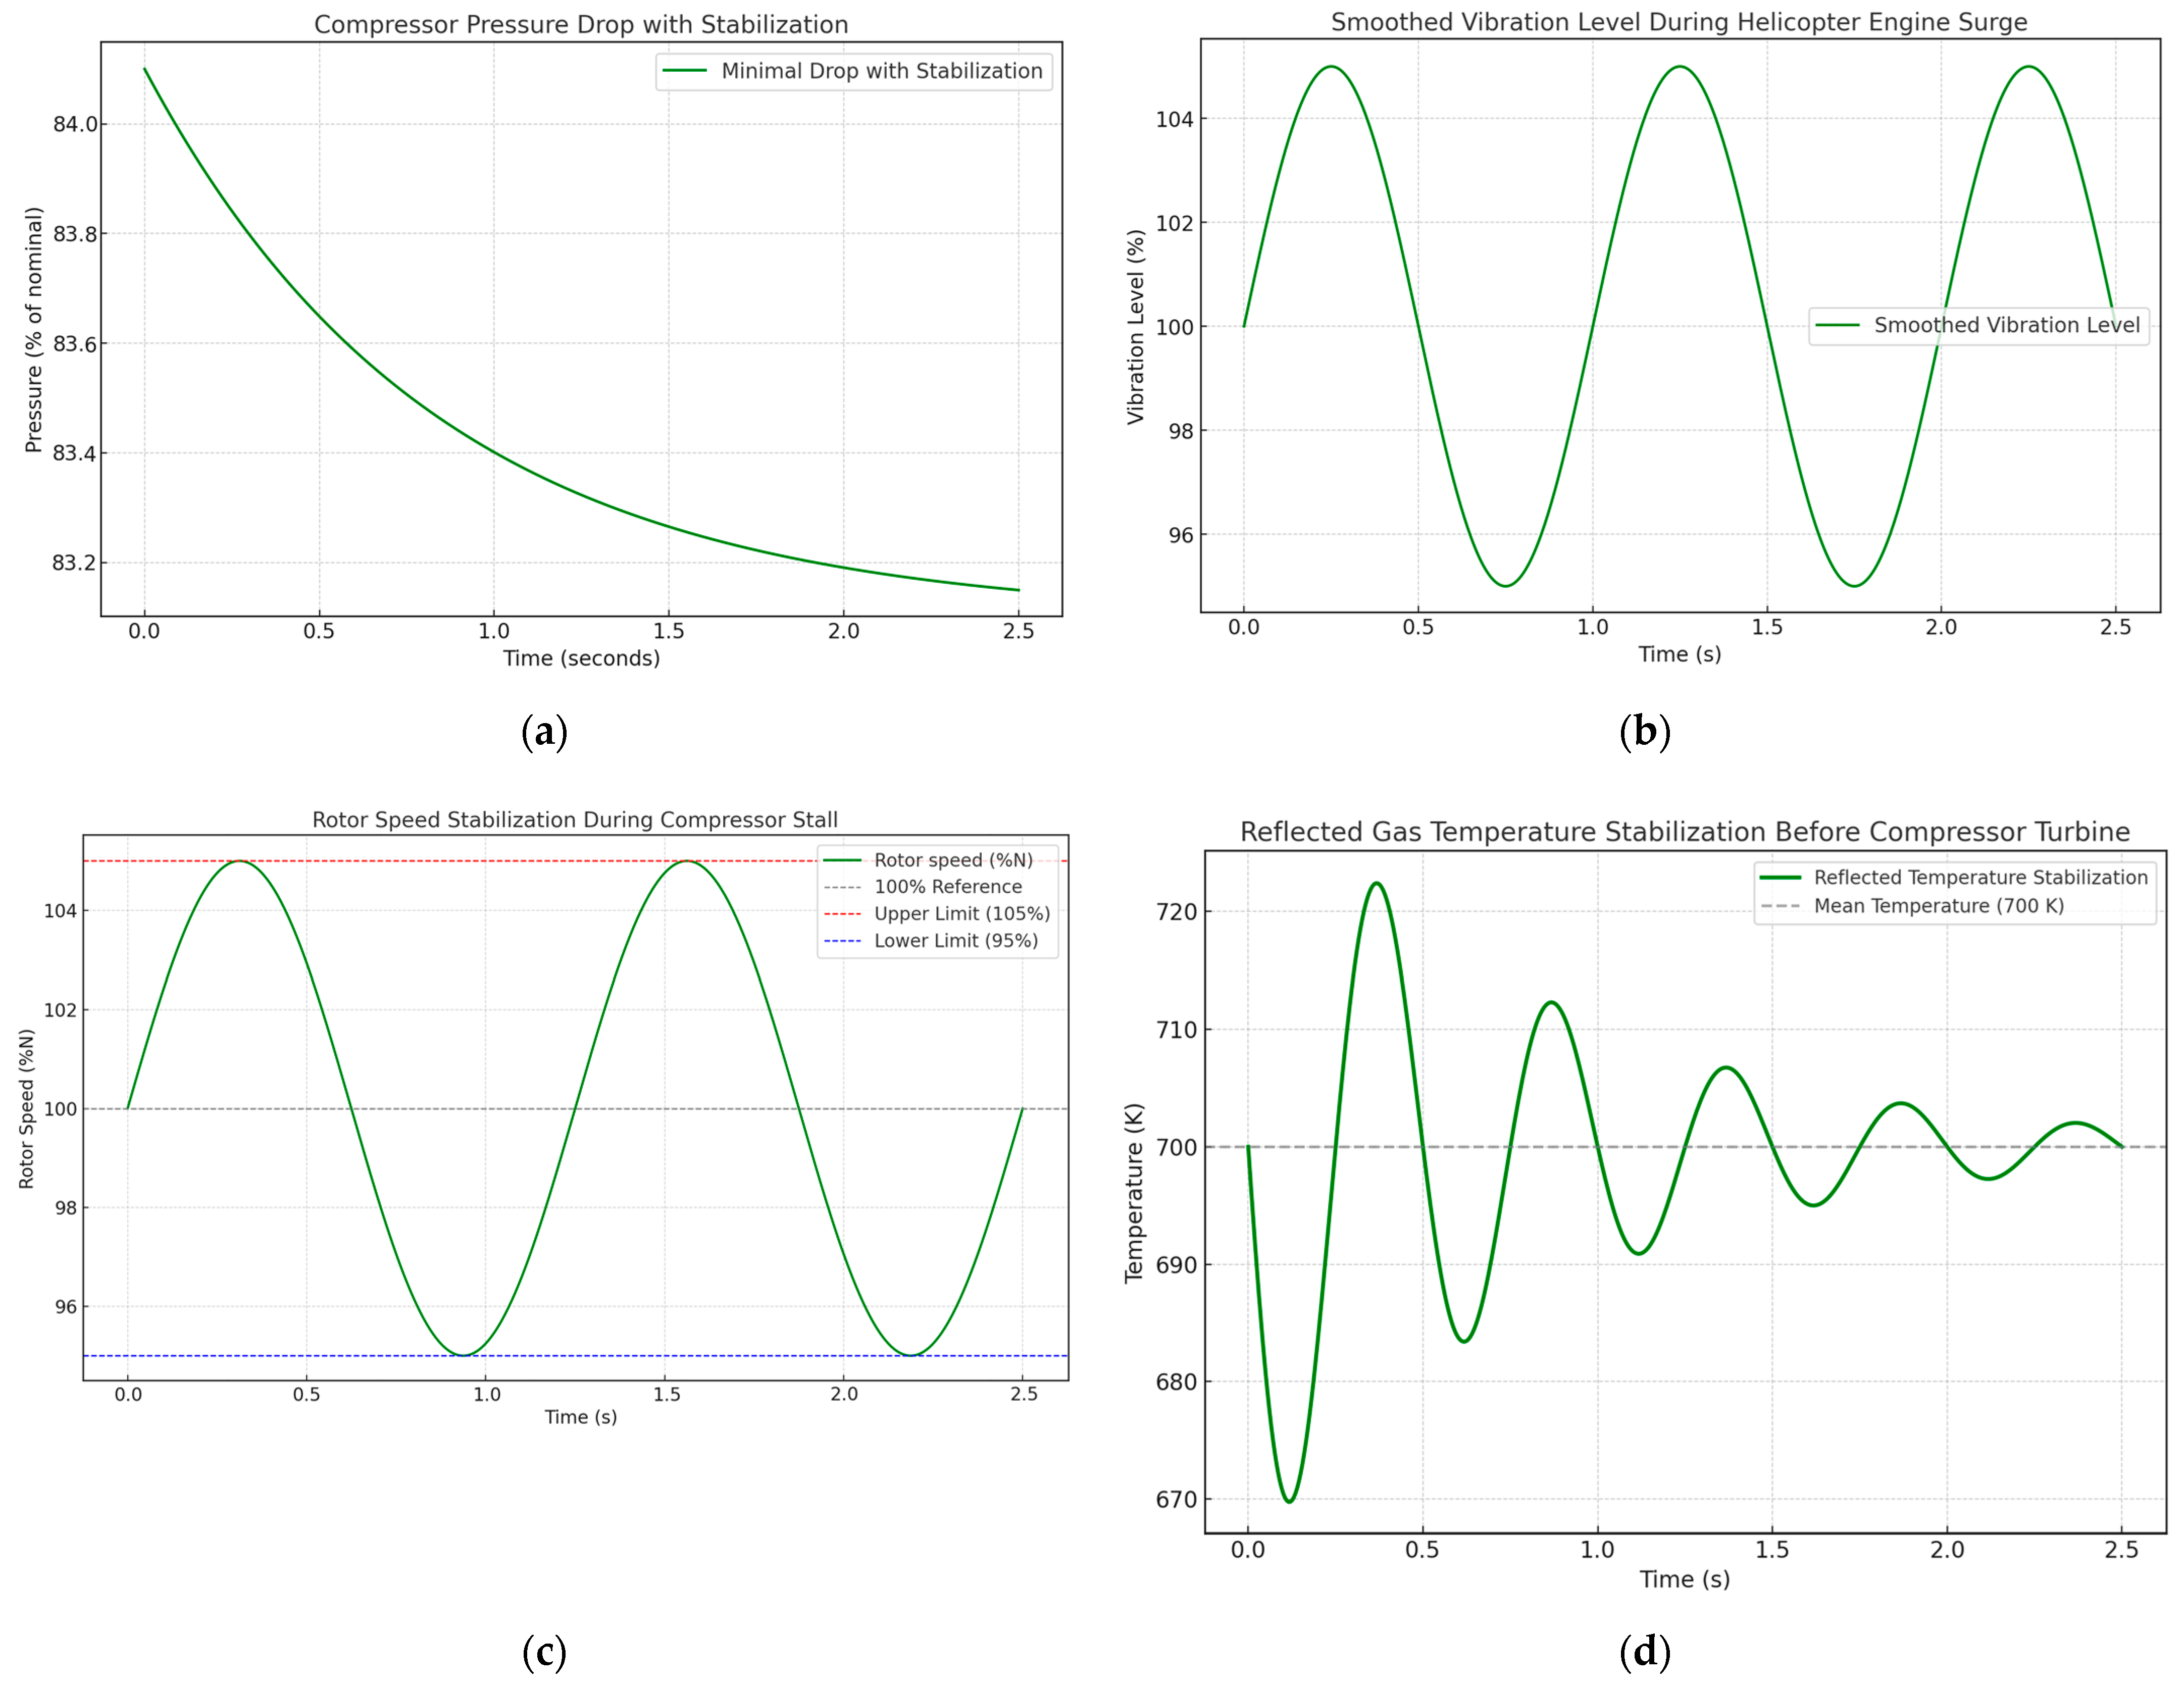
During the simulation modeling, the TV3-117 TE surge condition occurrence in the starting mode was reproduced, and the diagrams of the pressure change behind the compressor during the surge, the change in the vibration level during the surge, the compressor turbine rotor speed dynamics during the surge, and the change in the exhaust units’ temperature during the surge were obtained (
Figure 6). It is noted that the following phenomena accompany the surge:
Fluctuations in pressure, speed, and gas flow rates along the path with a clearly expressed drop in pressure behind the compressor relative to the pressure at its inlet;
An increase in the vibration level;
A decrease in the gas generator and the free turbine rotors speed;
The compressor turbines’ gas temperature increased at the inlet and outlet.
An adjusted gas generator rotor speed diagram was obtained, which shows a 29.7% reduction (
Figure 7), which helps prevent surge and stabilize compressor operation under starting conditions, namely:
No fluctuations in pressure, speeds, and gas flow rates along the tract with a pronounced drop in pressure behind the compressor relative to the pressure at its inlet;
No increase in vibration levels;
Stabilization of the gas generator and the free turbine rotor speeds;
Stabilization of the compressor turbines’ gas temperature at the inlet and outlet.
This adjustment ensures a fuel supply’s smooth restoration, which minimizes the emergency conditions risk.
As shown by the computational experiments series results, stopping the fuel supply to the engine combustion chamber for a set time and resuming the fuel supply with a reduced flow rate
leads to repeated compressor instability (diagrams similar to
Figure 6 were obtained). The compressor instability repetition prevention is achieved by adjusting the program dependence (6) towards reducing the
nTC value by 28…32% when the ignition unit is turned on again and maintaining the adjusted reliance (7) until the start is complete. Reducing the
nTC value by <28% is undesirable since repeated compressor instability is highly likely. Reducing
nTC by >32% will not solve this problem since this will lead to a shift in fuel consumption to the engines’ static characteristics and, consequently, to a long start time or termination of the start.
To assess the neural network (
Figure 2) quality in the helicopter TE surge monitoring task during starting mode, traditional metrics,
accuracy,
precision,
recall,
F-measure, and others [
49,
50], were used. In helicopter TE surge monitoring during starting mode, the applied metrics of neural network quality play a crucial role in assessing its efficiency in classification and regression.
Accuracy allows us to determine the correct prediction proportion, providing a general understanding of the models’ quality.
Precision and
recall give a more detailed assessment of the system’s performance in the unbalanced classes case, for example, when it is essential to minimize false positives and missed critical events. The
F-measure (
F1-score) is the harmonic mean between accuracy and recall. The determination coefficient (
R2) helps to assess how well the model explains the data variability, which is especially important for predicting and detecting abnormal modes during helicopter TE start. The applied metrics together provide a comprehensive assessment of the neural network (
Figure 2) quality under conditions of the helicopter TE operational status dynamic monitoring in the starting mode. The applied metrics are determined according to the following expressions:
In the context of the helicopter TE surge monitoring task in the starting mode, TP (true positive) is the correct detection of an anomaly (surge) when the model correctly classifies the malfunction; TN (true negative) is the correct absence of an anomaly when the model correctly identifies the normal operating mode; FP (false positive) is the false positive when the model incorrectly classifies the normal mode as an anomaly; and FN (false negative) is the false negative when the model does not detect an anomaly, although it is present.
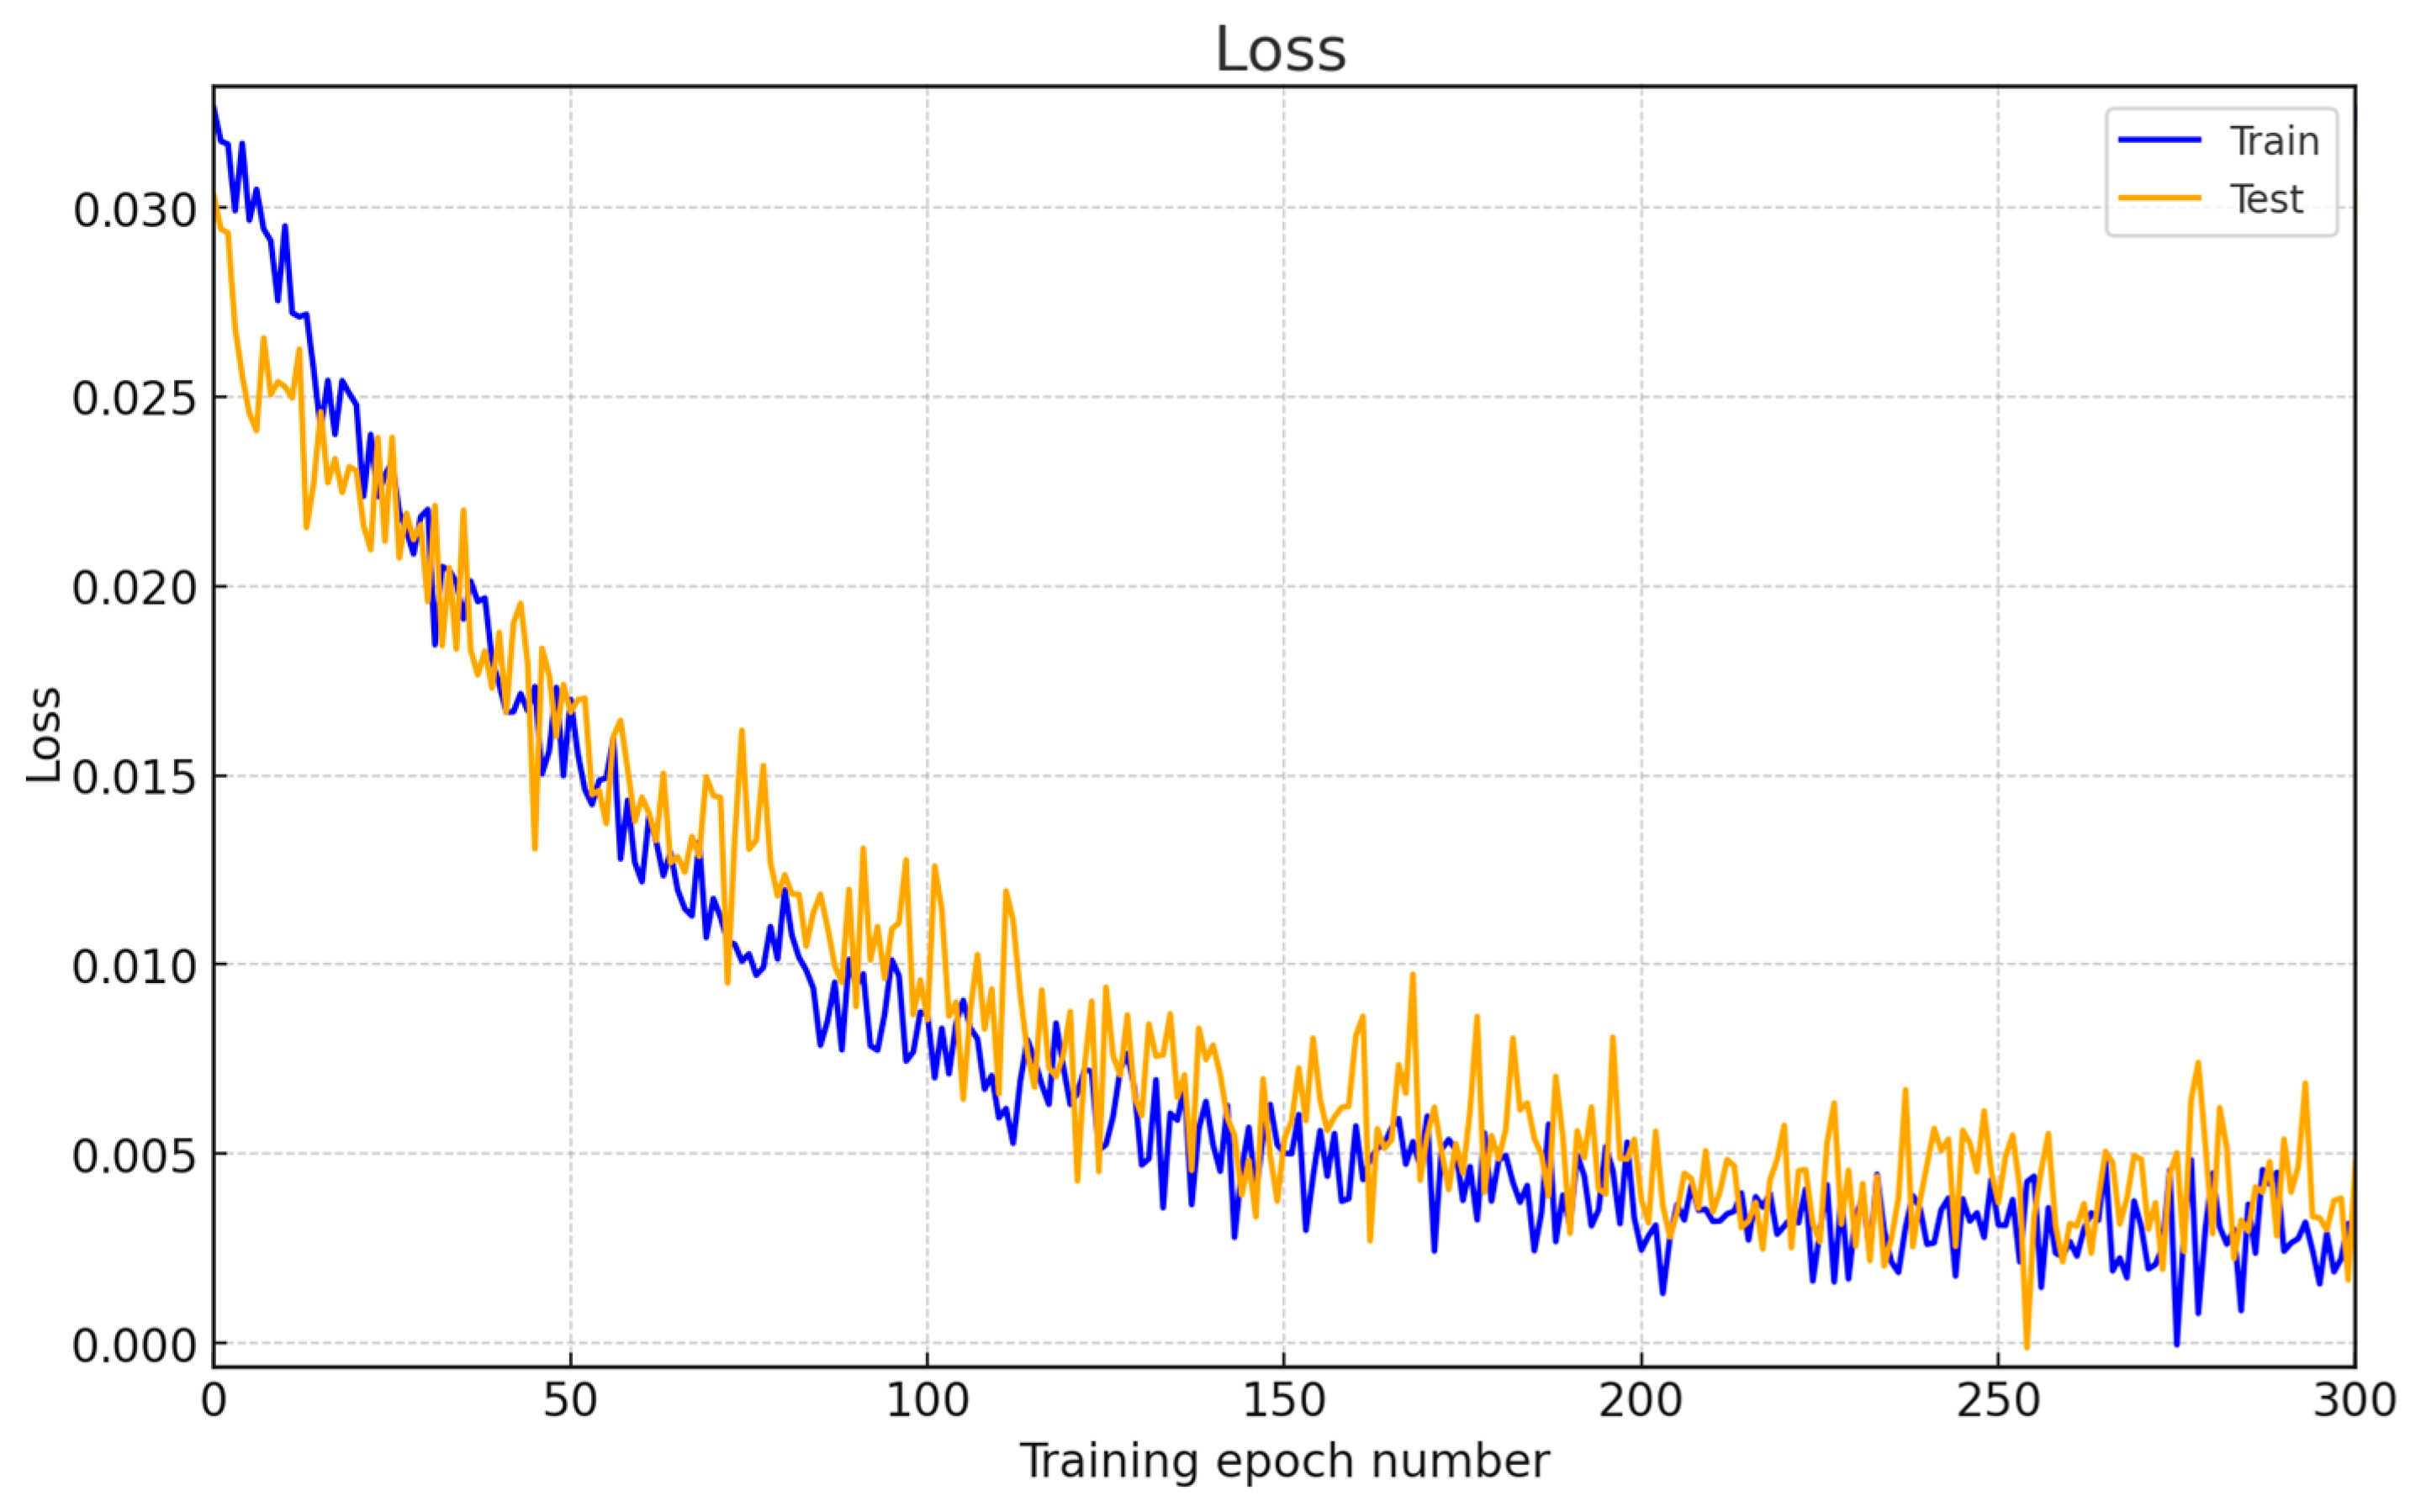
Figure 8 and
Figure 9 show the
accuracy and
loss metrics diagrams for 300 epochs of neural network training. In this case, based on [
31], the following data were used when deriving the results:
The
accuracy metric diagram (
Figure 8) shows the model’s accuracy on the training and validation datasets increasing during training.
Accuracy on the training dataset reaches a value of about 0.995 after 300 epochs, demonstrating that the model almost perfectly matches the target labels.
Accuracy on the validation dataset also increases, reaching a value of about 0.993, indicating that the model generalizes well. The difference (about 0.002) between the metrics on the training and validation data suggests that there is no significant overfitting.
The
loss metric diagram (
Figure 9) shows a gradual decrease in error during the model training process from 0.025 at the initial epoch to 0.005 by the 300th epoch. The training dataset curve (blue line) decreases error compared to the test dataset (orange line), indicating efficient model training without significant overfitting. The final
loss value on the test dataset stabilized around 0.007, indicating the models’ generalization efficiency.
The results of the evaluation of the effectiveness of the developed method compared to the closest analogue [
26] are given in
Table 3. For this aim, the research applied the area under the AUC-ROC curve (
Figure 10), which evaluates the binary classification models’ quality, showing their ability to distinguish between positive and negative classes [
51]. The AUC value reflects the models’ ability to differentiate between normal and surge modes at different decision threshold values [
52]. The closer the AUC is to 1, the higher the classification quality. An AUC value of 0.5 indicates random guessing.
TPR [
51] is the proportion of correctly detected surge cases among all real surge cases.
FPR [
51] is the proportion of standard operation cases incorrectly classified as surges among all typical operation cases. The area under the AUC-ROC curve is calculated as follows:
The proposed method with the closest analogue comparison shows its significant advantage in key metrics. The proposed method demonstrates higher accuracy (accuracy 0.995 vs. 0.972) and a better ratio between precision (0.989 vs. 0.963) and recall (1.0 vs. 0.988), which is confirmed by a higher F1-score value (0.995 vs. 0.975). In addition, the improved TPR (0.813 vs. 0.614) and reduced FPR (0.0105 vs. 0.0318) indicate more efficient detection of target events with fewer false positives. The increase in AUC-ROC from 0.605 to 0.809 confirms the better ability of the proposed method to distinguish between classes and increases its reliability in operational conditions.
4. Discussion
This research proposes a mathematical model based on the actions and specified dependencies of a sequential algorithm for modeling helicopter TE protection against a surge in the starting mode with a metered fuel supply and maintaining compressor stability. In the first stage, fuel is supplied according to a specified program (1). The second stage involves the unstable compressor operation signal formation based on the gas temperature in front of the compressor turbine and the gas generator rotor speed derivatives ratio (2). When this ratio exceeds the threshold value (3), an instability signal is sent, which at the third stage leads to stopping the fuel supply and turning on the ignition system for specified time intervals. Then, the fuel supply is resumed with a reduced flow rate according to (4), and at the fourth stage, it is smoothly restored to its original value according to (5). The fifth and sixth stages include determining the rotor speed change dependence (6) and adjusting it when the ignition is turned on (7). The process (seventh stage) is completed by switching to the ordinary operation mode after the start is complete. The developed model provides dynamic control of fuel supply and rotor speed, preventing the compressor’s unstable operation.
The developed mathematical model is implemented as a method, and the structural diagram is presented in
Figure 1. According to this diagram, unit 1 calculates the gas temperature before the compressor turbine and the gas generator rotor speed derivatives ratio. Unit 2 compares it with the threshold value and, if the threshold is exceeded, generates the
H1 signal, indicating the compressors’ unstable operation. Unit 3 starts the timer for 0.3…0.4 s and generates the
H2 signal to temporarily stop the fuel supply. Units 4 and 5 control the fuel supply stop and the ignition system inclusion. Unit 6 adjusts the fuel supply program, block 7 generates the adjusted fuel consumption, and block 8 regulates the gas generator rotor speed, reducing it by 28…32% if necessary. The system provides a restart with program adjustment to stabilize the engine operation.
To implement the helicopter TE protection method under surge conditions, a neural network method is proposed (
Figure 2), which performs the functions of control, signal processing, and logical control. The proposed neural network consists of several specialized layers simulating the operation of units 1–8. The input layer receives the gas temperature in front of the compressor turbine
, and the current speed of the turbocharger rotor
nTC values are passed to the next layer for processing. The derivative calculation layer calculates the derivatives
and
, as well as their ratio, which are passed to the recurrent layer (e.g., LSTM). The threshold comparison layer performs logical control and generates the
H1 signal if the
ratio exceeds the threshold value. The timer layer starts counting down the time upon receiving the
H1 = 1 signal and, after 0.3…0.4 s, generates the
H2 = 1 signal, which is removed after a delay. The AND logic layer for stopping the fuel supply generates a fuel stop command at
H1 = 1 and
H2 = 1 and turns on the ignition—at
H1 = 1 and
H2 = 0. In the fuel consumption correction layer with the
H3 = 1 signal, the
H4 signal is changed from 0.9 to 1.0 in 10 s, adjusting the fuel consumption depending on time. In the multiplying layer, the final value of fuel consumption is calculated. The rotor speed dependence correction layer dynamically adjusts the target frequency by 28…32% depending on the
H3 = 1 signal, ensuring stable engine operation. The proposed neural network architecture allows for the helicopter TE protection automation and control in unstable modes, implementing the anti-surge protection method in the sequential logical and mathematical control format.
To train the developed neural network simulating the helicopter TE protection under surge conditions, a specialized algorithm is proposed, which includes the data generation stages, setting time dependencies, logical conditions, and parameter adjustment. At the initial training stage, input data are simulated, including the gas temperature in front of the compressor turbine and the gas generator rotor nTC current speed, for which derivatives are calculated (12). The surge event is simulated when the derivatives ratio exceeds the threshold value, after which the initial weights and thresholds for the network layers are set (13). Training using error backpropagation over time allows for updating the networks’ hidden states and adjusting logical conditions, such as activation of the H1 signal during the surge. During training, loss functions for logical conditions, time delays, and adjustment signals, such as H4 for changing the fuel consumption (15)–(18), are considered. To optimize the network weights, the Adam algorithm with L2 regularization is used to combat overfitting and improve the generalization capabilities of the model (23)–(27). To optimize the hyperparameters, Bayesian optimization is used (28). The algorithm is highly adaptive to time and logical constraints, ensuring accuracy when monitoring helicopter TE in real operating conditions, taking into account the requirements for the time delays and logical conditions accuracy (30).
The TV3-117 TE, part of the Mi-8MTV helicopter power plant, was selected as the research object to conduct the computational experiment. The TV3-117 TE parameters (
nTC,
, etc.) required for the experiment were obtained exclusively from the flight data during the engine starting of the Mi-8MTV helicopter (
Figure 3). Data recording was performed on board using D-2M sensors and 14 T-101 dual-circuit thermocouples [
30] (data recording was performed in accurate flight for 256 s with a sampling period of 1 s). The specified data were provided to the authors’ team upon an official request to the Ministry of Internal Affairs of Ukraine and are intended for the projects’ “Theoretical and Applied Aspects of the Aviation Sphere” implementation, officially registered in Ukraine under number 0123U104884. As part of this study, a computational experiment was conducted using the developed neural network method to protect the helicopter TE from surge in the TV3-117 TE starting mode on a semi-naturalistic modeling stand (
Figure 5) designed to reproduce and analyze actual engine operating conditions, including various load, temperature, and pressure modes. The stand allows testing control systems, practicing control and diagnostic algorithms, and assessing helicopter TE operation stability under various external influences.
During the simulation, the TV3-117 TE surge occurrence in the starting mode was reproduced, and diagrams of pressure change behind the compressor during the surge, vibration level change, compressor rotor speed dynamics, and gas temperature at the turbine outlet change during the surge were obtained (
Figure 6). It was found that the following phenomena accompany surge: fluctuations in pressure, speed, and gas flow rate along the tract with a pronounced pressure drop behind the compressor relative to the pressure at its inlet; an increase in the vibration level; a decrease in the gas generator and free turbine rotors speed; and an increase in the gas temperature at the inlet and outlet of the compressor turbine. A diagram of the gas generator rotor speed change was obtained, showing a decrease of 29.7% (
Figure 7), which helps to prevent surge and stabilize compressor operation under starting conditions, namely: no fluctuations in pressure, speed, and gas flow rate along the tract with a pronounced pressure drop behind the compressor; no increase in the vibration level; the gas generator and free turbine rotors speed stabilization; and the gas temperature at the inlet and outlet of the compressor turbine stabilization. This setting ensures the smooth restoration of the fuel supply, minimizing the risks of emergencies. As shown by the computational experiments series results, stopping the fuel supply to the engine combustion chamber for a given time and resuming the fuel supply with a reduced flow rate
leads to repeated compressor instability (diagrams similar to
Figure 6 were obtained). Repeated compressor instability is prevented by additionally adjusting the software dependence (6) with a decrease in the
nTC value by 28…32% when the ignition device is turned on again and maintaining the adjusted reliance (7) until the start is complete. Decreasing the
nTC value by <28% is undesirable since repeated compressor instability is highly probable. Decreasing
nTC by >32% will not solve this problem since this will lead to a shift in the fuel consumption along the engines’ static characteristic and, as a result, to a long start time or its termination.
The following metrics were used to assess the neural network (
Figure 2) quality in the helicopter TE surge monitoring task in the starting mode:
accuracy,
precision,
recall,
F-measure, and others.
Accuracy reflects the correct predictions proportion;
precision and
recall are essential for assessing the unbalanced classes’ case model performance. The
accuracy diagram (
Figure 8) shows an increase in accuracy on the training (0.995) and validation (0.993) datasets, which indicates the models’ good generalizability. The
loss diagram (
Figure 9) demonstrates a decrease in error from 0.025 to 0.005, which confirms practical training without overfitting. The proposed method outperforms its analogue in the metrics: accuracy 0.995 vs. 0.972, precision 0.989 vs. 0.963, and recall 1.0 vs. 0.988, which is confirmed by a higher
F1
-score (0.995 vs. 0.975) and improved
TPR (0.813 vs. 0.614). The increase in
AUC-ROC from 0.605 to 0.809 confirms the better ability of the method to distinguish between classes.
This mathematical model’s main limitations are its dependence on the accuracy of the data obtained, such as the gas temperature in front of the compressor turbine and the gas generator rotor speed, as well as the need for constant adjustment of the models’ parameters in actual operating conditions. The model requires accurate measurements and current data on the engine condition for correct operation, which can be difficult in unstable operating conditions.
Prospects for further research include improving the models’ accuracy by integrating additional sensors [
53] for improved gas temperature [
54] and rotor speed [
55] measurements and developing methods for the models’ automatic adaptation to changing operating conditions [
56,
57]. An important direction is to improve the algorithms for working with incomplete or noisy data [
58], increasing the models’ stability in unstable modes. In addition, it is necessary to study the method of applying the possibility to the engines’ other types with different characteristics [
59,
60] and develop methods for the neural network model protecting against overfitting when working with limited data. It is also proposed that alternative methods be studied to optimize hyperparameters and expand the models’ functionality for implementation in natural aviation systems with increased reliability and safety requirements.
In addition, prospects for further research in the helicopter TE mathematical model development and improvement field protection include improving the accuracy of models by integrating additional sensors for more accurate measurements of gas temperature and rotor speed, as well as developing methods for automatic adaptation of models to changing operating conditions. The working algorithms optimization with incomplete or noisy data is also a critical task for increasing stability in unstable modes. Conducting case studies in real conditions will help demonstrate the effectiveness of the methods and confirm their relevance, showing how improvements reduce the unstable engine operation risks and increase operational reliability, which is especially important for new aviation systems with high safety requirements.

 ,
, 


