1. Introduction
In 2018, the National Council for the Evaluation of Social Development Policy (CONEVAL) stated that 42% of the population of Mexico lives below the official poverty line, and 7.4% are in a situation of extreme poverty (
https://www.coneval.org.mx/Medicion/MP/Documents/Pobreza_18/Pobreza_2018_CONEVAL, accessed on 20 December 2023). In Mexico, as in other developing countries with high CO
2 emissions, the socioeconomic welfare losses suffered by much of the population due to high energy prices are particularly critical. It is therefore important to focus on the development of optimal climate policy, poverty reduction, and further economic development. In recent years, the potential negative environmental and global warming effects of energy subsidies have been the subject of international attention. In Mexico, these subsidies, mainly on electricity and gasoline consumption, are among the highest in the world, and their costs go beyond the environmental effects that directly affect the population. In 2009, as part of the G20 and Asia-Pacific Economic Cooperation (APEC) agreements, Mexico committed to “phase out and rationalize over the medium-term inefficient fossil fuel subsidies, which encourage wasteful consumption… while providing targeted support for the poorest” (G20 (2009) Declaración de los Líderes del G-20 en la Cumbre de Pittsburgh y APEC (2009) APEC Summit Leaders’ Declaration: Sustaining growth, connecting the region.
https://www.apec.org/meeting-papers/leaders-declarations/2009/2009_aelm.aspx, accessed on 17 October 2023). In 2017, Mexico was one of twelve members of the World Trade Organization (WTO) to present a statement at the 11th Ministerial Conference to promote the debate on fossil fuel subsidies at the WTO (OMC (2017) Fossil Fuel Subsidies Reform Ministerial Statement
https://www.wto.org/english/tratop_e/envir_e/fossil_fuel_e.htm, accessed on 1 March 2023).
In a World Bank study on global energy subsidies [
1], it was stated that electricity tariffs in emerging markets and developing countries do not cover the suppliers’ generation, transmission, and distribution costs. It was also noted that these costs are not calculated based on the provision of the service, but only on the price of the resources required. In the case of Mexico, electricity subsidies cost the Federal Government an average of MXN 98 billion (USD ~5 billion) every year, 0.9% of the gross domestic product (GDP).
In developing countries, such as Mexico, energy subsidies tend to benefit two groups of end users: low-income and high-income users. This creates two major problems: the effects are regressive (disproportionately benefiting those who consume most, rather than the poorest), and it reduces the opportunity for subsidies to be directed toward other development goals.
The purpose of this article is to analyse the residential demand for the fuels most used in Mexican homes, showing the price and income elasticities of demand. The analysis is carried out using a QUAIDS model; the results obtained help provide information relevant to the decision-making process for the design of more effective energy policies, in the area of energy-saving policies and the reduction in greenhouse emissions.
On the other hand, this paper aims to show the impacts on urban and rural households in Mexico caused by the rise in energy prices when fuel and electricity subsidies were eliminated, and/or when there was an increase in the carbon tax. Several simulations were carried out, showing that the present policy regarding subsidies benefits the poorest far less than is expected.
2. Overview of Energy Demand in Mexico
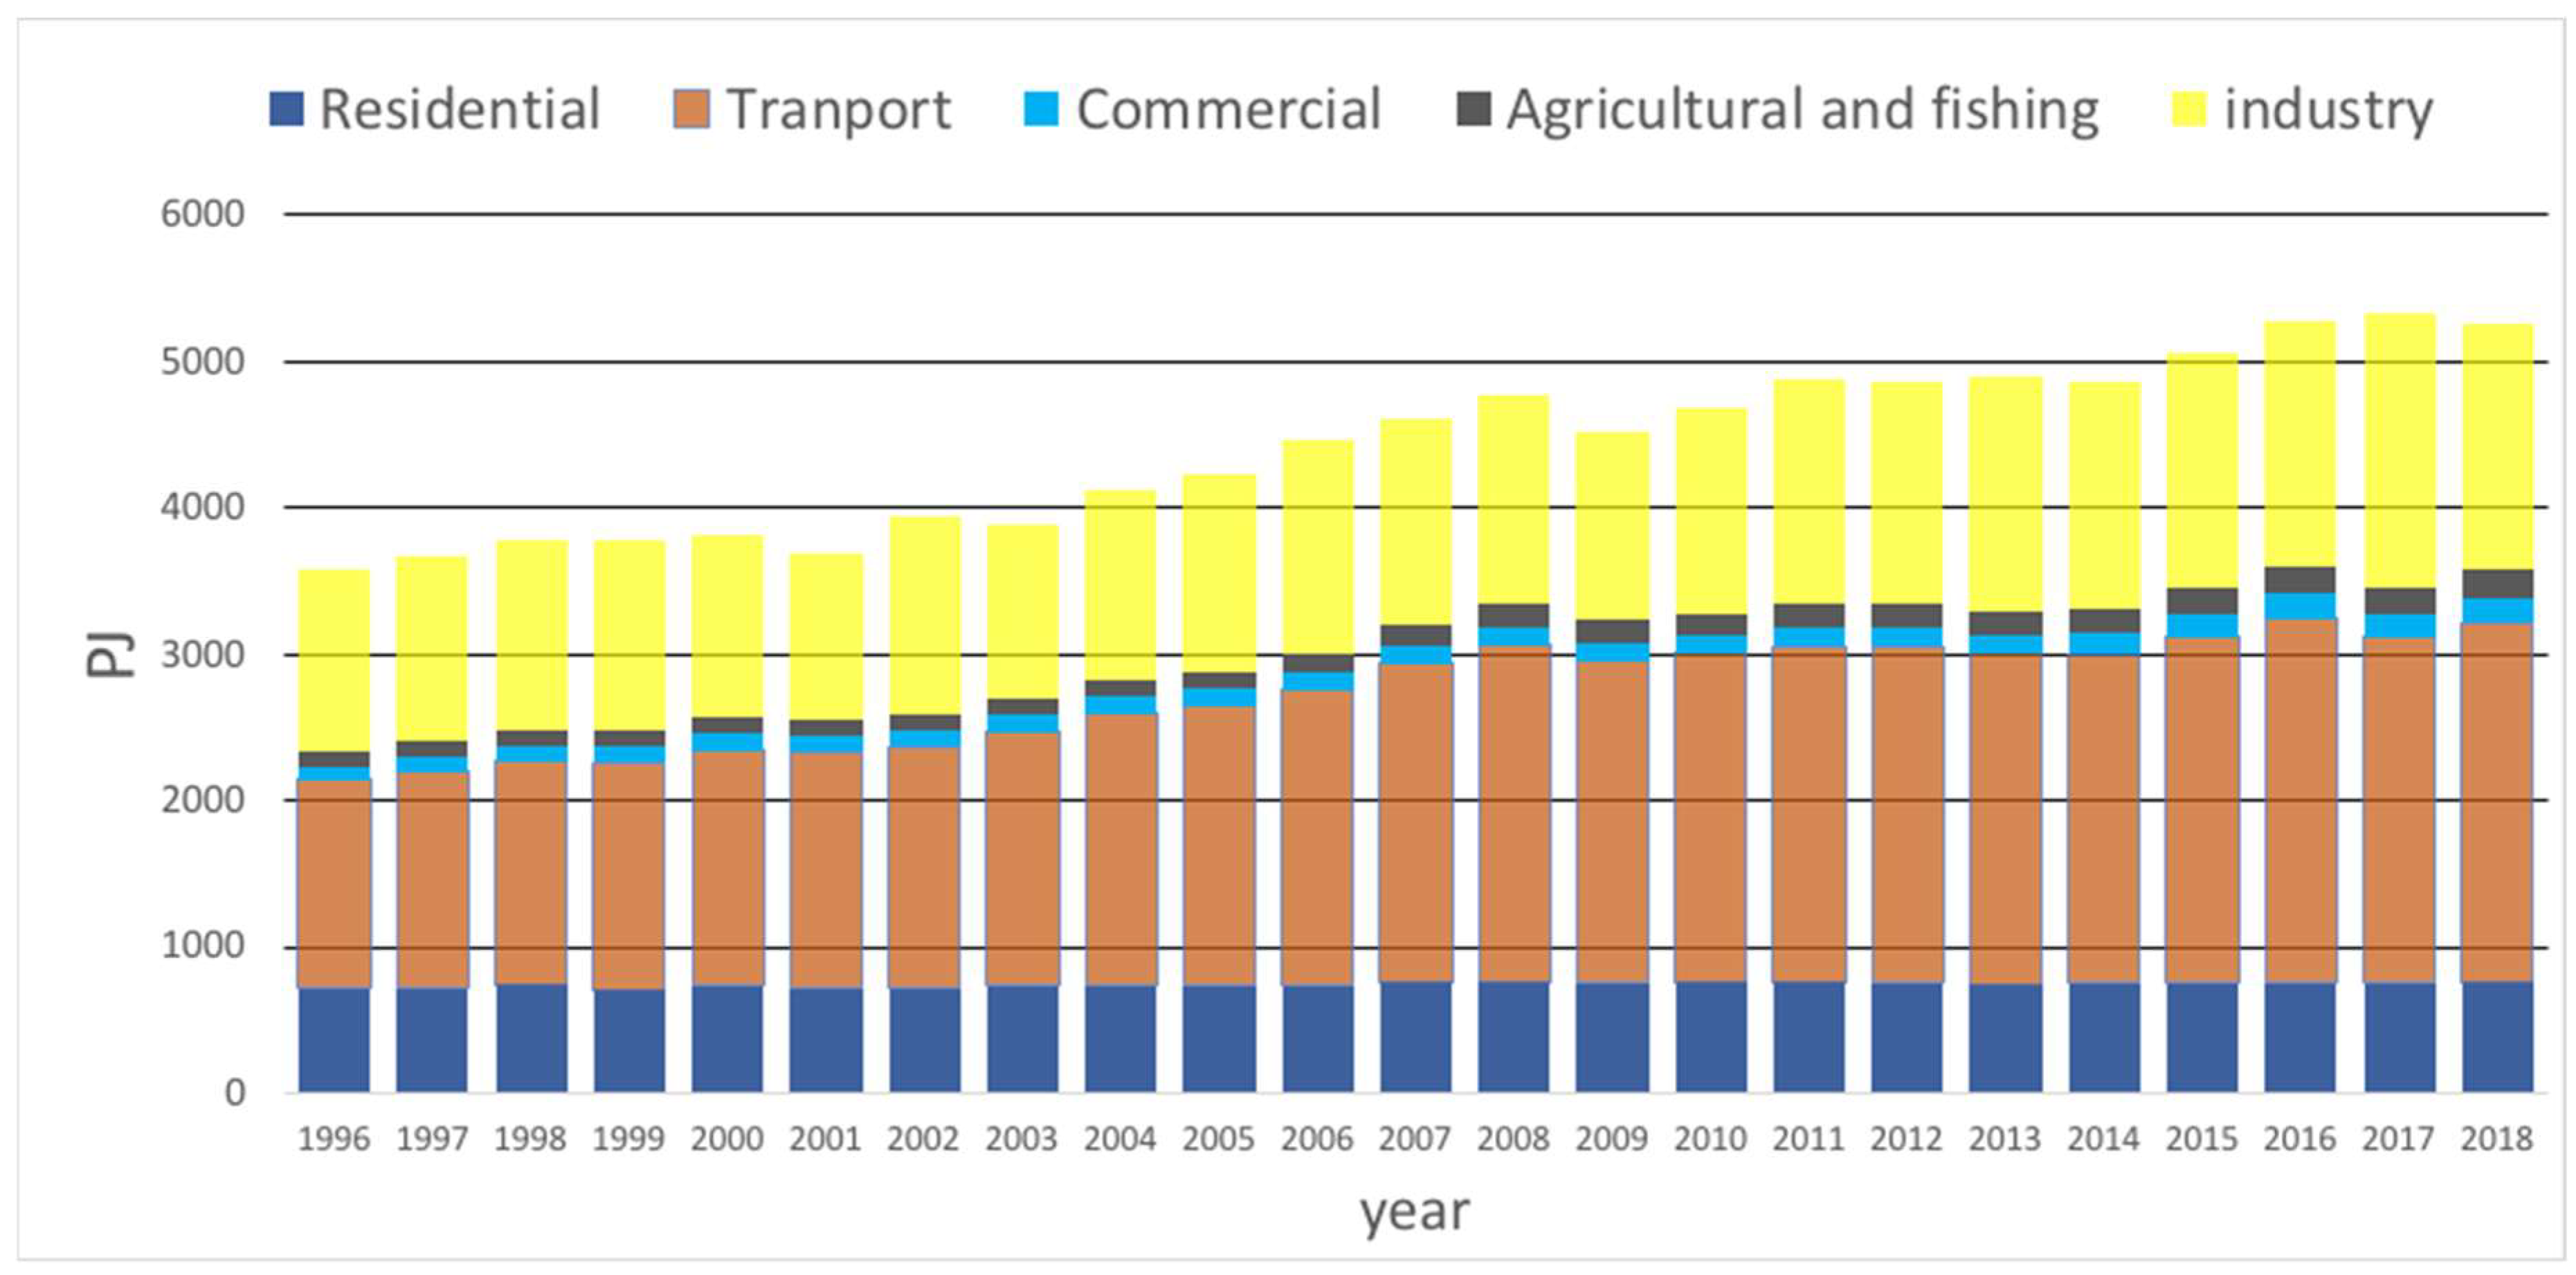
Analysing energy consumption in Mexico from 1996 to 2018, (
Figure 1) in Mexico, it is seen that in 2018, transportation accounted for 46.5% of the total energy consumption, 31.8% was used in the industrial sector, and 14.3% was used in the residential sector. Over this period, the energy consumed by the residential sector increased 5.9%, although its share of the total energy used decreased from 20% to 14.3%, a decrease that may be, in part, due to the growth in the energy demand from the transportation sector.
In the residential sector, the energy used includes that for cooking, heating, lighting, cooling, and entertainment. To meet these demands, various sources of energy are used, such as electricity, liquefied petroleum gas (LPG), natural gas, kerosene, and wood.
Figure 2 shows the energy consumed in the residential sector in the same period, by fuel type. The amount of electricity used in this period grew by 3.2% per year on average, the highest growth rate of the fuels considered, its share in the overall consumption rising from 14% in 1996 to 23% in 2018. On the other hand, the share of LPG fell from 43% in 1996 to 38.5% in 2018, while firewood showed a more significant drop (from 39% to 30%).
2.1. Fuel Subsidies in Mexico
In Mexico, subsidies are granted by the government to the state-owned electricity generation company, the Federal Electricity Commission (CFE), to cover electricity generation costs. This subsidy increases as generation prices rise, benefitting 40 million households; between 2010 and 2020 the electricity subsidy accounted for 0.22% of the national GDP [
2].
On the other hand, the price of gasoline has a Special tax on products and services (IEPS) that the government uses as a subsidy. By lowering this tax, the government controls the price paid by the consumer. In 2012 this subsidy was 1.28% of the GDP (DOF 2015) [
3].
In 2015 the Ministry of Finance and Public Credit (SHCP) updated the methodology to determine the fiscal stimulus on automotive fuels in terms of the special tax on production and services (IEPS). This regulates the price paid by the final consumer by reducing the IEPS paid by the consumer.
Energy subsidies in Mexico are questionable as a public policy, since they have collateral effects on both the population and the environment.
Energy subsidies are not an efficient means of providing support to the poor, and reinforce income inequalities, as most of the benefits of these subsidies go to those who can afford to consume more energy (rich households). This inequality is more acute in rural areas.
Energy subsidies consume resources that could be used to guarantee services that are human rights, such as health and education, or that could be used in Mexico’s economic development, e.g., for infrastructure.
Figure 3 shows the percentage of the GPD used in subsidies from 2010 to 2020.
The low energy prices, as a result of the subsidies, discourage investment from the private sector and reduce the stimulus for energy-efficient strategies to be used the consumer.
Inefficient energy consumption in turn produces higher CO2 emissions, and thus indirectly increases pollution in cities.
2.2. Studies on Fuel Subsidies
There are several studies on developing countries showing that fuel subsidies result in a regressive distribution, meaning that high-income households receive higher amounts of subsidies than low-income households do. For example, Ref. [
4] described carbon tax distribution in India, Ref. [
5] analysed carbon tax distribution in Brazil, while carbon taxes and poverty in Thailand were discussed by [
6].
A study on developing countries published by [
7] concludes that the direct effect is either distributionally neutral, approximately (Bolivia and Mali), or regressive (Ghana, Jordan and Sri Lanka). There are very few studies on the distributional effects of fuel subsidies in Mexico, where it is underlined that the electricity and LPG consumed in Mexican households are normal goods, not luxuries, while gasoline is a luxury good. An initial study on the distributional effects of the elimination of subsidies and carbon taxes [
8] found that the reduction in gasoline subsidies is progressive.
Other econometric studies in Mexico that use the general equilibrium model [
9] show how distributional effects depend to a large extent on income recycling. While this does not explicitly cover the distributional effects of recycling, it does show various effects on the population [
10]. These results have helped in the development of Mexico’s climate policy.
Other studies note the new energy market prices following the Energy Transaction Law of 2015, while an estimate of the distributional effects due to the introduction of carbon tax from 2002 to 2014 was offered by [
11,
12,
13]. Our study describes the distribution of welfare losses in Mexico due to the increase in fuel prices from 1996 to 2018, caused by the elimination of the fuel subsidy, as well as by the increase in the carbon tax. This study also highlights the gap between urban and rural households.
3. Data Description
Data from the National Households Income and Expenditure Survey (ENIGH, from the Spanish abbreviation Encuesta Nacional de Ingresos y Gastos de los Hogares) for 1996–2018 were used for the analysis carried out in this paper. The ENIGH survey is generally conducted every two years to collect data from a large sample of households across Mexico, in rural and urban areas, using the interview method (rural areas include households living in municipalities with fewer than 2500 inhabitants, while municipalities with over 2500 inhabitants are considered urban areas). A detailed description of the sampling methodology is described on the web page of the National Institute of Statistics and Geography (INEGI (household survey):
http://www.inegi.org.mx/est/contenidos/proyectos/encuestas/hogares/default.aspx) accessed on 2 February 2023 (INEGI from the Spanish name) (INEGI 1997 to 2019).
The sampling design is based on stratified random sampling where the households are selected with equal probability, with a random start. Household consumption in the survey includes the consumption of goods and services through purchases, receipts in exchange of goods and services, and others. Household consumption–expenditure refers to the amount and value of household consumption for the first three months of the year during which the survey was conducted. The survey also comprises detailed information on demographic characteristics and the attributes of dwellings.
To make the data suitable for analysis, a series of transformations must be performed. First, all homes with no energy consumption are eliminated, because this is not real information. The operations were carried out in different ways. Some of the variables were first converted into logarithms and/or percentages before conducting the regression analysis. These variables include the price of different fuels, budget participation, and fuel expenditure. This includes the price of the various types of transport, budget shares, and public transport or expenditure on gasoline. All households that report null expenditure for bus, subway, gasoline, and taxi, as well as those with expenditure on each type of transport, were eliminated to avoid outliers. After transforming and filtering the data, 73,508 observations were kept for the estimation and the QUAIDS model could be created.
3.1. Energy Prices in Mexico
The cost of energy in Mexico has many variables, including those of the market, as well as regulations, collection methodologies, and particularities in the way each client consumes energy. This section presents the evolution of energy prices.
3.1.1. Electricity
The Mexican government has subsidized electricity costs for end consumers through tariffs determined by the Ministry of Finance and Public Credit (SHCP) for many years, using information on generation costs from the Federal Electricity Commission (CFE). These subsidies have a high economic and social cost for the country (see
Figure 3).
In 2002, an energy reform made the tariff structure less regressive, introducing a domestic high consumption tariff (DAC), for households consuming over 250 kWh per month. This is a fixed monthly fee that varies by region, and the average monthly cost in 2018 was around USD 5.35 (MXN 100). In November 2017, the Energy Regulatory Commission (CRE) implemented a new means of devising electricity tariffs that is less regressive and will help recover generation and distribution costs.
3.1.2. Gasoline
Although there are other private companies, PEMEX is a federal government-owned public company that owns 85% of the national market. Gasoline prices vary depending on the type of gasoline and the point of sale. On average, the price of PEMEX Premium gasoline is 11–23% higher than that of PEMEX Magna gasoline. For reference, PEMEX Magna was MXN 21.71 per litre in 31 December 2018, equivalent to USD 1.10 per litre (USD 1 was worth MXN 19.65 on 31 December 2018). In 2012, the subsidy for fuels such as gasoline and diesel in Mexico reached a historical maximum of 1.2% of the country’s GDP (see
Figure 3).
3.1.3. Liquefied Petroleum Gas
Like other fuels in Mexico, LPG had a fixed price before 2017, which was lower than international market prices, in effect a subsidy for all end consumers. From 2010, the Mexican government gradually increased prices, bringing them closer to market prices, and by 11 August 2014, with the new hydrocarbons law (
http://www.dof.gob.mx/nota_detalle.php?codigo=5355989&fecha=11/08/2014, accessed on 12 March 2023), market liberalisation came into force in 2017.
3.2. Taxes
In Mexico, there are two Pigouvian taxes that aim to internalize the negative externalities caused by an economic agent that affect the economic activities of other economic agents damaging the environment. The IEPS (Special Tax on Production and Services) is a federal tax applied to automotive gasoline, automotive diesel, and its biofuel equivalents. The revenues from these taxes go to all Mexican states and municipalities to mitigate environmental damage caused by climate change. The 2013 carbon tax has been applied since January 2014 (
https://www.dof.gob.mx/nota_detalle.php?codigo=5547405&fecha=28/12/2018, accessed on 3 May 2023). It is internalized in the Special Tax Law on Products and Services.
3.3. The QUAIDS Model: Background
The empirical analysis uses a quadratic AIDS (almost ideal demand system) model of energy demand in Mexican households. Ref. [
14] combined the Translog and Rotterdam models in the almost ideal demand system (AIDS), which together improve the properties, including the arbitrary approximation for any demand system to the first order, where the information from consumers is added and the homogeneity and symmetry restrictions are tested [
15].
Thus, the AIDS has been used to model clustered asset systems, but with this model, it is difficult to obtain the effects of the nonlinear theory of Engel curves.
With these restrictions, a quadratic term is added in the logarithm of income to the AIDS model and thus the quadratic model is obtained, giving greater flexibility to the demand system.
This model was presented as a proposal to support the characteristics of congruence with microeconomic theory in terms of homogeneity, maximisation, and Slutsky symmetry, but through the inclusion of nonlinearity, it achieves a better approximation of the Engel curves of certain product groups. By adding quadratic and logarithmic terms in the model, goods are allowed to behave as luxury products for certain income levels and as necessities, or basic products, at other levels.
The representation is thus achieved reasonably well by incorporating the quadratic term. Ref. [
16] showed that for demand models, the rank two generalized linear form is a necessary and sufficient measure. The quadratic almost ideal demand system (QUAIDS) is ranked third and can improve nonlinear Engel curves in an empirical analysis.
There has been work conducted for Latin American countries where, based on the estimation of a demand system, estimates of price and income elasticity are made. These works include those of [
17,
18,
19]. Based on the 1987–1988 and 1995–1996 expenditure surveys in Brazil, Ref. [
17] employed an AIDS model using the two-stage budget allocation technique to calculate elasticities for different population groups (the richest 50% and the poorest 50%) and the total elasticities for the basic food groups and subgroups. Ref. [
18] estimated values for basic basket products, based on the AIDS model with time series data from the 1967–2007 period from the National Accounts for Colombia. Ref. [
19] used the income survey and Colombia’s 2006–2007 expenditures, and estimated various linear demand systems through cross-sectional models.
As seen in the international literature, various parametric and non-parametric specifications have been developed for the estimation of Engel curves. For this, different estimation methods have been considered, linearity or non-linearity, in expenditure or income, which shows the importance of making estimates using income strata since elasticities vary greatly between different groups.
Likewise, Refs. [
20,
21] estimated a complete food demand system for Italy and Indonesia, respectively, from the QUAIDS models, also incorporating demographic and regional variables.
4. The QUAIDS Model of Demand
The AIDS model, originally introduced by [
14] has been widely adopted in estimating demand elasticities and energy demand systems [
22,
23,
24,
25]. On the other hand, Ref. [
26] presents a generalisation of the QUAIDS model. The quasi-ideal quadratic demand system (QUAIDS) allows for a more flexible relationship between the share of spending on goods and total household spending. Studies carried out in various countries have used this method, for example Spain, Germany, and the United States, as shown by [
25,
27,
28].
The QUAIDS model is a system of equations that represents the proportion or share of residential spending on a good as a function of prices in addition to the total spending on all the goods that make up the system. According to [
15], the model is as follows:
where the subscripts
i and
j correspond to the different goods in the size budget,
n, while identifying each household. The term
wi represents the proportion of expenditure on the good,
i, that each household makes within the basket. The variables
pj and
x refer to the price of good
j and the total expenditure on all goods in the system in each household, respectively. The nonlinearity of the QUAIDS model is due to the indices of prices
a and
b, defined as follows:
where ln
a(
p) is the transcendental log function
and
b(
p) is the Cobb–Douglas price aggregator.
From Equation (1), it can be seen that the significance of parameter
λi indicates that residential spending should be analysed using a QUAIDS model; otherwise, the AIDS model of [
14] is the most suitable. As mentioned, one of the advantages of the QUAIDS model is that its functional form considers the rational behaviour of a consumer. In order for this to be satisfied, the model parameters are subject to the following restrictions:
The adding up restriction can be satisfied by dropping one equation from the estimation. The homogeneity and symmetry restrictions can be imposed on the parameters to be estimated and assessed using likelihood ratio tests.
4.1. Demand Elasticities
To evaluate consumer elasticities and distribution quantities in relation to changes in spending and prices, spending elasticities, Marshallian price elasticities, and Hicks price elasticities were calculated using the indicated parameters of QUAIDS models during the study period. The budget elasticities could be calculated from the following equations.
It should be remembered that the coefficients that go with prices and total expenditure in the QUAIDS model do not correspond to the price and income elasticities of demand. These sensitivity measures are obtained through the expressions (7)–(9). This analysis was conducted using a QUAIDS model adapted to consider the censoring that arises because not all households consume all fuels at the same time.
The significance of the residuals of the auxiliary regression in all the equations of the system confirms that residential spending on the goods analysed is an endogenous variable. Furthermore, the significance in two equations of the inverse of the Mills ratio in the system of equations corroborates the importance of treating censoring in residential energy expenditure.
The uncompensated price elasticity is given by the following:
According to Roy’s identity, the budget shares are given by the following:
4.2. Welfare Effects (Simulation)
To determine the impacts of price changes on the well-being of the population, a simulation was carried out that made changes to the prices of energy systems [
29]. The simulation illustrated the impacts on welfare resulting from the changes in energy prices caused by the implementation of carbon taxes, in three different scenarios, for several households (this work use stata files from the paper of [
29], with data on Mexico).
Our measure of the effect on welfare of a price change is the compensating change: the amount of income that must be given to a household for it to be indifferent to the new price vector. This calculation is carried out using the following expression:
On the other hand, for each household in the sample, to evaluate the effects on welfare of a specific set of increases in fuel prices, the following equation was used:
where
is the price change of good
i,
is the price before the implementation of the price or rate increase, and
is the new price resulting from a new price or tariff.
The literature on the welfare impacts of increases in energy prices and subsidy reforms generally focuses on first-order effects, as in [
30]. These first-order effects, based on the earlier work of [
31,
32], only require observed demand, and no additional information on the substitution behaviour resulting from price changes. First-order welfare losses relative to income (total expenditures are used as a proxy) are calculated as follows:
With the estimated coefficients, we calculated a second-order approximation of the compensatory variation (CV), which is the amount of money that the household needs to be compensated to reach utility level u0 (before the price changes) over total household expenses:
The CV is compared with the first-order effect to clarify the need to estimate a demand system in our context.
4.3. The Effects of Reducing Subsidies and Increasing Carbon Taxes
Microsimulations of price and tax increases have been used to evaluate the welfare and distributional effects of carbon tax in several countries, for example by [
33] for the United States, [
34] for Denmark, [
28] for Italy, [
35] for Ireland, [
29] for South Africa, and [
8,
12,
13], for Mexico.
The additional contribution offered here is the use of the QUAIDS model to evaluate the welfare loss from subsidy elimination and the increase in the carbon tax for fuels.
The first simulation considers the total elimination of energy subsidies for electricity, LPG, and gasoline, respectively. The second considers the implementation of a carbon tax (USD 25/ton) on unsubsidized electricity, LPG, and gasoline prices. The third simulates the effect of the first and second simulations. The ENIGH dataset, which details expenditure in the first quarter of 2018 for 14,265 households, was used for all the simulations.
Table 1 shows the percentage price changes for electricity, LPG, and gasoline for the three scenarios.
5. Results
Table 2 shows the elasticities obtained using the income, prices, and expenditures for the dataset used;
Table 3 shows the parameters obtained in the QUAIDS model. Budget elasticities for electricity, LPG, and public transport are less than one, because for the average household in Mexico, these items are necessities, which is consistent with the literature consulted. However, gasoline is considered a luxury good; its budget elasticity is greater than one. The results show that income is a key determinant of fuel demand when the price changes. Both uncompensated and compensated price elasticities show the expected negative signs; households in Mexico have an inelastic response to the price of electricity, gasoline, and public transport, while for LPG the response is elastic. Uncompensated price elasticities show that electricity and public transport are inelastic, and that LPG and gasoline are elastic. Cross-price elasticities show that electricity and LPG are substitutes and that the relationship is symmetric, probably due to the increased use of electricity for cooking. On the other hand, gasoline–electricity and gasoline–transportation are complementary.
5.1. Welfare Effects
As the distribution of the results for simulations 1 and 2 are similar, but with different magnitudes, only the results of simulation 3 are given in this section. The results of simulations 1 and 2 are presented in
Appendix A. The changes experienced by households as a result of the removal of subsidies and the implementation of a carbon tax of USD 25/ton CO
2 equivalent to the energy price, shown in
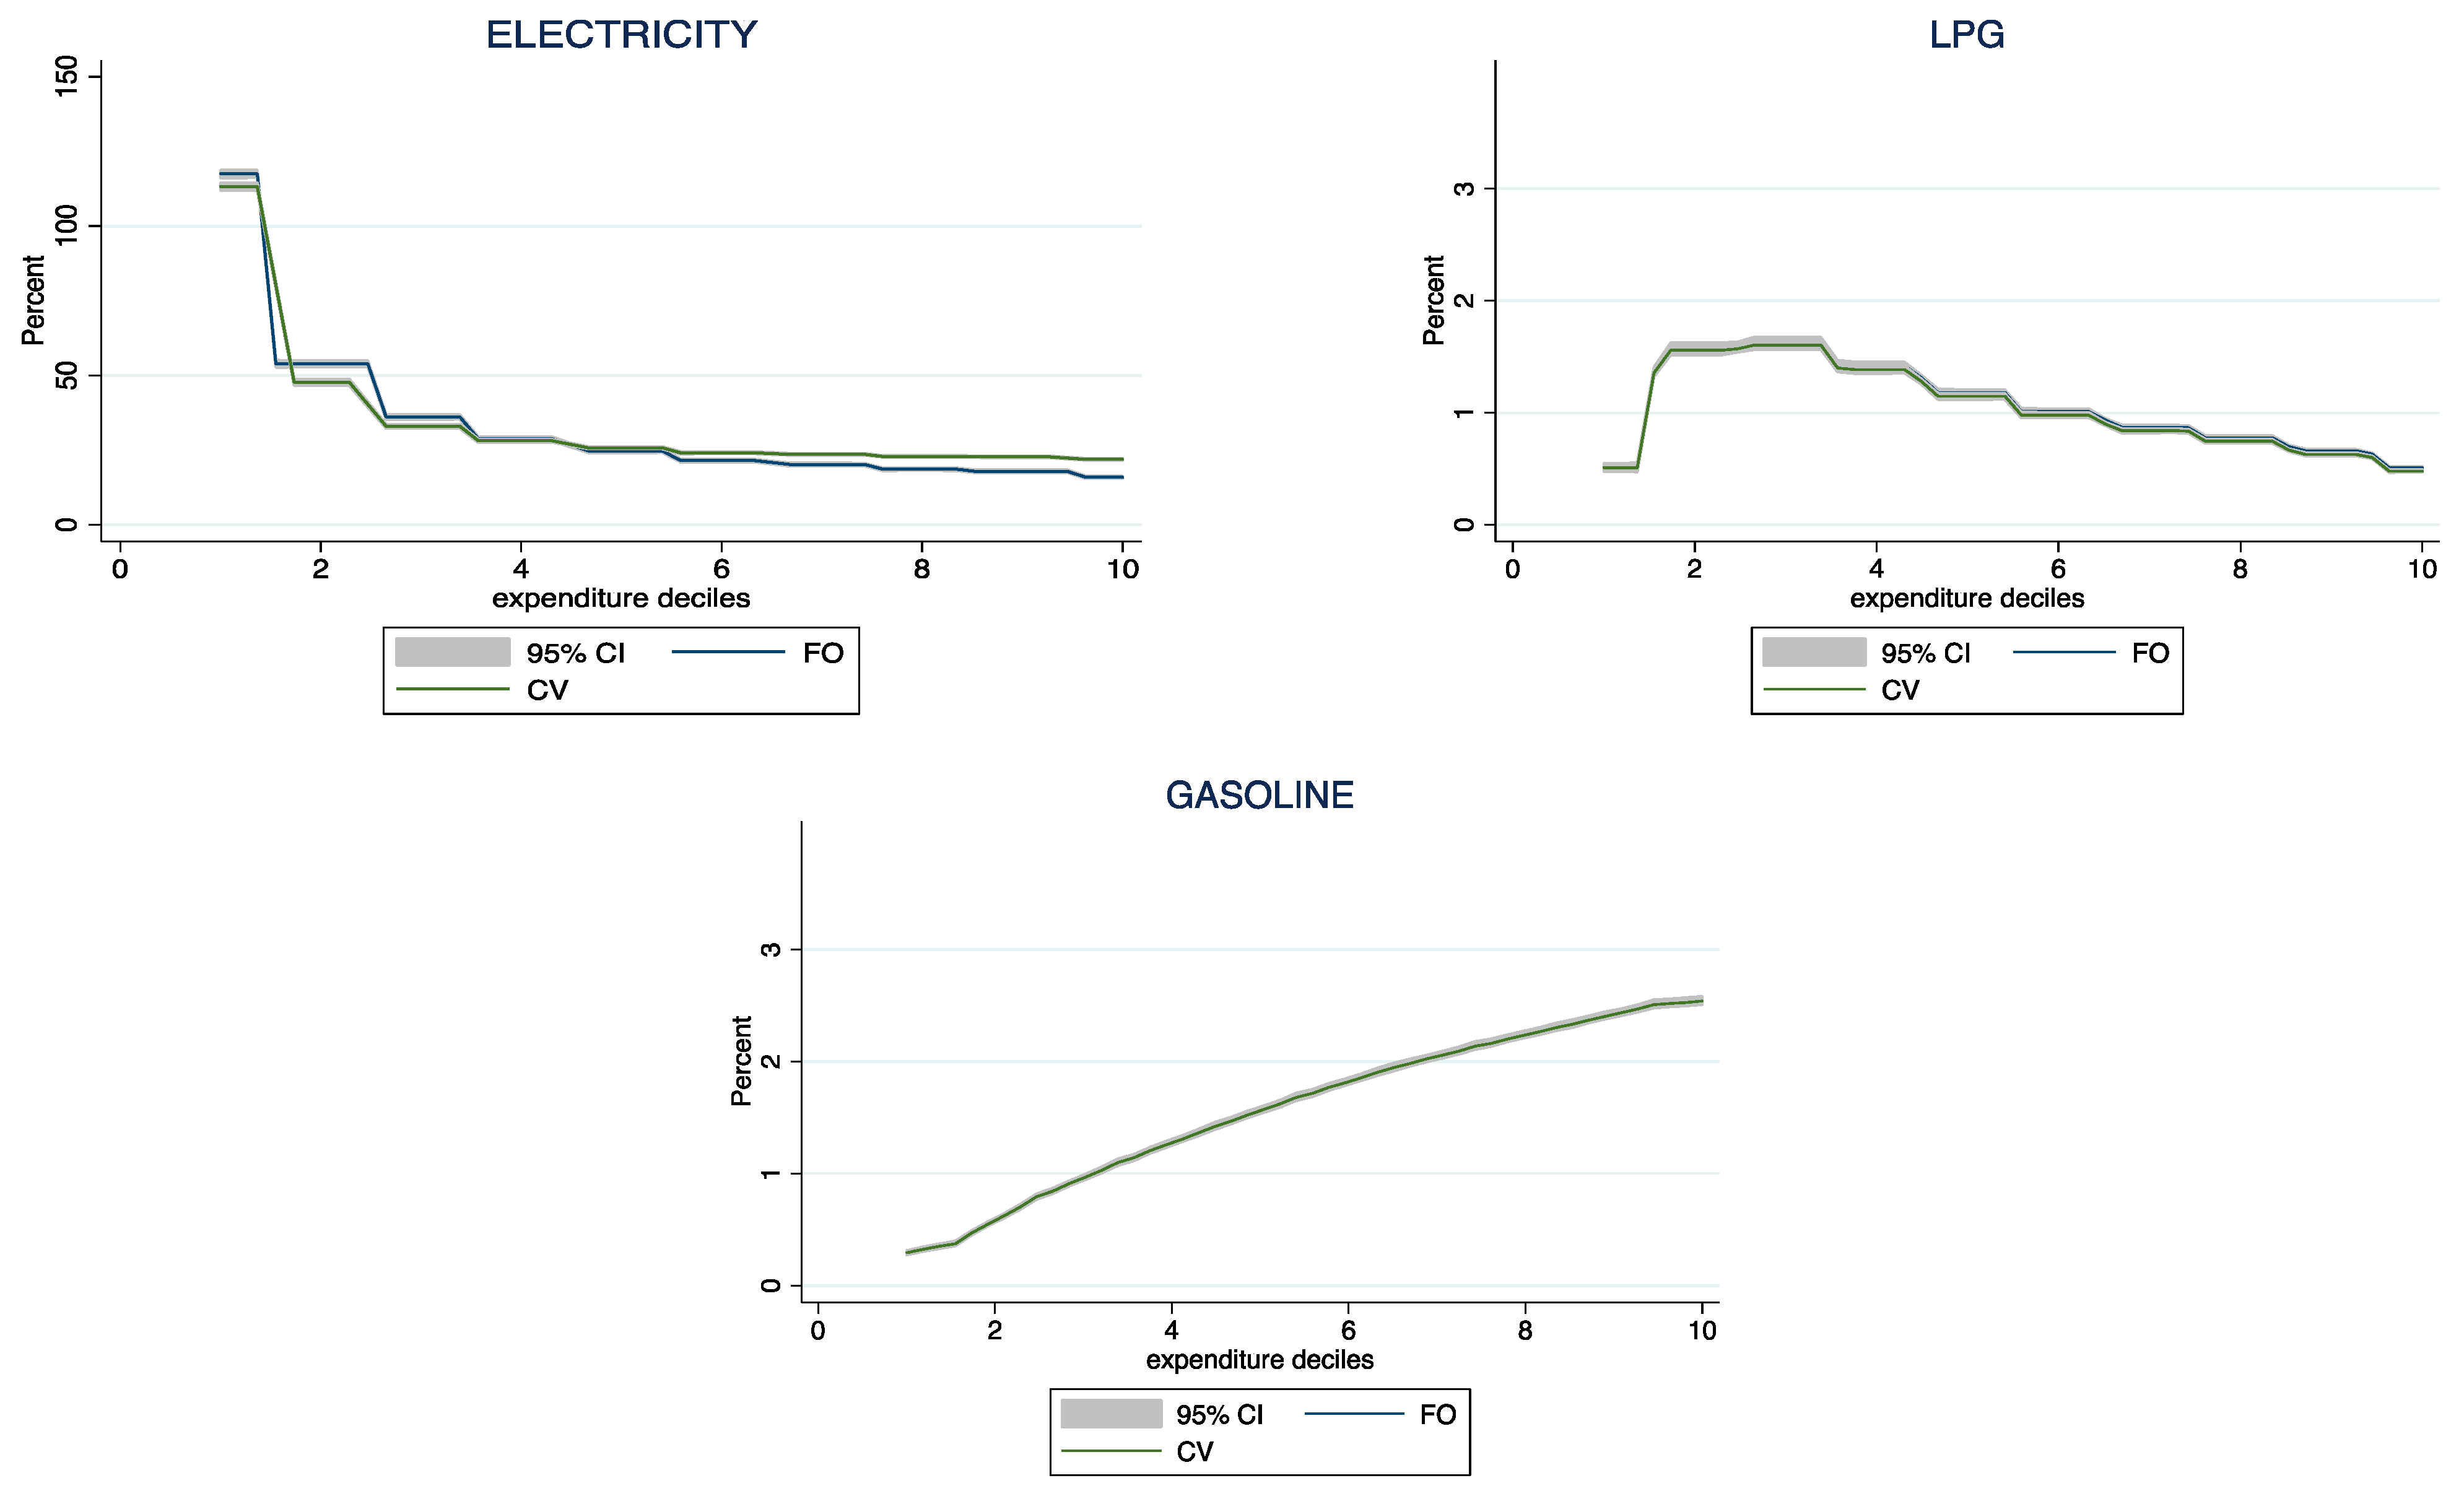
Table 1, are presented in this section. The first- and second-order effects on the welfare of the fuels studied are shown in
Figure 4. There is no significant difference between the first- and second-order results at a 95% confidence interval for a change in electricity, LPG, and gasoline prices.
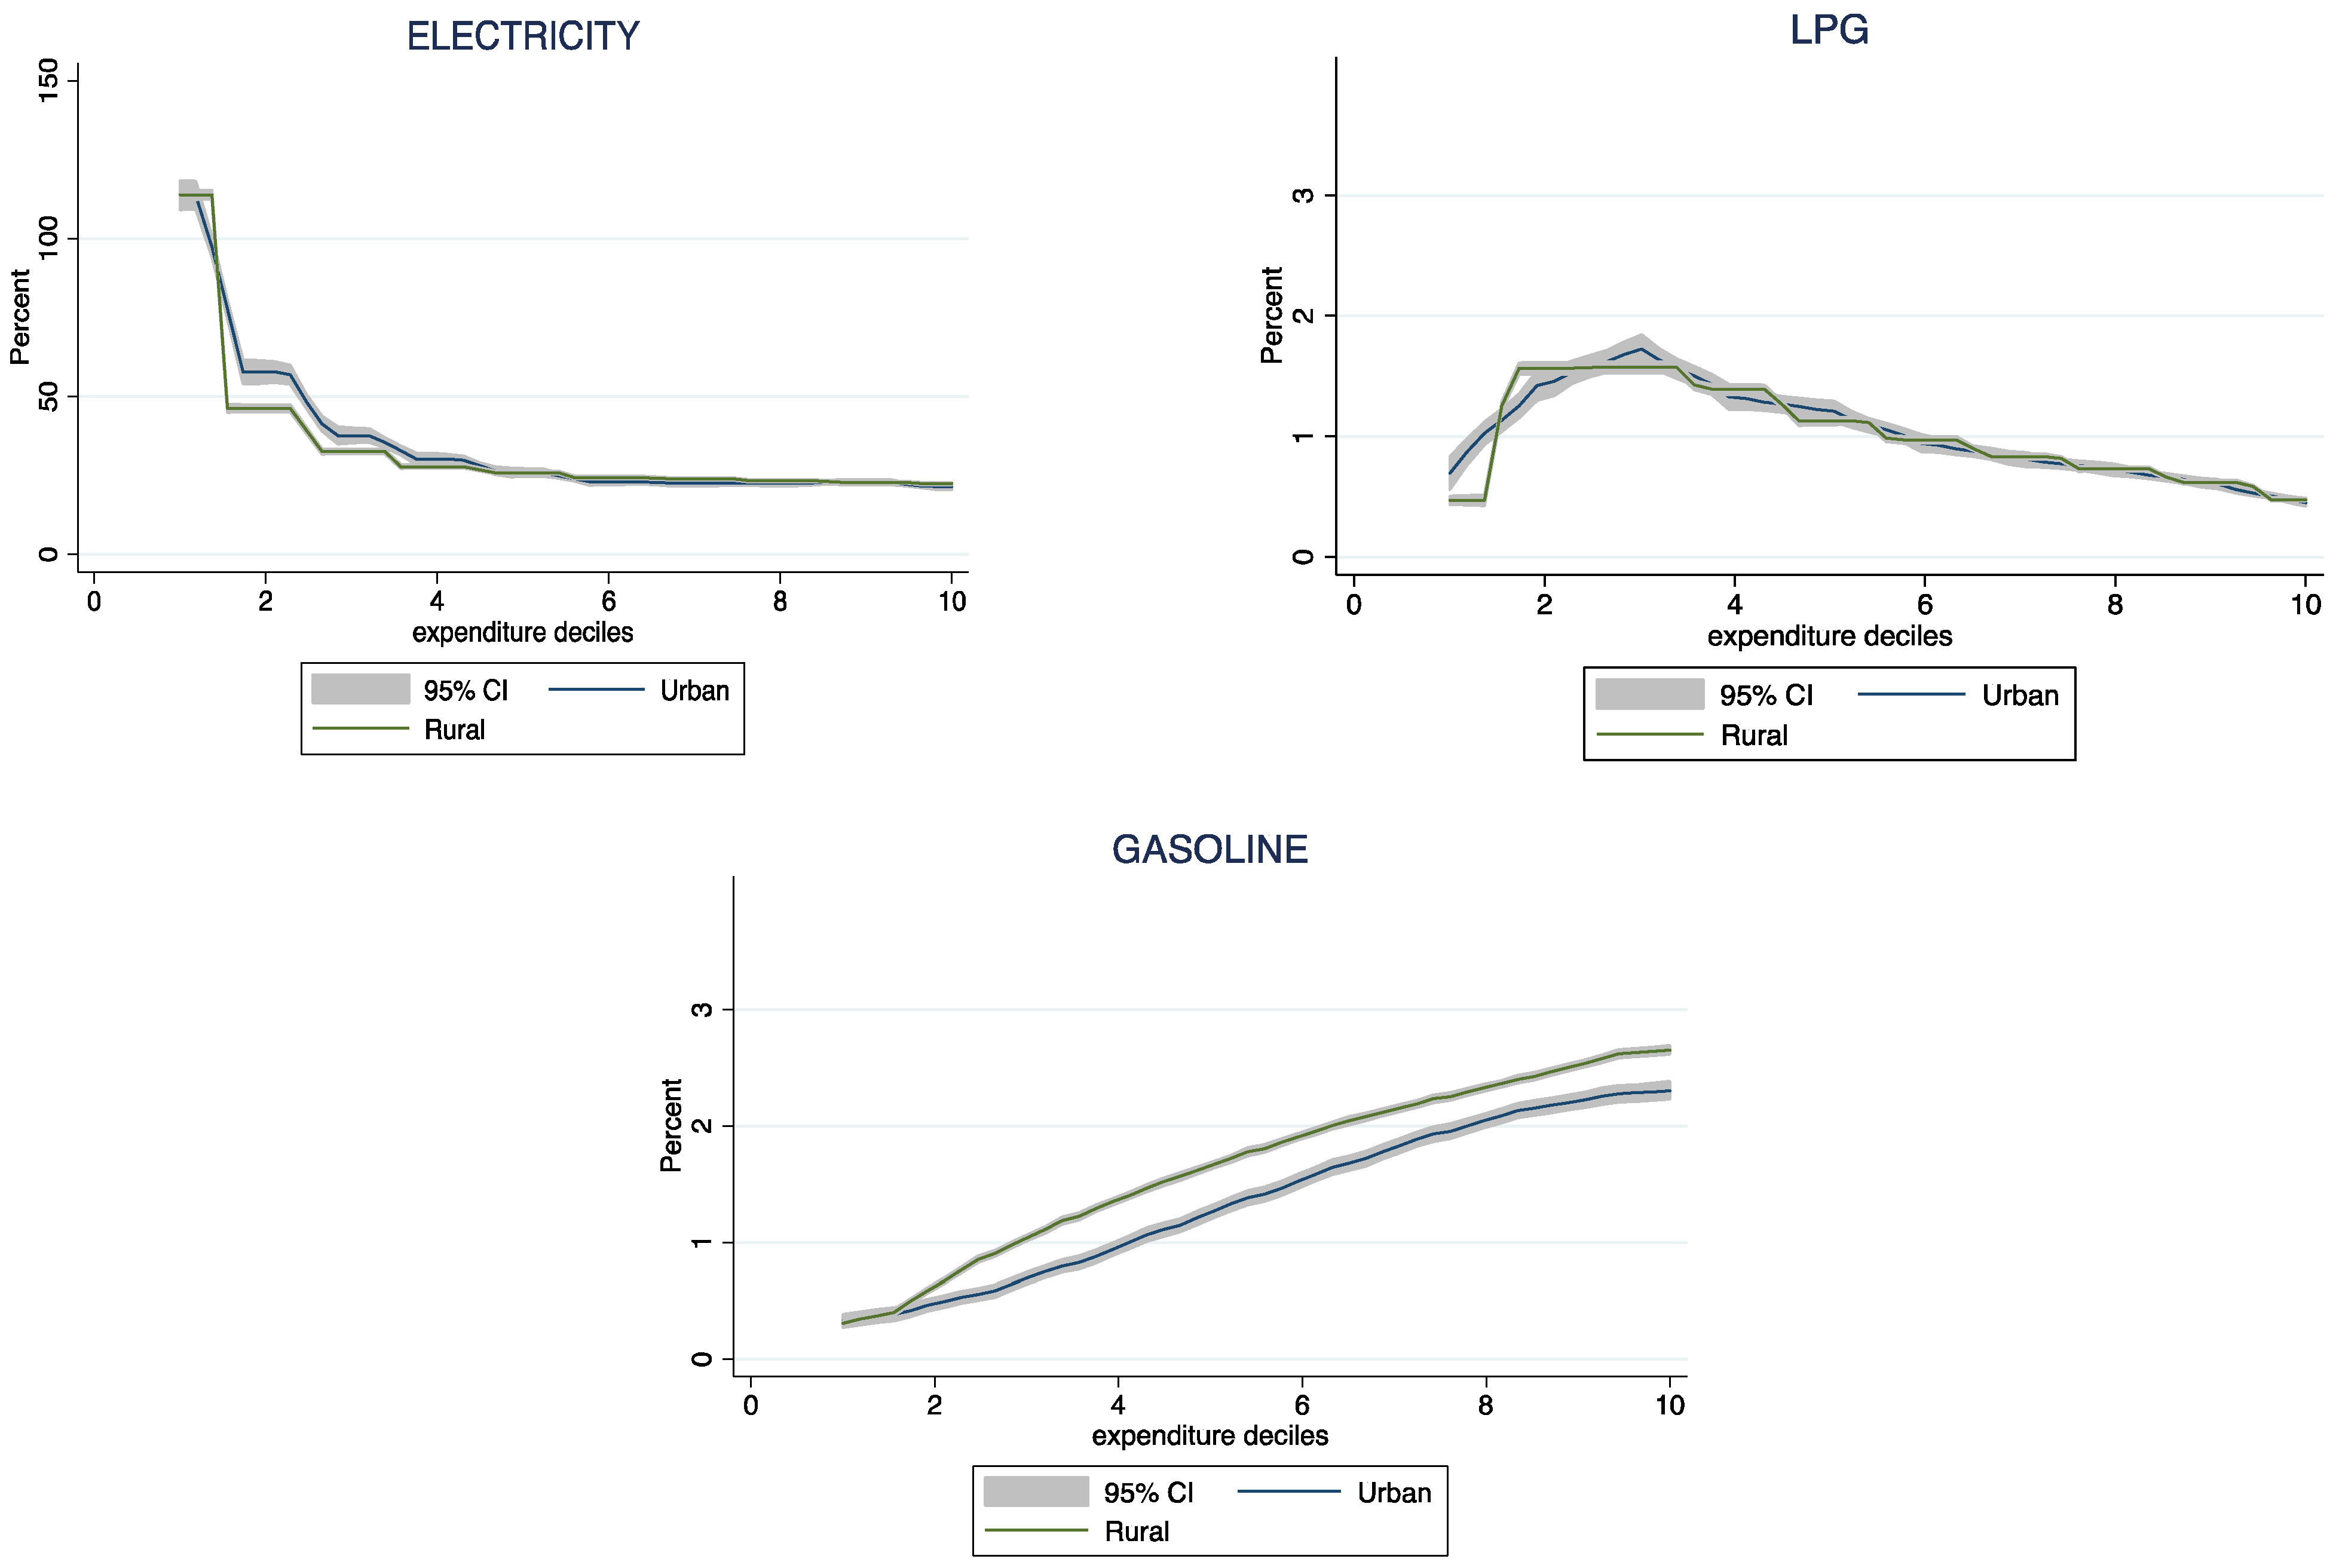
The results also show that the increase in electricity prices is regressive, with the lowest income deciles losing 118%, while the highest income deciles lose only 22%. For LPG, the effect is also regressive, where decile 2 loses 1.6%, while the effect on decile 1 is very low (0.5%) and can be attributed to the use of firewood. In the case of decile 10, it loses 0.4%. On the other hand, the change in gasoline prices is progressive, and there is a significant difference between the losses in the first and last decile, 0.4 and 2.6%, respectively. It is important to mention that the calculation of the first welfare effect overestimates the welfare loss per income decile.
The welfare losses faced by households also depend on whether they are urban or rural. On average, urban households experience higher welfare losses from a rise in electricity prices than rural households do. This may be due to the household equipment they have, such as gas stoves, while rural households use firewood for cooking. In contrast, rural households experience greater welfare losses from the use of gasoline, as shown in
Figure 5.
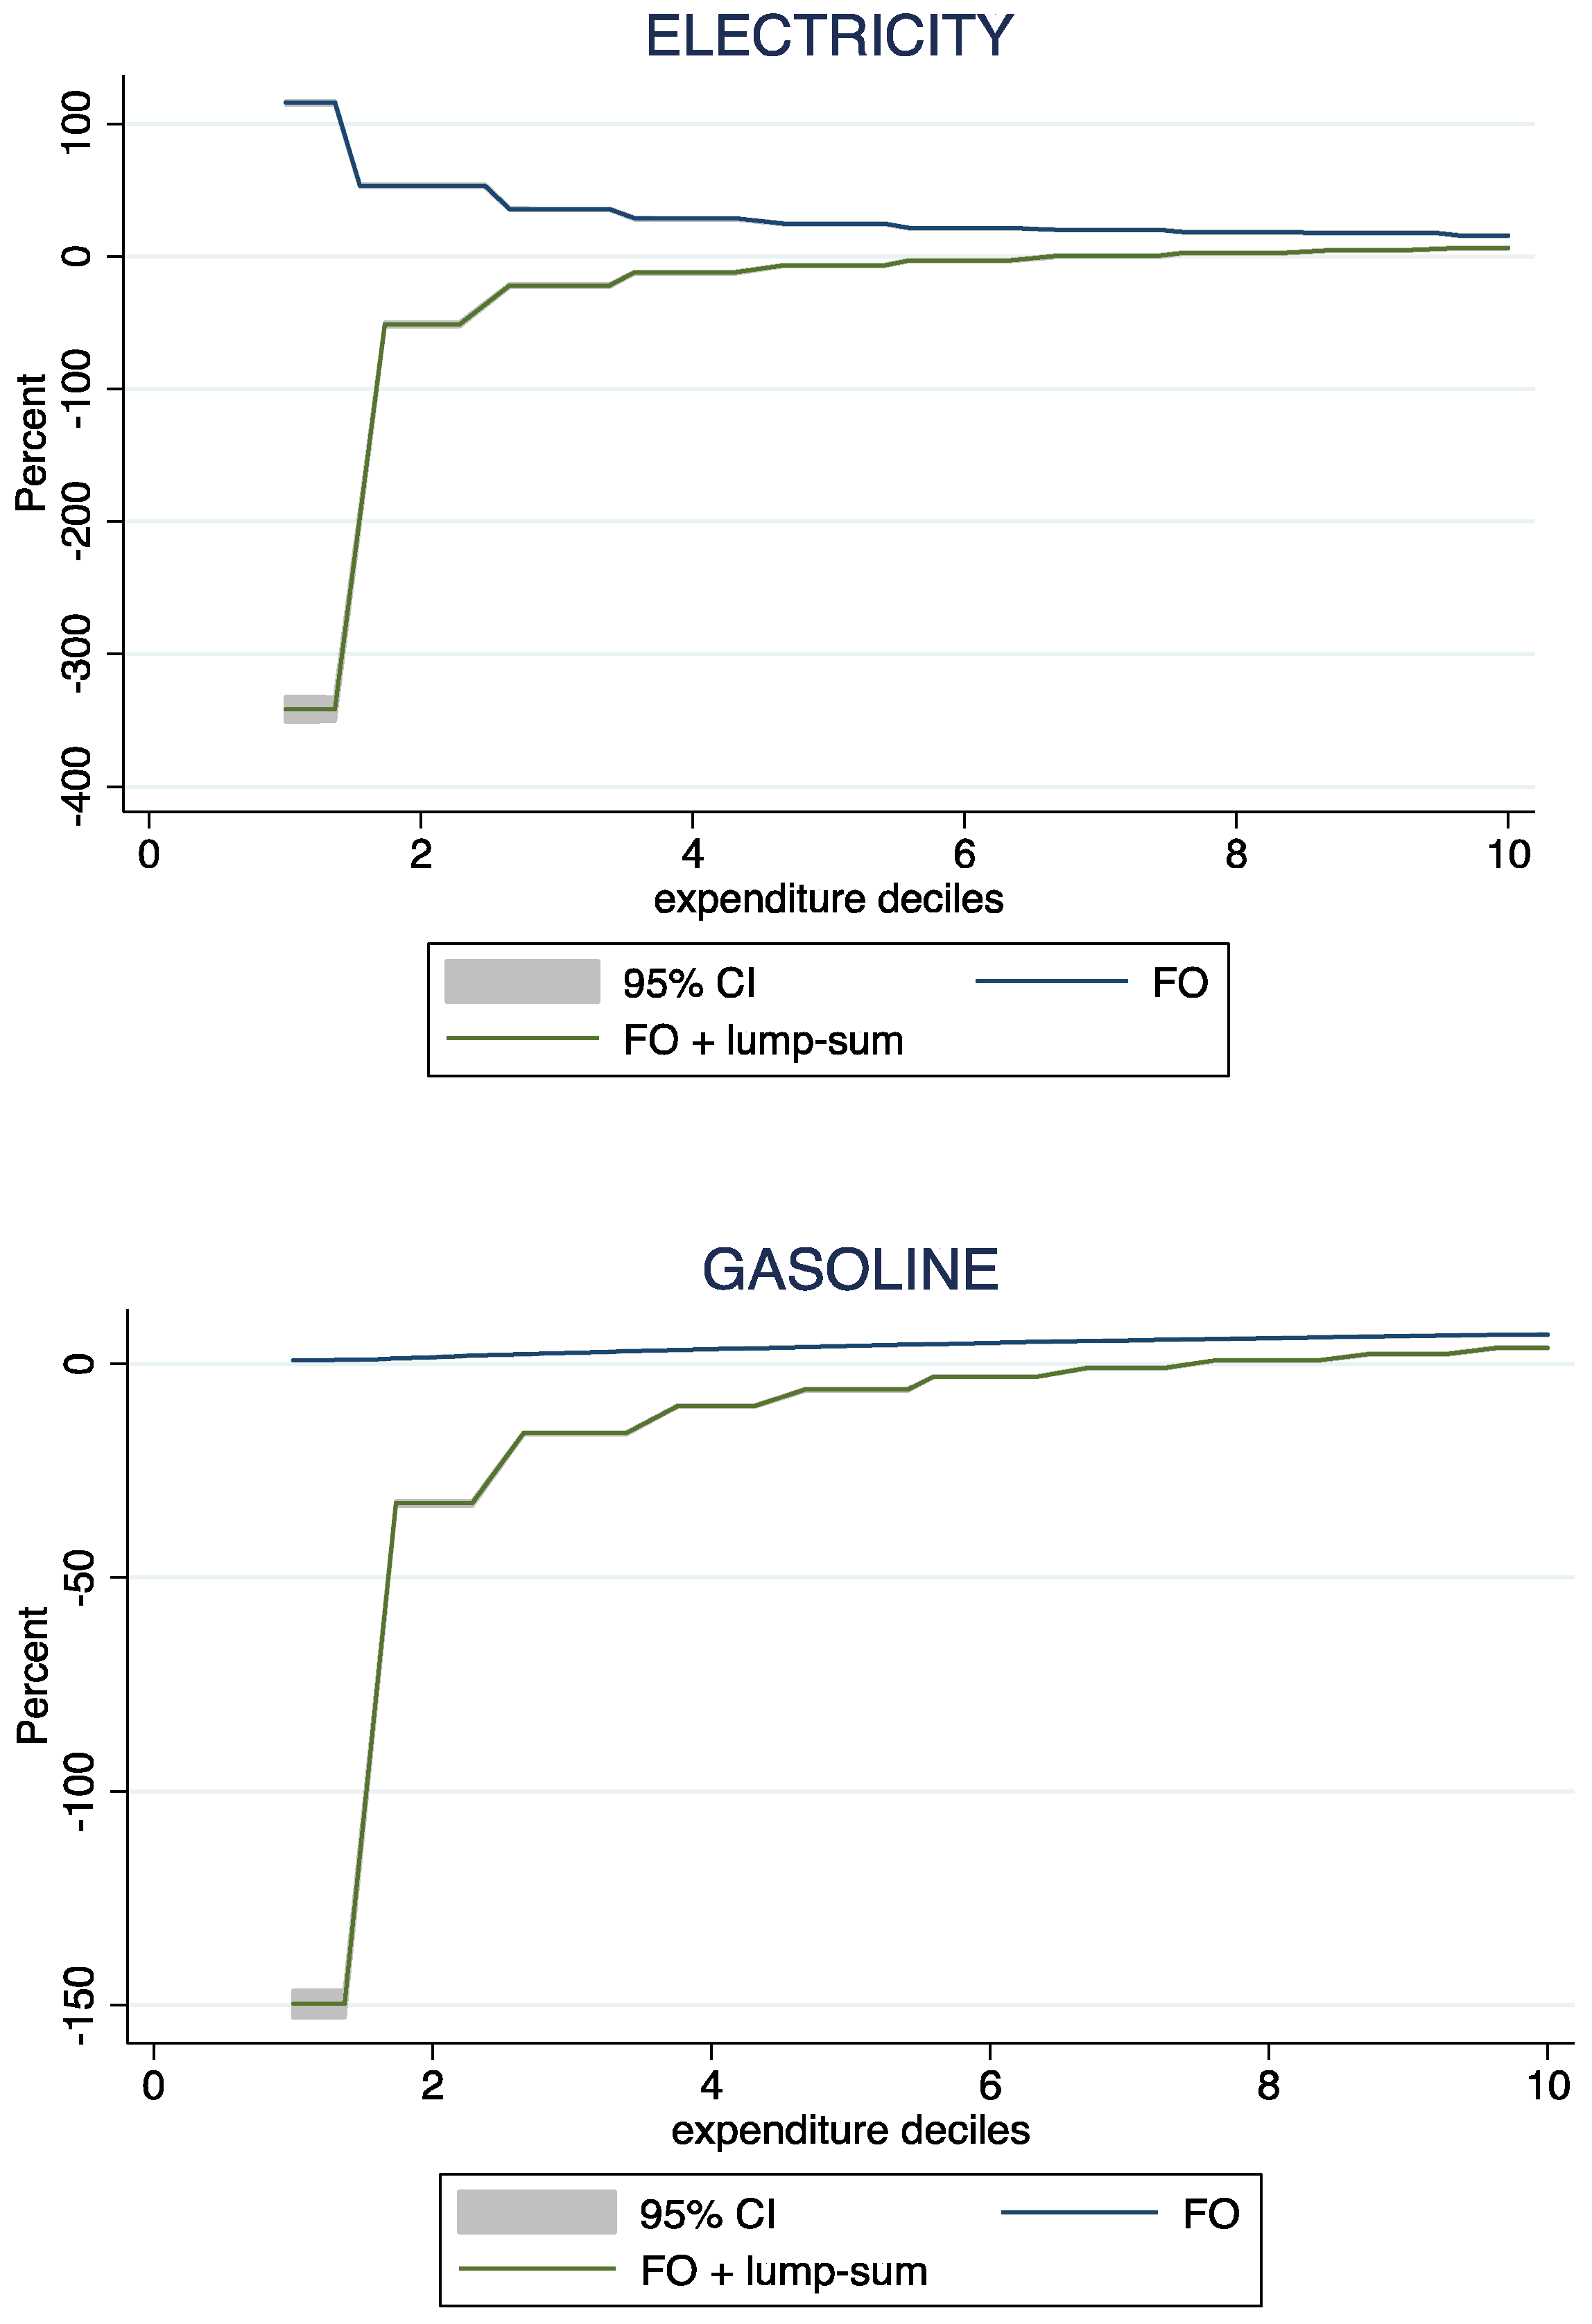
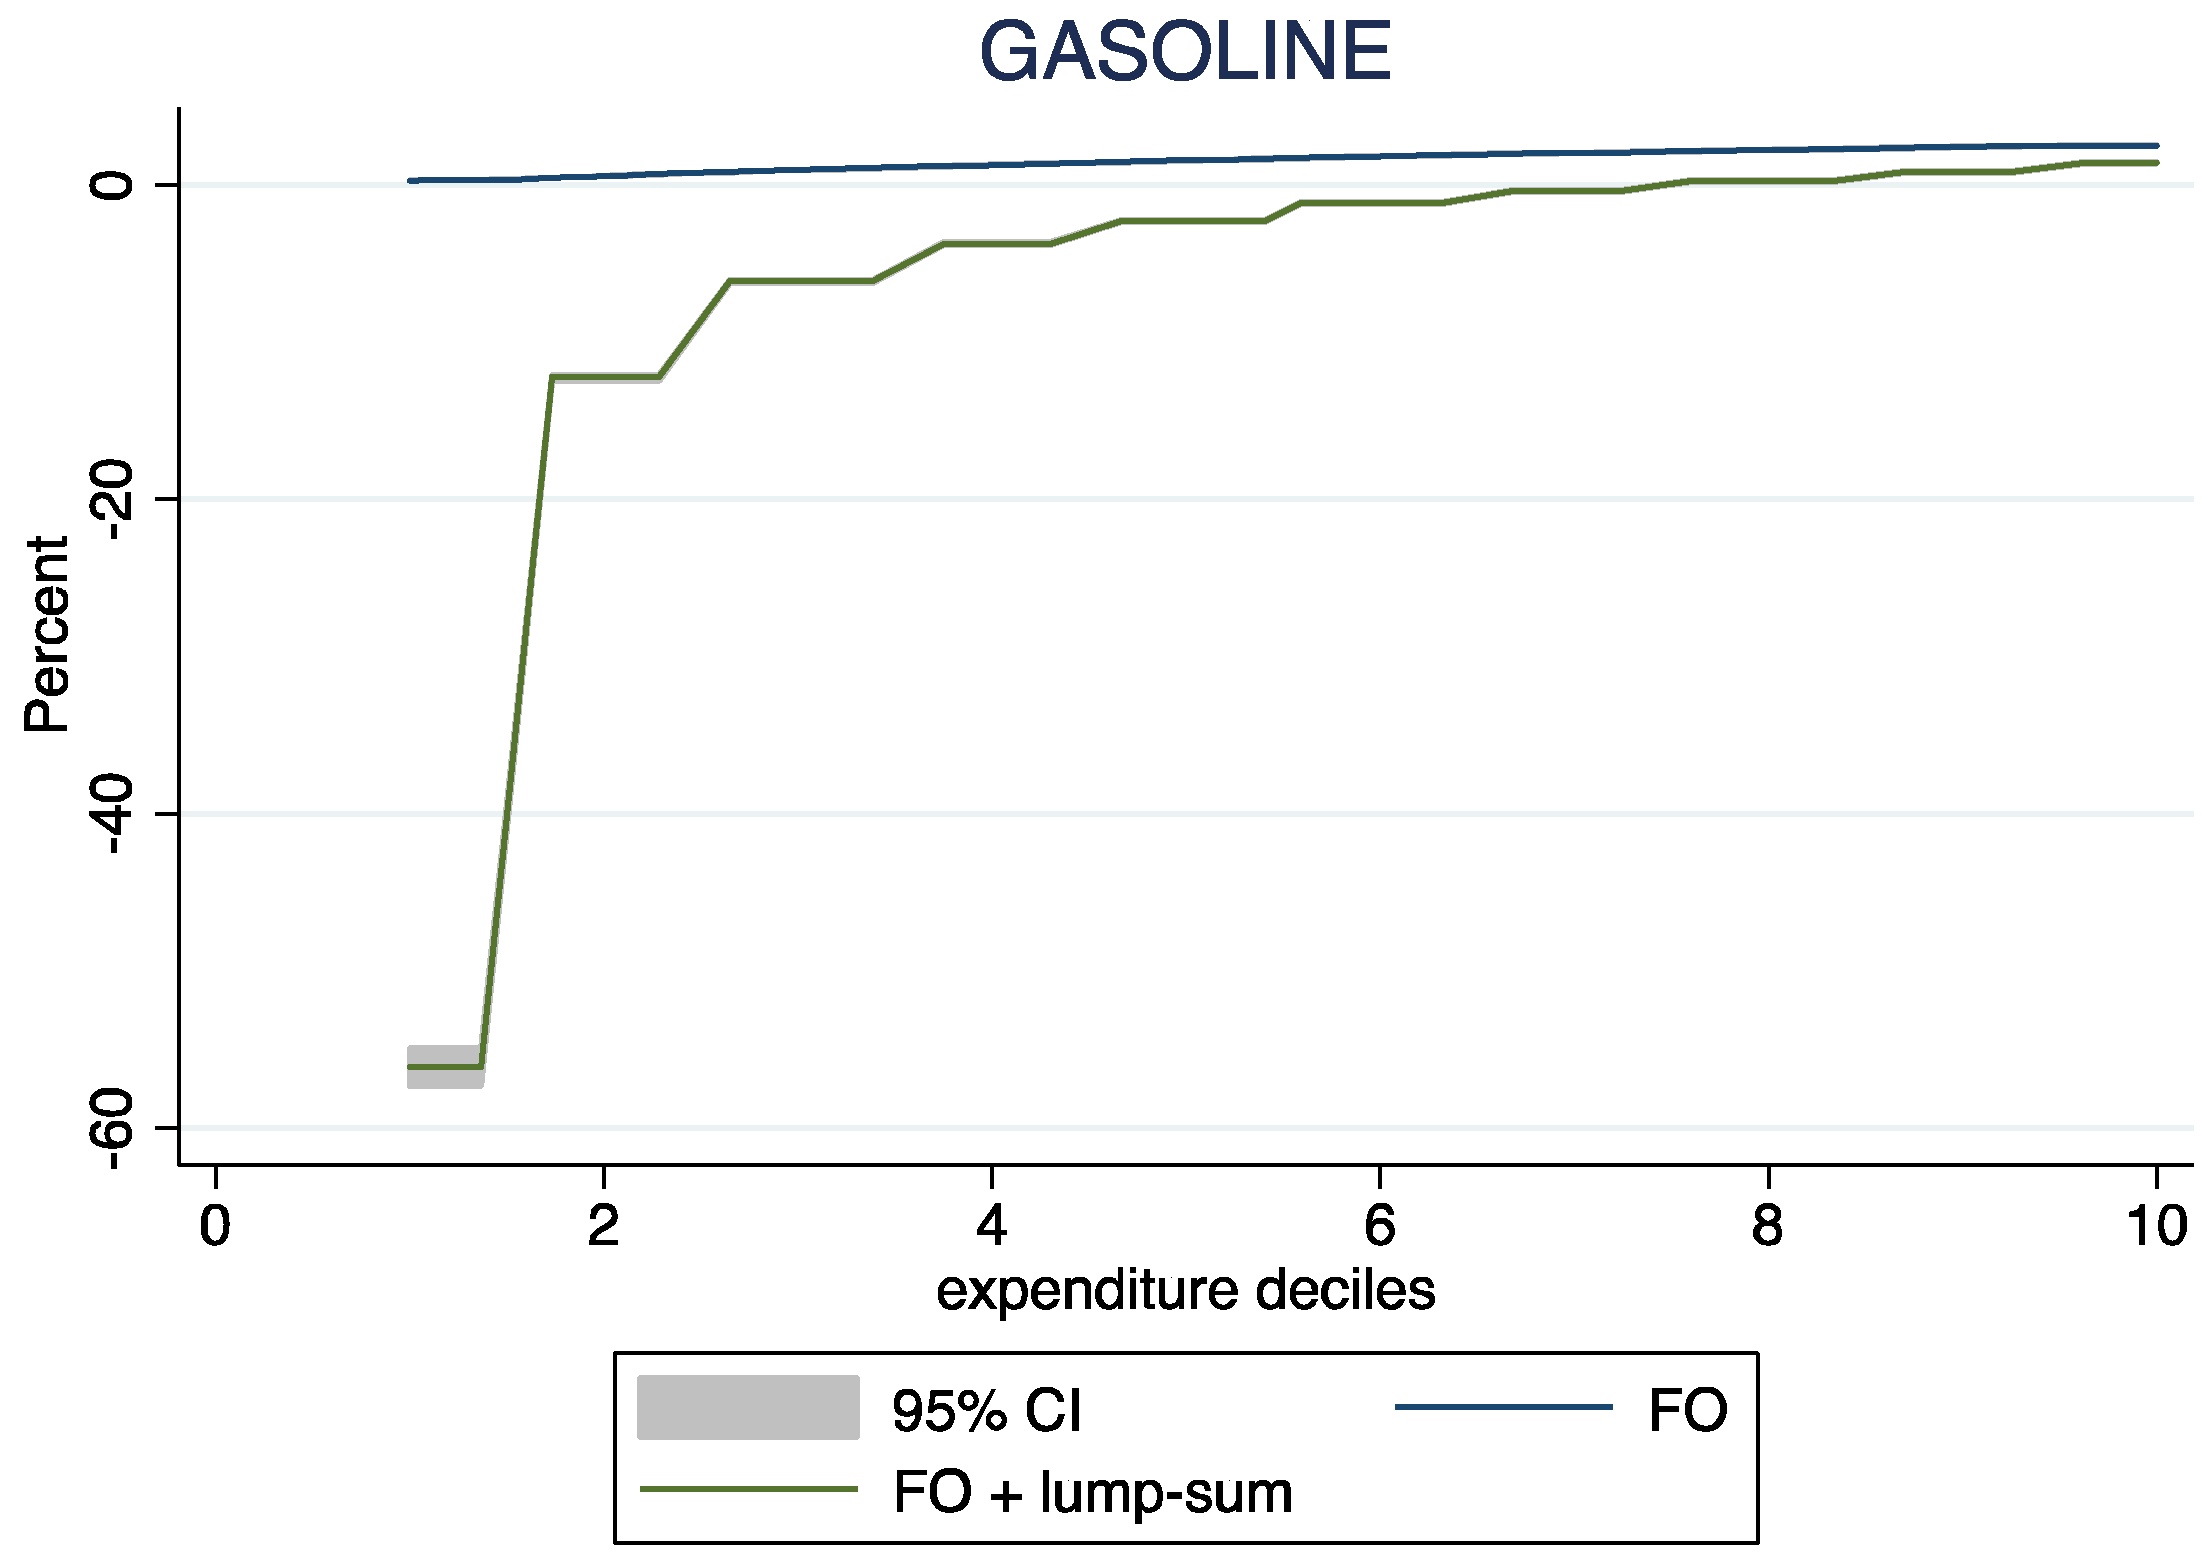
Figure 6 shows Welfare effect with a lump-sum transfer; revenue recycling is an important window of opportunity in the policies implemented by the Mexican government, as cutting fuel subsidies and implementing carbon taxes leads to more progressive welfare effects with welfare gains of up to 350% for the poorest households in the case of electricity taxes. Undoubtedly, the Mexican government should think of tax recycling as a policy to provide a global transfer of tax revenues to all households in accordance with their consumption of goods and services.
5.2. The Effect of Gender on the Welfare Losses of Households
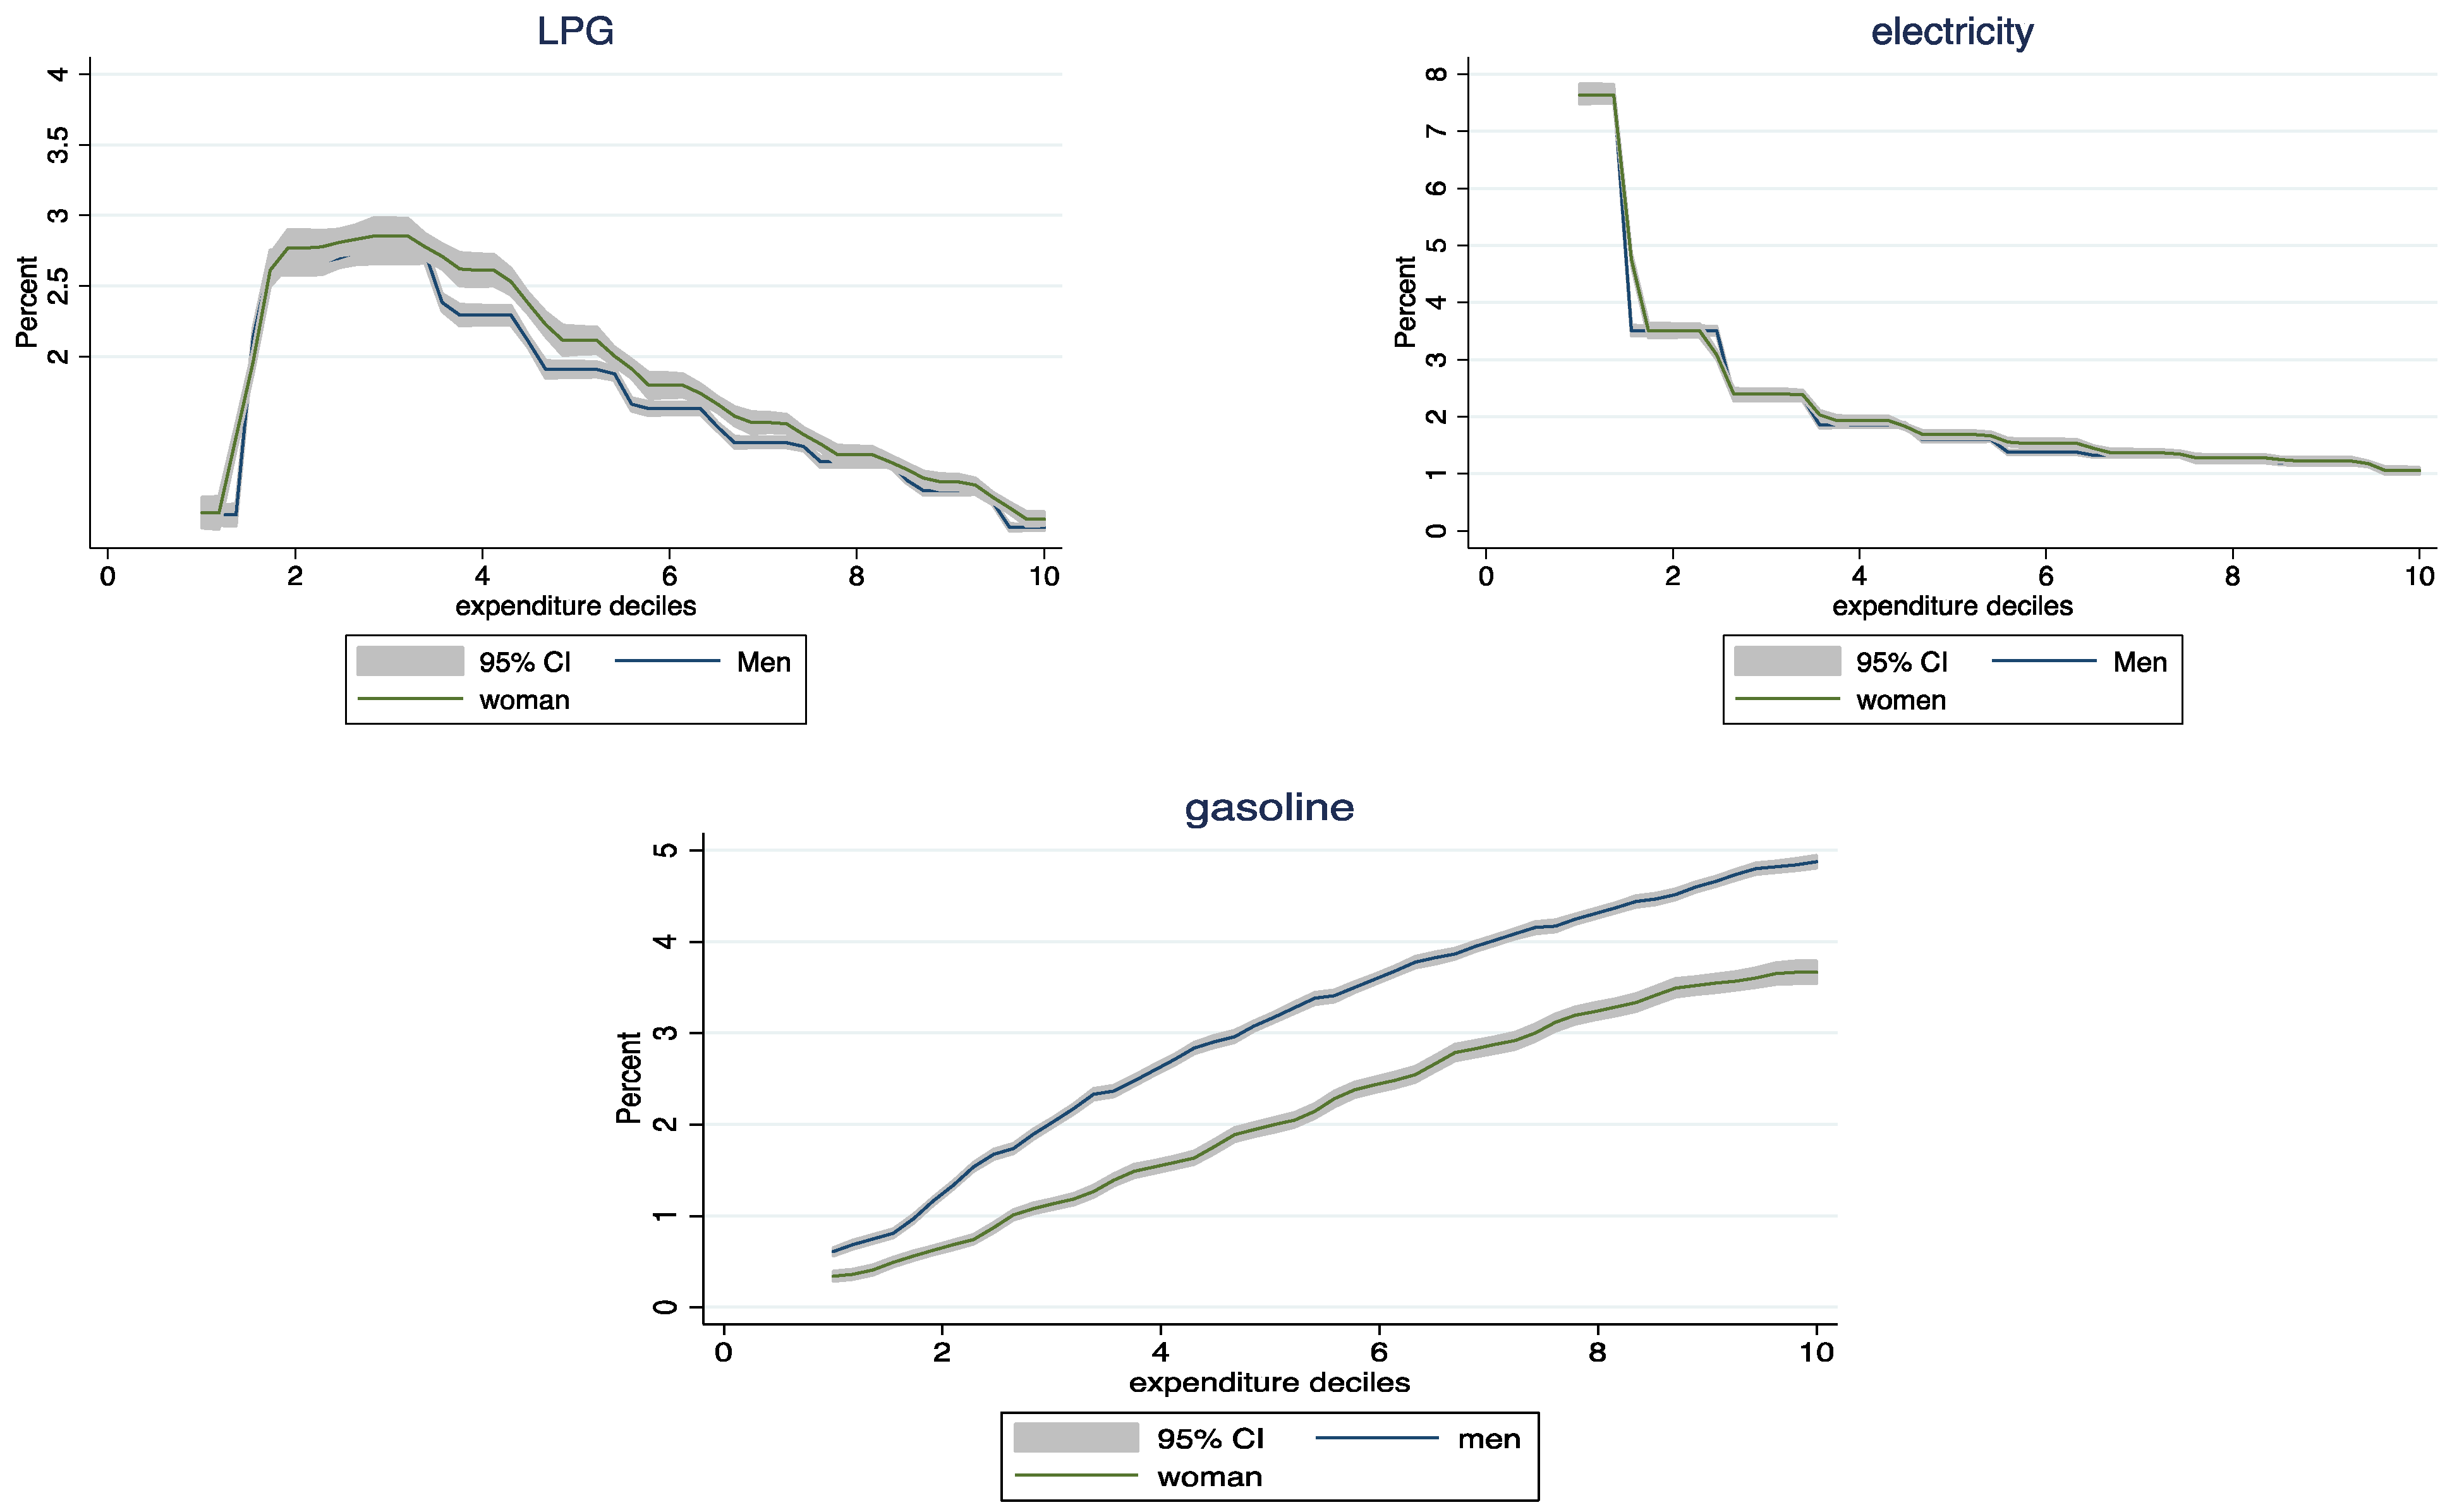
When the gender of the head of the household is taken into account, the degree of the loss of welfare is not constant between male and female income deciles. On average, households headed by women experience greater welfare losses due to price changes in electricity, gas, and public transport compared with the price increase felt in households headed by men. The percentages of losses are presented in
Figure 7. The results show that the welfare losses as a result of the increase in electricity and gas prices are regressive, significantly affecting female-headed households, while changes in gasoline prices are progressive and mainly affect male-headed households.
6. Conclusions
This paper examines the potential effects on household welfare in Mexico if energy subsidies and carbon taxes were to be eliminated, as proposed. The empirical analysis estimates the residential energy demand in Mexico from 1996 to 2018 using econometric techniques. Data from the Mexican Household Income and Expenditure Survey are used, and a QUAIDS model is employed for estimation.
The results reveal that welfare losses due to an electricity price increase are regressive, while changes in gasoline prices lead to progressive losses. Furthermore, the analysis suggests that the initial estimation overstates welfare losses, and rural and urban households are impacted differently, with rural areas experiencing greater welfare losses, primarily due to higher gasoline prices. Despite 99% of the population in Mexico having access to electricity, the poorest families allocate a higher proportion of their budget to it compared with wealthier households, resulting in more significant welfare loss. Therefore, robust policies are necessary to support poorer households in the event of such policy changes.
Income is seen to be a crucial determinant of fuel demand responsiveness to price changes. Both uncompensated and compensated price elasticities exhibit the expected negative signs; households in Mexico display an inelastic response to electricity and gasoline prices, while the liquefied petroleum gas (LPG) demand is elastic. Cross-price elasticities indicate substitutability between electricity and LPG, likely due to increased electricity usage for cooking. Conversely, gasoline exhibits complementary relationships with electricity and public transportation.
Regarding gender, the results indicate that electricity and gas price increases disproportionately affect female-headed households, while gasoline price changes predominantly impact male-headed households. Low-income households would bear higher tax burdens from subsidy elimination, further reducing their already meagre incomes. Complementary policies such as social programs could mitigate welfare losses.
Electricity prices in Mexico are government-administered and not market-determined, resulting in subsidies. These subsidies distort the economy and negatively impact the environment by misguiding consumers on electricity usage. This study contributes to eliminating subsidies, avoiding the distortion of public finances, and aligning with Mexico’s objectives for development and well-being with reduced greenhouse gas (GHG) emissions.
Redistributing tax revenues could lead to more progressive welfare effects, with substantial gains for the poorest households, particularly in electricity taxes. These resources could be reinvested in renewable energy projects and energy-saving initiatives to reduce GHG emissions and promote public transport usage.
These empirical results are applicable to countries with similar production and consumption profiles, particularly developing nations. The distributional consequences of energy consumption and taxes on air pollution (GHG) are contingent on income structures, even with different income recycling methods.
The Mexican Energy Ministry set goals for reducing electricity prices, developing strategies to have a supply of fuels with prices that encourage and increasing clean energy production by 25% for 2018, 30% by 2021, and 35% for 2024. The government has also pledged to reduce polluting emissions, through improvements in energy efficiency, and fuel substitution for individual transport that uses hydrocarbons. However, these objectives have only been partially achieved. Studies like this could aid Mexico and similar countries in redirecting subsidy policies to alleviate energy poverty, mitigate environmental impacts from fossil fuels, and foster more balanced economic development.
