1. Introduction
The optimization of configurations and operating modes of heating and ventilation systems of vehicles can reduce fuel consumption in internal combustion engines, reduce energy consumption, and extend the service life of electric vehicle batteries. In addition, the creation of a comfortable microclimate maintains optimal performance, the concentration of drivers, and conditions for the rest of transport passengers in [
1,
2,
3,
4,
5].
Critical HVAC (heating, ventilation, and air conditioning) parameters include the concentration of oxygen and carbon dioxide in the cabin and directly in the breathing area. An increase in CO
2 concentration to 1% can cause drowsiness, suffocation, and lead to tragic consequences [
6,
7]. Partial or complete air recirculation can cause this situation in the cabin and the lack of air supply from the environment.
Thus, the use of recirculation as one of the effective tools for reducing energy consumption while optimizing thermal comfort parameters requires additional study and restrictions to maintain the required gas concentrations.
The abbreviation HVAC (heating, ventilation, and air conditioning) includes rather broad concepts of studying, controlling, and optimizing microclimate parameters. In particular, these include temperature, pressure, air velocity and humidity, gas concentration, odors, illumination, etc. Civil and industrial transport, aircraft, buildings, and whole open micro-districts act as research objects. The most promising approach for the study of such problems is the use of mathematical modeling based on fundamental equations of hydrodynamics, together with advanced numerical methods.
Recommendations on temperature conditions and air quality are widely presented in various standards, in particular in the European air quality recommendations [
8,
9], the American Society of Heating, Refrigerating and Air-Conditioning Engineers (ASHRAE) standards [
10,
11], WHO, and others [
12,
13,
14,
15,
16]. In particular, in [
12], a review analysis is carried out on labor protection at passenger transport stations and vehicles, and in [
15,
16], studies are carried out in aircraft.
Analytical approaches based on balance equations [
17,
18,
19] make it possible to obtain volume-averaged field characteristics [
20,
21,
22]. The problems of finding heat transfer coefficients using the Nusselt criterion were considered for harvesting machines [
23], off-road vehicles [
24,
25,
26,
27,
28], building elements [
29,
30,
31,
32,
33,
34,
35], car cabins [
36,
37,
38,
39,
40], and engineering systems [
41,
42,
43]. This approach involves the use of previously found heat transfer coefficients to simulate heat exchange with external regions. For example, in [
24], the temperature regime in the interior of an SUV was studied depending on the fan rotation speed. In [
25], the assessment of thermal comfort in the vehicle interior was conducted, considering solar radiation. The article [
41] considered numerical modeling and heat transfer in concentric and eccentric cavities of rotation. The work [
43] discusses conjugate heat transfer in an anode roasting furnace. In article [
40], a method is proposed to calculate heat transfer coefficients for a multilayer car cabin wall that considers forced convective heat exchange between internal and external air. The article also compares the results obtained numerically and analytically based on various applied theories.
The complex geometry of vehicle cabins makes the use of analytical methods impossible. To directly determine the values of thermal comfort fields at each point of the internal domain, the solution of three-dimensional hydrodynamic equations using CFD analysis is required [
44,
45,
46,
47,
48,
49]. Therefore, in the aforementioned studies [
50,
51], CFD investigations were conducted on vehicle ventilation systems in tropical climates. A study was conducted on ACH in airplanes, cars, and buses, as well as the impact of passenger arrangement on cabin air flow structure.
Works [
52,
53,
54,
55,
56,
57,
58,
59] investigate climate control systems, considering the use of various controllers to obtain values of carbon dioxide concentrations in various areas [
60,
61], and control systems for damper drives. Experimental measurements of air quality, temperature profile, and energy consumption in the cabin of an electric vehicle are given in [
53,
55]. The articles [
62,
63,
64,
65,
66,
67] evaluate safety in terms of temperature factors when vehicles are heated from direct sunlight.
The economic justification for various air conditioning systems for electric buses is given in [
68,
69,
70], and an assessment of the economic efficiency of using a heat pump system is given. Studies have been conducted on humidity and the effective removal of condensation from fogging on the internal surfaces of a car [
54,
71,
72].
Researchers developed a mathematical model in [
73] to examine how viral particles are transmitted within car interiors, specifically from air intake deflectors and the driver’s respiratory tract.
The above review showed that despite the large number of studies, there is currently no clear methodology for analyzing the control of the climate system of transport crews. Therefore, in each specific case, it is necessary to conduct experimental studies.
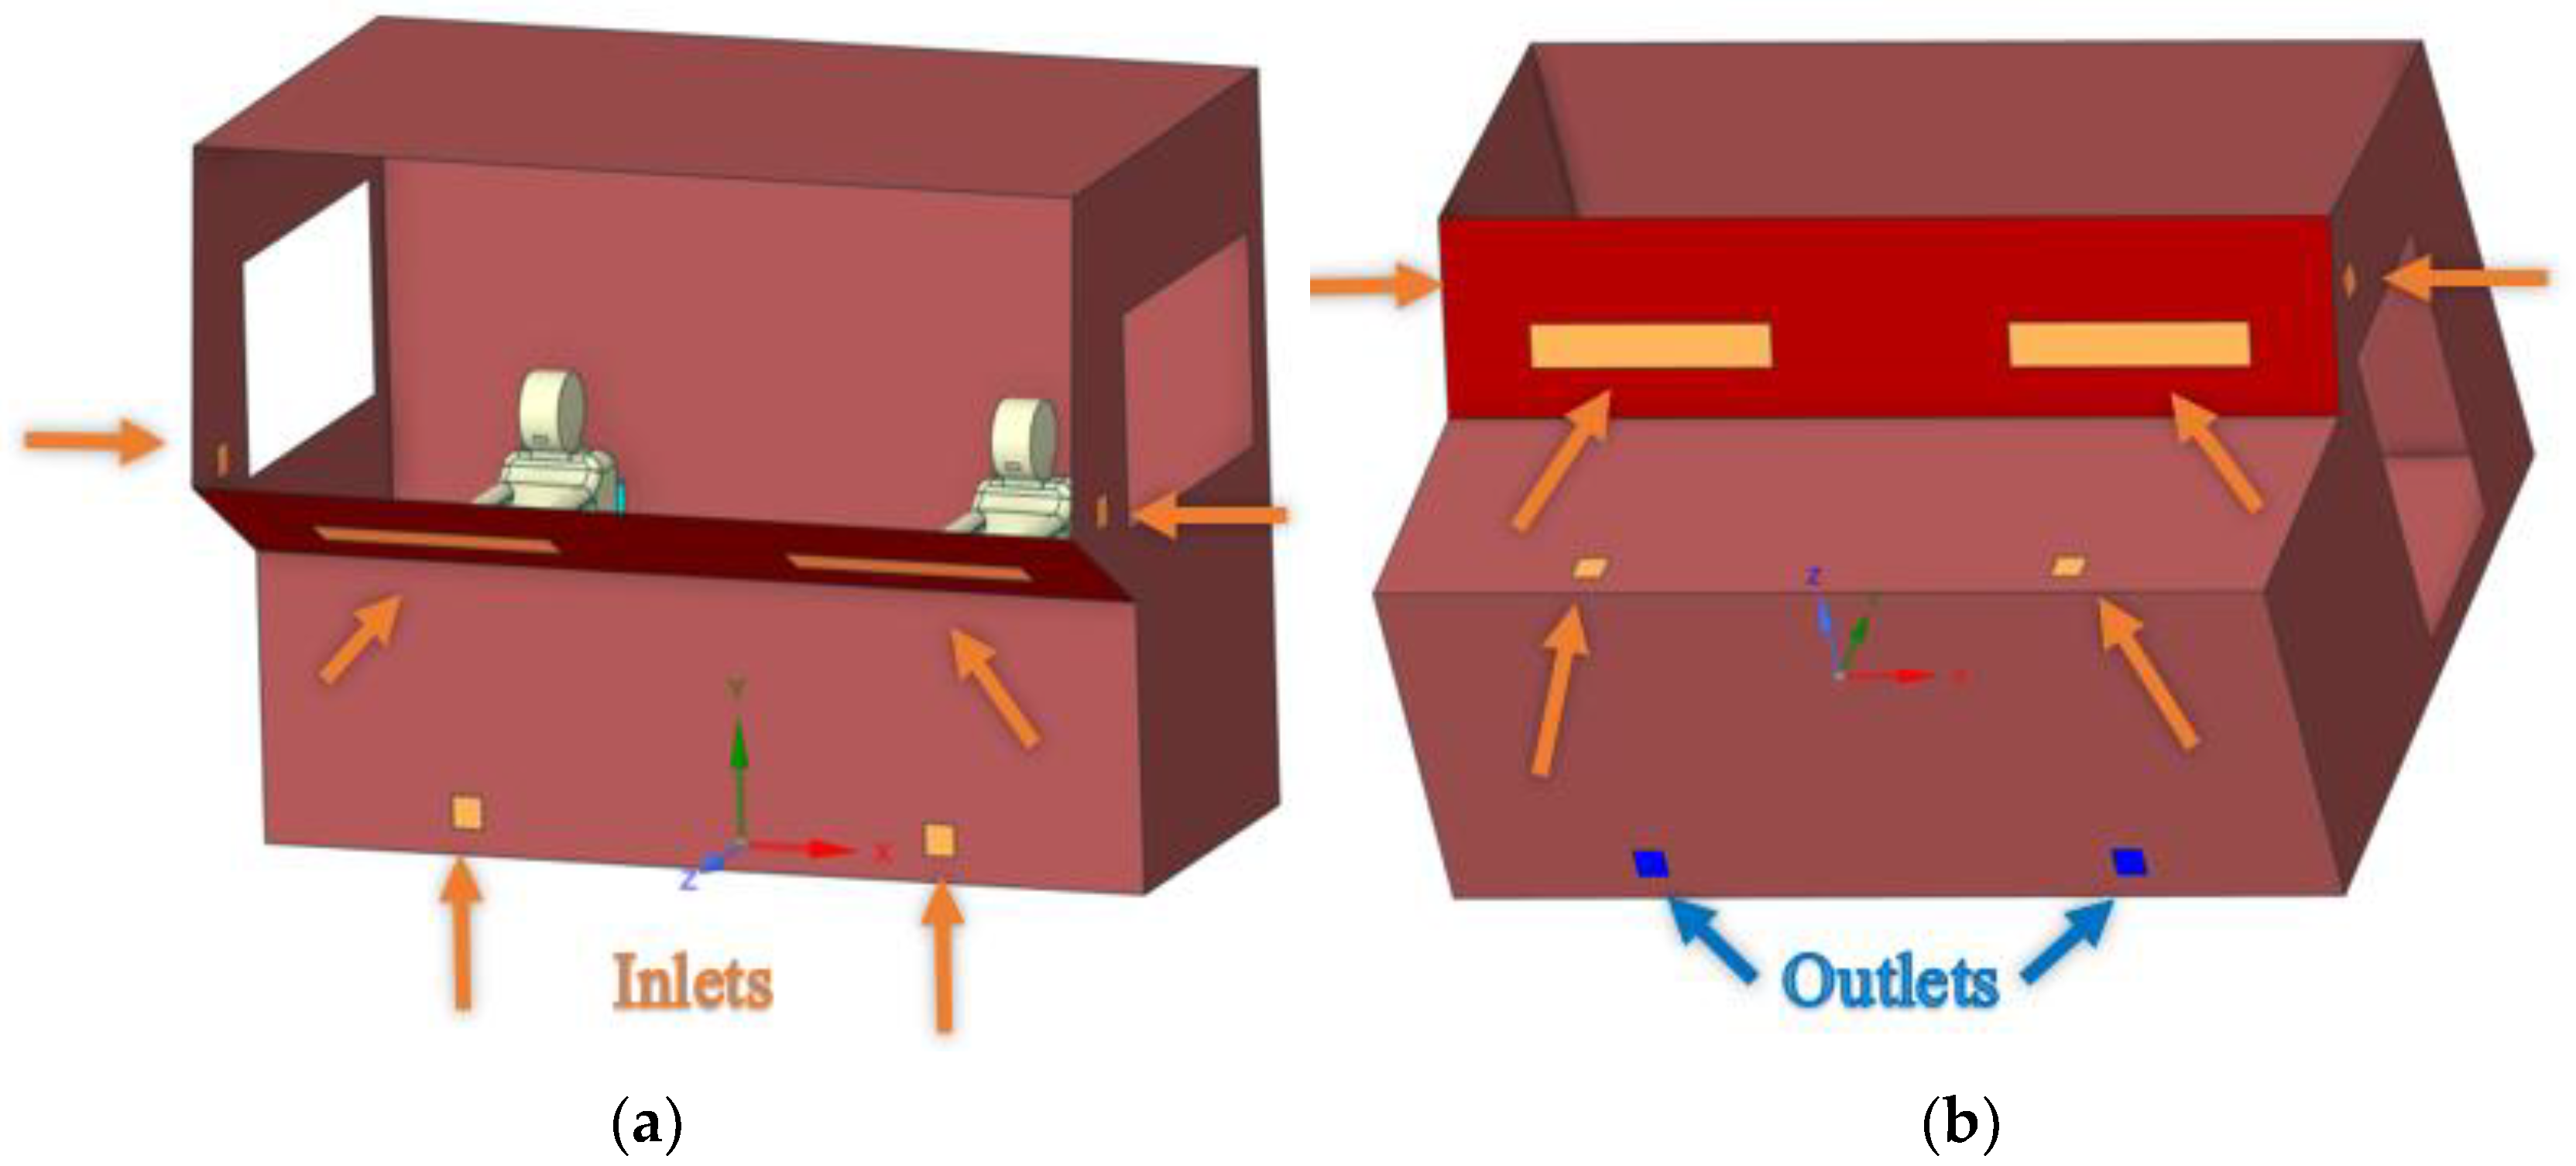
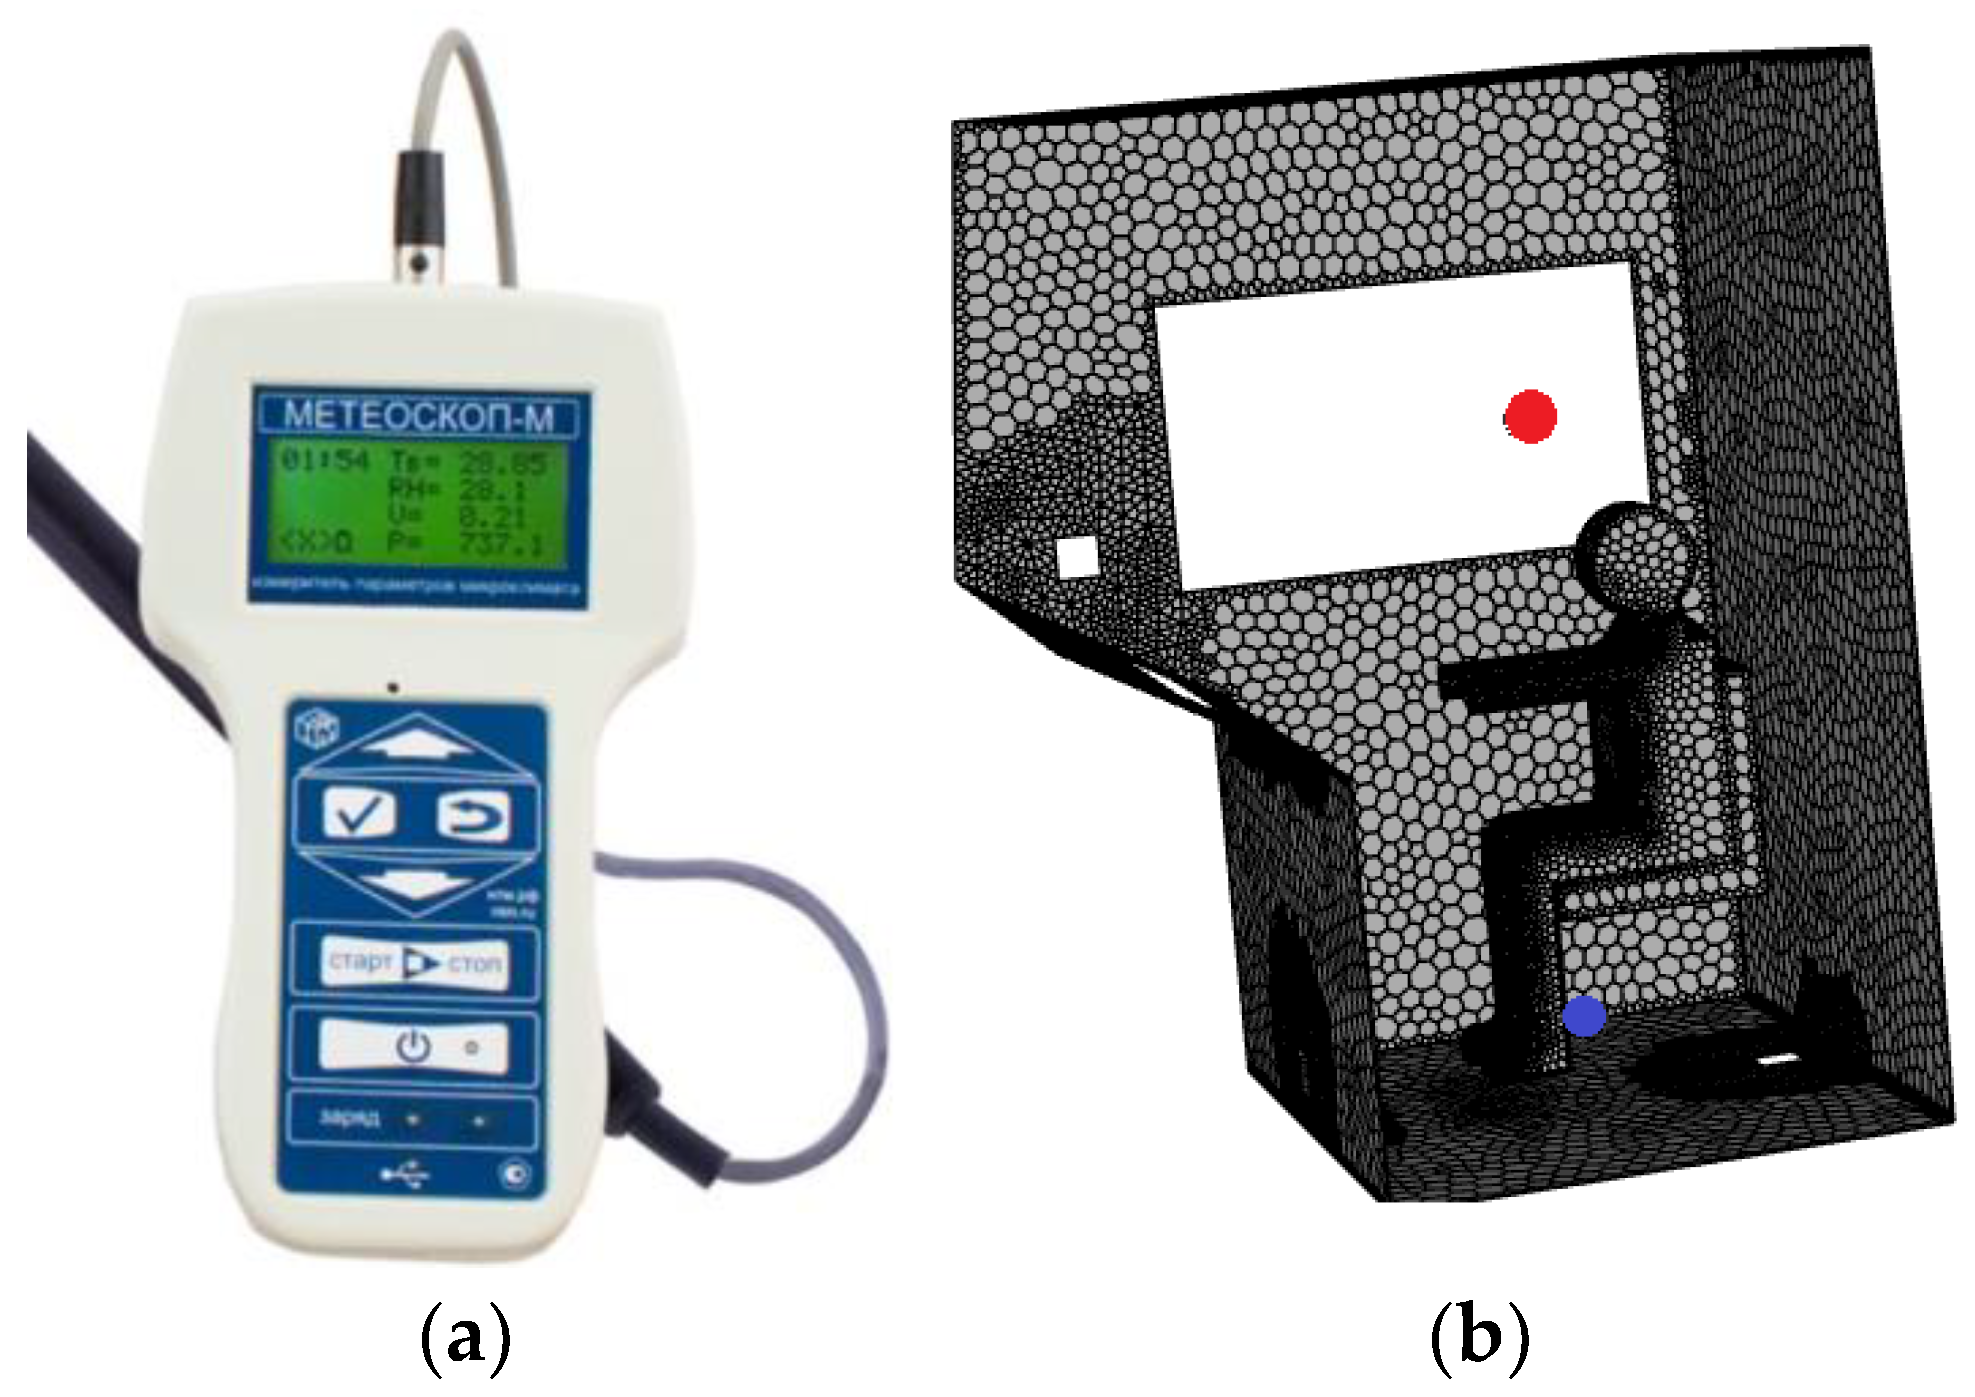
This work aims to develop a method for studying the climate system operation in a railroad locomotive cabin [
74] with two drivers (driver and assistant driver), as seen in
Figure 1. In particular, a solution was obtained in the form of the speed fields, temperature, humidity, carbon dioxide concentration, and oxygen. Primary attention is paid to studying the values of air concentrations during breathing, which is a critical factor for ensuring the health of the driver and passengers. In particular, the normal level of carbon dioxide concentration according to ASHRAE standards [
10,
11] is considered as being less than 600 ppm (0.06%); when the value reaches 1000 ppm (0.1%), drowsiness already occurs; and a value of more than 2500 (0.25%) is considered hazardous to health.
The mathematical model is built based on hydrodynamic equations: the Navier–Stokes equations and the energy and continuity equations. To model humidity and gas concentration, a diffusion equation has been added to the system.
Winter and summer temperature scenarios are considered as heating and cooling modes of air in the cabin, respectively. The problem was solved in a nonstationary formulation, the times of field stabilization were found, and graphs of the values of velocities, temperatures, humidity, and gas concentrations were constructed in different areas of the cabin at different times. The values of power consumption (energy efficiency) for various modes of operation of the climate system are also plotted. A comparative analysis of the uniformity of fields along the height of the cabin with different locations of deflectors was carried out, and optimal configurations were found. A qualitative assessment of the driver’s blowing directions under different circulation and recirculation modes is given from the point of view of the concentration of carbon dioxide in the breathing area. As a verification, a comparison was made with experimental data on measuring microclimate indicators at workplaces for the mainline diesel locomotive 2TE25K.
The significance of this work is as follows. The constructed numerical algorithm allows for the research and optimization of all necessary air flows inside the cabin. In particular, it allows researchers to study changes in the concentration of carbon dioxide in the cabin and in the inhaled air, including studying different degrees of air recirculation to increase energy efficiency. This model allows researchers to study the issues of the effective operation of life support systems in the absence of external air in critical situations and external air pollution, and it also allows for the simulation of the spread of harmful substances when entering the cabin and their effective removal.
3. Results
3.1. Numerical Analysis
To numerically solve the boundary differential problem (1)–(8), CFD analysis was used. This method consists of replacing the main variables with Reynolds-averaged ones [
77,
78,
79,
80,
81,
82] and using new RANS equations. In this case, there is a need to use turbulence models.
The Ansys CFD (Ansys Fluent) finite volume analysis package was used to obtain the numerical results and the settings are shown in
Table 1.
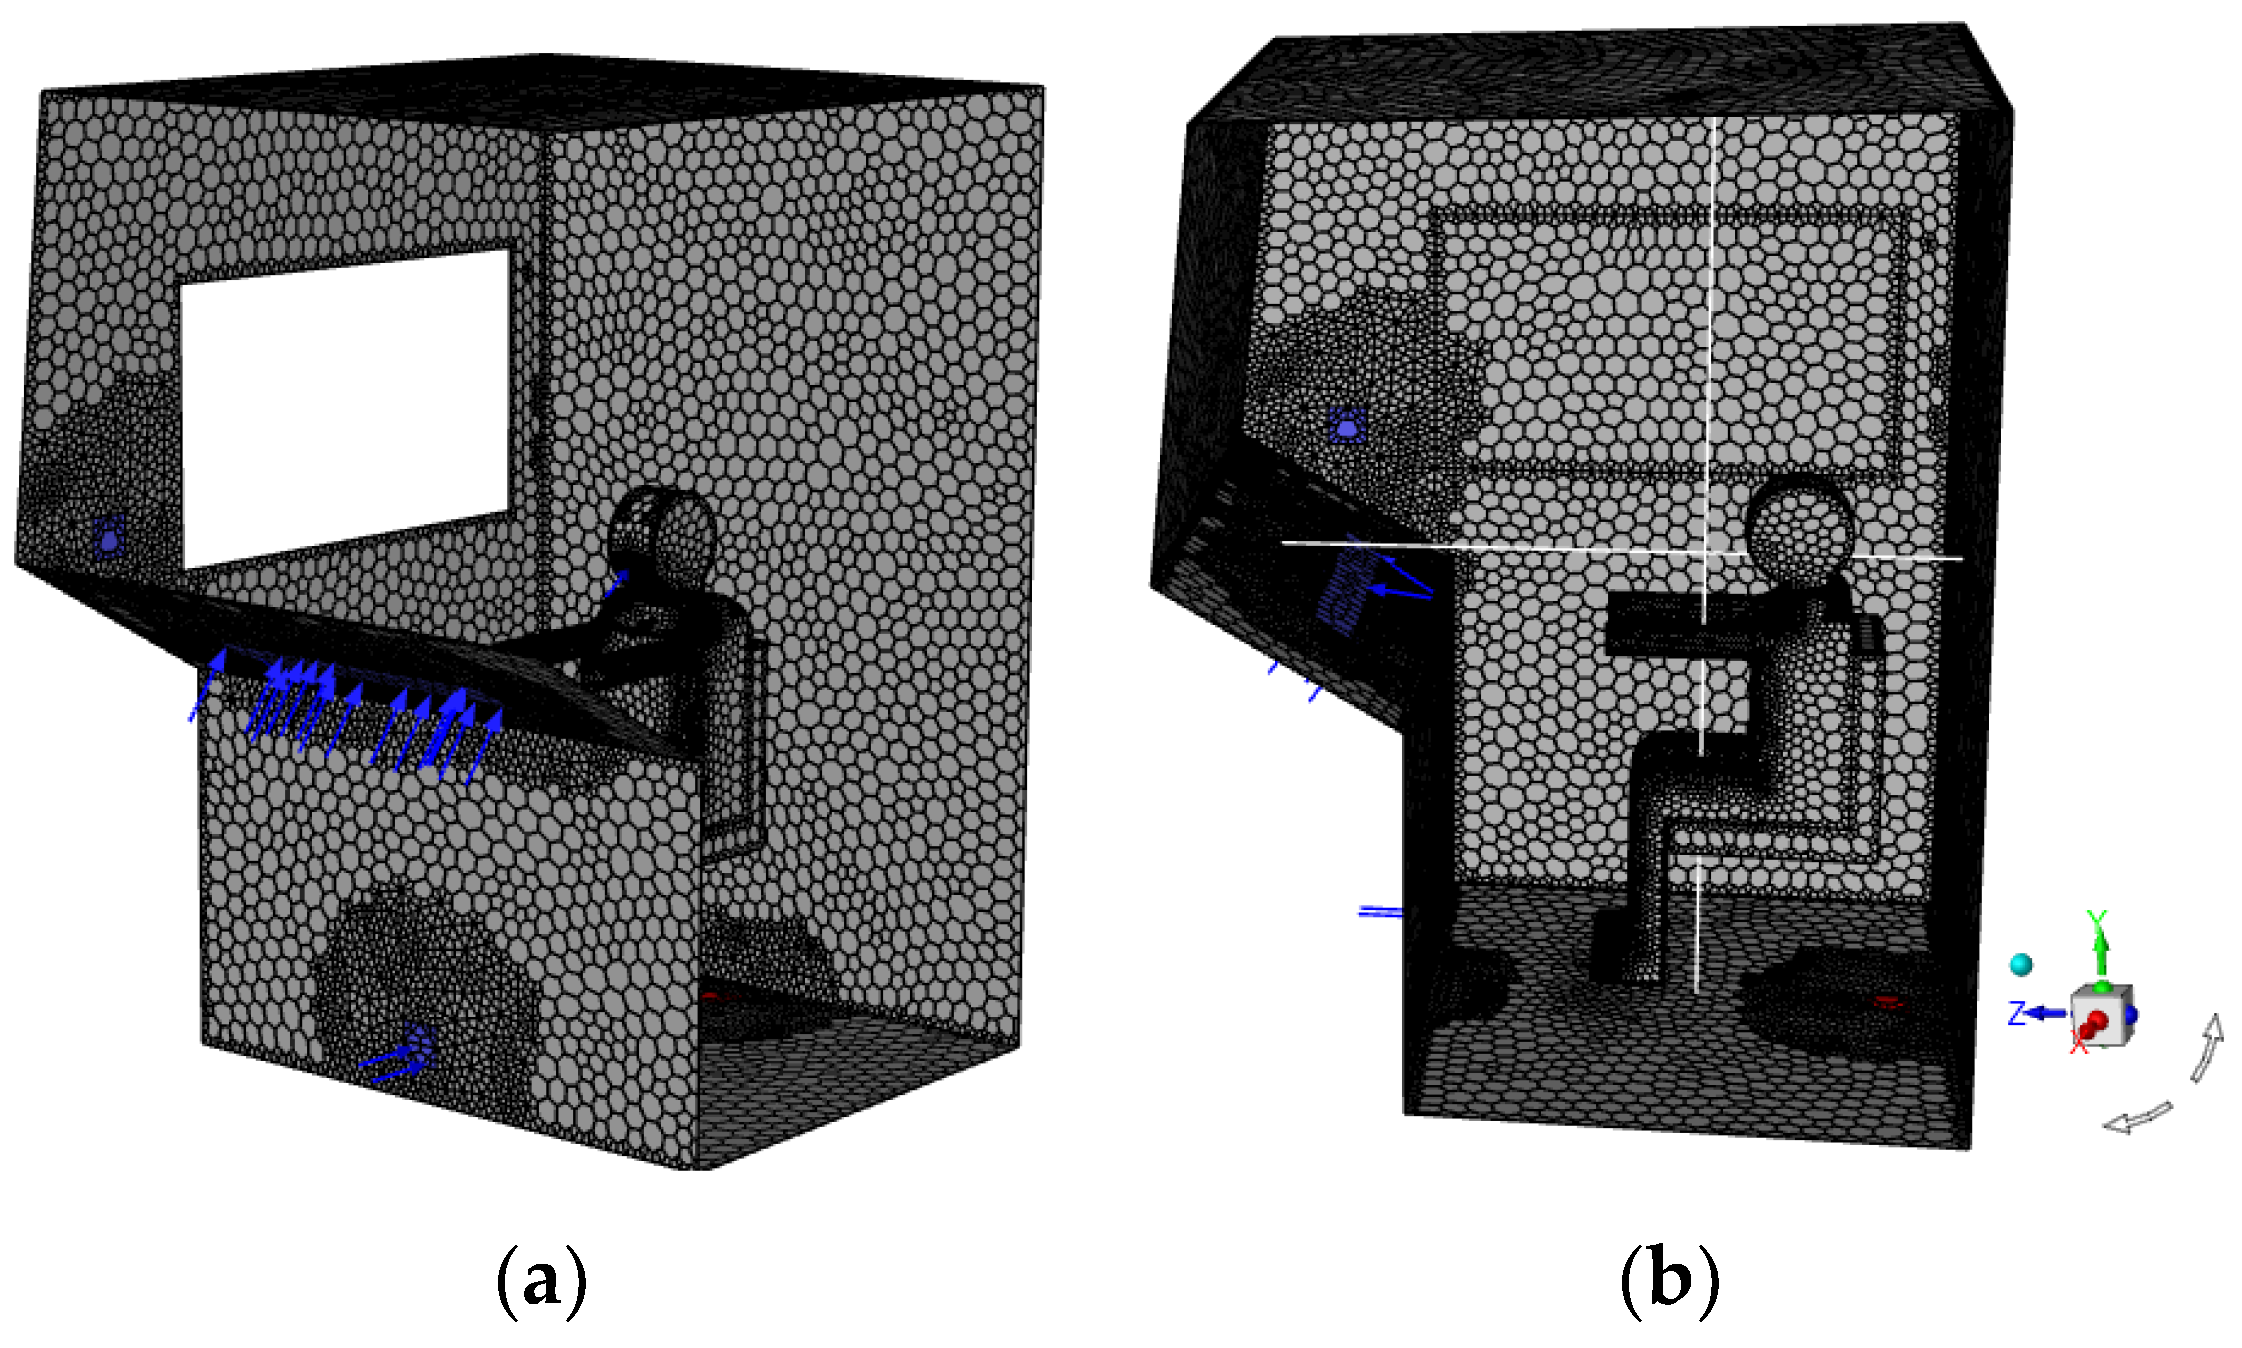
Figure 4 shows a polygonal mesh of the surface of the locomotive cab half, which was constructed using Ansys Meshing.
The numerical method chosen was “Simplex” based on the “Pressure-Based” solver. The turbulence model was used , proposed by Ansys Fluent by default, although to increase the speed of calculation in such problems it may be more preferable to use the turbulence model. A special transport model was used to simulate humidity.
Table 2 shows the number of iterations of convergence of the stationery and transition problems depending on the number of cells and grid nodes, as well as the values of the specified residuals. The quality of the grid (
Table 2 and
Table 3) was assessed by the value of the mesh orthogonality parameter. For these tasks, this value is within acceptable values [
77]. First, the tetragonal mesh was built in Ansys Meshing, then it was converted into a polygonal conformal mesh inside Ansys Fluent Meshing, which allows for the reduction in the number of elements by increasing the number of nodes.
For the nonstationary time integration problem, a fixed time step
s was chosen. This value was set based on recommendations in [
77]:
Here, is the characteristic size; in this case, the average cell size is 25 mm; and v is the characteristic speed. The characteristic speed for (10) is taken to be 0.7 and obtained based on the speed values at the entrance deflectors and several preliminary calculation operations. For these values, s. For a given step, according to (10), the flow will cover a distance of no more than one cell.
As a turbulence model for the RANS equation, two-parameter models of isotropic turbulence [
77,
78] were chosen: the
model (transfer equations are written for the kinetic energy of turbulence
and the specific dissipation rate of turbulent energy
) and the
model (transport equations are written for the kinetic energy of turbulence
and the rate of dissipation of turbulent energy
). For these problems, they show almost identical results, but the
model converges 30% faster. The
model does not include complex nonlinear wall damping functions required for the
model, and therefore it is more accurate and more stable and is recommended for use by default as a universal model in the latest versions of Ansys Fluent [
77].
The Species Transport model in Ansys Fluent calculates the concentrations of water vapor, oxygen, and carbon dioxide. The mixing and transport of chemicals can be modeled by solving conservation equations, which describe convection, diffusion, and reactions for each component. No chemical reactions occur in this solution.
3.2. Task Parameters
The train cabin is made of a metal frame of a multilayer wall.
Table 1: The outside of the cabin is sheathed with 2.5 mm thick steel sheets welded to the frame, and the inside is lined with 3 mm thick perforated aluminum sheets. To ensure good sound insulation and thermal insulation, the internal surfaces of the sheets and frame are covered with anti-noise mastic, and between the sheets of outer and inner cladding, packages of glass plates or insulation, in particular polyethylene foam, covered with polyamide film are installed into the frame.
In order to consider heat exchange with the environment, convective heat transfer was used to model the cabin wall and external domain (8). As an applied theory for obtaining heat transfer coefficients α, the Jurgens formula was used [
40]. Parameter values are given in
Table 4.
A comparative analysis of thermal characteristics using applied theories and directly taking into account the external environment as a separate domain is given in [
40].
Using Formula (11) for the wall thickness of 0.0375 m, the values of the coefficient
= 1.04
(heat transfer coefficient) can be obtained. The composition of the wall is presented in
Table 3.
Here, is the external air speed (train speed); are the thermal conductivity of the i-th wall and the thickness; and α is the thermal conductivity coefficient for the walls.
For a train speed of 16.7 m/s, the heat transfer coefficient of the wall was 1.04 and that of the windows was 38.14 .
For numerical and experimental purposes, a train moving at a constant speed was considered. It was assumed that the climate system in the train was not operating and that velocities, temperatures, and concentrations had constant values according to the values given below. Then, the climate system was set to operate at the initial moment of time. Initial and boundary conditions were set (
Table 5 and
Table 6) with equipment characteristics [
83].
The problem was solved for summer and winter modes; accordingly, the cooling and heating of the cabin were modeled in the time domain.
To estimate the value of the amount of water vapor in the air, it is more convenient to use values relative to humidity in %. Arden Buck’s formulas [
84] can be used to translate the values:
where
and
are the partial pressure and equilibrium pressure of saturated vapor and T is the temperature in degrees Celsius. Formula (13) is used for positive temperatures, and Formula (14) is used for negative temperatures.
To determine the mass and thermal diffusion coefficients in Equation (7) for an ideal gas, the kinetic theory relations available in Ansys [
78] were used. In general, these coefficients depend on the temperature, pressure, and composition of the mixture.
Table 7 presents the average values of diffusion coefficients in the volume for the winter and summer regimes.
3.3. Breathing Simulation
Initial breathing data for one driver are shown in
Table 8 [
85,
86].
In this case, the breathing rate from time
t of one driver is given by a periodic function:
Here, is the volume of inhaled air per breath, m3; —time of one breath, s; and is the inhalation–exhalation surface area (nasal or oral surfaces), m2.
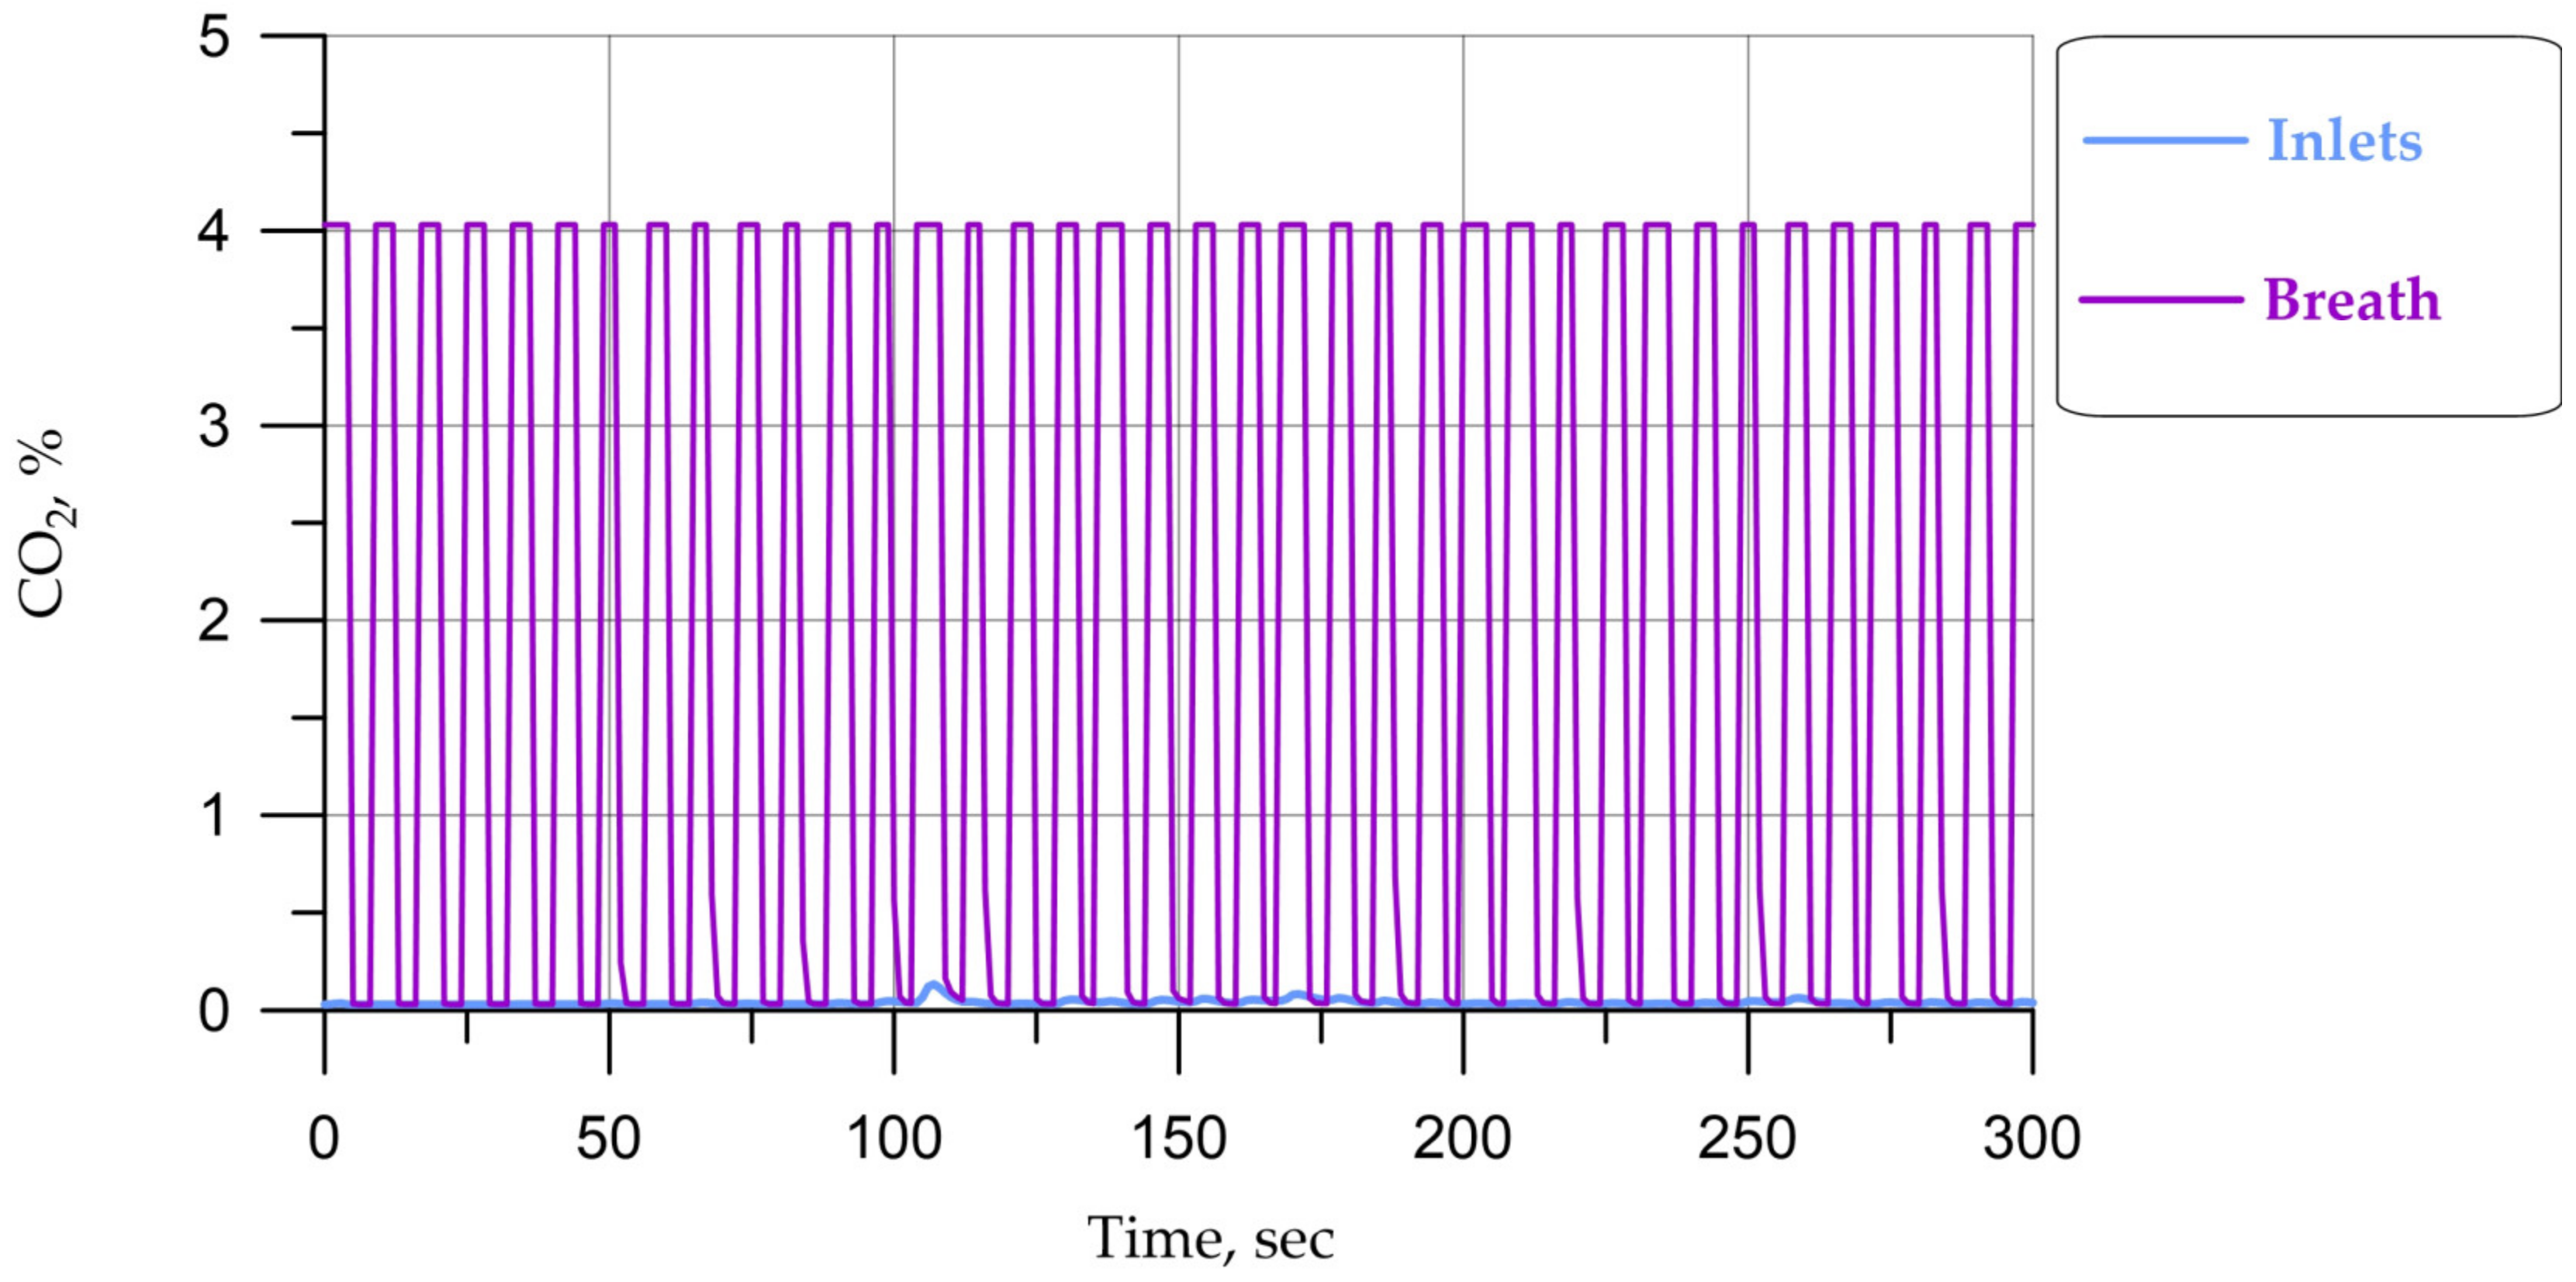
The concentration of carbon dioxide and humidity during respiration were specified over time by piecewise constant functions (set 1) in accordance with
Table 3.
The assumption in this case is that the concentration of carbon dioxide in exhaled air remains unchanged, regardless of the increase in inhaled air concentration. However, as a complication, it is possible to assume a variable concentration of exhaled carbon dioxide, depending on the inhaled one.
3.4. Numerical Results
Initially, a nonstationary problem was solved. The process was studied until the onset of a stable state, and the time to achieve stabilized parameters and the values of the parameters at each time step were determined.
Temperatures and carbon dioxide concentrations are given:
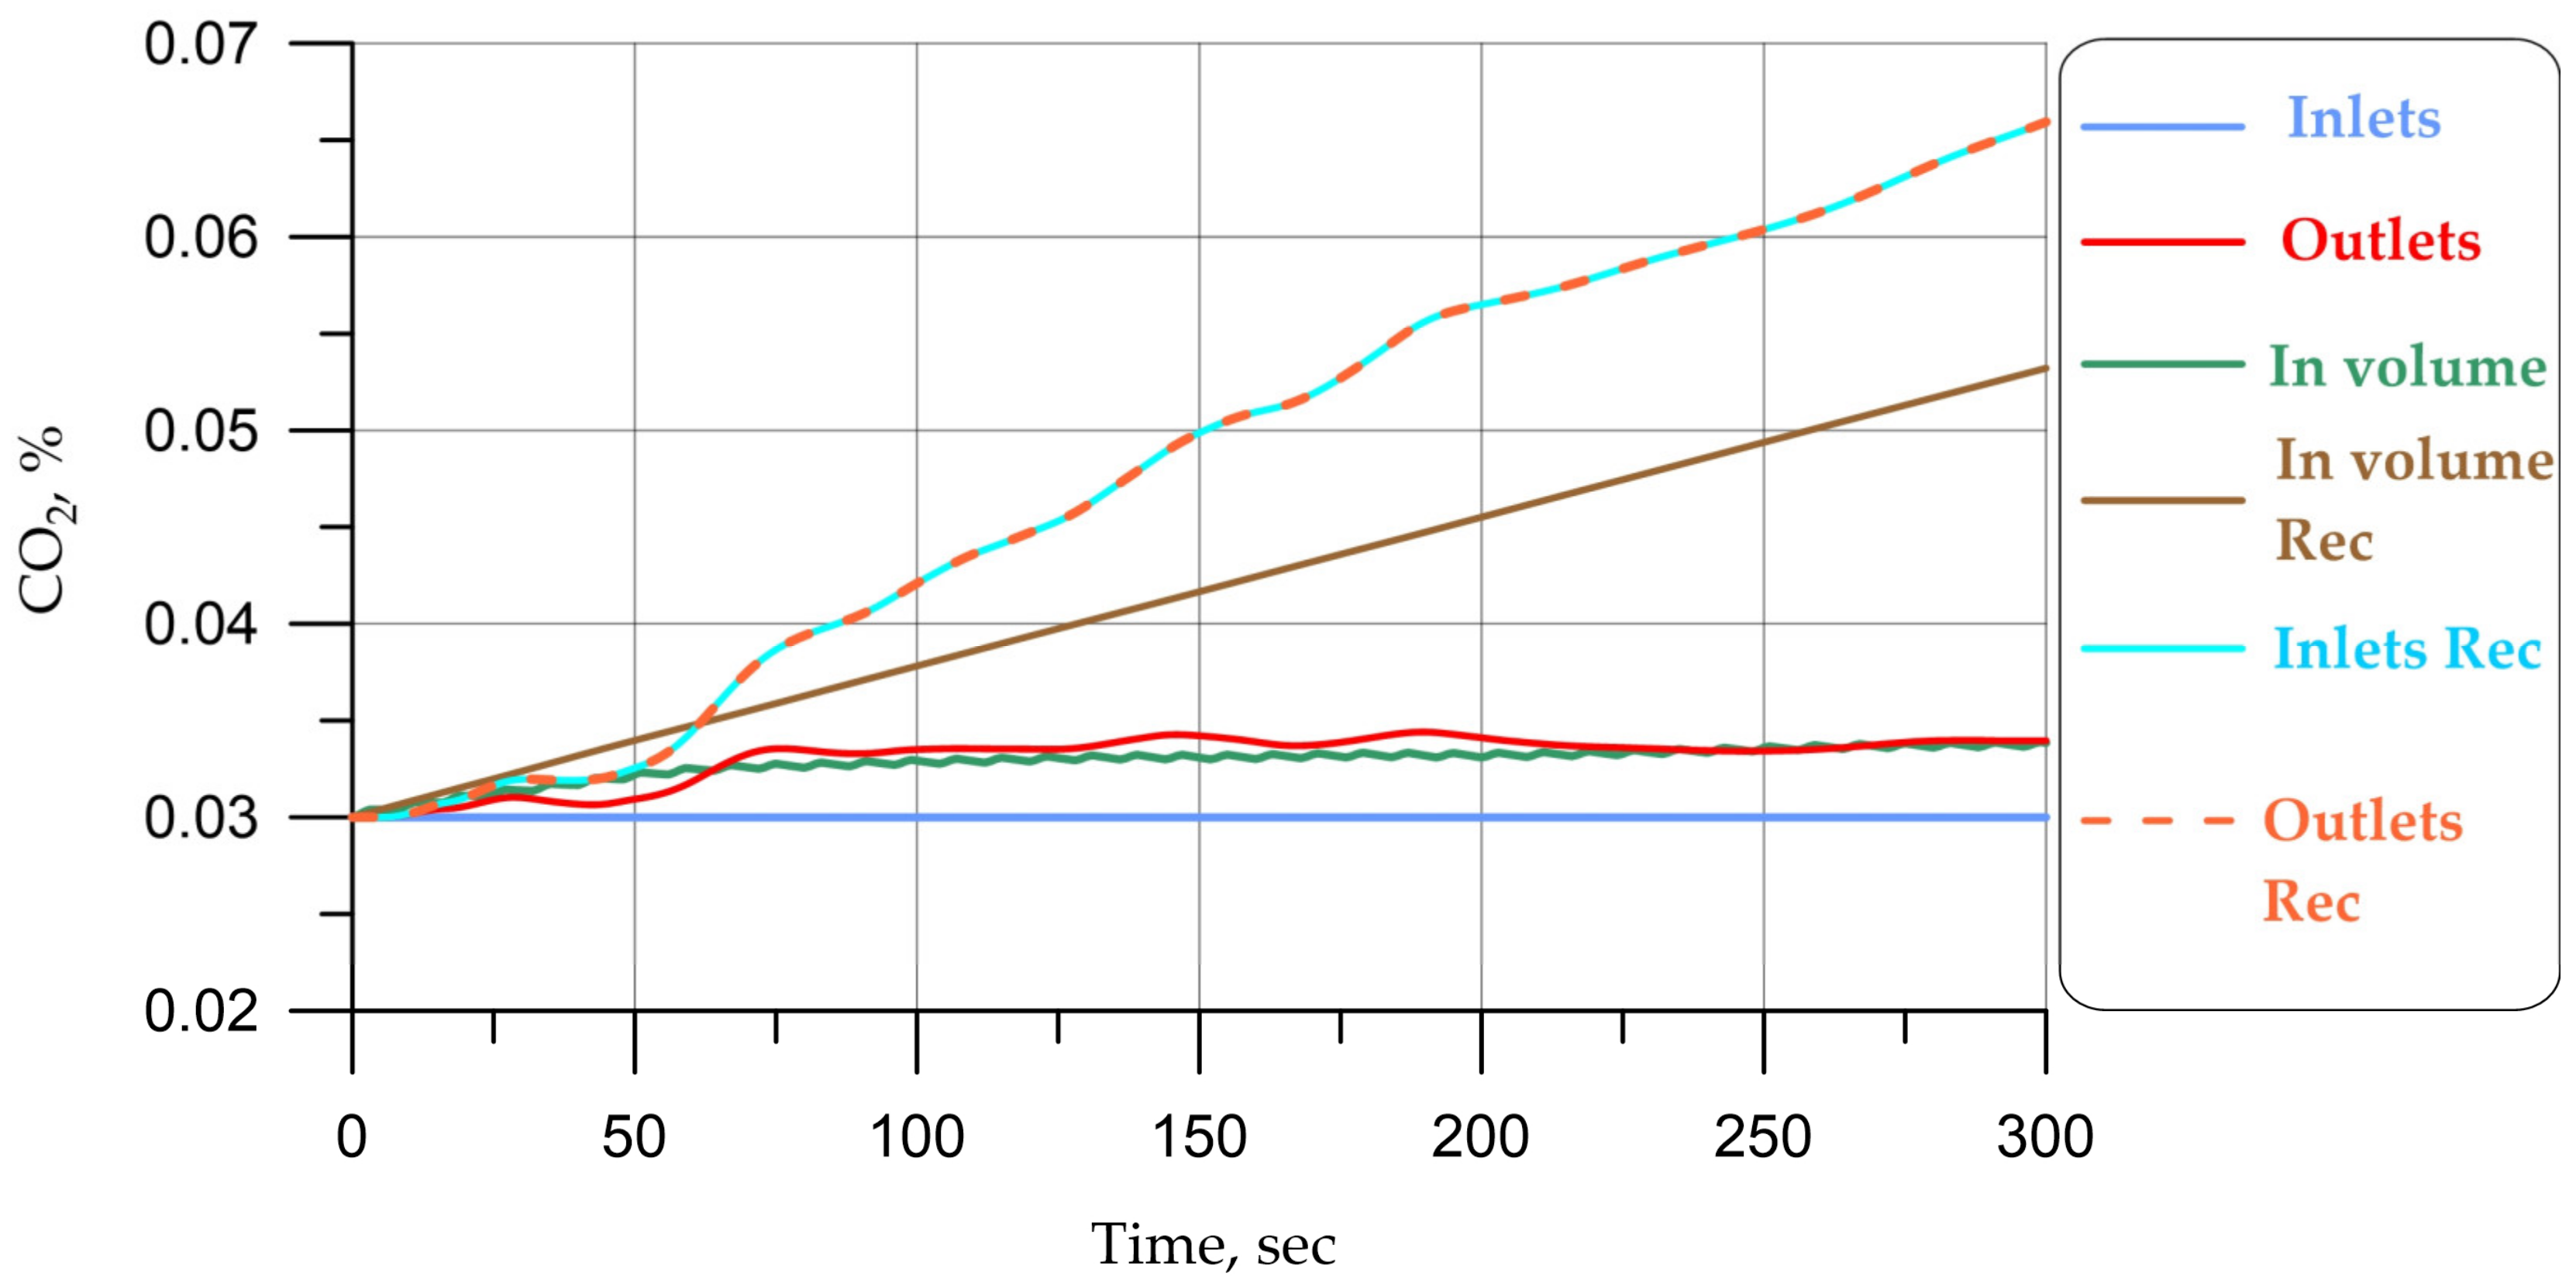
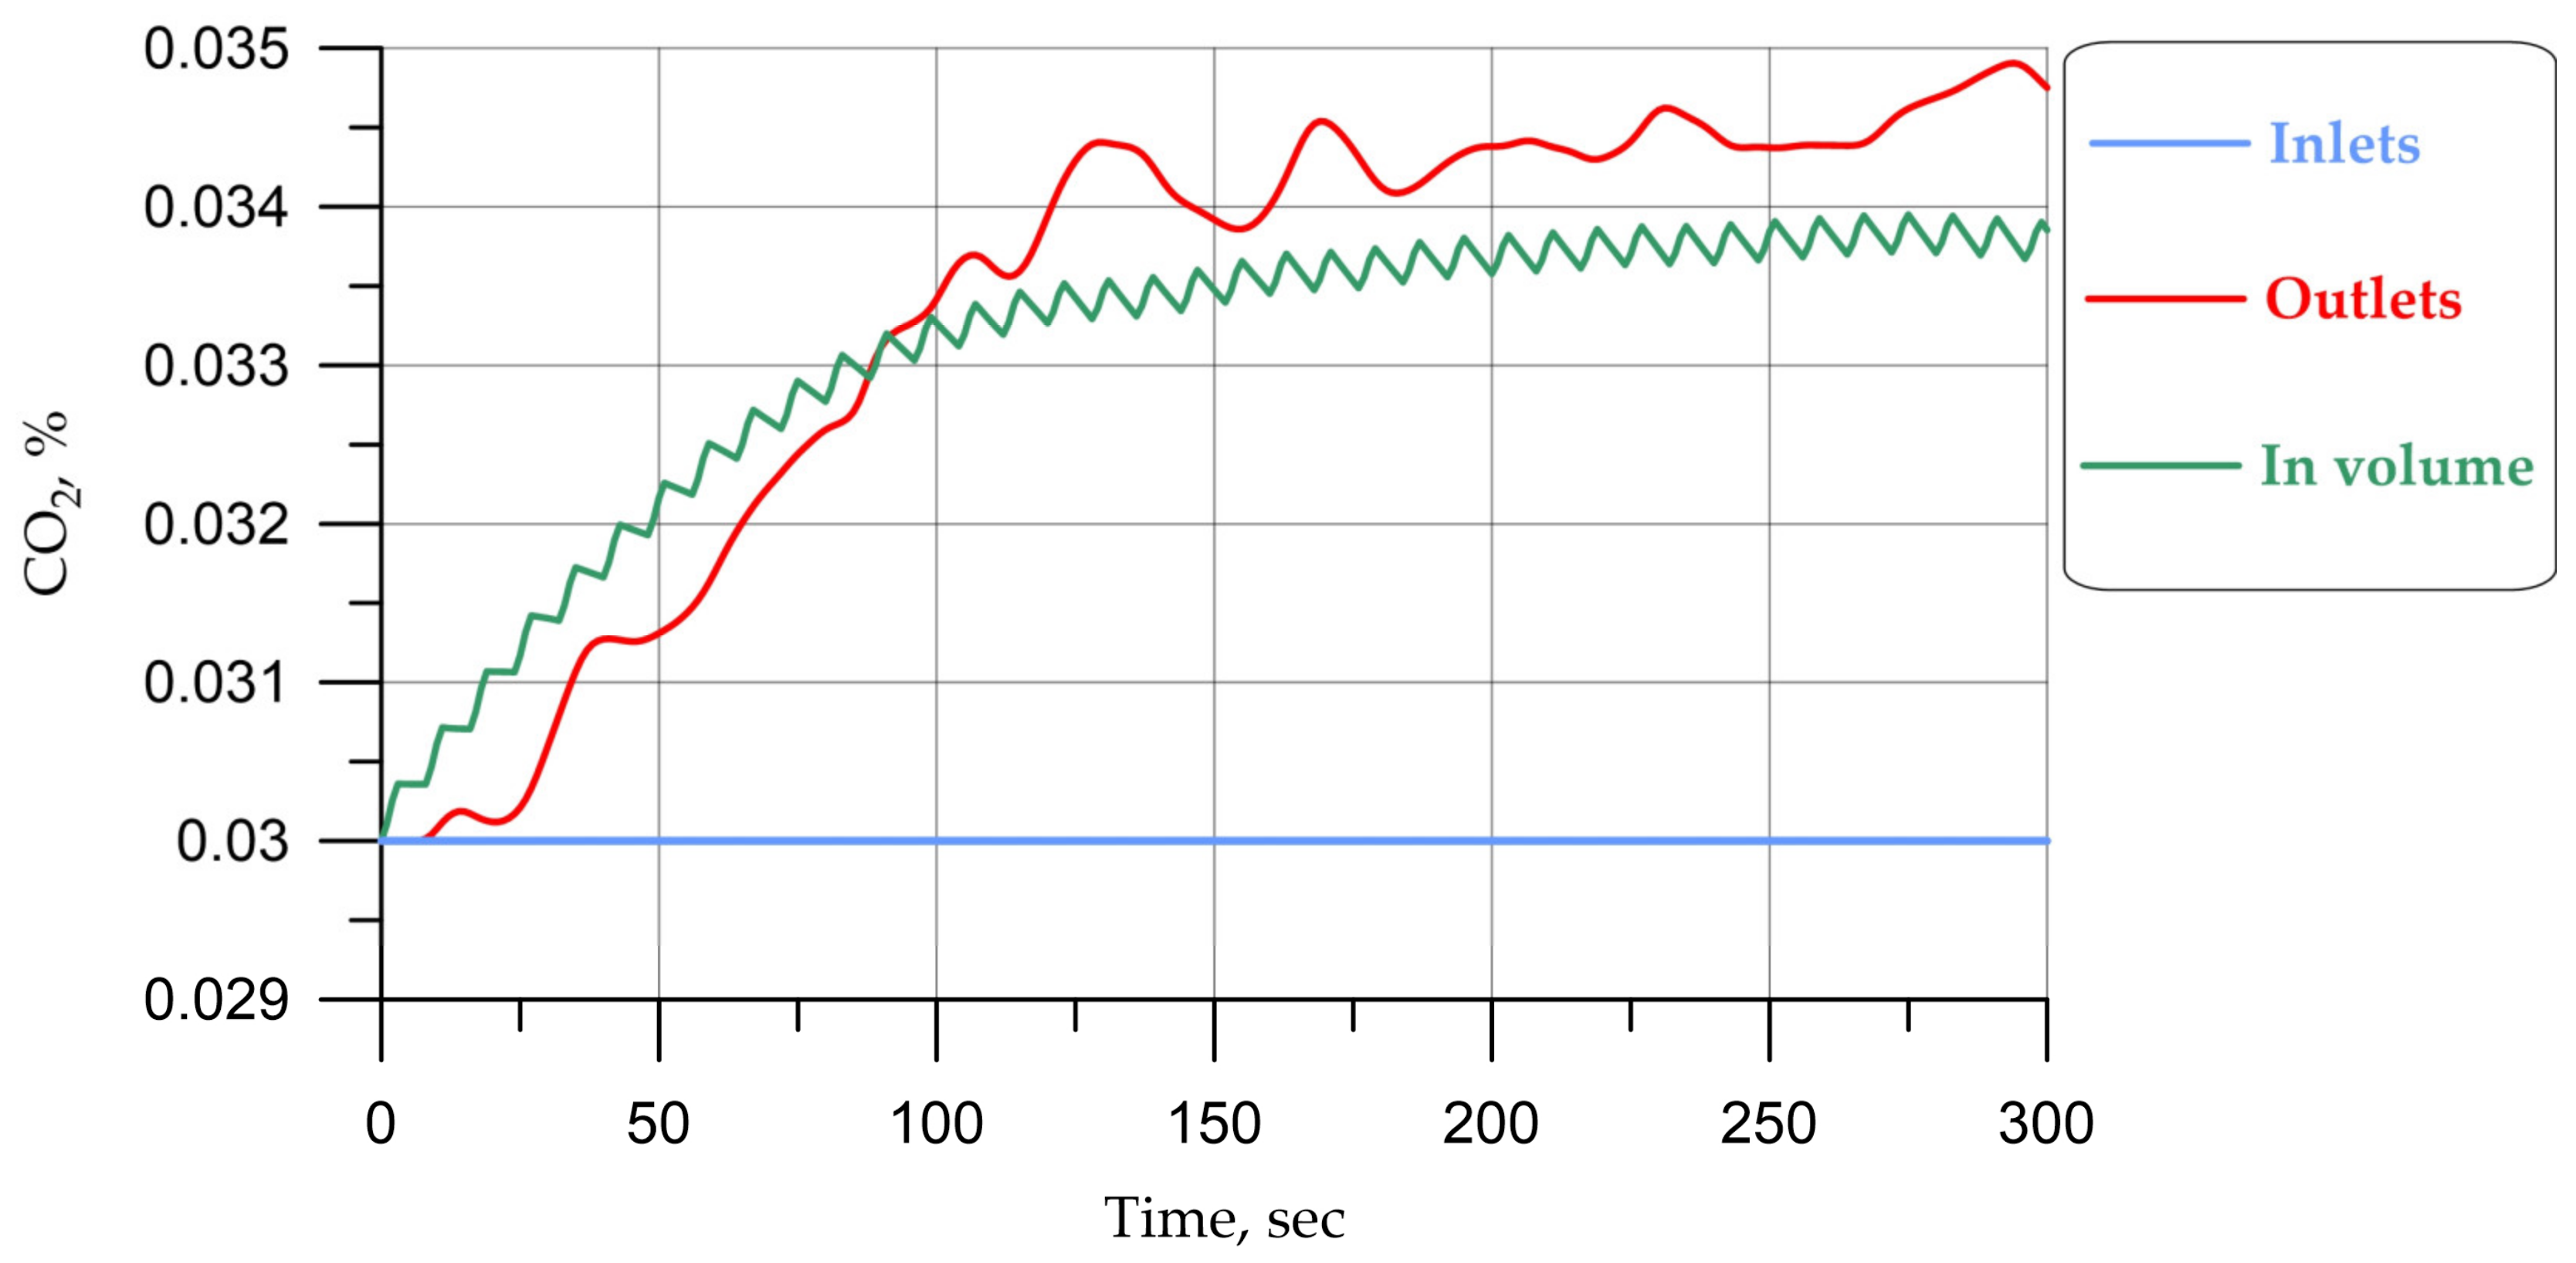
Average values at the entrances and exits from the cabin (designation in the Figures below: “Inlets” and “Outlets”);
Average value in the cabin (designation in the Figures below: “in Volume”);
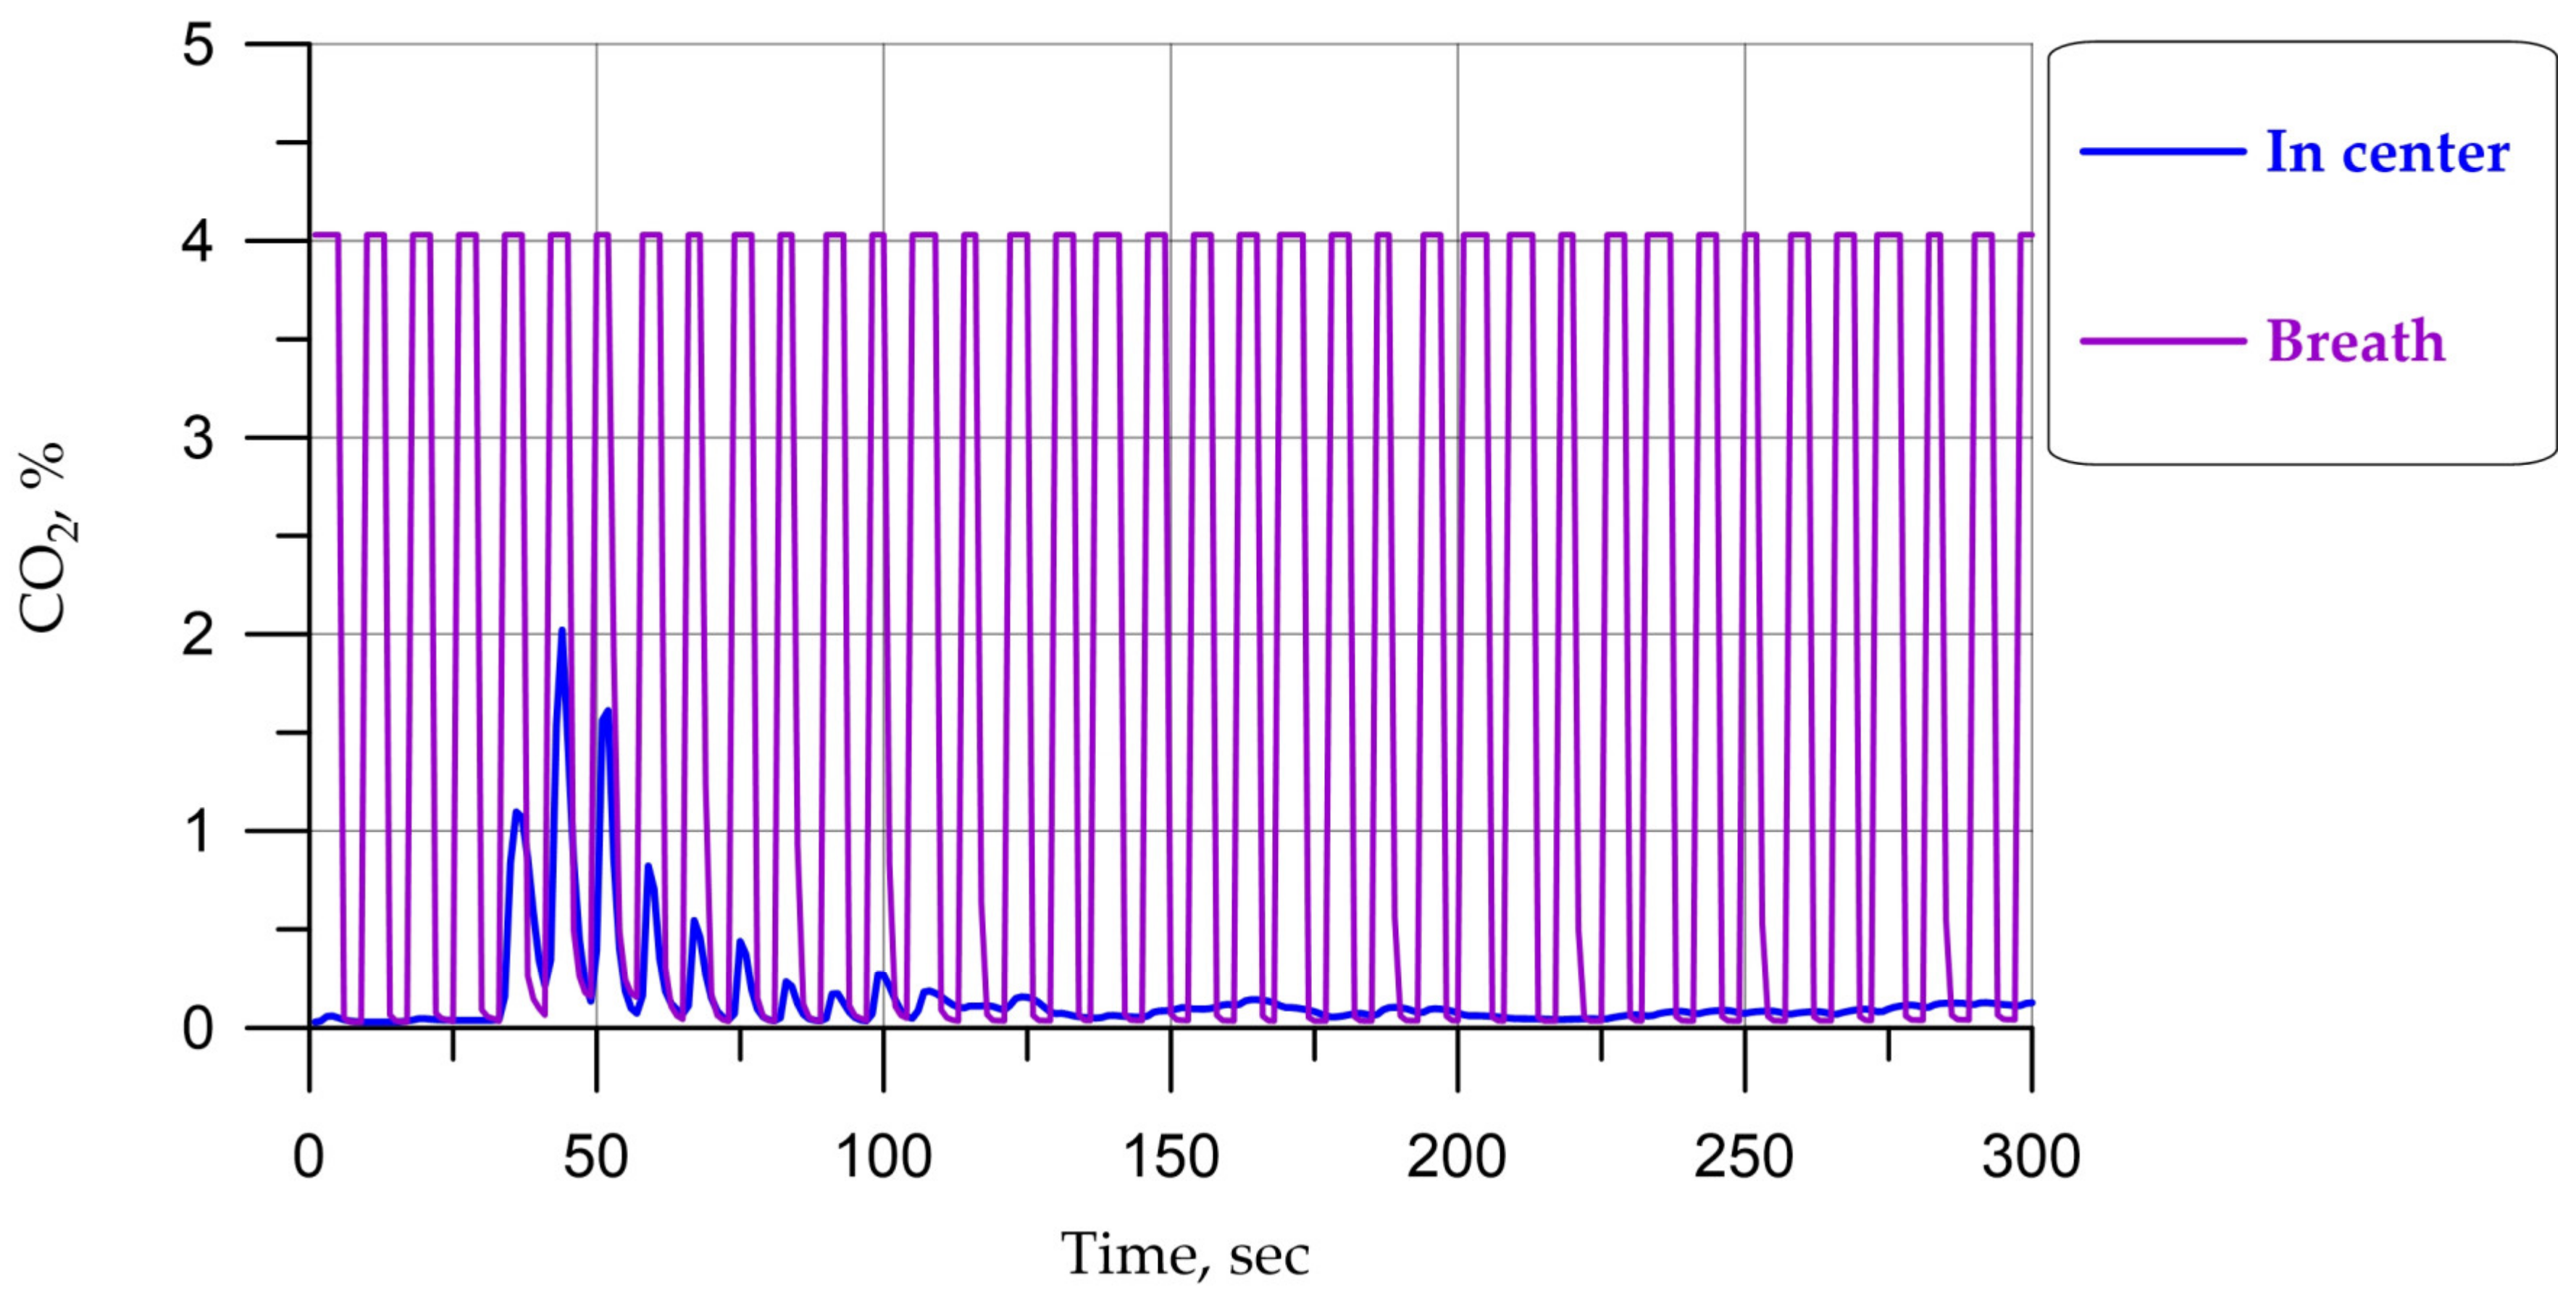
Average value on the driver’s inhalation–exhalation surface (designation in the Figures below: “Breath”);
In front of the driver’s face at the intersection of two lines (hereinafter referred to as the Center), as seen in
Figure 4 (designation in the Figures below: “In center”).
In addition,
Figure 8 and
Figure 9 show the graphs of carbon dioxide concentration obtained in the recirculation mode for the summer mode: values in the center (in “center” Rec) and the average value in the cabin (“in Volume Rec”).
It is necessary to explain how the recirculation mode works in climate systems. Air in the circulation mode after leaving the cabin through the valve (outlet) enters the pipe space, and then completely (or partially in case of partial recirculation) comes back to the inlet. Thus, for the mathematical formulation at the inputs of the values of concentrations of carbon dioxide and water vapor, we need to set not the data from
Table 4 but those values that are obtained in the previous iteration at the output (
, where
—time step). That is, the values of inlet concentrations will increase with time. The values of inlet temperatures and velocities, on the other hand, will not change because they are regulated by the climate system. In such a mathematical formulation, we are expected to obtain a decrease in energy consumption (required power of the climate system) but also an increase in the concentration of carbon dioxide and humidity in the cabin.
The field stabilization time was about 300 s.
Table 9 shows the results of average values by the cabin volume and in front of the driver’s face in the center for a time of 300 s.
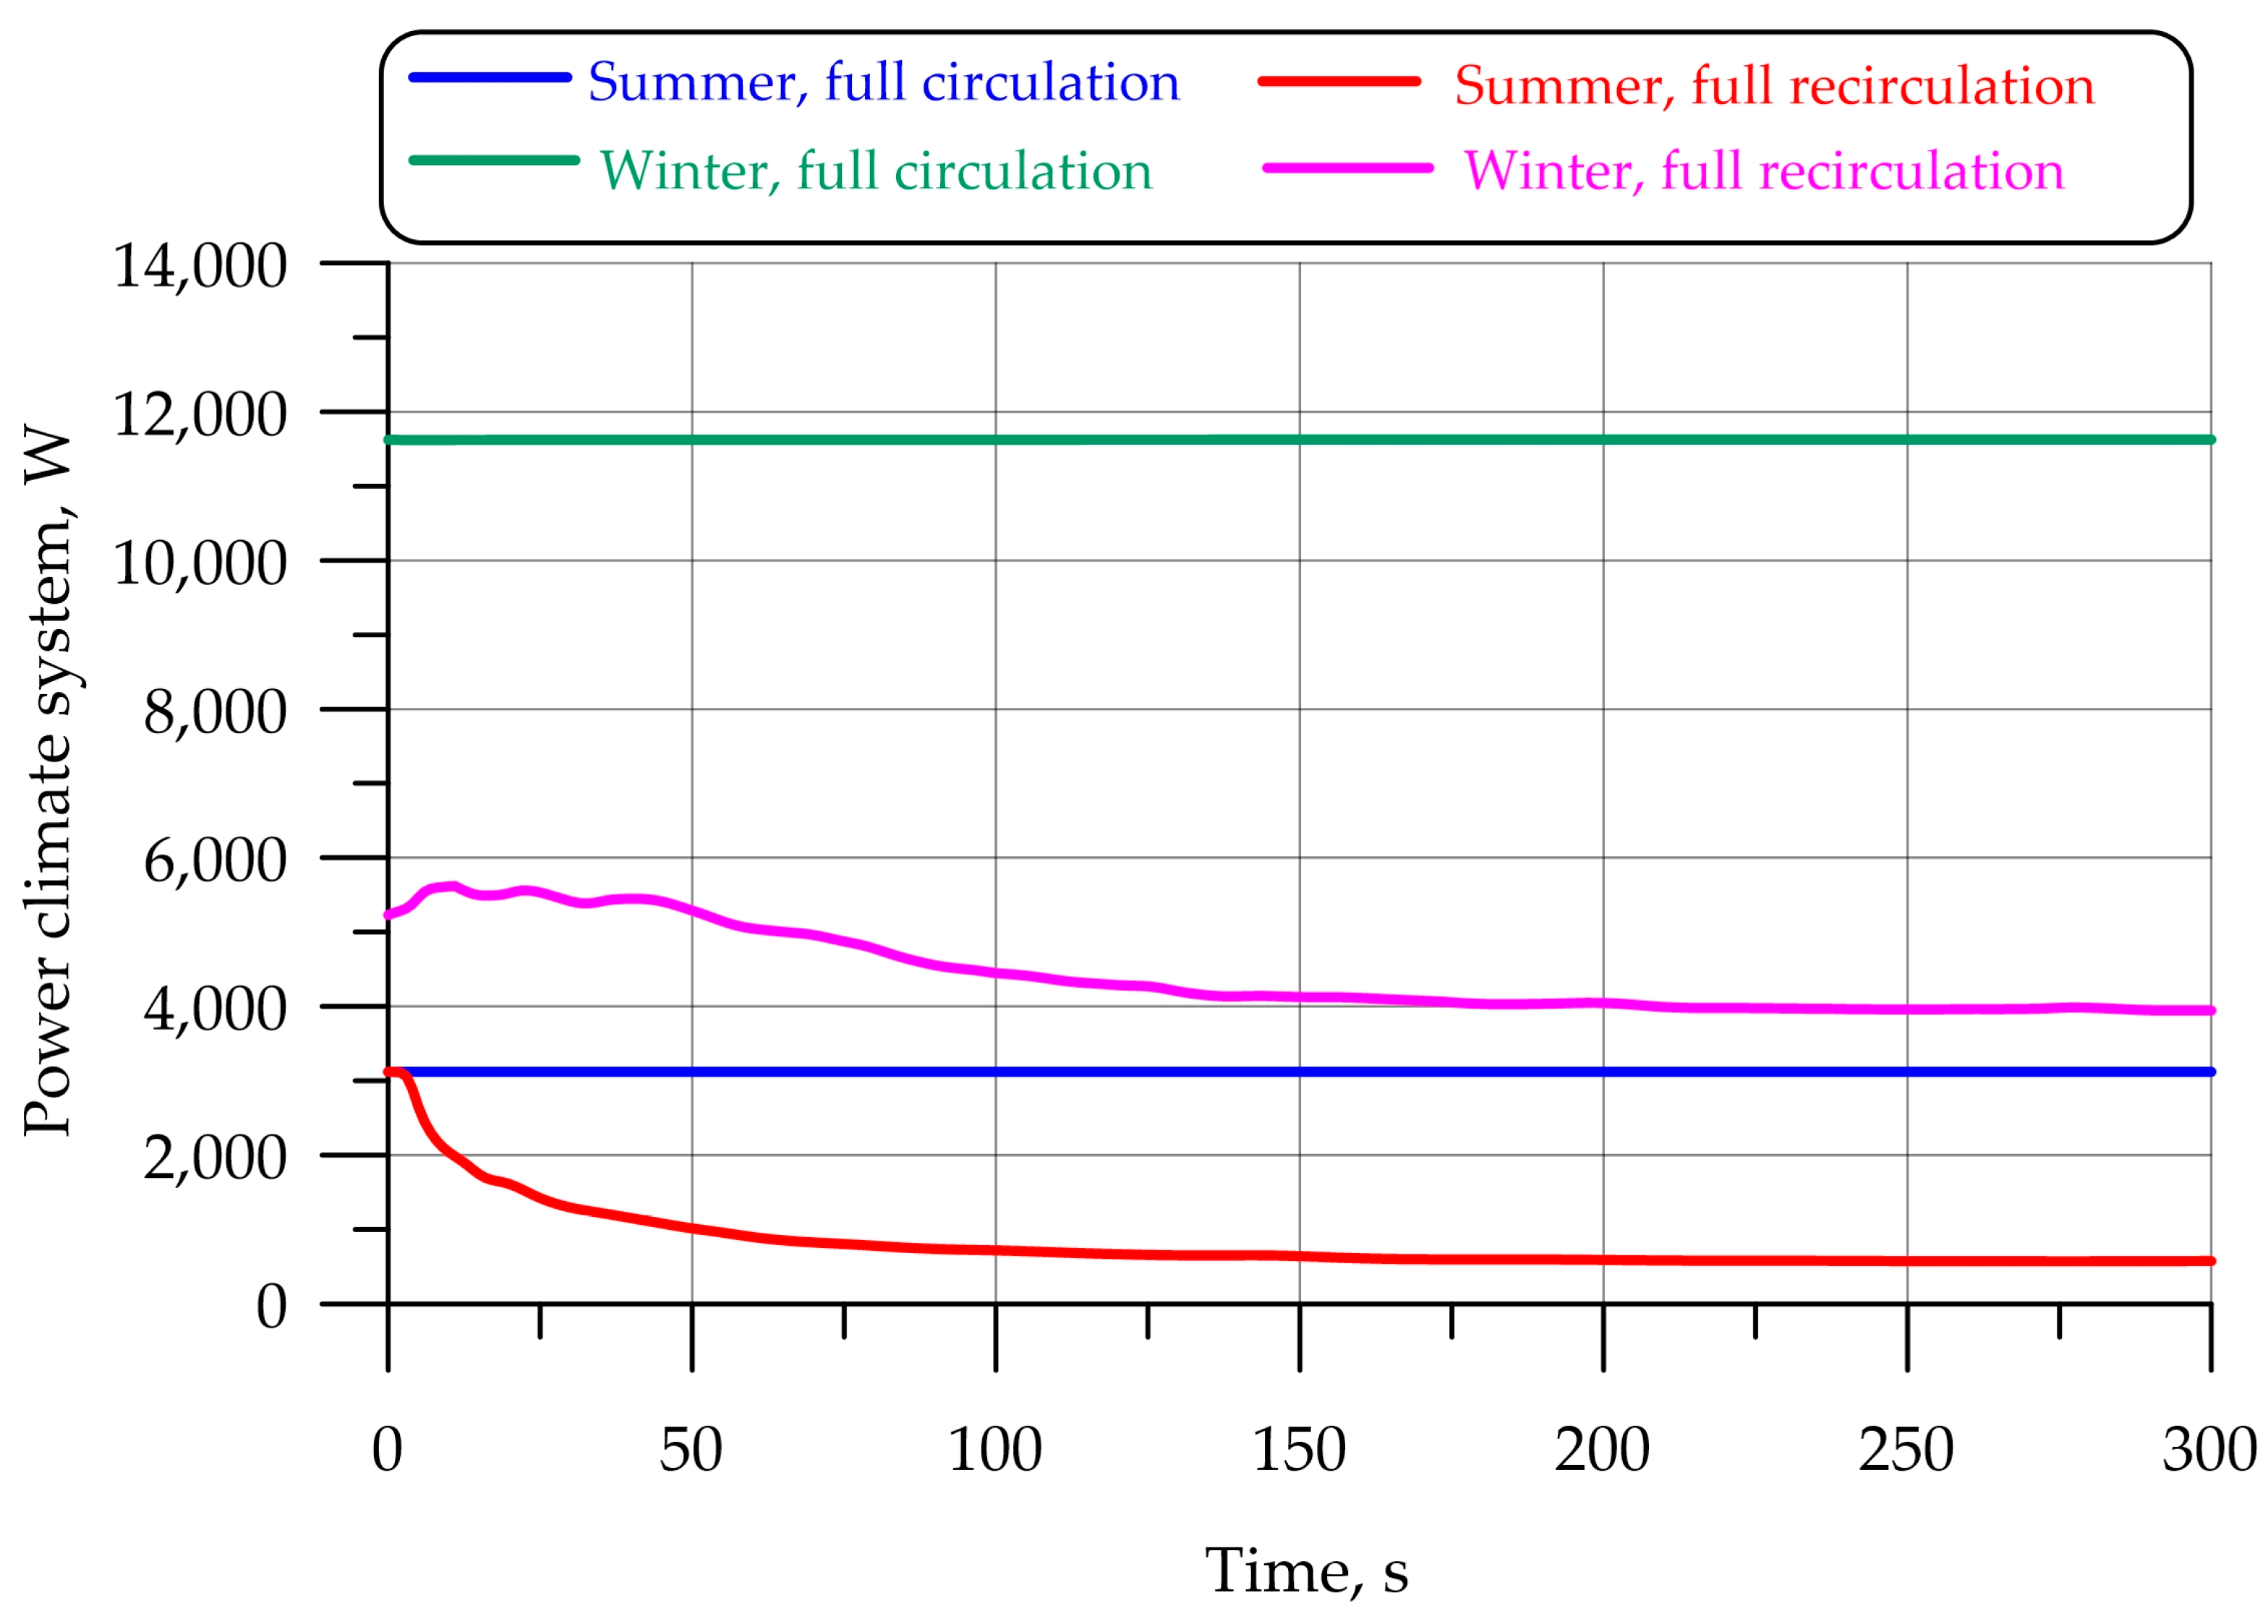
The power of the climate system according to heat balances in summer was 3122 W, and in winter it was 11,624 W. Power in this case is calculated using the following formula:
where
is the mass air flow rate,
is the heat capacity of the air, and ∆
T is the temperature difference at the inlet and outlet to the climate system.
Figure 13 shows the power values of the climate system for the summer and winter modes in the full circulation and full recirculation modes, respectively. Power in the recirculation mode is reduced by the climate system using cooled or heated air from the cabin rather than from outside. In the recirculation modes, power is reduced by a factor of 5 in the summer mode and by a factor of 3 in the winter mode.
5. Discussion
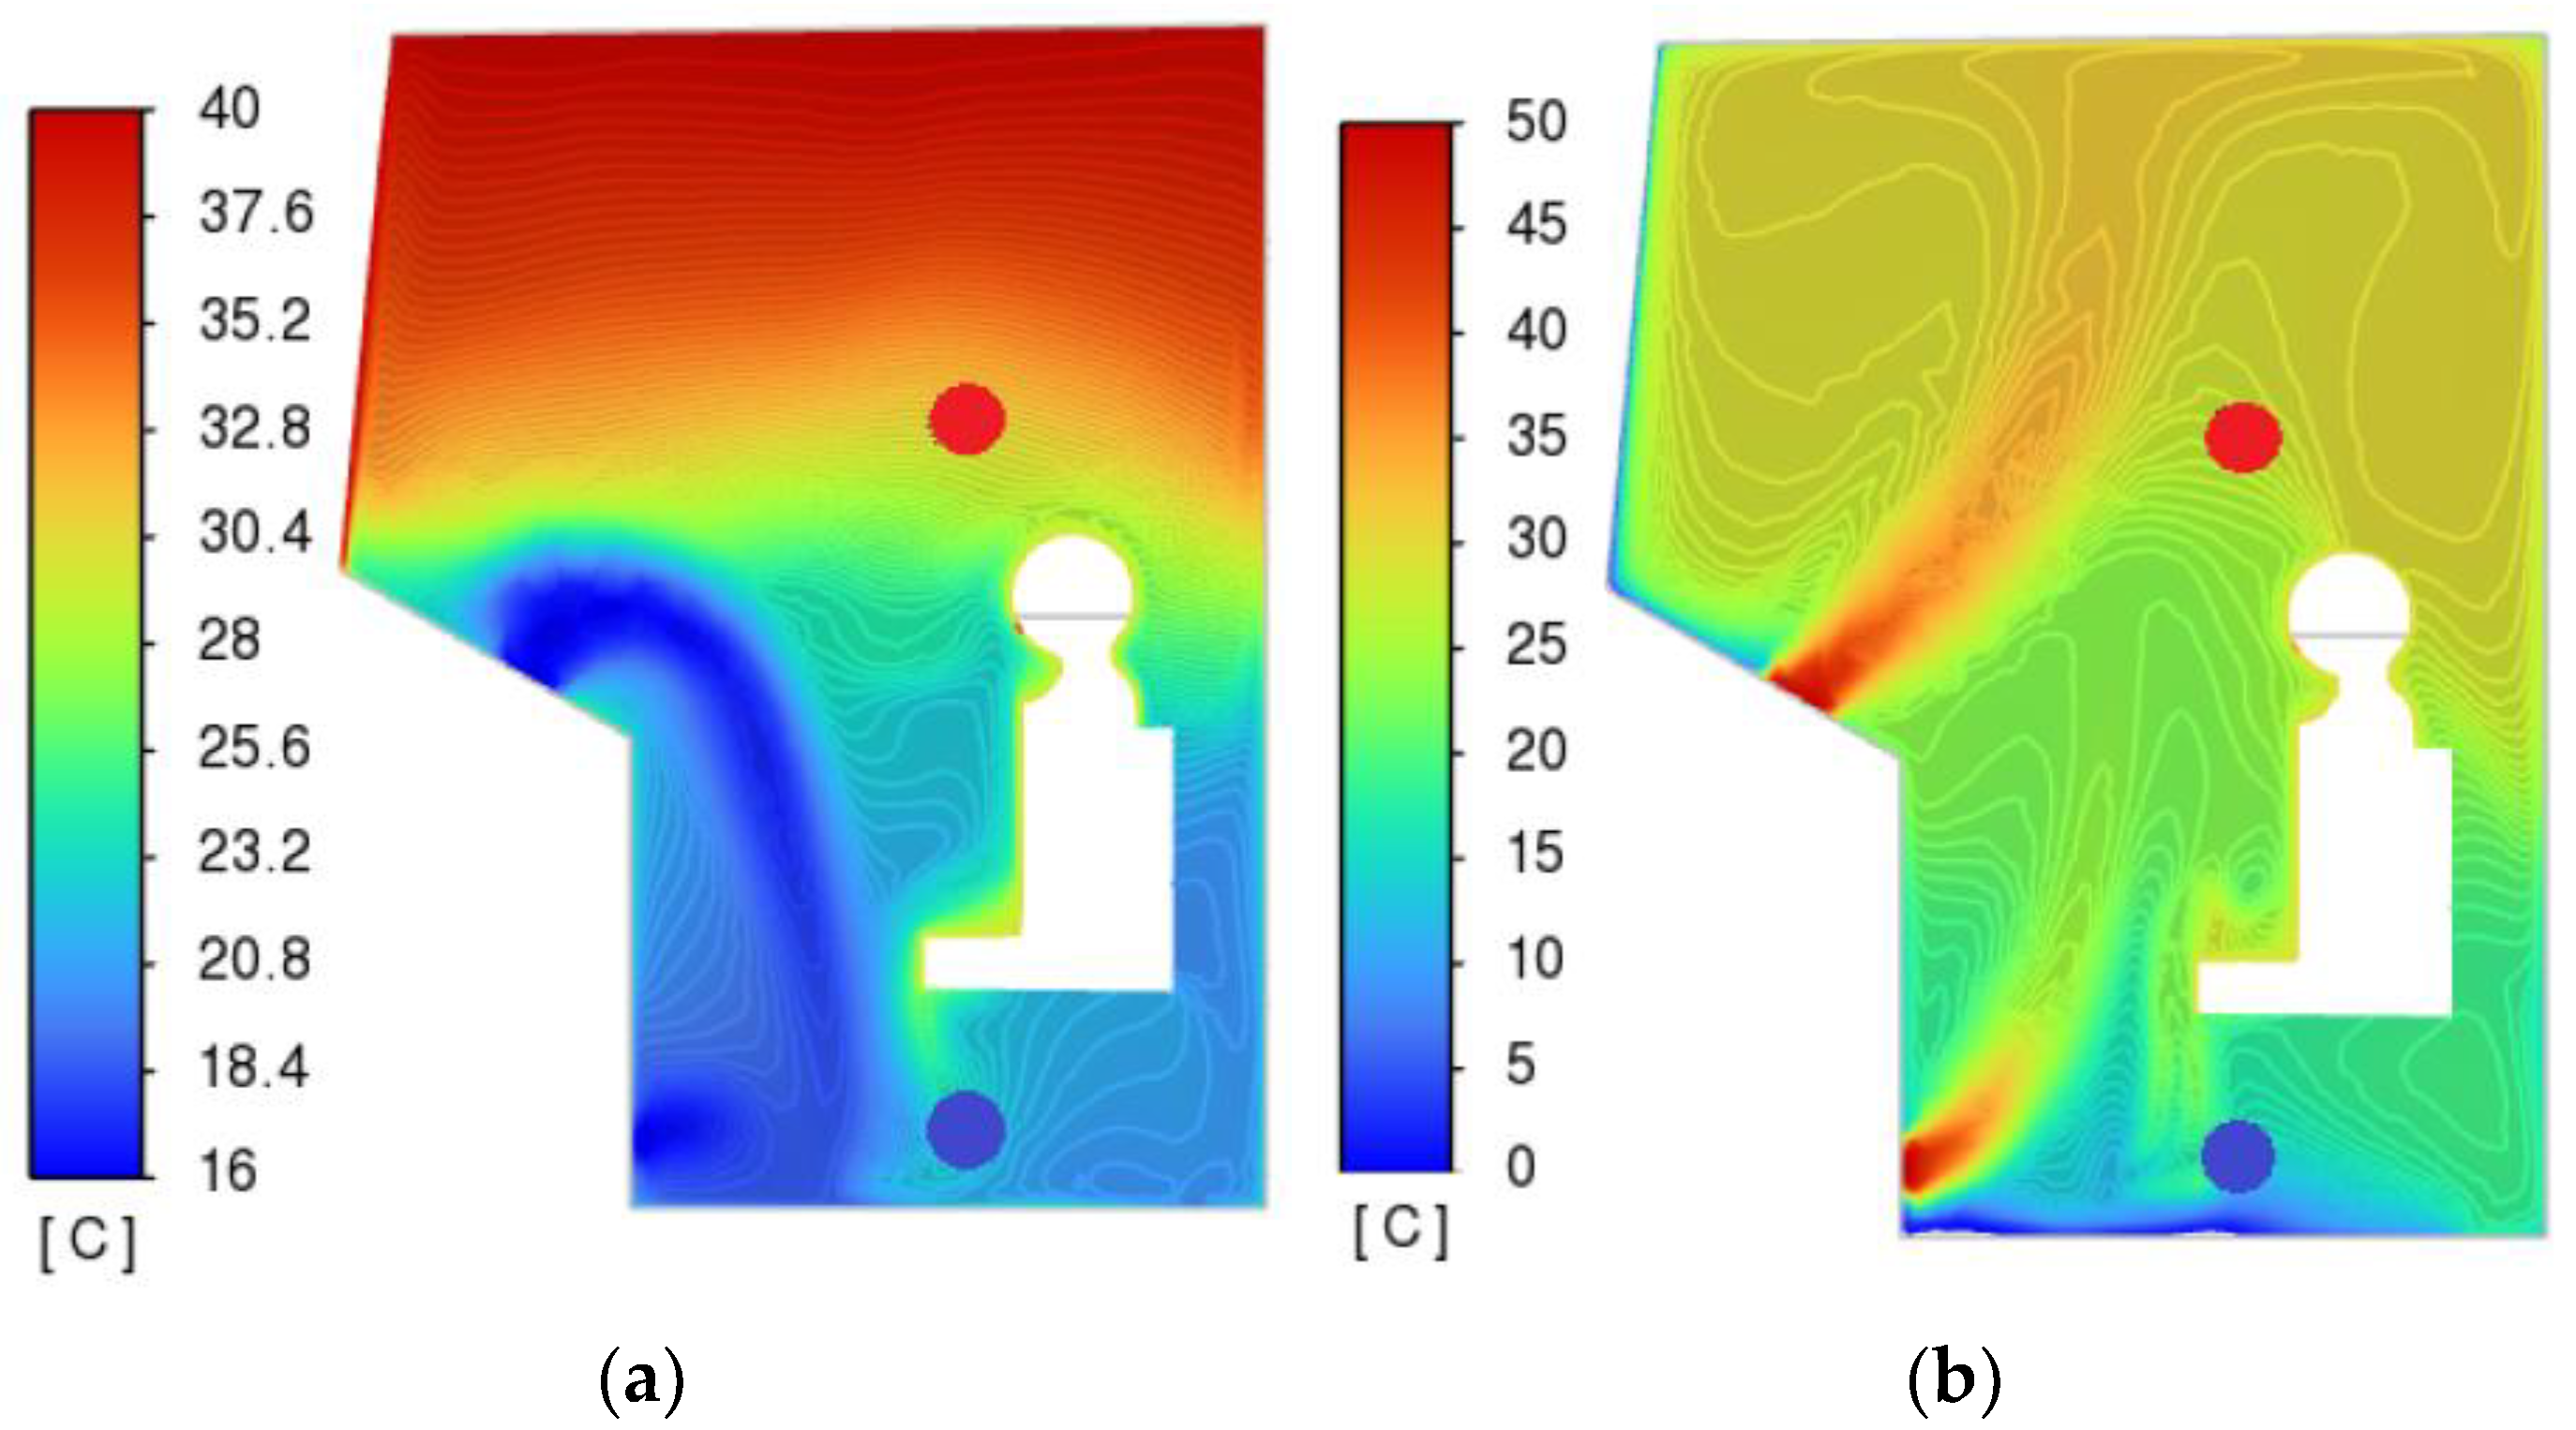
Based on the distribution of fields obtained above, the following patterns can be identified in the behavior of air flows and value fields in the cabin of a diesel locomotive:
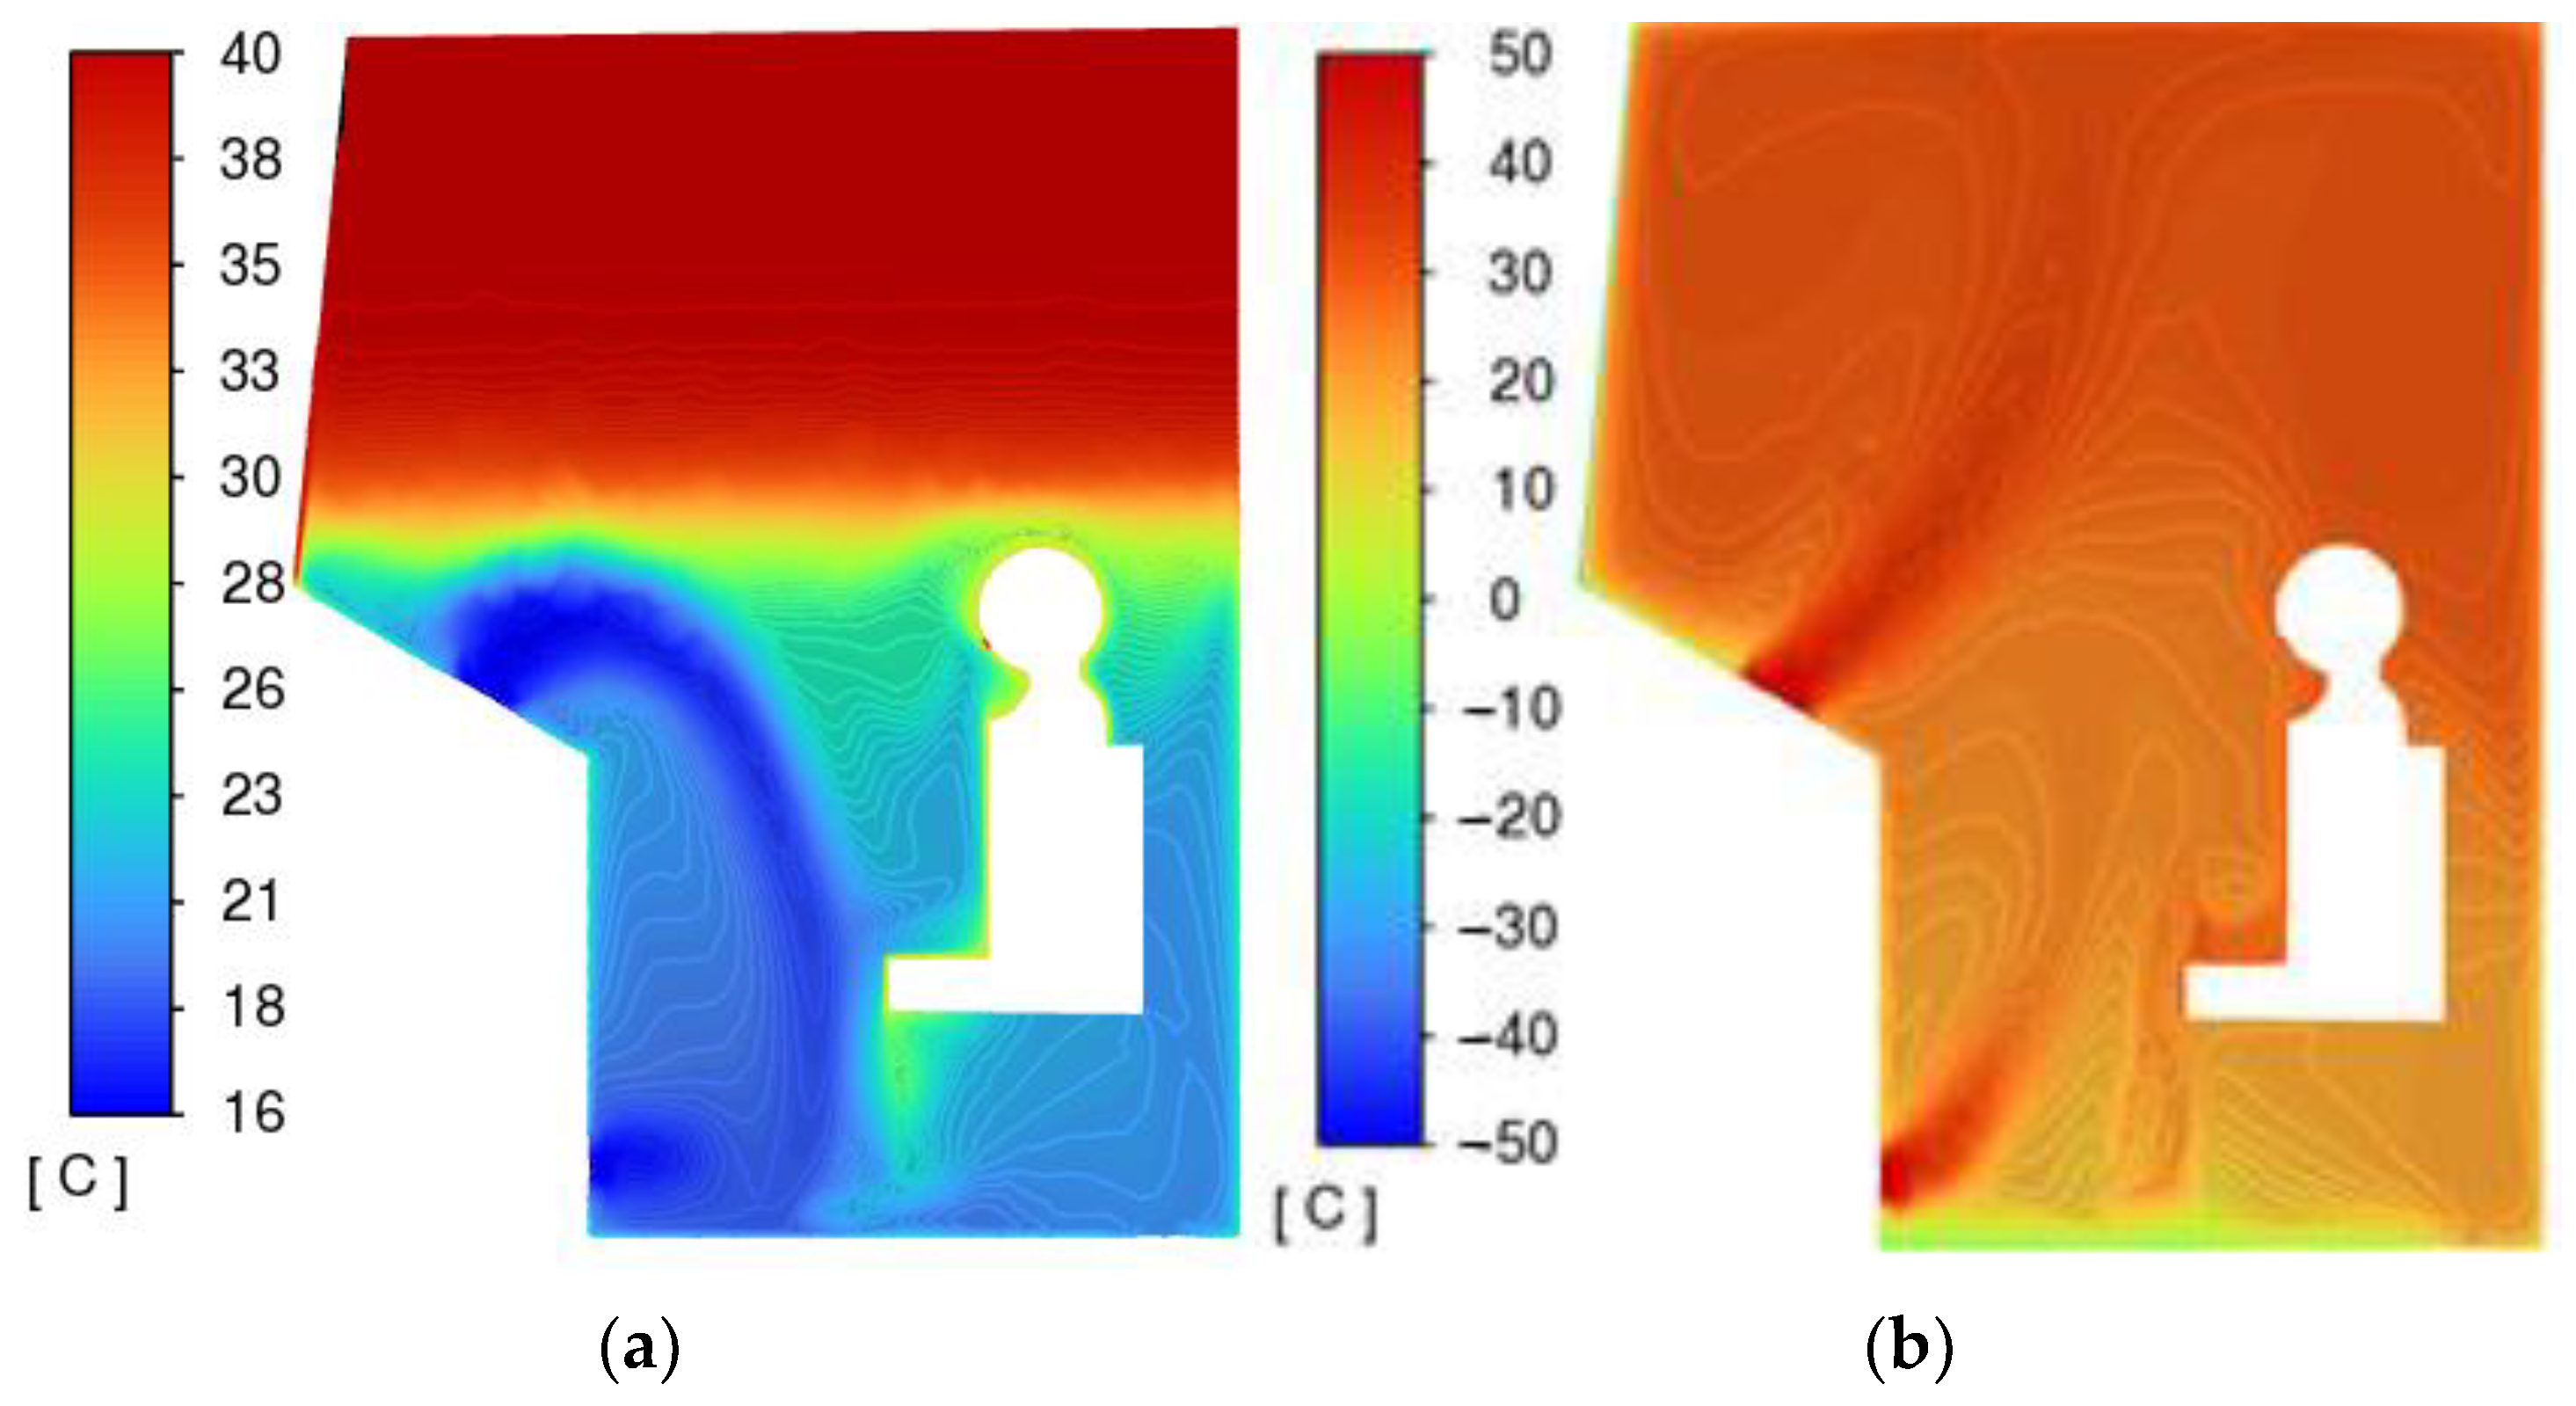
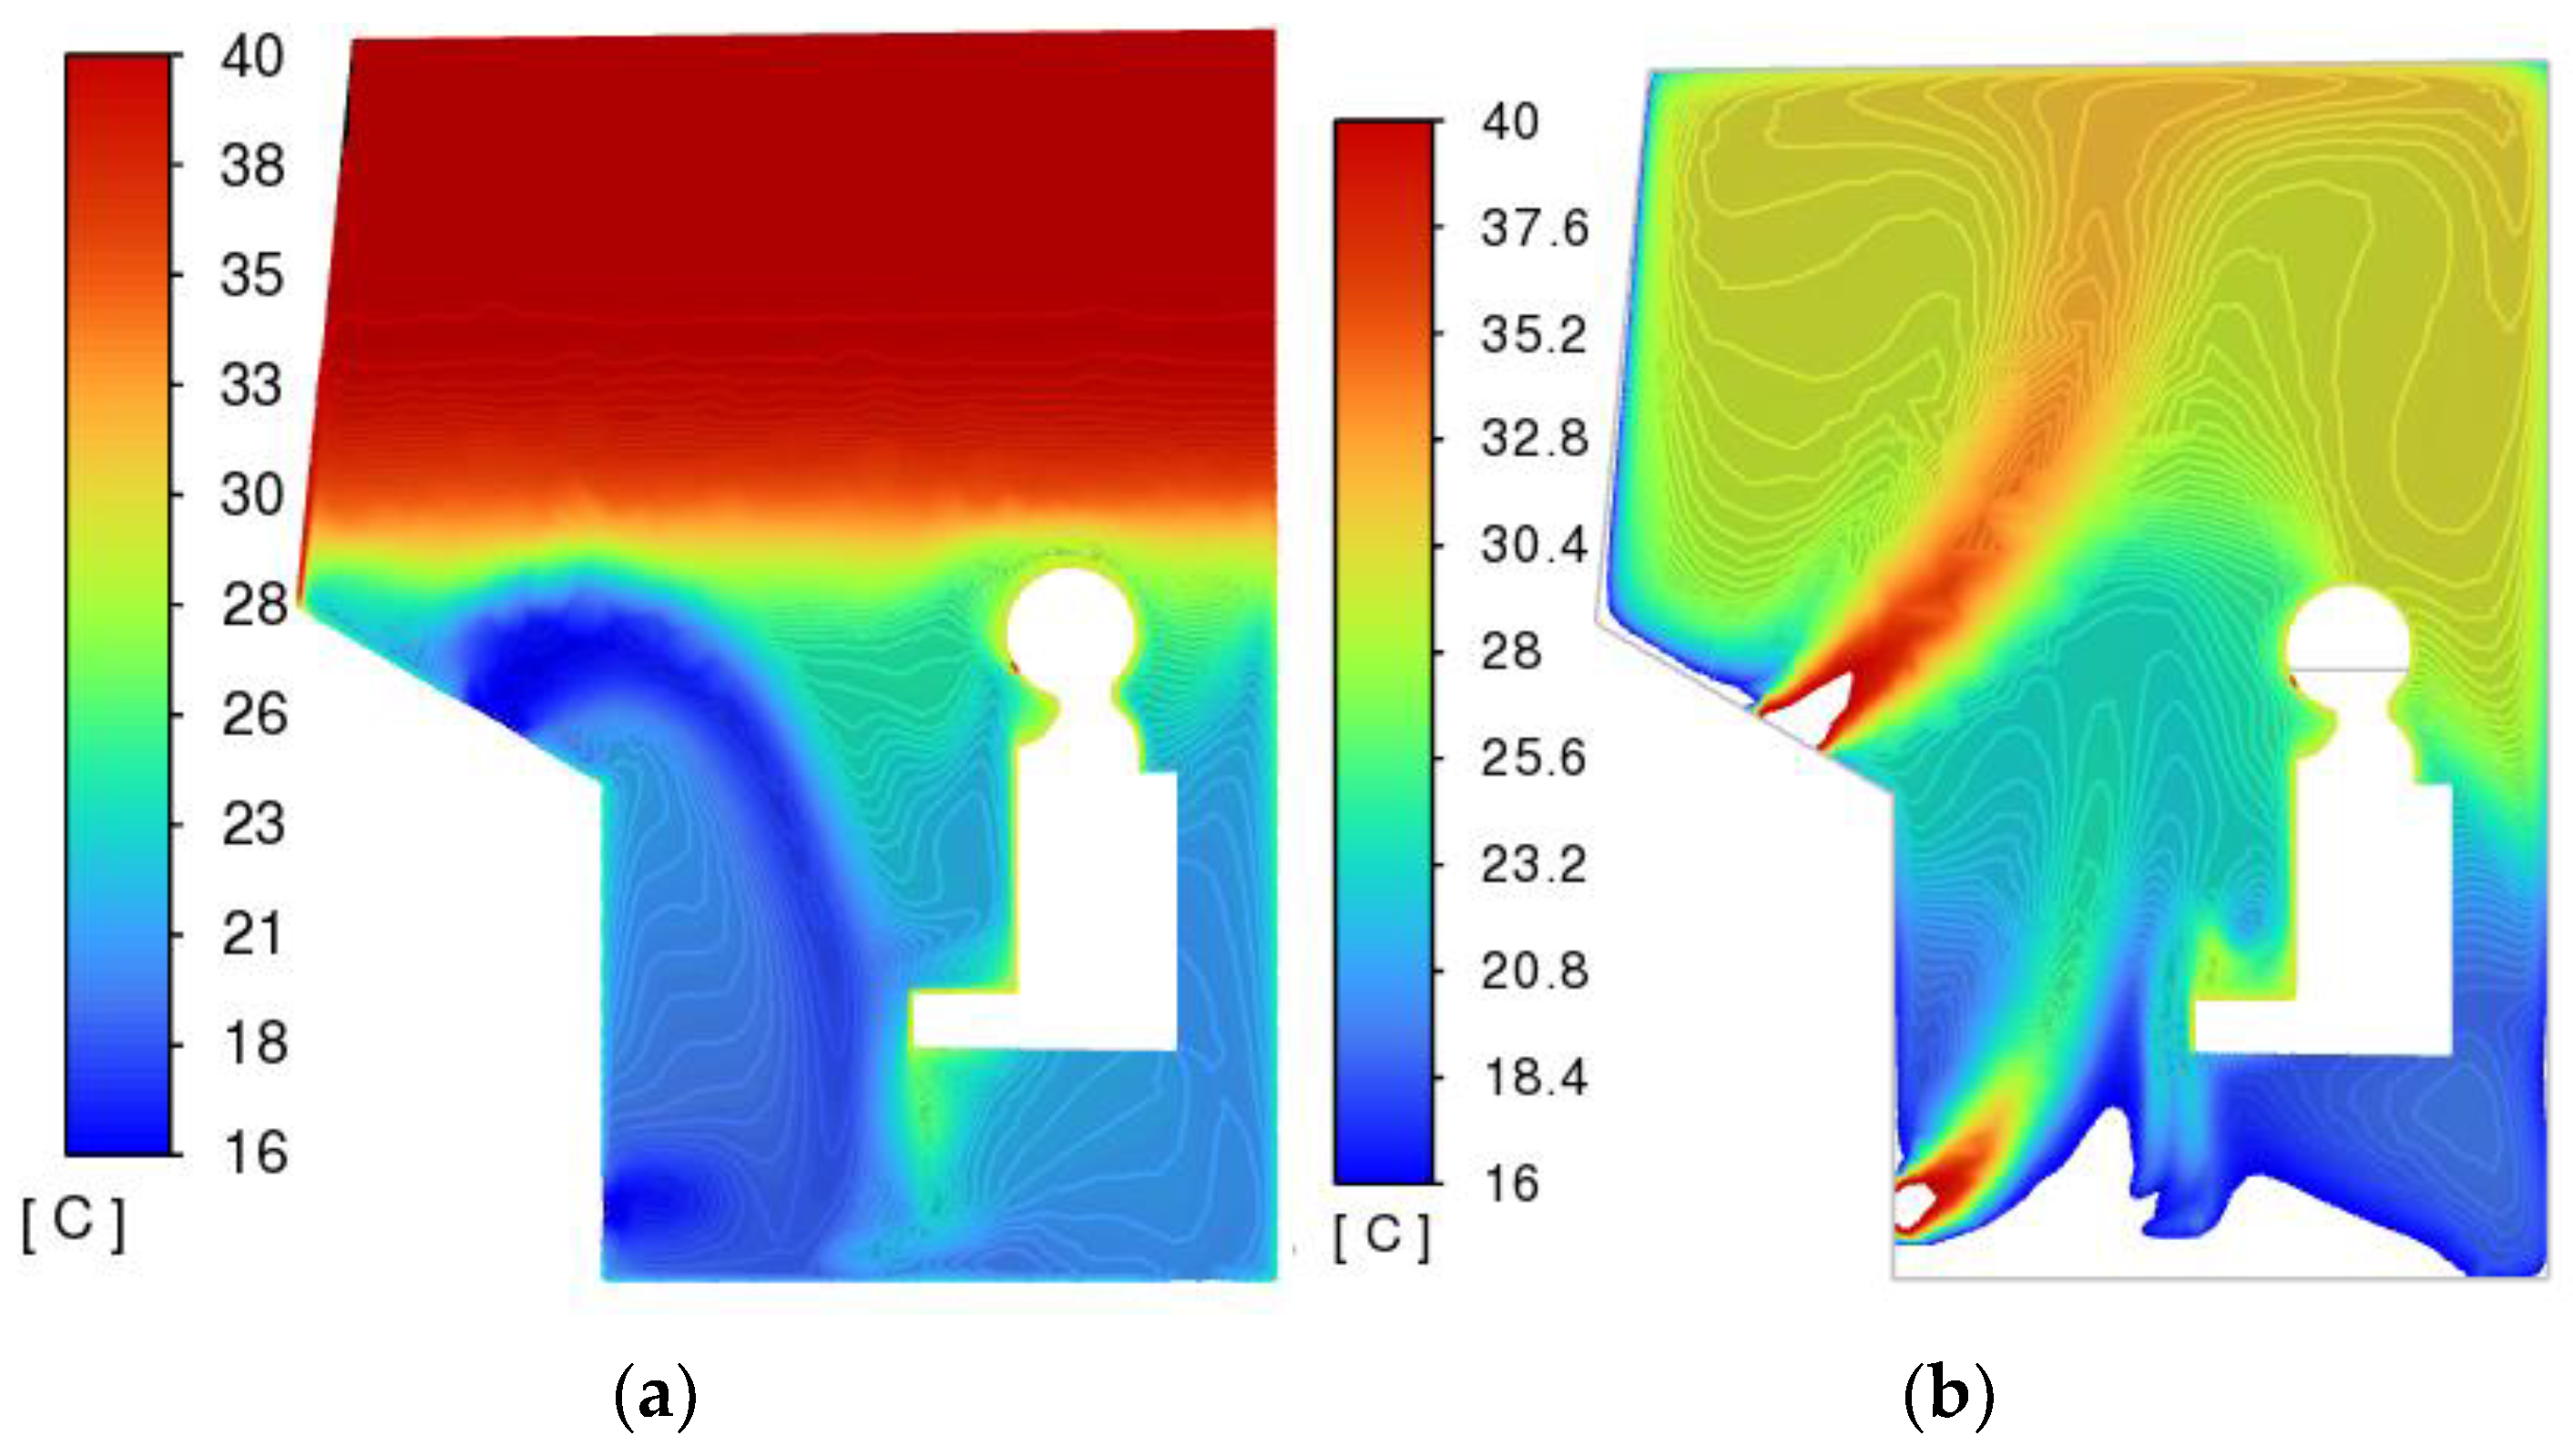
The nature of the distribution of speeds and temperatures is significantly uneven.
Limit values are reached in the areas of greatest airflow, located under the windshield.
Areas of air “stagnation” are located in the upper corners of the cabin.
In the winter mode, flow velocities reach higher values at a distance from the deflectors, which is caused by higher air temperatures in the winter mode.
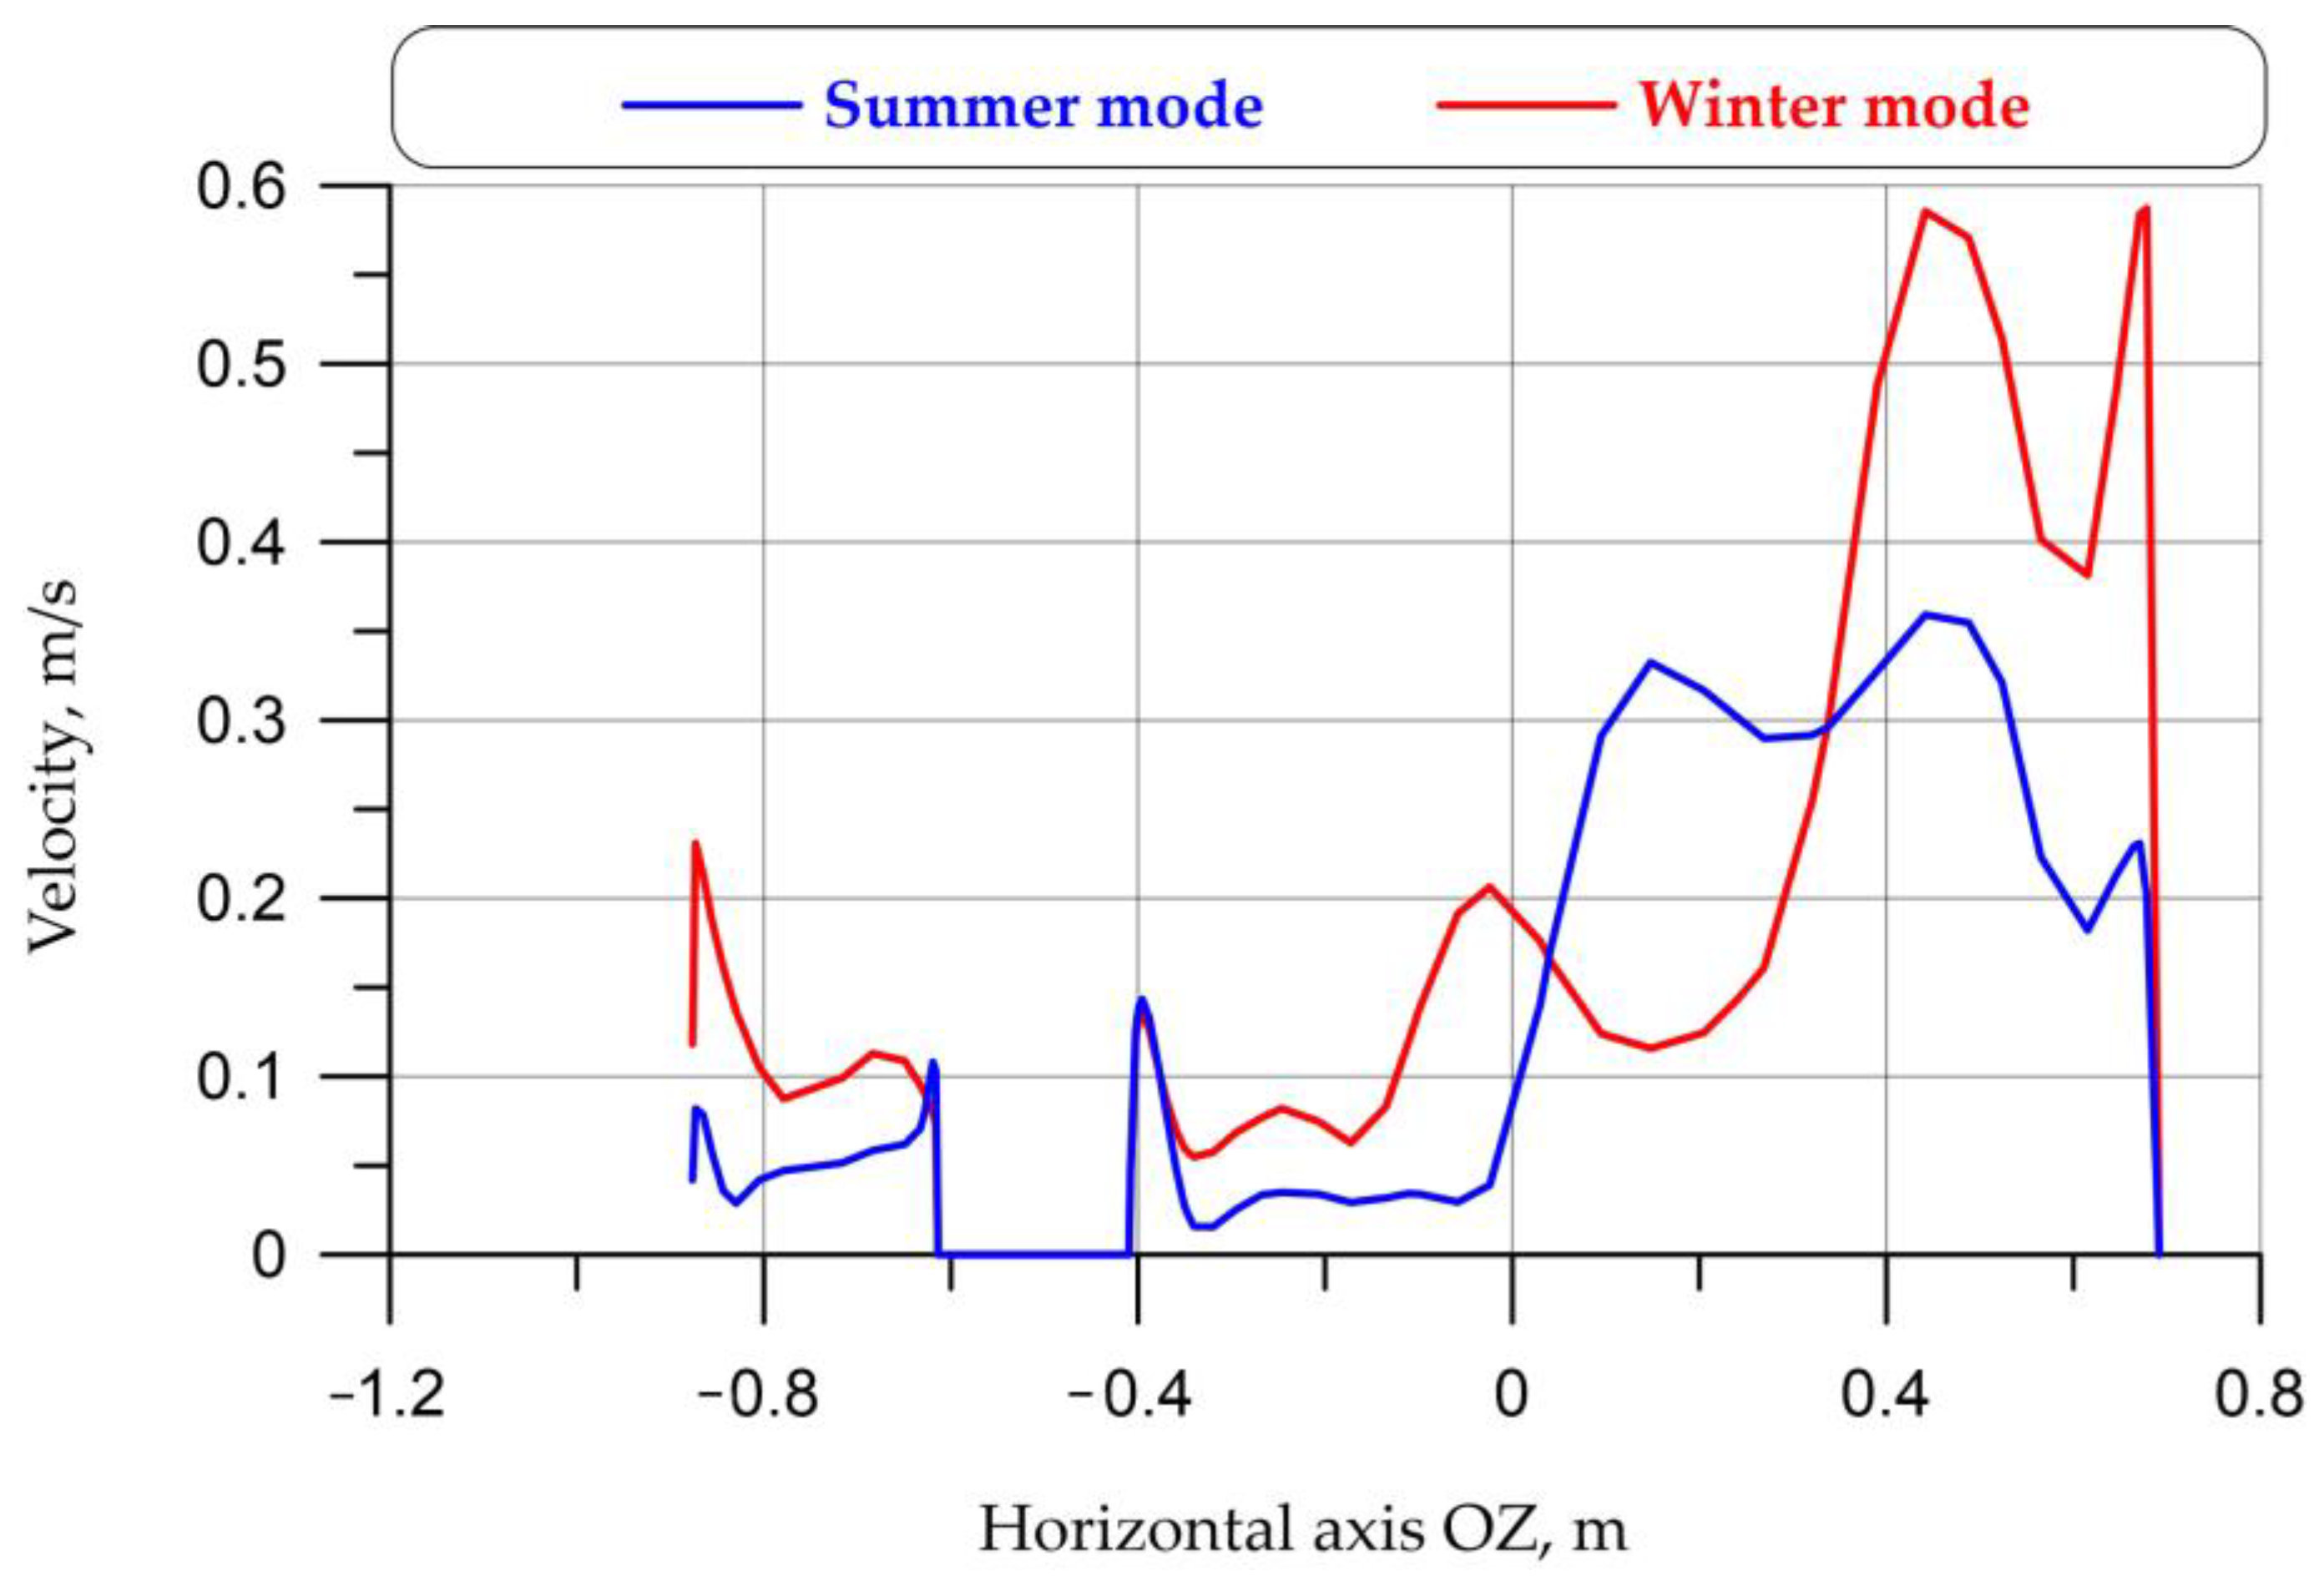
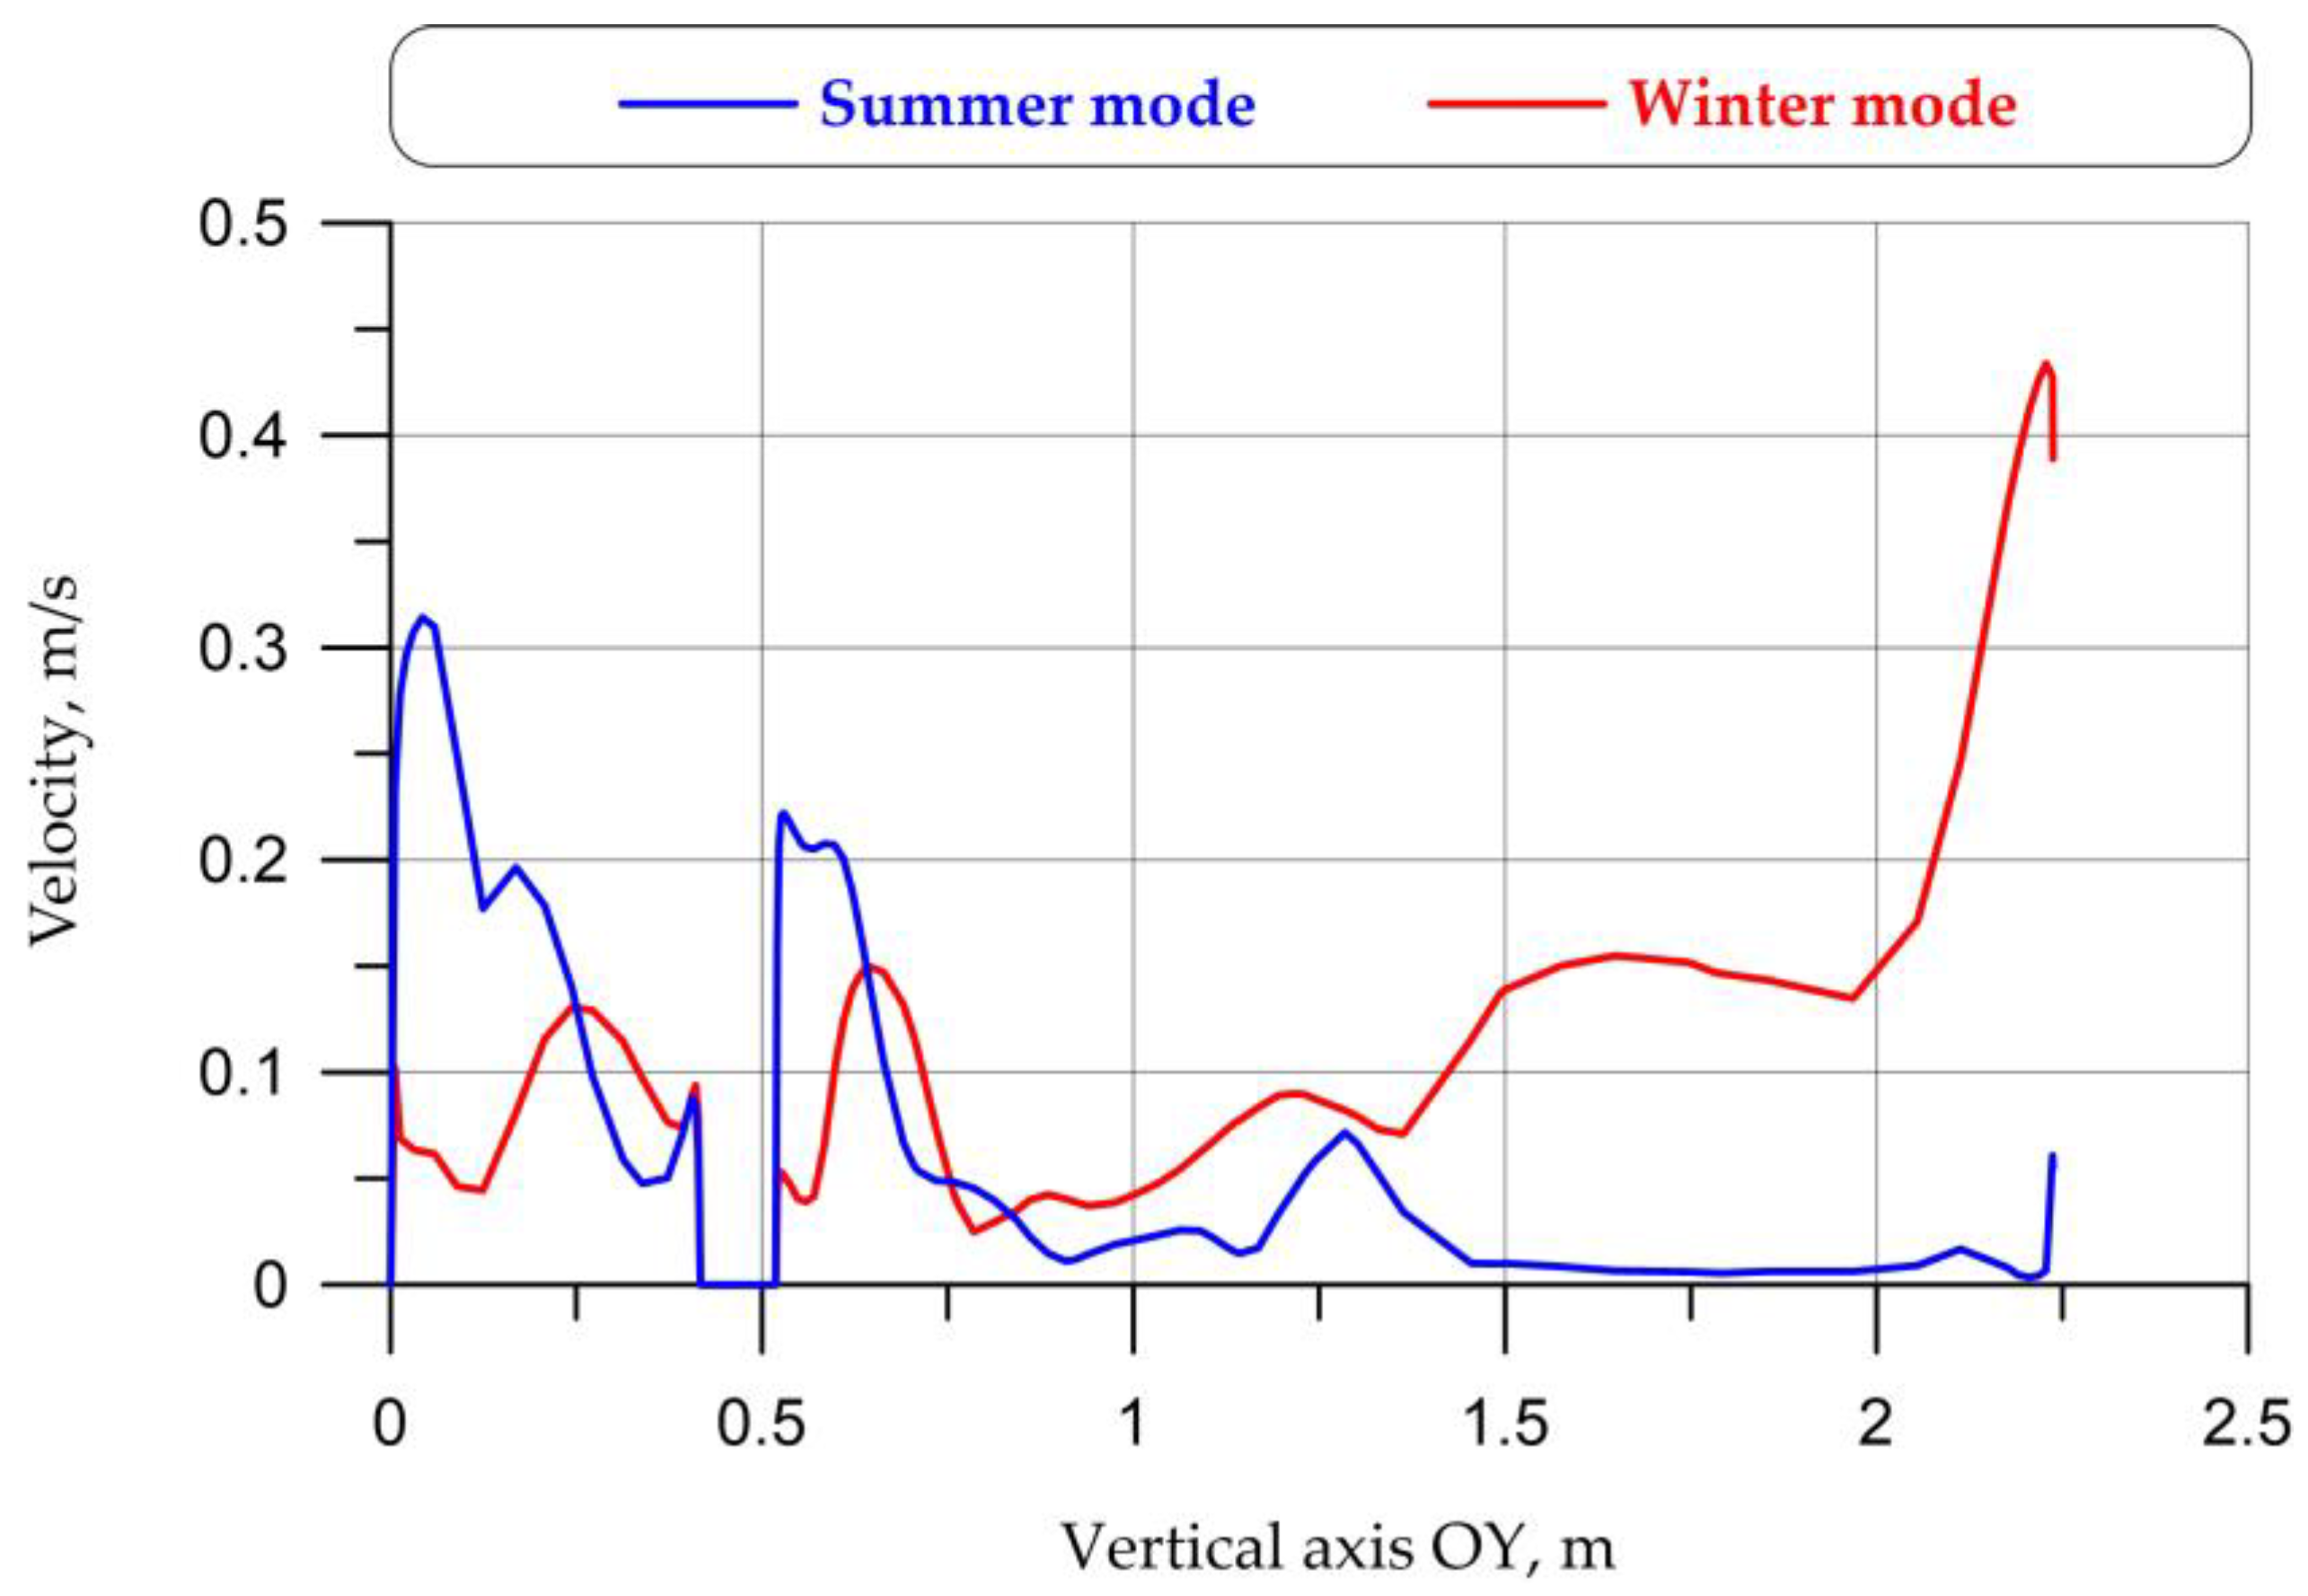
For a more detailed study of the unevenness of the fields,
Figure 22,
Figure 23,
Figure 24 and
Figure 25, graphs of the distribution of temperatures and velocities on the vertical (OY) and horizontal (OZ) axes were constructed. Dashed lines mark the intersections with the driver and the seat. The results of magnitude distributions along the OX axis are not presented in this paper due to space limitations.
Calculations were performed for three extra deflector locations and blowing speeds to evaluate their influence, while maintaining a total flow rate of 380 for the summer mode:
- (a)
The deflector located under the windshield has been reduced in area by half. The total incoming flow speed increased to 0.7 m/s;
- (b)
The deflector located under the windshield was moved to the cab roof without changing the area. The flow velocity took on the initial value of 0.4 m/s;
- (c)
The deflector located under the windshield has been reduced in area by half. A deflector of the same size was located on the roof. The flow velocity took on the initial value of 0.4 m/s.
To numerically assess the impact of the location of the air intake deflectors,
Table 11 shows the difference in values on the vertical axis, as seen in
Figure 4b, at a distance of 0.15 m and 1.5 m from the floor. The problem was solved in a stationary formulation. The smallest values are highlighted in green, i.e., values for which the location of the deflectors gives the most uniform picture of the distribution of values along the height on a given axis.
Thus, the most uniform picture of the location of the temperature field is provided by the option with the location of deflectors on the roof, and for the fields of speeds, relative humidity, and carbon dioxide concentration, this is provided by the simultaneous location of deflectors on the roof and under the windshield.
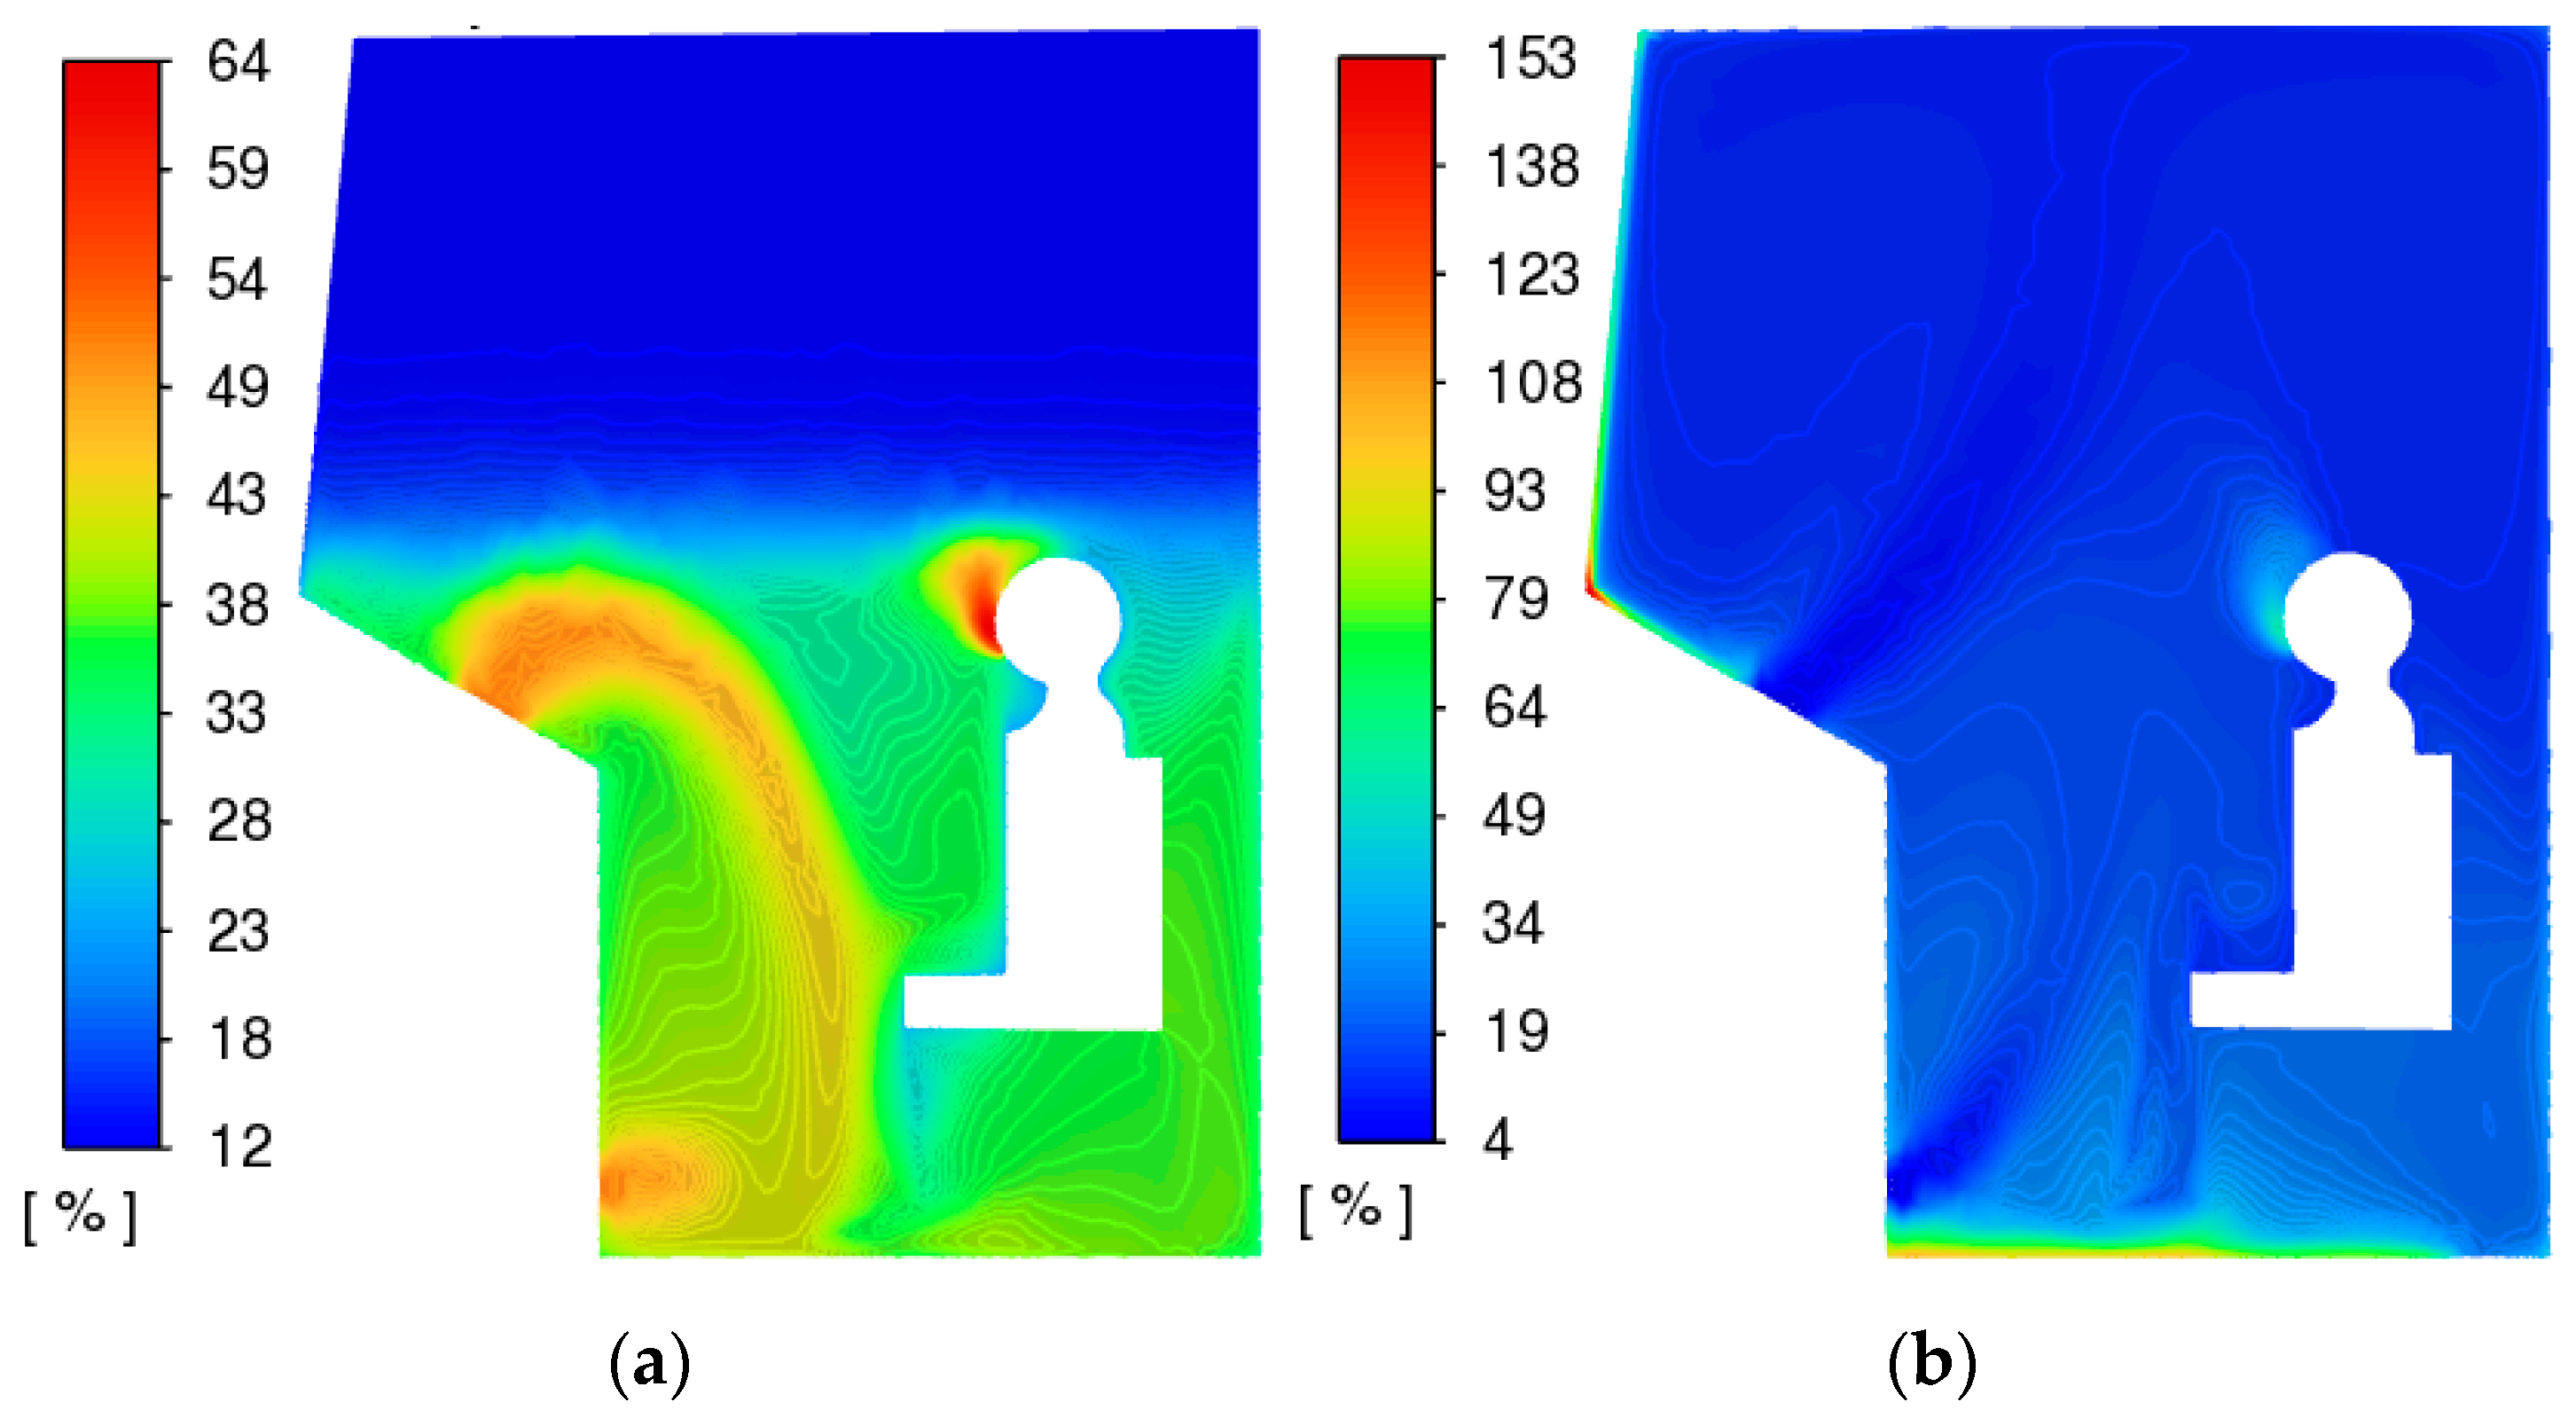
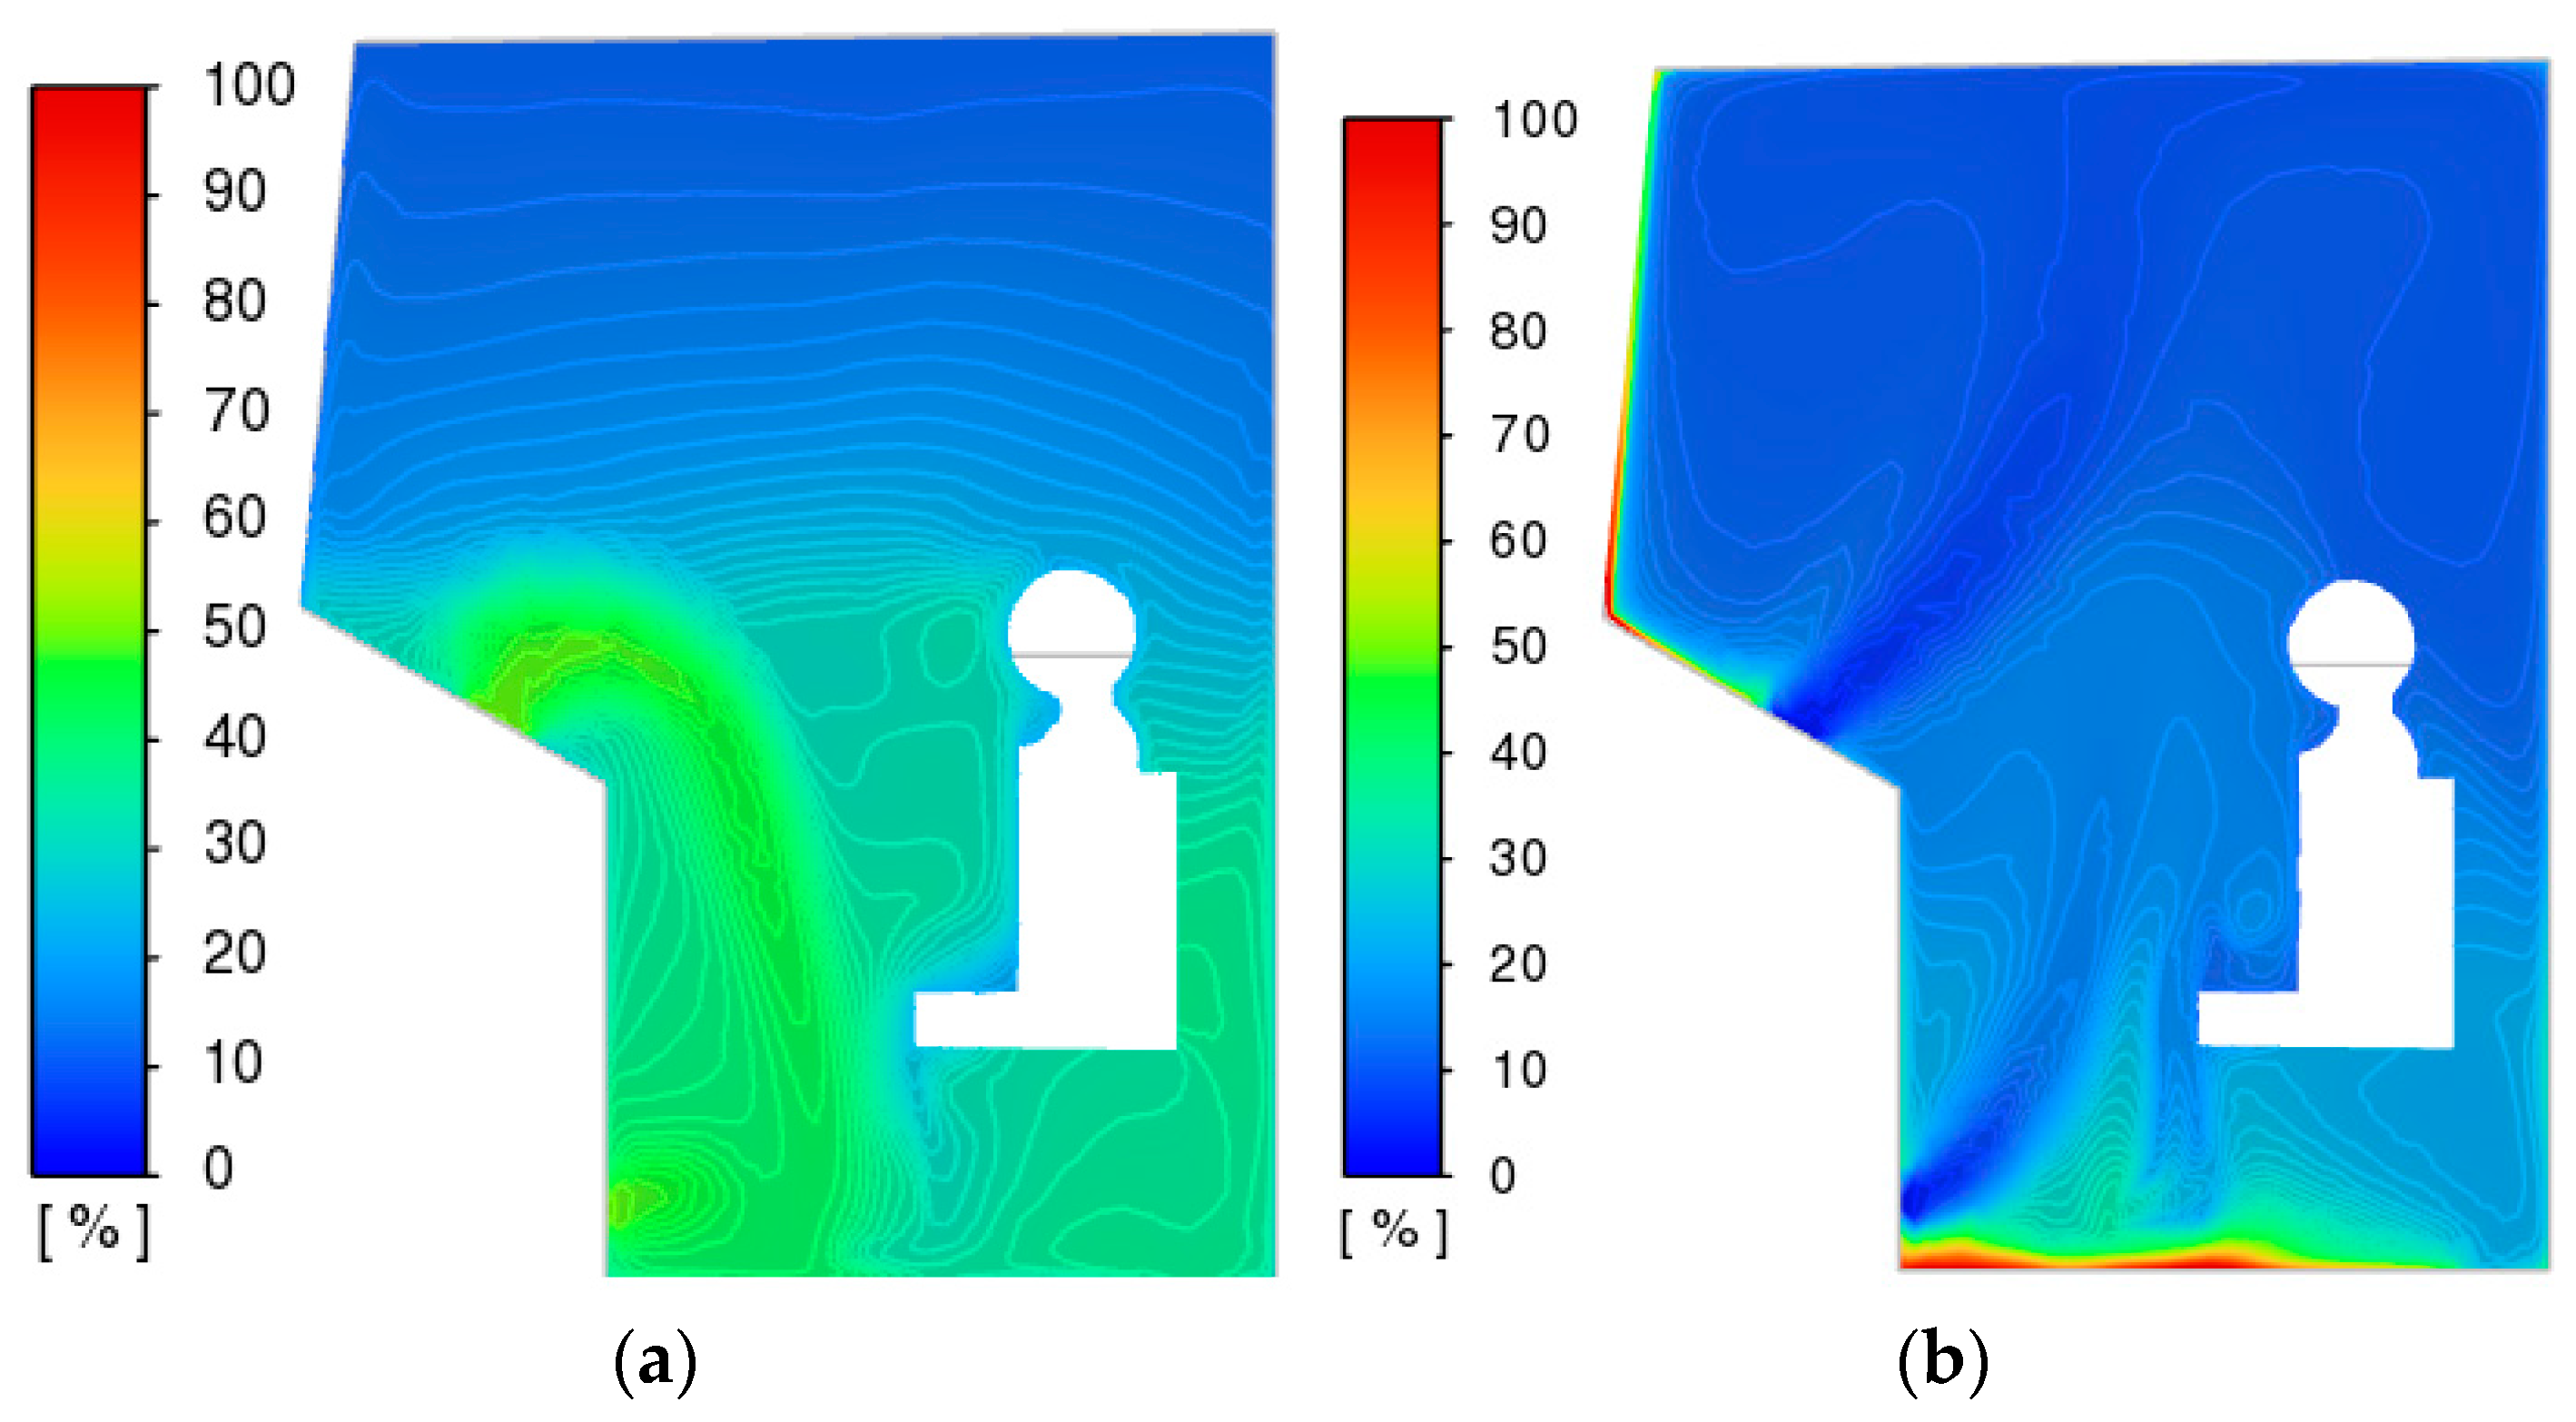
Humidity. Maximum relative humidity values are reached in winter due to significantly lower ambient temperatures. Relative humidity limits are located along the cabin trim and above the window area.
Above the front window, a value greater than 100% is reached, which in real conditions leads to condensation and at low temperatures can lead to freezing of surfaces. It is worth noting that this mathematical theory, and, directly, the use of the diffusion equation, can be applied quite accurately for relative humidity values from 0% to 100% and can predict the very fact of the formation of the “dew point”. If this range is exceeded, it is necessary to use models that take into account the phase transition of water vapor from gaseous to liquid and solid states.
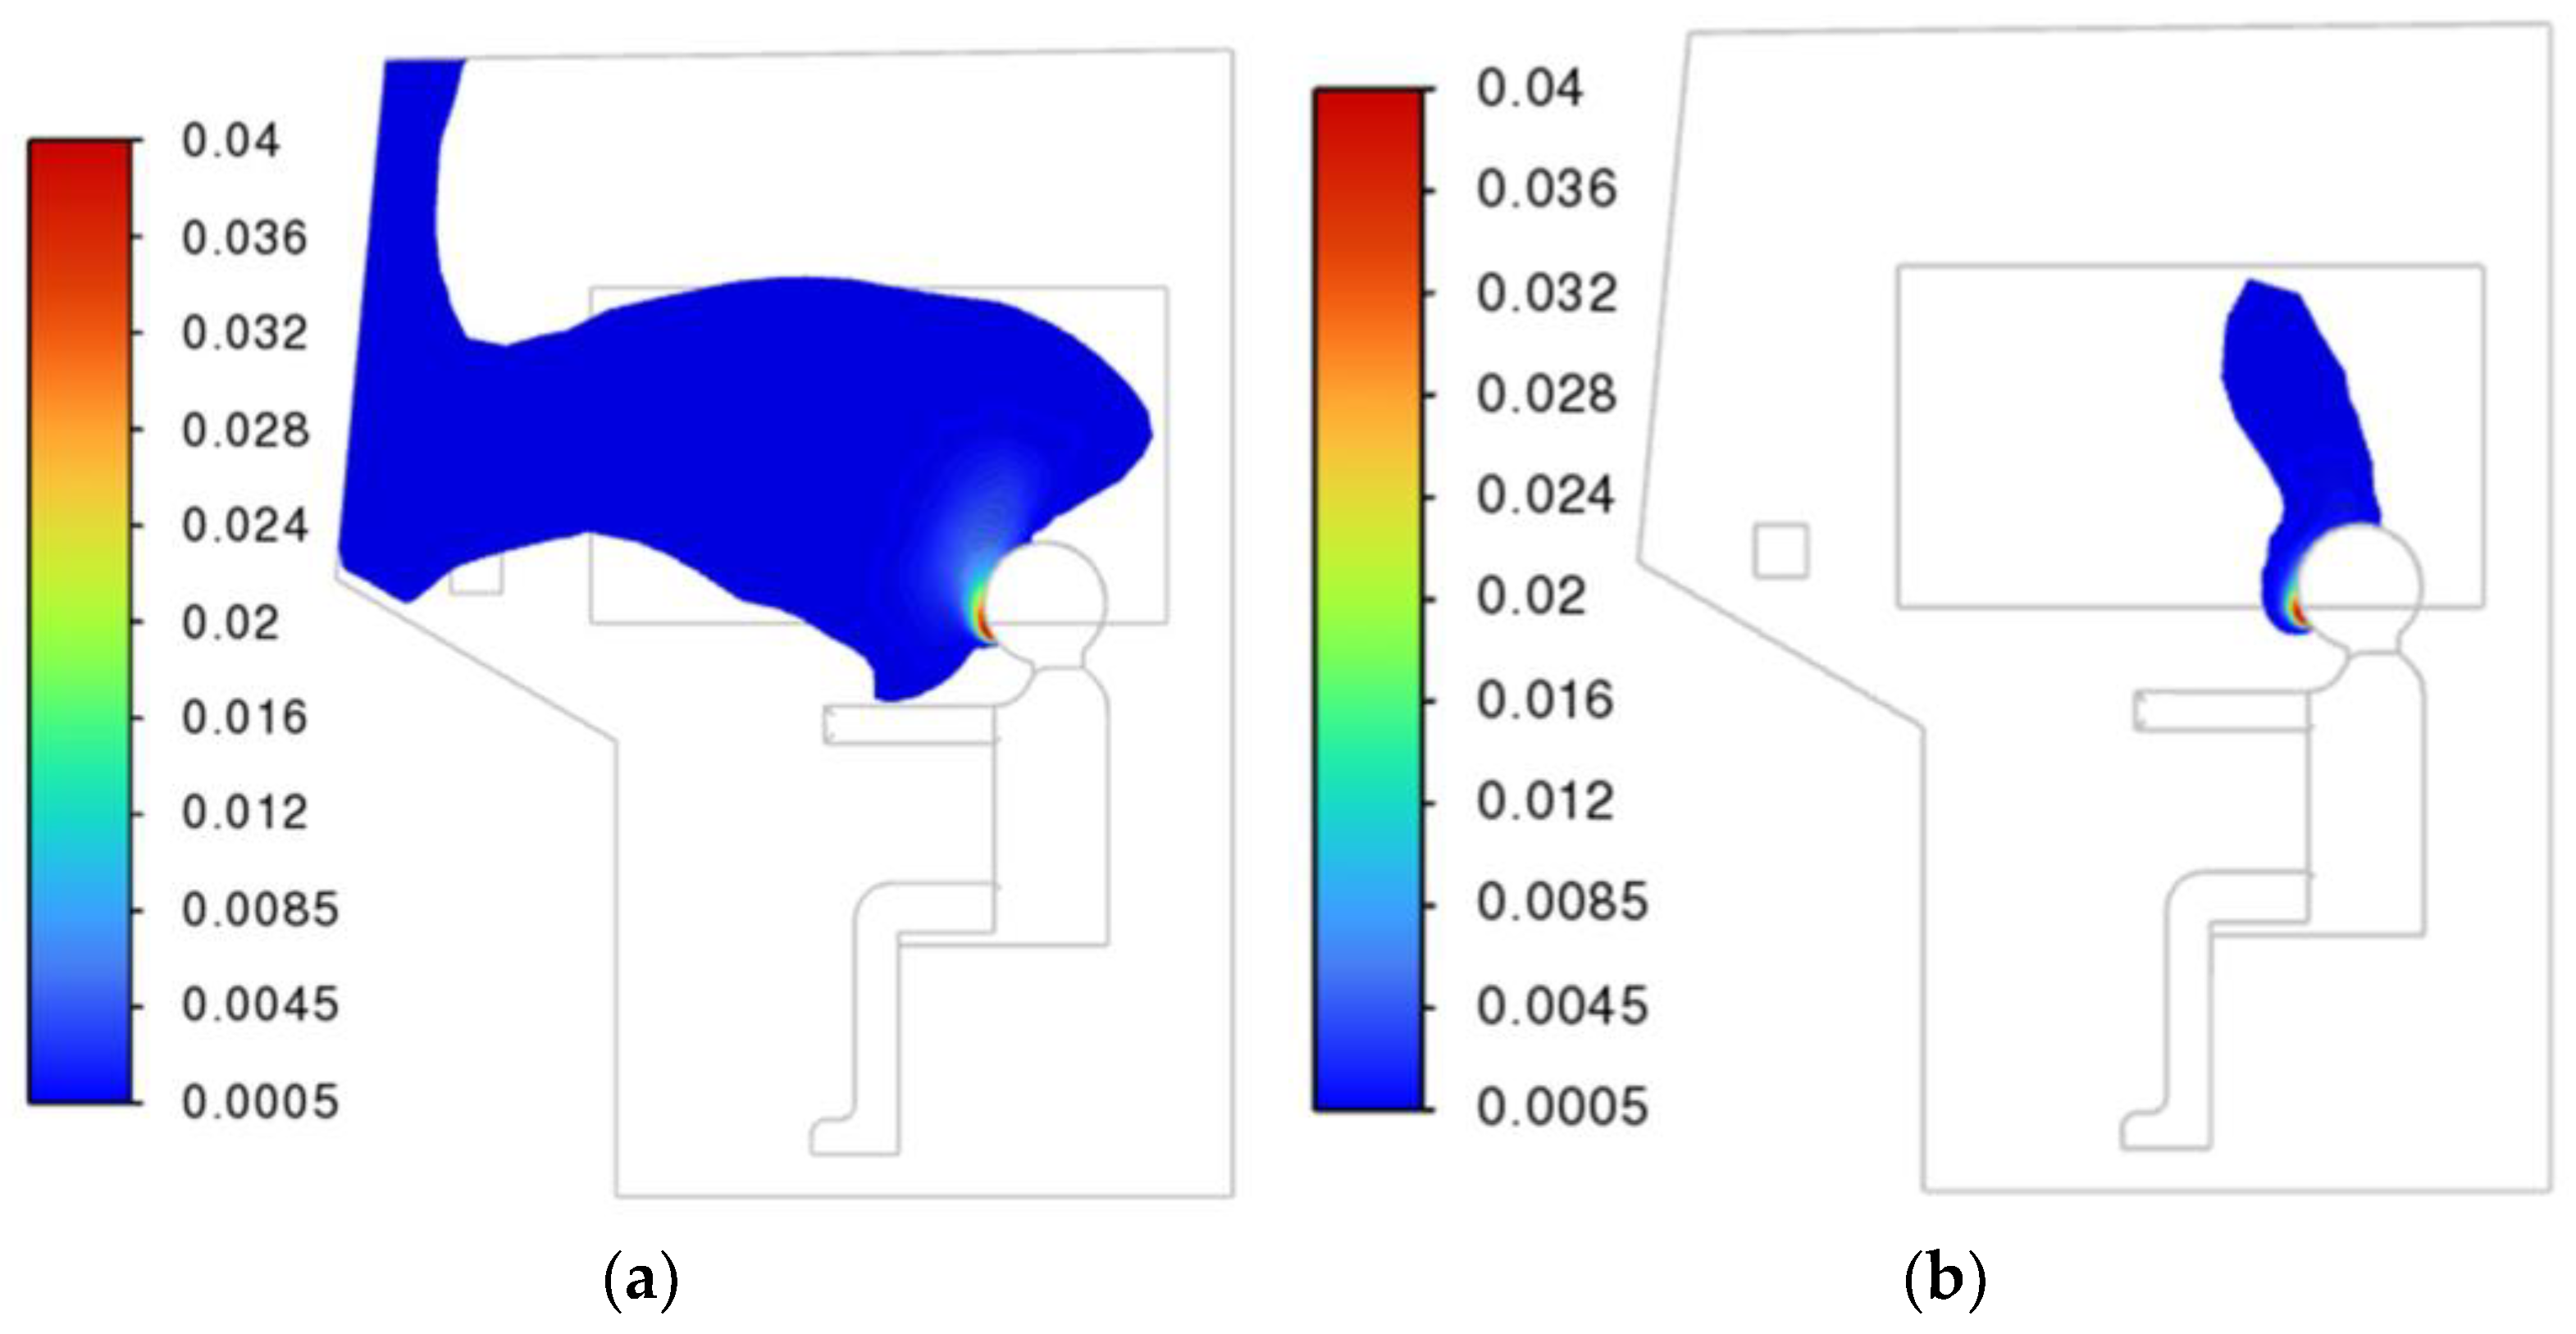
Carbon dioxide. In full circulation mode (air intake outside the cabin), the average values of carbon dioxide concentration in the cabin practically do not increase, which is caused by a much greater influx of air with a higher oxygen content than carbon dioxide entering during breathing.
For the summer regime in the time range of 30–80 s, as seen in
Figure 6, an increase in CO
2 concentration is observed. A detailed examination of the fields’ slices over time shows that up to a range of 30 s, exhaled air spreads downward from the breathing area; then, as the cabin space cools, it begins to rise; and after a range of 80 s, it spreads upward. Thus, in the range of 30–80 s, a “stagnation” zone is formed in front of the driver’s face. A similar behavior of the air environment can be seen in
Figure 14,
Figure 15,
Figure 16,
Figure 17 and
Figure 18, in which the flows from the windowsill deflectors propagate down and up for the summer and winter modes, respectively. This fact is caused not only by the temperature ratio of the flows but also by the complex field of air velocities.
In full recirculation mode in
Figure 8 and
Figure 9, we see the expected increase in carbon dioxide values over time.
Based on the calculations performed, the following assumptions and recommendations can be made for effectively reducing the concentration of carbon dioxide depending on the circulation mode:
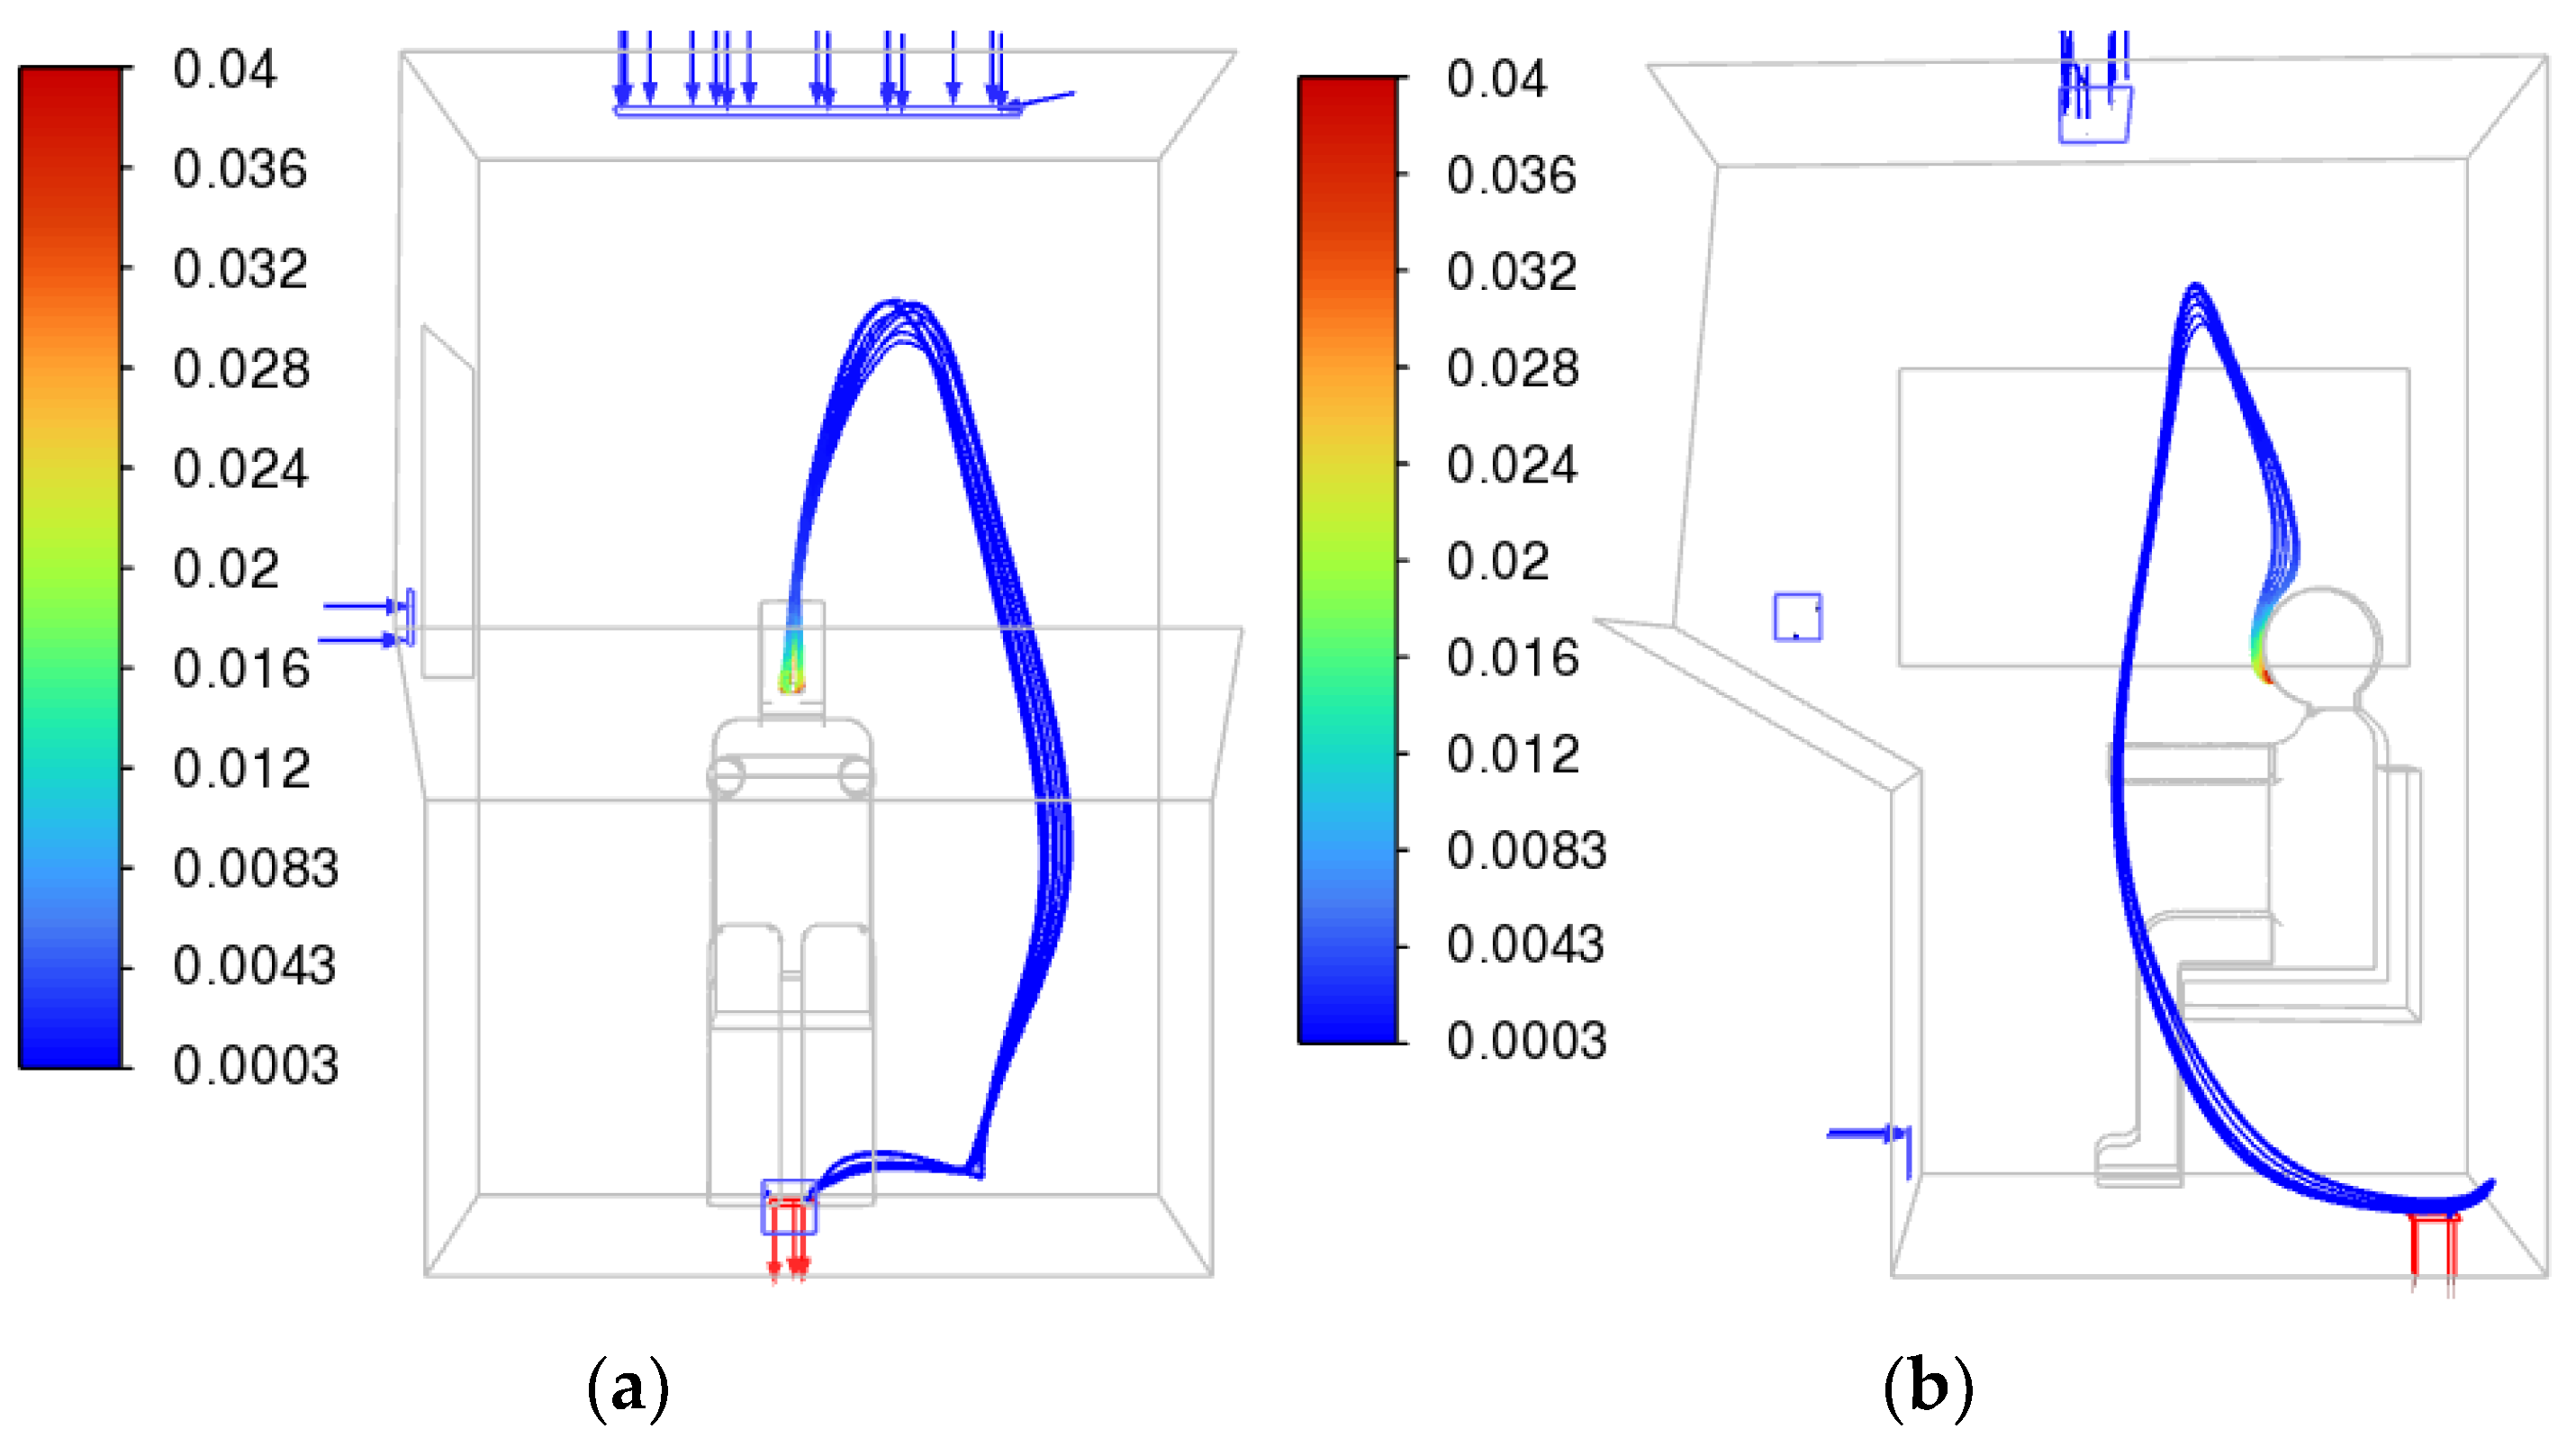
For the full circulation mode (air intake from outside), the most effective will be the flow that “blows away” the air from the driver’s breathing area towards the outlet valves. In this case, the most optimal would be, in particular, the location of the air deflectors on the roof of the cabin. Thus,
Figure 26 shows a three-dimensional graph of CO
2 streamlines for the summer mode when exhaling with a deflector on the roof. It can be seen that the exhaled air is almost immediately blown towards the outlet valve.
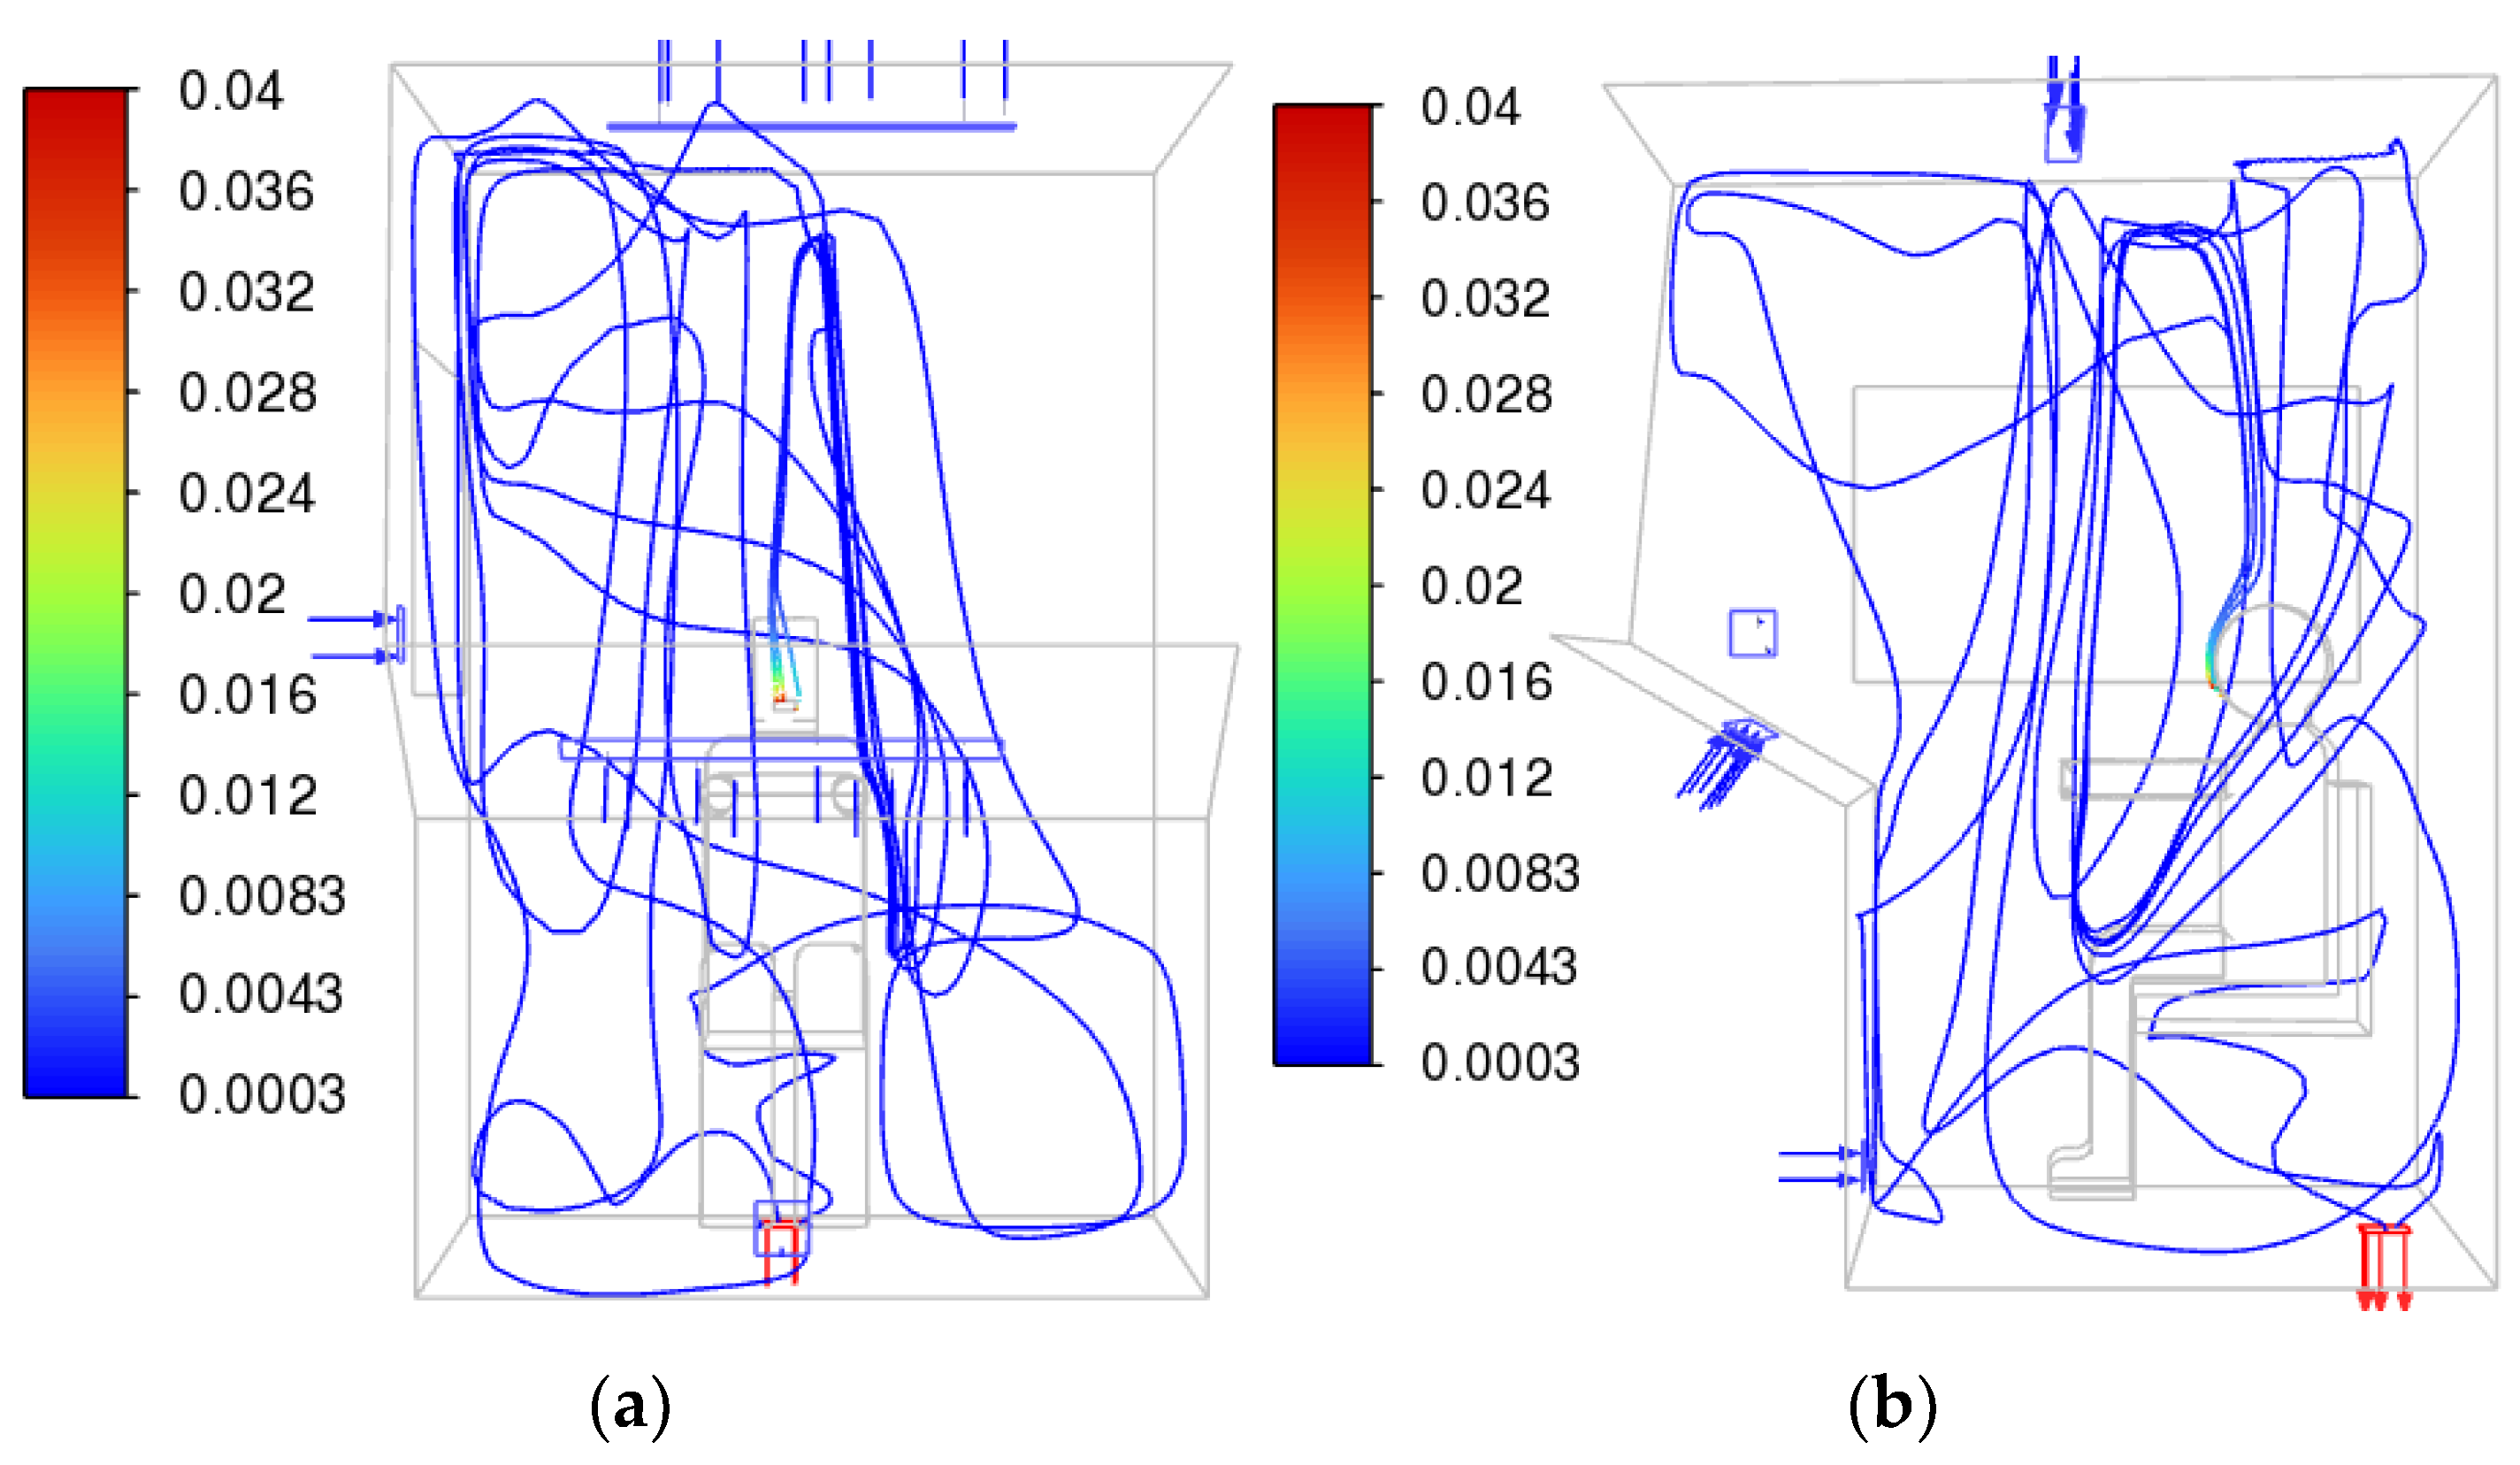
For full or partial recirculation mode, the blowing flow should remove air from the breathing area to the far edges of the cabin, mixing it as much as possible. In this case, a more complex configuration of deflectors will be most effective, for example, the simultaneous operation of deflectors located under the front window and on the roof.
Thus,
Figure 27 shows a three-dimensional graph of CO
2 streamlines for the summer mode during exhalation with deflectors on the roof and under the windshield. It can be seen that the exhaled air has a rather complex trajectory and spreads throughout the entire volume of the cabin.


