Article

A High-Resolution Defect Location Method for Medium-Voltage Cables Based on Gaussian Narrow-Band Envelope Signals and the S-Transform

1
Shenzhen Power Supply Bureau Co., Ltd. China Southern Power Grid, Shenzhen 518000, China
2
Institute of Energy Sensing and Information, Sichuan Energy Internet Research Institute, Tsinghua University, Chengdu 610000, China
3
Department of Electrical Engineerng, Tsinghua University, Beijing 100084, China
*
Author to whom correspondence should be addressed.
Energies 2024, 17(9), 2218; https://doi.org/10.3390/en17092218
Submission received: 9 April 2024 / Revised: 29 April 2024 / Accepted: 30 April 2024 / Published: 5 May 2024
(This article belongs to the Section F6: High Voltage)

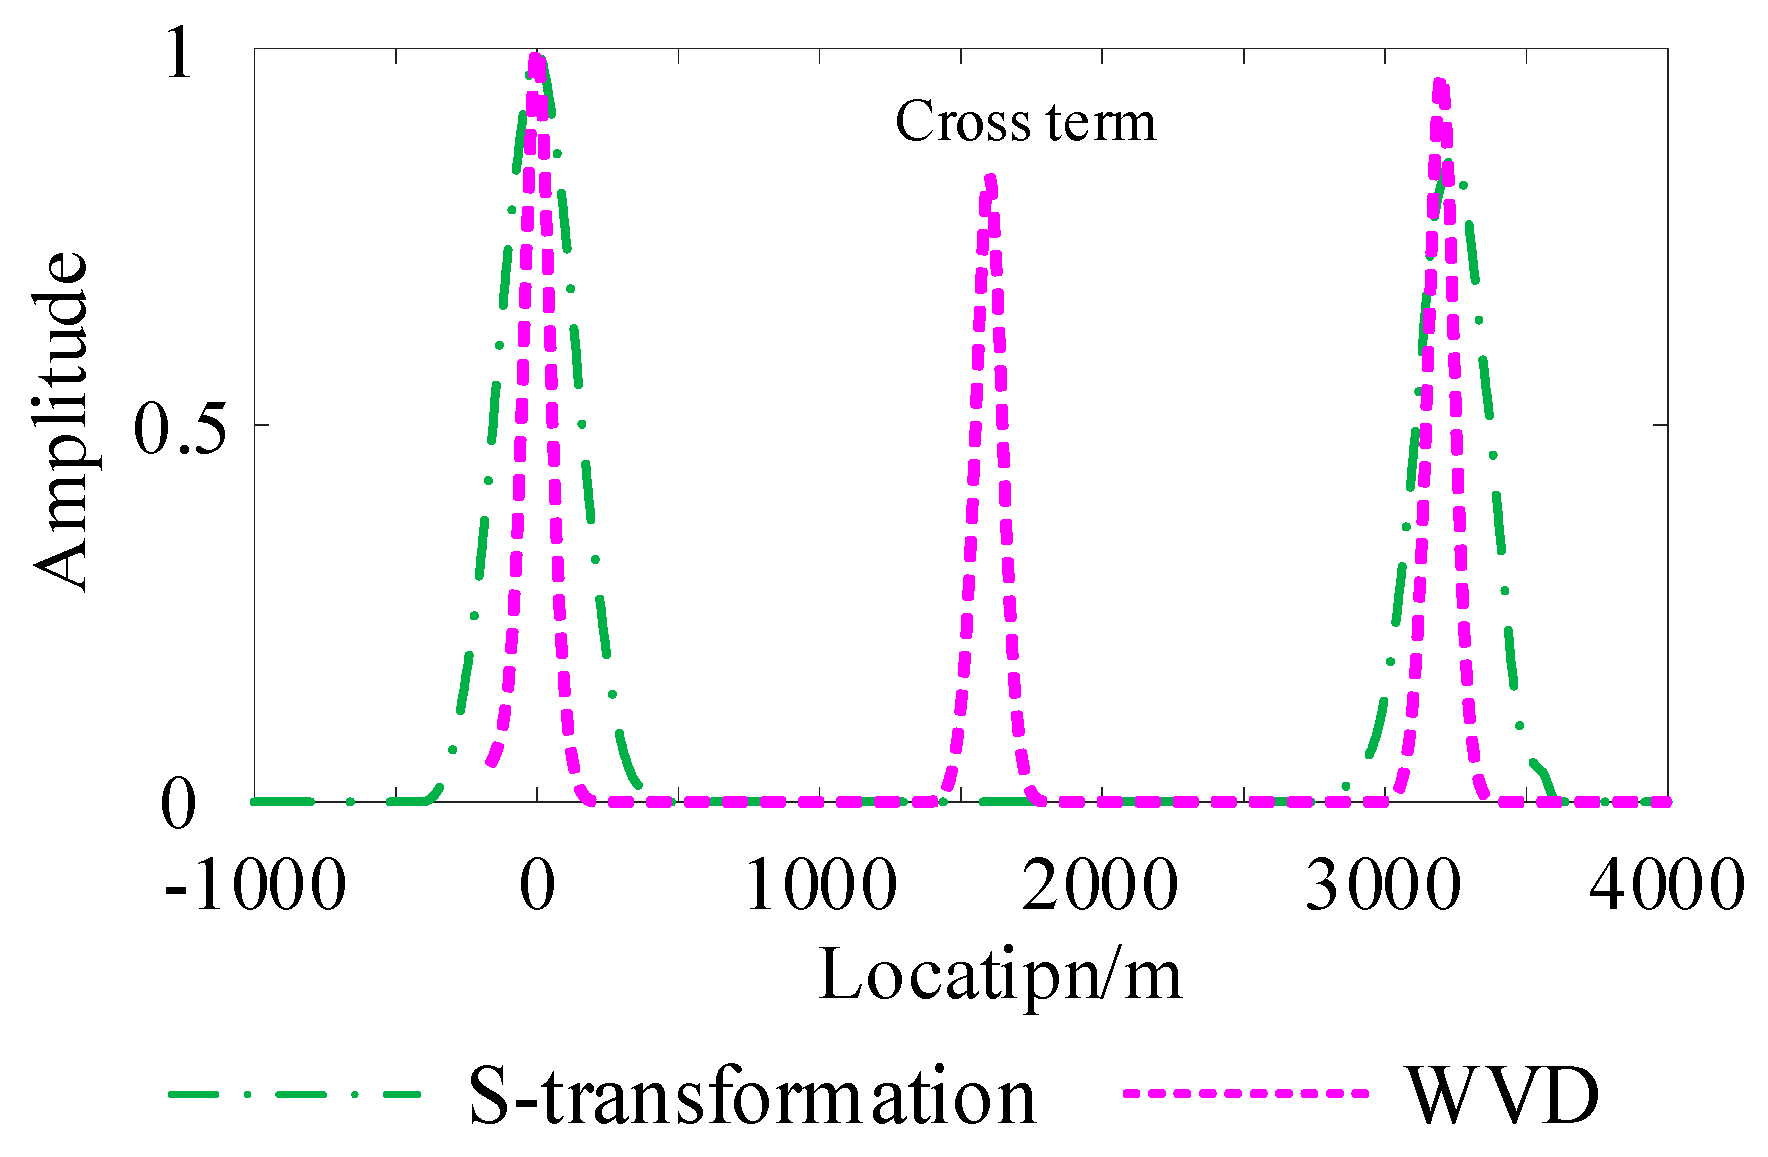
Abstract

:
The time–frequency-domain reflection method (TFDR) based on the Wigner–Ville distribution (WVD) is confronted with the problem of cross-term interference in existing methods to locate power cable defects. Therefore, a new method of locating cable defects based on Gaussian narrow-band envelope signals and the S-transform is proposed in this paper. In this method, the wide-band cable transfer function is obtained by adjusting the parameters of the Gaussian narrow-band envelope signal because the Gaussian narrow-band envelope signal has a good frequency-adjusting ability and time–frequency characteristics. Then, the time–frequency of the cable signal is transformed by the generalized S-transform, and the time delay of the modular matrix of the transformation matrix is estimated by the generalized cross-correlation algorithm to complete the accurate detection of the cable defect’s location. Compared with traditional methods, the proposed method can adaptively adjust the analysis time width according to the frequency change and provide intuitive time–frequency characteristics without cross-term interference. Finally, the effectiveness and practicability of the proposed method are verified in MATLAB 2017_a by simulating a 40 m/10 kV medium-voltage power cable and submarine cable with a length of 32 km.

1. Introduction

XLPE cables have a high operational reliability as a result of their excellent electrical and mechanical properties and they are widely used in urban underground power grids, cross-sea transmission, offshore wind power and other long-distance power transmission fields [1,2]. Due to the complex operating environment and working conditions, as the service time increases, the local position performance of the cable may deteriorate and defects may occur, which may lead to the failure of the cable system in serious cases [3,4]. Once systemic failure occurs, this will lead to huge economic losses and social effects. So, it is of great significance to quickly and accurately locate long-distance cable faults or defects and evaluate their insulation performance [5,6].
Defects in a cable will cause changes in its physical structure, which will lead to changes in the local characteristic impedance, resulting in impedance mismatch and thus in reflected waves carrying fault/defect characteristic information at the impedance mismatch point during traveling wave transmission [7,8]. Scholars in various countries have located and evaluated cable faults/defects based on the study of the reflection characteristics of traveling waves at the impedance mismatch point [9].
Among the popular defect detection technologies, time-domain reflectometry (TDR) [9,10] is a common method to detect, locate, and diagnose cable faults. Cable fault/defect identification and evaluation can be realized by detecting and analyzing the reflected signal characteristics generated by the uni-polar low-voltage pulse signal injected from the test terminal at the impedance mismatch point [10]. However, it is difficult to locate and identify the impedance mismatch points of long cables because the high-frequency component of the injected pulse signal in TDR is reduced and is easily affected by dispersion and noise signals. Given the shortcomings of TDR, some scholars have begun to study frequency-domain reflection (FDR) technology [11,12,13,14,15], which tests and analyzes the reflected signal characteristics generated by the linear sweep signal injected from the terminal to the impedance discontinuity point to locate the cable defect. Broadband impedance spectroscopy (BIS) has been proposed to locate cable defects with the help of integral transformations, and achieves good positioning and evaluation effects [16]. However, this method requires the original data of the power cable before it is put into operation, and the engineering implementation is complicated. In ref. [17], characteristic time-domain waveform recovery technology is proposed based on the frequency-domain reflection method to achieve calculation of the characteristic time-domain waveform recovery, and then the impedance change at the cable impedance mismatch point is determined to identify the fault type. Although this method can identify the impedance changes in short cables well because the test frequency is affected by the actual test equipment and cable length, effective test frequency band data account for a relatively small proportion of the total, resulting in the distortion of the recovery waveform in the feature time domain and making it difficult to judge its polarity [18]. The time–frequency-domain reflectometry (TFDR) method extracts the advantages of FDR and TDR in defect detection and has been widely used in defect detection in power cables [19,20,21]. However, traditional TFDR uses the Wigner–Ville distribution (WVD) to process the reflected signals of power cables, which results in cross-term interference in the positioning spectrum produced via TFDR [22]. Although the pseudo-Wigner–Ville distribution (PWVD) [23] and the smooth pseudo-Wigner distribution (SPWVD) [24] have been proposed in the literature to reduce the cross-term interference, the cross-term interference still exists in actual tests.
This paper presents a method of cable defect detection based on the S-transform. In this method, by adjusting the frequency band of the Gaussian narrowband envelope signal, a cable transfer function (CTF) with a wider band is collected, and the effective information of the transfer function is improved. Then, the time–frequency transformation of the output signal of the cable is carried out by the S-transform, which can adaptively adjust the window function, and the delay estimation of the modular matrix of the transformation matrix is combined with the generalized cross-correlation algorithm to further locate cable defects. Finally, the proposed method is compared with the WVD, and the validity of the proposed method is verified by simulating a defective cable model with a length of 800 m. At the same time, a 40 m/10 kV medium-voltage cable with defects is measured and analyzed, and the practicability of the proposed method is verified.
This paper is organized as follows. The principle of defect location is introduced in Section 2. In Section 3, the detailed steps for estimating CTF parameters via the S-transform are derived. The feasibility and effectiveness of the proposed method are verified in Section 4 and Section 5. Conclusions about the work are drawn in Section 6.

2. Medium-Voltage Cable Model and Principle of Locating Defects

Medium-voltage cables can be seen as a transmission line model, that is, a network along with a distributed parameter described by electrical parameters. According to transmission line theory [25], when the cable length is much larger than the signal wavelength, the power cable can be represented by a distributed parameter model, as shown in Figure 1.
In Figure 1, Δx is the unit length of the cable. The resistance R and inductance L per unit length can be approximated as
R = 1 2 π ω μ 0 2 1 r c ρ c + 1 r s ρ s L = μ 0 2 π ln r s r c + 1 4 π 2 μ 0 ω 1 r c ρ c + 1 r s ρ s
where ω =f is the angular frequency of the test signal, f is the frequency of the test signal, rc and rs are the core radius and the inner radius of the shield layer, respectively, and ρc and ρs are the resistivity of cable core and shield layer, respectively. The conductance G and capacitance C per unit length can be expressed as
G = 2 π σ ln r s / r c C = 2 π ε ln r s / r c
where μ0 is the vacuum permeability and σ and ε are the electrical conductivity and dielectric constant, respectively. According to transmission line theory, the transfer function Γ(ω) of a lossless cable of length l is expressed as
Γ ( ω ) = Z L Z 0 Z L Z 0 e - 2 r ( ω ) l
where Z0 is the characteristic impedance of the cable body, ZL is the load impedance at the terminal of the cable, and r(ω) is the propagation coefficient of the signal in the cable, as shown in (4).
Z 0 ( ω ) = R + j ω L G + j ω C r ( ω ) = ( R + j ω L ) ( G + j ω C )
r(ω) can also be expressed as
r ( ω ) = α ( ω ) + j β ( ω )
where α(ω) is the attenuation coefficient and β(ω) is the phase coefficient, which can be further expressed as
β ( ω ) = ω v = 2 π f v
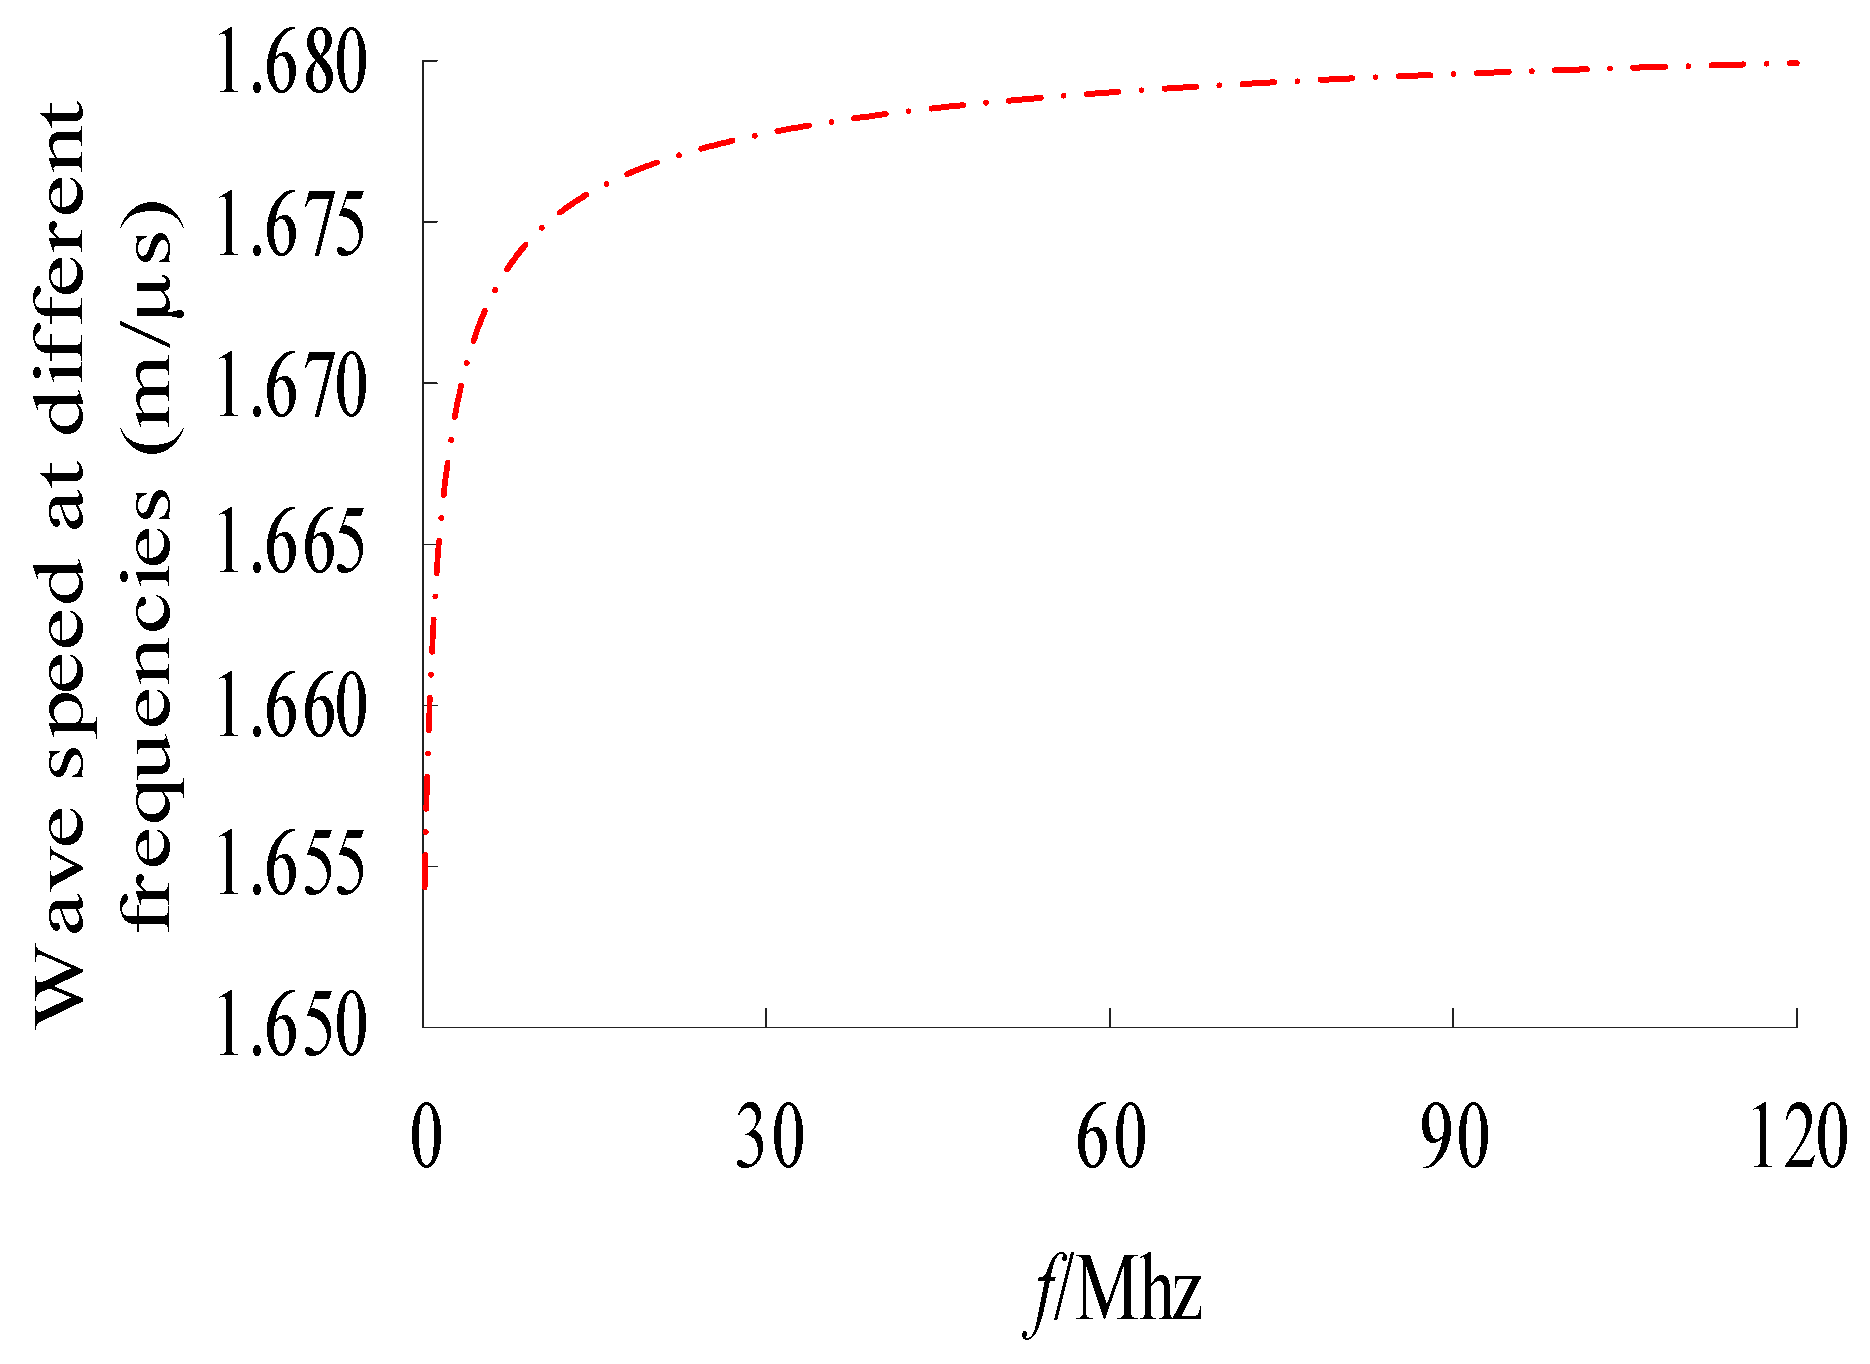
where v is the propagation speed of electromagnetic waves in the cable. When the frequency of the test signal changes, the capacitance and inductance parameter values of the unit length of the cable will change to different degrees, resulting in slightly different wave velocities at different frequencies, that is, the dispersion phenomenon, in the cable. Figure 2 shows the wave velocities of the test signals at different frequencies in a copper axis cable.
As can be seen from Figure 2, although v increases as the frequency of the test signal increases, it eventually becomes saturated and the wave speed v stabilizes at 168 m/μs. When the end of the cable is open (ZL = ∞), (3) can be rewritten as
Γ ( ω ) = e - 2 r ( ω ) l
then, Euler’s formula is used to expand (7) to obtain
Γ ( ω ) = e - 2 α ( ω ) l cos ( 2 β ( ω ) l ) + j sin ( 2 β ( ω ) l )
In this paper, the real part of the reflection coefficient Γ(ω) is taken for analysis:
Re Γ ( ω ) = e - 2 α ( ω ) l cos ( 2 β ( ω ) l ) = e - 2 α ( ω ) l cos ( 2 π 2 l v f )
As can be seen from (9), if the frequency f is taken as the independent variable, an equivalent frequency of 2l/v will appear in the real part Re Γ ( ω ) of the reflection coefficient of a cable with length l. Therefore, a defect in the cable at l can be located by finding the equivalent frequency corresponding to the maximum distortion peak of the spectrum of the real part of the reflection coefficient. Similarly, when there is a defect in the cable at x, a new resonant signal with frequency fx = 2l/v is generated, and the defect is located through the following formula:
x = 1 2 f x v
As can be seen from (10), from a physical sense, fx can be regarded as a time parameter, and is a key parameter for locating cable defects.

3. Equivalent Frequency Estimation Based on Gaussian Narrow-Band Envelope Signals and the S-Transform

3.1. Gaussian Narrow-Band Envelope Signals

It is pointed out in [26] that the energy of the test signal in the propagation process is an exponential function of the frequency of the test signal (the higher the frequency, the more significant the energy attenuation). Thus, the selection of test signals is very important. Gaussian envelope signals not only retain the pulse property of Gaussian signals in traditional TDR, but also extend their frequency band range, so that they have the advantage of a tunable frequency band compared with those in FDR. Thus, the linear frequency-adjustable Gaussian envelope signal is selected as the test signal in this paper, and its expression is shown as follows:
g ( t ) = g a e - ( t - g b ) 2 2 g c 2 cos [ ( 2 π f m + g d ( t - g b ) ) ( t - g b ) ]
where ga is the amplitude factor, gb is the time factor to ensure that g(t) has the highest main lobe at the center of time, gc is the pulse width factor that determines the resolution in the time domain, gd is a frequency modulation factor, which can adjust any signal frequency band according to the requirements of the test system to prevent the loss of low-frequency information, and fm is the central frequency.
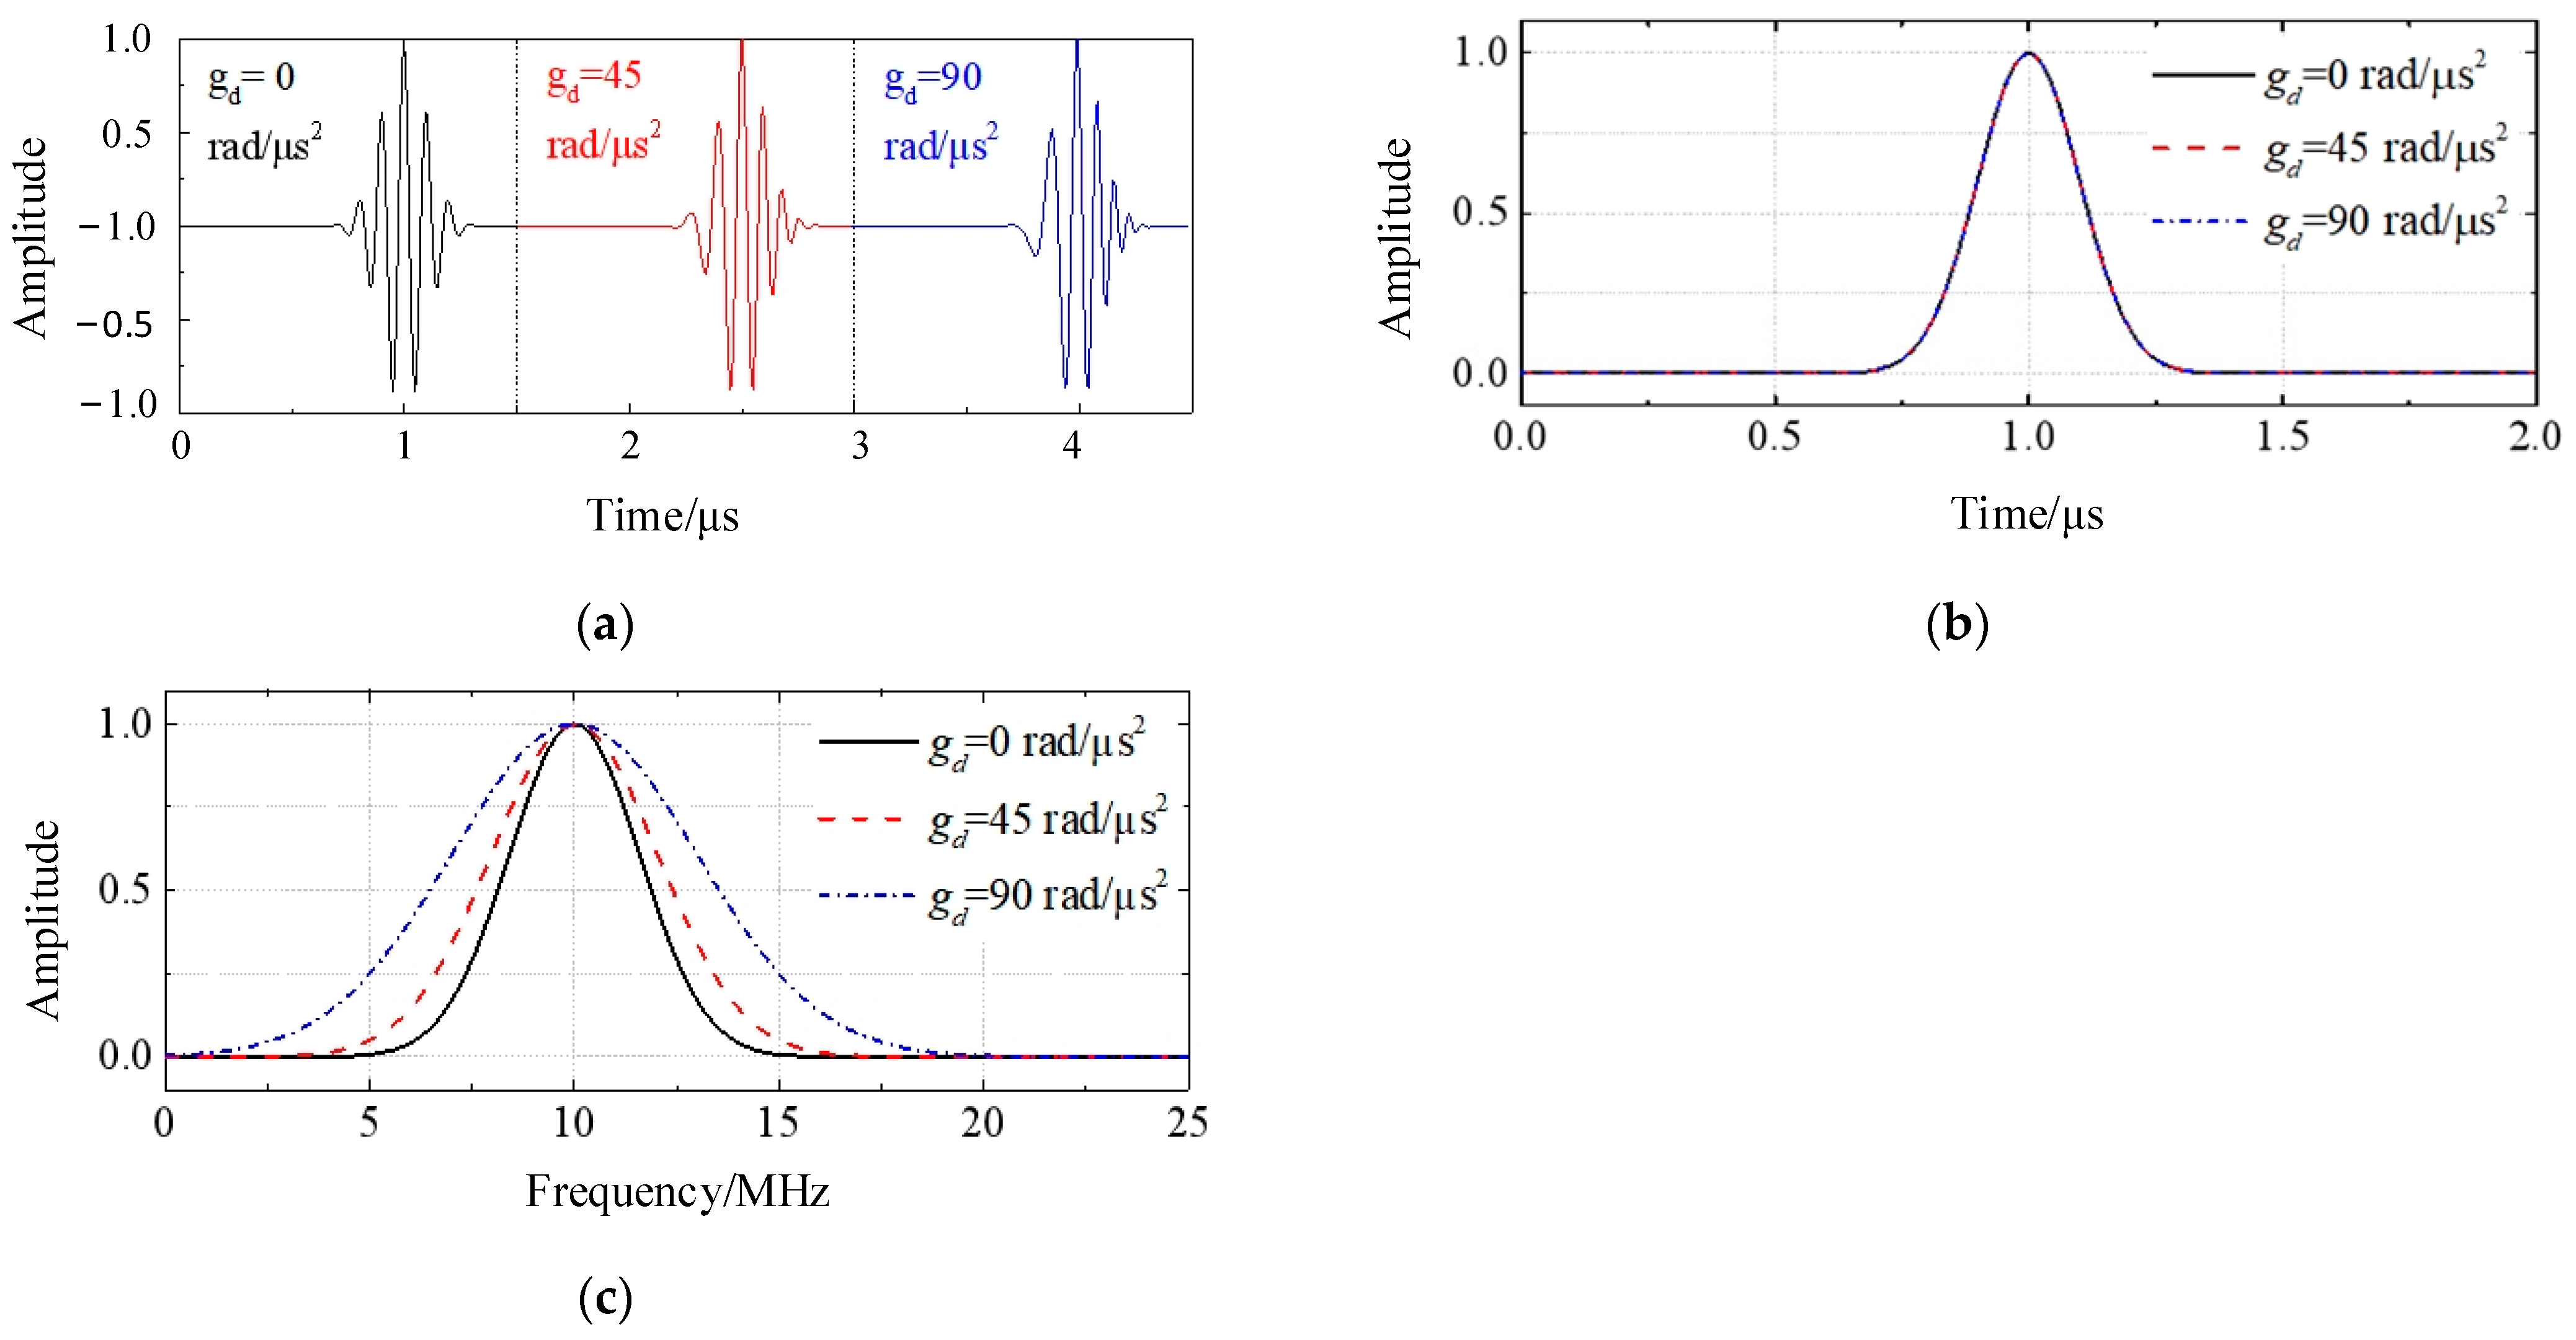
To improve the ability to judge the change of cable defects, g(t) parameters are set. The amplitude factor ga is set to 1 and normalized. Since the parameter setting of gb does not affect the location result of the defect, set gb = 0. However, the value of frequency modulation factor gd directly affects the frequency bandwidth of g(t), thus affecting the operation result of the whole test. Thus, when fm = 10 MHz and gc = 0.1 μs, the influence of gd on the time-frequency characteristics of g(t) was analyzed at gd values of 0 rad/μs2, 45 rad/μs2 and 90 rad/μs2. Figure 3a shows the time-domain waveform of g(t). The Hilbert transform [27] is used to obtain the envelope of g(t) in the time domain, as shown in Figure 3b. Then, the amplitude-frequency characteristic curve of g(t) was obtained via the Fourier transform, as shown in Figure 3c.
As can be seen from Figure 3a, with the increase in gd, the greater the frequency change rate for g(t), the more obvious the frequency change phenomenon. It can be seen from Figure 3b,c that with the increase in gd, the time bandwidth of g(t) remains unchanged, while the frequency bandwidth increases. At larger gd values, more time bandwidth (reflected wave distance resolution) is obtained and more data in the frequency domain are required; that is, a wider test frequency band or a higher test upper limit frequency is required in the frequency domain. The wider the frequency band of the test equipment, the larger its dynamic range and the higher the equipment cost. At the same time, the higher the upper limit frequency, the greater the attenuation of the high-frequency component of the signal. In addition, a large amount of noise is introduced during system testing to reduce the test effect. To sum up, gd is set to 0 rad/μs2, at which point Equation (11) is rewritten as
g ( t ) = g a e - ( t - g b ) 2 2 g c 2 cos ( 2 π f m ) ( t - g b )
The amplitude–frequency curve abs(g(f)) of Equation (12) can be expressed as
a b s ( g ( f ) ) = g a 2 g c 2 π e - ( f - f m ) 2 2 ( 1 2 π g c ) 2
After discretization of Equation (13), the amplitude–frequency curve of gn(t) is obtained, as shown in Equation (14).
a b s ( g n ( f ) ) = f n g a 2 g c 2 π e - ( f - f m ) 2 2 ( 1 2 π g c ) 2
It can be seen from Equation (14) that the frequency component of gn(t) is a Gaussian pulse function, gc determines the frequency bandwidth of the signal, and the distribution characteristics of the signal are independent of ga. Since abs(gn(f)) is a symmetric Gaussian function, to ensure that gn(t) is reasonably distributed within the reflection test band in the frequency domain, the center frequency fm is set as the center of the test band, as shown in Equation (15).
f m = ( f max - f min ) / 2 + f min
To improve the distance resolution of the reflected wave in a small time bandwidth, the threshold of the scale coefficient is defined as kth. Based on extensive field testing experience, set kth = 0.5%. Then, the value of the parameter gc is obtained, as shown in Equation (16).
g c = 2 ln k t h 2 π ( f max - f min )

3.2. Defect Detection Based on the S-Transform

The S-transformation is a time-frequency analysis method proposed by geophysicist Stockwell in 1996, which combines the advantages of the short-time Fourier transform and the wavelet transform; that is, it changes the fixed window function of the short-time Fourier transform into a Gaussian window function whose parameters can be adjusted adaptively [28]. The S-transformation of any signal h t L 2 R is defined as
S τ , f = h t G t τ e j 2 π f t d t
where τ is the time that controls the position of the window function on the time axis, h(t) is the analysis signal, f is the frequency, s(τ, f) is the time-spectrum matrix obtained by the transformation, and G t τ , f is the Gauss window function. The window width and window height of the Gauss window change with the change in frequency, and the specific expression is
G t τ , f = f 2 π e t τ 2 f 2 2
Then, the following expression is derived:
S τ , f = H υ + f e 2 π 2 υ 2 f 2 e j 2 π υ τ d υ
where f ≠ 0. The Fourier transform (FT) spectrum of discrete signal h k T is
H n N T = 1 N k = 0 N 1 h k T e j 2 π n k N
where k is the discrete time point, k = 1,2,..., N − 1, N is the length of the discrete signal, and T is the sampling interval. Let τ = kT, f = n/NT, then the discrete expression of the S-transformation is
S k T , n N T = m = 0 N 1 H m + n N T e 2 π 2 m 2 n 2 e j 2 π n k N
where n ≠ 0. Obviously, the S-transformation of the time series h(t) results in a complex time–frequency matrix, denoted as matrix S, whose rows represent the frequency and whose columns represent the time. The |S| modular array is the array obtained after modulating each quantity in the S-array, and its column vector describes the tendency of the amplitude of the signal at a certain time point to change with the change in frequency. Thus, the element’s size at each position in the |S| array represents the amplitude of the S-transform at the corresponding frequency and time.
According to the principle of generalized cross-correlation, the |S| matrix is divided into two groups of signals on the time axis according to the time displacement delay parameter D, which is denoted as
x n = S : , n + w 1 n y n = S : , n D + w 2 n
where w1(n) and w2(n) are observed noises. Compute the cross-correlation function of x(n) and y(n):
R x y τ = E x n y n + τ = E S : , n + w 1 n S : , n D + τ + w 2 n
Then, the |S| auto-correlation function of the matrix is
R s s τ = E S : , n S : , n + τ
because the auto-correlation function satisfies
R s s τ R s s 0
Thus,
R x y τ = E S : , n S : , n + τ D = R s s τ D
Take the maximum at τ = D. It has been pointed out in Section 2 that the reflected signal at the head end of the cable is composed of multiple superimposed reflected signals, so there are multiple delay parameters estimated according to Equation (26), and the delay parameter at x m is denoted as τx. τx corresponds to the carrier frequency fx in Equation (10), and the relation between them is expressed as
f x = τ x Δ t
where Δ t is the sampling interval of the test signal.
The flow chart of the proposed method is shown in Figure 4.

4. Simulation Analysis of Medium-Voltage Cables

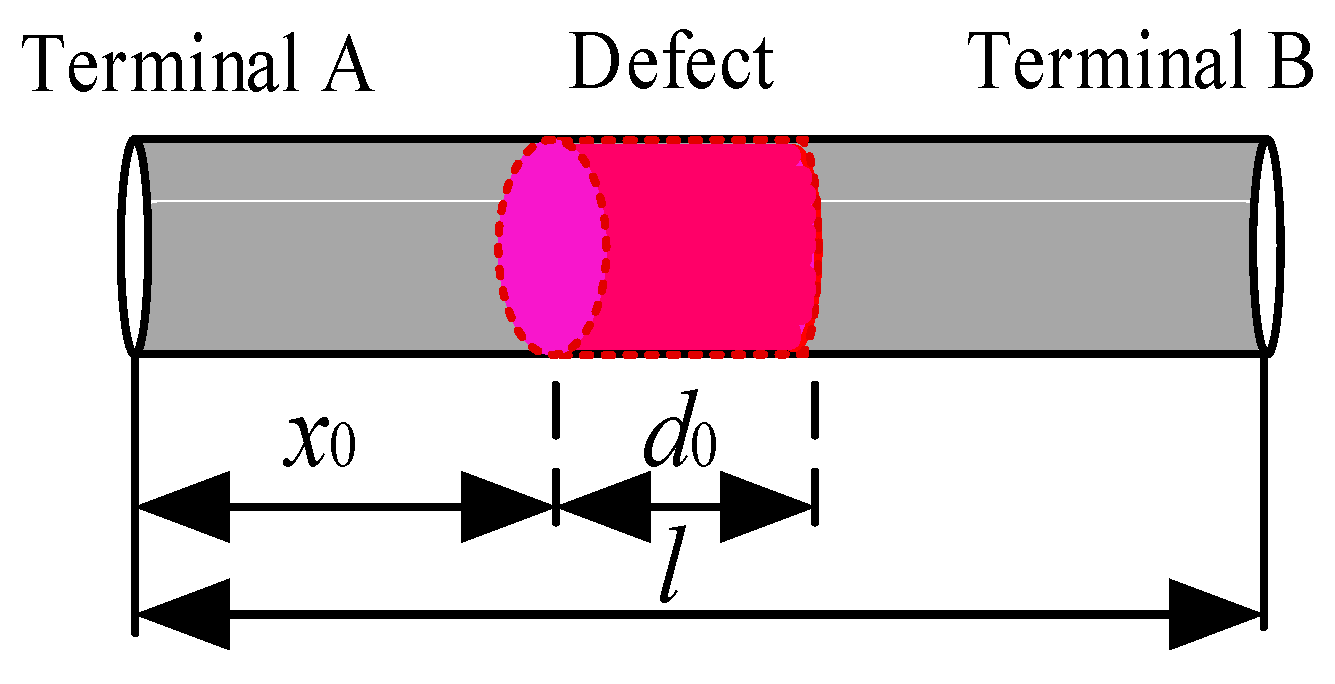
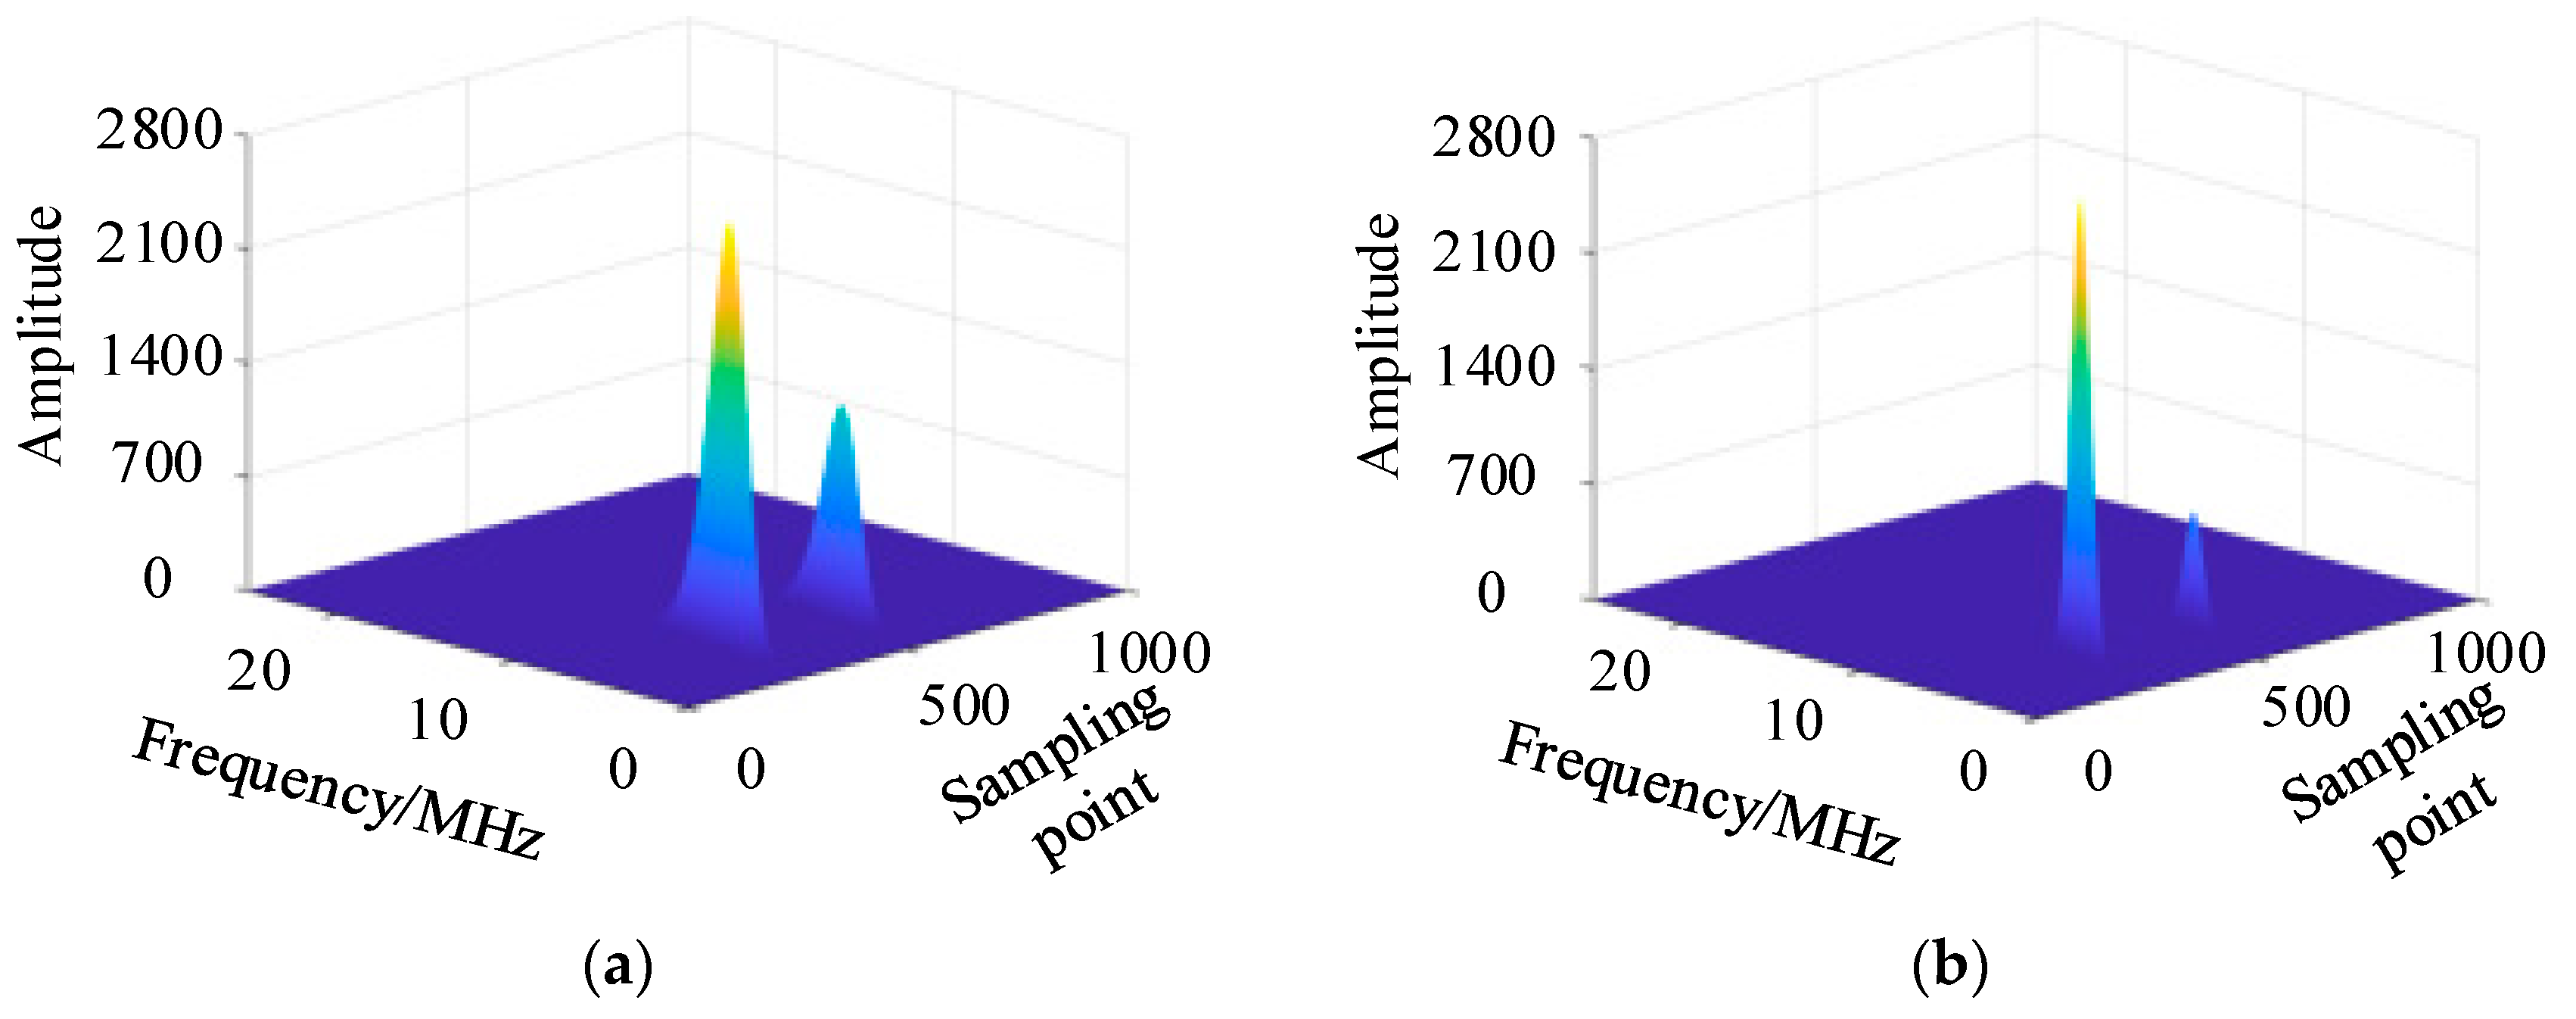
All simulations were carried out in MATLAB 2017_a. The set parameters according to the medium-voltage cable model shown in Figure 5 are as follows: cable length l = 800 m, x = 300 m, Δx = 0.5, ZL = ∞ (open end). Other cable simulation parameters are shown in Table 1. The parameters of the test signal are set to fm = 1.5 MHz, ga = 1 V, gb = 20 μs, and gc = 0.4 μs. The reflected signal r(t) is injected into the cable model at the terminal A, and the reflected signal g(t) is collected. Then, the superposition signal x(t) = g(t) + r(t) can be obtained, and the time-frequency transformation of the complex signal is carried out by the S-transform and WVD, respectively. The time–frequency analysis is shown in Figure 6.
In the spectrum in the time–frequency domain, both peaks of the S-transform have energy, as shown in Figure 6a. The energy of the WVD is mainly concentrated in the first main peak, as shown in Figure 6b. The cross-correlation curves of Figure 6a,b were obtained, respectively, and the results of cable defect positioning via the two methods were obtained, as shown in Figure 6.
In the spectrum in the time–frequency domain, both peaks of the S-transform have energy, as shown in Figure 6a. The energy of the WVD is mainly concentrated in the first main peak, as shown in Figure 6b. The cross-correlation curves of Figure 6a,b were obtained, and the results of cable defect positioning using the two methods were obtained, as shown in Figure 7.
In Figure 7a, there are three peaks in the positioning result of the S-transform, which represent the position of the head end, defect, and end of the cable, respectively. The positioning values of the defect and the end of the cable using the S-transform are 300.3 m and 799.2 m, respectively. The positioning errors were 0.12% and 0.14%, respectively. In Figure 7b, the positioning result of the WVD exhibits five peaks, among which the peak at 0 m indicates the cable head end and the peak at 300.5 m indicates the location of the defect, with a positioning error of 0.13%. The peak at 798.7 m indicates the end of the cable, with an error of 0.15%. Although the positioning accuracy of the S-transform is the same, there are two peaks at 149.5 m and 549.8 m, which are caused by the cross phase, and it is easy for the tester to misjudge the defect.

5. Actual Medium-Voltage Cable Test

5.1. Case 1

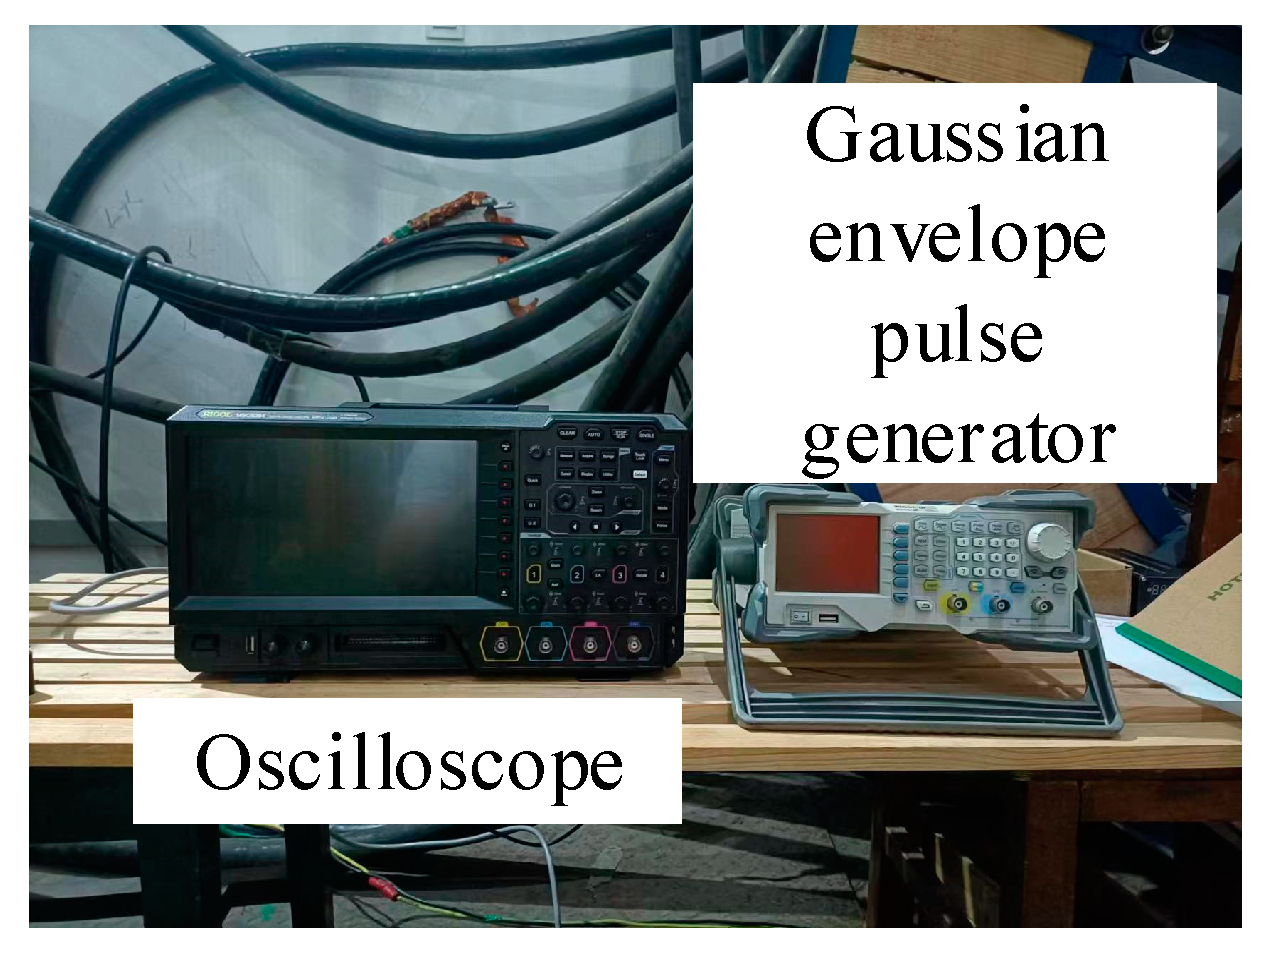
To verify the practicability of the method proposed in this paper, a 10 kV medium-voltage XLPE YJLV-22 cable with a length of 40 m was used in experiments using the method proposed in this paper and the Wigner distribution. The outer sheath and water-blocking yarn of the three-phase cable were stripped at a position of 20 m to form defects. Since the cable is short and requires a higher frequency injected signal, the center frequency of the injected signal is set to fm = 100 MHz, and the remaining parameters are set to ga = 1 V, gb = 20 μs and gc = 0.4 μs. The test platform is shown in Figure 8. The S-transform and WVD were used to carry out time–frequency transformations of the complex signal, and the time–frequency analysis is shown in Figure 9. Test parameters and test results are shown in Table A1.
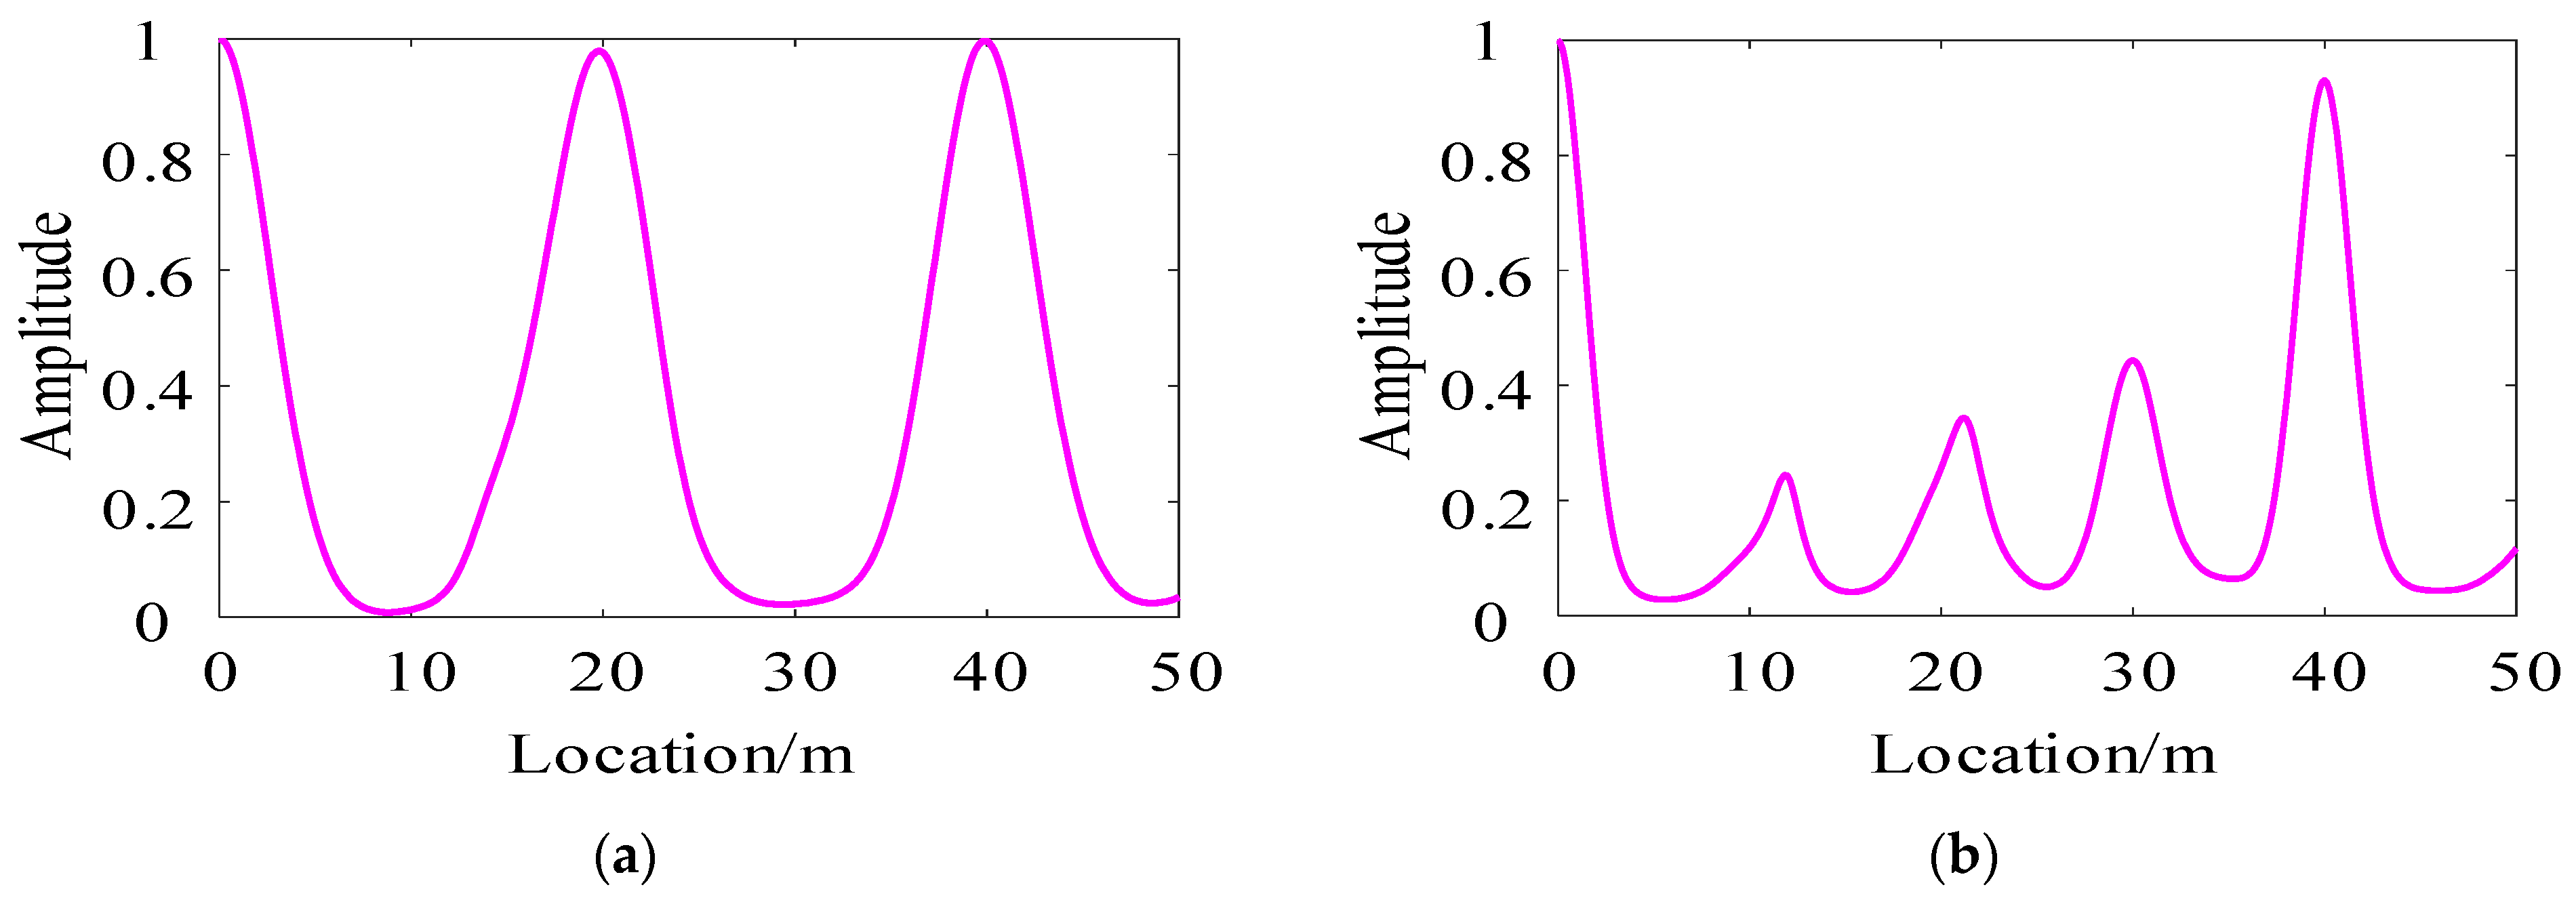
In Figure 9a, there are three obvious main peaks in the time spectrum of the S-transform, which have a good distribution and aggregation in the time domain. The WVD mainly concentrates energy in the first main peak, as shown in Figure 9b, which reduces the frequency proportion of cable defects and terminal detection signals, having a negative impact on their analysis. The positioning results of the generalized cross-correlation method are shown in Figure 10.
Figure 10 clearly shows that both methods can locate the head and end of the 40 m cable. The positioning value of the end of the cable using the S-transform is 39.98 m, and the error is 0.050%. The positioning value of the cable end using the WVD is 39.99 m, and the error is 0.030%. The Wigner distribution is more accurate for the cable with a length of 40 m, but in addition to the two peaks at the first and the end, there are four peaks at 11.48 m, 21.19 m, 30.03 m, and 40 m. If the tester does not know the defect location, it is difficult to determine which is the defect peak. In the positioning result of the S-transform, it can be clearly judged that there is a defect in the cable at 19.82 m, and the positioning accuracy is 0.9%.

5.2. Case 2

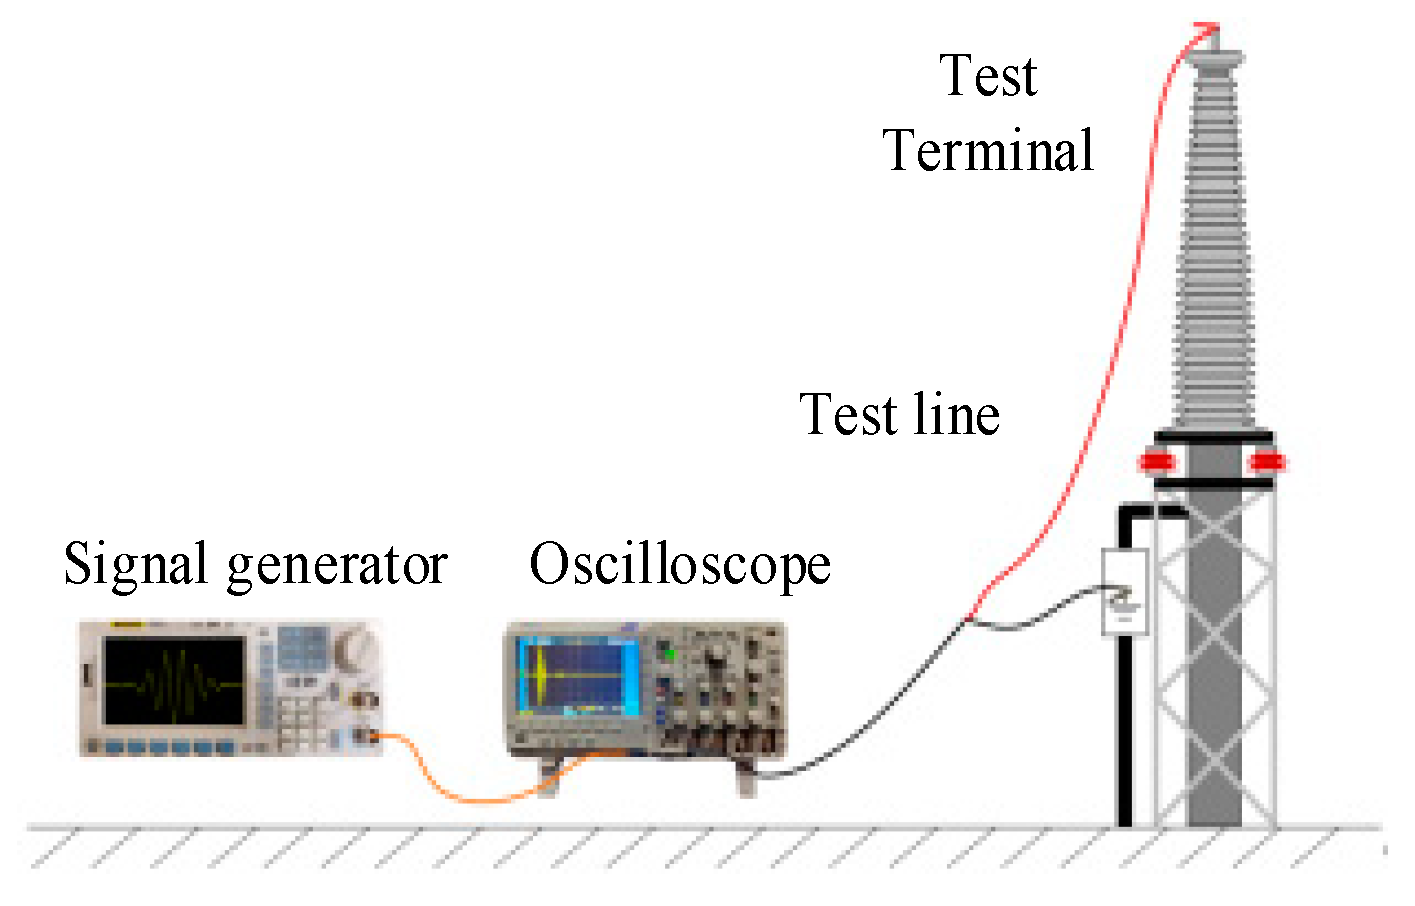
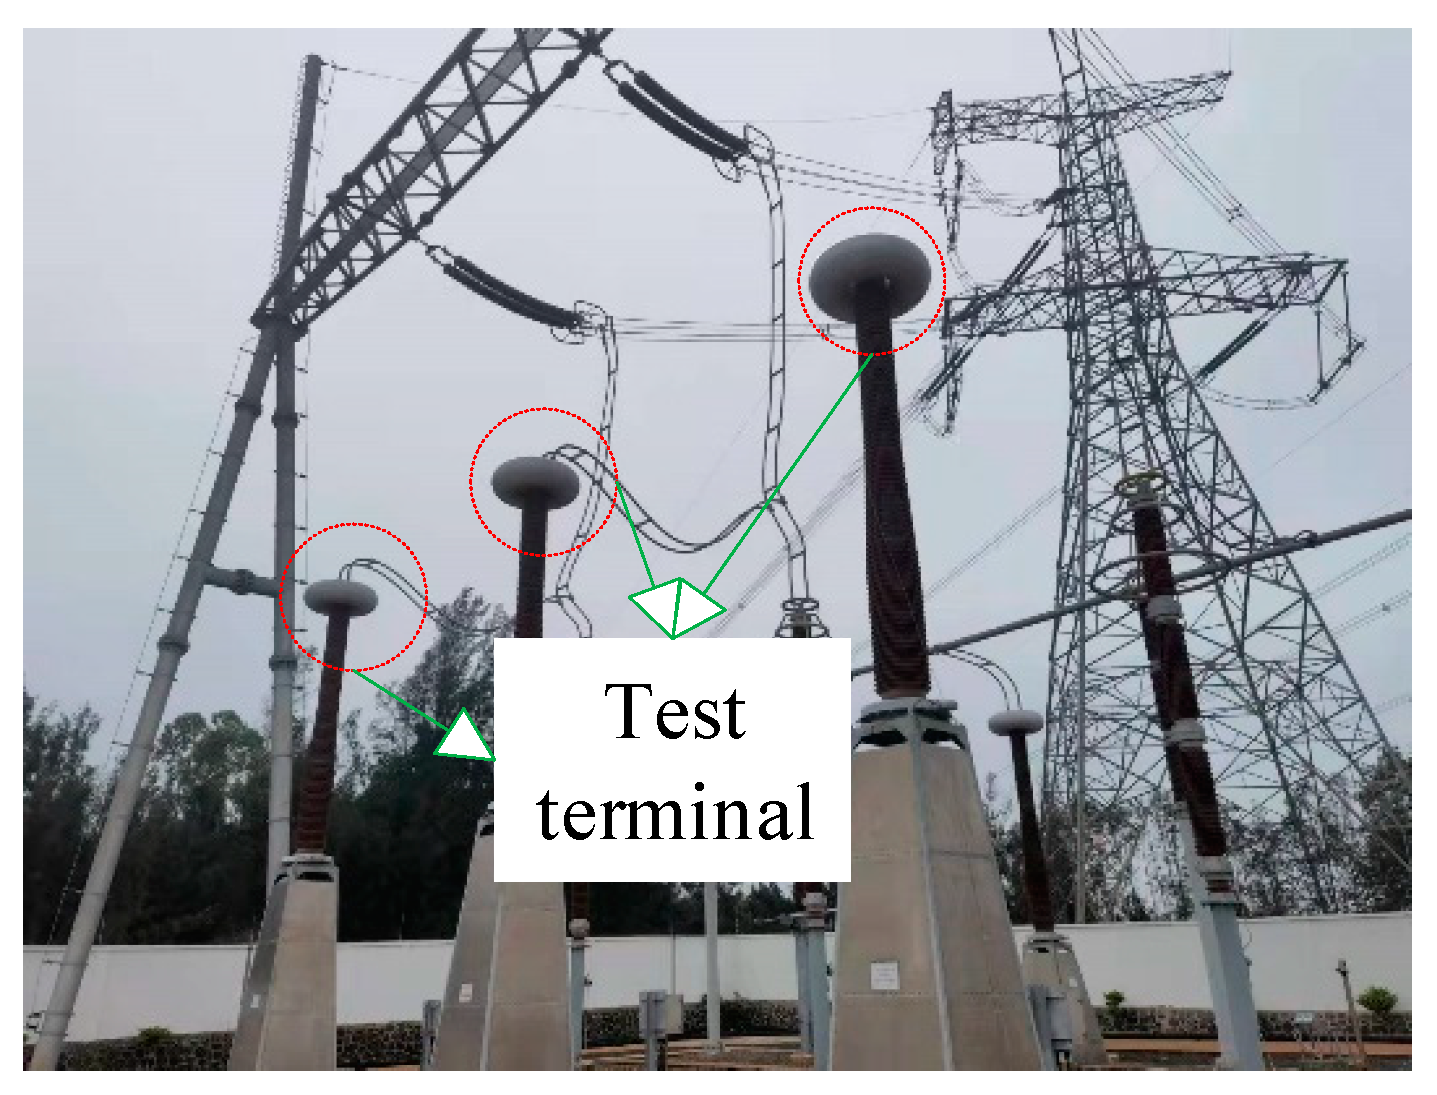
To verify the effectiveness of the proposed method in field testing, an oil-filled submarine cable with a total length of 32 km was taken as the test object in this case. Figure 11 is a schematic diagram of the wiring tested in the field, including a signal generator, T-connector, test wire, and oscilloscope connector. Figure 12 shows the field terminal diagram of the oil-filled submarine cable. High-frequency signal attenuation in long-distance submarine cables is more serious. Therefore, the test signal required for the field test has a narrow frequency band and a low center frequency. The specific reference signal parameters are set as follows: the signal frequency bandwidth is set to 5 MHz, the center frequency is set to fm = 2.5 MHz, and the center time is set to gb = 200 ns, ga = 1 V and gc = 0.4 ns. The positioning results of the S-transformation and WVD are shown in Figure 13. Test parameters and test results are shown in Table A1.
As shown in Figure 13, after processing via the S transformation, the total length of the 32 km oil-filled submarine cable can be accurately determined, and it is determined that there is no defect in the middle of the submarine cable, which is consistent with the actual situation. Therefore, this method can detect the actual submarine cable defect conditions without cross terms. From the above experimental results, it can be concluded that the proposed method of locating cable defects based on synchronous compression transformation can solve the problem of the cross-term influence in the WVD, obtaining a more accurate location signal energy distribution than the traditional signal spectrum acquisition method. At the same time, the S-transform improves the positioning accuracy of the traditional TFDR method (WVD), and can realize the effective positioning of ultra-long distance submarine cables. In addition, the test error for terminal B of the S-transform for the 32 km submarine cable is 0.28%, and the test error of the WVD is 0.28%. It can be seen that in the positioning of long cables, the S-transform has the same test accuracy as the WVD.

6. Discussion

To solve the problem of cross-term interference in the results of detecting medium-voltage cable defects in existing time–frequency-domain detection methods, a new method of locating cable defects based on Gaussian narrow-band envelope signals and the S-transform is proposed in this paper. The resolution of the cable transfer function is improved by adjusting the frequency range of the normal Gaussian narrow-band envelope signal. Through the adaptive property of the S-transform to the window function, the aim of eliminating cross-term interference is achieved, and defect detection in medium-voltage cables is more accurate. The effectiveness and practicability of the proposed method are verified via simulations and experiments.

Author Contributions

Conceptualization, W.C. and Z.Y.; methodology, J.S.; supervision and project administration, X.F. and L.Z.; writing—original draft preparation, W.C. and L.X.; software and visualization, X.W.; investigation and resources, C.H. All authors have read and agreed to the published version of the manuscript.

Funding

This research was funded by Technology project of Shenzhen Power Supply Bureau Co., LTD (090000KC23020053).

Data Availability Statement

The data used to support the findings of this study are available from the corresponding author upon request.

Conflicts of Interest

Authors Wei Chen, Zhenbao Yang, Jinyang Song, Lifu Zhou, Lingchen Xiang, Xing Wang were employed by the company Shenzhen Power Supply Bureau Co., Ltd. China Southern Power Grid. The remaining authors declare that the research was conducted in the absence of any commercial or financial relationships that could be construed as a potential conflict of interest.

Abbreviations

Abbreviations and full names in this article.
Full NamesAbbreviations
Time–frequency-domain reflection TFDR
Frequency-domain reflection FDR
Time-domain reflectometry TDR
Broadband impedance spectroscopy BIS
Wigner–Ville distribution WVD
Pseudo-Wigner–Ville distribution PWVD
Smooth pseudo-Wigner distributionSPWVD
Cable transfer functionCTF
The meaning of symbols in this article.
SymbolsMeaning
Δx The unit length of the cable
RThe resistance per unit length
LThe inductance per unit length
CThe capacitance per unit length
GThe conductance per unit length
ω/fAngular frequency/frequency
rc, rsThe core radius and the inner radius of the shield layer
ρc, ρsThe resistivity of the cable core and shield layer
μ0The vacuum permeability
σ, εThe electrical conductivity and dielectric constant
Γ(ω)The CTF
Z0, ZLThe characteristic impedance of the cable body and the load impedance at the terminal
r(ω) The propagation coefficient of the signal in the cable
α(ω), β(ω)The attenuation coefficient and the phase coefficient
vThe propagation speed of electromagnetic waves
xThe location of the defect
ga, gb, gc,, gd, fmThe amplitude factor, the time factor, the pulse width factor, the frequency modulation factor, and the central frequency

Appendix A

The experimental set-up and the obtained results are as follows.
Table A1. The list of the experimental set-up parameters and the obtained results.
CaseExperimental Set-UpExperimental Results
1fm = 100 MHz, ga = 1 V, ga = 1 V, gb = 20 μs and gc = 0.4 μsS-transform: 0.050% without cross-term
WVD: 0.030% with cross-term
2fm = 2.5 MHz, ga = 1 V, gb = 200 ns and gc = 0.4 nsS-transform: 0.28% without cross-term
WVD: 0.28% with cross-term

References

  1. Xie, S.; Chen, Z.; Yan, Z.; Qiu, X.; Hu, M.; Gu, C.; Zhao, X.; Wang, K. Blending Modification Technology of Insulation Materials for Deep Sea Optoelectronic Composite Cables. Energies 2024, 17, 820. [Google Scholar] [CrossRef]
  2. Tang, Z.; Zhou, K.; Xu, Y.; Meng, P.; Zhang, H.; Wu, Y. A Reflection Coefficient Estimation Method for Power Cable Defects Based on Three-Point Interpolated FFT. IEEE Trans. Instrum. Meas. 2024, 73, 3505508. [Google Scholar] [CrossRef]
  3. Li, Z.; Dong, Y.; Wu, Y.; Meng, Z.; Song, P.; Zhu, M.; Li, X.; Du, B. Breakdown Performance Evaluation and Lifetime Prediction of XLPE Insulation in HVAC Cables. Energies 2024, 17, 1337. [Google Scholar] [CrossRef]
  4. Li, S.; Song, P.; Wei, Z.; Li, X.; Tang, Q.; Meng, Z.; Li, J.; Liu, S.; Wang, Y.; Li, J. Partial Discharge Detection and Defect Location Method in GIS Cable Terminal. Energies 2023, 16, 413. [Google Scholar] [CrossRef]
  5. Li, C.; Hu, J.; Lin, C.; Zhang, B.; Zhang, G.; He, J. Surface charge migration and dc surface flashover of surface-modified epoxy-based insulators. J. Phys. D Appl. Phys. 2017, 50, 065301. [Google Scholar] [CrossRef]
  6. Li, C.; Lin, C.; Chen, G.; Tu, Y.; Zhou, Y.; Li, Q.; Zhang, B.; He, J. Field-dependent charging phenomenon of HVDC spacers based on dominant charge behaviors. Appl. Phys. Lett. 2019, 114, 202904. [Google Scholar] [CrossRef]
  7. Ngui, Y.J.; Lin, C.-P. Self-Referencing TDR Dielectric Spectroscopy Using Reflection-Decoupled Analysis with a Mismatched Section. IEEE Trans. Instrum. Meas. 2022, 71, 1003415. [Google Scholar] [CrossRef]
  8. Tian, C.; Ye, D.; Xing, W. Research on Aging Performance and Mechanism Analysis of Cross-linked Polyethylene Wire and Cable Materials. In Proceedings of the 2021 IEEE International Conference on the Properties and Applications of Dielectric Materials (ICPADM), Johor Bahru, Malaysia, 12–14 July 2021; p. 93. [Google Scholar]
  9. Li, W.; Zhou, W.; Fu, L.; Yuan, T. Cable Fault on-Line Monitoring Based on Transient Traveling Wave Signal Analysis Technology. In Proceedings of the 2023 IEEE 3rd International Conference on Power, Electronics and Computer Applications (ICPECA), Shenyang, China, 29–31 January 2023; pp. 631–635. [Google Scholar] [CrossRef]
  10. Papazyan, R.; Eriksson, R. Calibration for time domain propagation constant measurements on power cables. IEEE Trans. Instrum. Meas. 2003, 52, 415–418. [Google Scholar] [CrossRef]
  11. Lee, C.-K.; Kwon, G.-Y.; Shin, Y.-J. Condition Assessment of I&C Cables in Nuclear Power Plants via Stepped-Frequency Waveform Reflectometry. IEEE Trans. Instrum. Meas. 2019, 68, 215–224. [Google Scholar] [CrossRef]
  12. Arman, A.S.; Ali, M.; Glass, S.W.; Fifield, L.S. Full-Wave and Circuit-Based Simulations of Cable Insulation Aging/Damage Using Time-Frequency Domain Reflectometry. In Proceedings of the IEEE Conference on Electrical Insulation and Dielectric Phenomena (CEIDP), Vancouver, BC, Canada, 12–15 December 2021; pp. 531–534. [Google Scholar] [CrossRef]
  13. Zhou, K.; Tang, Z.; Meng, P.; Huang, J.; Xu, Y.; Rao, X. A Novel Method for Sign Judgment of Defects based on Phase Correction in Power Cable. IEEE Trans. Instrum. Meas. 2024, 73, 1–9. [Google Scholar] [CrossRef]
  14. Huang, J.; Ju, D.; Chu, G.; Liang, Y.; Chen, C.; Chen, P. Localization of Typical Defects in 220kV XLPE Submarine Cable Based on Frequency Domain Reflection Technology. In Proceedings of the 2023 IEEE World Conference on Applied Intelligence and Computing (AIC), Sonbhadra, India, 29–30 July 2023; pp. 948–953. [Google Scholar] [CrossRef]
  15. Ohki, Y.; Hirai, N. Location attempt of a degraded portion in a long polymer-insulated cable. IEEE Trans. Dielectr. Electr. Insul. 2018, 25, 2461–2466. [Google Scholar] [CrossRef]
  16. Shi, Q.; Kanoun, O. Wire Fault Diagnosis in the Frequency Domain by Impedance Spectroscopy. IEEE Trans. Instrum. Meas. 2015, 64, 2179–2187. [Google Scholar] [CrossRef]
  17. Chen, C.; Guan, Q.; Guan, Q.; Jin, X.; Shi, Z. A Wavenumber Domain Reflectometry Approach to Locate and Image Line-Like Soft Faults in Cables. IEEE Trans. Instrum. Meas. 2023, 72, 6011012. [Google Scholar] [CrossRef]
  18. Tang, Z.; Zhou, K.; Meng, P.; Li, Y. A Frequency-Domain Location Method for Defects in Cables Based on Power Spectral Density. IEEE Trans. Instrum. Meas. 2022, 71, 9005110. [Google Scholar] [CrossRef]
  19. Lee, H.M.; Lee, G.S.; Kwon, G.-Y.; Bang, S.S.; Shin, Y.-J. Industrial Applications of Cable Diagnostics and Monitoring Cables via Time–Frequency Domain Reflectometry. IEEE Sens. J. 2021, 21, 1082–1091. [Google Scholar] [CrossRef]
  20. Zou, X.; Mu, H.; Wang, R.; Fan, K.; Cheng, Z.; He, Y.; Zhang, G. An efficient accuracy improvement method for cable defect location based on instantaneous filtering in time-frequency domain. Meas. J. Int. Meas. Confed. 2024, 226, 114178. [Google Scholar] [CrossRef]
  21. Kwon, G.-Y.; Lee, Y.H.; Bang, S.S.; Ji, G.H.; Lee, G.S.; Tamus, Z.A.; Shin, Y.-J. Assessment of Cable Aging for Nuclear Power Plants I&C Cable via Time-Frequency Domain Reflectometry. In Proceedings of the 2020 IEEE 3rd International Conference on Dielectrics (ICD), Valencia, Spain, 5–31 July 2020; pp. 77–80. [Google Scholar] [CrossRef]
  22. Tang, Z.; Xu, Y.; Zhou, K.; Meng, P.; Huang, J.; Liang, Z. A Frequency Sweep Location Method for Soft Faults of Power Cables Based on MUSIC-Pseudospectrum. IEEE Trans. Instrum. Meas. 2023, 72, 3510410. [Google Scholar] [CrossRef]
  23. Górecki, K.; Szmajda, M.; Zygarlicki, J.; Zygarlicka, M.; Mroczka, J. Zaawansowane metody analiz w pomiarach jakości energii elektrycznej. Pomiary Autom. Kontrola 2011, 57, 284–286. [Google Scholar]
  24. Shweta; Kishor, N. Time- Frequency Based Detection of Faulted Line and Fault Instant Using Wide Area Signals. In Proceedings of the 2019 International Conference on Electrical, Electronics and Computer Engineering, Aligarh, India, 8–10 November 2019; pp. 1–6. [Google Scholar]
  25. Asorza, J.E.G.; Leon Colqui, J.S.; Kurokawa, S.; Filho, J.P. Analysis of Increased Induced Voltages on the Sheath of Double-Circuit Underground Transmission Lines Guaranteeing Ampacity. Energies 2024, 17, 1637. [Google Scholar] [CrossRef]
  26. Huang, J.; Zhou, K.; Xu, Y.; Meng, P.; Tang, Z.; Liang, Z. Upper Sweeping Frequency Selection for Cable Defect Location Based on STFT. IEEE Trans. Instrum. Meas. 2023, 72, 3521109. [Google Scholar] [CrossRef]
  27. Sathyanarayana, S.G.; Gargava, A.; Venkatesan, S.M. Parameterized transform domain computation of the Hilbert Transform applied to separation of channels in Doppler spectra. In Proceedings of the 2013 3rd IEEE International Advance Computing Conference (IACC), Ghaziabad, India, 22–23 February 2013; pp. 1189–1194. [Google Scholar] [CrossRef]
  28. Zhang, L.; Wang, X.; Tian, S.; Li, Y. Fault location method of distribution network based on transient energy relative entropy of S-transform. In Proceedings of the 2012 24th Chinese Control and Decision Conference (CCDC), Taiyuan, China, 23–25 May 2012; pp. 2255–2259. [Google Scholar]
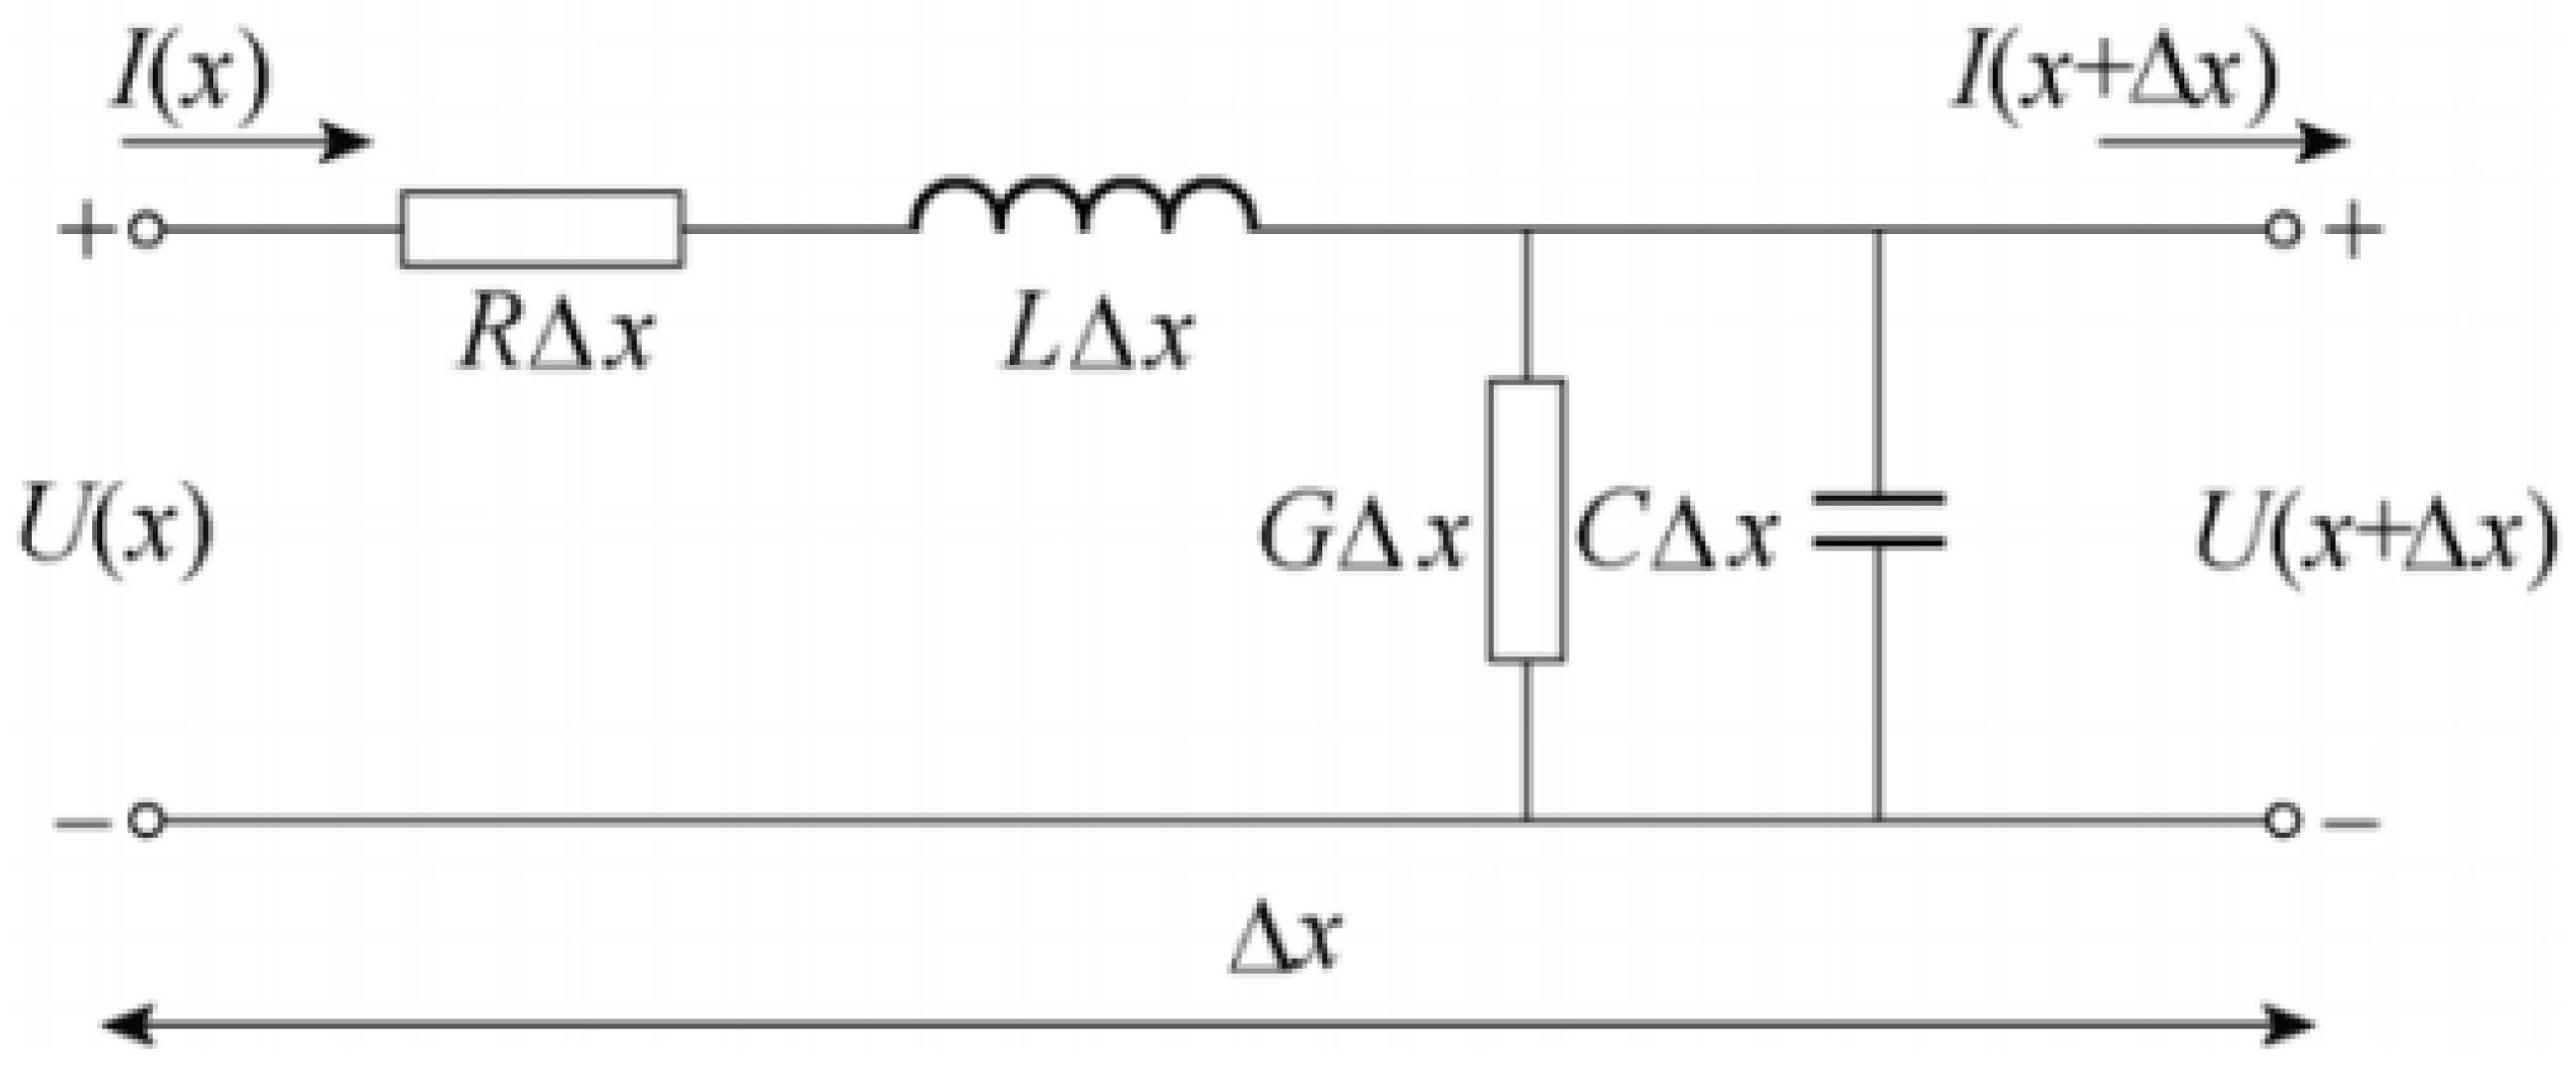
Figure 1. A medium-voltage cable model along with distributed parameters.
Energies 17 02218 g001
Figure 2. The change in wave speed v of the test signal with different frequencies in the cable.
Energies 17 02218 g002
Figure 3. g(t) time frequency characteristics at different gd.
Energies 17 02218 g003
Figure 4. Flow chart of the defect detection method based on the S-transform.
Energies 17 02218 g004
Figure 5. A medium-voltage cable model with a defect.
Energies 17 02218 g005
Figure 6. Analysis results of the S-transform and WVD for cables with defects. (a) S-transform, (b) WVD.
Energies 17 02218 g006
Figure 7. The positioning results of the S-transform and WVD for cable model with defects. (a) S-transform; (b) WVD.
Energies 17 02218 g007
Figure 8. Experimental test platform of a 10 kV medium-voltage XLPE cable.
Energies 17 02218 g008
Figure 9. Spectrum in the time-frequency domain of a 40 m/10 kV medium-voltage cable. (a) S-transformation, (b) WVD.
Energies 17 02218 g009
Figure 10. Test results of a 40 m/10 kV medium-voltage cable. (a) S-transformation, (b) WVD.
Energies 17 02218 g010
Figure 11. Field test diagram of the 32 km oil-filled submarine cable.
Energies 17 02218 g011
Figure 12. The terminal of 32 km oil-filled submarine cable.
Energies 17 02218 g012
Figure 13. The location spectrum of 32 km oil-filled submarine cable using the S-transformation and WVD.
Energies 17 02218 g013
Table 1. Parameter setting in simulations of the medium-voltage cable model.
ParameterValue
Core radius rc/mm 4
Radius inside the shield rs/mm 9.5
Cable core resistivity ρc/(μΩ·mm) 17.5
Shield resistivity ρs/(μΩ·mm) 17.5
Conductivity of XLPE σ/(S·m) 1 × 10⁻¹⁶
Dielectric constant of XLPE ε/(F·m) 2.4 × 10⁻¹¹
Disclaimer/Publisher’s Note: The statements, opinions and data contained in all publications are solely those of the individual author(s) and contributor(s) and not of MDPI and/or the editor(s). MDPI and/or the editor(s) disclaim responsibility for any injury to people or property resulting from any ideas, methods, instructions or products referred to in the content.