1. Introduction
The release of greenhouse gases, particularly CO
2, has resulted in global warming, posing a significant threat to human survival and sustainable development [
1]. As of 2020, coal-fired power plants remained the dominant source of global electricity, constituting approximately 41% [
2]. Although the retirement of coal-fired power plants is a gradual process in the transition towards carbon neutrality, these plants continue to play a crucial role in several countries, such as China, Japan, and India. Projections indicate that by 2030, coal-fired power plant capacity and electricity generation in China will still represent approximately 32.2% and 45.9%, respectively [
3]. Moreover, in response to the gas shortage arising from the conflict between Russia and Ukraine, several European countries and regions reinstated previously closed coal-fired power plants in June 2022. The substitution of coal with ammonia (NH
3) represents a strategy to decrease the carbon content in the fuel stream, resulting in reduced emissions from coal-fired power plants. Initially introduced by Japan [
4], this approach has garnered significant interest from nations heavily reliant on coal-fired power plants [
5].
Ammonia co-firing holds great importance in the context of transitioning to cleaner energy sources and reducing greenhouse gas emissions. By introducing ammonia as a co-firing agent alongside coal, the overall carbon footprint of energy generation can be significantly reduced [
6]. Ammonia is considered a promising fuel additive due to its high hydrogen content, which enhances combustion efficiency and reduces the emission of pollutants such as nitrogen oxides (NO
x). The use of ammonia as a co-firing agent can therefore contribute to the achievement of stricter environmental regulations and air quality standards [
7]. Furthermore, ammonia is readily available and can be produced from renewable energy sources, such as wind or solar power, through the process of electrolysis. This aspect aligns with the intention to decarbonize energy systems and achieve sustainability goals [
8,
9].
In the optimization process of ammonia co-firing, it is essential to investigate the impact of varying operational parameters, such as the air staging and ammonia-to-coal ratio [
6]. Understanding the interactions between these parameters and their influence on the combustion process is crucial for achieving optimal performance and maximizing the benefits of co-firing. Air staging plays a pivotal role in controlling combustion kinetics and temperature distribution within the furnace [
6]. By strategically introducing air at different stages, it is possible to manage peak temperatures, control flame characteristics, and enhance overall combustion efficiency. Simultaneously, the ammonia-to-coal ratio significantly affects the combustion chemistry and emissions profile. Properly balancing this ratio is essential to harness the benefits of ammonia as a clean fuel, minimizing NO
x emissions while ensuring complete combustion. By integrating these aspects into the study, a comprehensive assessment of the optimization potential and robustness of ammonia co-firing in a pilot-scale fluidized bed reactor can be achieved.
Zhao et al. [
3], focused on the integration of ammonia–coal co-firing technology into coal-fired power plants to reduce carbon emissions and support renewable energy integration. Using optimization models and simulations based on different power system scenarios, they analyzed the economic and environmental performance of the system with varying renewable energy shares. The results demonstrate that coal-fired power plants configured with green ammonia co-firing can significantly reduce operating costs, carbon emissions, and renewable energy curtailment compared to standalone batteries or fuel cells.
Other previous research conducted on the co-firing of ammonia and coal has primarily concentrated on investigating combustion characteristics and the emissions of nitrogen oxides (NOx). Wang and Sheng [
10] explored the potential of co-firing ammonia with coal in pulverized coal-fired power plants to reduce CO
2 emissions. The findings indicate that co-firing up to 20% ammonia is feasible without significantly affecting the boiler performance. However, at higher ratios (30% and 40%), the heat transfer distribution to boiler heat exchangers is compromised, leading to issues such as over-temperature of superheated steam, under-temperature of reheated steam, and reduced thermal efficiency.
In their study, Nagatani et al. [
4] assessed the feasibility of ammonia co-firing in a 1000 MW coal-fired boiler. Their findings demonstrated that incorporating ammonia co-firing primarily necessitates the addition of an ammonia supply system, while the remaining infrastructure can be utilized with no significant modifications under the existing conditions.
Hiroki et al. [
11] conducted experiments to assess the co-firing of ammonia with pulverized coal in a 10 MW
th combustion facility using a swirl burner. Their findings demonstrated that co-firing ratios of up to 20% allowed for the effective limitation of NO
x emissions to levels comparable to those observed during pure coal firing. Additionally, they successfully maintained a stable flame by supplying ammonia through the center of the coal burner.
In addition to experimental investigations, cost-effective numerical simulations have been utilized to explore the co-firing of ammonia in coal-fired facilities [
2,
6,
12,
13,
14]. These simulations capture the observed experimental outcomes at lower co-firing ratios while examining the combustion performance and NO
x formation at higher ratios. The findings of these studies confirm that co-firing ammonia at lower ratios maintains similar combustion performance to coal combustion [
2,
6]. However, as the co-firing ratios exceed 40%, both fuel burnouts may significantly deteriorate, although it is still possible to achieve low NO
x emissions [
2,
13].
Achieving optimized operational conditions for complex systems is facilitated by employing sophisticated combinations of numerical and statistical methodologies, including design of experiments (DoE) and response surface methods (RSM) [
15,
16]. DoE addresses several factors concurrently, as opposed to altering them one at a time. This approach offers a significant advantage by successfully accounting for multiple interactions among the factors. Furthermore, it markedly diminishes the required number of experimental runs needed to derive meaningful insights from the data. Integrating the propagation of error (PoE) into this strategy enhances the analysis by systematically quantifying uncertainties and error propagation, providing a more comprehensive understanding of the reliability of the optimized operational conditions [
17,
18].
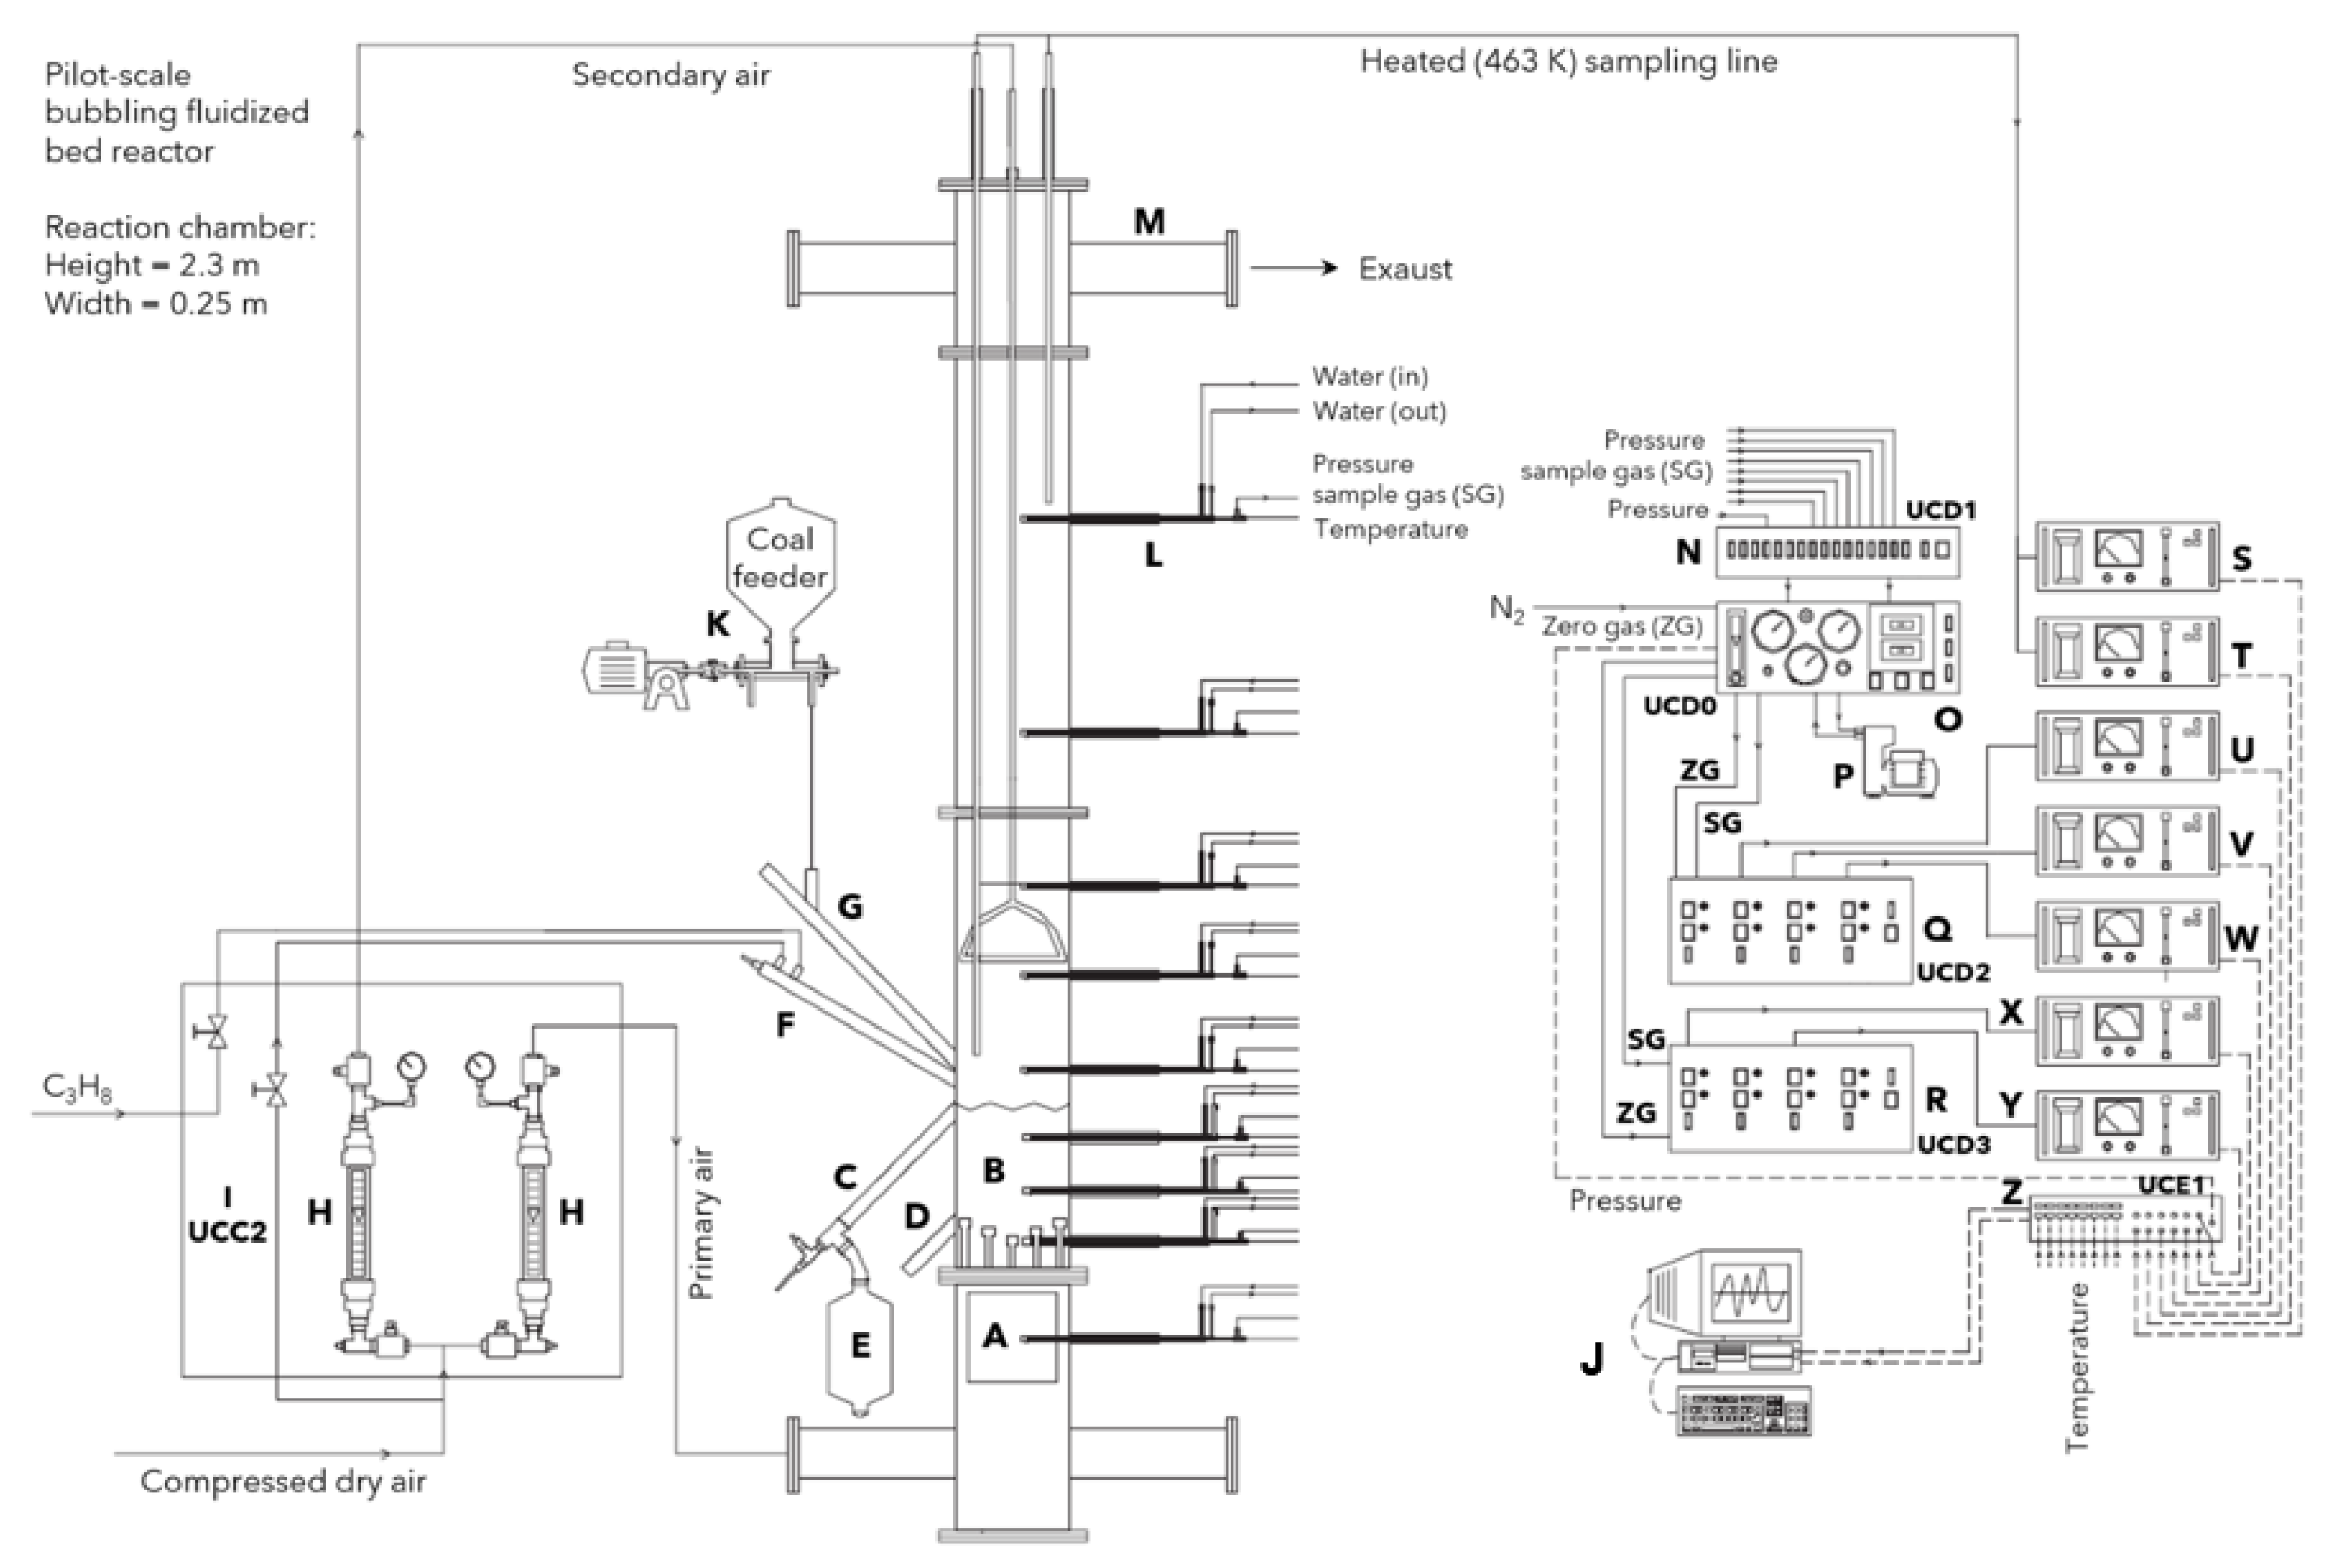
This work not only contributes to the scientific understanding of co-firing processes but also provides valuable insights for industry and policymakers in their pursuit of cleaner and more sustainable energy solutions. To the best of our knowledge, no existing literature addresses optimization and robustness techniques specifically applied to ammonia and coal co-firing in a pilot-scale fluidized bed reactor. Consequently, to bridge this gap in the current body of research and to explore the optimization potential while ensuring robustness in co-firing processes, this study presents an advanced statistical approach combining RSM and PoE. To accomplish this, a 2D Eulerian–Lagrangian model is developed within the Ansys Fluent framework. The mathematical model is validated using experimental data obtained from pilot-scale co-firing runs. Based on the experimental and numerical results, the optimal operating conditions are determined for ammonia and coal co-firing. Finally, the system’s performance is enhanced by addressing the robust operating conditions for minimizing NO, NH3 and CO2 emissions generation for coal phase-out co-firing processes.
4. Results
4.1. Model Validation
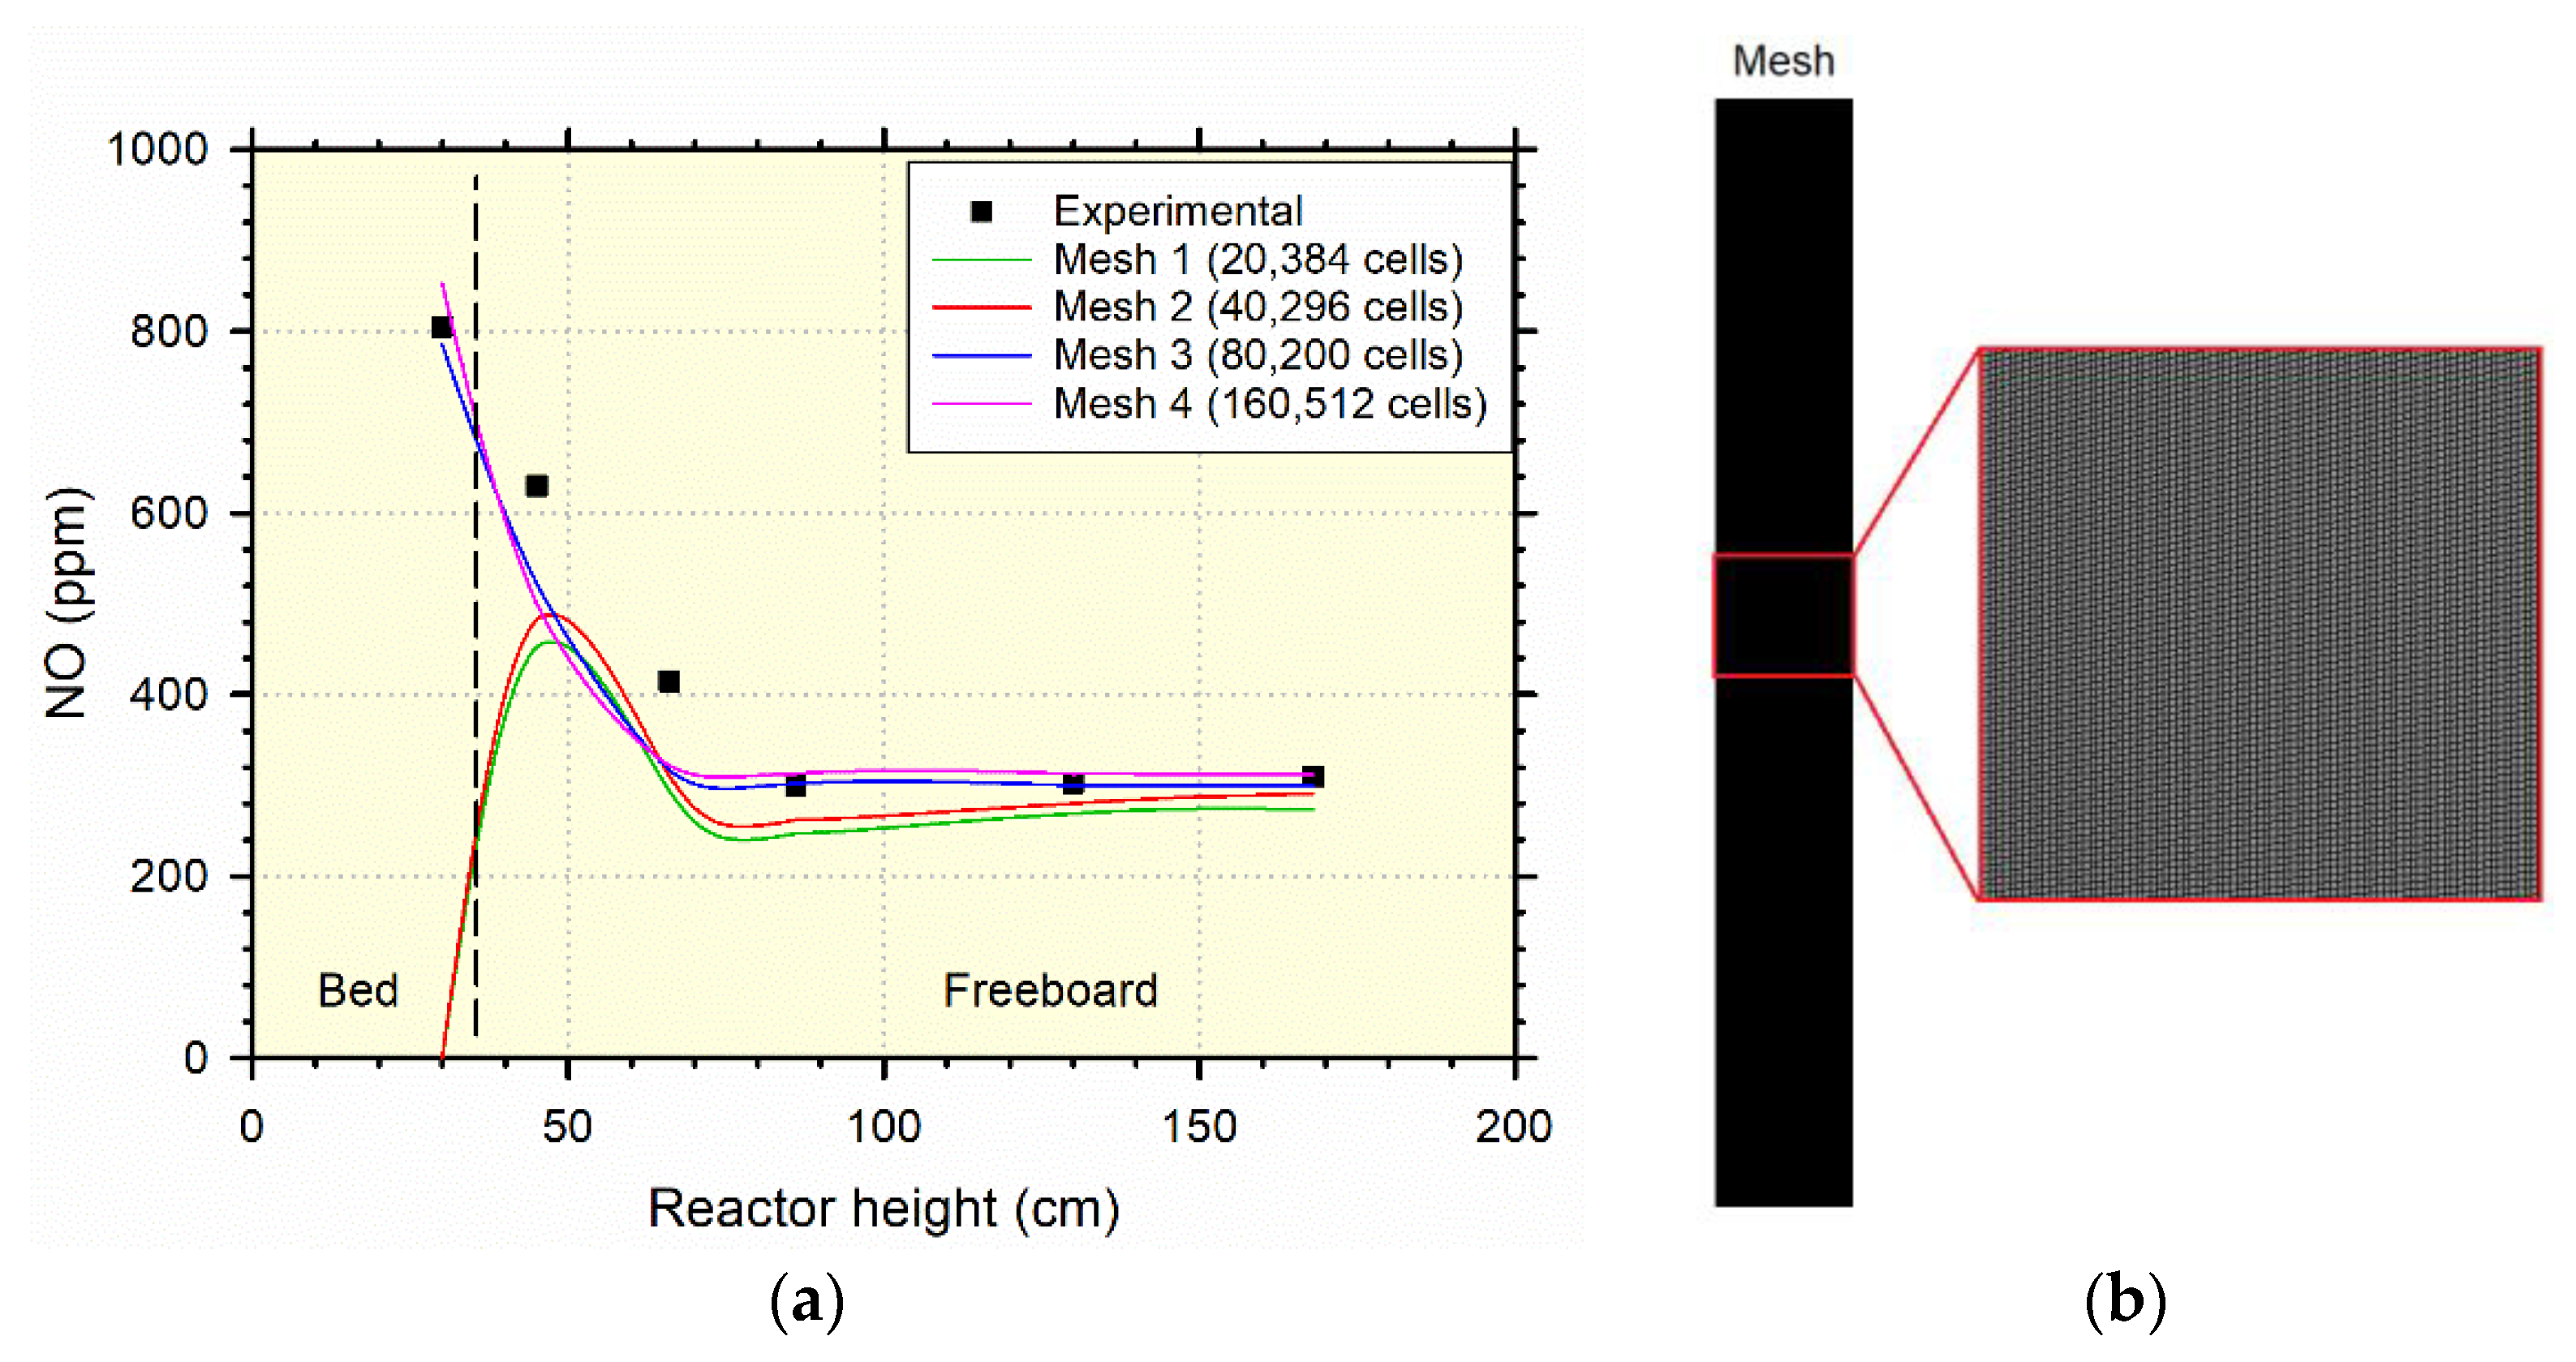
Figure 2a demonstrates the model’s accuracy in predicting NO concentrations across different reactor heights during coal combustion under air staging conditions (80% primary air). To accurately gauge the influence of the discretization process on the solution, initiating a mesh sensitivity analysis is imperative to capture the reactor’s performance comprehensively. Four meshes were established, uniformly divided into square cells with a refinement ratio of 2. These meshes were tailored to encompass the experimental NO concentration distribution across the reactor height. The simulations were conducted for bituminous coal, aligning with the experimental conditions featuring 80% primary air and an operational temperature of 1098 K [
27]. Concerning mesh convergence, coarser meshes (mesh 1 and 2) exhibited an underestimation of NO concentration, particularly for lower reactor heights, consequently leading to inaccurate assumptions and inconclusive outcomes. Contrarily, finer meshes yielded more accurate results, albeit at the cost of increased computational time. Thus, a balance must be struck between precision and computational resources. Both mesh 3 and 4 effectively projected the experimental NO concentration outcomes throughout the reactor’s height, demonstrating satisfactory mesh convergence. Considering the notable similarity between mesh 3 and 4, and considering the heightened computational demands of the denser mesh 4, mesh 3 with a cell count of 80,200 emerges as the optimal choice for this study.
Figure 2b depicts the mesh applied in this study.
To further ensure the reliability of these predictions, the validation process needs to be extended to encompass a wide range of variables.
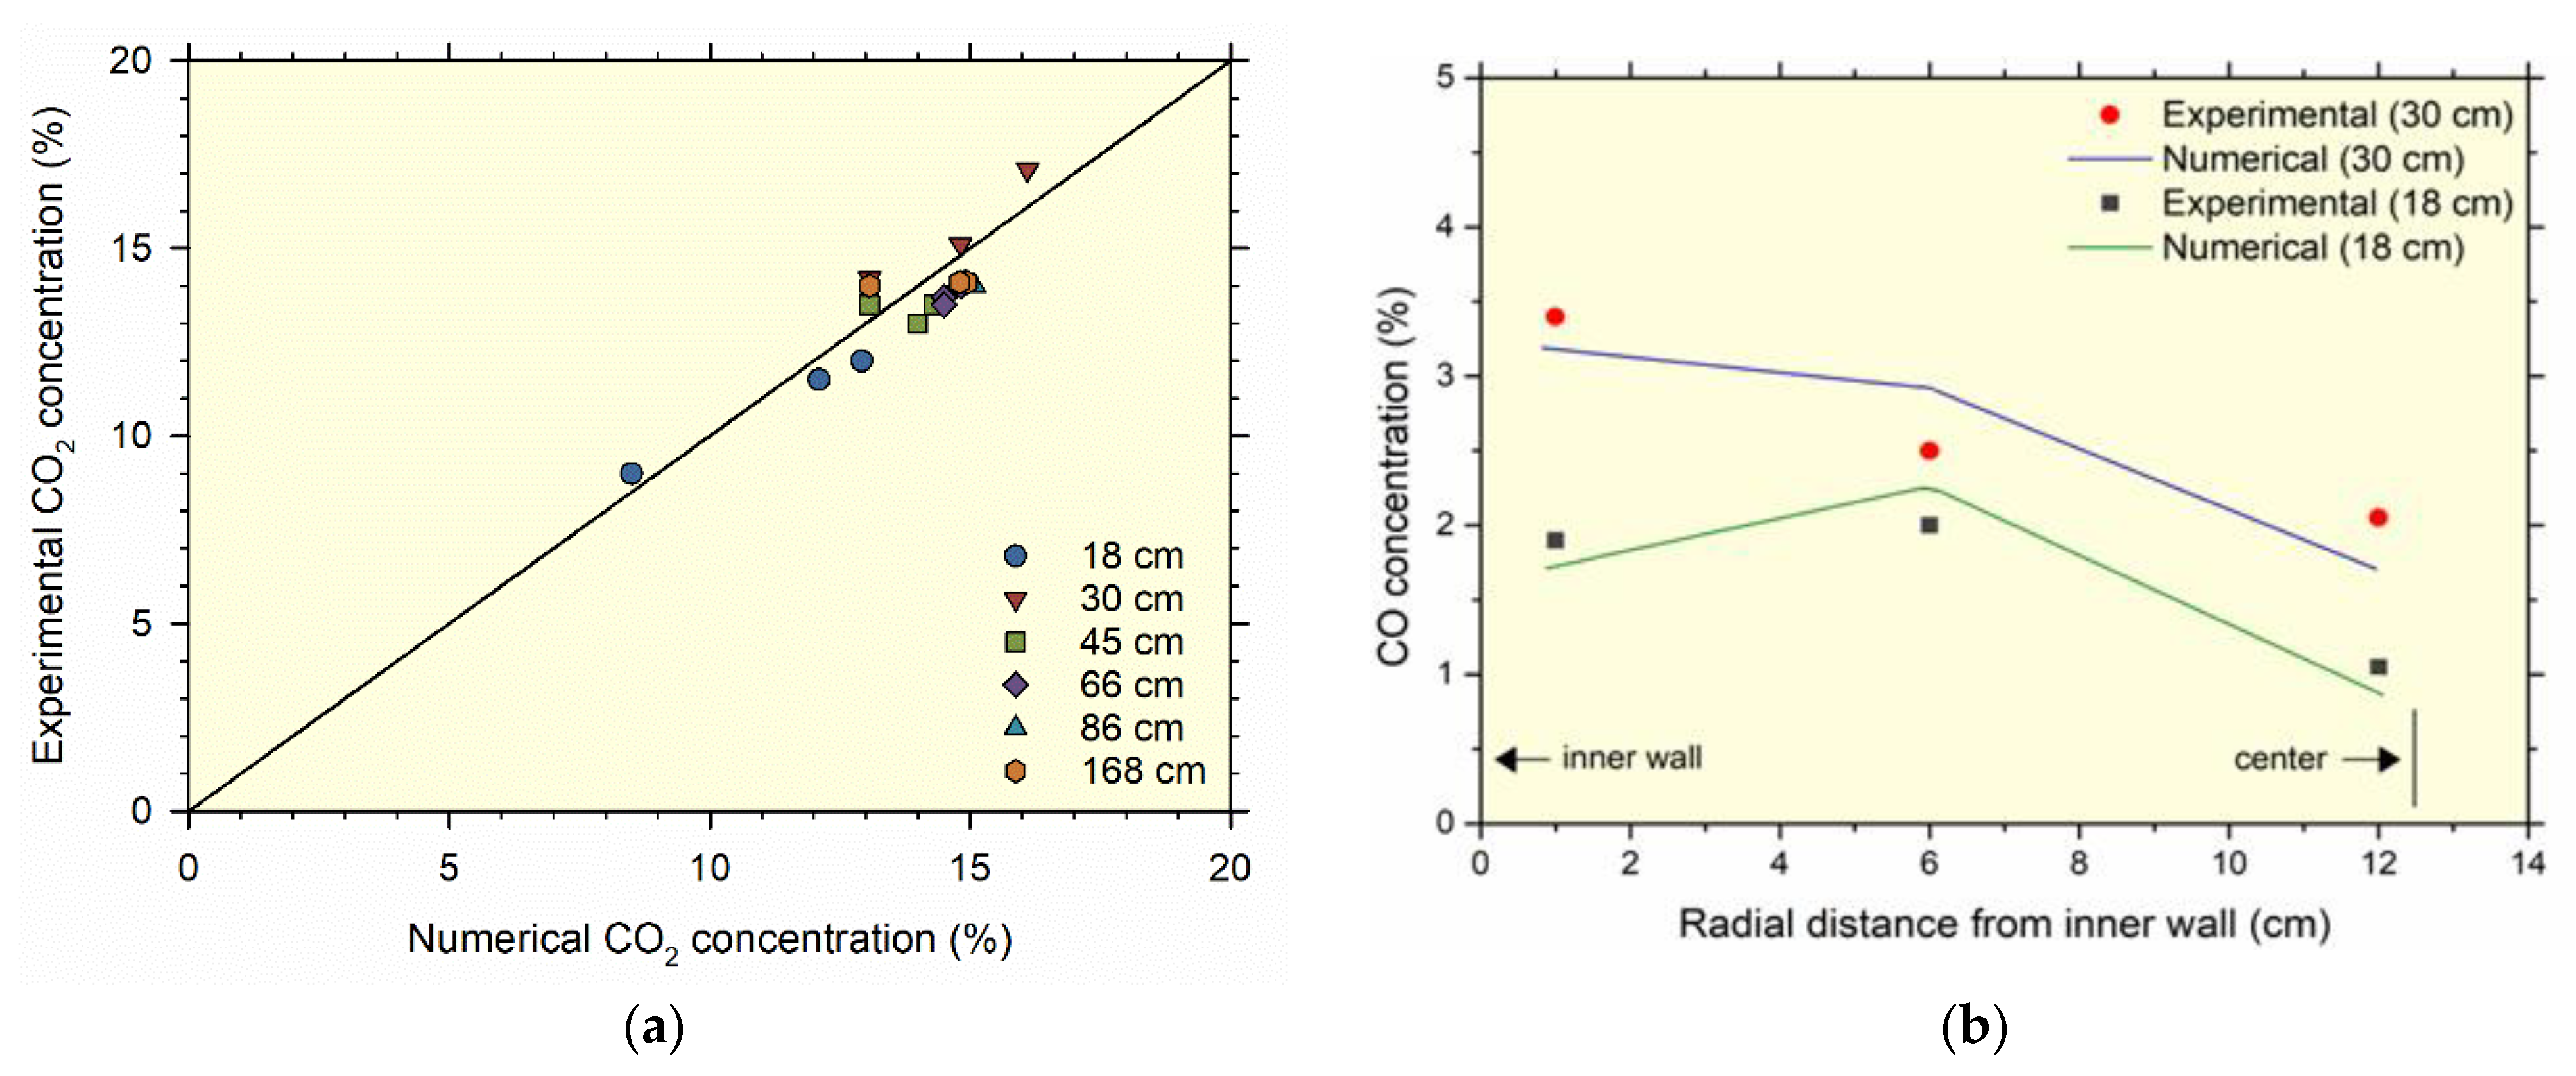
Figure 3a,b provide a comparison between experimental and numerical outcomes for CO
2 and CO concentrations at varying vertical heights and radial distances. These simulations followed the experimental parameters, using 100% primary air and an operational temperature of 1098 K [
19]. Similarly to the results for NO concentration, the model exhibited a commendable ability to predict CO
2 and CO concentrations at different reactor positions, with notable concordance between numerical and experimental values. The closeness to the line in CO
2 concentration signifies reduced error variance, while CO concentration displays close agreement between experimental and numerical values. Having successfully validated the model for coal combustion in a pilot-scale reactor, the study proceeded to investigate coal and NH
3 co-firing within the same system. The research group has already previously validated the model for compositions up to 80% ammonia [
6]. In this particular case, due to the intricacies of the DoE, we conducted simulations for new data points, ensuring they remained within the prescribed limits outlined in the referenced article. This approach underscores a considerable level of confidence in the simulation outcomes for these mixtures.
Furthermore, the research group boasts substantial expertise in developing mathematical models that describe thermochemical processes across diverse feedstocks, experimental scenarios, and scales [
16,
28,
29].
In addition to gas concentrations, evaluating the model’s competence in forecasting the fluidization process involves illustrating the variance between experimental and numerical fluidization curves, as depicted in
Figure 4. These curves quantify the pressure distribution within the bed by incrementally raising the superficial air velocity until the minimum fluidization velocity is reached. An internally developed user-defined function (UDF) routine was applied to reduce disparities between experimental and numerical fluidization outcomes, enhancing the accuracy and predictability of the mathematical model. This routine operates by adjusting the default constant values of the solid-phase velocity coefficient to ensure accurate prediction of bed behavior. Findings indicate that in the absence of the UDF routine, the model tends to overestimate fluidization curves, particularly at lower velocities, leading to larger deviations from experimental results. These notable deviations at lower speeds are attributed to the minimal movement of solid fractions at such velocities, compounded by the Fluent database model’s inability to account for such low-entropy behaviors [
29]. Overall, the numerical model demonstrated a favorable alignment with the fluidization behavior of the pilot-scale reactor.
4.2. Statistical Model Validation
Following good statistical practices, it is recommended that empirical models be kept as simple as possible. Additional terms should only be introduced if they contribute to explaining variations beyond what is already accounted for [
30]. A convenient tool for determining the extent to which polynomial terms should be added to the empirical model is the sequential model sum of squares (SMSS). SMSS yields
p-values for the sources of terms in the model. The results of the SMSS analysis for NO generation are presented in
Table 5. Similar analyses were conducted for all other responses under consideration.
Table 5 shows that both the linear terms (A and B) and the quadratic terms (A
2 and B
2) have small
p-values, indicating that they can explain the variation in the process. The table also shows the F-value, and larger F-values suggest more significant factors and higher variability, similar to small p-values. When
p-values are higher than 0.1, the terms are not considered significant on their own. The cubic terms are aliased, so including them is not recommended. The quadratic model also covers linear and interaction terms (AB), making it the preferable choice. The empirical model is created using Eulerian–Lagrangian numerical simulations. With computer-based simulations, the same solution is consistently obtained under specific operating conditions. In such cases, the idea of replicates loses its significance. Statistical measures like lack of fit do not offer useful data for analysis in these situations.
Nevertheless, other measures such as
,
and
remain valuable.
assesses how effectively the model can accurately fit the experimental data or, in the current scenario, the computer-based simulations. However,
can occasionally be misleading, leading to overfitting of the data.
addresses this issue by providing a more dependable tool to evaluate the quality of data fitting.
evaluates how effectively the model can refit the data when one point is missing. When these measures are sufficiently close, it indicates a high-quality fit.
Table 6 displays the results of these additional measures. Once again, the quadratic model emerges as the most valuable option, displaying a high-quality fit of the model due to the closer resemblance between the two
coefficients. As anticipated, the cubic model is aliased, making it an impractical choice. Additionally, an alternative statistical tool used to measure the signal-to-noise ratio is Adeq-Precision. Adeq-Precision comparatively addresses the predicted value extent at the design points to the average prediction error. A ratio greater than 4 (27.6638 was obtained in this study) means that the selected model is reliable for navigating under the design space.
The higher-order polynomial determined by the SMSS suggested that the quadratic model provided the best fit with the experimental data, including linear (A, B), interaction (AB), and quadratic (A
2, B
2) terms to depict the variation of the process. A and B terms suited the air staging and NH
3 co-firing ratio factors, respectively. The final empirical model for predicting NO generation, in coded form, is given by:
The coded form equation is valuable for understanding the relative impact of the factors, as indicated by their coefficients. Positive coefficients imply that an increase in the factor leads to a corresponding increase in the response. In this representation, high levels of the factors are coded as +1, and low levels are coded as −1 by default.
Once the empirical model is chosen and before applying it to create the response surface, it is vital to perform an analysis of variance (ANOVA) to determine whether all terms should be included. According to the ANOVA results data shown in
Table 7, the model’s F-value of 77.10 implies the model is significant, and there is only a 0.05% chance that an F-value this large could occur due to noise.
p-Values less than 0.05 indicate model terms are significant. In this case, A, B, AB, A
2 are significant model terms. Values greater than 0.1 indicate the model terms are not significant. If there are many insignificant model terms (not counting those required to support hierarchy), model reduction may improve the model.
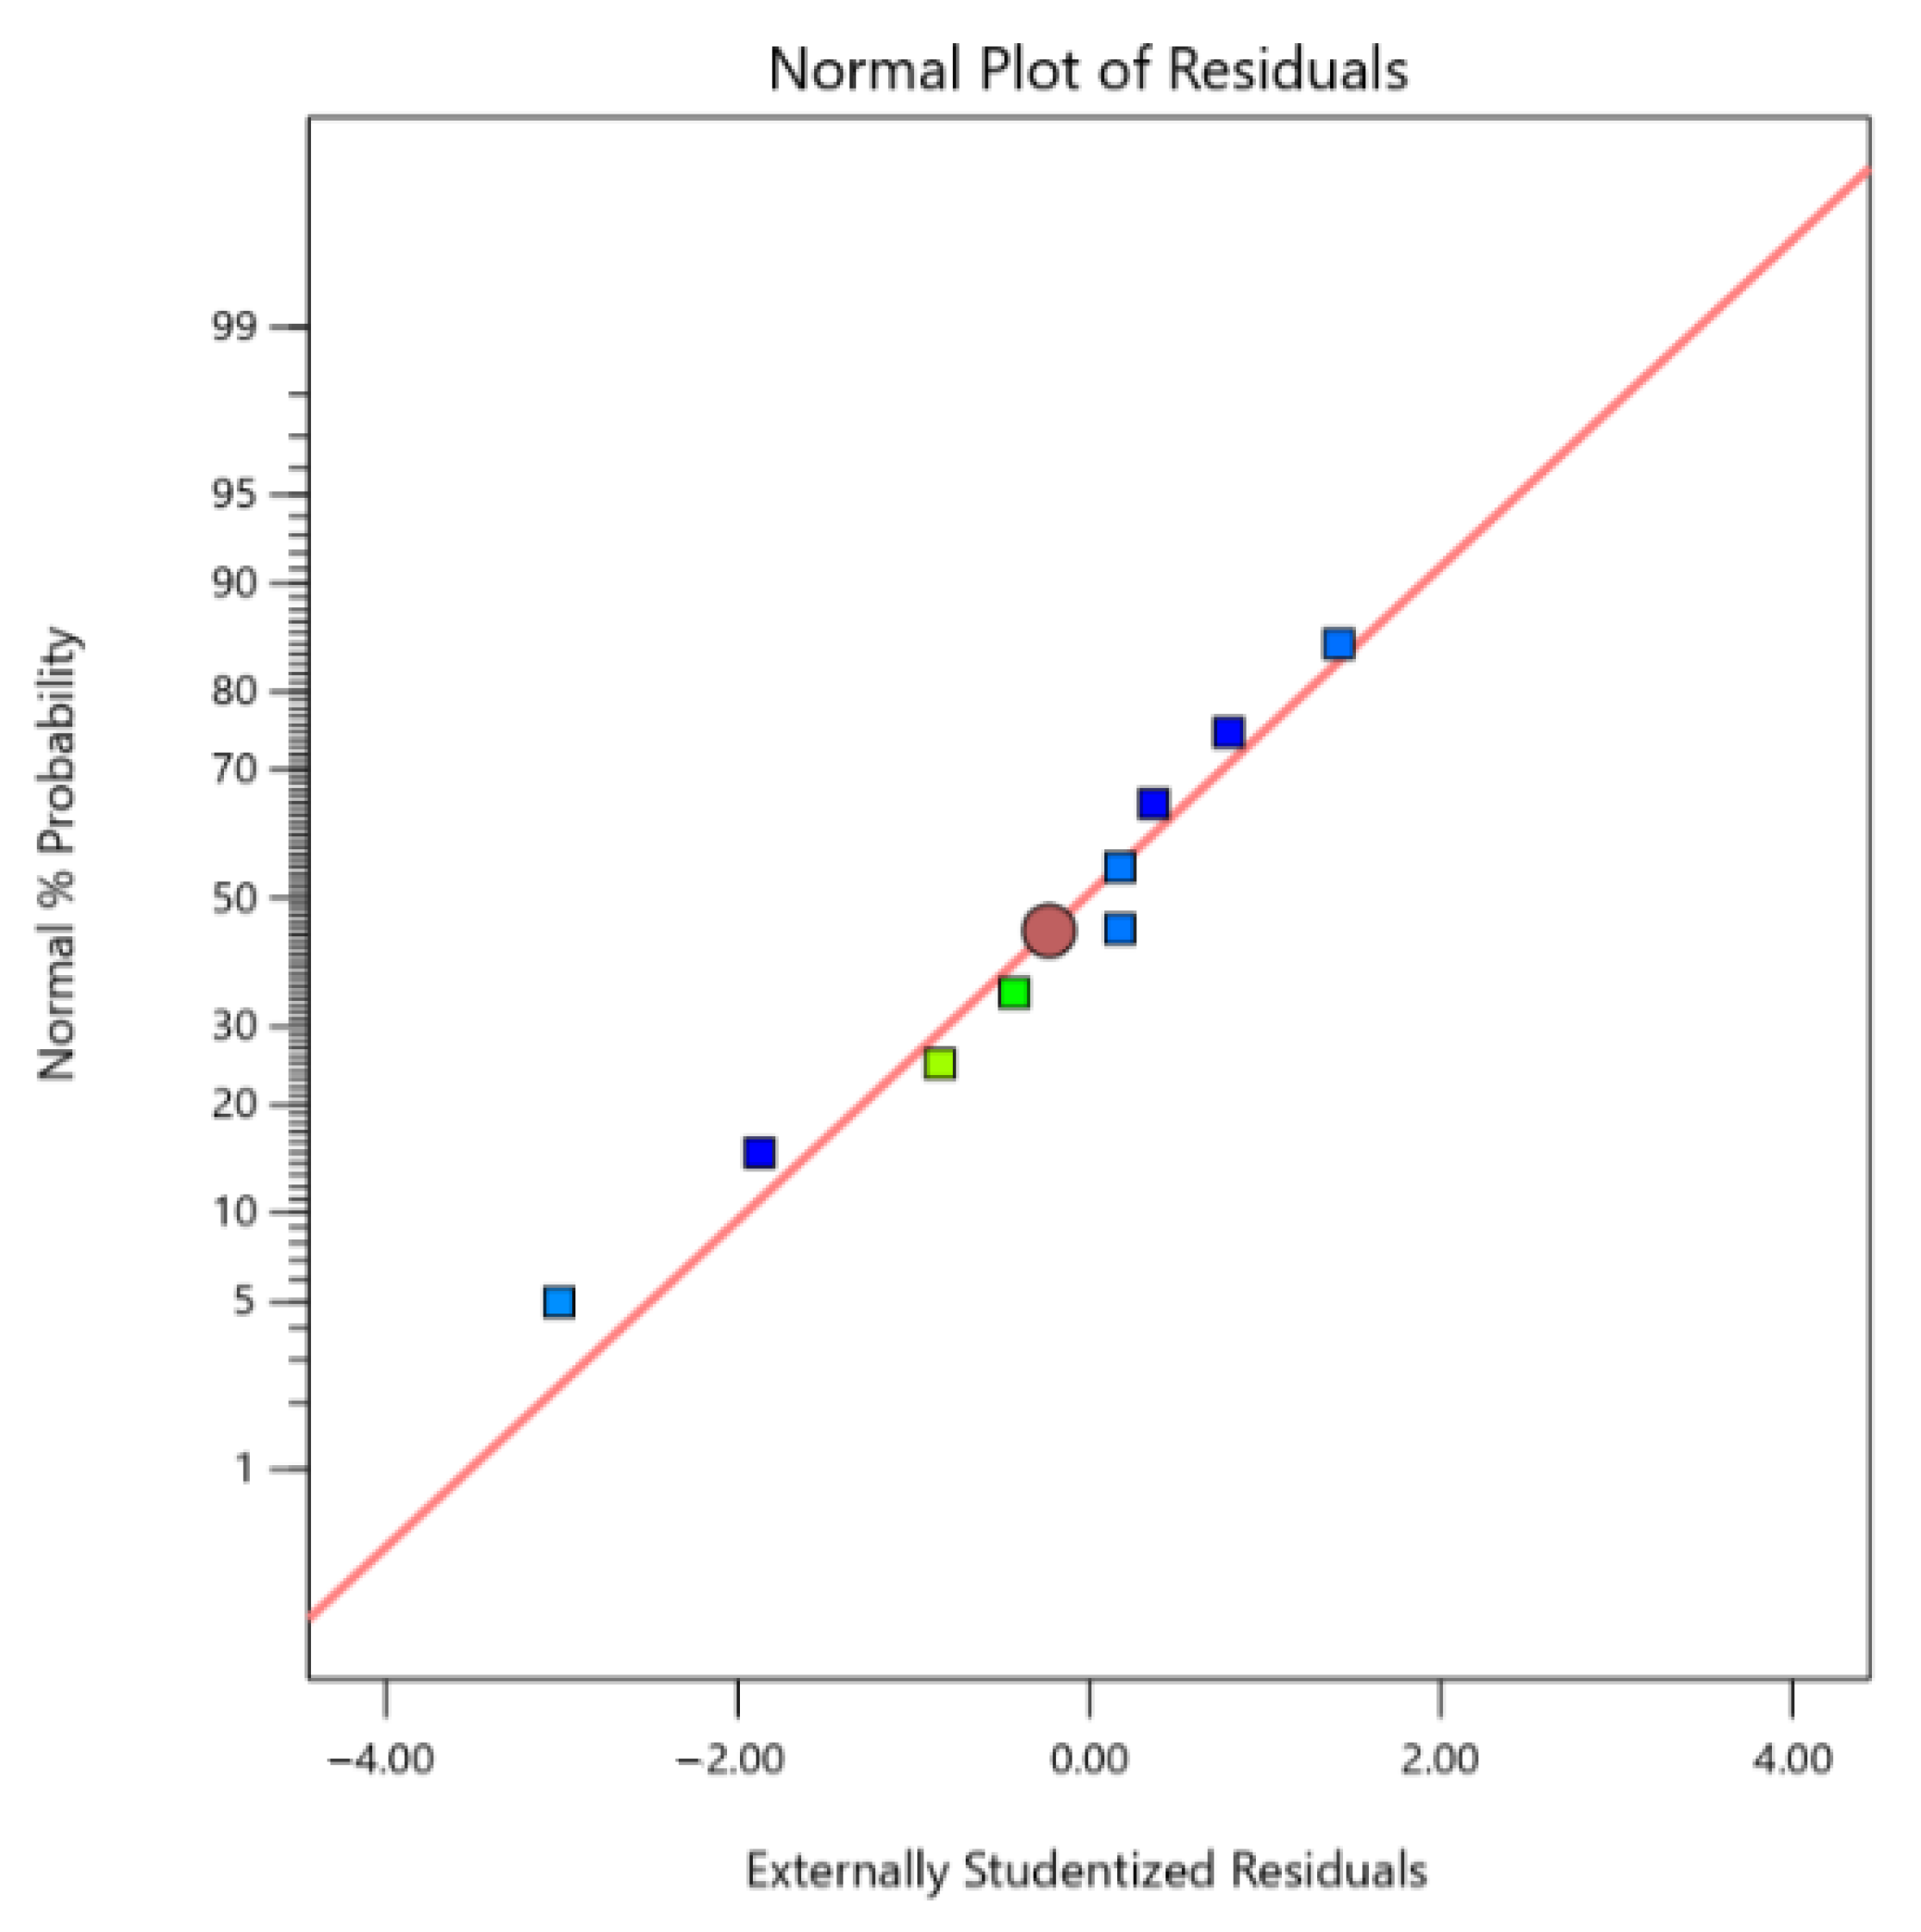
To assess the model’s appropriateness, the final step involves scrutinizing residuals for any irregularities. In essence, the disparities (residues) between the experimental data and the computed model are examined to distinguish whether the residuals represent mere noise or if there are discernible patterns.
Figure 5 illustrates the normal probability plotted against external studentized residuals. Externally studentized residuals are particularly useful for identifying influential observations and outliers that might not be apparent when considering the dataset as a whole. This method allows for assessing the impact of each data point on the model. The process of studentization is pivotal for accurately estimating residuals and adjusting for varying leverage in design points. If the residuals conform to a normal distribution, they should align with the red line. As seen in
Figure 5, the model behaves as expected for a normal plot of residuals, reaffirming the assumption of normality.
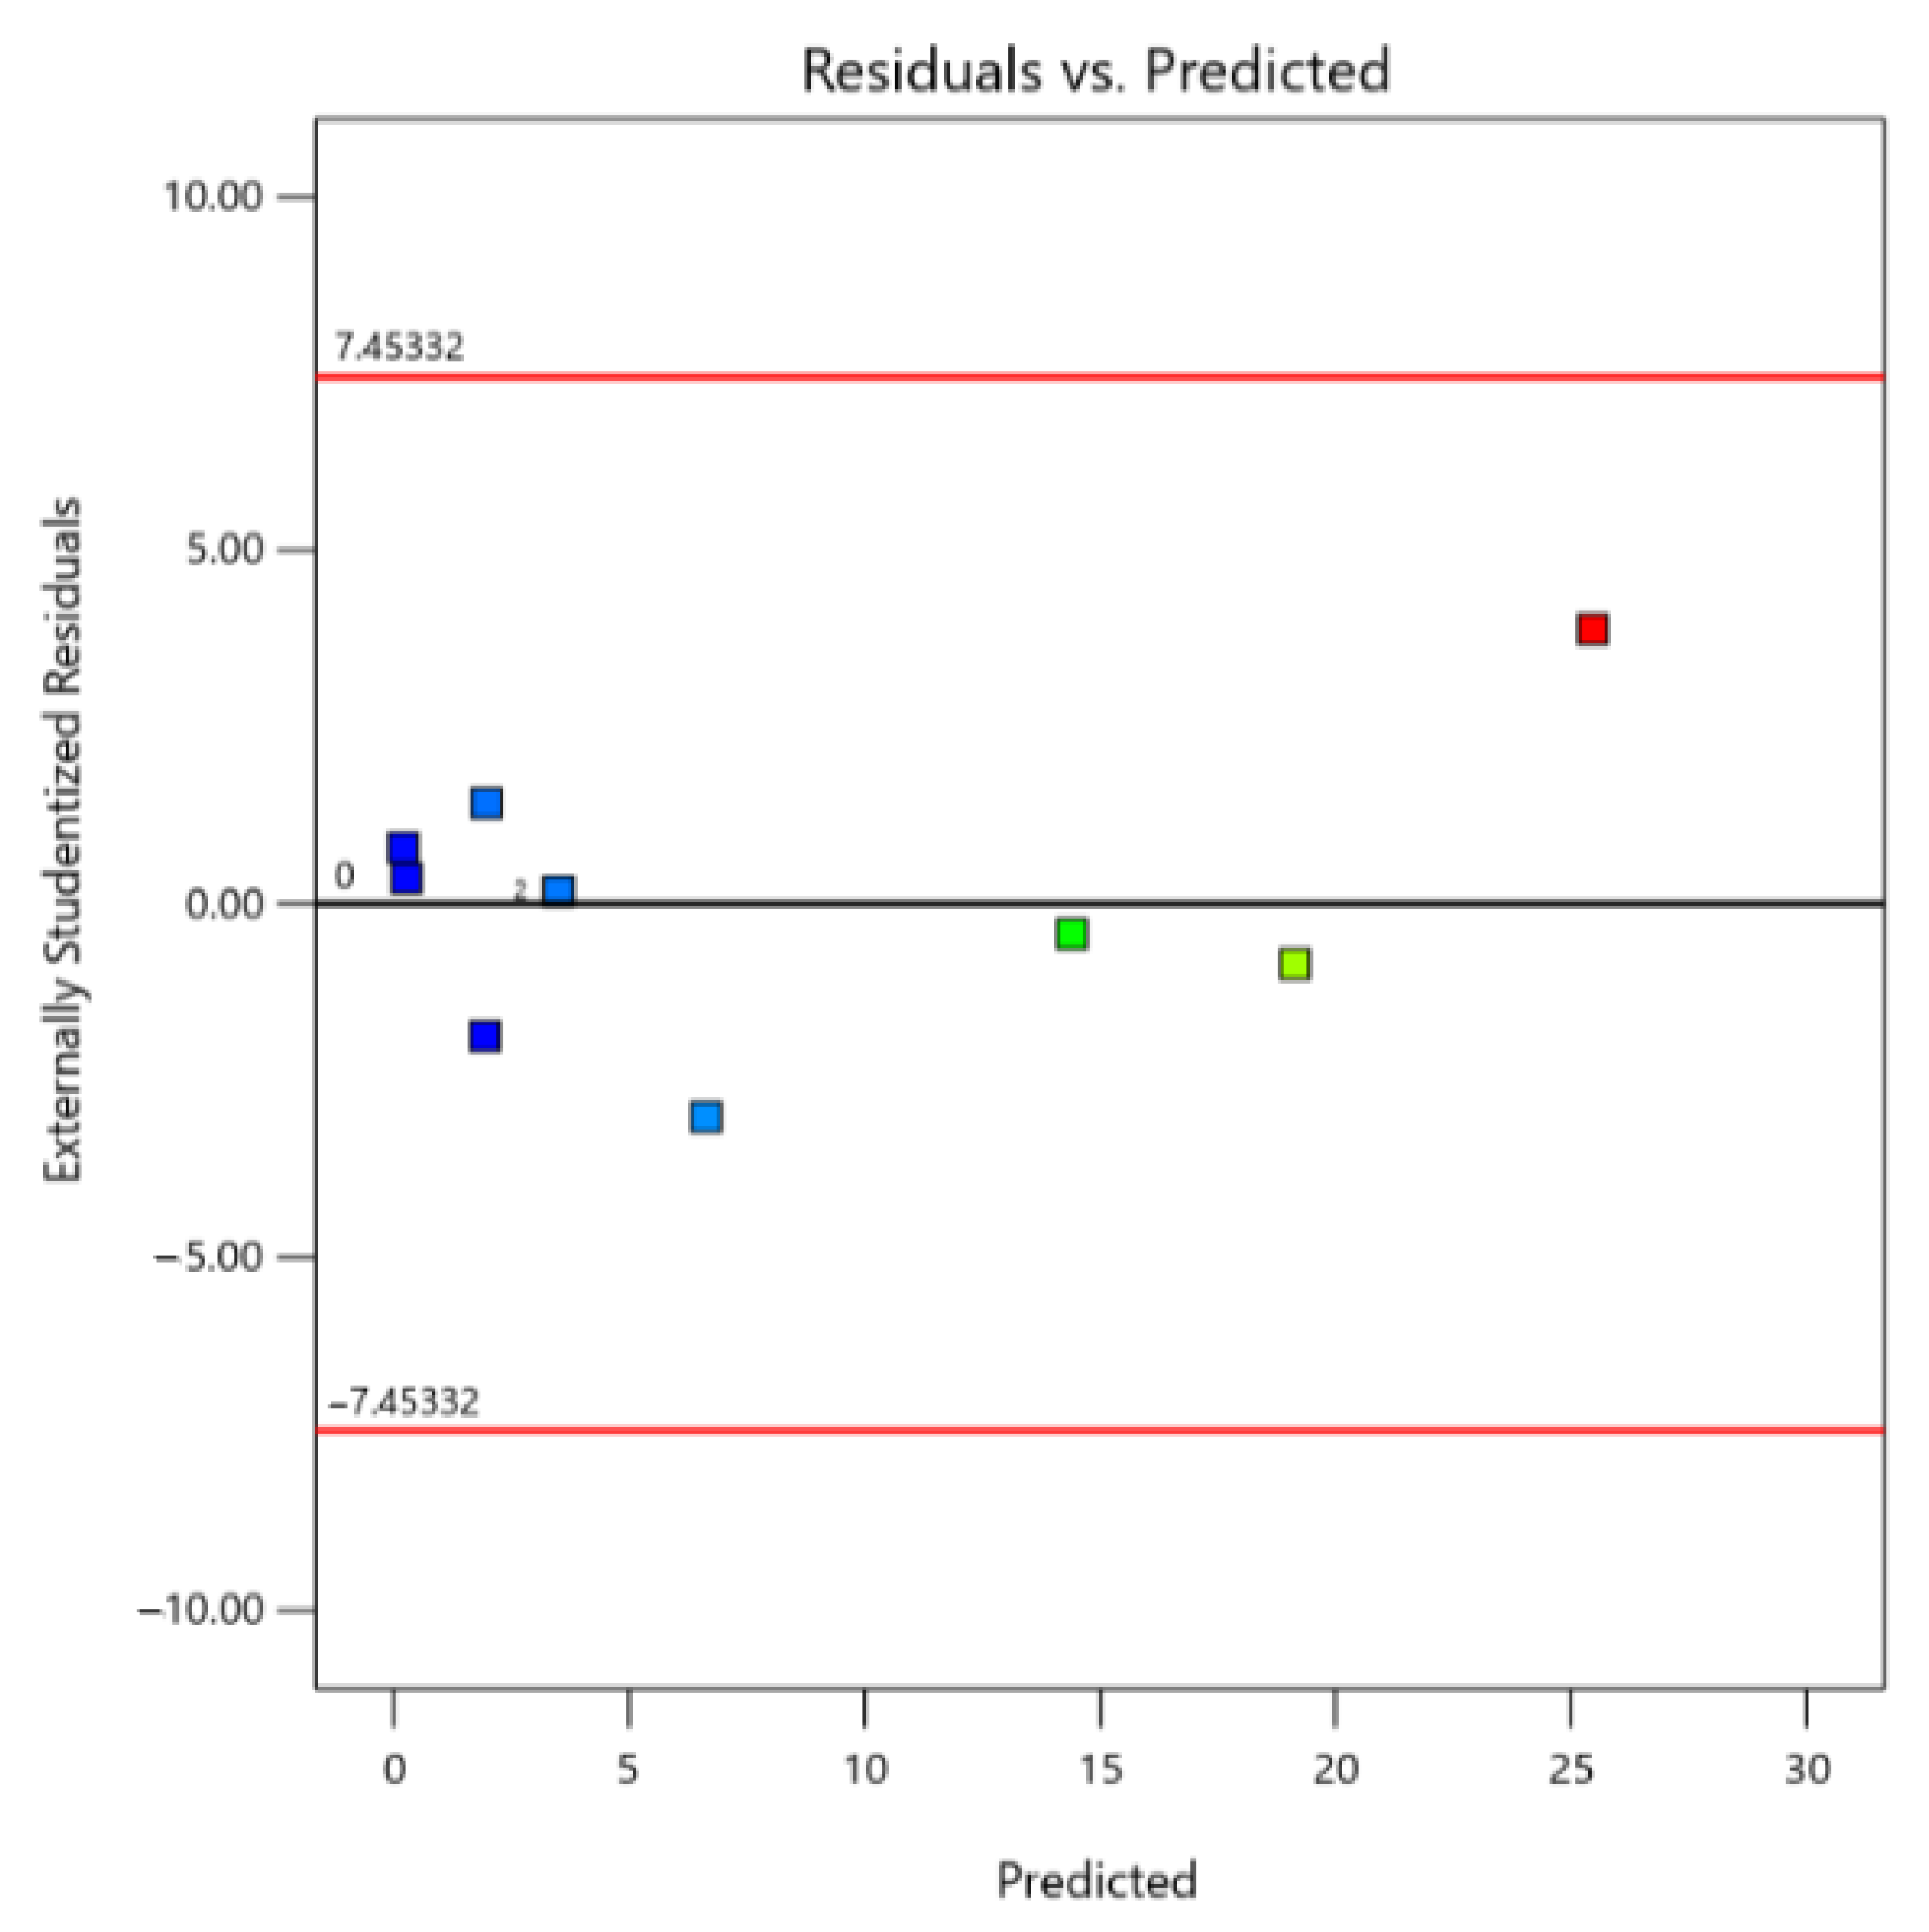
Additionally, a highly beneficial diagnostic tool involves plotting the residuals against the predicted response.
Figure 6 showcases a random scatter, reinforcing the utility of the developed empirical model. Residuals should exhibit a random scatter around zero, suggesting that the model adequately captures the underlying relationships in the data. Moreover, the results suggest that there is no need to contemplate transforming the responses through alternative mathematical functions such as logarithmic or square root transformations. The same procedure was applied to the other responses, all of which exhibited minor deviations from normality and constancy of variance. As a result, they can be deemed suitable for describing the behavior of the respective responses within the experimental design space.
4.3. Single-Response Optimization
Performing a large-scale experimental procedure incurs substantial costs, and when a model can adeptly replicate co-firing responses, it opens avenues for significant cost savings. Concurrently, the model helps circumvent logistical challenges associated with experimental work. Despite its predictive capability, CFD models fall short in straightforwardly determining the optimal operating conditions. To address this limitation, our CFD model was synergistically coupled with an RSM, and nine computer simulations were systematically conducted, wherein variations in air staging and NH3 co-firing ratio were implemented according to a DoE approach while keeping all other parameters constant. For each simulation, responses such as NO, NH3 and CO2 emissions generation were computed. Collating this information, an RSM was employed, fitting the data using the second-order empirical model validation in the previous subsection.
Figure 7a–c show the response contour plots for NO, NH
3 and CO
2 generation, respectively, as a function of the most significant factors (air staging and NH
3 co-firing ratio) after running an optimization algorithm for a single response.
The significant impact of air staging on NO emissions, as demonstrated in
Figure 7a, corroborates the recognized efficacy of air staging in NO control. The observed rapid 50% reduction in NO emissions at a 20% staged airflow is in line with reported mitigation ranges in the literature [
31]. The fuel-rich/O
2-lean conditions induced by air staging inhibit NO formation through NH
3+O
2 reactions, showcasing the higher the air staging level, the smaller the fuel-NH
3 fraction converted into NO. The elongated reduction zone upstream of the second airflow inlet, created by air staging, allows more time for the NH
3 combustion reaction to occur, further reducing NO yield [
6].
In
Figure 7b, the NH
3 generation reveals a maximum response of around 25 ppm at a 40% NH
3 co-firing ratio and 0% air staging. This configuration corresponds to the absence of air staging, emphasizing the specific conditions under which optimal NH
3 generation is achieved. As the NH
3 co-firing ratio increases, there is a gradual rise in the amount of unreacted NH
3. While the NH
3 co-firing ratio yielding the lowest NO emissions coincides with this relatively high NH
3 co-firing ratio, it introduces challenges related to NH
3 slip. Increasing NH
3 injection may offer benefits in NO reduction, but it simultaneously elevates the risk of unburned NH
3. Achieving a balance in the NH
3/NO ratio is imperative to enhance NH
3 reactivity and consequently diminish NH
3 slip in the unburned streams. This delicate equilibrium is vital for optimizing both NO reduction and NH
3 combustion efficiency [
32].
In
Figure 7c, the observed trends in CO
2 generation with varying NH
3 co-firing ratios align with established literature, corroborating the effectiveness of NH
3 injection for CO
2 reduction, as increased NH
3 co-firing ratio leads to a discernible decrease in CO
2 emissions. This aligns with the premise that NH
3, being devoid of carbon, replaces coal in combustion, directly reducing CO
2 emissions. Furthermore, NH
3 injection inhibits CO oxidation to CO
2, emphasizing its dual role in emission reduction [
6,
13].
4.4. Desirability Function
The previous analysis was performed considering a single response. However, co-firing processes require the ability to lead with several restrictions and multiple goals. Usually, a balance must be struck between yields, energy savings, or other desired outcomes. To address multiple goals, it is necessary to consolidate them into a unified function, commonly known as an objective function. Derringer and Suich [
33] propose employing the desirability concept to assess the success of combining multiple responses. The desirability (
D) can be computed using the following formula:
where
represents the desirability of each response and
is the overall desirability ranging from 0 to 1 (with 1 indicating the most desirable condition). Before computing desirability values, specific goals for each selected response (maximize, minimize, bounded within certain values, or equal to a fixed value) need to be defined, along with assigning different weights if certain variables are more critical than others.
Table 8 outlines the goals for each response under various simulation scenarios, based on typical operational responses while maintaining the goal of minimizing NO, NH
3 and CO
2 emissions generation [
6,
12].
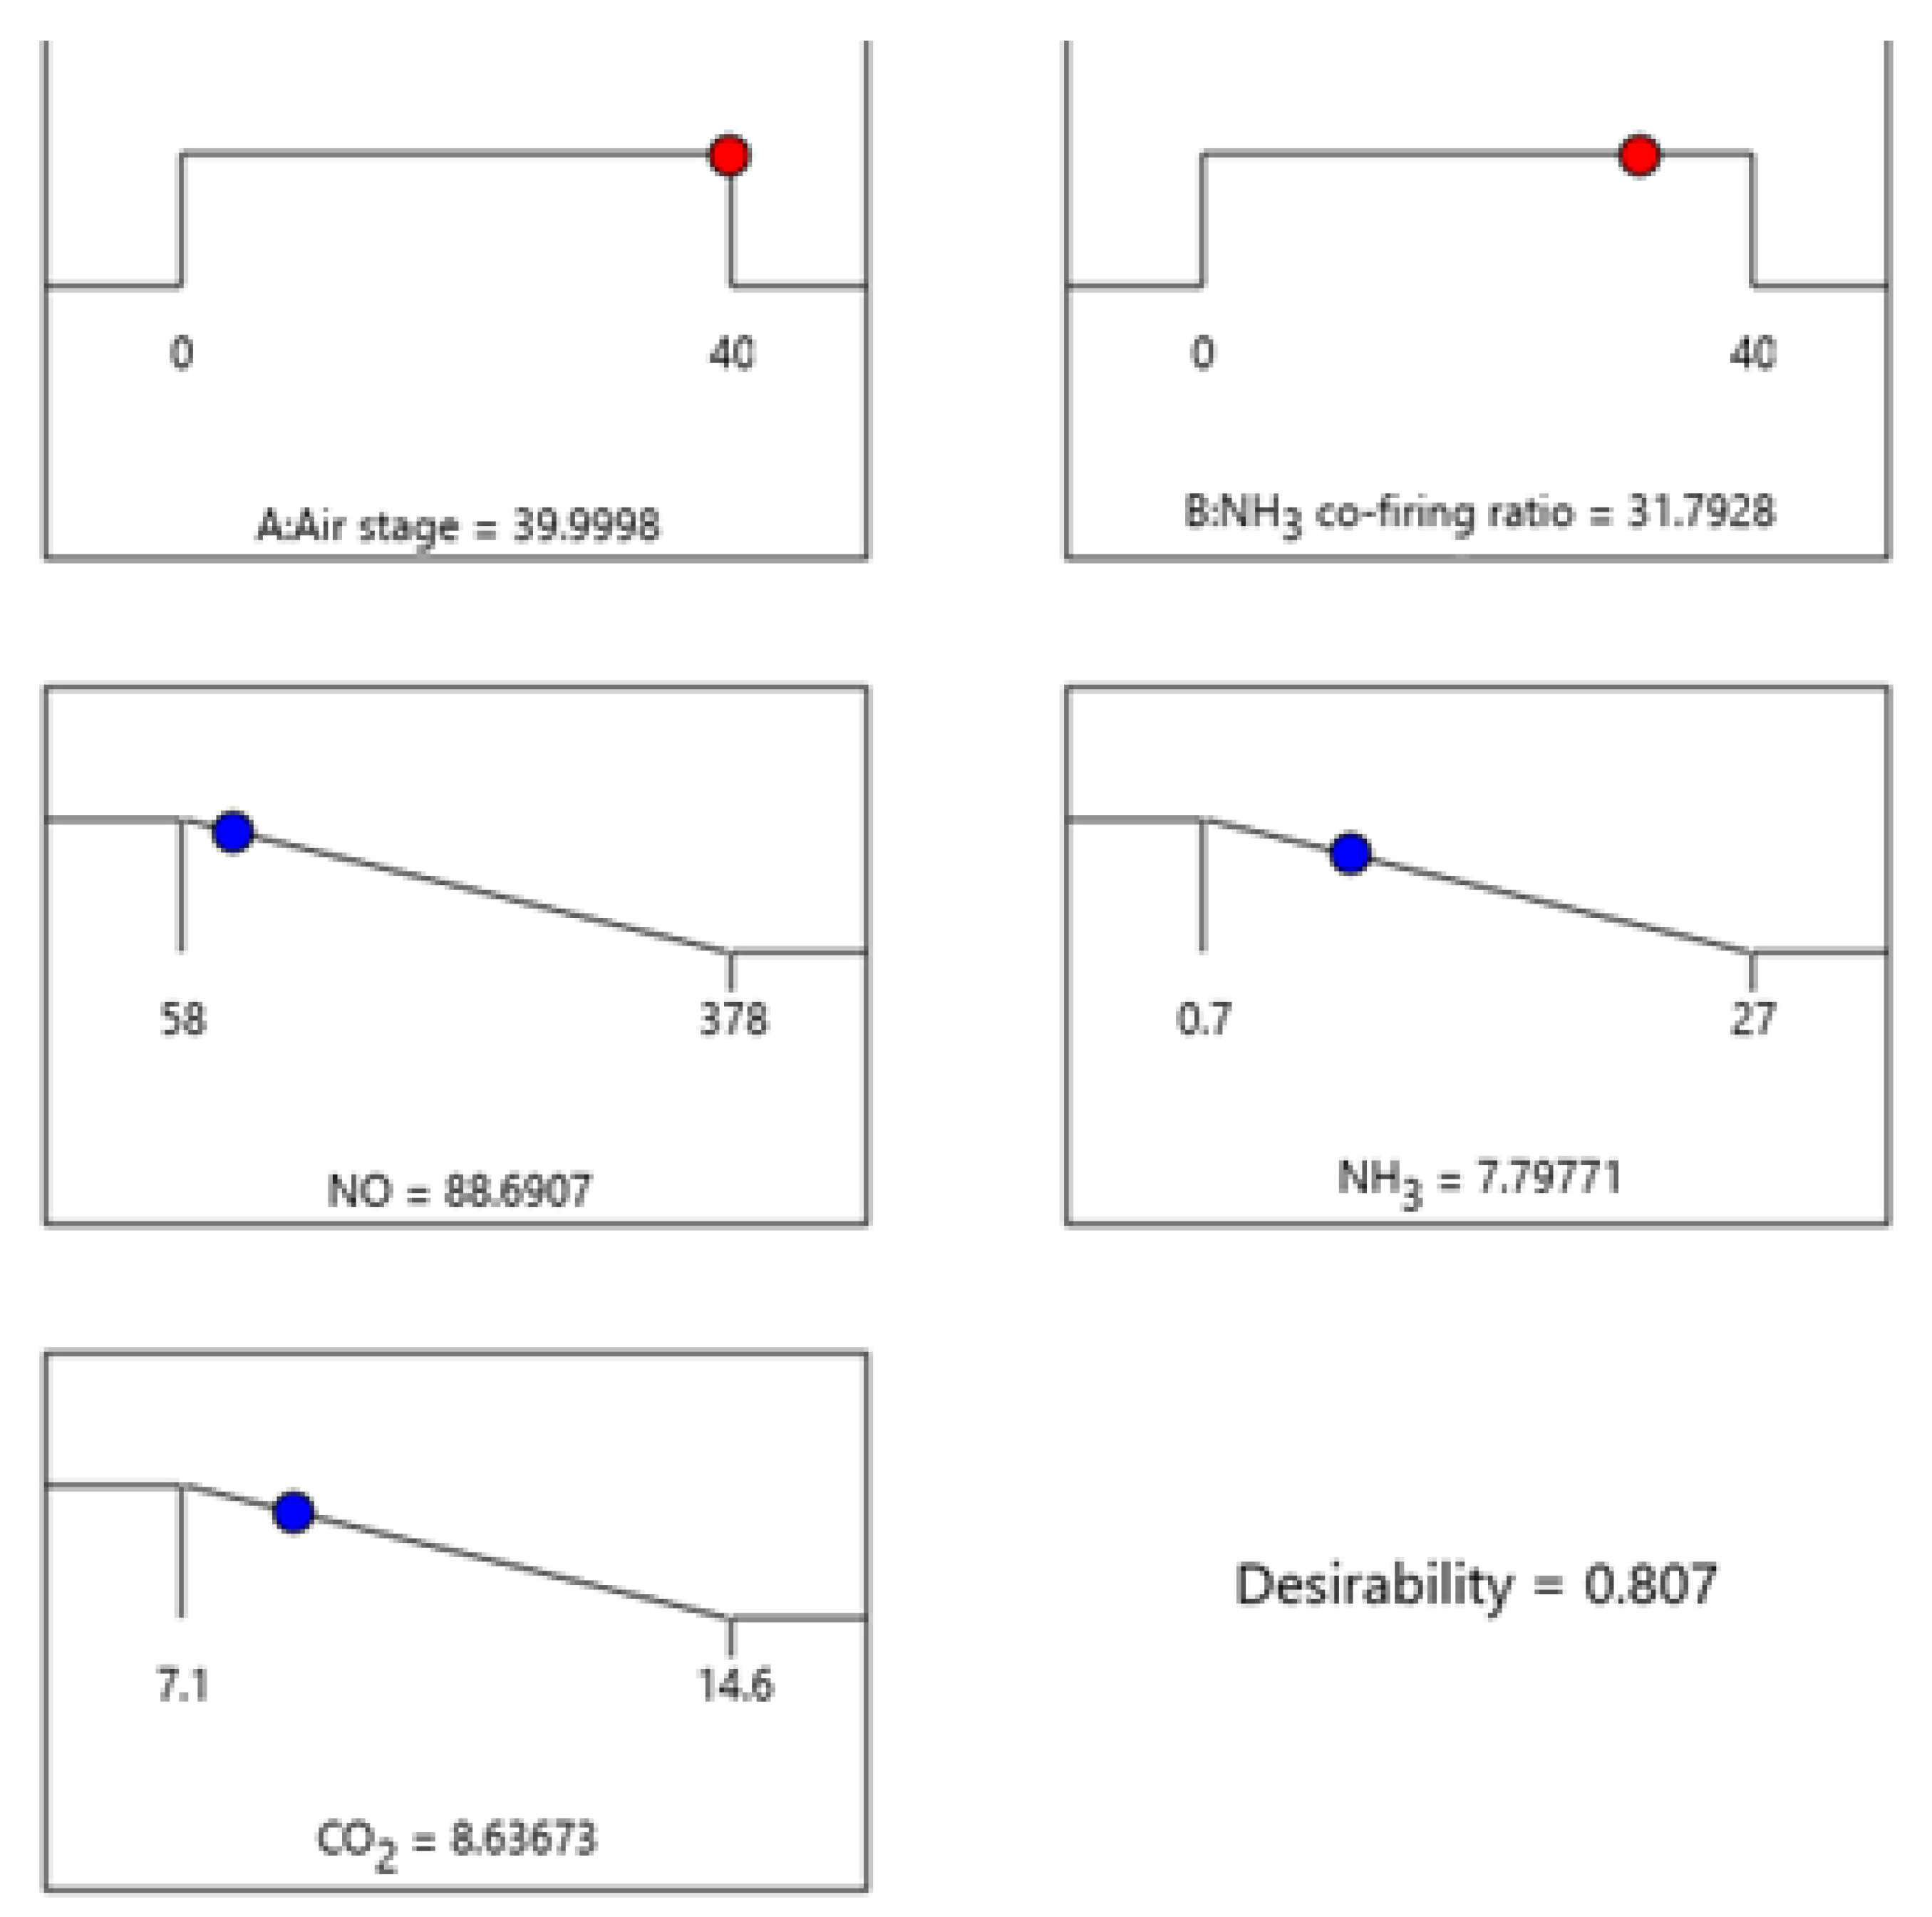
Figure 8 illustrates the optimal operating conditions and response values derived from a comprehensive analysis of five different responses. Here, the dot on each ramp function graph indicates the optimal level of the parameter. According to the results, to minimize NO, NH
3 and CO
2 emissions, air staging should be kept close to 40% and NH
3 co-firing ratio around 32% (the numbers below the ramp graphs refer to the dot position in the ramp). Here, a desirability value of 0.807 suggests that the corresponding operating condition or response is relatively close to the target or optimal value. In this purview, the desirability analysis considers the intricate interplay between air staging and NH
3 co-firing ratio, meeting the trends derived from previous findings [
2,
6,
13,
34]. Previous studies reveal that NH
3 co-firing can significantly reduce CO
2 emissions by up to 26%. Notably, the desirability analysis emphasizes maintaining an NH
3 co-firing ratio close to 32%, aligning with the observed trend of gradually decreasing NO emissions by up to 40% within the 20–80% NH
3 co-firing ratio range. This underscores the pivotal role of the NH
3 co-firing ratio in achieving optimal emissions reduction. Simultaneously, the desirability analysis underscores the importance of air staging, corroborating earlier findings that a 20% air staging alone resulted in a 50% reduction in NO emissions. The recommended air stage of approximately 40% signifies the critical influence of controlled air injection on minimizing NO emissions. Altogether, the desirability analysis offers a systematic approach, balancing the NH
3 co-firing ratio and air staging, to achieve a desirable and environmentally friendly operational range for ammonia–coal co-firing processes.
Indeed, this methodology proves crucial for assessing co-firing processes where tailoring responses based on changing input conditions becomes essential. In complex systems like co-firing processes, where various factors and responses need to be considered simultaneously, desirability offers a systematic approach to balance conflicting goals and find a compromise solution. The desirability function allows researchers and engineers to evaluate and compare different sets of operational parameters, considering trade-offs and finding an optimal operating point that aligns with multiple performance criteria. Notably, the optimal operating conditions differ from those obtained through single-response optimization, showcasing the adaptability and versatility of this approach. The weighting given to each variable is contingent upon the researcher’s objectives. In this instance, we simulated a scenario to illustrate the method’s practical utility.
4.5. Robust Operating Conditions
In the context of optimizing ammonia–coal co-firing processes, a robust analysis of operating conditions was conducted to address uncertainties and enhance system stability. Following the initial single optimization, where the desired operational target range was established for optimal responses, a concern arose regarding potential acute response peaks within the optimal conditions. To address this, a robust optimization approach was employed, integrating the PoE method. PoE methods aim to identify factor settings that minimize the transmission of variation from factors not entirely under control to the response. Optimal settings, reducing the transmission of variation, enhance the robustness of the process against fluctuations in input factors. Essentially, PoE methods utilize partial derivatives to identify regions of low slope on the response surface. To implement PoE techniques, two key components are necessary: a second-order hierarchical response surface model and estimated standard deviations for the numerical factors [
34].
In the PoE analysis, uncertainties in the optimization data were considered by assessing the robustness of the selected operating conditions to variations in input factors. The PoE method quantifies the propagation of uncertainties through the system and provides valuable insights into the stability of optimal conditions. The PoE method is also known for being particularly adept at systematically accounting for error propagation and uncertainty in a deterministic manner [
34]. For the PoE analysis, error propagation was computed based on a standard deviation of 2 for the selected input factors. To effectively govern the system, meticulous control over input errors is paramount, as these errors serve as the conduits for variation. It is imperative to emphasize that maintaining precision in the input leads to reduced uncertainty in the outcomes. Nevertheless, this pursuit of precision comes with associated costs, such as investment in more sophisticated equipment and resources. Importantly, the extent of control over factors directly influences the transmitted variation. The data source considered was obtained from the historical data gathered from previous ammonia–coal co-firing works [
2,
6,
13].
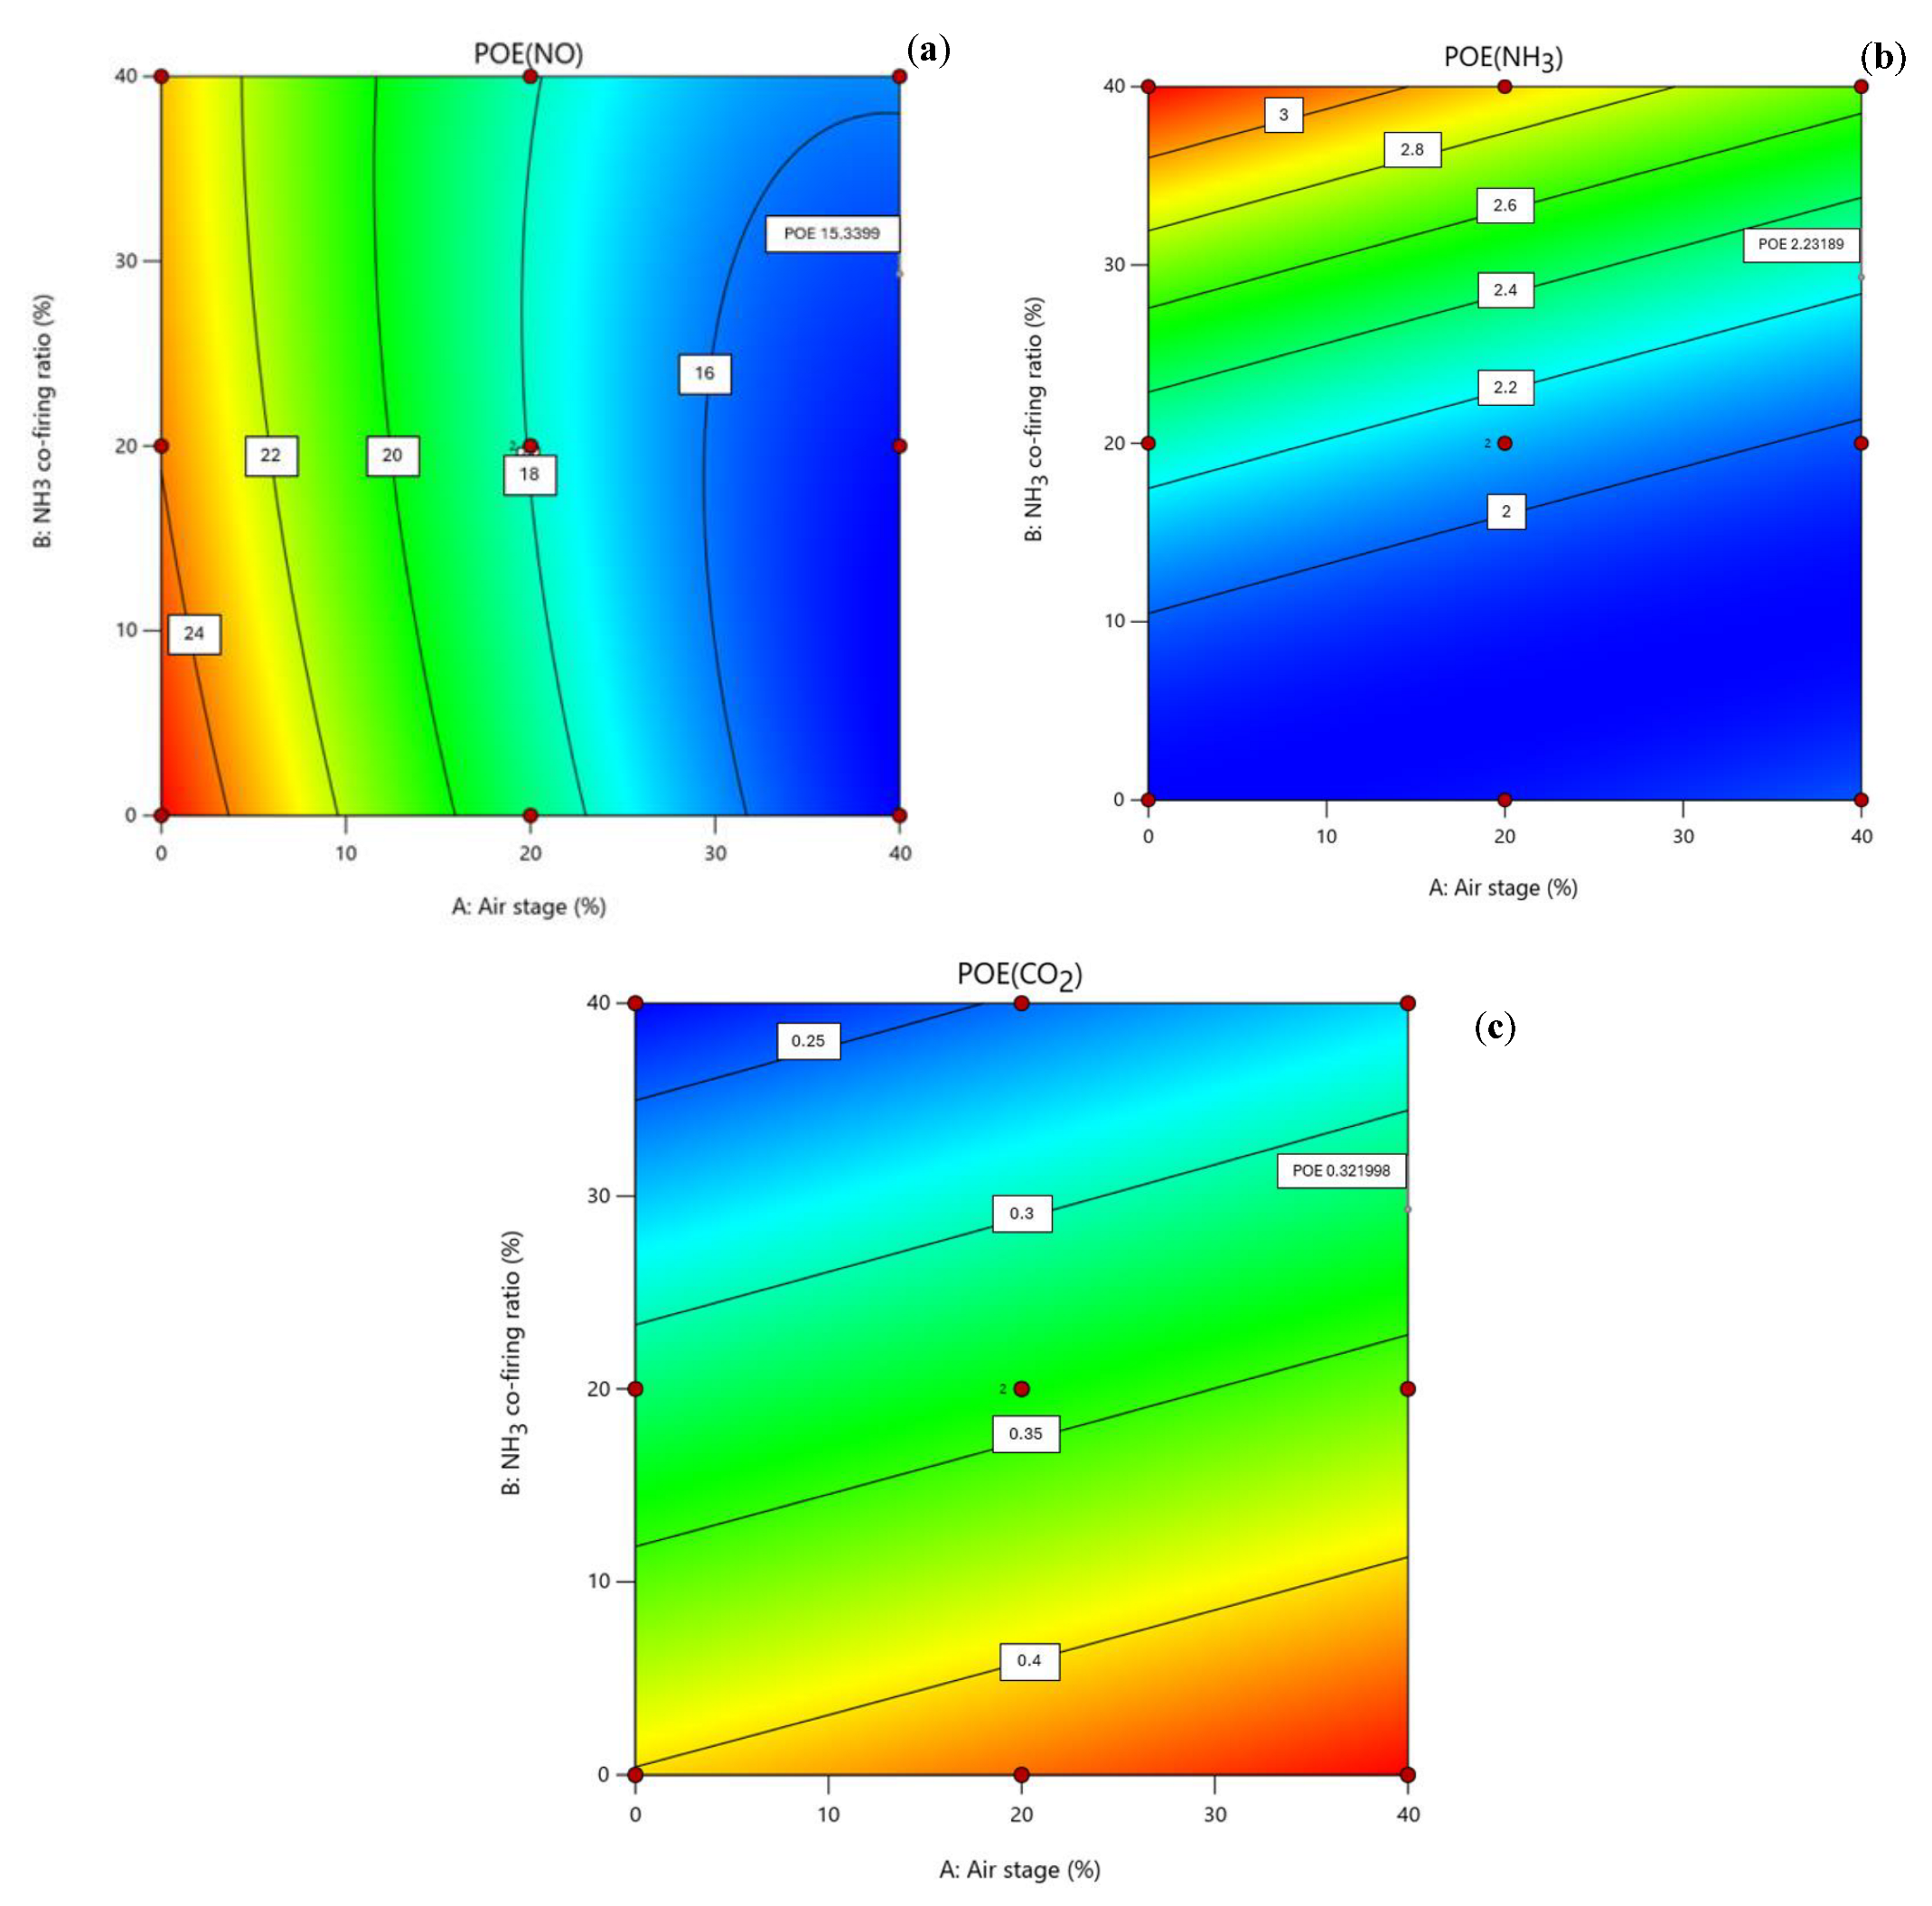
Figure 9a–c present the PoE contour plots for NO, NH
3, and CO
2 generation (in optimal conditions), respectively, as a function of their input factors (air staging and NH
3 co-firing ratio). These contour plots combine the optimization procedure with the robust conditions and depict the most stable operating conditions to reach the utmost performance of the NO, NH
3, and CO
2 response by providing the operating range that minimizes the variation transmitted to the response from the input factor. PoE contour plots offer insightful perspectives on the sensitivity and robustness of the ammonia–coal co-firing system concerning NO, NH
3, and CO
2 generation at optimal conditions, considering variations in air staging and NH
3 co-firing ratio. For NO generation (
Figure 9a), the smallest PoE measured at higher air staging and lower NH
3 co-firing ratio indicates a more stable and robust operating region for minimizing NO emissions. As for the substantial PoE observed for lower air staging and NH
3 co-firing ratio, these suggest heightened sensitivity and uncertainty in NO emissions within these parameter ranges.
For NH
3 generation (
Figure 9b), the smallest PoE spans the entire air staging range (0% to 40%). underscoring a relatively stable operating region for minimizing NH
3 emissions. As expected, the lowest PoE point occurs at 40% air staging and 0% NH
3 co-firing ratio, representing an exceptionally robust condition for NH
3 reduction.
Turning to CO
2 generation (
Figure 9c), the largest PoE sets around 40% air staging and 0% NH
3 co-firing ratio, suggesting heightened sensitivity in CO
2 emissions within this parameter space. Conversely, the smallest PoE is found for air staging around 0% and a 40% NH
3 co-firing ratio, highlighting a stable region for minimizing CO
2 emissions.
In summary, the PoE contour plots reinforce the importance of specific operating conditions for maximum performance, particularly concerning high air staging levels (40%) and the balance of NH3 co-firing ratio (around 30%), for achieving robust and stable performance in terms of NO, NH3, and CO2 emissions generation during ammonia–coal co-firing processes.
Regrettably, and in general, the setting of factors that meet the maximum response in the single-response optimization does not correspond to the minimum PoE. However, this challenge inherent in multi-optimization scenarios can be effectively addressed by applying the desirability function. Through the desirability function, it is possible to identify conditions where the response is maximized while concurrently minimizing the PoE. This approach offers a practical solution to reconcile the dual objectives of maximizing the response and minimizing uncertainty, providing a more robust and balanced optimization strategy.
Additionally, from
Figure 9a–c, it can be observed that combining the optimization procedure with robust conditions implies a decrease in NO generation from 88 ppm to about 15 ppm compared to the desirability function. Identical trends apply to NH
3 and CO
2 generation. Naturally, other results can be obtained if different weights are considered for each of the studied responses. Furthermore, given that this approach relies on numerical methodologies, it becomes plausible to achieve comparable results by considering an alternative set of factors. Integrating such insights with the accumulated experience of operating a gasifier enables the formulation of reliable and intelligent decisions that cater to a diverse range of objectives.
