Article

Geochemical Characteristics of the Paleozoic Marine Source Rocks and Ultra-Deep Hydrocarbon Accumulation Mode of the Awati Sag

1
National Key Laboratory of Petroleum Resources and Engineering, China University of Petroleum (Beijing), Beijing 102249, China
2
College of Geosciences, China University of Petroleum (Beijing), Beijing 102249, China
3
Oil & Gas Survey, China Geological Survey, Beijing 100083, China
*
Authors to whom correspondence should be addressed.
Energies 2024, 17(9), 2124; https://doi.org/10.3390/en17092124
Submission received: 7 March 2024 / Revised: 15 April 2024 / Accepted: 16 April 2024 / Published: 29 April 2024
(This article belongs to the Section H: Geo-Energy)

Abstract

:
The Lower Paleozoic of the Awati Sag and its periphery is a region with relatively low levels of exploration and stands as a frontier for ultra-deep hydrocarbon exploration. Based on outcrop and core samples, this study integrated organic geochemical analysis, total organic carbon (TOC) logging interpretation, and one-dimensional and two-dimensional hydrocarbon accumulation simulations, to clarify the primary source rock of the Lower Paleozoic and its characteristics, as well as its hydrocarbon accumulation mode. The findings indicate the following: (1) The Lower Paleozoic features two sets of industrial source rocks. The Yuertusi Formation, with its considerable thickness (approximately 200 m), widespread distribution, and elevated TOC (averaging approximately 5% from experimental data and logging interpretation), stands out as the Lower Paleozoic’s most pivotal source rock. (2) The Yuertusi and Saergan Formations are in a high-to-over-mature stage, with the Yuertusi initiating oil generation in the early Silurian and transitioning to gas by the late Permian. The Saergan began producing oil in the Carboniferous, followed by gas in the late Permian. (3) The potential ultra-deep gas reservoirs in the Awati Sag are mainly distributed in the structural traps closer to the deep faults in five potential target formations. Deep natural gas typically exhibits mixed-source signatures, with the mixing notably pronounced along the Shajingzi Fault Belt due to influential basin-controlling faults.

1. Introduction

By 2023, China’s external oil dependency was forecasted to hit 72.99% [1]. This trend has propelled hydrocarbon exploration in deep water and deep earth to the forefront of the oil and gas industry [1,2,3]. Over the last decade, China has markedly advanced in deep (>6000 m) oil and gas exploration [4,5]. By the close of 2022, China had drilled ultra-deep wells in 11 onshore hydrocarbon-rich basins [3]. The Tarim Basin, a frontier in China’s ultra-deep exploration, has yielded several billion-ton oil fields, such as the Fuman, Tazhong, and Shunnan–Shunbei, and several trillion-cubic-meter gas fields in the Kuche Depression, including Keshen and Bozi–Dabei. These exploration milestones underscore the significant potential in the Tarim Basin for deep oil and gas resource development.
The Tarim Basin is a superimposed basin composed of the Paleozoic Kraton Basin and the overlaying Mesozoic and Cenozoic foreland basins. Mesozoic and Cenozoic ultra-deep oil and gas resources are predominantly found in the Kuqa foreland basin, while Paleozoic resources are concentrated in the platform–basin areas of the Tarim Basin’s hinterland. The platform–basin areas include the Tabei Uplift, the Northern Depression, and the Central Uplift Belt. This region is also categorized into the Awati Sag and its surrounding zones to the west and the Manjiaer Sag area with its peripheries in the east–central sector. In sharp contrast, significant hydrocarbon reserves have been established around the Manggar Sag, yet the Awati Sag has yielded few substantial findings. Remarkably, the Keping Fault Uplift, located at the northwest edge of the Awati Sag, has experienced few oil and gas discoveries.
The deep oil and gas exploration in the Wensu Uplift (part of the Keping Fault Uplift) commenced in the 1960s. The widely observed Silurian asphaltic sandstone in outcrops and the SL-1 Well (1993) indicated potential exploration value in the Lower Paleozoic. Yet, by early 2017, there had been no breakthroughs despite the Wensu Uplift’s proximity to three hydrocarbon-generating sags: Wush, Baicheng, and Awati. In 2017, the XWD-1 and XWD-2 Wells achieved high-yield industrial oil flows, marking the first significant exploration success in the region in over 50 years. However, the target layer was the Neogene Jidike Formation, not an ultra-deep layer. In 2018, the XSD-1 Well, located in the Shajingzi Fault Zone adjacent to the Awati Sag, pioneered obtaining industrial gas flow from the Silurian strata of the northwest Tarim Basin. Subsequently, the XSC-1 Well was also a substantial exploration success in the Silurian Kepingtage Formation, yielding an industrial gas flow of 5300 cubic meters daily from a tested interval of five meters [6]. In 2019, the Jingneng Group’s KT-1 Well achieved a significant milestone, producing 1.04 million cubic meters of gas per day from the Cambrian inter-salt Wusonger Formation, although the cumulative reservoir thickness was limited. Conversely, the much thicker Xiaoerbulake Formation below the salt layer yielded no discoveries. After that, the KPN-1 Well’s discovery of oil and gas across 25 layers in the Cambrian Xiaoerbulake Formation fully validated the potential for hydrocarbon reserves below the Cambrian salt in the Keping Fault Uplift.
Exploration breakthroughs in ultra-deep hydrocarbon exploration at the northwest edges of the Awati Sag have led to the emergence of three pivotal scientific questions: 1. What constitutes the potential source rocks within the Lower Paleozoic, and among these, which are considered the primary set? 2. Are there any effective source rocks within the sag, and if so, what is the extent of their thermal evolution? 3. What hydrocarbon accumulation modes exist in the Awati Sag and its surrounding areas?
To facilitate ultra-deep hydrocarbon exploration in the Awati Sag, we should primarily focus on identifying and evaluating effective source rocks within the hydrocarbon window [3]. The current low level of exploration, marked by an absence of wells that have yielded industrial oil and gas flow [7], complicates this task. Additionally, the deep burial of source rocks, with no wells reaching the Cambrian strata, poses significant challenges in assessing the Lower Paleozoic source rocks in the Awati Sag. Therefore, studies on these source rocks are mainly conducted through exploratory wells and surface outcrops in areas surrounding the Awati Sag.
The recognition of three sets of potential source rocks in the Awati Sag, namely the Saergan and Yingan Formations from the Middle–Upper Ordovician and the Lower Cambrian Yuertusi Formation, underscores the region’s prospectivity for hydrocarbon resources. The interest in the Lower Cambrian Xiaoerbulake Formation, traditionally considered as a reservoir, expands the potential for finding effective source rocks.
The Lower Paleozoic of the Awati Sag is widely acknowledged to encompass three sets of prospective source rocks [7], namely the Saergan and Yingan Formations from the Middle–Upper Ordovician and the Lower Cambrian Yuertusi Formation [8]. In recent years, research has sparked significant interest in determining whether the Lower Cambrian Xiaoerbulake Formation could serve as an effective source rock. This formation, traditionally categorized as a reservoir, has been reassessed by Huang Suwei in 2017 [9]. Based on field outcrop and drilling core observations, and rock pyrolysis analysis, they have posited that the organic carbon content within the Xiaoerbulake Formation meets the criteria for a high-maturity carbonate source rock, thus suggesting its potential as a source rock [10]. However, the definitive role of the Xiaoerbulake Formation as an effective source rock within the study area warrants further investigation.
Among the four sets of potential source rocks, the Lower Cambrian Yuertusi Formation, widely spread within the Awati Sag and its southeastern periphery, is recognized as a high-quality source rock. This formation primarily comprises organic-rich siliceous shale, boasting a notably high total organic carbon (TOC) content, ranging from 1.87% to 22.39% [11,12]. The organic matter in the Yuertusi Formation source rocks is predominantly composed of sapropelite and exinite, with a relatively minor presence of inertinite. Kerogen analysis on core samples from the H4 Well further indicated that the kerogen in the Yuertusi Formation is chiefly II1 type [13]. Regarding kerogen maturity, the Yuertusi source rock in the Awati Sag and its vicinity have attained a high level of maturity [14]. The equivalent vitrinite reflectance (VER) values of the Yuertusi Formation samples from the Xiaoerbulake outcrop range impressively from 2.63% to 2.85%, indicative of an over-mature stage [11]. Comparatively, the vitrinite reflectance (Ro) from the Fang-1 and He-4 Wells is somewhat lower, between 1.39% and 2.06%, with some still categorized as high-maturity [15,16].
The Ordovician Saergan shale exhibits qualities parallel to the Yuertusi shale, distinguishing itself as another high-quality source rock. Specifically, the gray-black shale of the Saergan Formation within the XSD-1 Well is characterized by a rich organic matter content with a TOC value of 6.19% and a remarkable hydrocarbon generation potential (S1 + S2) reaching 16.27 mg/g [15]. Field outcrop sample analyses revealed that the TOC of the Saergan Formation’s black shale spans from 0.65% to 2.83%, with the organic matter predominantly being Type II. Furthermore, VER values range between 1.58% and 1.61%, indicating a high to over-high maturity [15,17]. In terms of distribution, the shales of the Saergan Formation and the tuffs of the Yingan Formation are more confined in scope when compared to the extensive spread of the Yuertusi Formation, largely concentrated in the vicinity of the ShaJingZi Fault Belt [18].
Identifying primary source rocks within the Lower Paleozoic strata of the Tarim Basin—and by extension in the study area—has been an ongoing debate among researchers. According to prior studies, it has been proposed that two sets of primary source rocks exist in the study area, specifically within the Middle–Upper Ordovician and the Lower Cambrian strata [7]. The Middle–Upper Ordovician comprises the Saergan and the Yingan Formations, both of which have been identified as potential source rocks. Likewise, the Lower Cambrian not only includes the well-documented Yuertusi Formation but also encompasses the Xiaoerbulake Formation, which has garnered attention as another potential source rock. Therefore, a comparative analysis of the above four potential source rocks is urgently needed to refine the primary source rocks.
Currently, there are 11 wells drilled into the Cambrian sub-salt layer in the Keping Fault Uplift: KT-1 (Jingneng), KT-1 (CNPC), QT-1, Tong-1, ST-1, XH-1, BY-1, PT-1, XKD-1, XSC-1, and KPN-1. However, these strata remain untapped by drilling within the Awati Sag. This discrepancy hinders direct appraisal of Lower Paleozoic source rocks in the Awati Sag and obfuscates these sources’ hydrocarbon generation and maturation history.
Understanding the hydrocarbon generation and evolution processes of the source rocks within the Awati Sag is crucial for elucidating the stark contrast in hydrocarbon accumulation between the adjacent Awati and Manjiaer Sags. The variance in Lower Paleozoic source rocks’ evolution histories between the sags likely accounts for these differences. In the Late Caledonian, paleo-oil reservoirs widely formed in the Silurian strata in central and northern Tarim, predominantly near the Manjiaer Sag. The Manjiaer Sag was then the main hydrocarbon-generating area. In contrast, due to the shallowness, the lower Paleozoic source rocks of the Awati Sag had not yet reached the oil window. In the following Hercynian (the second stage of oil and gas accumulation in the Tarim Basin), the uplift of Manjiaer and subsidence of Awati shifted the oil-generating epicenter to Awati, dispersing hydrocarbons to its environs.
Indeed, the current understanding is incomplete regarding hydrocarbon generation and evolution within the Awati Sag, and it does not address the absence of large-scale hydrocarbon accumulations in the Keping Fault Uplift, despite its proximity to the Awati Sag. To fill these gaps, an integrated approach combining hydrocarbon evolution simulations with tectonic history is necessary.
In this study, the primary source rock of the Lower Paleozoic and its characteristics were clarified through geochemical analysis based on samples from key exploratory wells and outcrops. Then, based on the 2D seismic interpretation profile from the State Geological Survey, synergistic studies of hydrocarbon generation and evolution and tectonic evolution were carried out by using PetroMod. The aim is to establish a hydrocarbon accumulation mode in the Awati Sag and its periphery, ultimately aiding the search for ultra-deep oil and gas reserves in the Lower Paleozoic.

2. Geologic Background

2.1. Tectonic Background

The Awati Sag, located in the northwestern Tarim Basin, is primarily characterized by Late Paleozoic and Cenozoic deposits. It shares a boundary with the Manjiaer Depression to the east and is delineated by several significant fault lines: the Tumushuke Fault separates it from the Bachu Uplift to the south, the Shajingzi Fault Belt from the Wenshou Uplift and the Keping Fault Uplift to the west, and the Kalayuergun Fault Belt divides it from the Yingmaili Low Uplift to the north (Figure 1). Surrounding the Awati Sag, Lower Paleozoic outcrops are notably developed, particularly highlighted by the Shiairike and Dawangou outcrops.

2.2. Stratigraphic Development

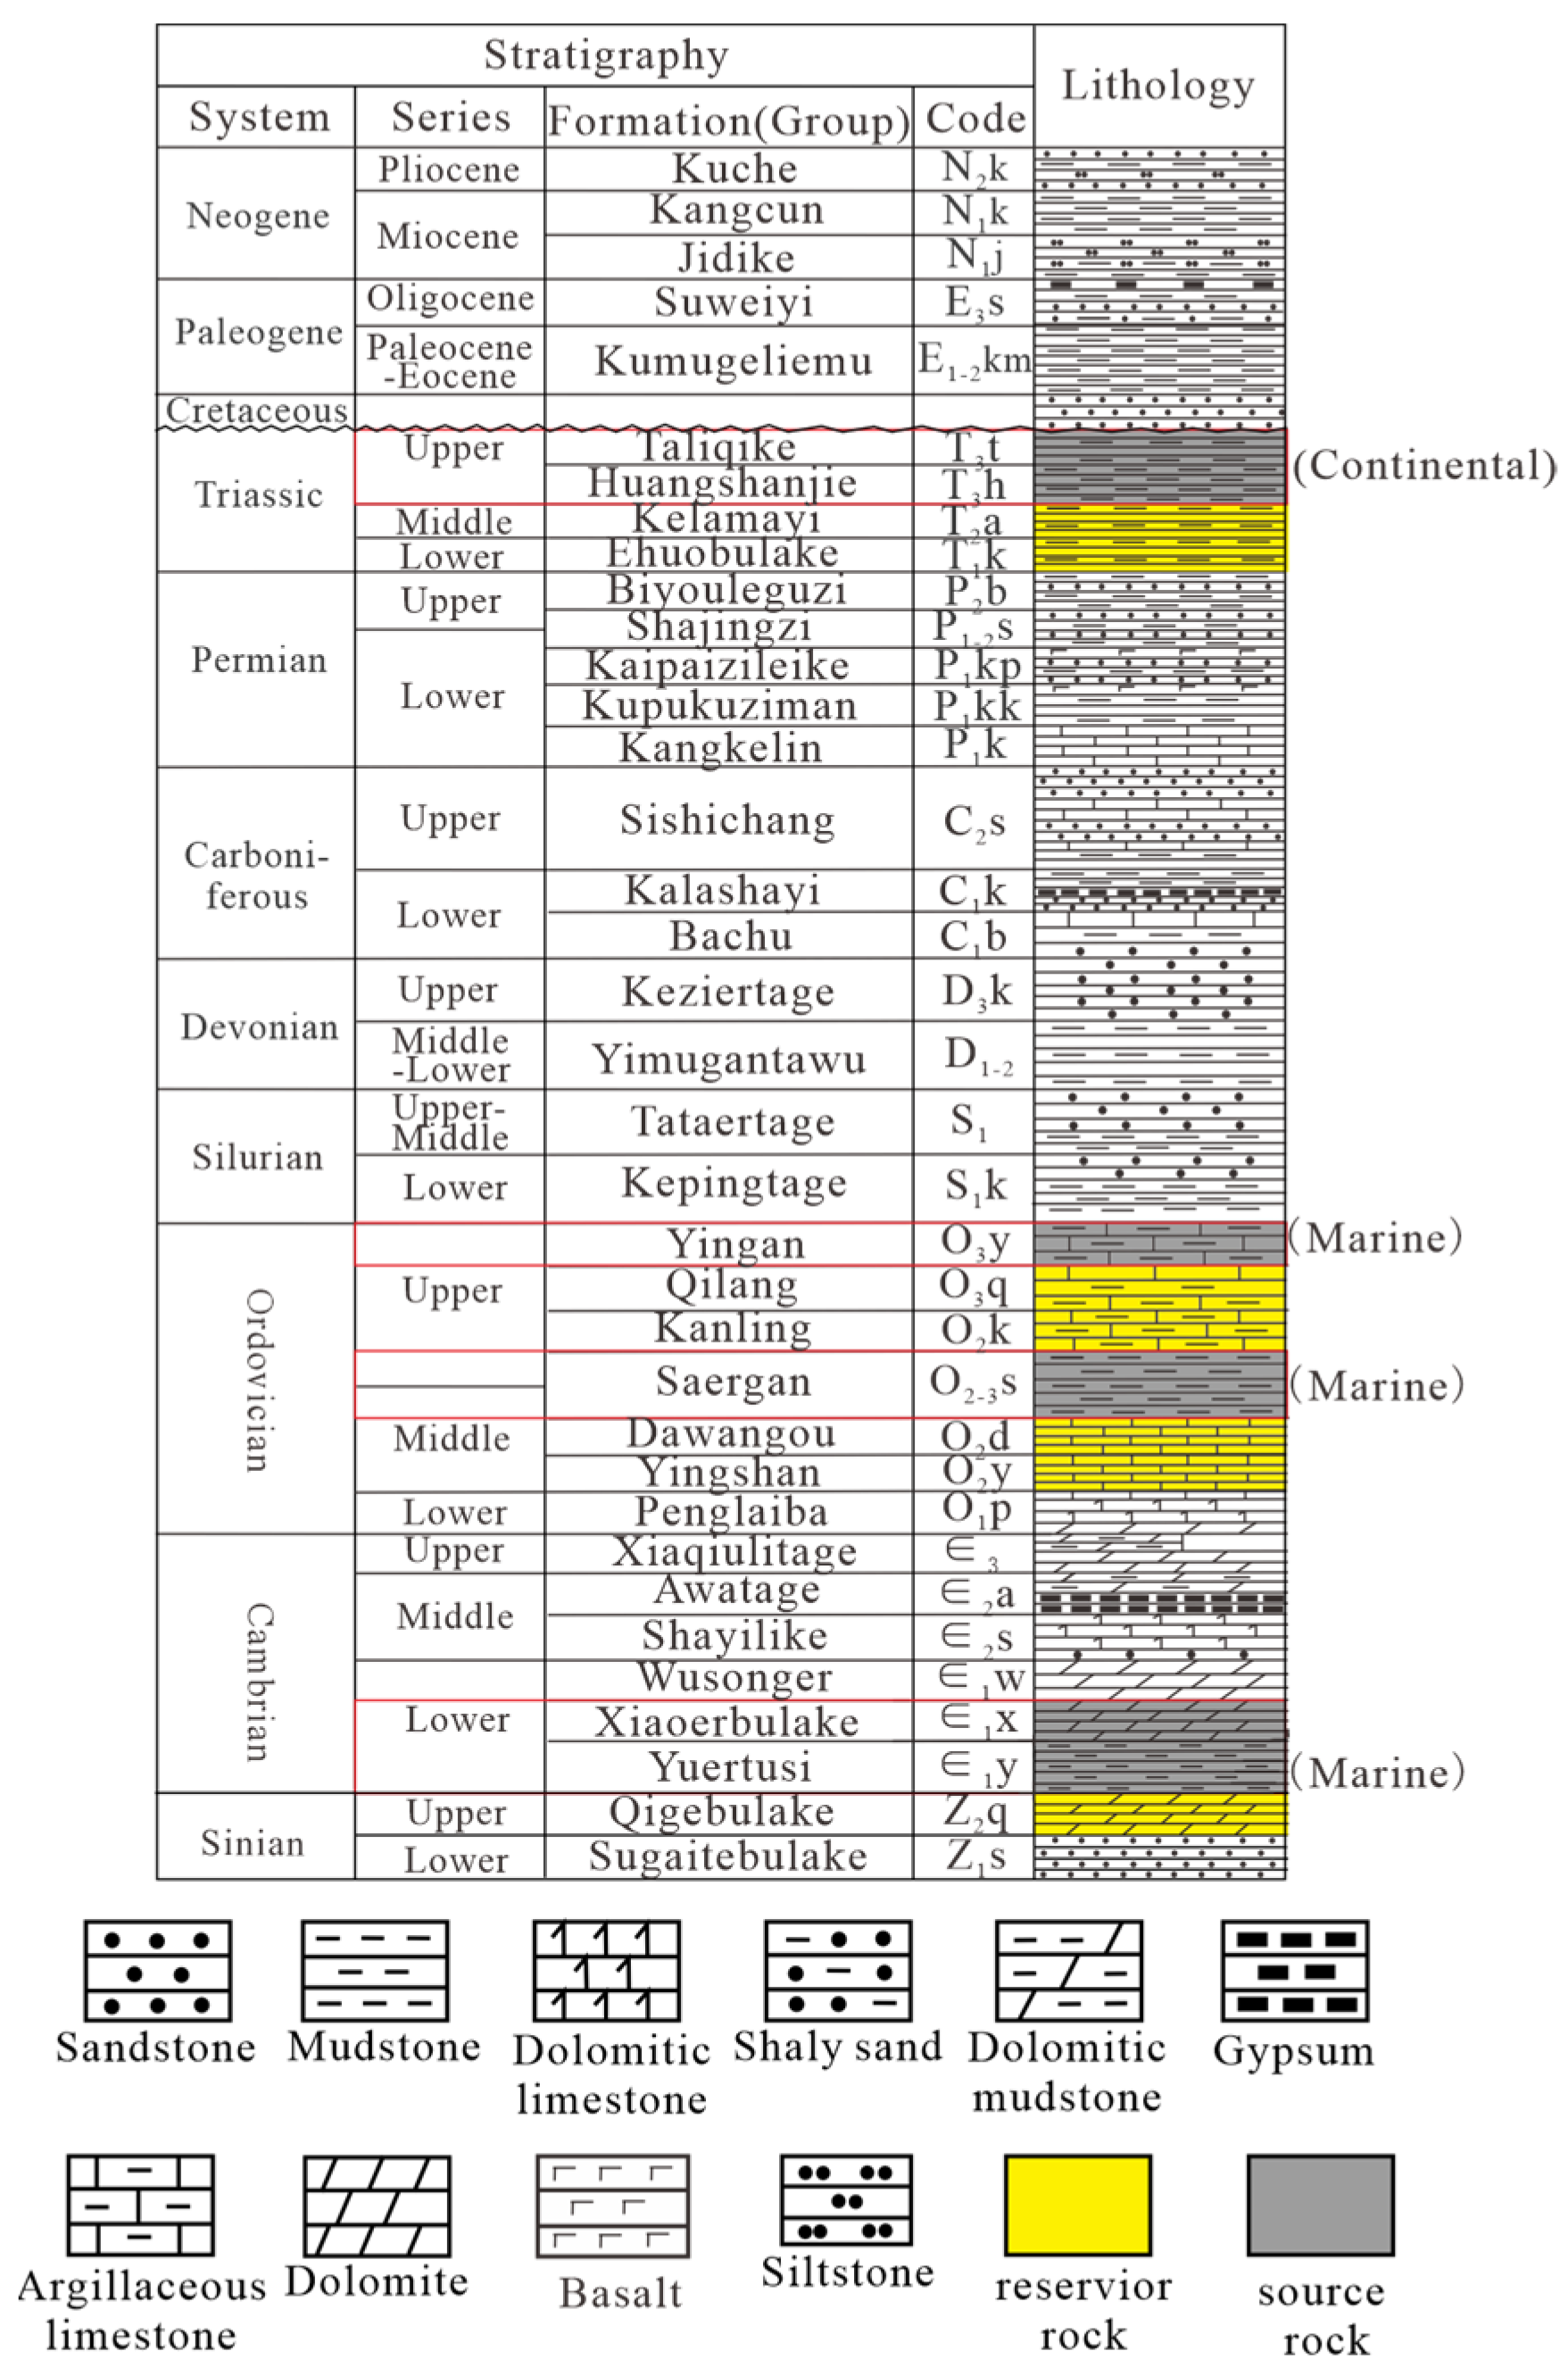
The stratigraphy of the Awati Sag and the Keping Fault Uplift is notably comprehensive, albeit lacking the Jurassic System. The focus of the study encompasses the Lower Paleozoic’s Cambrian Yuertusi and Xiaoerbulake Formations, along with the Middle and Upper Ordovician Saergan and Yingan Formations (Figure 2).
Within the Awati Sag, the Lower Cambrian Yuertusi Formation is dominated by deep-water shelf facies [19], with lithofacies largely comprising black siliceous rocks, yellow phosphorites, and black shales. The black siliceous rocks signify the cooling and crystallization of crust-derived hydrothermal fluids. Yellow phosphorites exhibit distinct attributes of continental-margin marine sedimentary phosphorite facies, closely tied to upwelling currents. Meanwhile, black shales, marked by parallel lamination and radiolarian fossils, correlate with the still-water conditions of greater depths pertinent to a deeper hydrostatic setting [20]. The Xiaoerbulake Formation comprises lacustrine dolomite from a restricted platform facies, indicative of early evaporite conditions with increasing salinity that provides a basis for hydrocarbon generation [21,22].
The Middle-Upper Ordovician Saergan and Yingan Formations correspond to a deep-water shelf–basin facies, with deposition governed by seafloor depth variations. The Saergan Formation is dominated by a dysoxic environment, with organic-rich black shales interbedded with minor chert layers or lenticular shale [18,23]. The Yingan Formation is predominantly anoxic, characterized by black and charcoal shales with intercalations of thin argillaceous limestone layers [23].

3. Sampling and Methodologies

For geochemical analysis, we collected the lower Paleozoic source rock samples from (1) the Shiairike Yuertusi outcrop (28 pieces); (2) the Dawangou Saergan outcrop (10 pieces); and (3) the XKD-1 (9 Yuertusi samples and 7 Xiaoerbulake samples), XSD-1, and KP-1 Wells (4 Saergan samples and 6 Yingan samples).

3.1. Field Outcrop Profiles

The Shiairike outcrop, situated approximately 30 km southwest of Aksu, presents an optimal site for examining the Yuertusi source rock. The exposure of the Yuertusi Formation at this outcrop is substantial, and its accessible geographical position facilitates sample collection for analytical and observational purposes [12]. Dominated by siliceous shale, the Yuertusi Formation at the Shiairike outcrop can be broadly categorized into three stratigraphic layers from top to bottom.
The first layer is a siliceous rock, primarily gray to gray-black, interspersed with apatite concretions and trace sandy dolomite, approximately 1 m thick. The second layer comprises gray dolomite, approximately 3 m in thickness. The third layer, a black shale, contains numerous siliceous bands, evident in field observations, and exhibits high TOC, typically exceeding 2%, indicative of a high-quality source rock, and measures about 3–5 m in thickness (Figure 3).
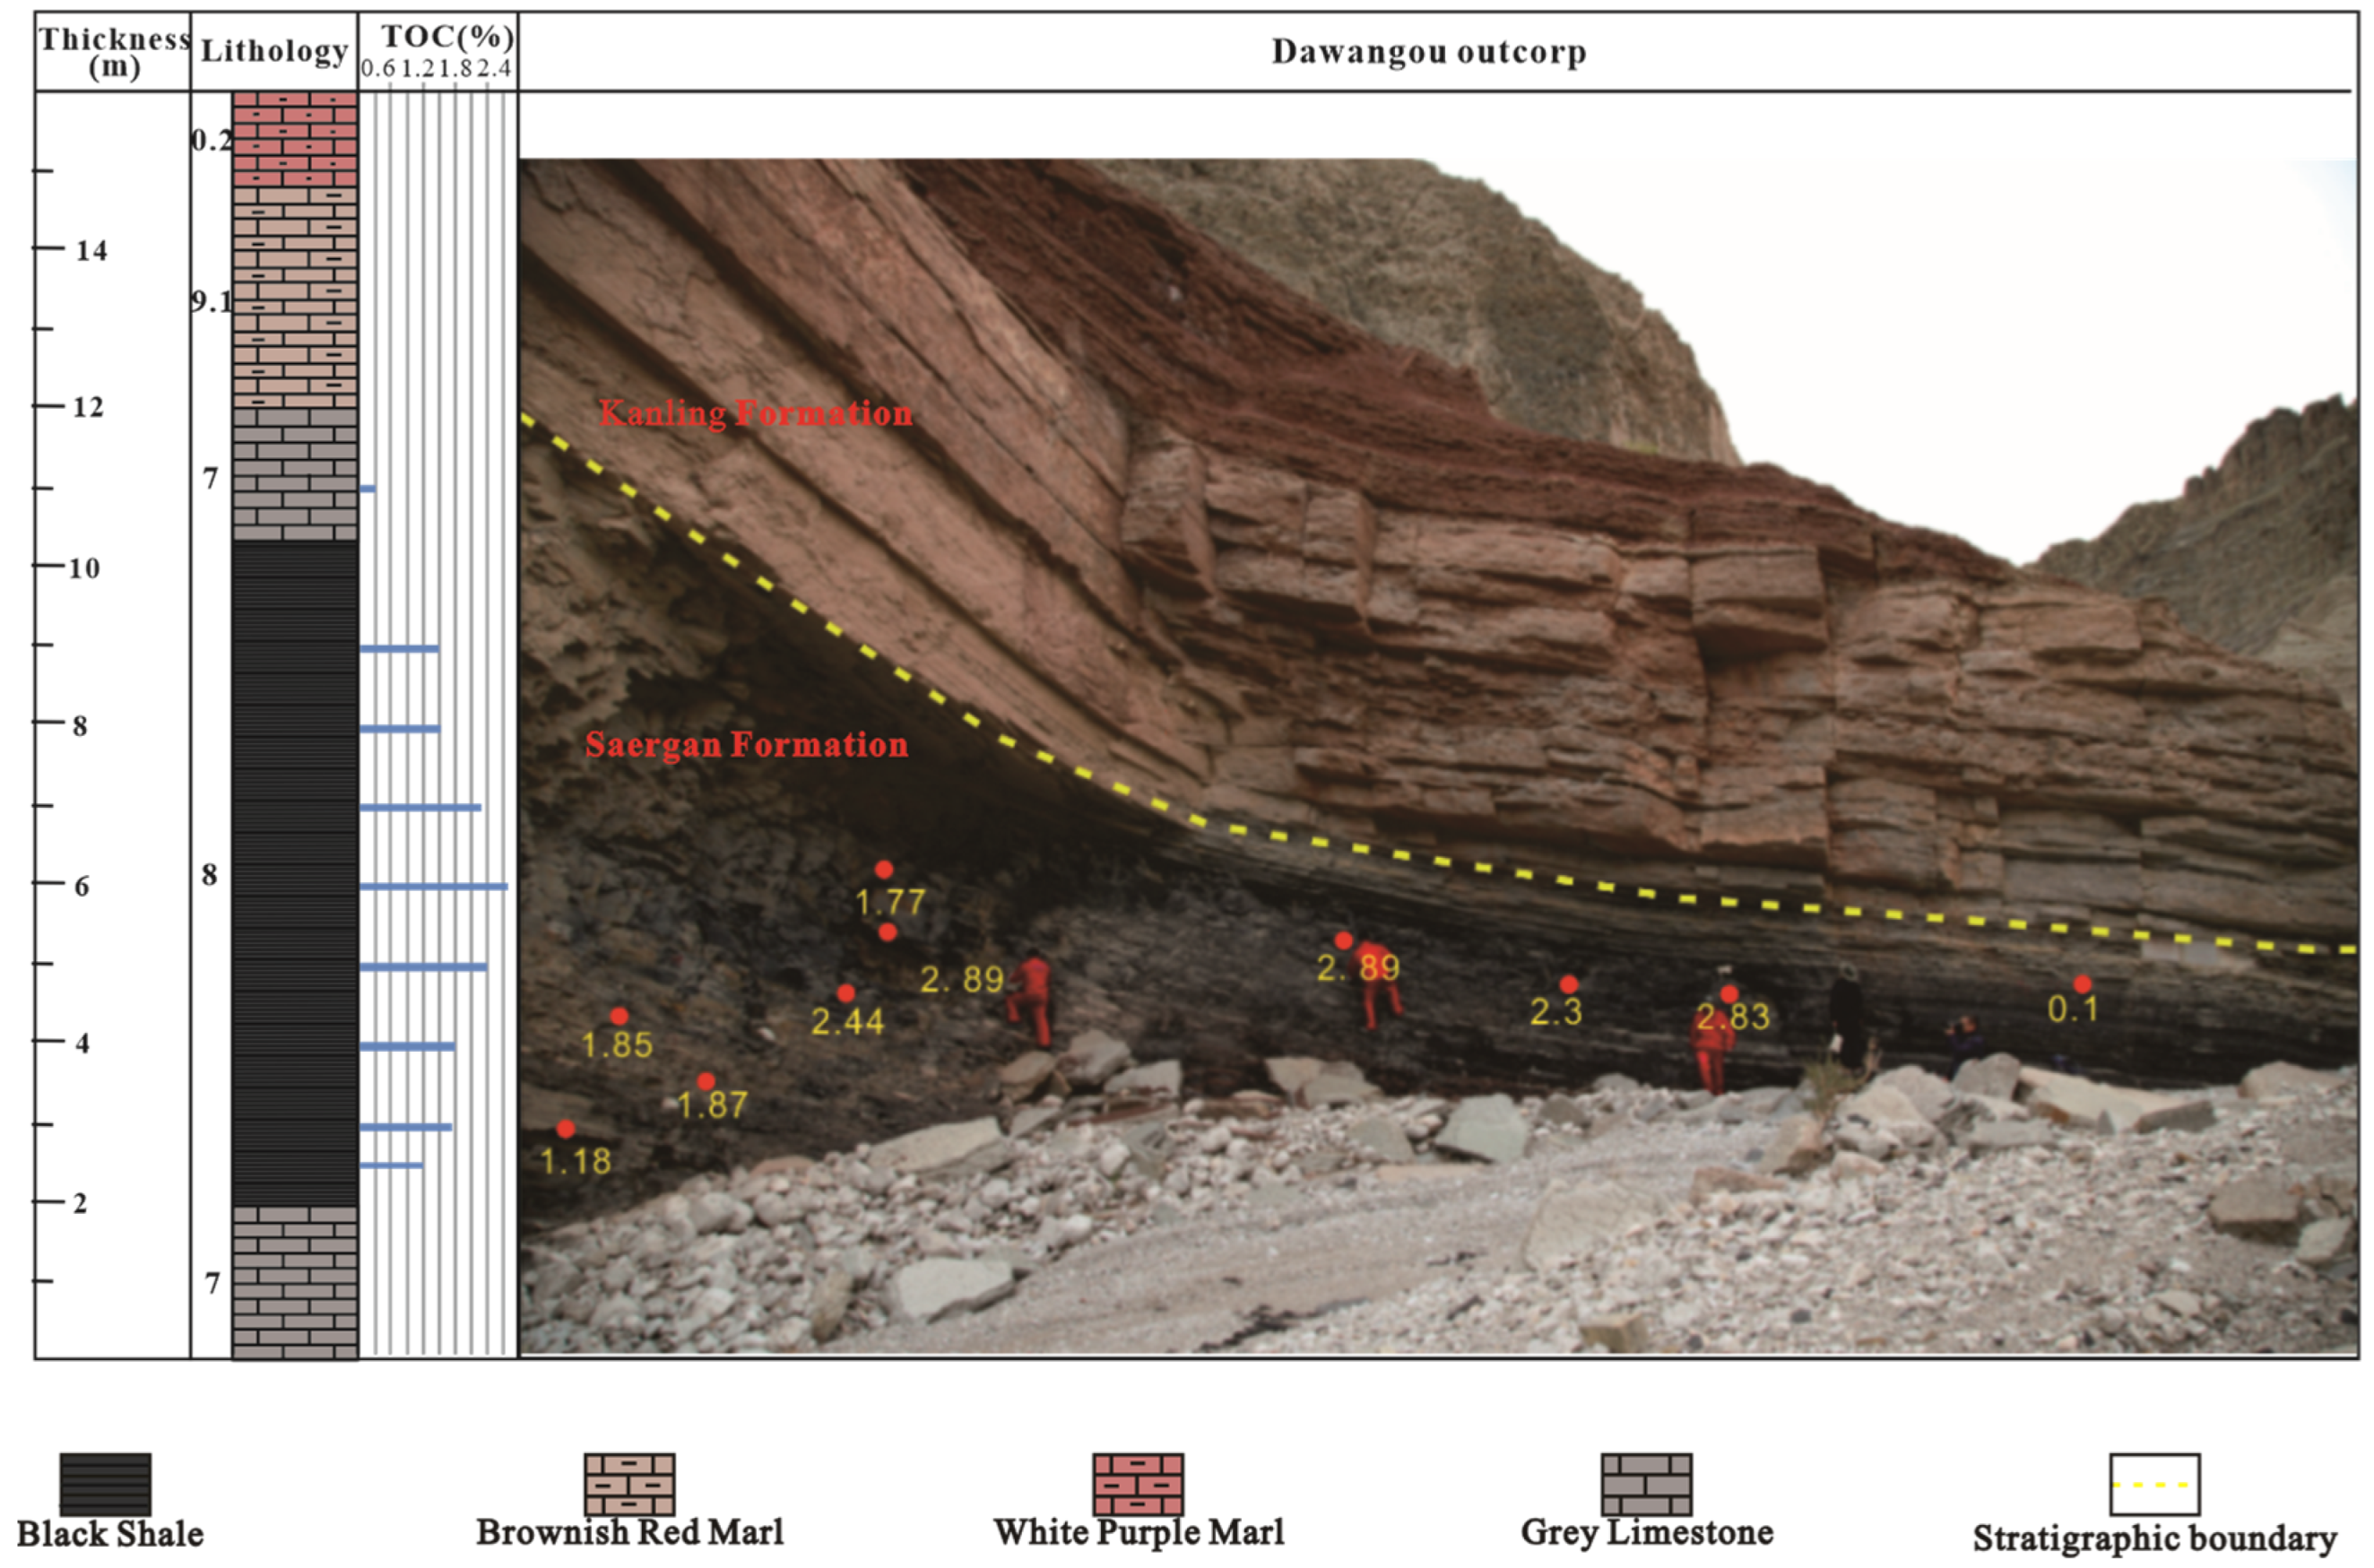
The Dawangou outcrop, located northwest of Yingan Village in Keping County, boasts a significantly exposed section of the Saergan source rock [24]. The field profile (Figure 4) reveals the Saergan Formation’s thickness to be approximately 13.4 m, composed predominantly of two lithologies: black calcareous shale in sheet form with horizontal stratification and interspersed thin laminated or lenticular limestone and marl within the shale. The black shale and gray-black lenticular marl are notably riddled with penstocks, with occasional siliceous bands in some layers. Penstock analysis suggests a depositional paleo-water depth for the Saergan Formation ranging from 60 m to over 200 m [25].

3.2. Geochemical Analysis and Mineral Composition Analysis

The TOC analysis, pyrolysis, scanning electron microscopy (SEM) observation, and X-ray diffraction (XRD) were conducted at the National Key Laboratory of Petroleum Resources and Engineering at China University of Petroleum (Beijing). TOC analysis utilized a CS-230 HC carbon–sulfur analyzer. The rock samples were initially treated with dilute hydrochloric acid to remove inorganic carbon. Subsequently, the samples were rinsed, dried, and then analyzed. Pyrolysis was carried out using Rock-Eval on samples ground to under 100 mesh [26]. XRD analysis was performed using a Panalytical X’Pert PRO X-ray diffractometer following the standard SY/T5163-2010 [27] “X-ray diffraction analysis methods for clay minerals and common non-clay minerals in sedimentary rocks”.

3.3. 1D and 2D Hydrocarbon Accumulation Simulations

The PetroMod software (2016.2) developed by IES was used for 1D and 2D hydrocarbon accumulation simulations. The input parameters mainly include stratigraphic layering data, thickness, lithology, organic matter abundance, hydrogen index (HI), and erosion thickness. The layering and thickness data were determined based on the log interpretation. The lithology was determined based on mud logging data.
Accurate geochemical parameterization is essential for assessing potential source rocks, with notable variations among wells. For XSD-1, the Yingan Formation is characterized by a TOC of 0.36% and an HI of 29.00 mgHC/gTOC, while the Saergan Formation exhibits a TOC of 3.26% and an HI of 119.76 mgHC/gTOC. In the XSC-1 Well, the Yingan Formation presents a TOC value of 0.36% and an HI of 29.00 mgHC/gTOC. The Saergan Formation exhibits a TOC of 3.26% with an HI of 150 mgHC/gTOC, while the Yuertusi Formation shows a TOC of 7.34% with an HI of 46.45 mgHC/gTOC.
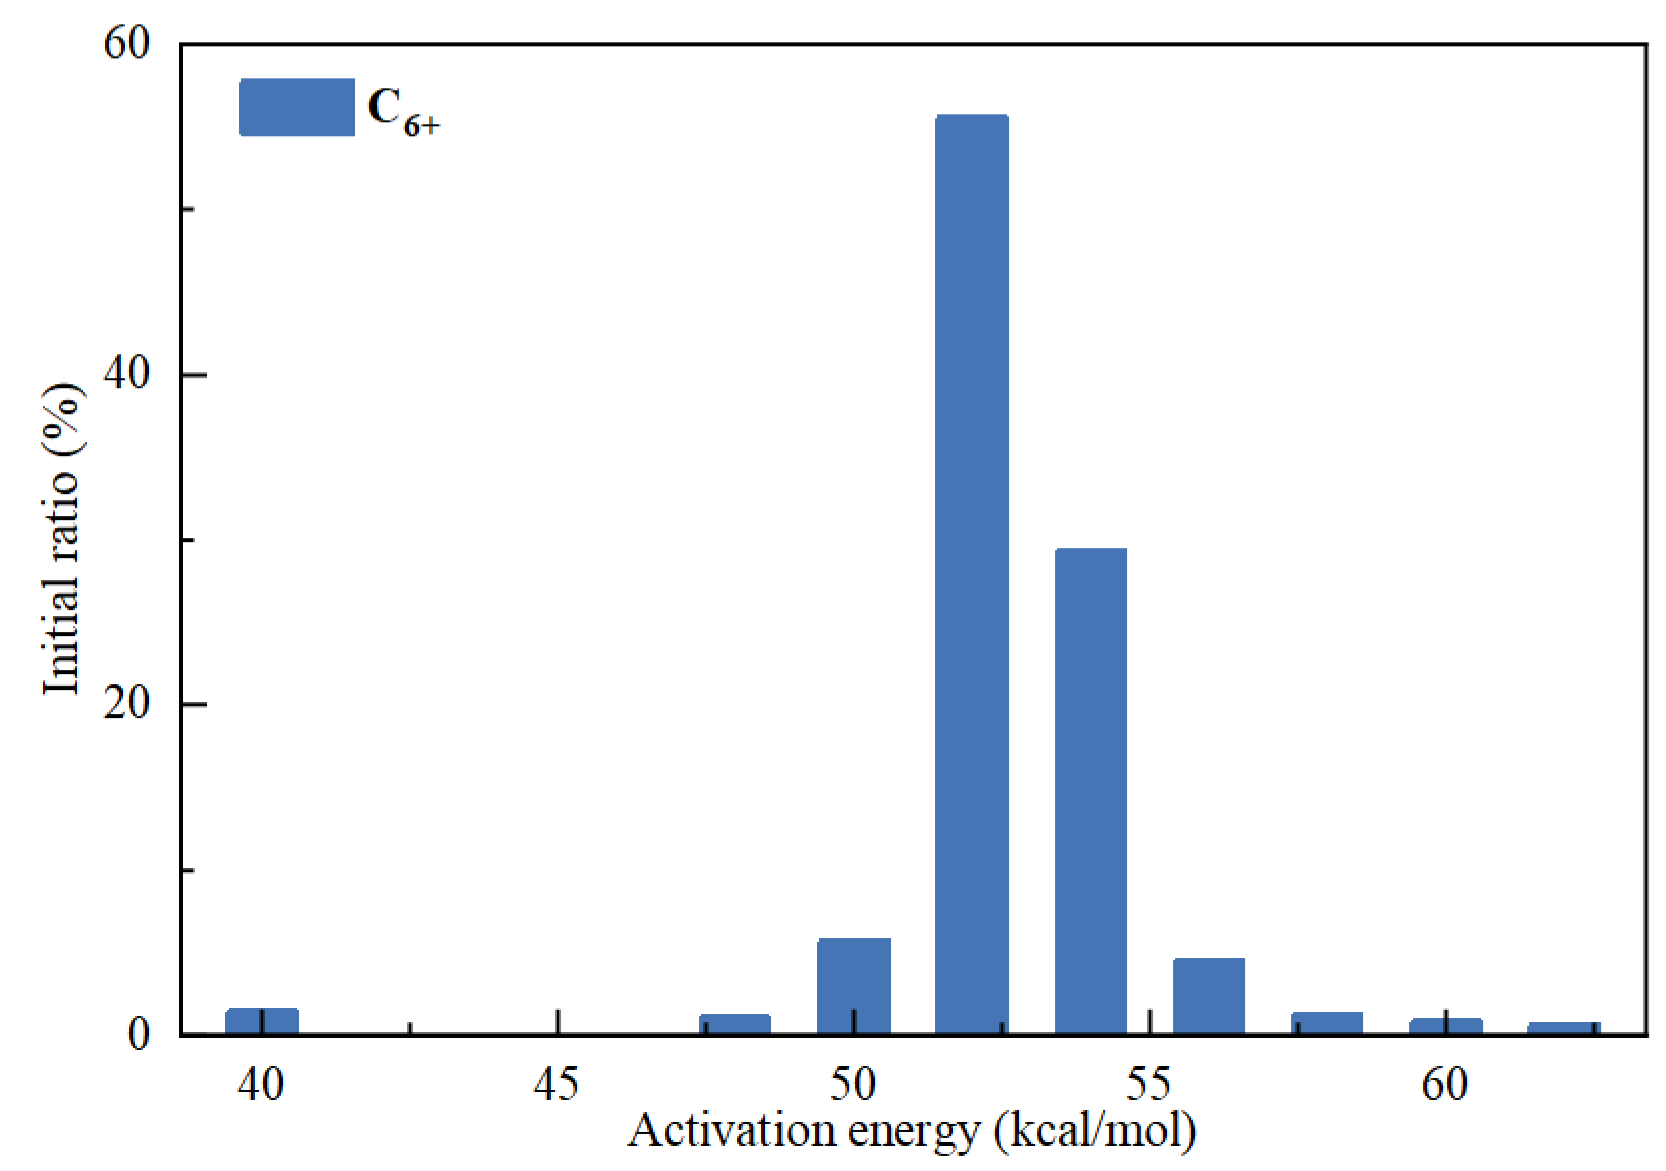
Previous studies have established several key kerogen cracking models for reconstructing the history of hydrocarbon generation from source rocks, such as Burnham (1989) [28], Tissot and Waples (1992) [29], and PM Tll Toarcian Shale 2C (2006) [30]. These kerogen cracking models play a crucial role in understanding the evolution of hydrocarbons from source rocks. We adopted the Type II kerogen cracking model developed by Tissot and Waples (1992) [29] (Figure 5) for the hydrocarbon accumulation simulation. The activation energy distribution range of the model for oil/gas generation (C6+) mainly ranges from 40 kcal/mol to 62 kcal/mol, with an average of 53.33 kcal/mol.
Boundary conditions (paleo-water depth, paleo-surface temperature, paleo-heat flow) critically impact hydrocarbon evolution. Cambrian source rock deposition in the Tarim Basin primarily occurred in tidal flat facies, specifically mud flats, sand flats, and cloud flats [31]. During this period, paleo-water depths are estimated at 20–30 m, remaining relatively consistent through the Middle and Upper Ordovician. Post-Permian, the basin experienced a seawater regression, leading to shallower depths. Triassic to Holocene sedimentation was dominated by semi-deep lake, shoal lake, and riverine deposits.
Current surface temperatures in the Tarim Basin average 18 °C, with paleo-temperatures derivable from PetroMod software (2016.2) using paleo bathymetry [32]. Paleo-heat flow varied over geological periods, with Cambrian–Ordovician at 50–65 mW/m2, Silurian–Permian at 40–70 mW/m2, Triassic–Cretaceous at 35–45 mW/m2, and Cenozoic generally below 40 mW/m2 [32]. Paleo-heat flow values evolved from low in the early Paleozoic to high in the late Paleozoic through the Mesozoic, and have decreased in the current era [33,34].

4. Comparison of Geochemical Characteristics of Potential Source Rocks

4.1. Organic Matter Abundance and Hydrocarbon Potential

4.1.1. TOC Statistics Obtained from Lab Analysis

The TOC statistics for field outcrop Yuertusi samples (Table 1) reveal a minimum TOC of 0.03%, a maximum of 7.83%, an average of 2.13%, and a median of 1.70%, indicating high-quality source rock [35,36]. The standard deviation of 1.77% for TOC across 28 samples from the Yuertusi Formation suggests significant variability and heterogeneity in the TOC content across different field outcrop locations. In contrast, shale samples from the Ordovician Saergan Formation display TOC ranges from 0.1% to 2.89%, with an average of 2.01%, also denoting good source rock quality but with overall lower organic carbon content than the Yuertusi Formation.
Given that the Yingan and Xiaoerbulake outcrop samples inherently exhibit low TOC values and have undergone extensive weathering and erosion, downhole core samples were employed to accurately compare the TOC content among the four prospective source rock groups.
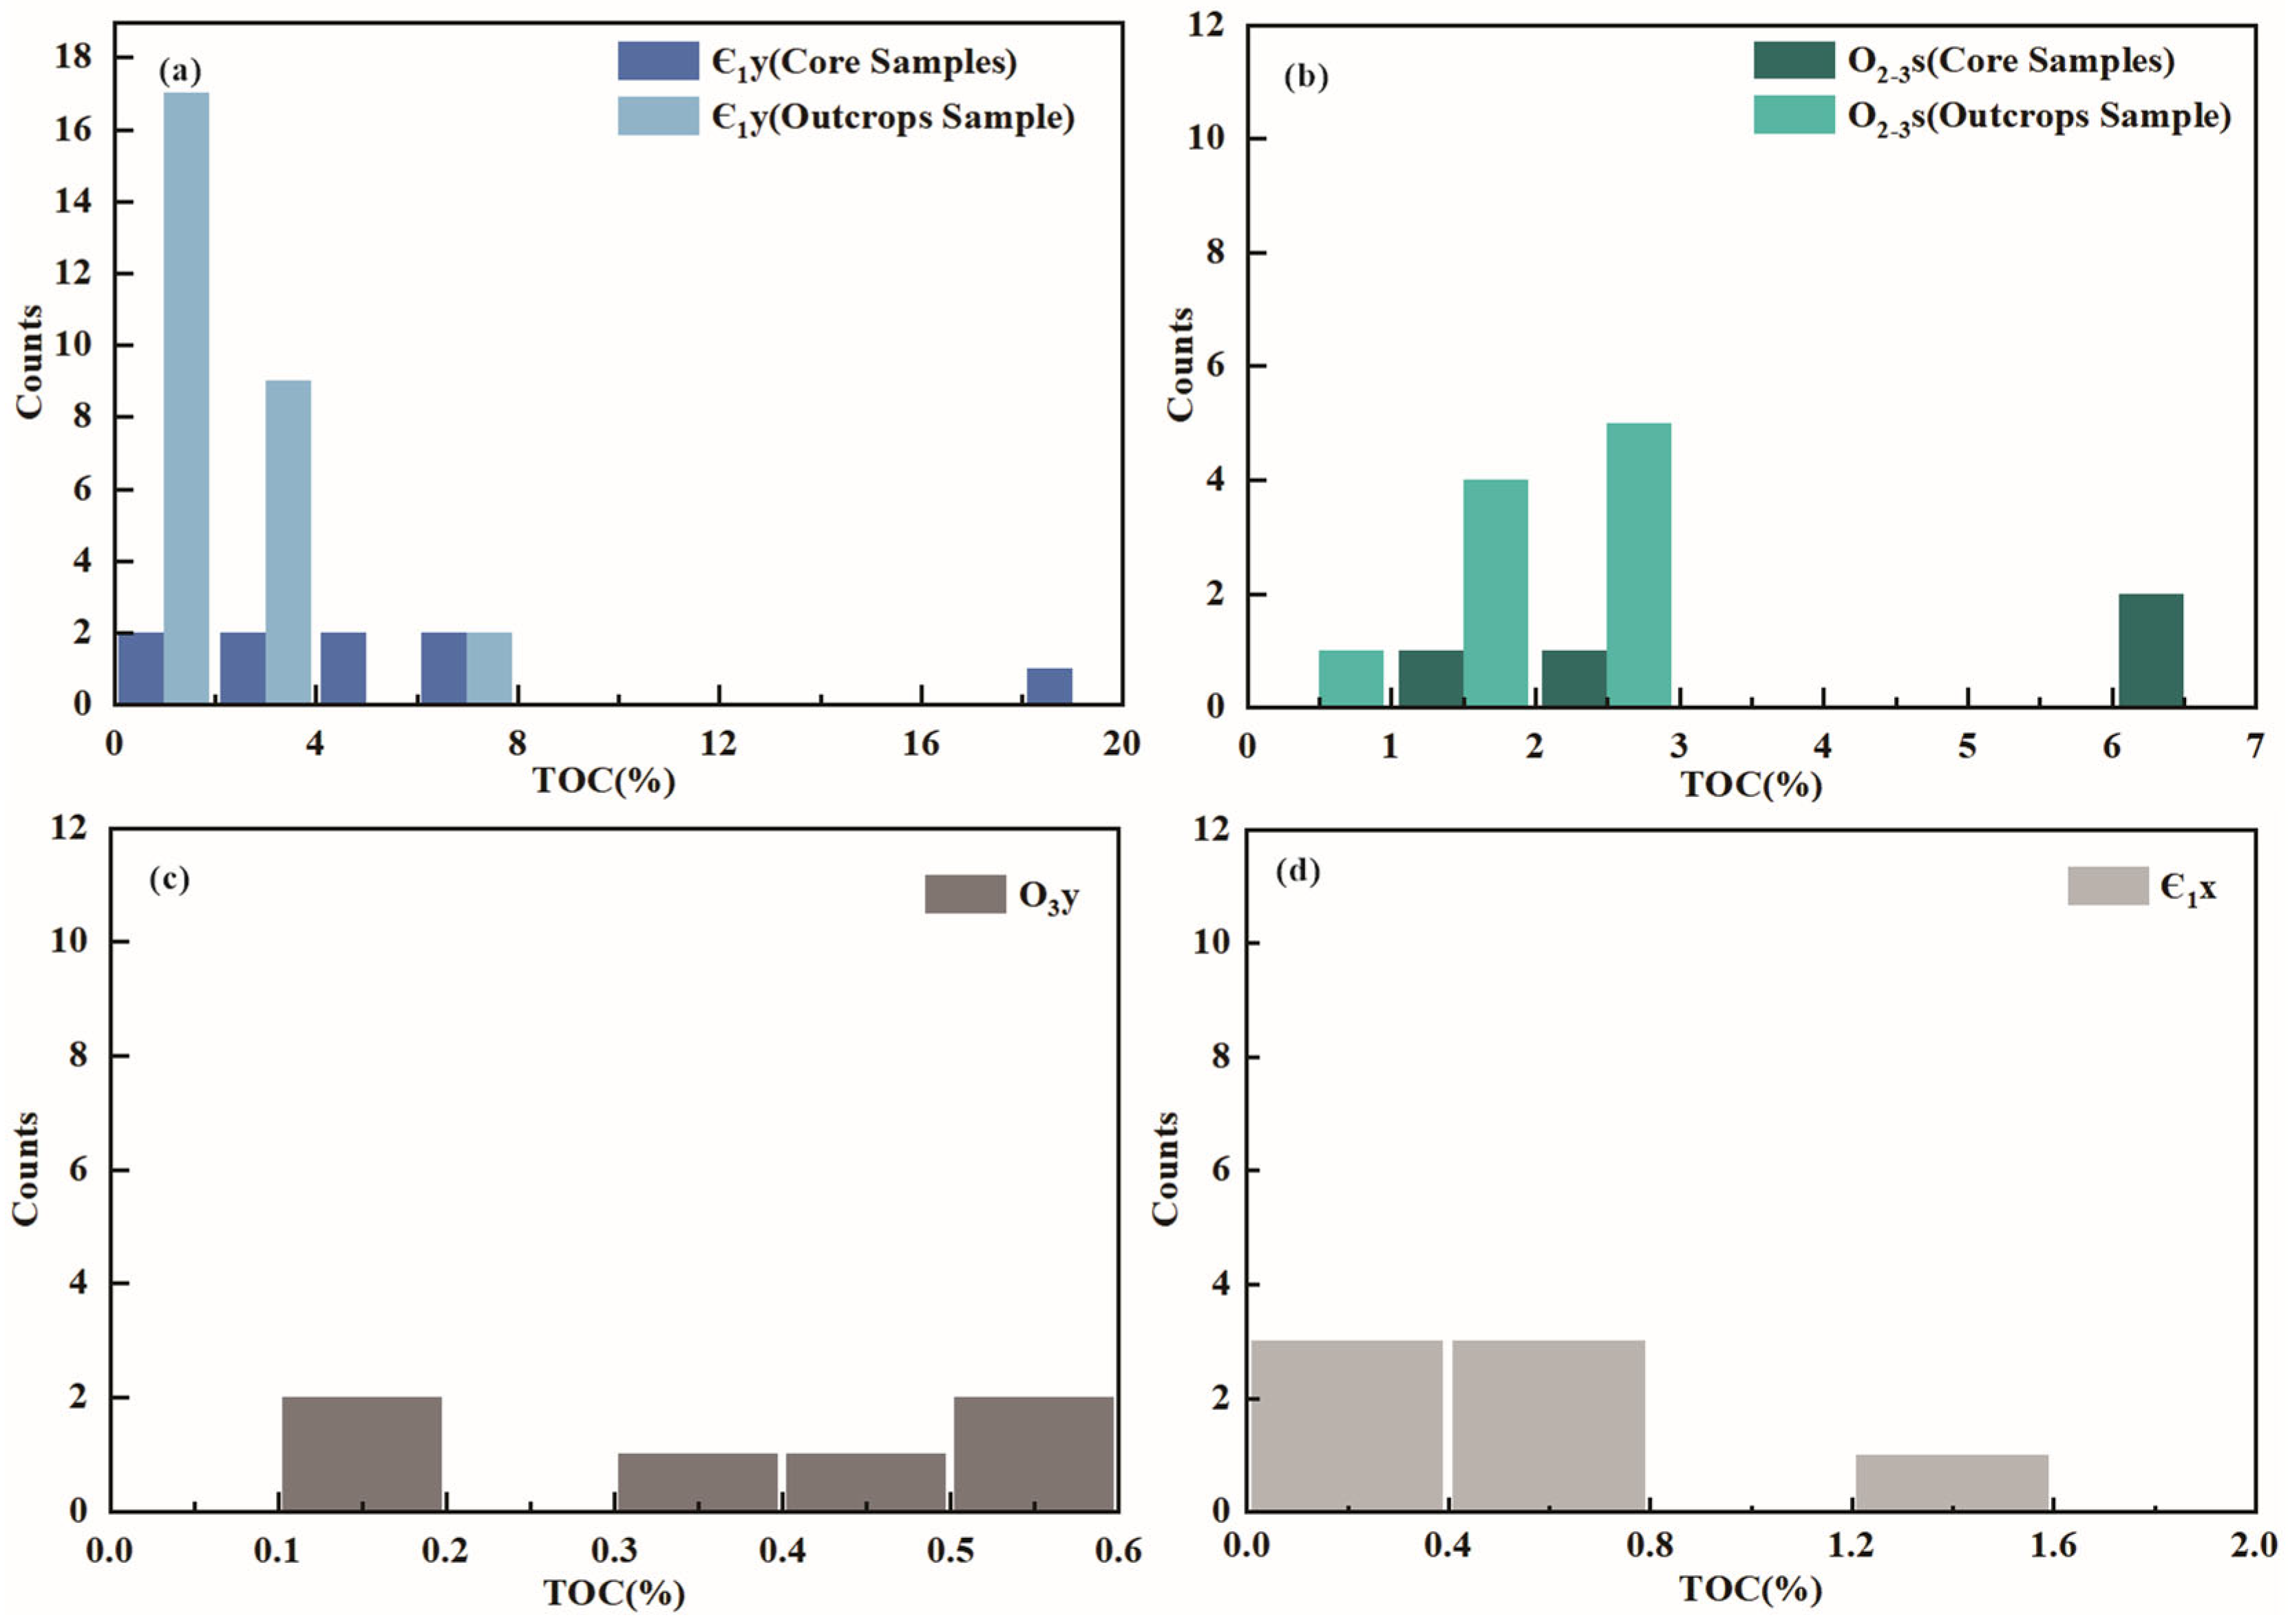
Analysis of downhole core samples reveals the following TOC statistics (Table 1): (1) Echoing outcrop sample analyses, the Yuertusi Formation registers the highest TOC (Figure 6b, Table 1), peaking at 18.98% with an average of 5.82%, indicative of high-quality source rock. The Saergan Formation also presents notable source rock potential, averaging 3.99% TOC. (2) The Xiaoerbulake Formation displays the lowest TOC levels (Figure 6d, Table 1), ranging from 0.06% to 1.3% with an average of 0.53%. Only four out of seven samples exceed a TOC of 0.5%, classifying it overall as poor–non-source rock. (3) The Ordovician Yingan Formation, composed primarily of gray muddy limestone, shows an overall low TOC range: 0.11–0.58% with a mean of 0.36%, and thus characterized as poor–non-source rock.
To summarize, from a TOC perspective, the primary source rock in the Middle–Upper Ordovician is the Saergan Formation, whereas for the Lower Cambrian, it is the Yuertusi Formation. The latter demonstrates superior quality as a source rock when compared to the former. Conversely, the Yingan and Xiaoerbulake Formations are generally classified as poor to non-source rocks, with a limited potential for significant hydrocarbon production.

4.1.2. Logging Interpretation on TOC

So far, there are various TOC geophysical prediction methods, and different experts and scholars at home and abroad have proposed different TOC logging evaluation methods at different times according to their own scientific research projects and research blocks. Among them, the ΔLogR method has gained widespread adoption and promotion by leading logging companies globally, becoming a prevalent tool in the assessment of TOC across various types of source rocks [37].
The ΔLogR method aligns the acoustic, compensated density, or compensated neutron curves with the resistivity curve in “clean” mudstone sections. Upon encountering hydrocarbons, these overlaid logging curves diverge, denoted as Δ. It is important to note that resistivity curves are plotted on logarithmic scales, while acoustic, density, and neutron curves use linear scales.
Many experts and scholars have also developed various prediction models based on this principle, among which Passey et al.’s comprehensive model considering the maturity of source rocks has been widely used [37], as shown in (Formula (1)).
T O C a c = L o g L L D L L D b a s e + 0.02 A C A C b a s e   10 ^ [ ( 2.297 0.1688 L O M ) s   ]
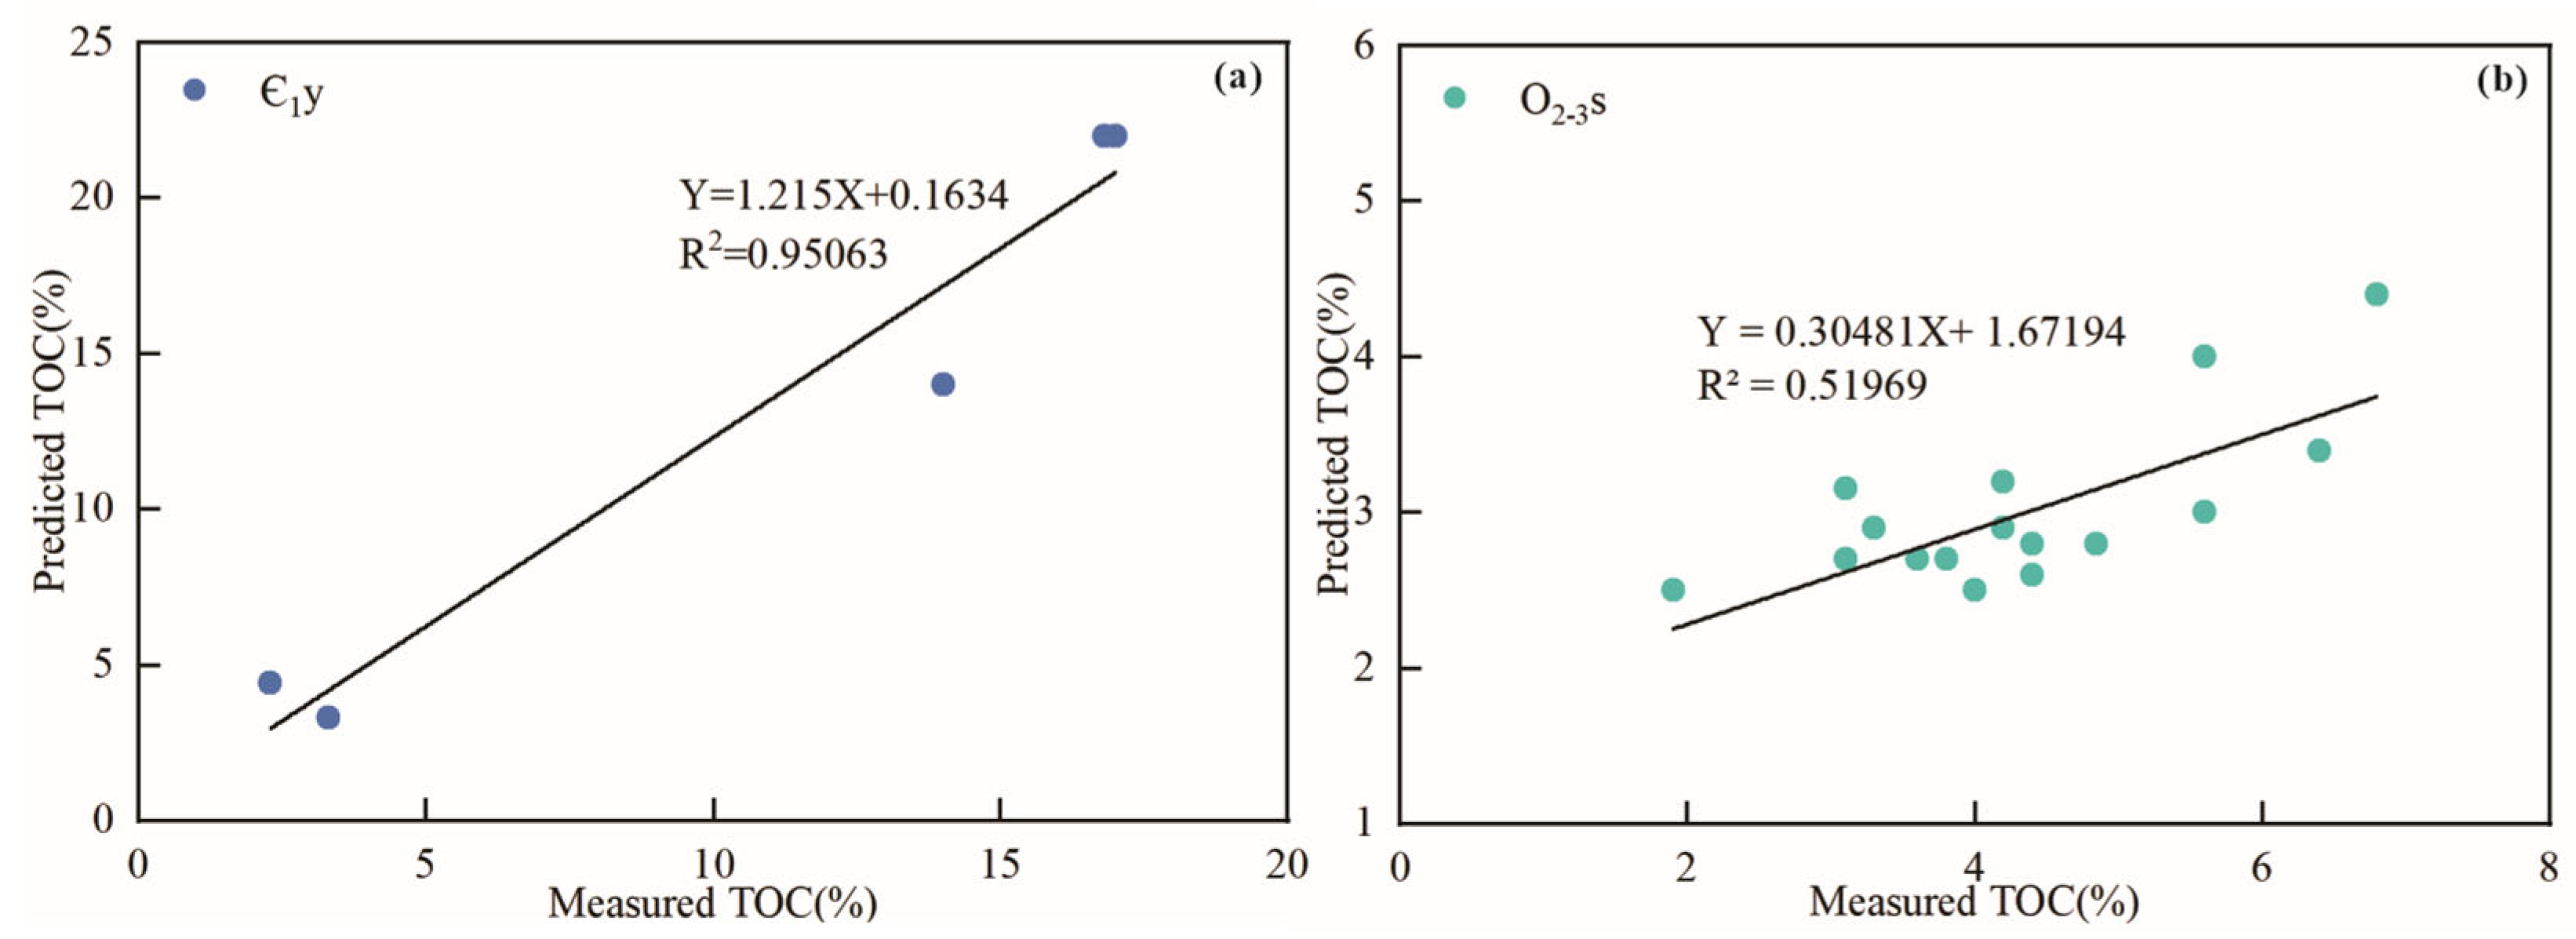
where LLDbase and ACbase represent the resistivity and acoustic curve values in the “clean” mudstone section, while LOM is the maturity index correlated to Ro. The correlation between the TOC interpretation results and the lab measurements is robust, exhibiting high predictive precision (Figure 7 and Figure 8). However, given the broad distribution of TOC within the Sargan Formation, a certain degree of error is observed (Figure 7b).
The TOC interpretation of the XSC-1 Well reveals that within the Yuertusi Formation, the TOC shows an increasing trend with depth. The TOC values range from a minimum of 1.52% to a maximum of 23.03%, averaging at 4.86%. The organic-rich layers are predominantly situated in the formation’s lower sections, with thicknesses between 10 and 15 m, and these layers have an average TOC content of 17.26%, which is significantly high (Figure 8). In contrast, the overall TOC of the Saergan Formation appears to be lower, hovering around 3%, with values ranging between 2.52% and 4.59%. The distribution across the formation is more uniform, averaging at 3.20% (Figure 8). Vertically, the TOC content is generally lower in the upper and lower members of the Saergan Formation, while the middle member exhibits slightly higher contents, reaching up to 8% (Figure 8). The thickness of the Saergan Formation is also thinner (<10 m) in the XSC-1 Well because it is on the Shajingzi Fault Belt.

4.1.3. Hydrocarbon Generation Potential

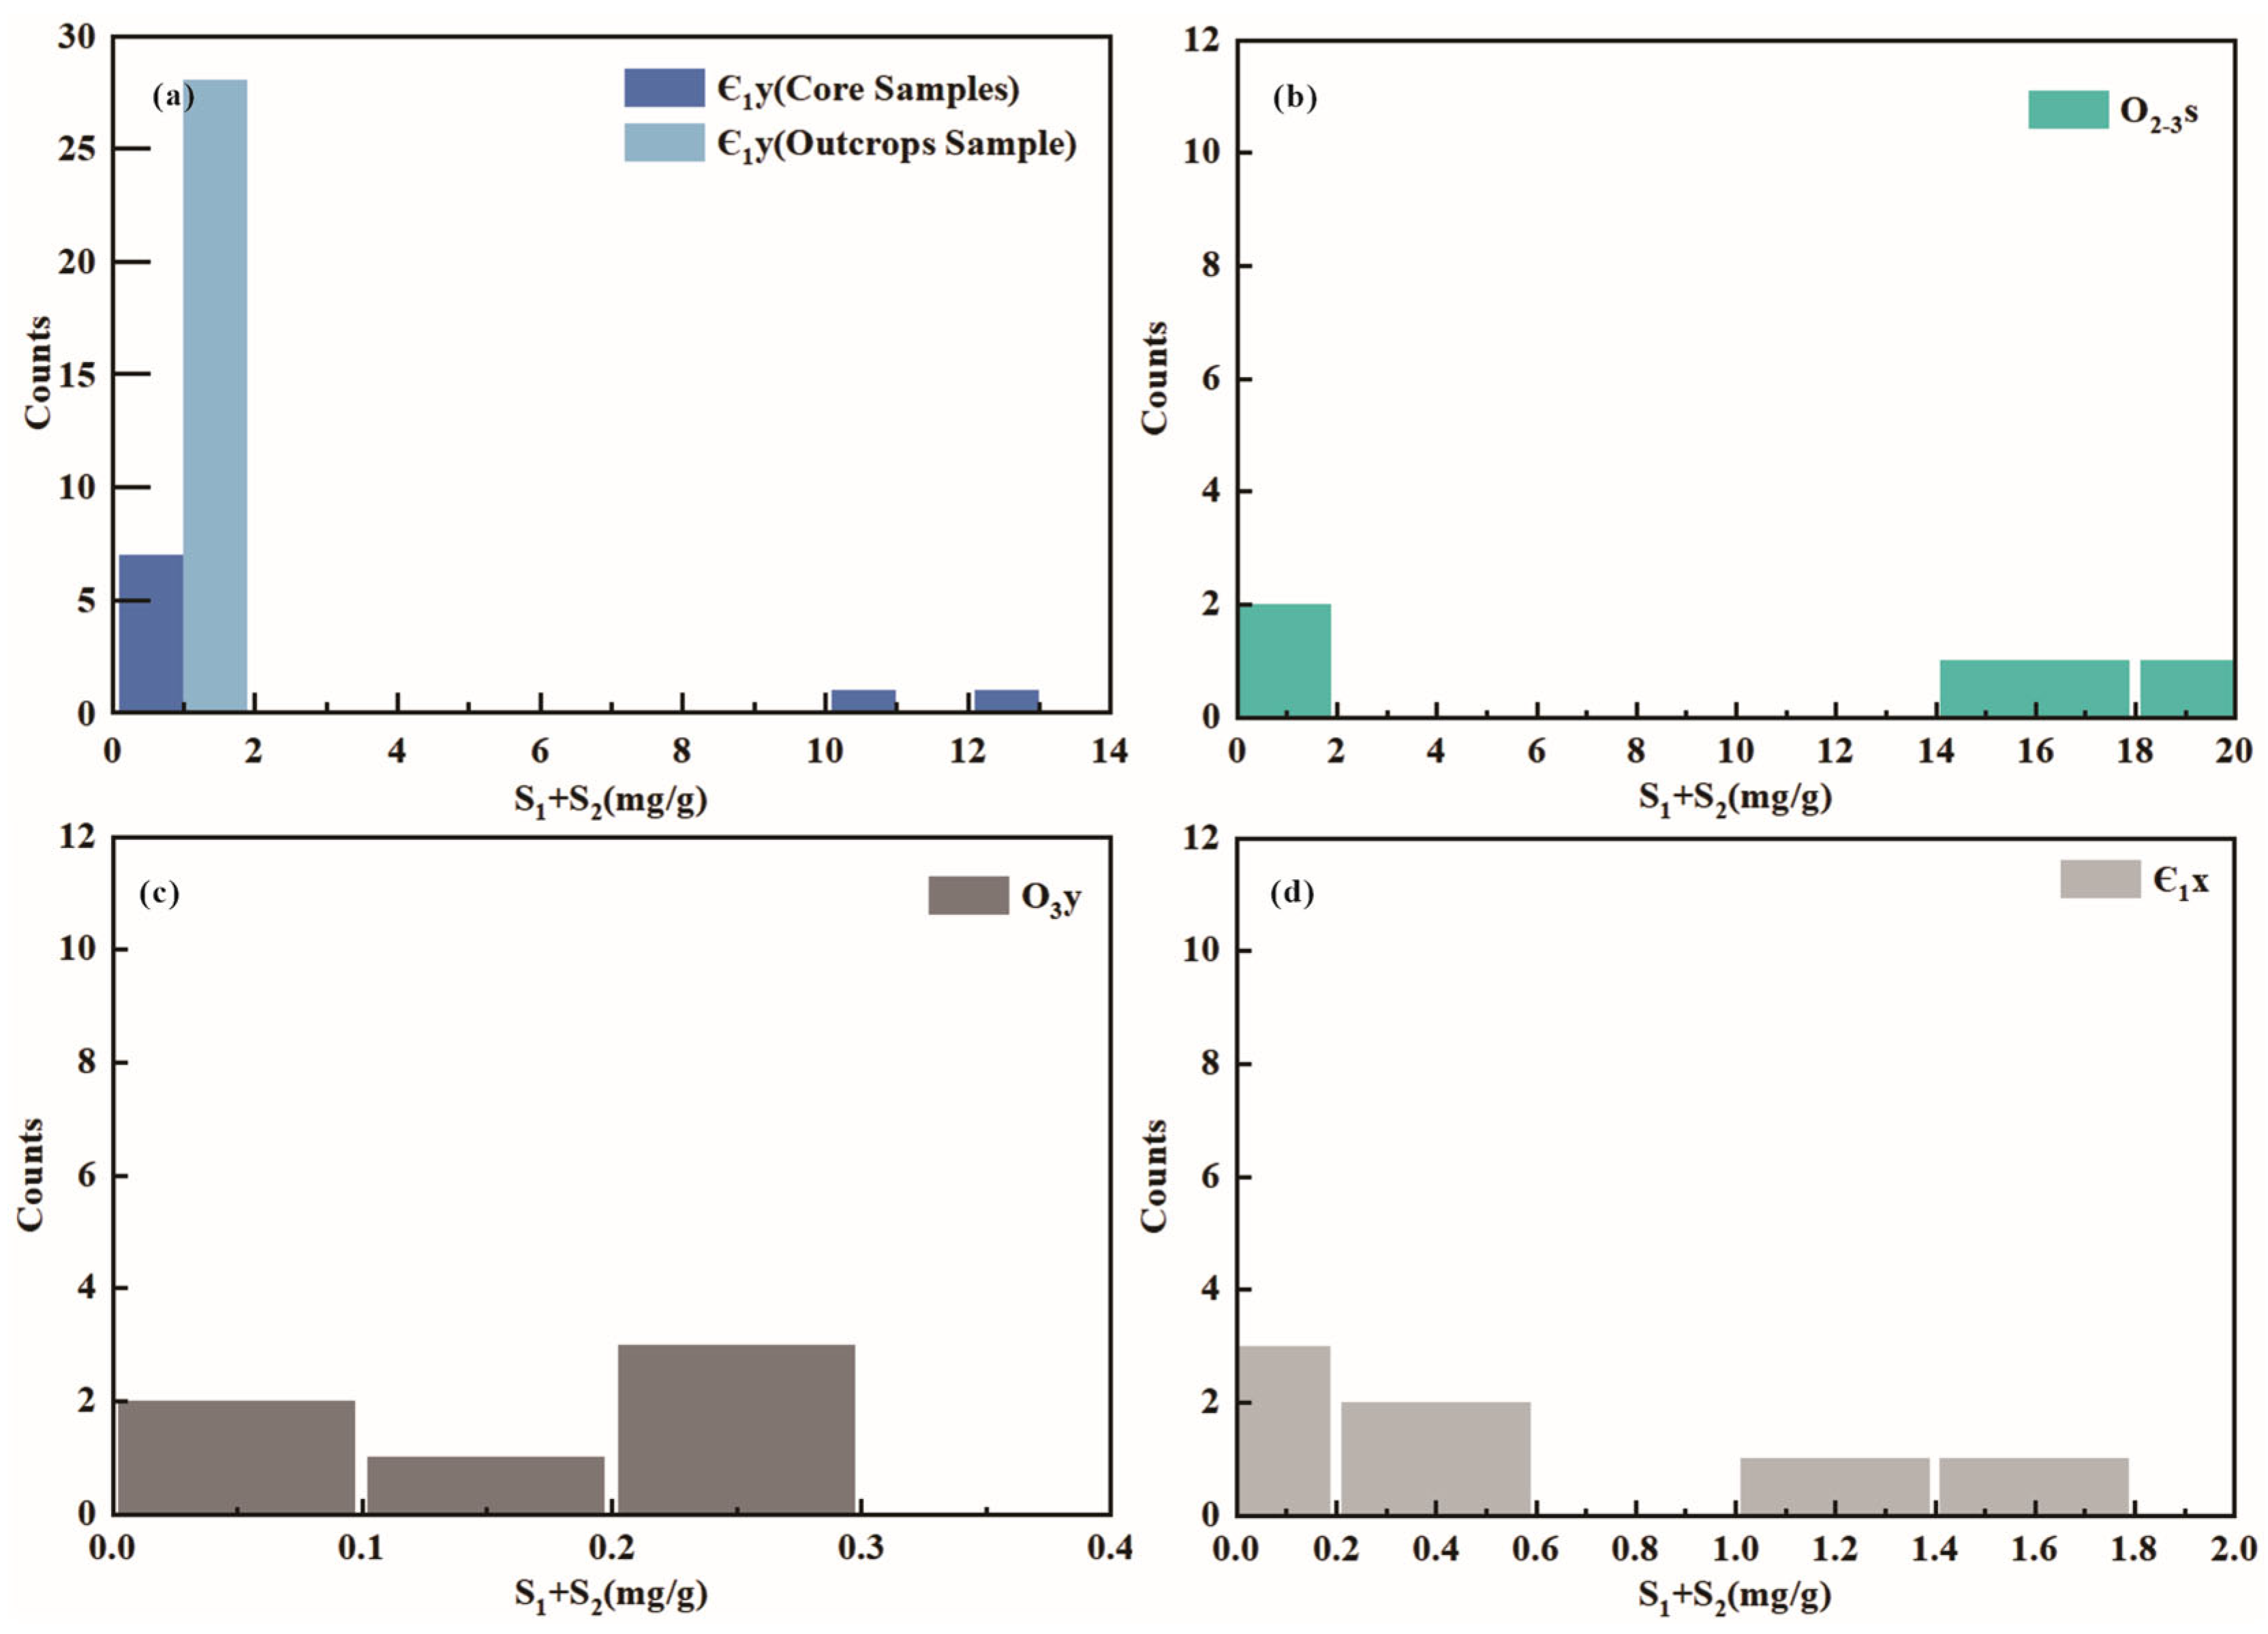
Analysis of the hydrocarbon generation potential of field outcrop samples (Table 2, Figure 9a) indicates that the Cambrian Yuertusi Formation source rocks possess S1 + S2 values ranging from 0.01 mg/g to 0.62 mg/g, averaging 0.22 mg/g, categorizing them as non-source rocks (<0.5 mg/g) [38,39]. The high maturity of the Yuertusi Formation’s source rocks likely results in diminished residual S1 + S2 value, compounded by weathering and erosion of the outcrop samples, possibly skewing results [40]. For more precise evaluations, subsurface samples were used to assess the S1 + S2 value across four potential source rock groups.
Downhole sample analysis (Table 2) revealed the following: (1) The Yuertusi Formation, consistent with TOC results, qualifies as an effective source rock (Figure 9a), featuring a maximum S1 + S2 value of 13.12 mg/g and an average of 3.42 mg/g (Table 2), demonstrating robust potential. (2) The Saergan Formation exhibits a higher maximum S1 + S2 value of 19.50 mg/g, with an average of 9.4 mg/g, surpassing that of the Yuertusi Formation. However, the Saergan Formation’s limited sample size and uneven data distribution, with a standard deviation of 9.91 mg/g, warrant caution (Table 2, Figure 9b). (3) The Yingan Formation shows minimal S1 + S2 values (Figure 9c), peaking at only 0.26 mg/g, and is thus classified as poor to non-source rock. (4) The Xiaoerbulake Formation presents the lowest potential (Figure 9d), averaging at 0.57 mg/g, and is categorized as poor source rock.
In summary, the Lower Paleozoic marine source rocks are dominated by the Yuertusi Formation, followed by the Saergan Formation, while both the Xiaoerbulake Formation and the Yingan Formation are poor–non-source rocks. The significant discrepancy observed between the outcrop and downhole samples is largely attributed to the weathering effects on the field outcrop samples [41]. Consequently, this study focuses on the Yuertusi and Saergan Formations for subsequent hydrocarbon numerical modeling.

4.2. The Types and Maturity of Organic Matter

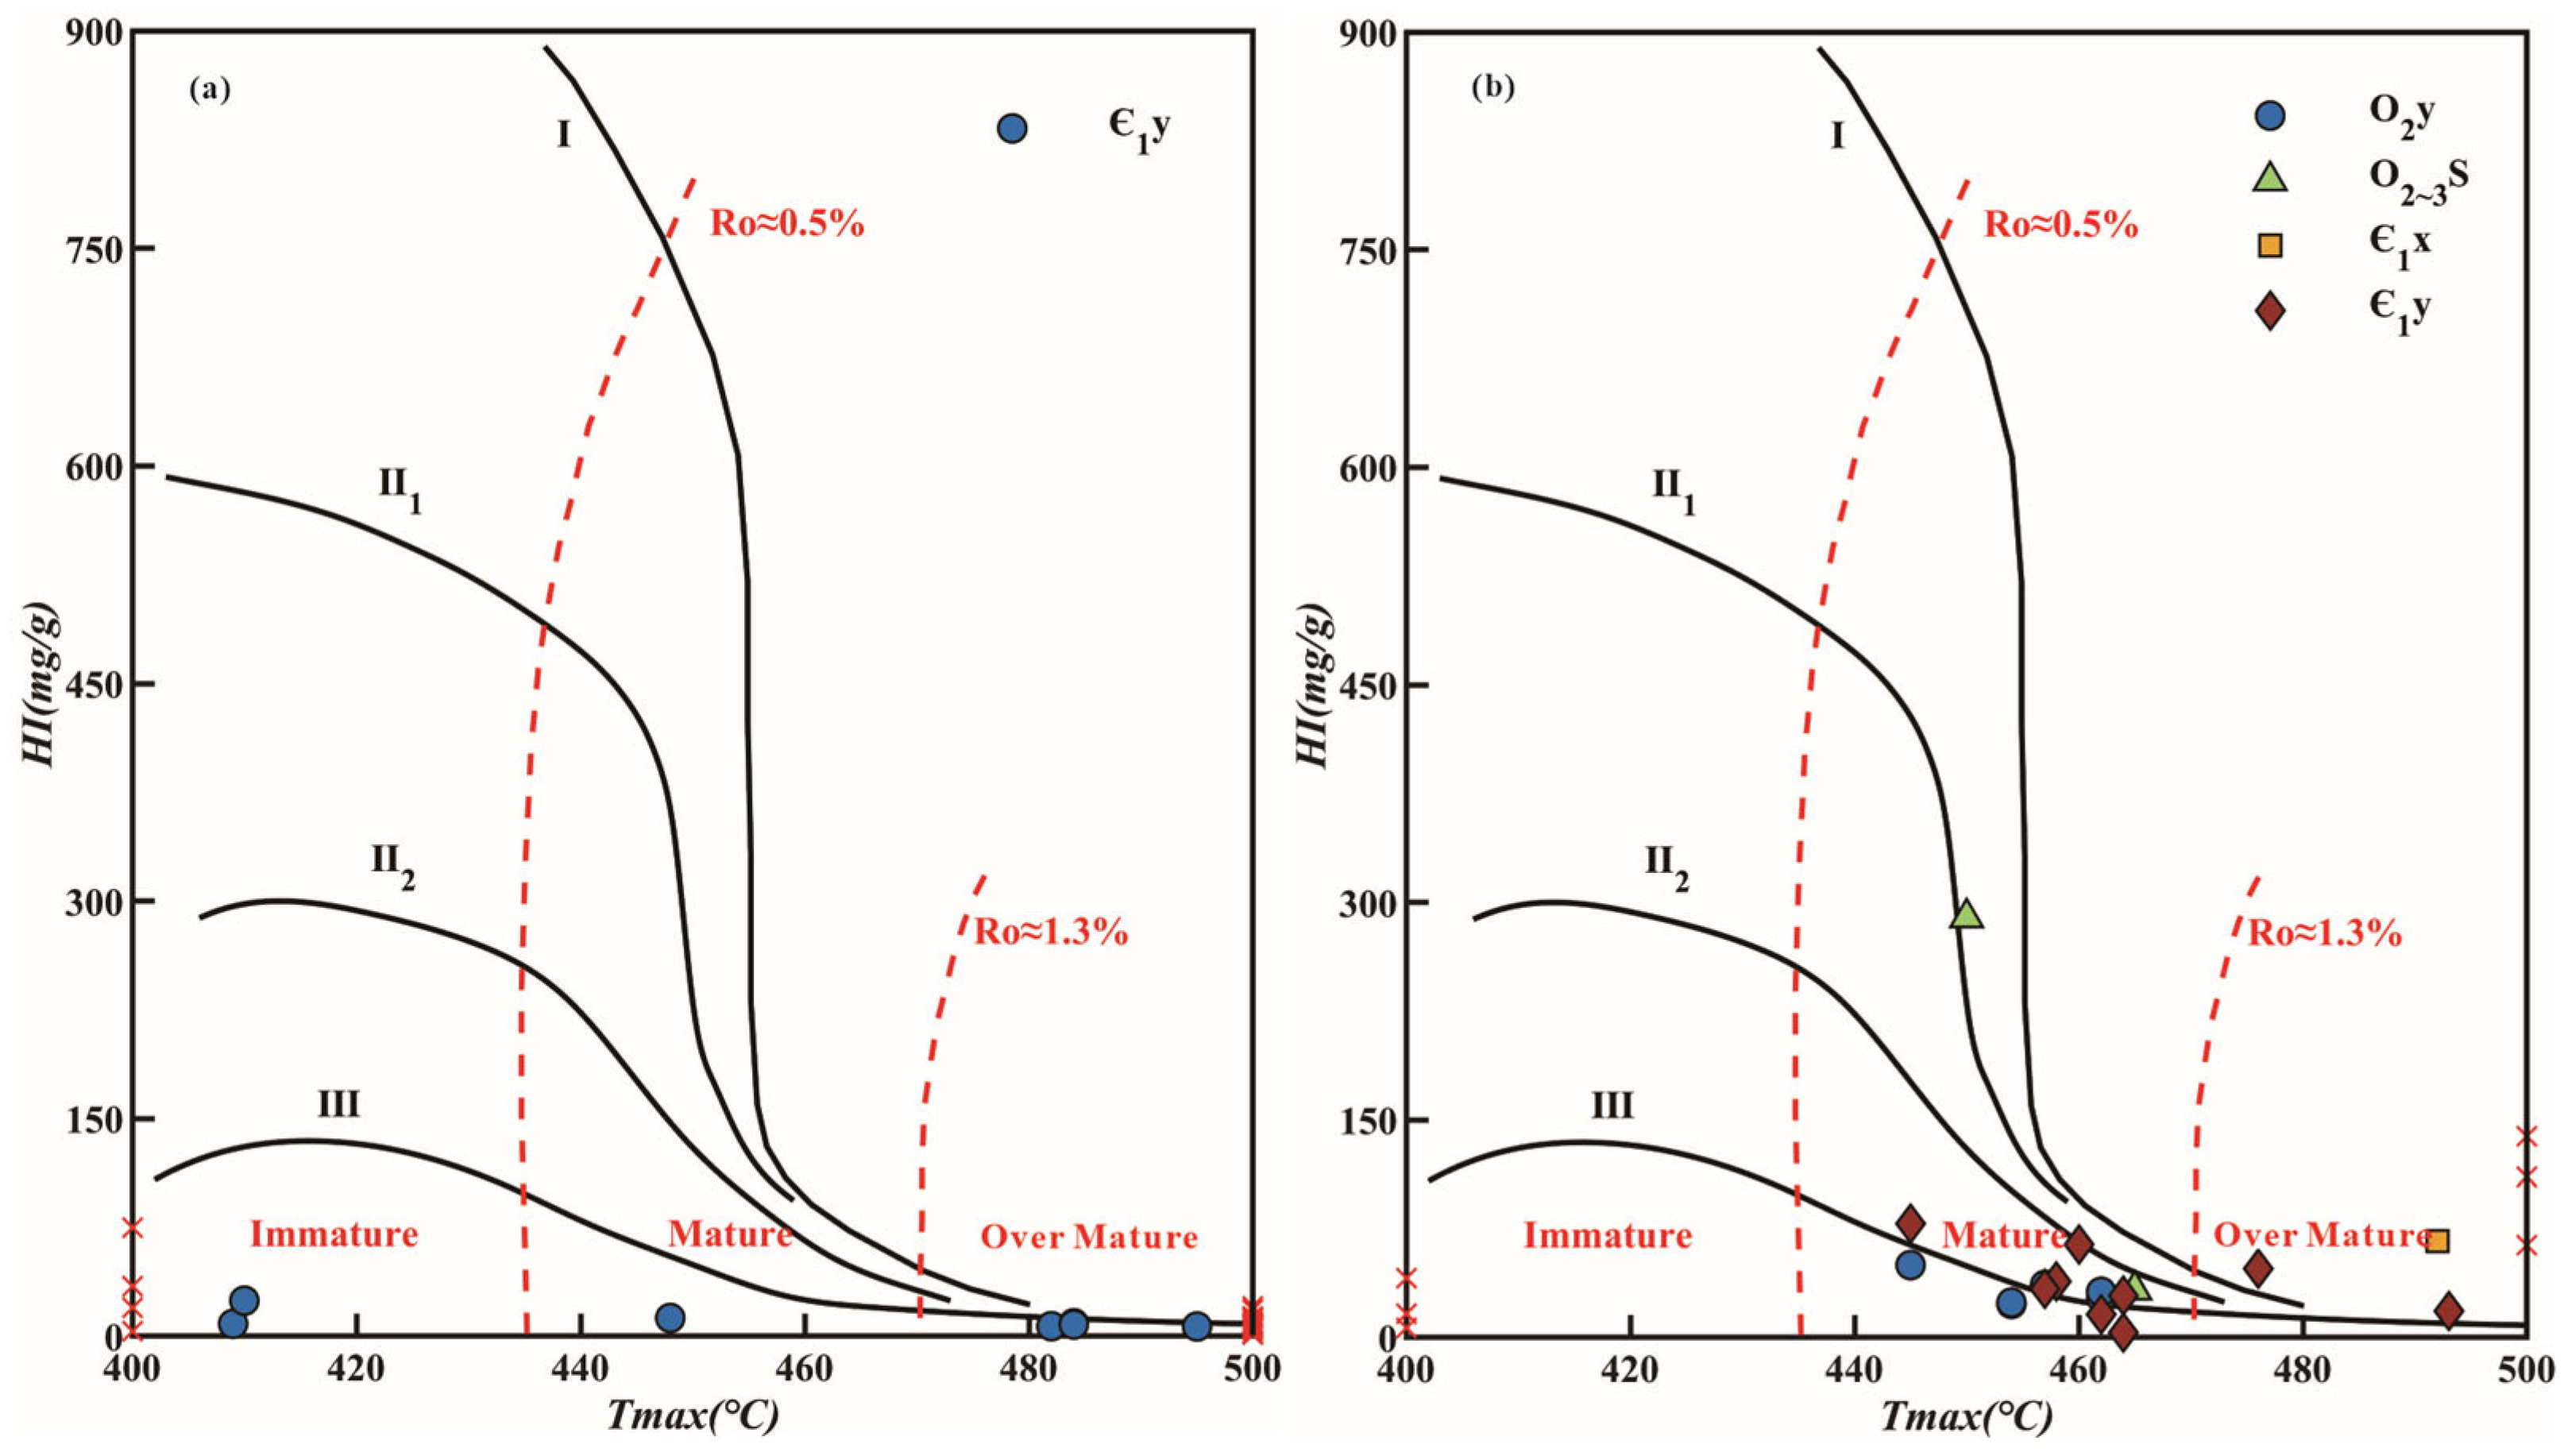
The pyrolysis results of the field outcrop samples (Table 3) align with findings from previous studies [42]. In this study, more than half of the Yuertusi samples exhibit Tmax exceeding 500 °C, with only a few exceptions. The HI-Tmax plot (Figure 10a) positions the Yuertusi Formation outcrop samples within the type III kerogen interval and indicates that the Yuertusi source rock has reached an over-mature stage.
The analysis of the downhole core samples presents a contrast to the outcrop samples, with Tmax mostly recorded below 500 °C, which is within the typical range, yet the values are predominantly above 455 °C, suggesting a trend towards high maturity to over-maturity (Figure 10b, Table 3). The HI-Tmax plot further indicates that the majority of the core samples from the Saergan Formation, Yingan Formation, and Yuertusi Formation fall within the type III kerogen category. Only a minority of the samples from the Saergan Formation are situated in the type II1 kerogen interval (Figure 10b).
The above conclusions on the identification of kerogen type are evidently flawed. It is widely accepted that higher plants had not yet emerged on Earth during the Cambrian–Ordovician period, precluding the existence of type III kerogen. The discrepancies in the HI-Tmax diagram may be attributed to both advanced maturation and weathering effects, which can skew pyrolysis results [43]. Zhang Shuichang et al. (2001) found that the organic matter of Cambrian source rocks typically exhibits high maturity, with VER exceeding 1.6%, and the alginite lacks fluorescence, complicating organic matter type discrimination [44]. Given the pervasive high maturity of Cambrian source rocks, conventional organic matter indices may be insufficient for reliable type recognition. The prevailing theory, grounded in the timeline of biological evolution, suggests that the primary kerogen in Cambrian source rocks is predominantly type I–II [11].

5. Mineral Compositions and Microscopic Characterization of the Primary Source Rocks

5.1. Mineral Compositions

To further scrutinize the primary source rock (Yuertusi), outcrop samples with high TOC content were chosen for whole-rock mineral analysis. The results (Table 4) show that the Lower Cambrian Yuertusi shale in the Shiairike outcrop exhibited pronounced silicification, with high quartz content ranging from 53% to 97.8%. This was followed by significant proportions of calcite (32.4%) and dolomite (7–30.5%), along with minor fractions of apatite (3.5–4.9%), feldspar (0.5–2.9%), and clay minerals (1–5.2%). It is worth noting the following: (1) Certain samples from the Yuertusi Formation contain substantial barite (3.1–20.6%), a mineral characteristic of hydrothermal activity, suggesting a hydrothermal diagenetic silicification process within these siliceous shales [45]. (2) The clay mineral content is exceedingly low in almost all outcrop samples (<10%), indicative of extensive weathering and erosion that resulted in the leaching of clay. Moreover, some outcrop samples from the Yuertusi Formation are primarily composed of dolomite (50.2–94.6%) or calcite (85.5%), with lesser quantities of quartz (3.2–26.2%), gypsum (23.5%), feldspar (0.5–1.9%), apatite (6.8%), and clay minerals (1%), typifying the dolomite and chert interlayers within the formation.

5.2. Microscopic Observation under FE-SEM

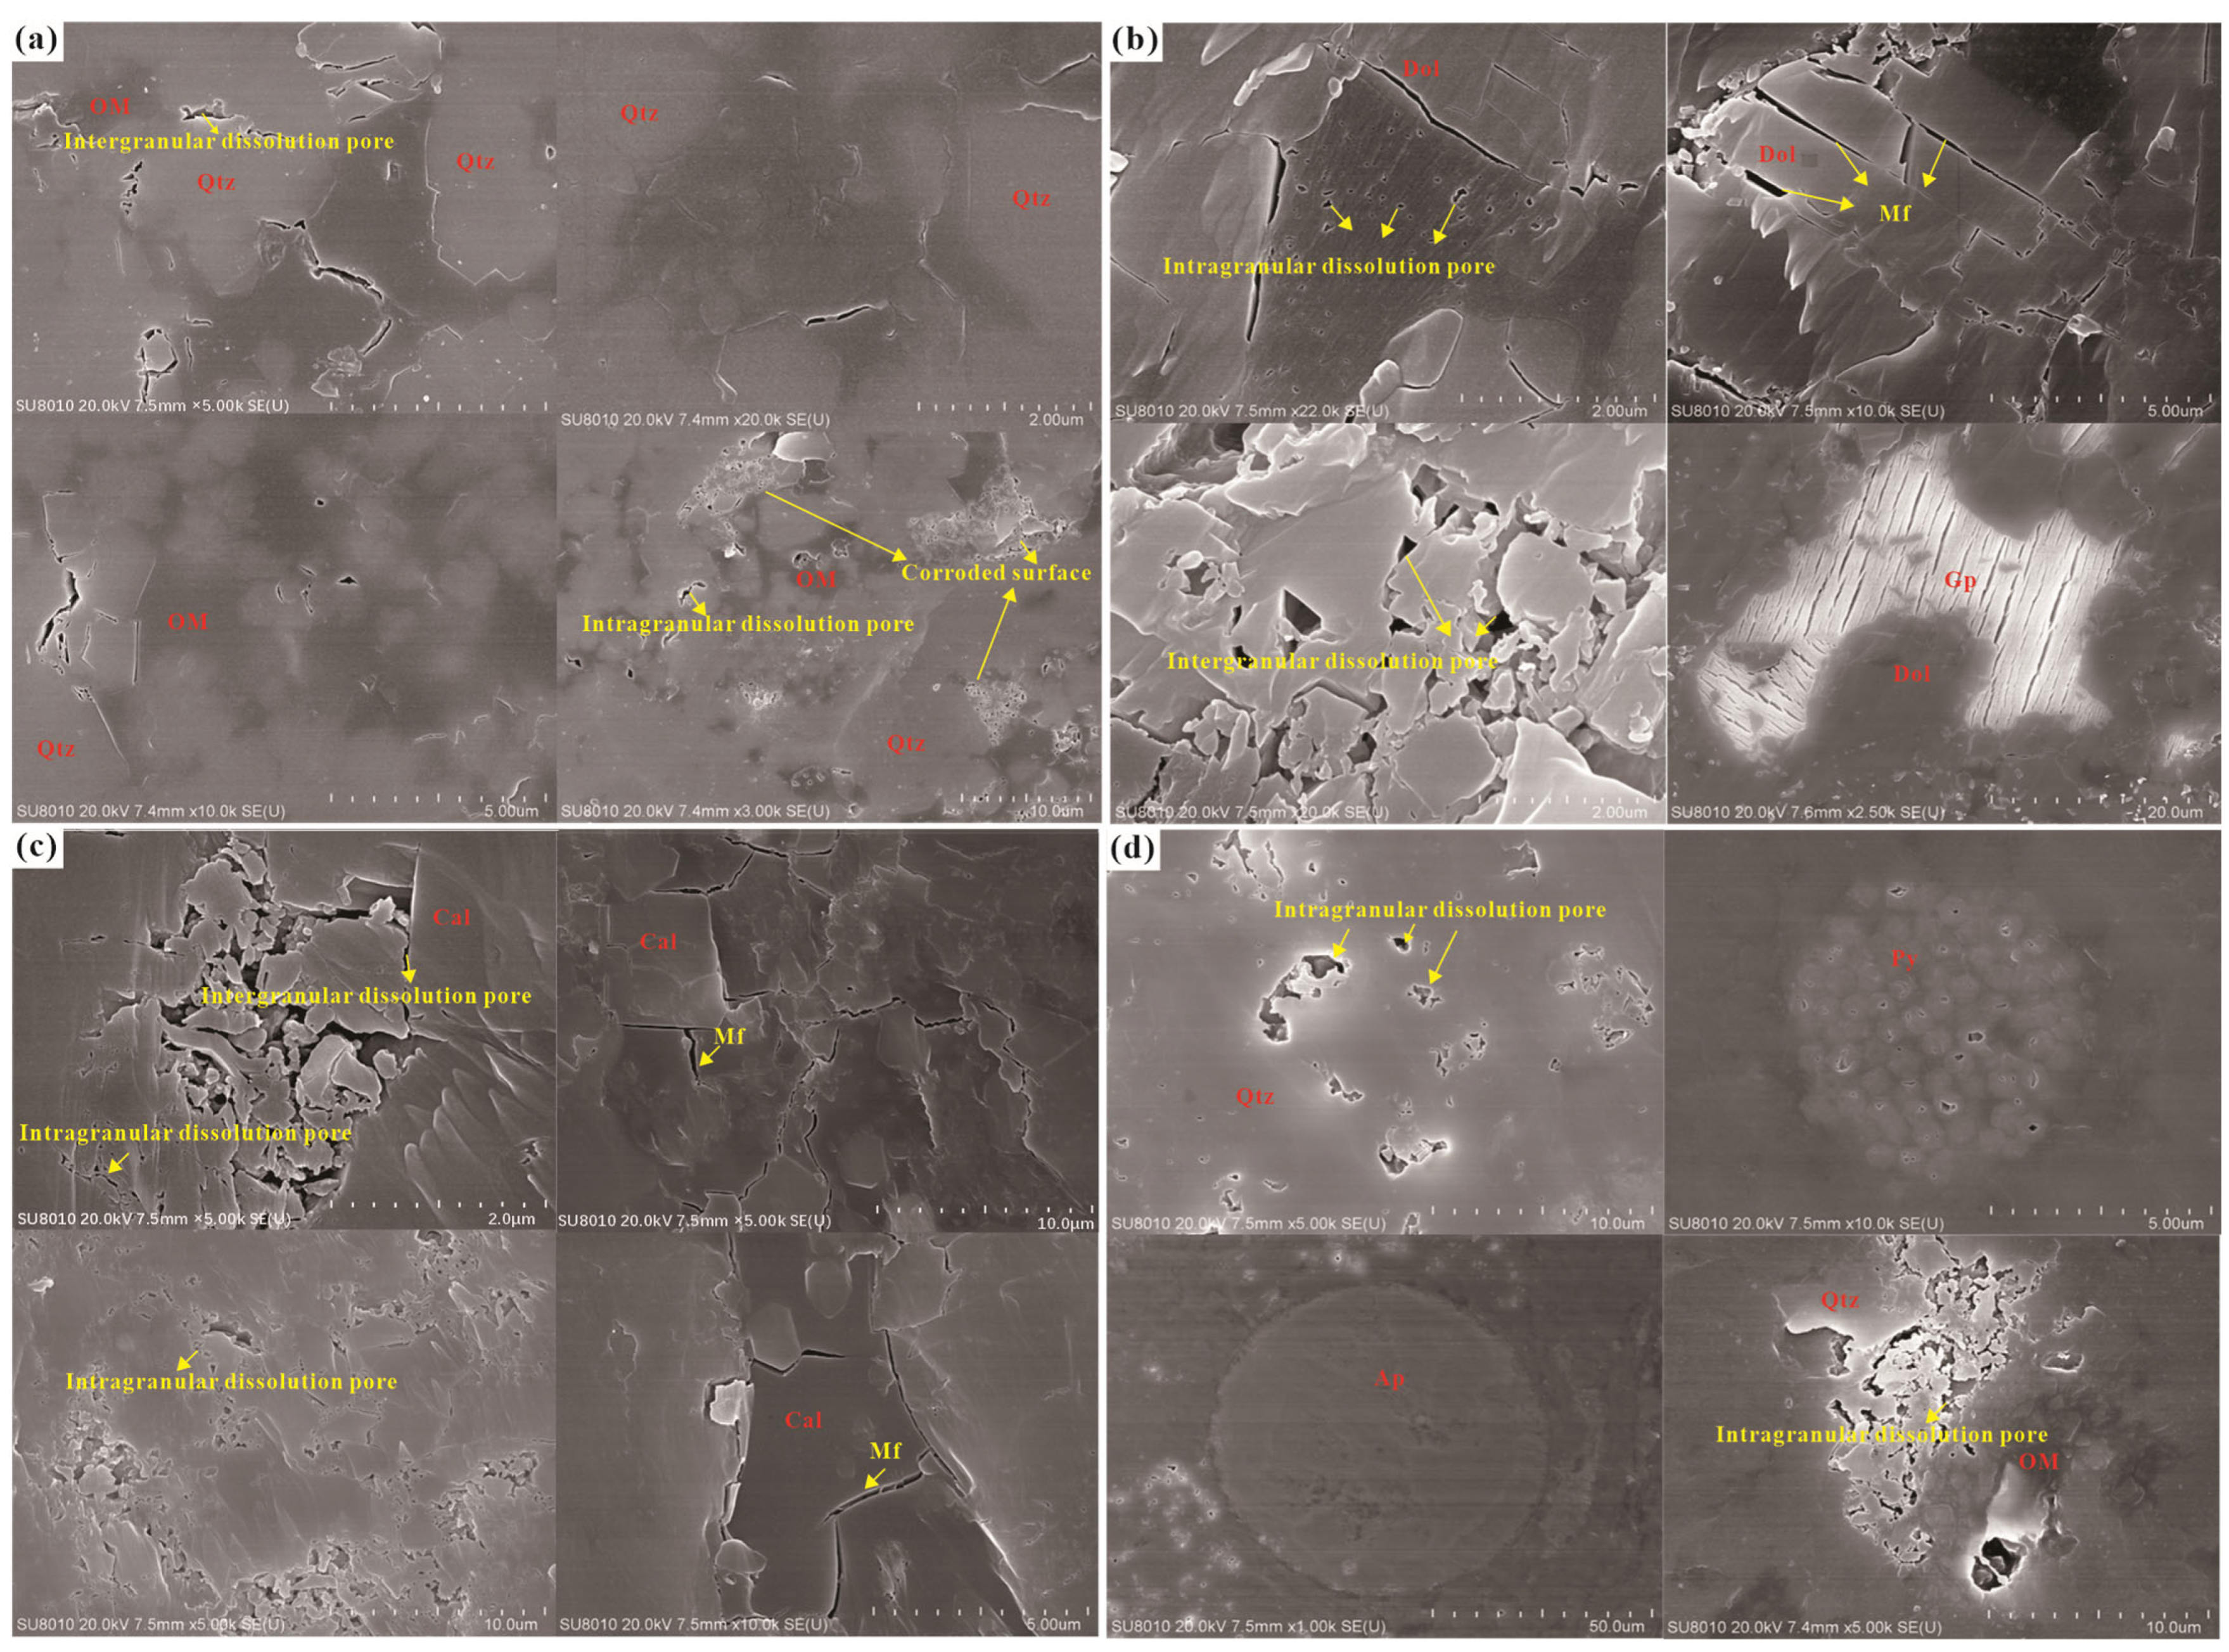
Scanning electron microscope observations (Figure 11) reveal that the Yuertusi Formation outcrop samples primarily feature dissolution pores, alongside the presence of intergranular pores, intragranular pores, and microcracks.
(1) Intergranular and intragranular dissolution pores: Influenced by dissolution, mineral grains exhibit partial dissolution, leading to the formation of intergranular and intragranular dissolution pores. The Yuertusi Formation samples are predominantly rich in quartz and exhibit extensive silicification, with hydrothermal activity being the main contributor [45].
Apatite presence in the siliciclastic shales (Figure 11d) further indicates hydrothermal activity [45]. Meanwhile, strong compaction has led to quartz grains predominantly exhibiting mosaic contact, with evident pressure dissolution (Figure 11a). Quartz dissolution presents as grains and siliceous cement dissolving into harbor-like, jagged surfaces with the development of dissolution pits. These can be categorized into three scenarios: edges of quartz particles dissolving, significant dissolution at the secondary plus large margins of quartz, and partial or complete dissolution of quartz particles [46].
(2) Microfractures: Microfractures are extensively developed in the interbedded limestones and dolomites of the Yuertusi Formation (Figure 11b,c). The presence of gypsum in the dolomite layers (Figure 11b) indicates that while the primary deposition environment of the Yuertusi Formation was a stable carbonate gentle slope in a deep-water facies, there were episodes of uplift or the transient emergence of evaporite platforms, leading to the formation of gypsum–salt rocks [41]. Additionally, outcrop samples from the Yuertusi Formation typically exhibit high TOC and a proliferation of organic matter contraction joints. The presence of strawberry-shaped pyrite in the siliceous shales (Figure 11d) is common, signifying formation in an anoxic environment.

6. Simulation of Hydrocarbon Generation

6.1. One-Dimensional Hydrocarbon Accumulation Simulation

One-dimensional hydrocarbon accumulation simulation for the XSD-1 Well (Figure 12a) indicates that the Saergan source rock underwent rapid burial post-deposition, reaching approximately 2000 m in depth, and entered the oil window at the end of the Caledonian period (Ro > 0.5%). During the Hercynian period, tectonic uplift affected the region, causing the burial depth of the Saergan to become shallower, and consequently, the source rock remained in the early stage of oil generation. In the late Hercynian to early Indosinian period, the Saergan source rock experienced another rapid burial, with the maximum depth reaching about 4000 m. At this juncture, the maximum formation temperature was about 200 °C, and the Ro reached 2.0%. This increase in temperature and pressure caused the organic matter within the source rock to enter the gas-generating stage.
One-dimensional hydrocarbon accumulation simulation for the XSC-1 Well shows that (Figure 12b) after deposition, Yuertusi source rock underwent consistent burial throughout the Cambrian and Ordovician, reaching approximately 3000 m depth by the late Ordovician, with Ro attaining 1.0%, signifying oil generation. Following Caledonian uplift, the formation was rapidly buried to 4500 m depth, with source rock Ro reaching 2.0% and entering high maturity by the late Silurian. During the Hercynian, the source rock sustained this high maturity due to tectonic uplift. From the late Hercynian to early Indosinian, rapid burial resumed, maxing at roughly 6000 m depth, with Ro approximately 4.0%. At this stage, the source rock entered high or over-maturity, initiating extensive gas generation. From the Indosinian to the present, Yuertusi source rock has exhibited an uplift trend, with Ro exceeding 4.0%, indicative of an over-mature stage.
It is noteworthy that both wells are situated along the Shajingzi Fault Belt, straddling the transitional zone between the Awati Sag and the Keping Fault Uplift. The simulation outcomes specifically illuminate the Lower Paleozoic source rock evolution within this fault belt.

6.2. Two-Dimensional Hydrocarbon Accumulation Simulation

To elucidate the hydrocarbon generation/evolution process of the Lower Paleozoic source rocks and the hydrocarbon accumulation in the Awati Sag, this study executed a two-dimensional hydrocarbon accumulation simulation. This simulation was based on seismic interpretation cross-section (NW-SE direction) encompassing the “FN-1 well—XSD-1 well—GM-1 well”, as rendered by the Bureau of Geophysical Prospecting INC, China National Petroleum Corporation (BGP). The Awati Sag features all stratigraphic layers except for the Jurassic and Cretaceous strata. Notably, the vertical strata in the Shajingzi Fault Belt lack not only Jurassic and Cretaceous formations, but also Triassic and Devonian formations due to erosion, creating several unconformities at the tops of the Silurian, Devonian, Carboniferous, and Permian layers (Figure 13e).
The simulation’s source rock parameters primarily derive from geochemical analyses of source rocks and 1D simulations conducted in this study. For the two-dimensional simulation, fault closure settings adhere to specific criteria: faults remain open during periods of active tectonic movement and closed when tectonic activity is dormant [6,47]. This simulation employs Petromod’s Combined Darcy flow and Invasion Percolation methods.
Two-dimensional hydrocarbon accumulation simulation shows:
(1) By the end of the Upper Ordovician (443.8 Ma), the two premium Paleozoic source rocks in the Awati Sag had not matured, leading to no hydrocarbon generation (Figure 13a).
(2) From the Early to Middle Silurian (443.8–419.2 Ma), significant hydrocarbon generation occurred from the Yuertusi Formation in the Awati Sag. The produced hydrocarbons primarily migrated upwards to the Lower Cambrian reservoir (Xiaoerbulake reservoir) and, to a lesser extent, downwards to the Cambrian reservoir (Qigebulake reservoir). During this period, depositional subsidence was relatively uniform, facilitating primarily vertical migration (Figure 13b).
(3) During the Late Silurian to Early Devonian (419.2–358.9 Ma), tectonic uplift led to partial erosion and exposure of Silurian strata within the study area. In the early stage of the Hercynian Movement, the Awati Sag subsided again, spurring sustained oil generation from the Yuertusi Formation. The generated oil started to accumulate in some low-amplitude uplifts. Vertical migration continued as the primary mechanism for oil and gas movement, with principal reserves maintained within Cambrian formations. In deeper zones, some oil reservoirs underwent cracking, initiating gas production (Figure 13c).
(4) From the Late Devonian to the Permian period (358.9–251.9 Ma), following Late Devonian tectonic uplift and erosion, the Awati Sag underwent continued subsidence and was subjected to Carboniferous sedimentation. Oil generation commenced from the Saergan source rock, with the produced oil predominantly accumulating in the Ordovician reservoirs. During this time, the Yuertusi Formation remained active within the oil-generation window (with a bottom boundary depth of less than 4500 m). By the end of the Permian, the Yuertusi Formation had reached high-to-over-maturity, leading to substantial gas generation, whereas the Saergan Formation entered a high-maturity stage, primarily producing wet gas. Notably, this period experienced the development of numerous deep faults due to intense tectonic activity. These faults facilitated connectivity between the Cambrian–Permian reservoirs, enabling deep-seated oil and gas to migrate along these faults towards shallower depths and accumulate at structurally favorable positions near the Silurian and Carboniferous formations (Figure 13d). Consequently, the oil and gas present in the Ordovician strata were sourced from both the Yuertusi and Saergan Formations, with the Yuertusi Formation being the dominant source. Meanwhile, the accumulation of hydrocarbons in the Silurian and Carboniferous formations resulted from mixed sources.
(5) Indosinian–Yanshanian Period: Following the Indosinian Period, early Yanshanian tectonics uplifted the region, erasing all Jurassic deposits. Throughout the late Yanshanian to the Cenozoic’s conclusion, tectonic subsidence prevailed, with subsidence rates surging in the Cenozoic. By then, the Saergan Formation within the Awati Sag had been buried beyond 7000 m, cracking all prior oil reservoirs within the Carboniferous, Ordovician, and Cambrian strata. Only oil that migrated earlier from deep into the relatively shallow Neogene and Quaternary formations remained, mainly localized in low-amplitude uplifts adjacent to faults, establishing most oil and gas accumulations in the Awati Sag. Notably, Himalayan tectonics transformed the lower regions into elevated ones during this period, reversing the lateral migration direction of oil and gas. Consequently, oil and gas accumulations markedly increased in these newly raised areas, potentially offering prime locations for exploring deep-buried hydrocarbons (Figure 13e).

7. Hydrocarbon Accumulation Modes in the Awati Sag and Surrounding Areas

The hydrocarbon accumulation model in the Awati Sag can be concisely described as “dual-source rock hydrocarbon provision; early oil followed by late gas, continuous kerogen-derived hydrocarbon generation coupled with paleo-oil reservoir cracking; deep fault regulation on hydrocarbon accumulation, and prevalent mixed-source contributions” (Figure 14).
“Dual-source rock hydrocarbon provision”: The primary source rocks are the Lower Cambrian Yuertusi Formation, situated at approximately 9000–10,000 m, and the Lower Ordovician Saergan Formation, exceeding 7000 m in depth. The Yuertusi Formation, with its greater thickness of around 200 m versus the Saergan Formation’s 100 m, broad distribution, and higher organic matter content—peaking at 18.98% and averaging 5.82%—is deemed the most crucial Lower Paleozoic source rock within the Awati Sag.
“Early oil followed by late gas, continuous kerogen-derived hydrocarbon generation coupled with paleo-oil reservoir cracking”: The Yuertusi and Saergan source rocks in the Awati Sag are composed of Type I and II1 organic matter, both following a hydrocarbon generation pattern characterized by “early oil generation, late gas generation”. The Yuertusi Formation commenced oil generation in the early Silurian and transitioned to gas generation by the late Permian. Similarly, the Saergan Formation started generating oil during the Carboniferous period and began gas generation by the late Permian.
“Deep fault regulation on hydrocarbon accumulation, and prevalent mixed-source contributions”: Strata below 6000 m in the Awati Sag predominantly contain gas reservoirs. Prospective layers for ultra-deep natural gas exploration include the Sinian reservoir (exceeding 9000 m depth), the Lower Cambrian reservoir (approximately 7300–7500 m), the Ordovician reservoir (7000–7300 m), the Silurian reservoir (6000–7000 m), and the Carboniferous reservoir (5500–7000 m). These potential gas accumulations are largely associated with structural traps close to the deep and major faults. Conversely, oil reservoirs are primarily located within shallower Paleogene layers (around 3500 m depth) and along the Shajingzi fault zone.
Within the Awati Sag, several low-amplitude uplifts provided conducive settings for hydrocarbon accumulation. Indications of oil reservoirs in these areas include features like the Silurian asphalt sand in the SL-1 well, primarily resulting from the secondary cracking of oil into gas from the Yuertusi Formation source rock. Post-Carboniferous tectonic activity initiated the development of deep major faults within the sag. Subsequent destruction of early structural high points led to the widespread migration of hydrocarbons into shallower strata via these fault systems. Consequently, hydrocarbons accumulated in the low-amplitude uplifts proximate to these major faults.
There are certain differences in the oil and gas sources of the main reservoirs inside the Awati Sag: gas accumulations in the Sinian and Lower Cambrian reservoirs all originate from the Yuertusi Formation and can be classified as the near-source accumulation. This is consistent with previous research [48]. The gas in the Ordovician, Silurian, and Carboniferous reservoirs generally exhibits a mixed-source phenomenon: in addition to the dual contribution of kerogen gas from the Saergan and Yuertusi Formations, there is also the contribution of cracking gas generated by early oil reservoir, but the relative contributions of three sources are different at each layer, and related research can still be deepened further.
The Shajingzi Fault Belt, located adjacent to the Awati Sag, shows evidence of both oil (predominantly) and gas from the Upper Ordovician to the Paleogene strata. The 2D hydrocarbon simulation confirmed that this hydrocarbon presence was primarily mixed-source from the Saergan and Yuertusi Formations of the Awati Sag. The simulation results were also verified by previous oil/gas-source correlation research. Xi Qing et al. (2016) posited that Triassic oil in the Shanan region (SN1 and SN-2) exhibits an exceptionally low abundance of gammacerane and a relatively high presence of rearranged steranes, along with a low concentration of C28 regular steranes, a profile that correlates with the Ordovician source rock [7]. Zhang Shuhai et al. (2021) concluded that the oil in Silurian asphaltic sands and Ordovician limestones was mixed-source from the Yuertusi and Saergan Formations [49]. Zhang Jinhu et al. (2022) believed that the SN-1 and SN-2 (Shajingzi fault belt) Triassic oil migrated from the Awati Sag, characterized by high sulfur content, low wax content, lower Pr/Ph, and C30 diahopanes/C30 hopane ratios, high tricyclic terpenoids/pentacyclic terpenoid ratios, high C29 hopane/C30 hopane and sterane/hopane ratios, and a high content of dibenzothiophene in the three-fluorene series, indicating marine origin (from the Lower Paleozoic) [50].
Furthermore, the presence of basin-controlling faults along the Shajingzi Fault Belt suggests that the mixing of natural gas sources in this area is likely to be more complex. The expected gas mix includes inorganic deep gas, kerogen-cracked gas from the Saergan and Yuertusi formations, and oil-cracking gas. The complexity of these interactions and contributions means that the exact nature of the mixed hydrocarbons, particularly in terms of their migration and entrapment along the fault belt, might represent a significant area for further research and exploration.

8. Conclusions

1. In the Lower Paleozoic of the Awati Sag and its adjacent regions, four potential source rock formations are identified: the Yuertusi, Xiaoerbulake, Saergan, and Yingan Formations. The Yuertusi and Saergan Formations, distinguished by their high organic content, are considered high-quality source rocks. Despite their advanced maturity, they retain notable hydrocarbon generation potential. Conversely, the Yingan and Xiaoerbulake Formations are classified as suboptimal or non-source rocks. Notably, the Yuertusi Formation, with its considerable thickness (approximately 200 m compared to the Saergan Formation’s 100 m), broader distribution, and higher organic content (TOC reaching 18.98% with an average of approximately 5%), stands out as the Lower Paleozoic’s most critical source rock layer in the Awati Sag.
2. The Yuertusi and Saergan Formations in the Awati Sag remain active hydrocarbon sources, transitioning from early-stage oil to late-stage gas production, and are now highly to over-mature. Oil generation in the Yuertusi Formation initiated in the early Silurian and shifted to gas by the late Permian. Similarly, the Saergan Formation began producing oil in the Carboniferous, moving to gas generation by the late Permian.
3. The Awati Sag exhibits a dual-source rock system for hydrocarbon supply, characterized by early-stage oil and late-stage gas generation, alongside continuous hydrocarbon generation and oil cracking, under the influence of deep major fault control. Viable targets for ultra-deep natural gas exploration include the Sinian (beyond 9000 m depth), Lower Cambrian (approximately 7300–7500 m), Ordovician (7000–7300 m), Silurian (6000–7000 m), and Carboniferous reservoirs (5500–7000 m). These potential deep and ultra-deep natural gas reserves primarily reside in structural traps adjacent to profound faults within these five strata, displaying mixed-source gas characteristics. The natural gas mixing is particularly intense along the Shajingzi fault belt, driven by the basin-controlling deep faults.

Author Contributions

Z.S.: Supervision, Investigation, Writing—review and editing. Z.Z.: Methodology, Investigation, Writing—original draft, Data curation. X.D.: Investigation, Writing—original draft, Data curation. Y.Z.: Project administration, Resources, Supervision, Investigation, Data curation. Z.B.: Project administration, Resources. L.L.: Project administration, Resources. Y.G.: Project administration, Resources. All authors have read and agreed to the published version of the manuscript.

Funding

This research was funded by the National Natural Science Foundation of China, grant numbers 42272161 and 41802173; and China University of Petroleum, Beijing, grant number 2462023BJRC023.

Data Availability Statement

The authors confirm that the data supporting the findings of this study are available on request.

Acknowledgments

We thank the Oil & Gas Survey of China Geological Survey for providing core samples and necessary data.

Conflicts of Interest

The authors declare no conflicts of interest.

References

  1. Li, Q.; Liu, J.; Wang, S.; Guo, Y.; Han, X.; Li, Q.; Cheng, Y.; Dong, Z.; Li, X.; Zhang, X. Numerical insights into factors affecting collapse behavior of horizontal wellbore in clayey silt hydrate-bearing sediments and the accompanying control strategy. Ocean Eng. 2024, 297, 117029. [Google Scholar] [CrossRef]
  2. Li, Q.; Wang, F.; Wang, Y.; Bai, B.; Zhang, J.; Lili, C.; Sun, Q.; Wang, Y.; Forson, K. Adsorption behavior and mechanism analysis of siloxane thickener for CO2 fracturing fluid on shallow shale soil. J. Mol. Liq. 2023, 376, 121394. [Google Scholar] [CrossRef]
  3. Zhao, W.; Wang, Z.; Huang, F.; Zhao, Z.; Jiang, H.; Xu, Y. Hydrocarbon accumulation conditions and exploration position of ultra-deep reservoirs in onshore superimposed basins of China. Acta Pet. Sin. 2023, 44, 2020. [Google Scholar]
  4. Song, Z.; Ding, X.; Zhang, B.; Ge, B.; Tian, X.; Chen, X.; Ma, K.; Peng, H.; Wang, Y.; Yang, D. Dynamic reconstruction of the hydrocarbon generation, accumulation, and evolution history in ultra-deeply-buried strata. Front. Earth Sci. 2022, 10, 927903. [Google Scholar] [CrossRef]
  5. Song, Z.; Lv, M.; Zhao, L.; Liu, C.; He, Y.; Zhang, Y.; Lobusev, M.A. A novel bound water occurrence model for tight sandstone. Fuel 2024, 357, 130030. [Google Scholar] [CrossRef]
  6. Zhang, J.; Zhang, Y.; Gao, Y. Silurian hydrocarbon exploration breakthrough and its implications in the Shajingzi structural belt of Tarim Basin, NW China. Pet. Explor. Dev. 2022, 49, 233–246. [Google Scholar] [CrossRef]
  7. Xi, Q.; Yu, H.; Gu, Q.; Qian, L.; Li, X.; Li, Y. Main hydrocarbon source rocks and contrasts for aeati sag in tarim basin. Pet. Geol. Oilfield Dev. Daqing 2016, 35, 12–18. [Google Scholar]
  8. Gao, Z.; Shi, J.; Lv, J.; Chang, Z. High-frequency sequences, geochemical characteristics, formations, and distribution predictions of the lower Cambrian Yuertusi Formation in the Tarim Basin. Mar. Pet. Geol. 2022, 146, 105966. [Google Scholar] [CrossRef]
  9. Huang, S.; Ren, H.; Yiqian, Q. Recognition of Cambrian Pre-salt Source Rock in the Central and Western Part of Tarim Basin. Offshore Oil 2017, 37, 14–20. [Google Scholar]
  10. Yang, Z.Y.; Luo, P.; Liu, B.; Liu, C.; Ma, J.; Chen, F.R. The difference and sedimentation of two black rock series from Yurtus Formation during the earliest Cambrian in the Aksu area of Tarim Basin, Northwest China. Acta Petrol. Sin. 2017, 33, 1893–1918. [Google Scholar]
  11. Wu, J.; He, X.; Ni, X.; Huang, L.; Xiong, R. Characteristics of the Lower Cambrian Yuertus Formation Source Rocks in the Tarim Basin, NW China; IOP Conference Series: Earth and Environmental Science, 2019; IOP Publishing: Bristol, UK, 2019; p. 012043. [Google Scholar]
  12. Zhu, G.; Chen, F.; Chen, Z.; Zhang, Y.; Xing, X.; Tao, X.; Ma, D. Discovery and basic characteristics of the high-quality source rocks of the Cambrian Yuertusi Formation in Tarim Basin. Nat. Gas Geosci. 2016, 27, 8–21. [Google Scholar] [CrossRef]
  13. Lu, X.; Li, J.; Zhao, F. Re-cognition on petroleum exploration prospect of marine carbonates in western Tarim Basin. Mar. Orig. Pet. Geol. 2007, 12, 10–14. [Google Scholar]
  14. Zheng, J.; Li, B.; Liu, Y.; Xiao, P.C.; Li, Q.Q. Study on thermal evolution modeling of Lower Cambrian Yuertusi source rock, Tarim Basin. Reserv. Eval. Dev. 2018, 8, 7–12. [Google Scholar]
  15. Wang, F.Y.; Du, Z.L.; Zhang, B.M.; Zhao, M.J. Geochemistry of Salgan black shales of Middle-Upper Ordovician in keping outcrop, Tarim Basin. Xinjiang Pet. Geol. 2008, 29, 687. [Google Scholar]
  16. Wang, F.; Zhang, S.; Zhang, B.; Xiao, Z.; Liu, C. Maturity and its history of Cambrian marine source rocks in the Tarim Basin. Geochimica 2003, 32, 461–468. [Google Scholar]
  17. Liang, Z.L.; Gang, W.Z.; Ye, Z.X. Hydrocarbon expulsion history of Middle-Upper Ordovician source rocks in Tarim Basin. Xinjiang Pet. Geol. 2008, 29, 53. [Google Scholar]
  18. Zhang, S.; Gao, Z.; Li, J.; Zhang, B.; Gu, Q.; Lu, Y. Identification and distribution of marine hydrocarbon source rocks in the Ordovician and Cambrian of the Tarim Basin. Pet. Explor. Dev. 2012, 39, 305–314. [Google Scholar] [CrossRef]
  19. Chen, Q.; Chu, C.; Yang, X.; Hu, G.; Shi, Z.; Jiang, H.; Shen, B.; Liu, W. Sedimentary model and development of the Cambrian source rocks in the Tarim Basin, NW China. Pet. Geol. Exp. 2015, 37, 689–695. [Google Scholar]
  20. Zhang, C.; Guan, S.; Wu, L.; Ren, R. Hydrothermal activity and depositional model of the Yurtus Formation in the Early Cambrian, NW Tarim, China. Earth Sci. Front. 2019, 26, 202. [Google Scholar]
  21. Du, J.; Pan, W. Accumulation conditions and play targets of oil and gas in the Cambrian subsalt dolomite, Tarim Basin, NW China. Pet. Explor. Dev. 2016, 43, 360–374. [Google Scholar] [CrossRef]
  22. Hong, H.; Peng, S.P.; Shao, L.Y.; Gao, Y.F.; Shi, Z.B. Sedimentology and palaeogeography of the Cambrian-Ordovician in Bachu uplift and Awati depression, the Tarim Basin. Coal Geol. Explor. 2002, 30, 1–4. [Google Scholar]
  23. Gao, Y.; Ren, C.; Fang, Q.; Wu, H.; Shi, M.; Zhang, S.; Yang, T.; Li, H. Cycle stratigraphy of Ordovician Sargan Formation in Tarim Basin. Acta Sedimentol. Sin. 2022, 15, 1–15. [Google Scholar]
  24. Ma, A.; Li, H.; Li, J.; Gao, X.; Wang, F.; Yao, Y.; Feng, F. Geochemical characteristics of Middle-Upper Ordovician source rocks in the Kalpin outcrop profiles and marine oil-source correlation, Tarim Basin, NW China. J. Nat. Gas Geosci. 2020, 5, 143–155. [Google Scholar] [CrossRef]
  25. Gao, Z.; Zhang, S.; Li, J.; Zhang, B.; Gu, Q.; Lu, Y. Distribution and sedimentary environments of Salgan and Yingan shales of the Middle-Upper Ordovician in western Tarim Basin. J. Palaeogeogr. 2010, 12, 599–608. [Google Scholar]
  26. Song, Z.; Abula, A.; Lyu, M.; Zhang, Y. Quantitative analysis of nitrogen adsorption hysteresis loop and its indicative significance to pore structure characterization: A case study on the Upper Triassic Chang 7 Member, Ordos Basin. Oil Gas Geol. 2023, 44, 495–509. [Google Scholar]
  27. SY/T5163-2010; Analysis Method for Clay Minerals and Ordinary Non-Clay Minerals in Sedimentary Rocks by the X-ray Diffraction. National Energy Administration: Beijing, China, 2010.
  28. Burnham, A.K. A Simple Kinetic Model of Petroleum Formation and Cracking; Lawrence Livermore National Lab: Livermore, CA, USA, 1989. [Google Scholar]
  29. Waples, D.W.; Suizu, M.; Kamata, H. The art of maturity modeling. Part 2: Alternative models and sensitivity analysis. AAPG Bull. 1992, 76, 47–66. [Google Scholar]
  30. di Primio, R.; Horsfield, B. From petroleum-type organofacies to hydrocarbon phase prediction. AAPG Bull. 2006, 90, 1031–1058. [Google Scholar]
  31. Jin, Z.; Tan, X.; Tang, H.; Shen, A.; Qiao, Z.; Zhang, J.; Li, F.; Zhang, S.; Chen, L.; Zhou, C. Sedimentary environment and petrological features of organic-rich fine sediments in shallow water overlapping deposits: A case study of Cambrian Yuertus Formation in northwestern Tarim Basin, NW China. Pet. Explor. Dev. 2020, 47, 513–526. [Google Scholar] [CrossRef]
  32. Zhang, J.; Li, B.; Wu, H.; Yuan, Q.; Liu, Y.; Xiao, P. Study on the thermal history of the source rock and its relationship with hydrocarbon accumulation based on the basin modeling technology: A case of the Yuertusi Formation of Tarim Basin. Editor. Dep. Pet. Geol. Recovery Effic. 2018, 25, 39–49. [Google Scholar]
  33. Liu, S.; Lei, X.; Feng, C.; Li, X. Heat Flow, Deep Formation Temperature and Thermal Structure of the Tarim Basin, Northwest China; EGU General Assembly Conference Abstracts; China Peace Audio Video Electronic Publishing House: Beijing, China, 2018; p. 1. [Google Scholar]
  34. Li, M.; Wang, T.; Chen, J.; He, F.; Yun, L.; Akbar, S.; Zhang, W. Paleo-heat flow evolution of the Tabei Uplift in Tarim Basin, northwest China. J. Asian Earth Sci. 2010, 37, 52–66. [Google Scholar] [CrossRef]
  35. Rao, D.; Zhang, P.; Qiu, Y. Discussion on lower limit of content of organic matter for effective source rocks. Pet. Geol. Exp. 2003, 25, 578–581. [Google Scholar]
  36. Liu, X.-B.; Liu, G.-D.; Jiang, W.-Y.; Song, Z.-Z.; Wang, N. Organic geochemistry and petrology of source rocks from the Banqiao Sag, Bohai Bay Basin, China: Implications for petroleum exploration. Pet. Sci. 2022, 19, 1505–1515. [Google Scholar] [CrossRef]
  37. Passey, Q.; Creaney, S.; Kulla, J.; Moretti, F.; Stroud, J. A practical model for organic richness from porosity and resistivity logs. AAPG Bull. 1990, 74, 1777–1794. [Google Scholar]
  38. Chen, J.; Liang, D.; Zhang, S.; Deng, C.; Zhao, Z.; Zhang, D. Evaluation criterion and methods of the hydrocarbon generation potential for China’s Paleozoic marine source rocks. Acta Geol. Sin. 2012, 86, 1132–1142. [Google Scholar]
  39. Li, H.; Shao, Z.; He, Z. Hydrocarbon generation characteristics and potential of bitumen in the tarim basin. Pet. Geol. Exp. 2009, 31, 373–378. [Google Scholar]
  40. Zhang, Q.; Huang, T.Z.; Li, H.L.; Li, Y.J.; Jiang, H.S.; Ma, Q.Y.; Cai, X.Y.; Wen, L. The Cenozoic faults in western Tarim Basin, NW China. Acta Petrol. Sin. 2016, 32, 833–846. [Google Scholar]
  41. Zhang, P.H.; Chen, Z.Y.; Xue, L.; Bao, Y.J.; Fang, Y. The differential diagenetic evolution and its influencing factors of Lower Cambrian black rock series in the northwestern margin of Tarim Basin. Acta Petrol. Sin. 2020, 36, 3463–3476. [Google Scholar]
  42. Yang, F.; Yun, L.; Wang, T.; Ding, Y.; Li, M. Geochemical characteristics of the Cambrian source rocks in the Tarim Basin and oil-source correlation with typical marine crude oil. Oil Gas Geol. 2017, 38, 851–861. [Google Scholar]
  43. Tao, G.; Shen, B.; Tenger, B.; Yang, Y.; Xu, E.; Pan, A. Weathering effects on high-maturity organic matter in a black rock series: A case study of the Yuertusi Formation in Kalpin area, Tarim Basin. Pet. Geol. Exp. 2016, 38, 375–381. [Google Scholar]
  44. Zhang, S.; Zhang, B.; Wang, F.; Liang, D.; He, Z.; Zhao, M.; Bian, L. Two sets of marine effective hydrocarbon source beds in the Tarim Basin Ⅰ. Organic matter properties, development environment and control factors. Prog. Nat. Sci. 2001, 3, 39–46. [Google Scholar]
  45. Liu, L.; Gao, Y.; Zhu, G.; Yang, Y.; Yin, C.; Sun, X.; Li, Q. Genesis of siliceous rock in the black rock series of Ediacaran-Cambria transition and its environmental significance in northwestern Tarim bas. Acta Geol. Sin. 2024, 98, 511–529. [Google Scholar]
  46. Liu, J.; Peng, J.; Shi, Y.; Bao, Z.; Sun, Y.; Liu, X.; Zhang, X. The genesis of quartz dissolution in tight sand reservoirs and its impact on pore development: A case study of Xujiahe Formation in the transitional zone of Central-Southern Sichuan Basin. Acta Pet. Sin. 2015, 36, 1090. [Google Scholar]
  47. Wang, Y.; Chen, H.; Guo, H.; Zhu, Z.; Wang, Q.; Yu, P.; Qi, L.; Yun, L. Hydrocarbon charging history of the ultra-deep reservoir in Shun 1 strike-slip fault zone, Tarim Basin. Oil Gas Geol. 2019, 40, 972–989. [Google Scholar]
  48. Wang, Q.; Xu, Z.; Zhang, R.; Yang, H.; Yang, X. New fields, new types of hydrocarbon explorations and their resource potentials in Tarim Basin. Acta Pet. Sin. 2024, 45, 15. [Google Scholar]
  49. Zhang, S. Geochemical Characteristics and Genetic Mechanism of Marine Oil and Gas in Awati Sag. Master’s Thesis, China University of Petroleum, Beijing, China, 2023. [Google Scholar]
  50. Zhang, J.; Yang, Y.; Gao, Y.; Li, S.; Yu, B.; Gong, X.; Bai, Z.; Miao, M.; Zhang, Y.; Sun, Z.; et al. Geochemistry and source of crude oils in the Wensu uplift, Tarim Basin, NW China. J. Pet. Sci. Eng. 2022, 208, 109448. [Google Scholar] [CrossRef]
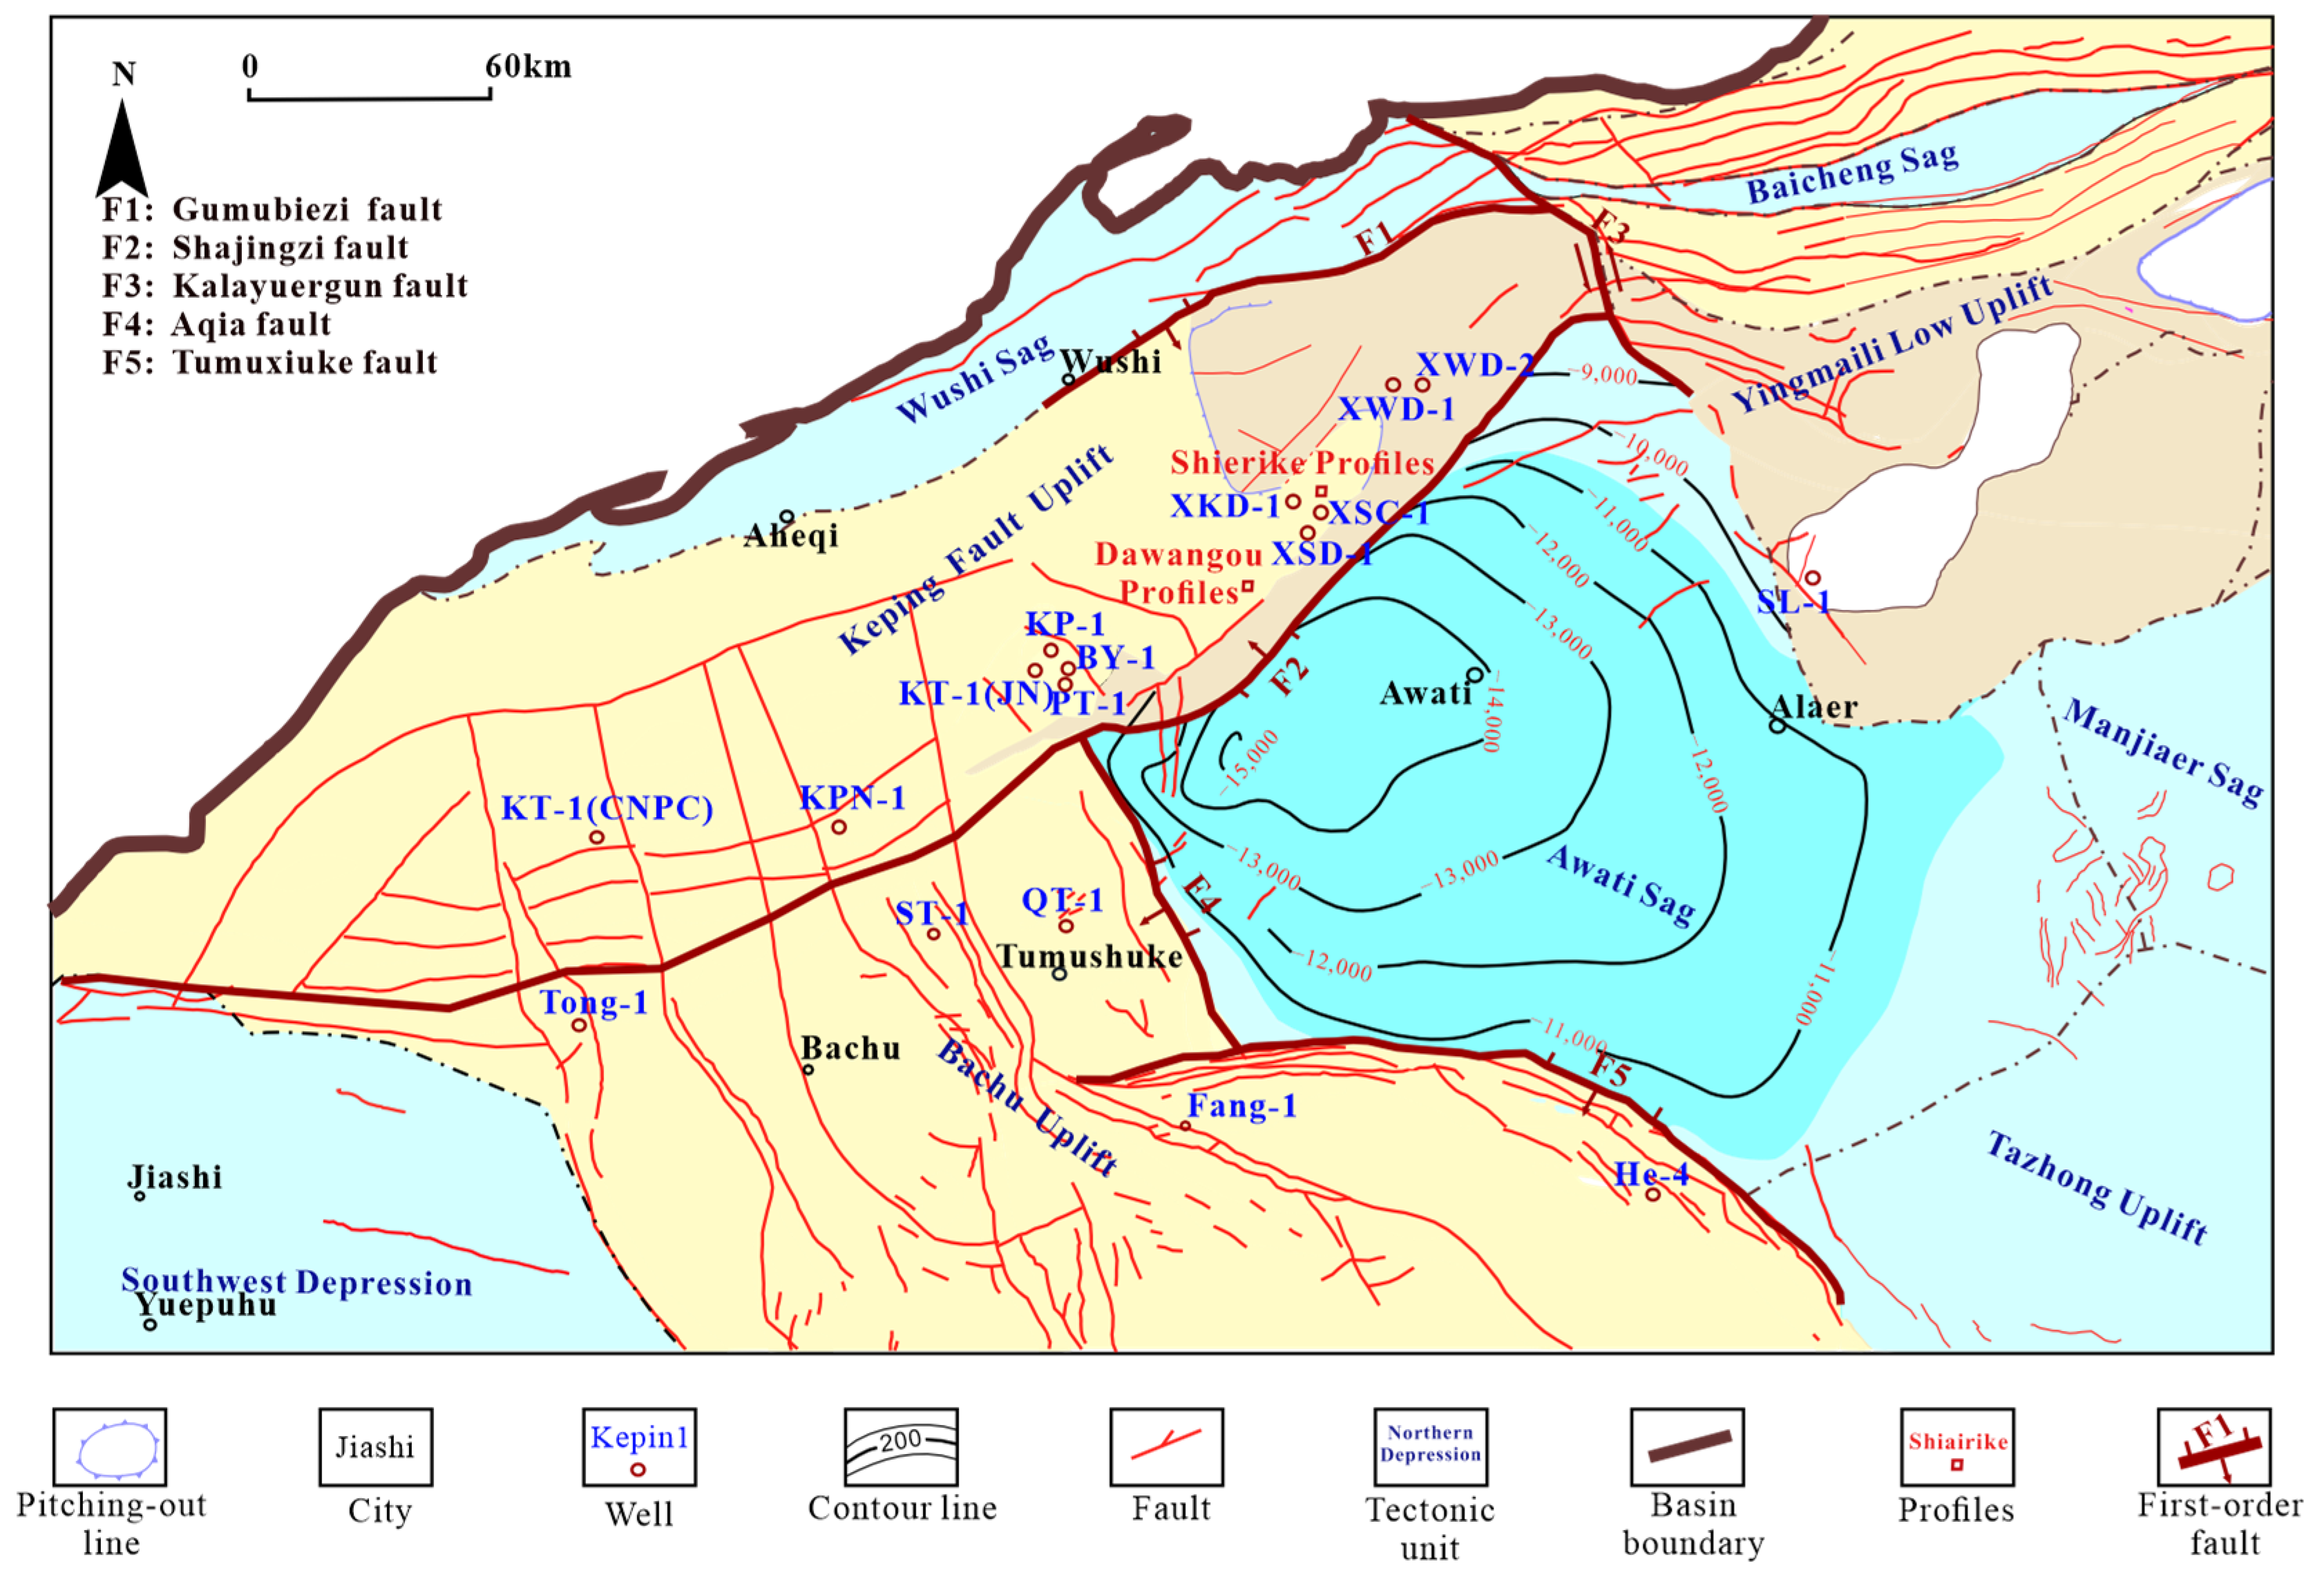
Figure 1. Geological overview of the study area, showing (1) the northwest Tarim Basin’s primary tectonic divisions; (2) the specific positioning of the Awati Sag and Keping Fault Uplift; and (3) the layout of key exploratory wells. (Provided by the Oil & Gas Survey of China Geological Survey).
Energies 17 02124 g001
Figure 2. Typical stratigraphic column of the Avati Sag.
Energies 17 02124 g002
Figure 3. The Shiairike outcrop displaying the Yuertusi source rock exposure. Coring locations and associated total organic carbon (TOC) levels are also highlighted. (Provided by the Oil & Gas Survey of China Geological Survey.
Energies 17 02124 g003
Figure 4. The Dawangou outcrop, where the Saergan source rock is exposed on the surface; the coring sites on this outcrop and the corresponding TOC contents are also shown. (Provided by the Oil & Gas Survey of China Geological Survey).
Energies 17 02124 g004
Figure 5. The activation energy distribution for Type II kerogen cracking, developed by Tissot and Waples [29].
Energies 17 02124 g005
Figure 6. Histograms demonstrating the TOC distribution of four potential lower Paleozoic source rocks. (a) Yuertusi Formation core samples and outcrops sample. (b) Saergan Formation core samples and outcrops sample. (c) Yingan Foormation core samples. (d) Xiaoerbulake Formation core samples.
Energies 17 02124 g006
Figure 7. Correlation relationships between TOC obtained by the Yuertusi Formation (a) and Saergan Formation (b) logging interpretation (XSC-1) and lab measurements.
Energies 17 02124 g007
Figure 8. Logging interpretation of TOC content of the Yuertusi Formation (a) and Saergan Formation (b) of the XSC-1 Well.
Energies 17 02124 g008
Figure 9. Comparison of S1 + S2 values for the four potential source rocks. (a) Yuertusi Formation core samples and outcrops sample. (b) Saergan Formation core samples. (c) Yingan Foormation core samples. (d) Xiaoerbulake Formation core samples.
Energies 17 02124 g009
Figure 10. The organic matter types and maturity of the four potential source rocks, revealed on the HI vs. Tmax map using core samples (a) and outcrop samples (b).
Energies 17 02124 g010
Figure 11. Microscopic observation of the Yuertusi samples under FE-SEM. (a) Sample Y-01-2 is a siliceous rock, rich in organic matter (dark), with prevalent shrinkage and dissolution pores. (b) Y-02-1 is a dolomitic sample containing noticeable organic content and gypsum. It exhibits both intergranular and intragranular solvation pores, alongside pronounced fractures within the dolomite matrix. (c) Y-06-1 contains abundant organic material and silica, with well-developed intergranular and intragranular dissolution pores, and microcracks are observed within the calcite. (d) Y-14-2, a siliciclastic shale, is noted for its organic-rich (dark) areas and the presence of pyrite and apatite, with both intergranular and intragranular pores present.
Energies 17 02124 g011
Figure 12. The burial history and hydrocarbon generation history of the Lower Paleozoic source rocks in Wells XSD-1 (a) and XSC-1 (b).
Energies 17 02124 g012
Figure 13. Two-dimensional hydrocarbon accumulation simulation demonstrating the coupling of hydrocarbon generation and tectonic evolution. (a) the Upper Ordovician. (b) the Early to Middle Silurian. (c) the Late Silurian to Early Devonian. (d) the Late Devonian to the Permian period. (e) Indosinian–Yanshanian Period.
Energies 17 02124 g013
Figure 14. The typical hydrocarbon accumulation mode in the Awati Sag and surrounding areas.
Energies 17 02124 g014
Table 1. Statistics of TOC analysis on downhole core samples and outcrop samples.
TypeFormationNum.Min
%
Max
%
Average
%
Median
%
St. Dev
outcrop samplesSinianЄ1y280.037.832.131.701.77
OrdovicianO2-3s100.12.892.012.090.83
core samplesSinianЄ1y91.0818.985.824.365.39
Є1x70.061.300.530.590.42
OrdovicianO2-3s41.266.373.994.172.66
O3y60.110.580.360.390.21
Table 2. Statistics of S1 + S2 value of the four potential source rocks (core samples and outcrop samples).
TypeFormationNum.Min
mg/g
Max
mg/g
Average
mg/g
Median
mg/g
St. Dev
outcrop samplesSinianЄ1y280.010.620.220.180.16
core samplesSinianЄ1y90.2913.123.421.404.72
Є1x70.031.620.570.510.59
OrdovicianO2–3s40.6819.509.408.729.91
O3y60.060.260.170.200.08
Table 3. The pyrolysis statistics obtained from core samples.
No.FormationTmax
°C
S1
mg/g
S2
mg/g
S1+ S2
mg/g
PI
mg/g·TOC
HI
mg/g·TOC
PC
mg/g·TOC
PC/TOC
%
HC
mg/g·TOC
XKD1-1Є1y4640.180.180.360.53.270.030.543.27
XKD1-2Є1y4457.85.3213.120.5978.471.0916.06115.04
XKD1-5Є1y4930.090.20.290.3118.520.022.238.33
XKD1-6Є1y4640.331.261.590.2128.90.133.037.57
XKD1-7Є1y4760.999.0510.040.147.680.834.395.22
XKD1-8Є1y4580.141.031.170.1238.720.13.655.26
XKD1-9Є1y4600.181.161.340.1364.090.116.149.94
XKD1-10Є1y4570.21.231.430.1433.420.123.235.43
XKD1-11Є1y4620.211.191.40.1515.890.121.552.8
KP1-1O2-3s4650.410.711.120.3732.870.094.318.98
XSD1-1O2-3s4501.0618.4419.50.05289.481.6225.4116.64
XSD1-2O3y4450.030.060.090.33500.016.2325
XSD1-3O3y4570.020.040.060.3336.3604.5318.18
KP1-2O3y4540.110.130.240.4623.210.023.5619.64
KP1-3O3y4620.070.110.180.3927.50.013.7417.5
XSD1-2O3y4450.030.060.090.33500.016.2325
XSD1-3O3y4570.020.040.060.3336.3604.5318.18
KP1-2O3y4540.110.130.240.4623.210.023.5619.64
KP1-3O3y4620.070.110.180.3927.50.013.7417.5
KP1-4O3y4540.120.140.260.4624.140.023.7220.69
KP1-5O3y4620.090.120.210.4331.580.024.5923.68
XKD1-3Є1x4920.010.040.050.266.6706.9216.67
XKD1-4Є1x3490.010.020.030.3316.6702.088.33
XKD1-3Є1x4920.010.040.050.266.6706.9216.67
XKD1-4Є1x3490.010.020.030.3316.6702.088.33
XSC1-1Є1x5970.80.821.620.49138.980.1322.79135.59
XSC1-2Є1x6000.160.410.570.28110.810.0512.7943.24
XSC1-3Є1x3390.220.290.510.4340.850.045.9630.99
XSC1-4Є1x3830.130.040.170.766.780.012.3922.03
XSC1-5Є1x5100.230.831.060.2263.850.096.7717.69
Table 4. Whole-rock X-ray diffraction analysis on typical outcrop samples of Yuertusi Formation.
No.Mineral Content (%)Lithology
QuartzPotash FeldsparPlagioclaseCalciteDolomiteApatiteBariteGypsumClay
Y-02-13.20.70.5-94.6---1Dolomite
Y-04-225.3---50.2--23.51
Y-15-126.21.9-955.16.8--1
Y-06-17.70.6-85.55.2---1Limestone
Y-01-297.8-------2.2Siliceous shale
Y-03-179.52.91-7--4.45.2
Y-08-174---19.6-3.12.31
Y-10-1530.7-32.47.63.5-0.82
Y-11-277.4-----20.611
Y-14-258.14.10.5-30.54.9-0.91
Disclaimer/Publisher’s Note: The statements, opinions and data contained in all publications are solely those of the individual author(s) and contributor(s) and not of MDPI and/or the editor(s). MDPI and/or the editor(s) disclaim responsibility for any injury to people or property resulting from any ideas, methods, instructions or products referred to in the content.