Article

Study on Hydrocarbon Fuel Ignition Characterization Based on Optimized BP Neural Network

1
School of Computer Science and Engineering, Shenyang Jianzhu University, Shenyang 110168, China
2
Liaoning Key Lab of Advanced Test Technology for Aerospace Propulsion System, School of Aeroengine, Shenyang Aerospace University, Shenyang 110136, China
3
College of Petroleum Engineering, Liaoning Petrochemical University, Fushun 113001, China
4
Green and Low-Carbon Smart Heating and Cooling Technology Characteristic Laboratory, Shandong Huayu University of Technology, Dezhou 253034, China
5
School of Transportation and Vehicle Engineering, Shandong University of Technology, Zibo 255049, China
*
Author to whom correspondence should be addressed.
Energies 2024, 17(9), 2072; https://doi.org/10.3390/en17092072
Submission received: 9 March 2024 / Revised: 15 April 2024 / Accepted: 24 April 2024 / Published: 26 April 2024
(This article belongs to the Section I2: Energy and Combustion Science)

Abstract

:
The investigation of the ignition delay of hydrocarbon fuel is highly valuable for enhancing combustion efficiency, optimizing fuel thermal efficiency, and mitigating pollutant emissions. This paper has developed a BP-MRPSO neural network model for studying hydrocarbon fuel ignition and clarified the novelty of this model compared to the traditional BP and ANN models from the literature. The model integrates the particle swarm optimization (PSO) algorithm with MapReduce-based parallel processing technology. This integration improves the prediction accuracy and processing efficiency of the model. Compared to the traditional BP model, the BP-MRPSO model can increase the average correlation coefficient, from 0.9745 to 0.9896. The R2 value for predicting fire characteristics using this model can exceed 90%. Meanwhile, when the two hidden layers of both the BP and BP-MRPSO models consist of 9 and 8 neurons, respectively, the accuracy of the BP-MRPSO model is increased by 38.89% compared to the BP model. This proved that the new BP-MRPSO model has the capacity to handle large datasets while achieving great precision and efficiency. The findings could provide a new perspective for examining the properties of fuel ignition, which is expected to contribute to the development and assessment of aviation fuel ignition characteristics in the future.

1. Introduction

The proper usage of various energy sources remains an issue of concern amidst the rapid development of the economy and society. The ignition delay time (IDT) of hydrocarbon fuels is crucial in characterizing fuel combustion. It dramatically affects the emission of pollutants and combustion efficiency, including unburned hydrocarbons (UHC), carbon monoxide (CO), and carbon smoke. An enhanced understanding and precisely forecasting the IDT properties are expected to aid in analyzing combustion of hydrocarbon fuels in an aeroengine, which thus helps to improve the modeling of the chemical reaction kinetics of aviation fuels [1].
The current study primarily employs shock tube experimental equipment to investigate the ignition delay time (IDT) of various hydrocarbon fuels. Liu et al. [2] demonstrated a linear relationship between the logarithm of the IDT of alternative fuels and the reciprocal of the ignition temperature. Wei et al. [3] explored the relationship between IDT and factors such as pressure, fuel/air mass ratio, and temperature. Bui et al. [4] studied the relationship between IDT and factors including temperature, pressure, and the composition of fuel/air mixtures. Zhang et al. [5] investigated ignition delay characteristics under different equivalence ratios, pressures, and temperatures by measuring the pressure rise and OH* chemiluminescence signals during the ignition process in a shock tube. Ma et al. [6] provided the relationship between IDT and the fuel concentration and equivalence ratio. Wang et al. [7] studied the OH radicals, reactive particles, through sensitivity analysis and modification of the reaction mechanism, revealing that the addition of reactive particles significantly shortened the ignition delay time of n-decane aviation kerosene. To ensure the gaseous state of the fuel, Zhukov et al. [8] used a heated shock tube to study the ignition delay time, measuring the IDT of Jet-A/air mixtures under different pressures, equivalence ratios, and temperatures, with experimental errors around 20%.
The fuels generated and used in real life are often mixtures of hydrocarbon fuels with different carbon numbers, and their IDT characteristics are extremely complex, making systematic analysis and research difficult. Therefore, other means are needed to study and analyze the ignition delay characteristics. Neural networks, with their high nonlinear modeling capability [9], can effectively identify and simulate complex chemical reactions and have been widely applied in object recognition, trend prediction, fault diagnosis, and other fields [10,11,12]. Using genetic algorithms to optimize the backward BP neural network [13], predicted the ignition delay time of n-butane/hydrogen mixtures. Compared with interpolation data prediction, the average correlation coefficient for extrapolation data prediction decreased from 0.9890 to 0.9763, and the corresponding average mean square error increased from 1.06 to 13.37, indicating that the genetic algorithm-optimized BP neural network has a slow convergence speed, is prone to falling into local optima, and is inefficient in processing large-scale data. In contrast, the BP-MRPSO model combines the particle swarm optimization algorithm and MapReduce parallel processing technology, effectively improving prediction accuracy and processing efficiency. By constructing an ANN neural network model, Huang et al. [14], Bounaceur et al. [15] predicted the ignition delay time of hydrocarbon mixtures. Data-driven surrogate models based on artificial neural networks (ANN) have limitations in capturing the full complexity of the aviation fuel ignition process, with maximum local relative errors of up to 10%, indicating poor predictive performance of data-driven surrogate models under certain conditions, especially when the IDT is short. Moreover, due to the long-tail distribution of the IDT database, outliers among these data points have a significant impact on the loss function, making it difficult to optimize the prediction of the data-driven surrogate model for low IDT data points. Addressing the limitations of data-driven surrogate models, especially under specific conditions where the IDT is short, the BP-MRPSO model can adjust parameters based on individual and collective historical experience, thereby searching for the optimal solution in the solution space, effectively avoiding falling into local optima. This global search strategy allows the BP-MRPSO model to find more suitable network parameters in complex tasks, avoiding the problem of traditional BP models and data-driven surrogate models falling into local optima.
As shown in Table 1, the systematic errors from previous studies [6,13,16,17] provide a context for understanding the improvements in measurement accuracy in current models.
In general, the neural network models are currently being used to study and predict the flammability characteristics of hydrocarbon fuels with substantial advantages. This research presents a developed optimized BP-MRPOS neural network model to examine the IDT characteristics of hydrocarbon fuels with different carbon atomic weights. Through comparison to the BP model, the superiority and accuracy of the BP-MRPSO model in predicting the ignition characteristics of hydrocarbon fuels are verified.Compare the predicted IDT of the BP-MRPSO model with experimental values under different pressures, fuels, and equivalence ratios to verify the effectiveness of the established model.

2. Methodology

2.1. Acquisition of Data

The data included in this work are partially obtained from experiments conducted within our research group, while the remaining portions are derived from existing literature [6,8,16,17,18]. The experiment was conducted at the State Key Laboratory of Two-Phase Flow of Xi’an Jiaotong University with a chemical-pressure-stabilizing tube.

2.2. Creation of Data Sets

The experimental data settings for studying the effect of fuel on the IDT are collected and presented in Table 2.
The long-tailed distribution of the IDT dataset used in this paper is shown in Figure 1.
The data for the IDT of several aviation fuels was obtained within the temperature range of 715.0 K to 1671.0 K using chemical excitation tube tests. An investigation was conducted to examine the effects of various pressures, oxygen concentrations, equivalence ratios, and fuel mole fractions on the ignition delay. Figure 1 demonstrates a high occurrence of shorter ignition delay periods, with a quick reduction in frequency as the IDT grows.
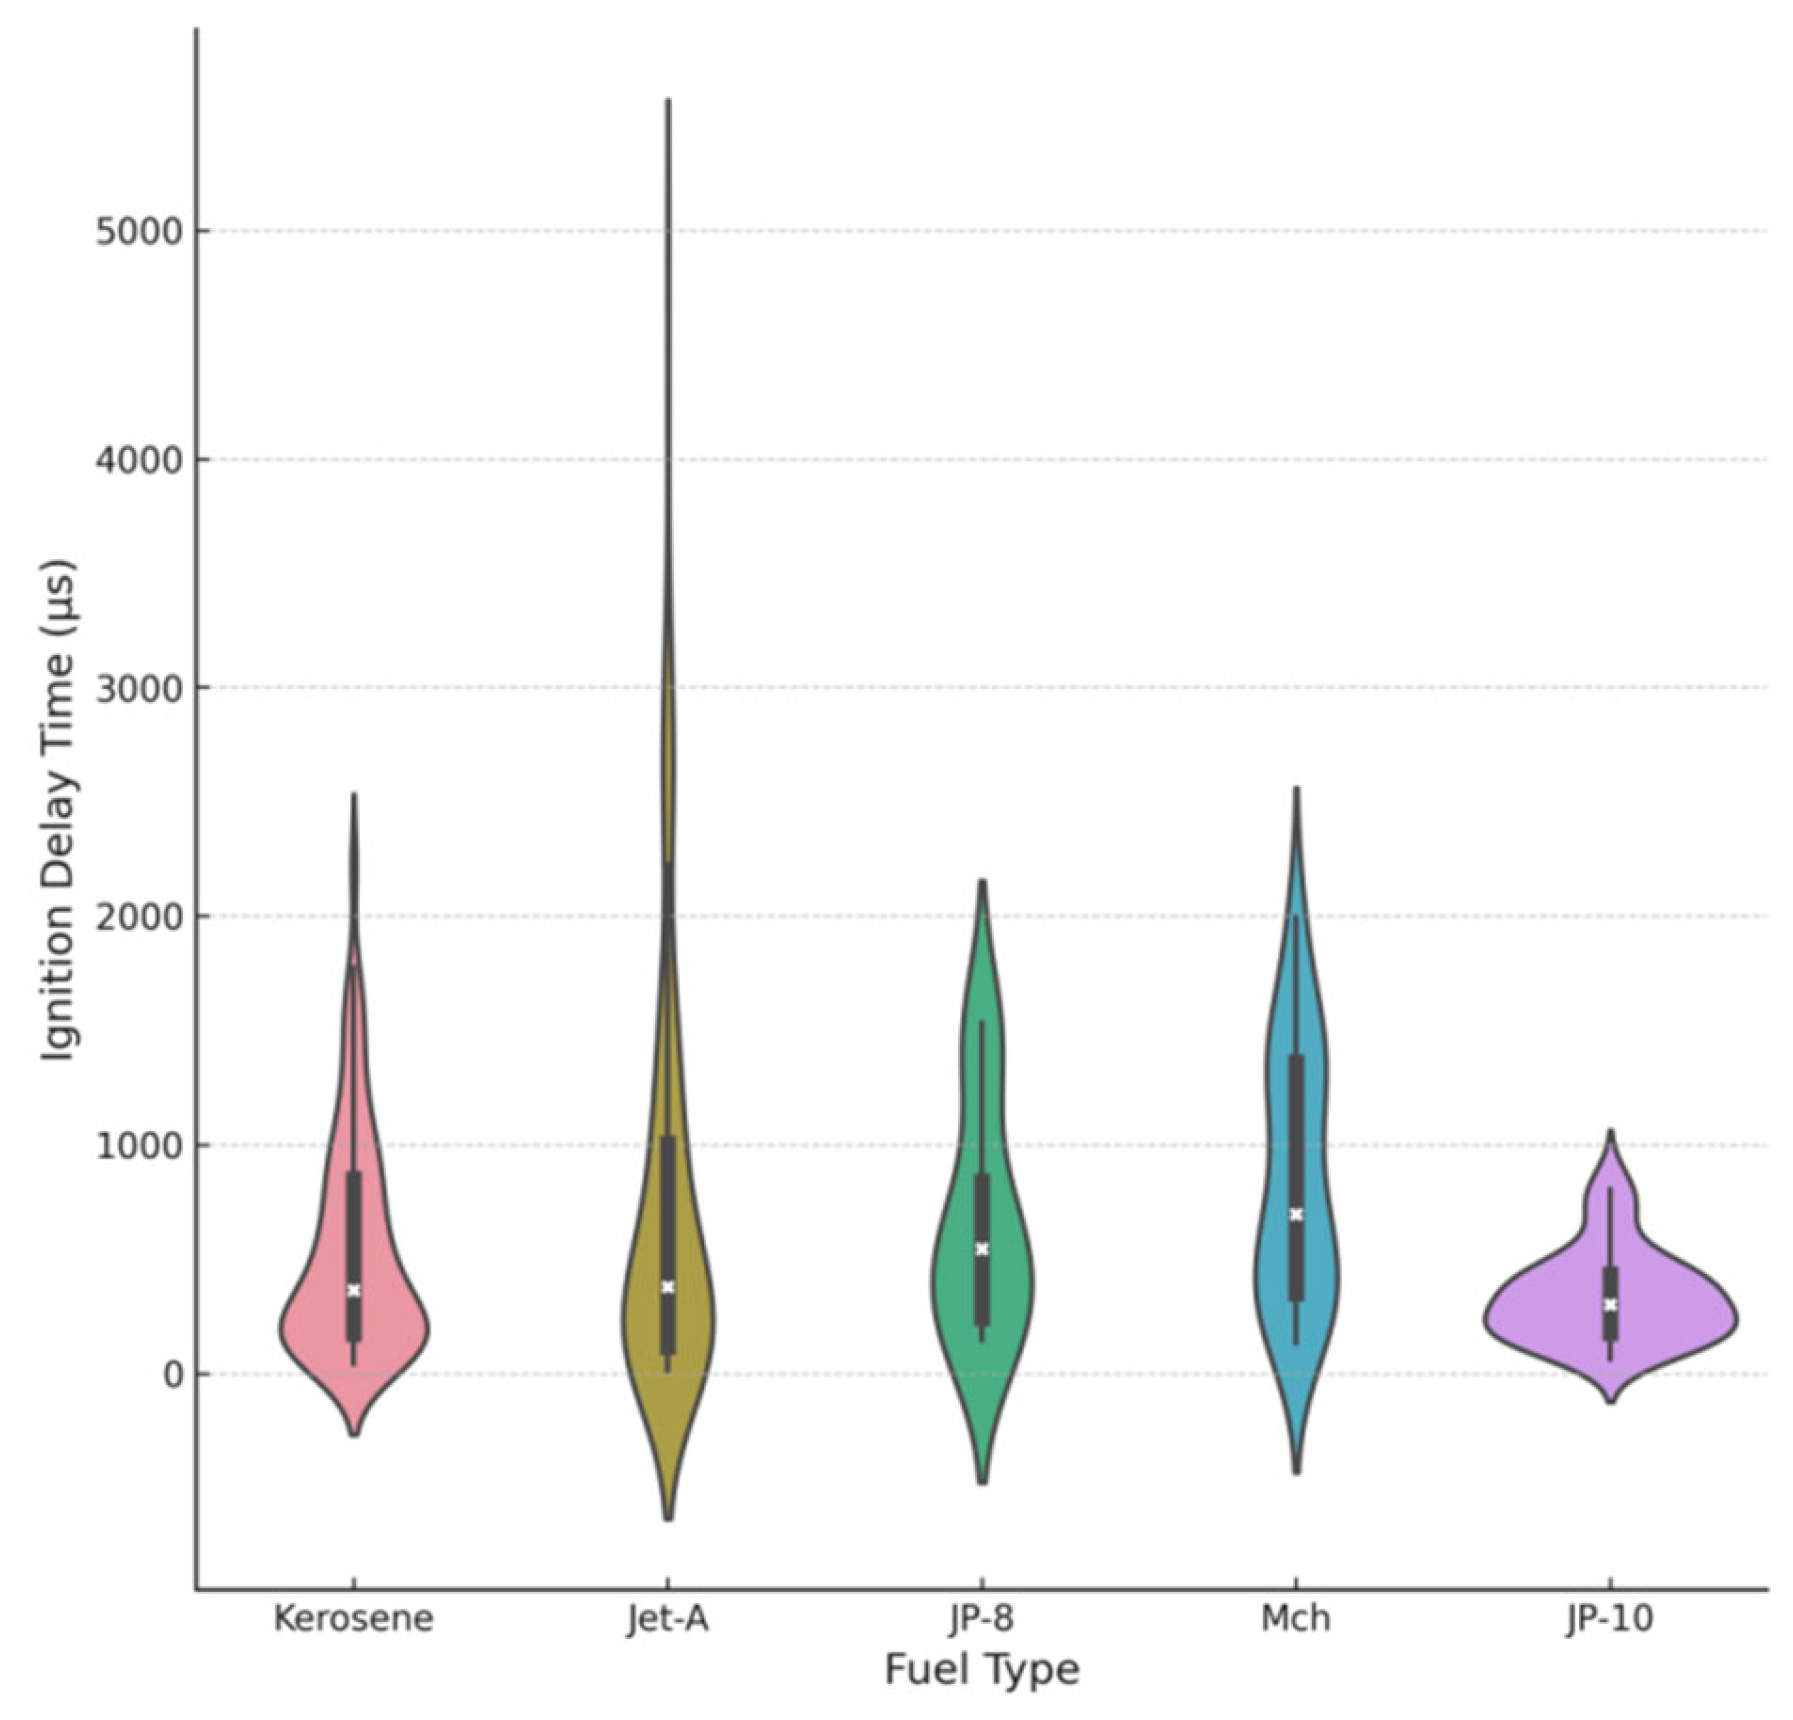
Figure 2 shows the distribution of IDT for various fuels.
Figure 2 shows the distribution of IDT for different fuels under the experimental conditions detailed in Table 2. The violin graphs demonstrate the distribution of the IDT for several fuel types, such as kerosene, Jet-A, JP-8, MCH, and JP-10. A white dot in the center in this figure represents the median, while a box indicates the interquartile range. The lines represent the range of the data, usually encompassing the most prominent value within 1.5 times the interquartile range and the minimum values. The graph illustrates that the IDTs for several fuel types display distinct shapes and widths, suggesting variations in the combustion characteristics of these fuels. The graph demonstrates the comprehensive properties of this study by comparing the ignition delays of various fuels under identical test settings. We analyzed traditional aviation fuels, such as Jet-A and JP-8, experimental mixtures like MCH, and high-energy fuels like JP-10. In this study, various fuel types are allowed for a comprehensive assessment and examination of the crucial factor of ignition delay. Multiple intricate factors influence the behavior of fuel ignition, and the correlation between these factors is not always linear. Neural networks excel at capturing and modeling the nonlinear relationship within data. They can automatically extract significant features from complex data and enhance the robustness of the dataset through training by handling outliers and noise. This reduces the adverse effects of high IDT values on prediction performance. Once thoroughly trained, neural networks can make precise predictions.

2.3. BP Neural Networks

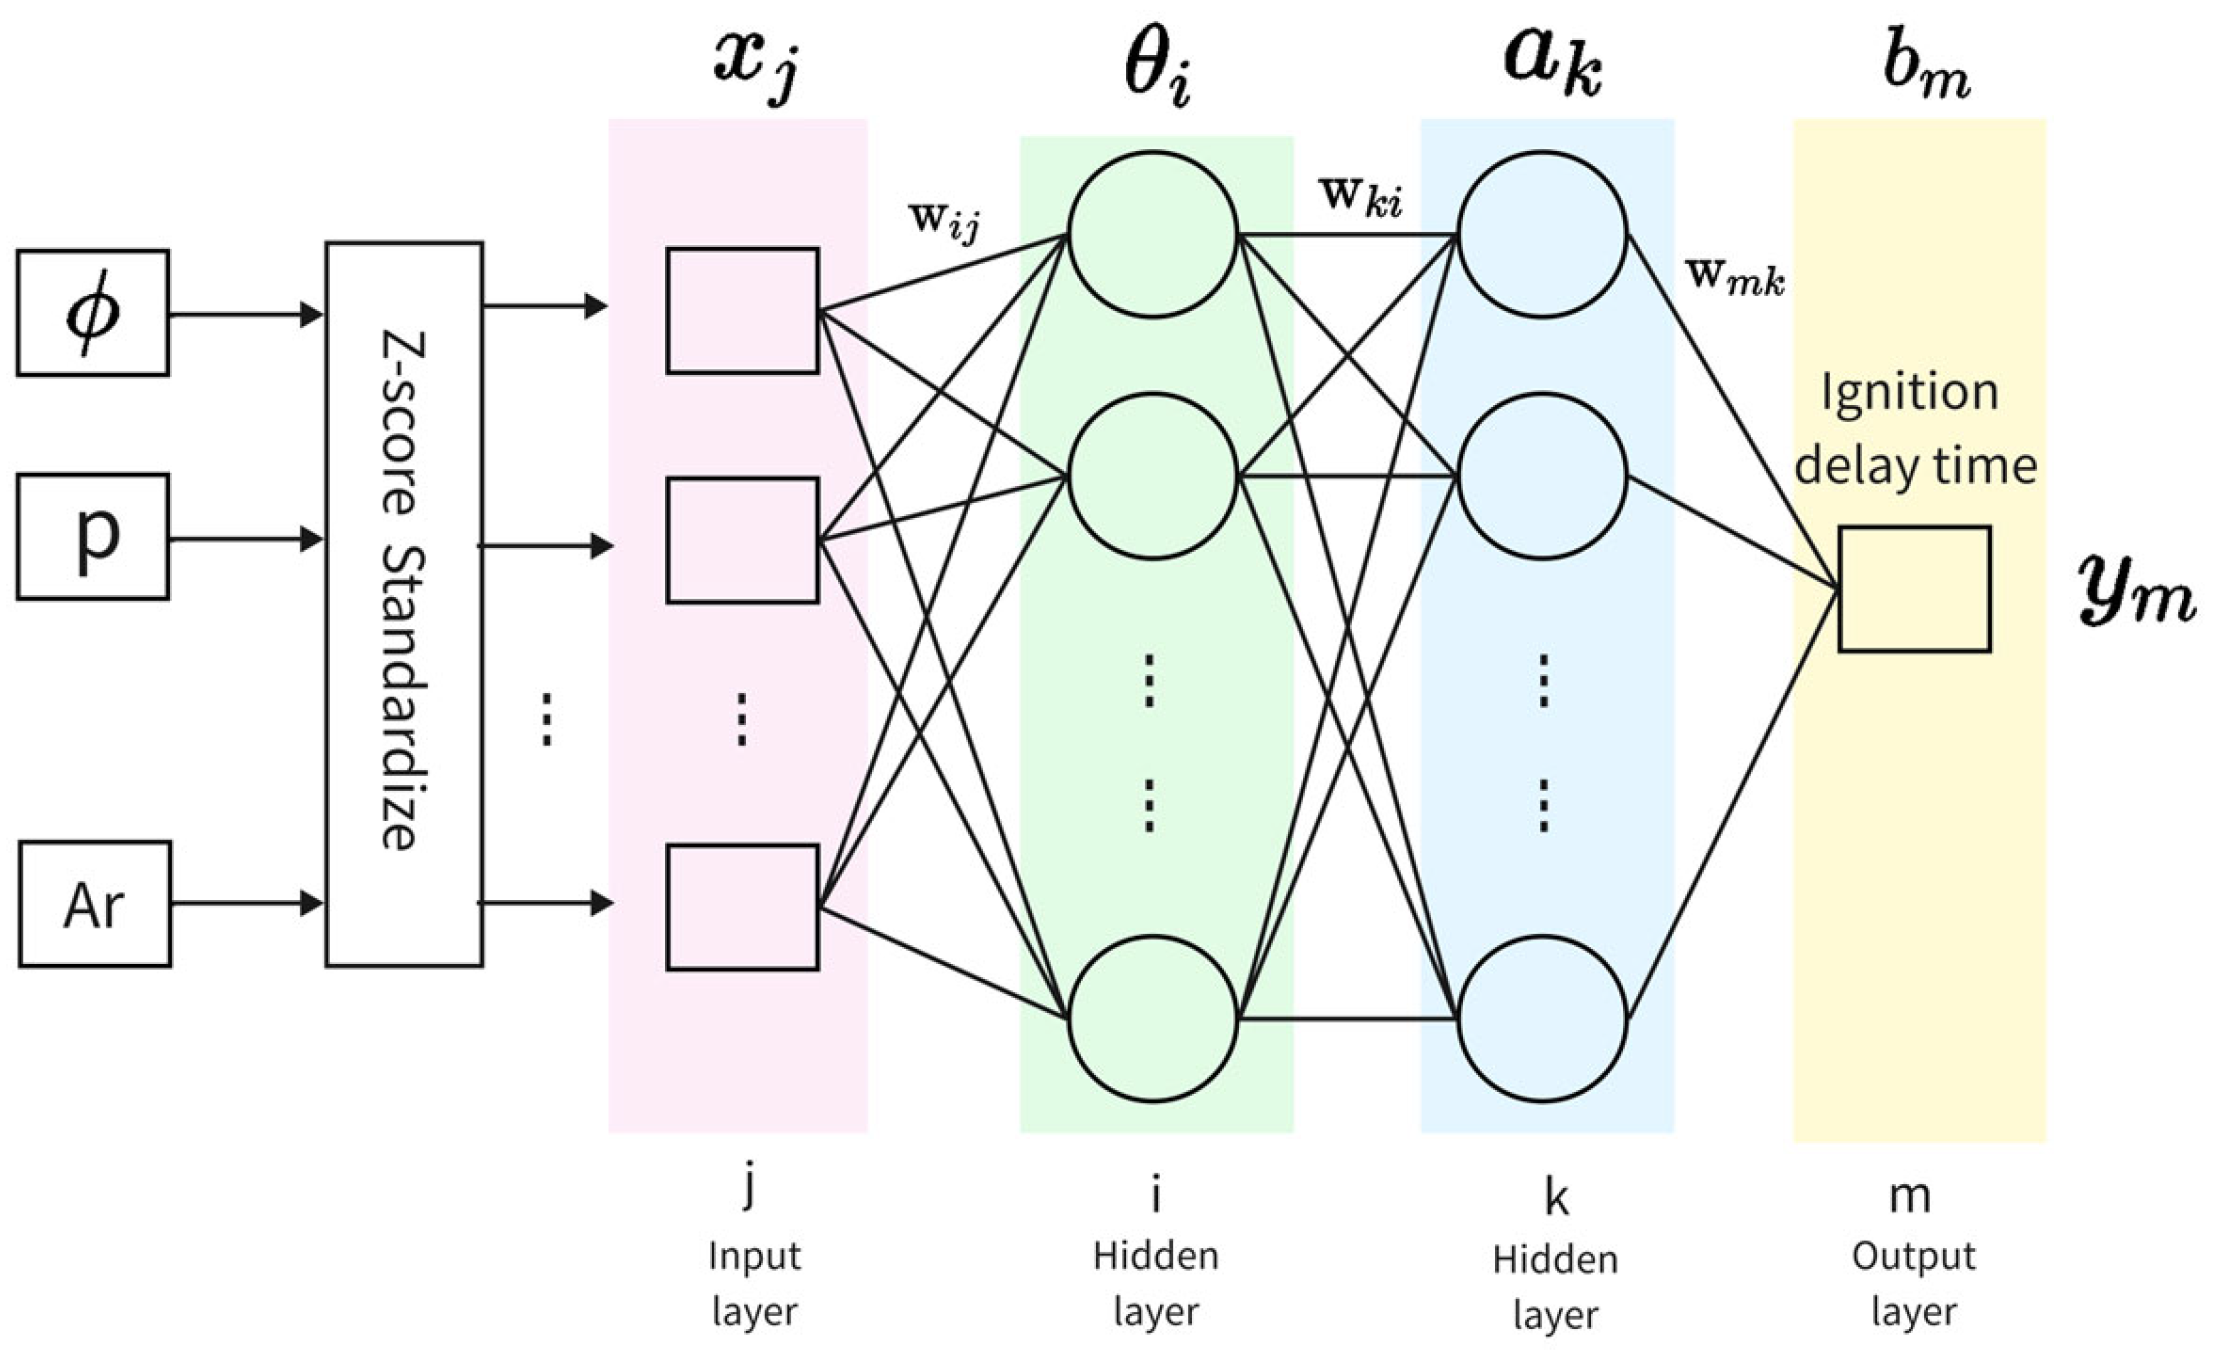
The BP neural network model structure is shown in Figure 3.
In the graph, there are two hidden layers and one output layer in the neural network; x j is the input quantity, subscript j corresponds to the number of the node in the input layer; y m is the output quantity, subscript m corresponds to the number of the node in the output layer; θ i is the threshold introduced in the first hidden layer, subscript i corresponds to the number of the node in the hidden layer; a k is the threshold introduced in the second hidden layer, subscript k corresponds to the number of the node in the hidden layer; b m is the threshold introduced in the output layer, subscript m corresponds to the number of the node in the output layer. The input z i and output p i of the ith node of the hidden layer during forward propagation are calculated as follows ( f is the activation function):
z i = j = 1 m w i j x j + θ i
p i = f ( j = 1 m w i j x j + θ i )
The input z i k and output p i k of the kth node of the implicit layer during forward propagation are calculated as follows ( g is the activation function):
z i k = i = 1 m w k i p i + a k
p i k = g i = 1 m w k i p i + a k
The input z k m and output p k m of the mth node of the output layer during forward propagation are calculated as follows ( h is the activation function):
z k m = k = 1 m w p k + b m
p k m = h k = 1 m w m k p k + b m
Error function for the nth sample E n .
In neural networks, the error function E n for the nth sample is often used to measure the difference between the predicted output and the actual output for that sample. A common form of the error function is the mean square error function, which is computed as follows:
E n = 1 2 m out m , n target m , n 2
Let outm,n represent the anticipated output of the network for the nth sample at the mth output node, and let targetm,n represent the actual target value for the nth sample at the mth output node. The error function E n quantifies the precision of the neural network’s prediction for each individual sample. The objective of training a neural network is to minimize the cumulative total of the error functions across all training samples.
The total error E for n training samples is:
E = n = 1 N E n = n = 1 N 1 2 m out m , n target m , n 2
In the feedback process, the amount of weight correction and threshold correction in the implicit and output layers can be written, respectively, as:
Δ w i j = η E w i j   Δ θ i = η E θ i
Δ w k i = η E w k i Δ a k = η E a k
Δ w m k = η E w m k Δ b m = η E b m
where η is the learning rate ( η = 0.0001); E is the error function; and w i j , w k i , w m k are the weights to be updated. θ i , a k , b m are the thresholds or biases to be updated.

3. Improvement of the BP Algorithm

3.1. MapReduce-Based Parallel Processing Optimization

As a robust parallel processing programming paradigm, the primary benefit of MapReduce lies in its ability to successfully manage extensive data sets beyond the full processing capacity of a single server. This paradigm can significantly improve the speed and efficiency of data processing by splitting complex data processing tasks into smaller, more manageable activities that can be processed. More precisely, during the map phase, the model dissects the unprocessed data into discrete and autonomous data blocks and handles each block simultaneously. Next, in the reduction phase, the processed data is combined and condensed to produce the outcome [19]. Applying MapReduce to BP neural network training for tasks like hydrocarbon fuel ignition characterization, accelerates data processing through distributed computing, effectively handling the high data and computational demands [13]. During this process, MapReduce is employed as a distributed computing solution. The MapReduce process initially preprocesses and partitions extensive datasets during the map stage, and then analyzes and summarizes these datasets during the Reduce stage. This approach significantly enhances the speed of data processing and the performance and precision of the BP neural network when dealing with intricate datasets. The parallel processing mechanism of the MapReduce model enables the simultaneous execution of numerous data computations and network training on multiple compute nodes. This feature is particularly beneficial for analysis that requires precise and complex calculations, such as the ignition characteristics of hydrocarbon fuels. By implementing this approach, the burden on an individual compute node can be significantly reduced, and the overall efficiency of the network training process can be improved. Especially in the presence of a large amount of data, this approach can guarantee the efficient utilization of computational resources and optimize the speed of data processing.

3.2. Particle Swarm Optimization (PSO) Algorithm Integration

Particle swarm optimization (PSO) is an optimization algorithm based on swarm intelligence inspired by the foraging behavior of bird flocks. In PSO, each particle represents a potential solution and is adjusted based on individual and group historical experience to find the optimal solution [20]. In PSO, each particle has a position x i and speed v i , representing the potential solution and its search direction and velocity in the solution space. The speed of the particle will be updated according to the following equation:
v i ( t + 1 ) = w v i ( t ) + c 1 · r 1 p best   x i ( t ) + c 2 r 2 g best x i ( t )
Among them: v i ( t + 1 ) is the speed of the particle i at the time t + 1 , and w is the inertial weights, the c 1 and c 2 are the learning factors ( c 1 = c 2 = 2.0), the r 1 and r 2 are the random numbers, and p best   is the individual historical optimal position of the particle, g best   is the global optimal position of the population, and x i ( t ) is the current position. The particle updates its position based on its own experience (individual optimum) and the experience of other group members (global optimum).
The update of the position follows the formula.
x i ( t + 1 ) = x i ( t ) + v i ( t + 1 )
Among them, x i ( t + 1 ) is the position of the particle i at the time t + 1 .
The method is iterated until an optimal solution is attained or a termination criterion is satisfied. The crux of the particle swarm optimization technique lies in disseminating information among the particles, enabling the entire population to converge toward the best solution swiftly. The movement of each particle is impacted not only by its own experiences but also by the optimal position within the population. This collective behavior of the group makes PSO well-suited for solving large neural networks by optimizing the weights and thresholds. PSO improves the efficiency and precision of neural networks by adjusting these parameters to discover the optimal network configuration. This integrated strategy utilizes the global search capabilities of the PSO algorithm to prevent the BP neural network from becoming trapped in a local optimum and instead discovers network parameters that are more suited for a specific challenge. When working on intricate tasks like characterizing the ignition of hydrocarbon fuel, the position of each particle represents a range of potential combinations of network weights and thresholds. By assessing the network’s performance (e.g., error rate) for each particle position, the PSO algorithm directs the particle towards a position that offers improved performance. The PSO algorithm first creates a collection of particles, each representing a specific combination of weights and thresholds for the BP neural network. Then, it utilizes hydrocarbon fuel data to conduct forward propagation in the neural network, determining various network outputs such as ignition point and combustion rate. The algorithm evaluates the performance of each particle, measurement error rate, and other factors. Based on the performance of each particle and the best performance within the group, it modifies the position of the particles and explicitly updates the weights and thresholds of the neural network. The procedure of forward propagation, performance evaluation, and particle location updating is iterated until the optimal performance is attained or the specified number of iterations is reached [19]. This approach enhances network training efficiency and avoids the prevalent issue of local optimization by employing global search. It dramatically enhances the accuracy of predictions and the efficiency of learning in BP neural networks, offering robust assistance in tackling intricate challenges.

3.3. BP-MRPSO Neural Network Modeling

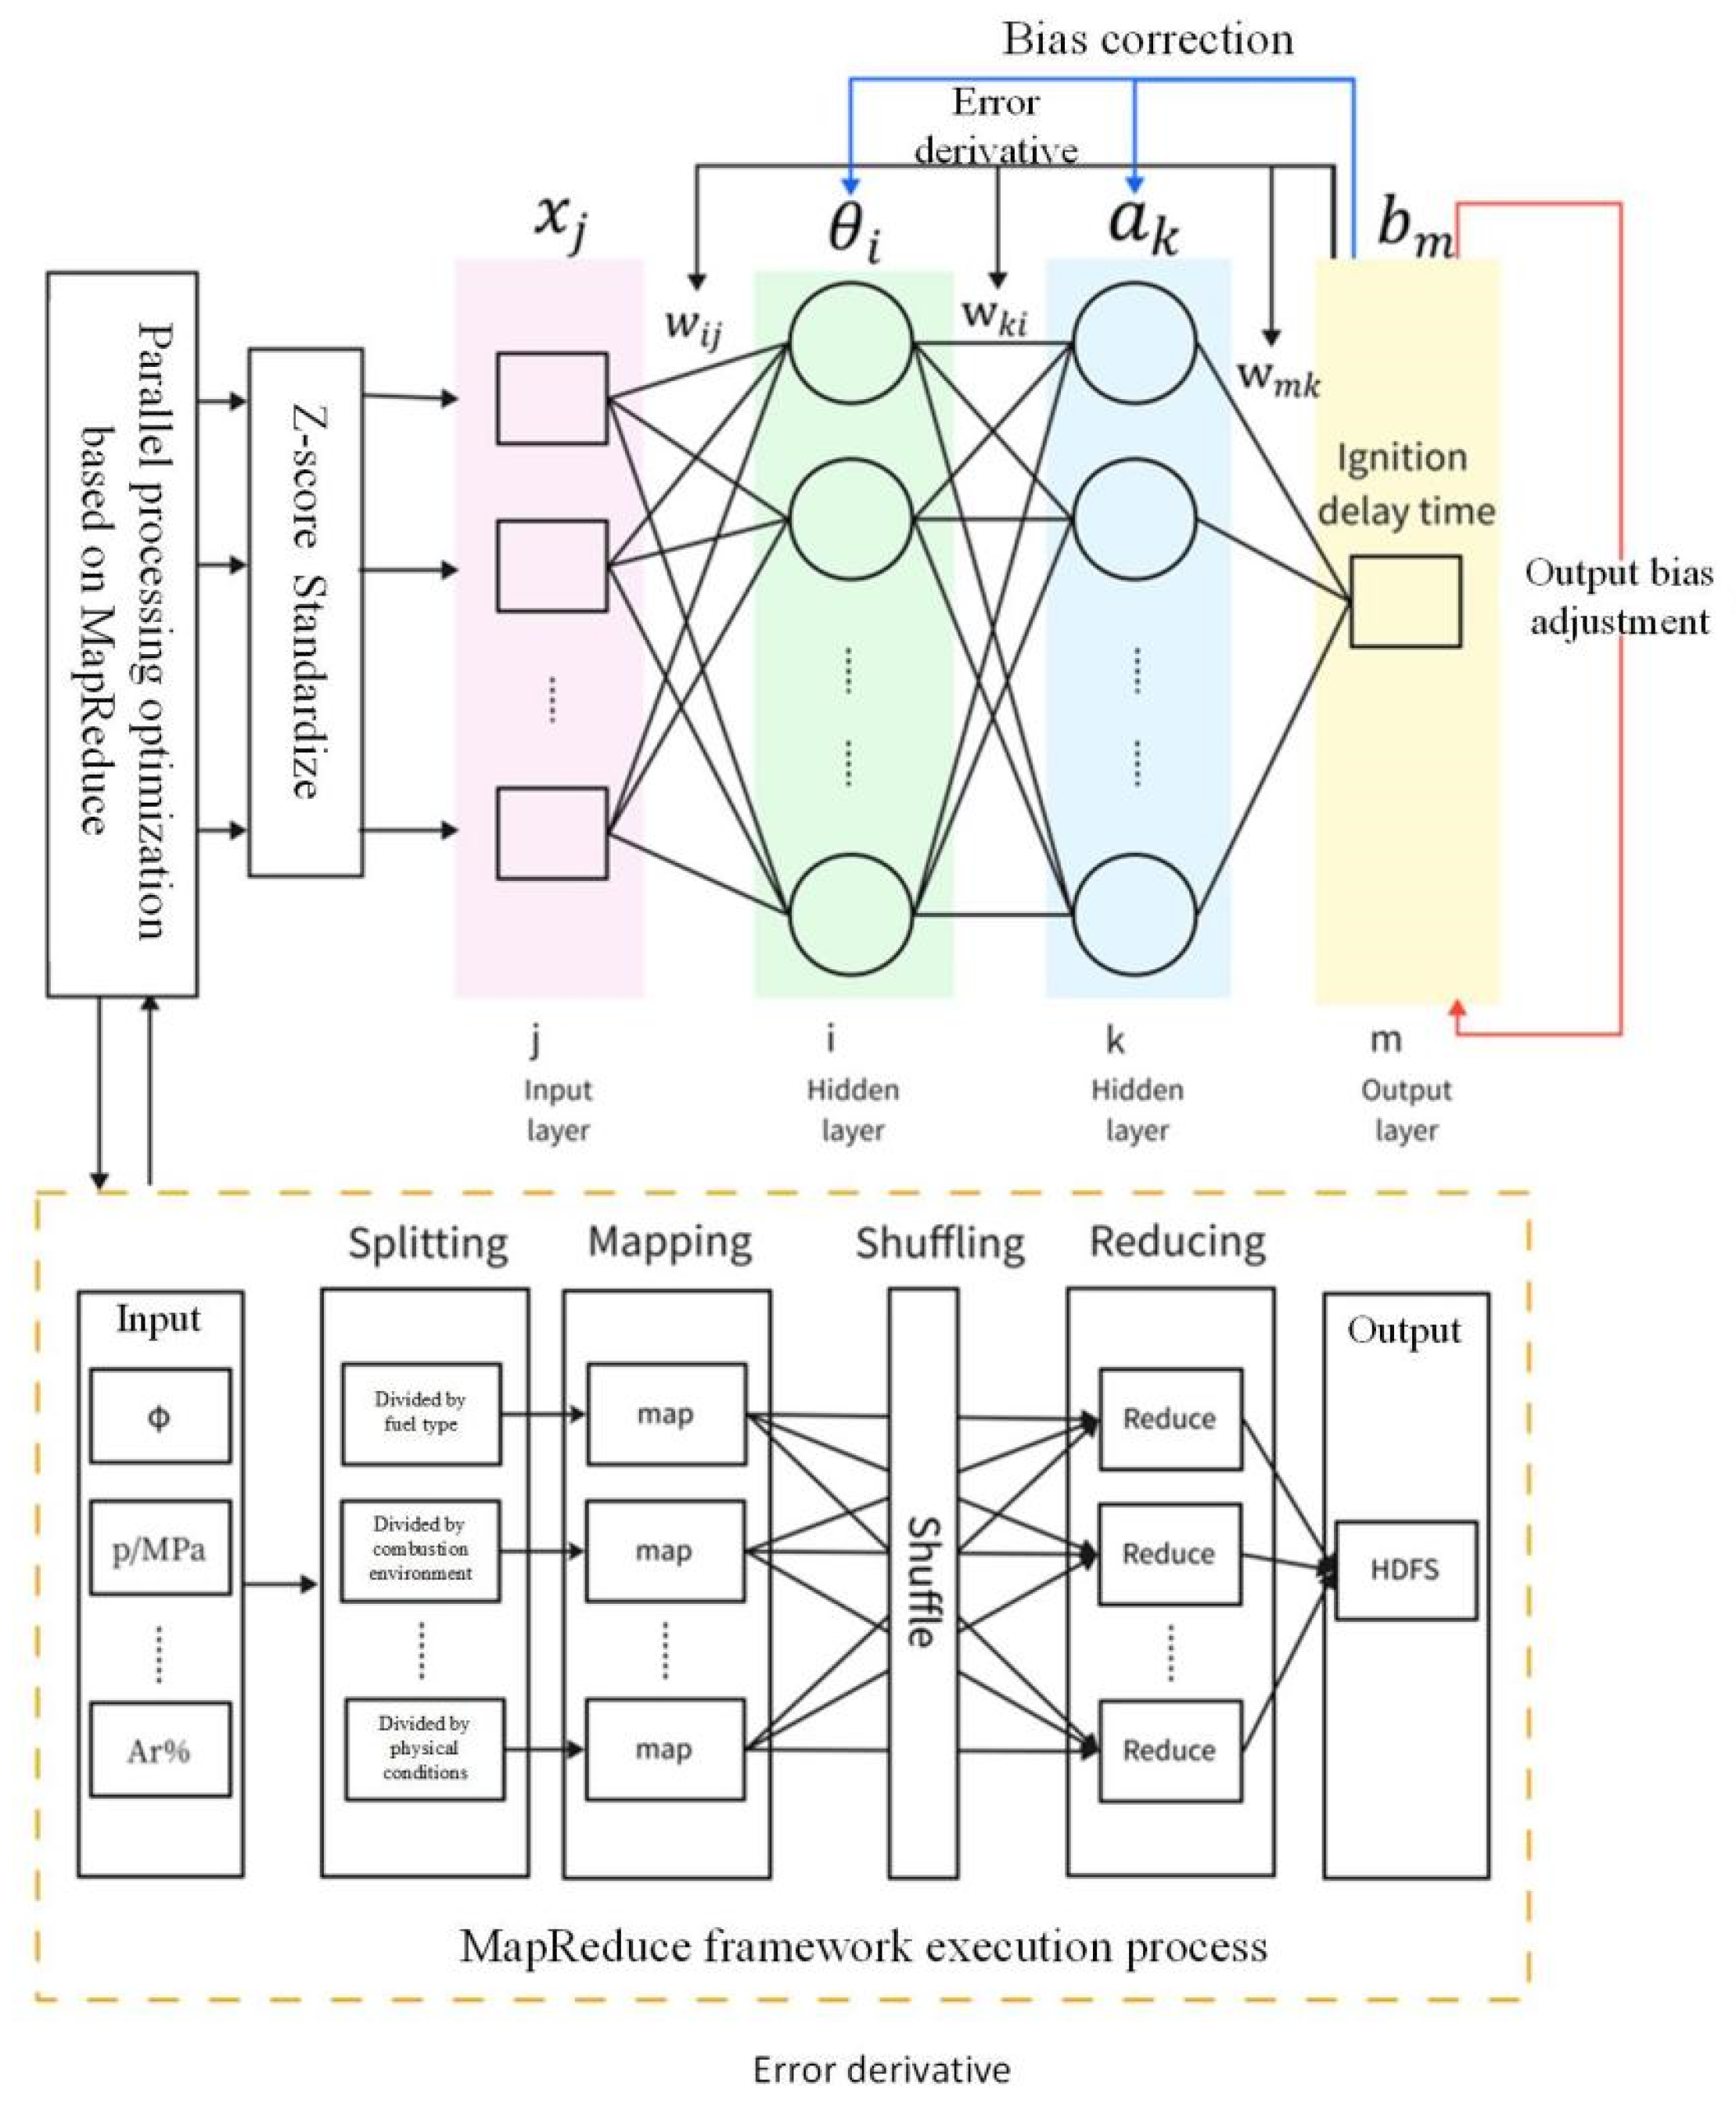
The optimized BP model based on MapReduce and PSO is called the BP-MRPSO neural network model. The architecture of the BP neural network, which incorporates MapReduce and PSO co-optimization, together with the data processing flow, is illustrated in Figure 4.
The dataset, consisting of 24,850 data points, undergoes initial processing using the MapReduce technique. Subsequently, the processed dataset is partitioned using a random sampling method. Based on random indices, the dataset is split into two distinct subsets: the training set and the test set. The dataset is divided into a training set comprising 80% (19,880 data points) of the data and a testing set comprising the remaining 20% (4970 data points) of the data. The data is partitioned and then standardized using the Z-score approach. Subsequently, the model is trained and predicted using a BP neural network optimized using the PSO algorithm.
To further enhance the model’s generalizability and effectively prevent overfitting, this paper introduces L2 regularization technology [21]. Regularization is implemented by adding an extra regularization term to the model’s loss function, which imposes constraints on the size of the model’s weights. In each iteration of loss calculation, in addition to the original error term, a proportion of the sum of squares of all network weights (controlled by the regularization coefficient λ, λ = 0.01) is also included as a penalty term, encouraging the model to learn smaller and more dispersed weight values during the training process, thus reducing the model’s sensitivity to noise in the training data. Moreover, to avoid overfitting, this paper sets a target error rate of 1; training will stop prematurely when the error during the model training process drops below this value.
Figure 4 illustrates the utilization of the MapReduce parallel processing technique and the PSO [22] to optimize BP neural networks’ ability to ensure that all input data are standardized before entering the training process. Regularization, as part of the model training, works in conjunction with the particle swarm optimization (PSO) algorithm. MapReduce greatly improves the velocity and efficiency of data processing by breaking down data into smaller entities for processing tasks and executing them simultaneously on numerous nodes [23]. The PSO method has efficiently directed the entire swarm towards the global optimal solution. This is achieved by modeling the foraging behavior of a flock of birds and altering each particle based on the individual and collective experience. This global search strategy enables the BP neural network to avoid falling into the local optimum during the parameter optimization process and find a better configuration of weights and thresholds [24]. The regularization term imposes additional constraints on the rules for updating weights, helping to prevent overfitting and enhance the stability and accuracy of the model. The integrated method not only improves the accuracy of prediction but also shortens the data processing time and substantially improves the computational efficiency and the ability of the BP neural network to deal with complex and high-dimensional datasets, which enhances the generalization performance of the model. The MapReduce approach is partitioned into four distinct stages for data processing.
As shown in Table 3, as the phase of division and transformation, the splitting phase divides the hydrocarbon fuel dataset based on specific parameters such as equivalence ratio (φ), pressure (p/MPa), temperature (T/K), various fuel concentrations (Kerosene%, Jet-A%, JP-8%, MCH%, JP-10%), oxygen percentage (O2%), nitrogen concentration (N2%), and argon concentration (Ar%). The dataset is divided into various subsets, and each subset is allocated to separate map jobs. Each map task is responsible for processing a specific subset of the dataset and executing the first filtering and transformation operations. In the shuffling phase, the output of the mapping task is reorganized and arranged in a specific order to guarantee that all pertinent data (such as the same fuel type or physical condition) is directed to the corresponding reducing job. During the reducing phase, a comprehensive statistical analysis is conducted to combine all data about each fuel type or particular condition. The data processed using the MapReduce technique is normalized using the Z-score approach, μ represents the mean, and σ represents the standard deviation. This approach standardizes the data by adjusting it to mean zero and variance one. This process guarantees that the various feature scales are consistent and enhances the effectiveness and reliability of network training.
x s t d = x μ σ
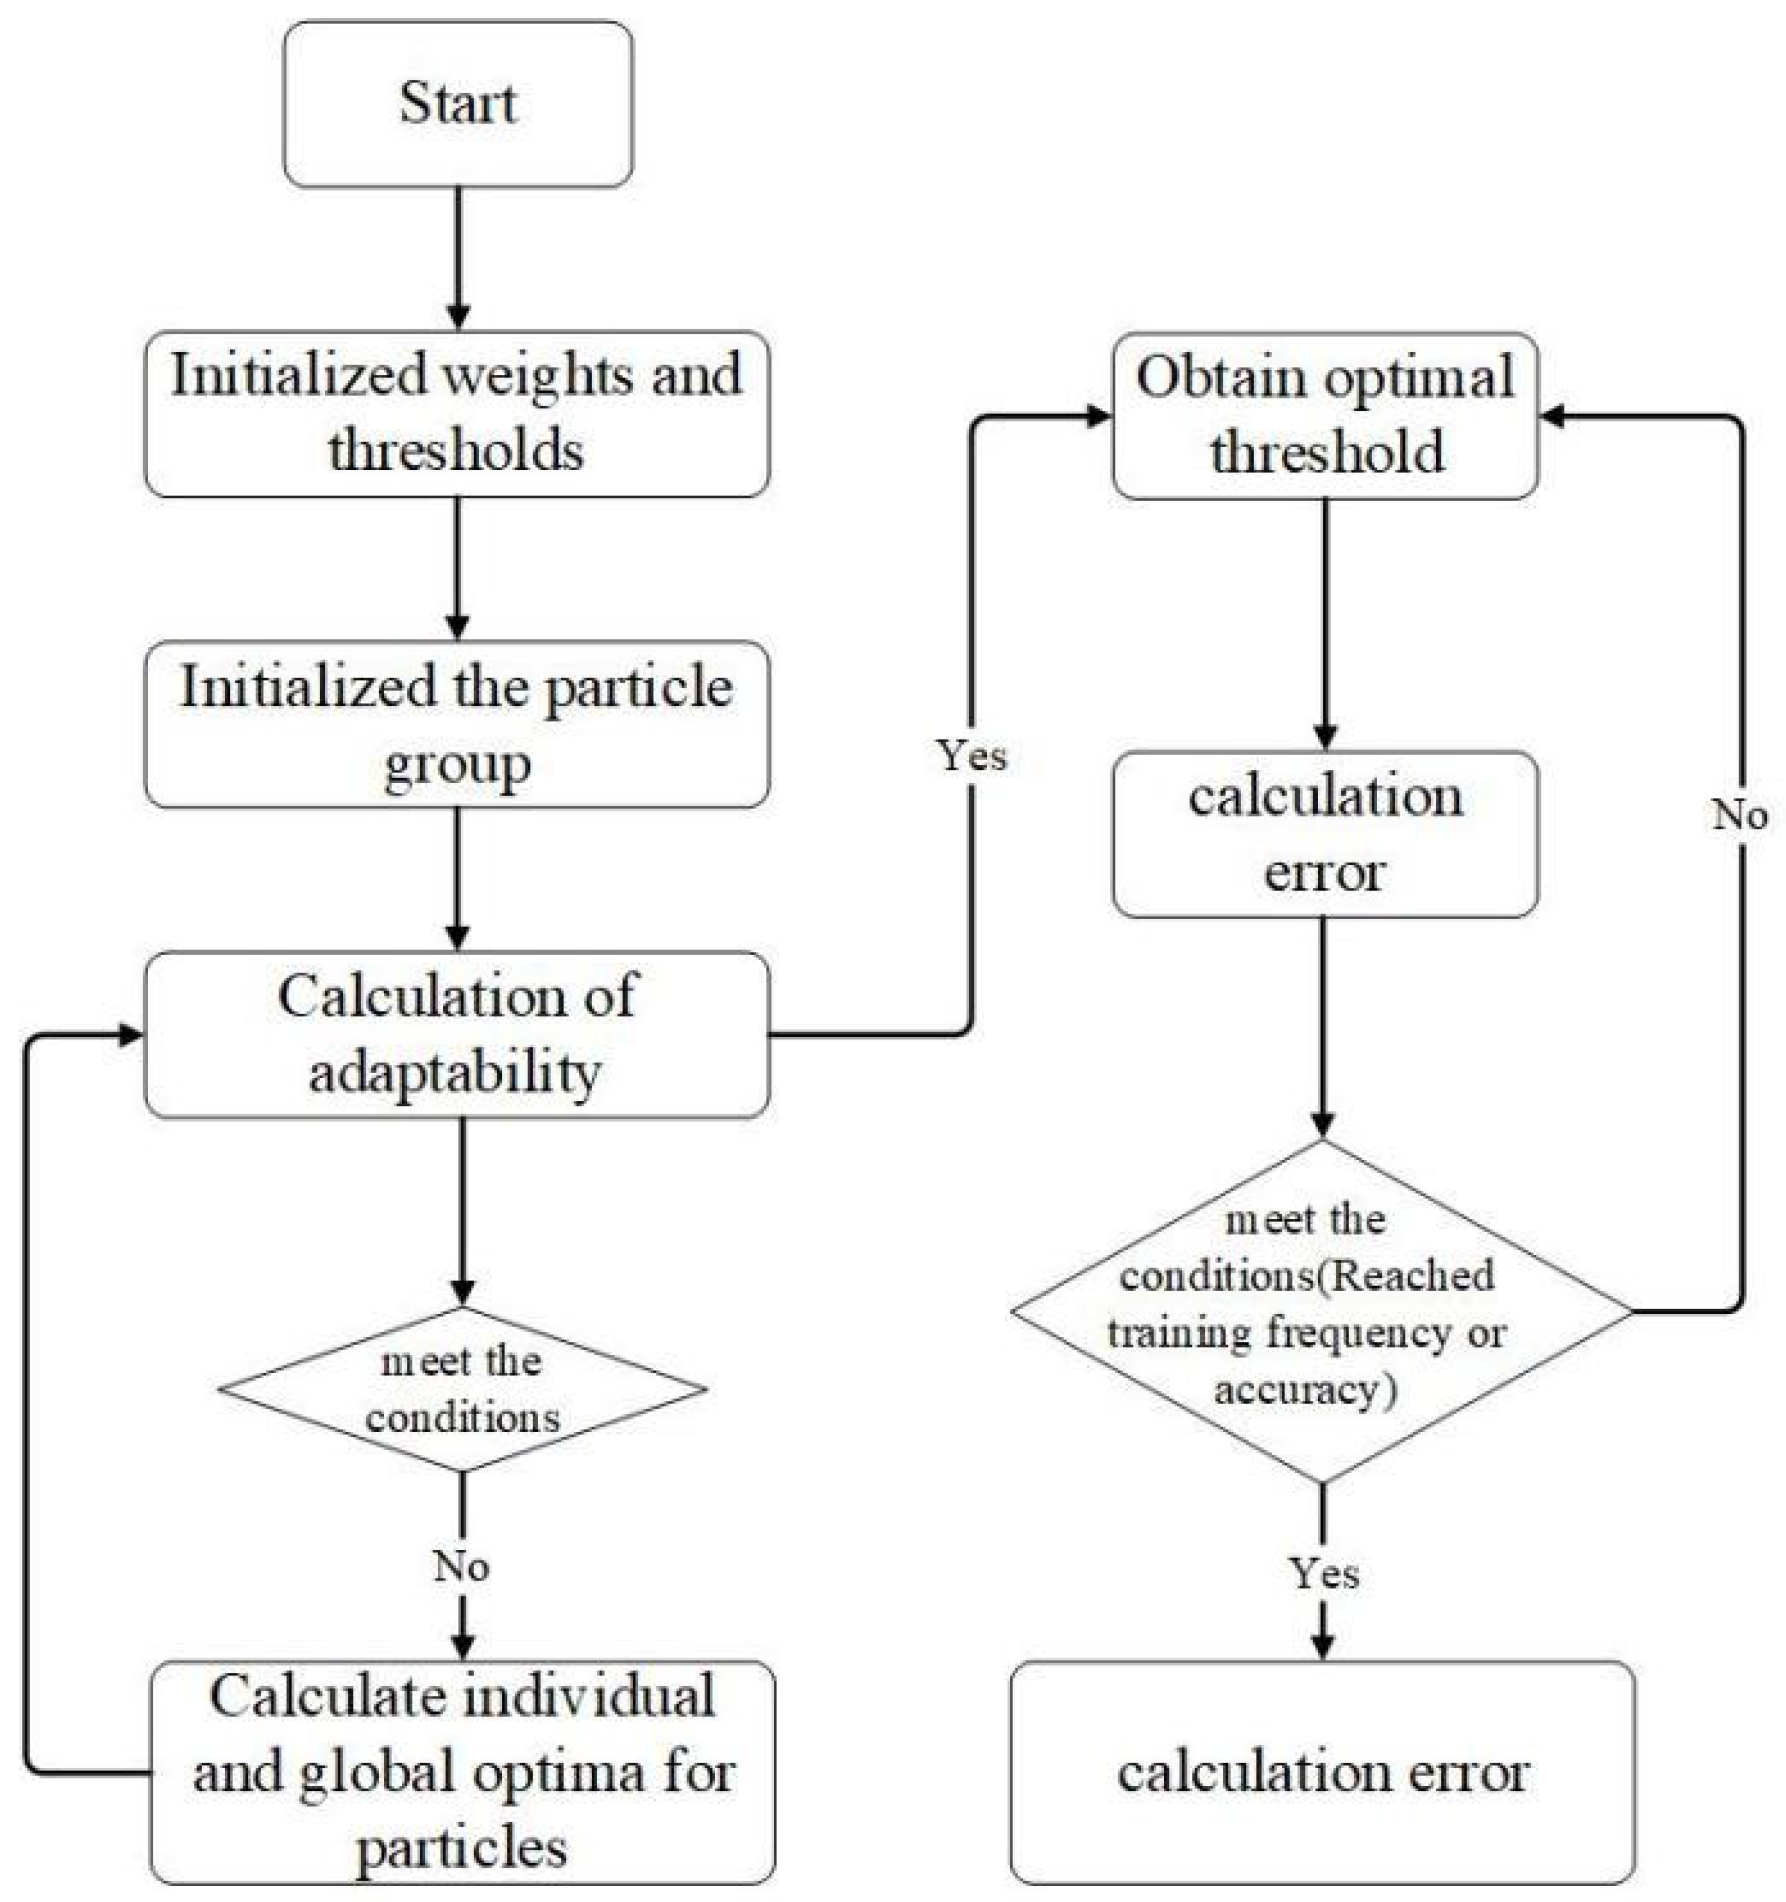
The Z-score approach is used to normalize the data, which is then inputted into a PSO-optimized BP neural network to train and predict the IDT. The PSO based BP neural network training process is shown in Figure 5.
The PSO algorithm is used in the training process instead of the traditional gradient descent method. The model is configured with 50 particles, with a maximum of 10,000 iterations, and both the individual learning factor (c1) and social learning factor (c2) are set to 2.0. The PSO particle positions represent the maximum and minimum values for adjusting the neural network weights and thresholds, which are set to 1.0 and −1.0, respectively. Using neural networks to evaluate the ability of each particle to predict fire characteristics. The evaluation results indicate that the PSO algorithm utilizes rules to update the speed and position of the particle swarm, while automatically adjusting the weights and thresholds of the neural network. This evaluation and updating process is iterated until the optimal weights and thresholds are discovered. Empirically, the inertia weights gradually decrease from 0.9 to 0.4, enabling precise analysis of the fuel ignition characteristics and validating the effectiveness of the model. The combination of MapReduce and PSO algorithms offers a more efficient and accurate approach to analyzing the ignition characteristics of hydrocarbon fuel. This co-optimization method is especially well-suited for handling high-dimensional and complex data in the ignition characteristics of hydrocarbon fuels, substantially enhancing prediction accuracy. Table 4 is a comparison of the structure of the base BP neural network model and the optimized BP-MRPSO model, listing the layer structure, the total number of parameters, the number of neurons per layer, the activation function used, and the average prediction accuracy of the fire characteristics, R2, for both models. The model includes an input layer, two hidden layers, and an output layer and uses ReLU as the activation function. It was experimentally measured that the performance is optimal when the number of neurons in each of the two hidden layers of the Basic BP model and the BP-MRPSO model were set to 12 and 11, 9 and 8, respectively.
When MapReduce and PSO are combined and applied to BP neural networks [22], MapReduce effectively manages and processes large-scale hydrocarbon fuel datasets through its distributed computing capability. The efficient data processing provides a high-quality database for the PSO algorithm, which enables the PSO algorithm to perform global parameter search and optimization more accurately.
MapReduce is used for large-scale data processing, while PSO is used for global parameter optimization, significantly improving the performance of neural networks in characterizing the ignition of hydrocarbon fuels.

4. Prediction and Analysis of Fuel Ignition Delay Characteristics

4.1. Comparison of BP-Based and BP-MRPSO Neural Networks

A backpropagation (BP) neural network was employed to predict and evaluate the ignition delay properties of hydrocarbon fuels with different carbon levels. The BP network learns the influence of temperature, pressure, and equivalence ratio on the ignition delay during training. Consequently, it effectively incorporates these intricate nonlinear connections inside the model.
To determine the optimal structure of the neural network, this study adopted a strategy combining grid search with 10-fold cross-validation. Initially, a multidimensional parameter space was defined, encompassing a variety of neuron number configurations from simple to complex, ranging from a single layer with 4 neurons to dual layers with up to 15 neurons each. A systematic grid search was employed within this parameter space to enumerate every conceivable neuron combination, from straightforward structures to more complex ones, ensuring comprehensive coverage of experimental data. Subsequently, rigorous evaluation of each neuron configuration was performed via 10-fold cross-validation. During each iteration, data was evenly divided into 10 subsets, with one subset serving as the validation set and the remaining nine used for training. This procedure was repeated 10 times, with a different subset selected as the validation data each time, to guarantee the fairness and accuracy of assessments. Furthermore, upon the completion of each cross-validation cycle, the average performance metrics of the model were computed, and the performance data for each configuration were documented.
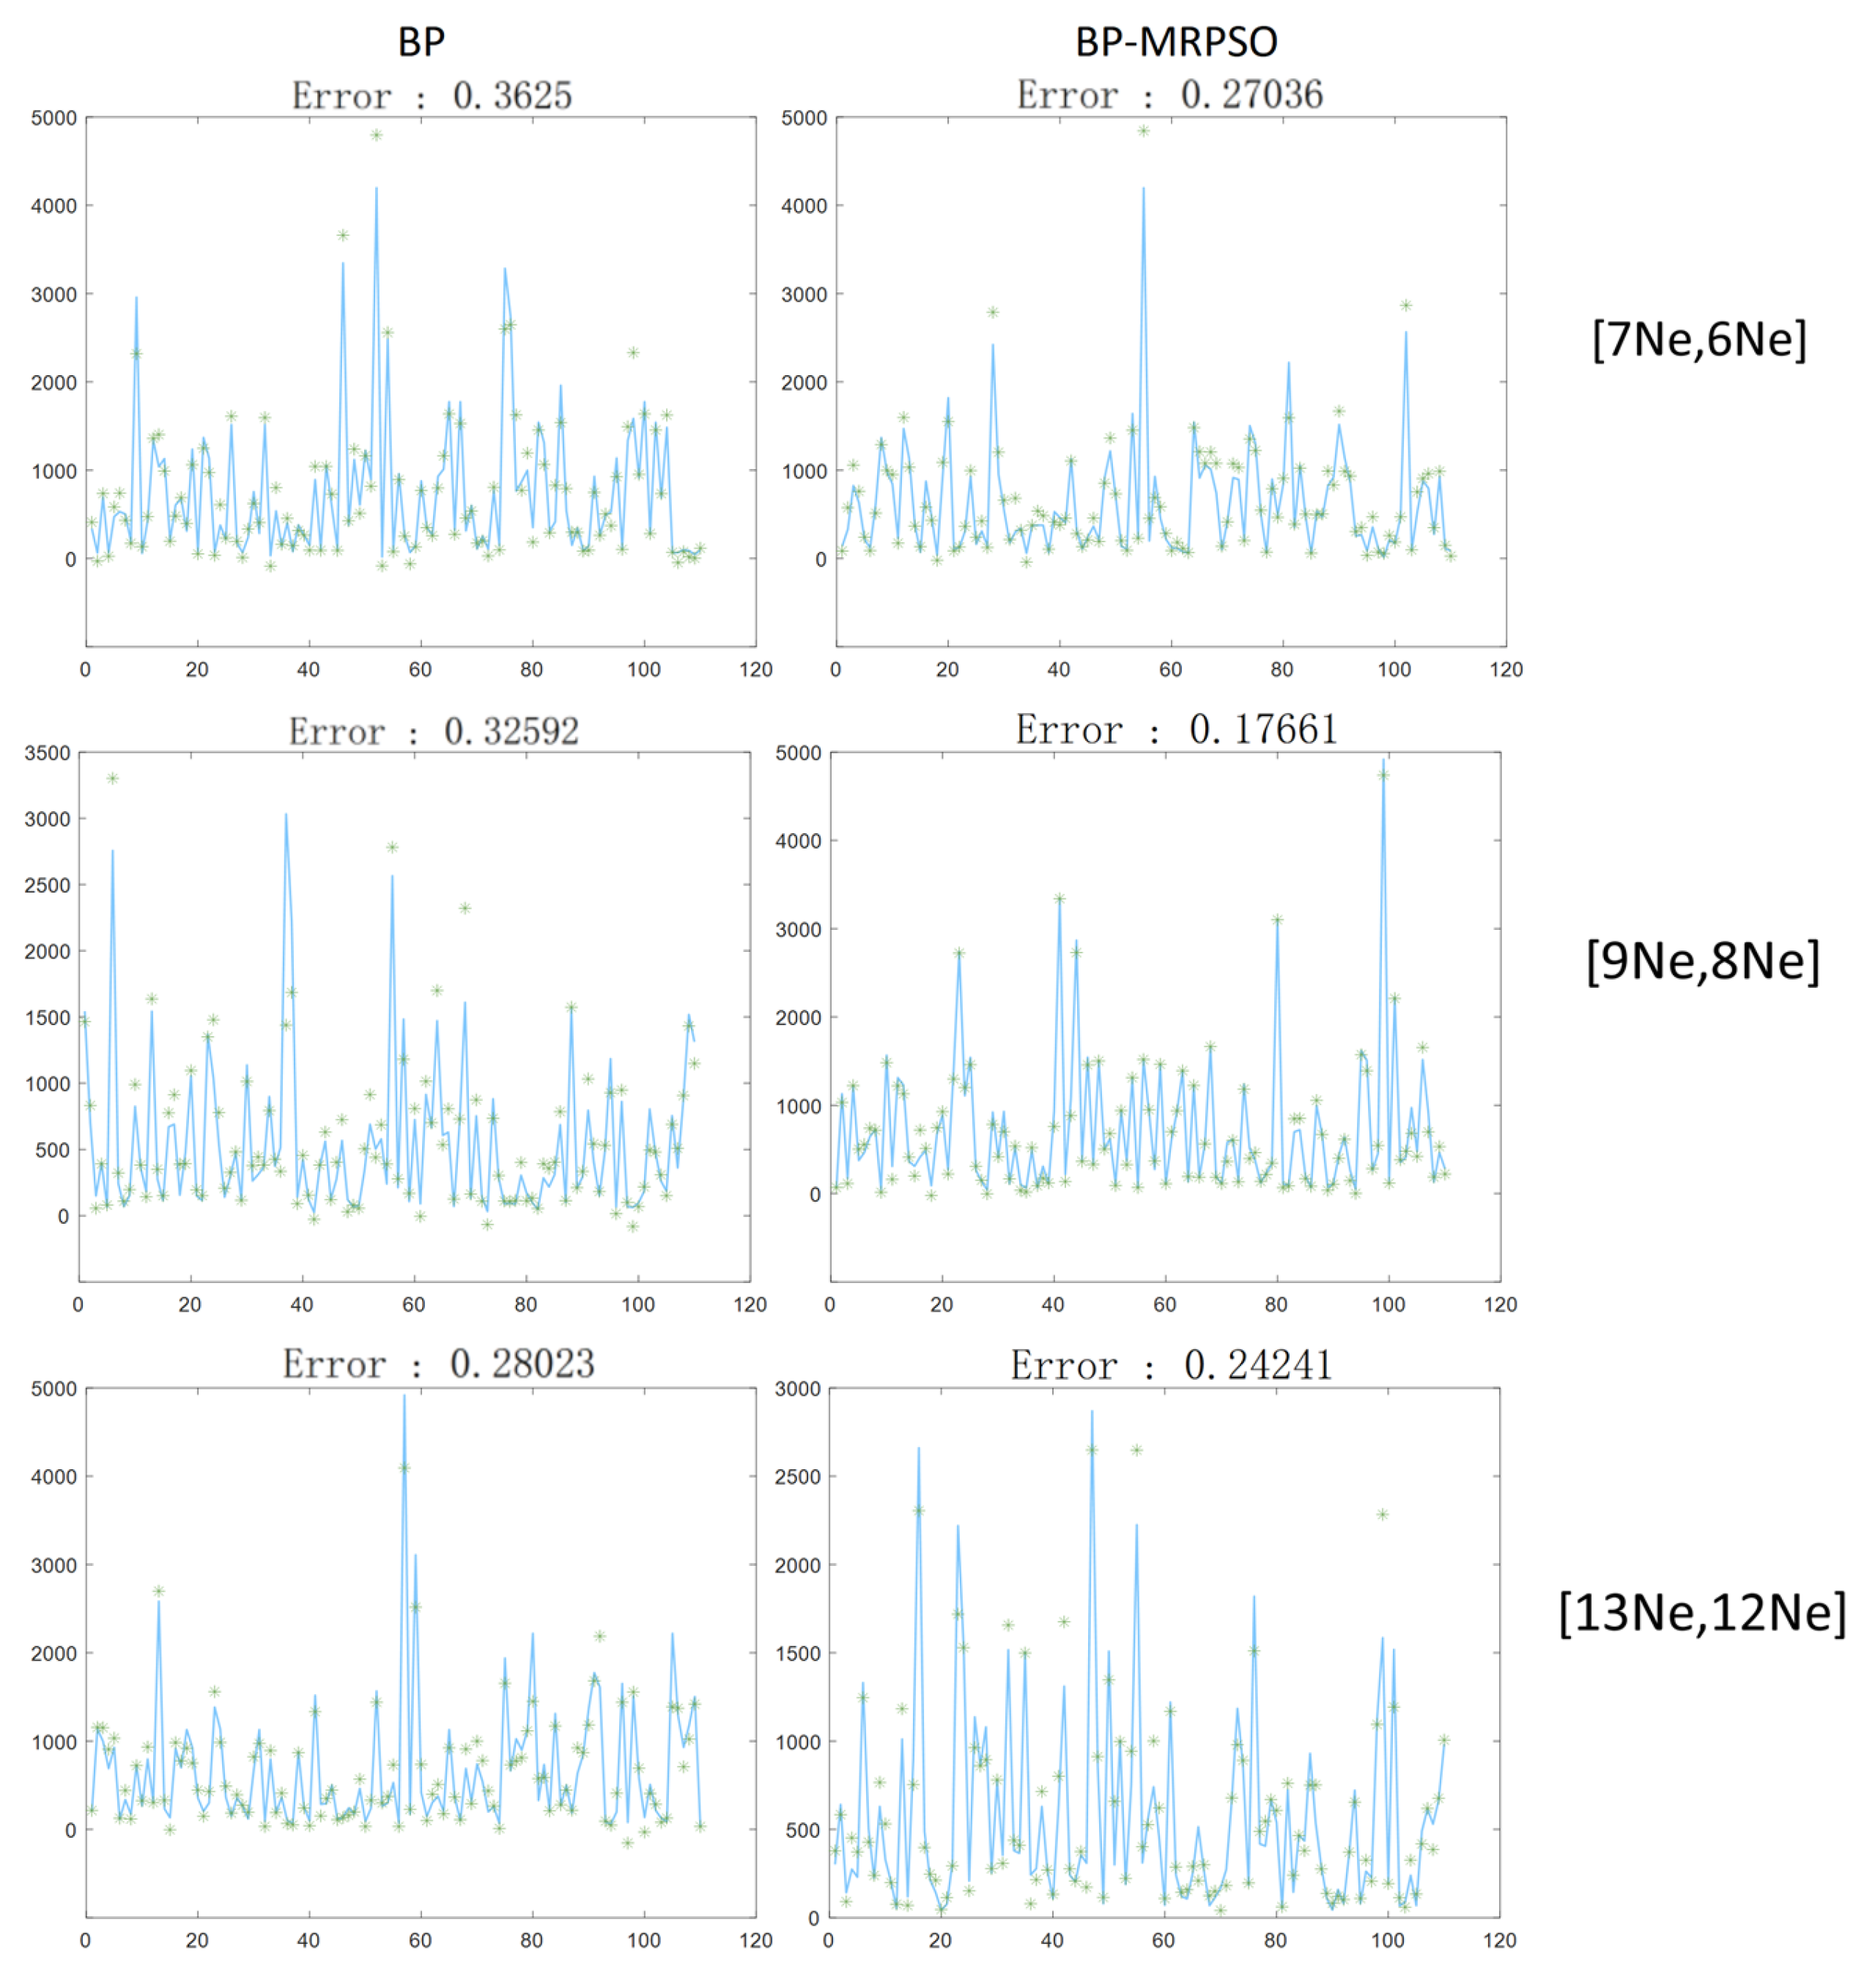
Figure 6 provides a comparative analysis of the predictions made by the BP and BP-MRPSO neural networks.
Figure 6 displays a comparative analysis of the performance of two distinct neural network models in predicting the IDT of fuel. The horizontal axis represents the index of the dataset samples, and the vertical axis indicates the ignition delay time. The left side displays the prediction results of the conventional BP neural network, while the right side showcases the prediction results of the BP neural network model that integrates the MapReduce and PSO algorithms. Refs. [6,7] refers to a neural network configuration with 7 neurons in the first hidden layer and 6 neurons in the second hidden layer. Similarly, refs. [15,24] indicates a configuration of 9 neurons in the first hidden layer and 8 neurons in the second hidden layer, and refs. [17,25] represents 12 neurons in the first hidden layer and 11 neurons in the second hidden layer. The model configurations, in descending order, are Chaos et al.; Wu et al. [25,26], Pawan et al.; Zhukov et al., [8,27], and Wang et al.; Wu et al., [11,12], representing the number of neurons in each configuration. Within each picture, the model predicts the IDT with a blue line, whereas a green asterisk shows the experimentally measured IDT. The prediction accuracy increased by 25.34% when the neuron configuration was changed from [25,26] to [8,27]. This change also increased the average correlation coefficient of the BP-MRPSO model from 0.9745 to 0.9896. Furthermore, the accuracy of the model improved to 38.89%. Similarly, when the neuron configuration was changed to [11,12], the accuracy of model increased by 25.02%. The experiments indicate that among various configurations, the neuron configuration of [8,9] exhibits the best performance on the validation set, with its average error rate reduced to 2.75%. Simultaneously, its performance on the test set also demonstrates its superior generalization capability. The BP-MRPSO model has superior capability in capturing and learning the intricate features of the IDT compared to the conventional BP model. By examining the traditional BP model depicted in the figure, it becomes apparent that there is a noticeable discrepancy between the actual values (represented by green dots) and the predicted values (represented by the blue line). However, in the BP-MRPSO model on the right, there is a substantial improvement in the agreement between the two, indicating the optimized model has extraordinary accuracy and resilience. Through ongoing optimization of the hidden layer structure and neuron count, our model demonstrates enhanced predictive capability and resilience in handling intricate data, which is a key factor in correctly predicting fuel ignition delay.
The optimized BP-MRPSO neural network model can conduct synchronous studies on activation energy. Regarded as a core output variable, activation energy represents the energy barrier that must be overcome for a reaction to occur and is a key parameter for assessing fuel ignition characteristics. This model utilizes a variety of input features, including but not limited to temperature (T), pressure (p), and equivalence ratio (φ). By learning the relationships between temperature, pressure, equivalence ratio, and activation energy, the BP-MRPSO model reveals how activation energy varies under different conditions, thereby optimizing combustion conditions for efficient burning. For instance, the equivalence ratio, the proportion of fuel to oxidizer (such as air), directly impacts the completeness and efficiency of the combustion reaction. Under ideal equivalence ratio conditions, fuel can burn completely, releasing maximum energy. The BP-MRPSO model allows for the exploration of changes in activation energy under different equivalence ratios, analyzing how conditions of excess or insufficient fuel affect activation energy and combustion efficiency, providing a scientific basis for optimizing the fuel mixture ratio.
Compared to traditional experimental and theoretical computation methods, the optimized BP neural network demonstrates significant advantages. Traditional methods are often constrained by experimental conditions and simplified computational models, making it difficult to capture the complex nonlinear relationships in the combustion process. In contrast, the optimized BP neural network, with its multilayer architecture and strong nonlinear fitting capability, can accurately predict ignition delay times across a broader range of parameters and exhibit equally precise and in-depth predictions for activation energy. This capability enables the model not only to handle large volumes of data but also to accurately capture the complex dynamics of how activation energy changes with combustion conditions, providing deeper insights into the combustion mechanisms of fuels. Especially in analyzing the dependencies of ignition delay times and activation energy on factors such as temperature, pressure, and equivalence ratio, the optimized BP neural network, with its high flexibility and adaptability, can reveal subtle differences in the changes in activation energy during the combustion process, which are often challenging to achieve with traditional methods. The application of this method not only improves the accuracy of predictions but also significantly enhances the efficiency and depth of research, offering a powerful analytical tool for optimizing aviation fuels and enhancing combustion efficiency.
In practical aeronautical engineering applications, the optimization model of hydrocarbon fuel ignition characteristics based on BP neural network can provide accurate combustion dynamics prediction for engine design, optimize combustion efficiency, and improve energy utilization. The model can accurately predict the fuel ignition characteristics in various flight conditions by examining the intricate reaction process. Additionally, it may offer valuable guidance for designing engine combustion chambers and help to develop more effective fuel management systems. The model can forecast combustion behavior in extreme situations, offering extra confidence in ensuring flight safety. Hence, this model improves the field of aeroengine design and offers vital data to support the future development of aviation fuels.

4.2. Analysis of Experimental and Prediction Results of BP-MRPOS

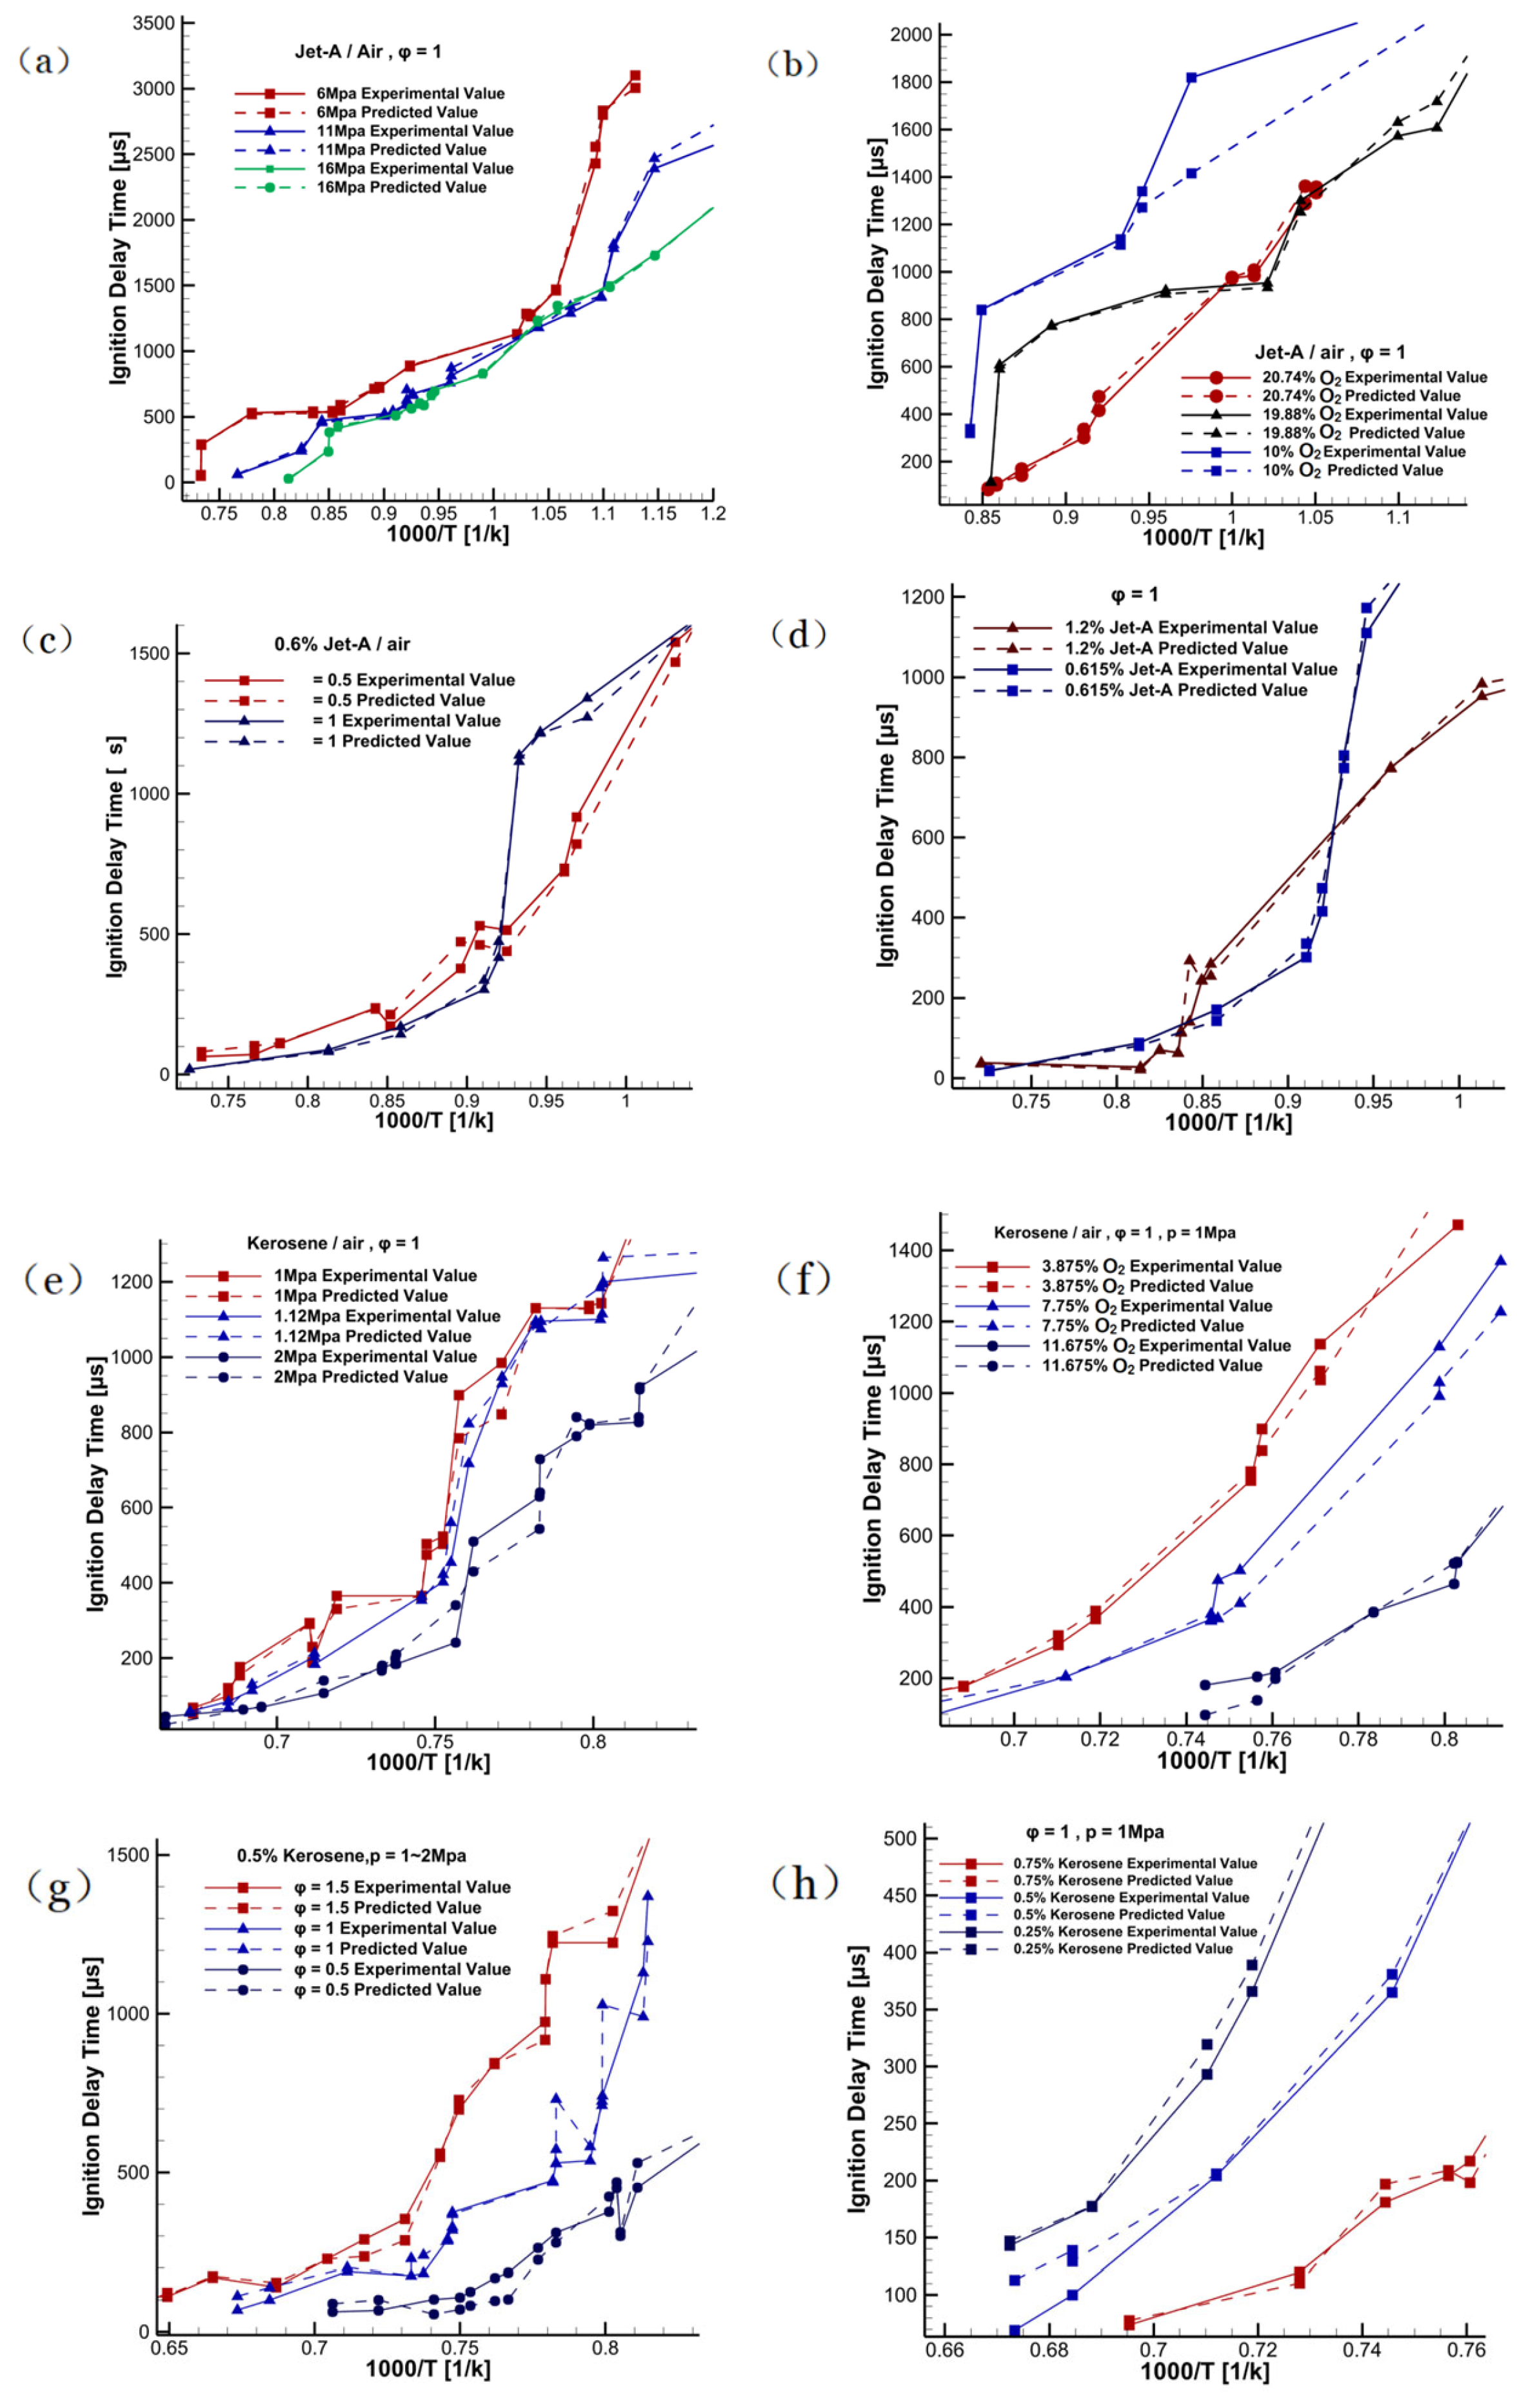
For data on the ignition characteristics of various hydrocarbon fuels, Figure 7 compares the experimental results with the predicted results.
The following presentation displays the prediction results of the BP neural network model, which integrates MapReduce and PSO algorithms. Jet A fuel and aviation kerosene are utilized as illustrative instances. By comparing the experimental values with the predicted values, it is evident that the BP-MRPSO neural network accurately predicts the IDT of hydrocarbon fuels across various conditions. Figure 7a,e display the experimental and projected values of the IDT of the mixture at various pressures, assuming an equivalence ratio φ of 1. The data points collected at various pressure levels clearly demonstrate the substantial impact of pressure on the ignition process. The data points collected at various pressure levels clearly demonstrate the substantial impact of pressure on the ignition process. Figure 7b,f display the measured and estimated IDTs for various oxygen concentrations for an equivalence ratio φ of 1. The correlation between the rise in IDT and the decrease in ignition temperature can be seen by the relationship with a 1/T increase. The IDT of Jet A fuel and aviation kerosene decreases as the oxygen concentration increases. This means the fuel oxidation reaction rate is enhanced when more oxygen is available, resulting in faster ignition. The IDTs of experimental and predicted values for various equivalence ratios are displayed in Figure 7c,g. The IDT of the combination with a mixture equivalence ratio φ of 1.5 is greater than that of the correct ratio mixture, indicating that the fuel concentration also plays a role in the igniting process. Figure 7d,h demonstrate the relationship between fuel concentration and IDT at an air-fuel ratio φ of 1. The results indicate that the IDT decreases when the fuel concentration increases regardless of the equivalence ratio remaining the same.
Table 5 shows some of the data comparing the experimental values with the predicted values based on the BP-MRPSO model, where the absolute error indicates that the difference between the predicted values and the actual values does not exceed 6 μm at most, and the error is controlled in a relatively small range. The relative error is less than 5%, which indicates that the prediction model can predict the experimental values with a relatively high degree of accuracy. Based on the absolute and relative errors, this data set shows that the prediction model has good accuracy and reliability.
Based on the information in Table 5, the computed accuracy R2 of the projected ignition characteristics is 90% or above in all cases. The prediction accuracy of the IDT is influenced by multiple parameters, as indicated by the trend of the curves in Figure 7. Combustion is an intricate chemical reaction process that includes numerous reaction stages and intermediate species. The speeds of these reaction steps frequently fluctuate with slight variations in temperature, pressure, and mixing ratio. Furthermore, slight deviations in experimental parameters, such as the precision of temperature regulation, the precision of pressure assessments, and the uniformity of fuel–air blending, can significantly influence the ignition delay. Furthermore, slight disparities in the chemical makeup of the fuel between different batches might also result in changes in igniting characteristics. Collectively, these elements contribute to the ignition process, rendering it challenging for even the most refined model to comprehensively encompass all variances, thereby restricting further enhancements in forecast precision.

5. Conclusions

Based on particle swarm optimization algorithm (PSO) and MapReduce-based parallel processing technology, a BP-MRPSO neural network model is constructed to analyze the ignition characteristics of hydrocarbon fuels. Co-optimization of MapReduce with PSO dramatically improves the prediction accuracy and stability of BP neural networks. Compared to the BP model, the BP-MRPSO model can increase the average correlation coefficient from 0.9745 to 0.9896.
The results also show that the accuracy R2 of the ignition characteristics prediction can reach 90% and above, The BP-MRPSO model can be used for synchronous studies of data such as ignition delay and activation energy, analyzing the effects of factors such as equivalence ratio, mixture gas pressure, ignition temperature, and combustion characteristics on these two data points. This method can not only handle large-scale datasets but can also maintain high accuracy with high efficiency, which provides a new perspective for the study and application of fuel ignition characteristics and is expected to play an essential role in the field of aviation fuel design and evaluation.

Author Contributions

Z.C.: visualization, writing—original draft and writing—review and editing; L.W.: supervision, writing—review and editing; Y.L.: data curation, formal analysis, writing—review and editing; H.M.: data curation, validation, writing—review and editing; M.Y.: writing—review and editing; J.S.: investigation, methodology, writing—review and editing, conceptualization, supervision. All authors have read and agreed to the published version of the manuscript.

Funding

The authors are grateful for the financial support of this work by the Shandong Huayu Institute of Technology Science and Technology Program (No. 2023KZ05) and University Students’ Innovation and Entrepreneurship Training Program (Project No. S202310153024).

Data Availability Statement

The raw data supporting the conclusion of this article will be made available by the authors without undue reservation.

Conflicts of Interest

The authors declare that the research was conducted in the absence of any commercial or financial relationships that could be construed as a potential conflict of interest.

Nomenclature

Abbreviation/TermFull Name/Explanation
AIArtificial intelligence
BPBack propagation
BP-MRPSOBack propagation-MapReduce particle swarm optimization
IDTIgnition delay time
PSOParticle swarm optimization
MapReduceA programming model for processing and generating large data sets
COCarbon monoxide
UHCUnburned hydrocarbons
ANNArtificial neural network
ϕEquivalence ratio
pPressure, MPa
TTemperature, K
O2Oxygen concentration, %
N2Nitrogen concentration, %
ArArgon concentration, %
IDTIgnition delay time, μs

References

  1. Xu, X.; Liu, E.; Zhu, N.; Liu, F.; Qian, F. Current Status of Performance Research on Ammonia Mixed Fuel Systems. Chem. Ind. Prog. 2022, 41, 2332–2339. [Google Scholar]
  2. Liu, J.; Hu, E.; Huang, Z.; Zeng, W. Ignition Delay Characteristics of RP-3 Aviation Kerosene Simulated Alternative Fuel. Propuls. Technol. 2021, 42, 467–473. [Google Scholar]
  3. Wei, S.; Wu, L.; Yu, Z.; Sun, L.; Zhang, Z. Analysis of Fuel Chemical Reaction Kinetics Characterization for RP-3 Jet Fuel in the Negative Temperature Coefficient Region. Acta Pet. Sin. 2024, 40, 16. [Google Scholar]
  4. Bui, T.T.; Luu, H.Q.; Hoang, A.T.; Konur, O.; Huu, T.; Pham, M.T. A review on ignition delay times of 2,5-Dimethylfuran. Energy Sources Part A Recover. Util. Environ. Eff. 2022, 44, 7160–7175. [Google Scholar] [CrossRef]
  5. Zhang, X.; Zeng, W.; Hu, B.; Yin, G.; Zhang, Y.; Ma, H. Experimental Study on Oxidation and Ignition Characteristics of RP-3 Aviation Kerosene/O2. J. Aerosp. Power 2024, 39, 20220381. [Google Scholar]
  6. Ma, H.; Xie, M.; Zeng, W.; Chen, B. Analysis of Influencing Factors on the Ignition Characteristics of RP-3 Aviation Kerosene. Propuls. Technol. 2015, 36, 306–313. [Google Scholar]
  7. Wang, M.; Chen, L.; Zeng, W. Analysis of the Mechanism of the Influence of Reactive Particles on the Ignition Characteristics of Aviation Kerosene. Propuls. Technol. 2022, 43, 375–381. [Google Scholar]
  8. Zhukov, V.P.; Sechenov, V.A.; Starikovskiy, Y.A. Autoignition of kerosene (Jet-A)/air mixtures behind reflected shock waves. Fuel 2014, 126, 169–176. [Google Scholar] [CrossRef]
  9. Li, B. Deep Network Inversion Analysis and Its Application in Abrasive Waterjet Etching. Master’s Thesis, Dalian University of Technology, Dalian, China, 2022; pp. 1–93. Available online: https://link.cnki.net/doi/10.26991/d.cnki.gdllu.2022.000764 (accessed on 23 April 2024).
  10. Samanta, B.; Al-Balushi, K.R.; Al-Araimi, S.A. Artificial neural networks and genetic algorithm for bearing fault detection. Soft Comput. 2006, 10, 264–271. [Google Scholar] [CrossRef]
  11. Wu, G.Q. Fault detection method for ship equipment based on BP neural network. In Proceedings of the 2018 International Conference on Robots & Intelligent System, Changsha, China, 26–27 May 2018; IEEE: Piscataway, NJ, USA, 2018; pp. 556–559. [Google Scholar]
  12. Wang, X.M.; Wang, J.; Privault, M. Artificial intelligent fault diagnosis system of complex electronic equipment. J. Intell. Fuzzy Syst. 2018, 35, 4141–4151. [Google Scholar] [CrossRef]
  13. Cui, Y.; Wang, Q.; Liu, H.; Zheng, Z.; Wang, H.; Yue, Z.; Yao, M. Development of the ignition delay prediction model of n-butane/hydrogen mixtures based on artificial neural network. Energy AI 2020, 2, 100033. [Google Scholar] [CrossRef]
  14. Huang, Y.; Jiang, C.; Wan, K.; Gao, Z.; Vervisch, L.; Domingo, P.; He, Y.; Wang, Z.; Lee, C.H.; Cai, Q.; et al. Prediction of ignition delay times of Jet A-1/hydrogen fuel mixture using machine learning. Aerosp. Sci. Technol. 2022, 127, 107675. [Google Scholar] [CrossRef]
  15. Bounaceur, R.; Heymes, R.; Glaude, P.A.; Sirjean, B.; Fournet, R.; Montagne, P.; Auvray, A.; Impellizzeri, E.; Biehler, P.; Picard, A.; et al. Development of an Artificial Intelligence Model to Predict Combustion Properties, With a Focus on Auto-Ignition Delay. J. Eng. Gas Turbines Power 2024, 146, 061011. [Google Scholar] [CrossRef]
  16. Liang, J.; Wang, S.; Hu, H.; Zhang, S.; Fan, B.; Cui, J. Shock tube study of kerosene ignition delay at high pressures. Sci. China Phys. Mech. Astron. 2012, 55, 947–954. [Google Scholar] [CrossRef]
  17. Tang, H.C.; Zhang, C.H.; Li, P.; Wang, L.D.; Ye, B.; Li, X.Y. Experimental study on the self ignition characteristics of kerosene. Acta Phys. Chim. Sin. 2012, 28, 787–791. [Google Scholar]
  18. Vasu, S.S.; Davidson, D.F.; Hanson, R.K. Jet fuel ignition delay times: Shock tube experiments over wide conditions and surrogate model predictions. Combust. Flame 2008, 152, 125–143. [Google Scholar] [CrossRef]
  19. Li, F.; Ooi, B.C.; Özsu, M.T.; Wu, S. Distributed data management using MapReduce. ACM Comput. Surv. (CSUR) 2014, 46, 1–42. [Google Scholar] [CrossRef]
  20. Zhai, N.G.; Deng, J.S. Overview of Particle Swarm Optimization Algorithms. Technol. Innov. Guide 2015, 12, 216–217. [Google Scholar]
  21. dos Santos, C.F.G.; Papa, J.P. Avoiding overfitting: A survey on regularization methods for convolutional neural networks. ACM Comput. Surv. (CSUR) 2022, 54, 1–25. [Google Scholar] [CrossRef]
  22. Karloff, H.; Suri, S.; Vassilvitskii, S. A model of computation for MapReduce. In Proceedings of the Twenty-First Annual ACM-SIAM Symposium on Discrete Algorithms, Austin, TX, USA, 17–19 January 2010; Society for Industrial and Applied Mathematics: Philadelphia, PA, USA, 2010; pp. 938–948. [Google Scholar]
  23. Dean, J.; Ghemawat, S. MapReduce: Simplified data processing on large clusters. Commun. ACM 2008, 51, 107–113. [Google Scholar] [CrossRef]
  24. Houssein, E.H.; Gad, A.G.; Hussain, K.; Suganthan, P.N. Major advances in particle swarm optimization: Theory, analysis, and application. Swarm Evol. Comput. 2021, 63, 100868. [Google Scholar] [CrossRef]
  25. Wu, Y.T.; Kong, X.D.; Wang, X.H.; Liang, J.H.; Tang, C.L.; Huang, Z.H.; Wang, B.Y.; Zeng, P. Experimental and kinetic studies on self ignition characteristics of aviation kerosene during direct coal liquefaction. Propuls. Technol. 2023, 31, 1–8. [Google Scholar]
  26. Chaos, M.; Dryer, F.L. Chemical-kinetic modeling of ignition delay: Considerations in interpreting shock tube data. Int. J. Chem. Kinet. 2010, 42, 143–150. [Google Scholar] [CrossRef]
  27. Pawan, Y.N.; Prakash, K.B.; Chowdhury, S.; Hu, Y.-C. Particle swarm optimization performance improvement using deep learning techniques. Multimed. Tools Appl. 2022, 81, 27949–27968. [Google Scholar] [CrossRef]
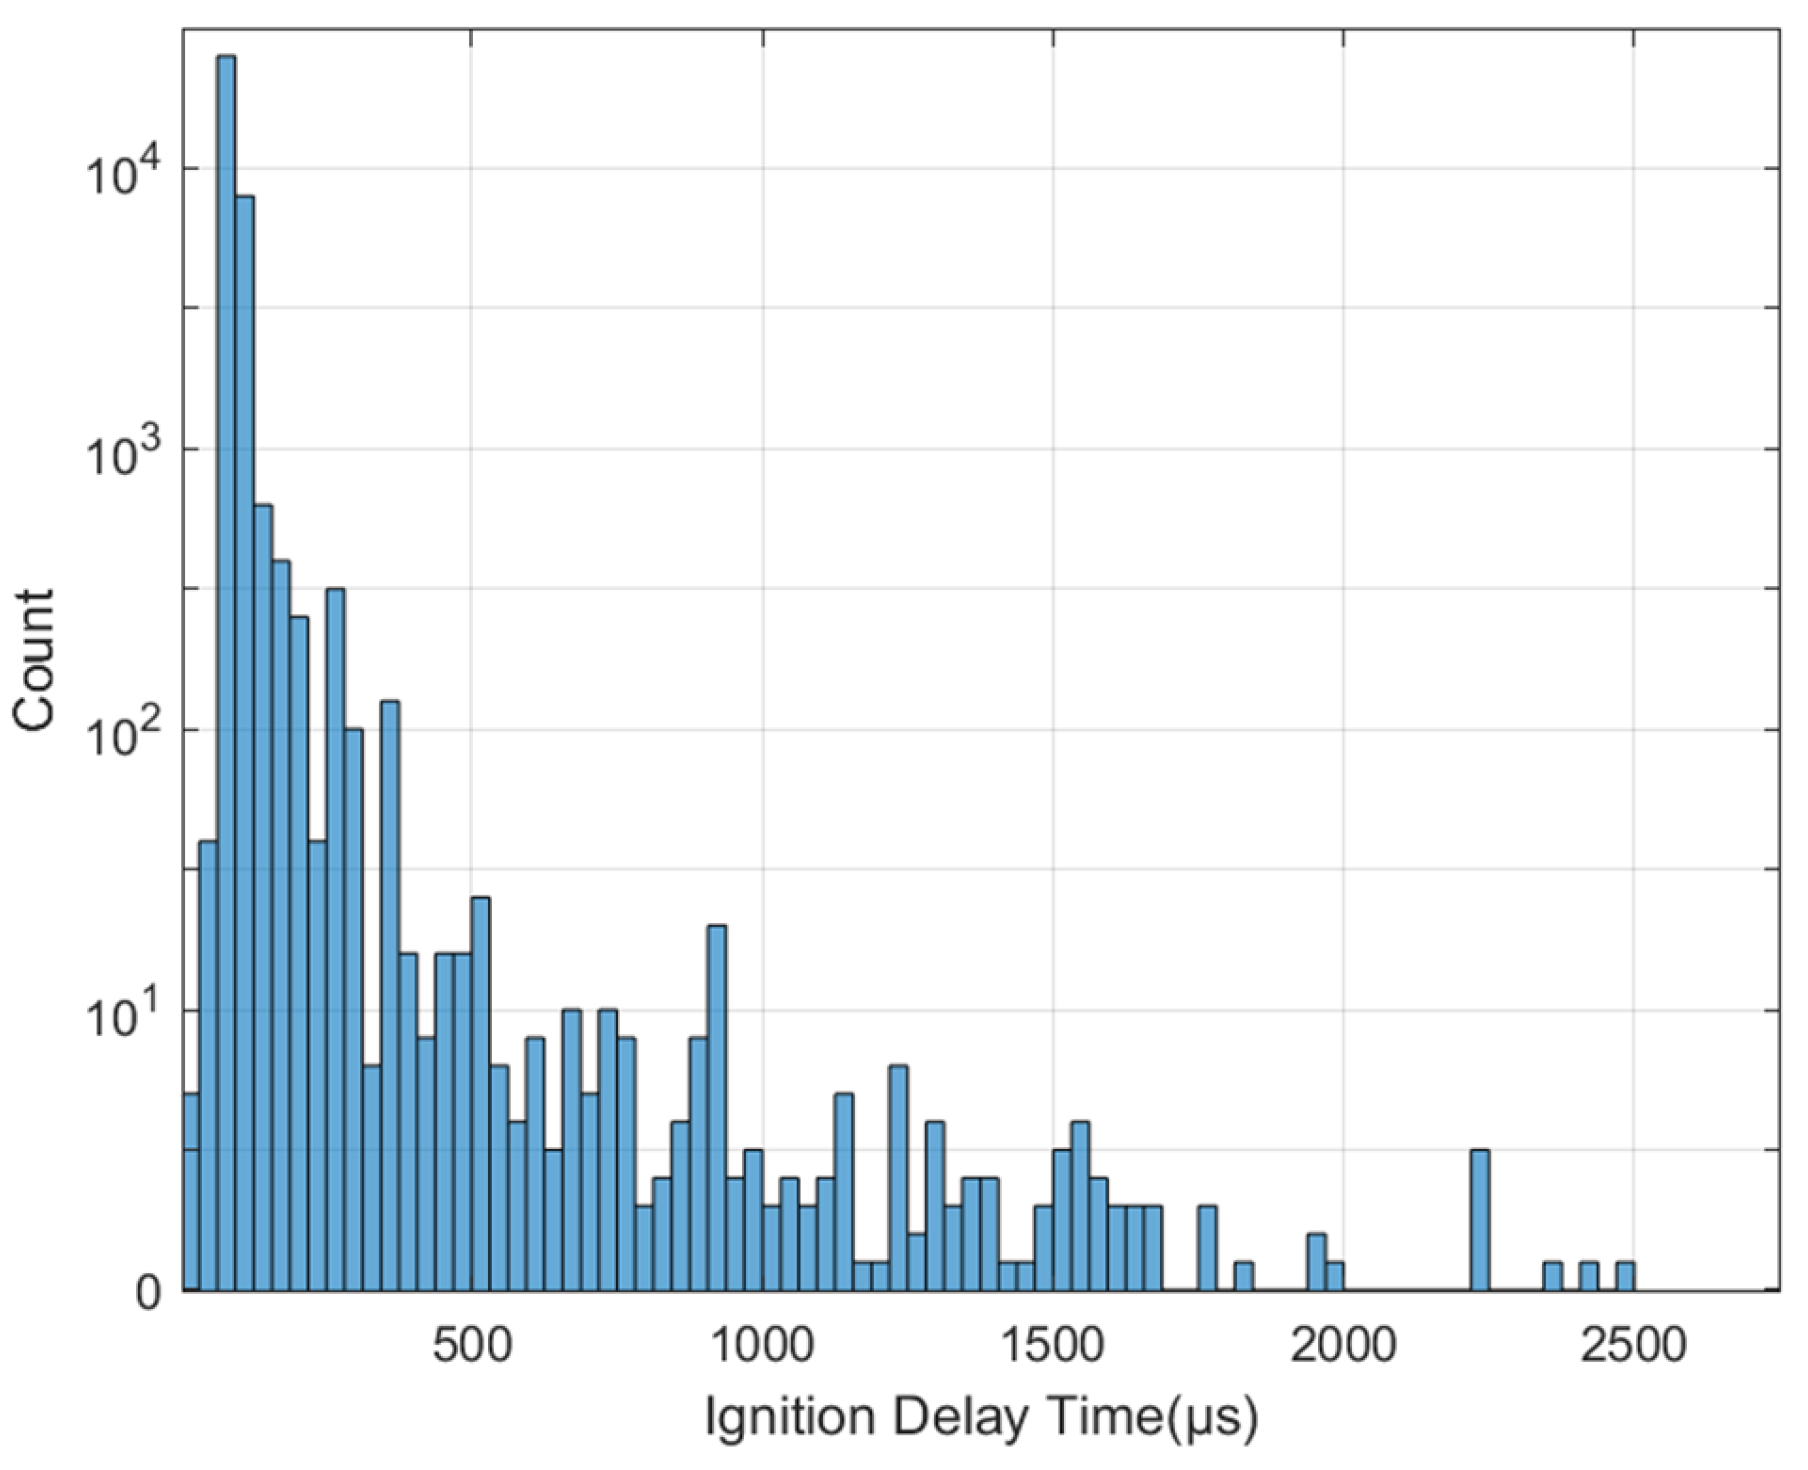
Figure 1. Long tail distribution of IDT values.
Energies 17 02072 g001
Figure 2. Distribution of IDT for different fuels.
Energies 17 02072 g002
Figure 3. Structure of BP neural network model.
Energies 17 02072 g003
Figure 4. BP neural network structure and data processing flowchart based on MapReduce (https://hadoop.apache.org/) and PSO co-optimization.
Energies 17 02072 g004
Figure 5. Flowchart of BP neural network training based on PSO.
Energies 17 02072 g005
Figure 6. Comparison of BP and BP-MRPSO neural network model prediction plot. (The vertical axis represents the ignition delay time (μs), and the horizontal axis represents the dataset sample index, Asterisk (*) indicates the experimental value).
Energies 17 02072 g006
Figure 7. Comparison of experimental and predicted fuel IDTs: (ad) for fuel Jet-A [11,18], (eh) on fuel kerosene [6,16,17].
Energies 17 02072 g007
Table 1. Systematic errors in experimental data from references.
ReferenceMa et al. [6]Tang et al. [17]Cui et al. [13]Liang et al. [16]
Systematic Error4%0.42%1.06%10%
Table 2. Initial condition range for different aviation fuels.
FeatureRangeDivision Value
Equivalent ratio (-)0.5–1.50.1
Pressure (MPa)1–180.01
Temperature (K)715.0–1671.00.1
Fuel concentration (%)0.25–1.250.001
Oxygen concentration (%)3.8–23.250.001
Nitrogen concentration (%)0–0.10.001
Argon concentration (%)76.0–95.8750.001
Table 3. BP-MRPSO input and output parameters explanation.
Parameter TypeParameter NameUnit
Inputϕ-
InputpMPa+
InputTK
InputO2%
InputN2%
InputAr%
InputFuel Chemical CompositionVariable
OutputIDTμs
Table 4. Structures of the basic BP and BP-MRPSO models.
ModelTotal ParametersLayer TypeNeuron NumberActivation FunctionMean R-Squared
Basic BP251Input7--83%
Dense12ReLu
Dense11ReLu
Dense (Output)1ReLu
BP-MRPSO161Input7--92%
Dense9ReLu
Dense8ReLu
Dense (Output)1ReLu
Table 5. Comparison of experimental and predicted values predicted by the BP-MRPSO model serial number.
Serial NumberExperimental Value (μs)Predicted Value (μs)Absolute Error (μs)Relative Error
151.853.9392.1394.129
2405410.3355.3351.317
34543.3911.6083.575
4189183.0015.9983.173
5125121.8163.1832.546
6237242.8485.8482.467
7162156.8375.1623.186
8125121.8163.1832.546
9175180.4105.4103.091
10114118.8724.8724.274
Disclaimer/Publisher’s Note: The statements, opinions and data contained in all publications are solely those of the individual author(s) and contributor(s) and not of MDPI and/or the editor(s). MDPI and/or the editor(s) disclaim responsibility for any injury to people or property resulting from any ideas, methods, instructions or products referred to in the content.