Abstract
The use of renewable energy sources to achieve carbon neutrality is increasing. However, the uncertainty and volatility of renewable resources are causing problems in power systems. Flexible and low-carbon resources such as Energy Storage Systems (ESSs) are essential for solving the problems of power systems and achieving greenhouse gas reduction goals. However, ESSs are not being installed because of Korea’s fuel-based electricity market. To address this issue, this paper presents a method for determining the optimal investment timing of Battery Energy Storage Systems (BESSs) using the Least Squares Monte Carlo (LSMC) method. A case study is conducted considering the System Marginal Price (SMP) and Capacity Payment (CP), which are electricity rates in Korea. Revenue is calculated through the arbitrage of a 10 MW/40 MWh lithium-ion BESS, and linear programming optimization is performed for ESS scheduling to maximize revenue. The ESS revenue with uncertainty is modeled as a stochastic process using Geometric Brownian Motion (GBM), and the optimal time to invest in an ESS is determined using an LSMC simulation considering investment costs. The proposed method can be used as a decision-making tool for ESS investors to provide information on facility investments in arbitrage situations.
1. Introduction
In response to climate change, the Paris Agreement was adopted to keep the global temperature rise below 2 °C compared to pre-industrial times and limit it to within 1.5 °C. Subsequently, the Intergovernmental Panel on Climate Change published a Global Warming of 1.5 °C report, suggesting a global path to achieve carbon neutrality by 2050 to meet the goals of the Paris Agreement [1,2].
Aligned with these trends, South Korea has established the 2030 National Greenhouse Gas Reduction Goals. The expansion of renewable energy generators and a reduction in coal generators are methods for achieving this goal [3]. To reduce greenhouse gas emissions, the Ministry of Trade, Industry, and Energy announced a basic plan for electricity supply and demand, setting targets to increase the share of renewable energy generation from 6.2% in 2018 to 21.6% by 2030 and 30.6% by 2036 [4]. The potential of renewable energy in Korea is 6,180,571 GWh/year of solar thermal, 2,337,875 GWh/year of solar photovoltaic, and 1,691,704 GWh/year of geothermal energy [5].
However, with the increase in variable renewable energy resources, such as wind and solar power, problems in power systems are increasing. The expansion of solar power generation increases the output volatility during sunrise and sunset, requiring adjustments in thermal power generation to accommodate these fluctuations.
Securing flexible resources is necessary to solve the problems that occur in power systems [6]. An ESS, a low-carbon resource, is a representative flexible resource [7]. Various countries are actively installing ESSs, and the forecast based on each country’s energy plans is expected to increase to 370 GWh by 2030 and 3400 GWh by 2050. To maintain global temperature increases below 2 °C, it is forecasted that 754 GWh of ESSs will be installed by 2030, and by 2050, this capacity is expected to reach 9000 GWh [8]. The U.S. Department of Energy announced the goal of accelerating the development and commercialization of next-generation ESSs and reducing ESS installation costs by 2030. In Korea, as of 2021, a total of 10.3 GWh has been installed, including 5674 MWh for renewable energy and 4349 MWh for peak reduction purposes [9,10]. Table 1 lists the ESS facilities to be configured by 2036 based on the basic plan for electricity supply and demand [11].

Table 1.
Energy Storage Mix by 2036 in Korea.
An ESS is used effectively for peak shaving, frequency regulation, and renewable energy support [12]. The role of an ESS is classified depending on its duration; a short-term ESS supplies power within a short period or shifts the surplus power to peak demand hours. A long-term ESS addresses the output limitations of renewable energy on a daily to weekly basis, and a seasonal ESS enables energy storage and supply on a seasonal basis, contributing to power planning [13].
However, Korea’s fuel-based electricity market is unsuitable for investment-centric sources, such as ESSs. Due to limited investments in ESSs, the renewable energy system was reduced to 96 MW in 2021, 2 MW in 2022, and 0 MW in 2023. Consequently, only 107 MW of ESSs were installed in 2023 [10]. To address this issue, ESSs are being installed through the Jeju BESS central contract market, a long-term contract market aimed at expanding ESSs. Similarly, the UK’s National Grid is installing ESSs through long-term contracts, such as the Network Options Assessment Stability Pathfinder. PG&Es in the United States are expanding their ESS facilities through long-term contracts [14,15,16]. To achieve the goal of the basic plan for electricity supply and demand, a method must be developed to determine the optimal investment timing of ESSs and research on ESS market participation is being conducted [17].
In the past, research has been conducted to model the optimal investment timing of ESSs along with economic evaluations [18,19,20]. Future uncertain demand has been modeled using GBM, and studies have been conducted on the arbitrage of Vanadium Redox Batteries [21]. Nguyen analyzed energy arbitrage considering the congestion of transmission and distribution systems, and Sang examined the prediction of electricity prices to maximize ESS arbitrage [22,23]. A Monte Carlo simulation was used to mitigate uncertainty in revenue [24]. Various studies explored ESSs using machine learning techniques such as genetic algorithms and Long Short-Term Memory (LSTM) [25,26]. An ESS investment analysis was also conducted by studying Locational Marginal Price variations in the MISO energy market and Korea’s electricity market [27,28].
The revenue of the ESS varies depending on the charging and discharging scheduling models and the investment cost. Yoon utilized a Genetic Algorithm, and M. M. Alam planned the charging and discharging schedules of an ESS through LSTM [29,30]. Research was also conducted using Dynamic Programming, a Mixed-Logit model, and Mixed-Integer Linear Programming [31,32,33,34,35]. Mauricio B. C. Salles studied the potential arbitrage of ESSs by choosing parameter values anticipated for future mature flow battery technology but did not consider actual installed costs [36]. Optimal scheduling algorithms for non-central dispatch ESSs were studied in the South Korean power market; however, the discussion did not cover the determination of the investment timing of ESS facility expansion [37].
This paper emphasizes the need to consider actual investment costs when evaluating the revenue of ESSs and addresses the following implications:
- Development of a scheduling algorithm for the economic operation of a central dispatch ESS (10 MW/40 MWh) in the Korean electricity market.
- Using the GBM model for ESS arbitrage revenue to consider future revenue uncertainty.
- Analysis of ESS revenue and investment costs using LSMC simulations to determine optimal investment timing.
The proposed method for determining the optimal ESS investment timing provides incentives to ESS investors. This research analyzes lithium-ion battery ESSs to consider the development costs and revenue through SMP and CP in the Korean electricity market. ESS charging and discharging scheduling that maximizes the arbitrage revenue is derived through linear programming optimization. ESS arbitrage revenue over 22 years is analyzed to create a probabilistic model of uncertain ESS revenue. To determine the optimal investment timing in an ESS, using LSMC simulations that activate options when arbitrage returns can recover actual investment costs. The proposed method contributes to securing the ESSs required to respond to volatile resources.
The remainder of this paper is organized as follows: Section 2 presents the problems that must be addressed. Section 3 introduces a method for determining the optimal investment timing for the ESSs. Section 4 describes the results of the proposed method, based on a case study. Finally, Section 5 concludes this paper with suggestions for future research.
2. Problem Formulation
ESSs have emerged as a promising solution to mitigate the variability of renewable generation and improve grid performance. However, its installation is constrained. One of the primary problems with installation is the discrepancy between the high investment costs of ESS installation and the relatively low revenue. Table 2 lists the annual capacity of ESSs installed in Korea [10].
Table 2.
Annual ESS installation capacity in Korea.
This paper aims to solve the problems of ESS installation by proposing a method to determine the optimal timing for ESS investments. To provide insight into the investment timing for ESS infrastructure by considering both profitability and investment costs.
2.1. Optimal Investment Considering ESS’s Revenue and Investment Cost
The optimal investment of the ESS requires the revenue to exceed the installed costs and expenditures. The formula used is as follows:
where is the revenue from the ESS discharge. is the cost of charging ESS. and are the costs of installing the ESS and operational maintenance costs, respectively. The installation cost of ESSs decreases with technology development, and the gap between the maximum and minimum SMP also increases. The ESS earns revenue through SMP’s arbitrage trading of the SMP, and the maximum and minimum SMP determines the revenue.
2.2. GBM Model of Revenue Reflecting Uncertainty
The GBM models the probabilistic components by reflecting the uncertainty of the ESS revenue. The GBM stochastic process model is expressed as follows:
where is the revenue, is the expected rate of return on revenue, is the period, is the volatility of revenue, and reflects the uncertainty of revenue changes.
The method for generating revenue process in a risk-neutral world is as follows:
where the is the risk-free interest rate, is the year-to-year volatility of revenue, m is the number of revenue rate observations, represents the log returns from day − 1 to day , and is the mean of .
The method for generating the process of revenue is as follows:
where represents a random number, and the stochastic process of , the natural logarithm of revenue, is converted into a discrete-time model.
2.3. LSMC Simulation to Determine the Investment Timing
The optimal investment timing of the ESS is determined using an LSMC simulation. Using the LSMC, the number of simulations required for computation can be reduced compared to traditional probabilistic simulation methods. Additionally, it allows for the analysis of interactions with ESS investment costs. The activation value function for the LSMC option is expressed in Equation (10).
where is ESS’s arbitrage revenue, and is ESS investment cost.
The profit path is generated using the GBM, and the activation value at option maturity is calculated. Subsequently, the holding value for the in-the-money path just before maturity is calculated, and the equation is as follows:
where is the activated value at maturity and is the activated value just before maturity. To determine the exact decision for LSMC, a regression analysis between revenue and holding value just before maturity is performed using Laguerre Polynomials. The equation for the regression model using the least squares method is as follows:
To estimate the regression model, the coefficients are obtained by minimizing the following equation for revenue and holding value:
where is the holding value and , , , and are the correlation coefficients. The regression coefficient is obtained using the estimated regression equation, and the holding value immediately before maturity is recalculated to determine the activate decision. This process is reversed until the initial year is reached to determine the optimal investment timing.
The next section describes in detail the method used to determine the optimal investment timing when the ESS arbitrage revenue exceeds installation costs and expenditures. This method derives effective strategies for ESS investments and increases renewable energy utilization.
3. LSMC-Based Method for ESS Investment Decision
The ESS scheduling results are used to set the discharge and charge amounts, and the revenue from discharge and expenses for charging are calculated using the SMP and CP data in the Korean electricity market [38,39]. Subsequently, the stochastic component reflecting the uncertainty of the ESS revenue variation is modeled using the GBM, and the optimal investment timing of the ESS is determined through an LSMC simulation.
3.1. ESS Scheduling for Arbitrage Revenue Calculation
ESS scheduling significantly affects ESS revenue. The ESS revenue is calculated as the SMP arbitrage and CP. SMP is the market price applied to power transactions in the Korean electricity market, which varies by power trading time and represents the market clearing price for the electricity system. CP is the capacity payment paid to the central dispatch ESS.
To maximize the ESS arbitrage is the objective of scheduling. The equation is as follows:
ESS daily and annual revenue from arbitrage are as follows:
where is the daily revenue on day , and is the annual revenue. is the SMP [$/kWh] during discharge at time , is the CP [$/kWh] during discharging at time , is the discharge amount [MW] of the ESS at time , Round Trip Efficiency (RTE) is the ratio of the electricity generated to the electricity input, is the SMP [$/kWh] during charging at time , is the charge amount [MW] at time t.
The constraint equations for scheduling are as follows:
where and are the initial- and final-state constraints of the ESS, respectively. State of Charge is expressed by dividing the current available battery capacity by the total capacity. This is expressed in Equation (20). is the maximum Power Conditioning System (PCS) capacity [MW], is the maximum ESS capacity [MW], and Depth of Discharge (DoD) is the ratio of the discharge capacity to the total capacity of the ESS batteries.
The ESS output for 4 h limitations are expressed by Equations (21) and (22). The cycle constraints, which are the 1 Day/1 Cycle constraints considering the battery’s life, are expressed by Equations (23) and (24).
The constraint that discharges accord to the amount of charge is expressed by Equation (25).
3.2. ESS Installed Costs
The ESS installation cost includes a storage system and batteries. The storage system is a DC storage block [$/kWh], DC storage BOS [$/kWh], and the batteries include the power equipment [$/kW] and system integration [$/kWh]. Other ESS installation costs include the EPC, project development, and grid integration. Fixed O&M and warranty are also considered.
The installed cost is the total cost over 20 years; therefore, the Capital Recovery Factor () is used. The is a ratio used to calculate the annual amount that can evenly recover investment over future years and is multiplied by the investment amount. The equation is as follows:
where is the initial investment, is the annual equal recovery amount, and is the discount rate.
3.3. Overview Diagram of the Proposed Method
Figure 1 presents an overview of the proposed optimal ESS investment timing method.
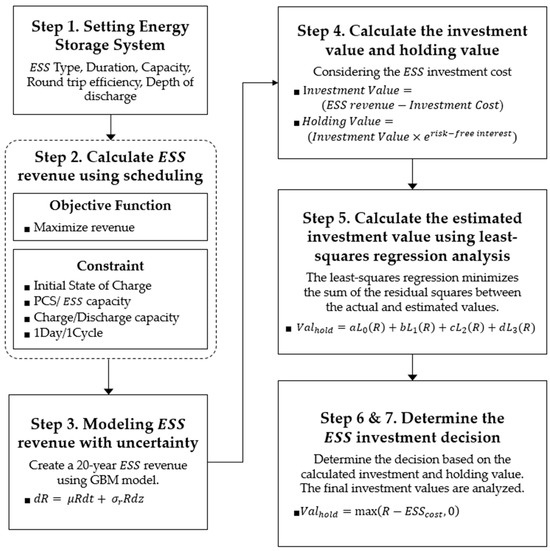
Figure 1.
Schematic diagram of the proposed optimal ESS investment timing method.
The detailed steps of the paper are as follows:
- Step 1:
- This paper starts with the ESS setting. Information regarding ESS type, capacity, discharge duration, DoD, and RTE is collected and an ESS is set to conduct research using the collected information.
- Step 2:
- Perform ESS scheduling to calculate annual revenue. An objective function that maximizes the revenue from arbitrage trading is used. The constraints on the economic operation of the ESS are used. Scheduling uses the SMP and CP data.
- Step 3:
- GBM modeling is performed to stochasticize the uncertain ESS revenue. A 20-year ESS revenue process in a risk-neutral world is created. An analysis of 22 years of revenue is conducted to determine the annual volatility of the ESS revenue.
- Step 4:
- The investment value for the 20-year revenue scenario is calculated by considering the ESS investment cost. Subsequently, the estimated T−1 holding value is calculated by applying a risk-free interest rate in year T.
- Step 5:
- The investment value in T−1 is calculated using least squares regression analysis of the value in year T and the estimated holding value in year T−1. Least squares regression minimizes the sum of the residual squares between the actual and estimated values.
- Step 6:
- Determine investment decisions based on recalculated investment and holding values. If the investment value is greater than the holding value, ESS investment is carried out, and if the holding value is more significant, ESS investment is not made.
- Step 7:
- Repeating this process calculates the holding value for each revenue process. The final investment and holding values of the process are compared to determine the timing of the investment.
4. Case Study
4.1. ESS Parameter and CRF Setting
ESSs should consider the aging of facilities due to long-term use, and in Korea, an End-of-Life (EOL) system has been introduced to prepare for the safety of ESSs. EOL is the battery capacity up to the facility warranty period, considering ESS degradation. The initial design capacity of the ESS must satisfy the capacity demanded by the owner until the end of the warranty period, and additional design capacity to extend the warranty lifespan should not be added during operation [40,41]. In accordance with Korea’s EOL system and the characteristics of lithium-ion batteries, the DoD is set to 80% [42,43,44]. The RTE is the ratio of the electricity generated to the electricity input and is set at 85% based on the characteristics of lithium-ion batteries [45,46,47]. A lithium-ion battery ESS is used to consider the actual investment costs.
In Korea, a central dispatch ESS is defined as a device that operates based on dispatch orders of electricity exchange, with a maximum operating time of more than 2 h and a maximum discharge capacity exceeding 10 MW. In addition, the device only provides primary reserve services based on separate criteria [48]. In this paper, a long-term ESS of 4 h is analyzed. Therefore, the ESS capacity is set to 40 MWh. According to the Jeju long-term BESS contract market introduced in Korea, the PCS capacity is set at 10 MW. Table 3 represents the ESS parameters.
Table 3.
Parameters for the ESS used in the method for determining the optimal investment timing.
The installation cost for a 10 MW/40 MWh lithium-ion battery ESS that can be operated for 20 years is $4,056,920 [49]. Table 4 lists the ESS installation costs.
Table 4.
2021/2030 10 MW/40 MWh Lithium-ion Battery ESS Installed Costs.
The installed cost applied to the CRF, according to Equation (26) in Section 3.2, is $311,880.37. The learning rate is applied based on technological advancements. Using investment costs in 2030, the learning rate is set to 2.76%, and the investment costs after 2030 are the same as those in 2030 [49]. Figure 2 shows the installed cost with the CRF applied according to the learning rate.
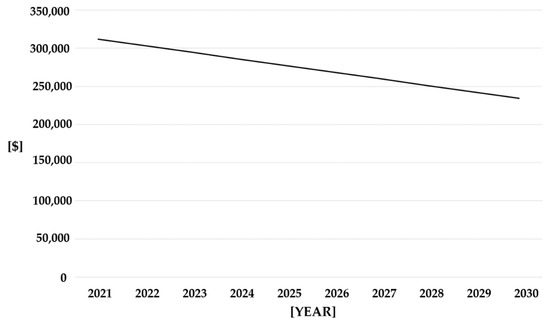
Figure 2.
ESS installed cost with CRF according to the learning rate.
4.2. Arbitrage Revenue for Lithium-Ion Battery ESS Using Scheduling
Linear programming solvers are used for ESS scheduling optimization to calculate the ESS revenue. The optimization uses the objective function and constraints described in Section 3.1.
Table 5 lists the charging and discharging amounts based on the 1 January 2022. Charging occurs during low-SMP hours at 12:00, 13:00, 14:00, and 15:00, and discharging occurs during high-SMP hours at 19:00, 20:00, 21:00, and 23:00.
Table 5.
ESS charging and discharging amounts on 1 January 2022.
Figure 3 shows the ESS charging and discharging amounts from 1 January 2022 to 7 January 2022. On 5th January, charging and discharging are not performed when profits are not generated from arbitrage, whereas on 1st January, charging and discharging are performed when profit is generated from arbitrage. The discharge capacity does not exceed 32 MW due to the DoD constraints. In addition, the number of charge and discharge cycles is limited to one due to the 1 Day/1 Cycle constraints.
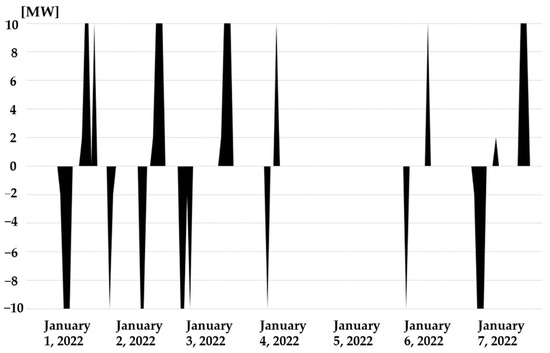
Figure 3.
The ESS charging and discharging amount results from 1 January 2022 to 7 January 2022.
Using Equations (18) and (19) in Section 3.1, the revenue over 22 years is calculated to determine the revenue volatility required for the GBM model computation. Table 6 presents the annual revenue for ESS arbitrage from 2002 to 2023. The highest revenue is $403,451.64 in 2010, and the lowest revenue is $54,903.17 in 2016.
Table 6.
Annual revenue from ESS arbitrage from 2002 to 2023.
4.3. GBM Model Reflecting ESS Revenue Uncertainty
To generate the ESS revenue process, the initial revenue is set at $349,631.05 in 2023. Setting the variables in Equations (3)–(6) in Section 2.2 generates revenue in a risk-neutral world. The risk-free interest rate is 3.627%, which is the 180-day average for the Korea Overnight Financing Repo Rate [50]. The annual revenue volatility for ESS arbitrage is 43.368%, as calculated from the annual returns in Table 6. Table 7 shows the logarithmic returns of the ESS over 21 years.
Table 7.
ESS log returns from 2003 to 2023.
To convert the stochastic process of the natural logarithm of the ESS revenue into a discrete-time model, logarithmic returns are calculated according to Equations (7)–(9) in Section 2.2. Using the GBM model in MATLAB, 1,000,000 revenue scenarios are generated. Random numbers from a normal distribution are generated using the random function. Figure 4 illustrates the ESS revenue process over 20 years using the GBM. All Revenue Paths refer to the individual revenue scenarios; Revenue Mean denotes the mean of the generated revenue.
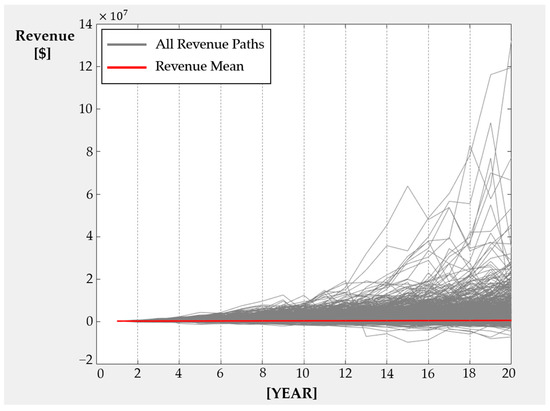
Figure 4.
ESS revenue process over 20 years using GBM.
4.4. Determining of Optimal ESS InvestmentTiming
The option activation rate of LSMC determines the optimal investment timing of the ESS. The LSMC method approximates the optimal investment policy at each exercise opportunity using least squares regression and determines whether to exercise early based on approximation. It estimates the expected payoff for ESS investors using the least squares method. Simulation is used as a valuation and risk management of ESSs [51].
The investment value is calculated by Equation (10) in Section 2.3. in Equation (10) represents the 20-year ESS revenue generated through the GBM in Section 4.3, and the are shown in Figure 2 in Section 4.1. The estimated T−1 holding value is calculated by Equation (11). Subsequently, the investment value in T−1 calculated using least squares regression analysis of the value in year T and the estimated holding value in year T−1. Least squares regression minimizes the sum of the residual squares between the actual and estimated values. The regression analysis formula utilizes Equations (12)–(16). Figure 5 presents the results of the LSMC simulations.
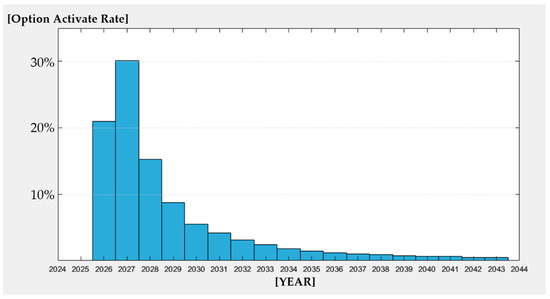
Figure 5.
Results of the optimal ESS investment timing determination method.
The horizontal axis represents years, and the vertical axis represents the option activate rate. Among the 1 million simulations, the highest option activate rate is 30.1% in 2027, and the frequency of option occurrence decreases as the years go on. From 2024 to 2025, the LSMC option is not activated. The earned profit does not exceed the installed cost. Table 8 presents the active options ratios by year.
Table 8.
Option activation rate of the proposed LSMC model.
5. Conclusions
This paper is used for ESS investors as a decision-making tool to determine investment timing. Previous study has shown some limitations in using option theory to find the timing of ESS investments. It has simply found that investment is delayed as the operating period increases due to higher volatility in revenue. Furthermore, it has shown that investment is delayed as the cost of ESS investment increases, without considering the learning rate and actual investment cost [18]. Therefore, the optimal investment timing is determined through a least squares simulation model considering these factors; economical and reliable ESS scheduling is used for revenue calculation, and the optimal investment timing is determined using the regression model that considers actual investment costs and the learning rate. This paper analyzes the optimal investment of a 10 MW/40 MWh lithium-ion BESS and addresses the following conclusions:
- Analyze revenue through economic ESS operational constraints in the Korean electricity market, and consider future revenue uncertainty using GBM.
- Determine the optimal investment timing of ESSs using LSMC simulation considering the actual investment cost.
ESSs are important for managing volatile energy resources. Delays in ESS installation can lead to problems in power systems because of volatile resources. The proposed model provides advantages for expanding ESS facilities. The installation of ESSs through the government’s long-term contract market is also important. However, ESS investors should be able to invest in the facilities themselves. The ESS can be installed on time using LSMC models, enabling a stable power system operation.
This paper focuses only on a lithium-ion BESS for 4 h. The role of the ESS varies depending on the period, and simulations for various timeframes should be considered. A short-term ESS charges and supplies power within a brief period or shifts surplus power to other times. A long-term ESS resolves the limitations of renewable energy output. A seasonal ESS allows for energy storage and supply on a seasonal basis, contributing to power planning. To solve the problems of power systems, appropriate installation of short-term, long-term, and seasonal ESSs is required. Further research is required to apply and simulate the proposed method using various ESS durations.
The government is endeavoring to install ESS facilities in a timely manner. However, in the Korean power market, installing investment-centric ESSs is problematic. The proposed method for determining optimal investment timing using arbitrage provides investment decisions to ESS investors. Even in a cost-oriented fuel market, an ESS stabilizes the power system. Future research should investigate the optimal investment timing of power-to-X such as power-to-gas, and power-to-heat using an ESS.
Author Contributions
K.S. performed the research and wrote the paper; J.L. provided guidance for the research and revised the paper. All authors have read and agreed to the published version of the manuscript.
Funding
This research received no external funding.
Data Availability Statement
The original contributions presented in the study are included in the article, further inquiries can be directed to the corresponding author.
Acknowledgments
This research was supported by Korea Electrotechnology Research Institute (KERI) primary research program through the National Research Council of Science and Technology (NST) funded by the Ministry of Science and ICT (MSIT) (No. 24A01044).
Conflicts of Interest
The authors declare no conflicts of interest.
References
- UN/UNFCCC. Paris Agreement. 2015. Available online: https://unfccc.int/sites/default/files/english_paris_agreement.pdf (accessed on 12 April 2024).
- IPCC. Global Warming of 1.5 °C; IPCC: Geneva, Switzerland, 2018; Available online: https://www.ipcc.ch/sr15/download/ (accessed on 12 April 2024).
- Ministry of Environment. 2030 National Greenhouse Gas Reduction Goals; Ministry of Environment: Sejong, Republic of Korea, 2021. [Google Scholar]
- Ministry of Trade, Industry and Energy. The 10th Basic Plan for Electricity Supply and Demand; Ministry of Trade, Industry and Energy: Sejong, Republic of Korea, 2023. [Google Scholar]
- Korea Institute of Energy Research. The Potential of Renewable Energy in Korea. 2024. Available online: https://kier-solar.org/user/map/map_patential.do (accessed on 14 April 2024).
- Kim, S.; Joo, S.-K. Transmission Pricing Incorporating the Impact of System Fault and Renewable Energy Uncertainty on the Transmission Margin. IEEE Access 2023, 11, 103779–103789. [Google Scholar] [CrossRef]
- Korea Energy Economics Institute. Flexibility of Power Systems for the Supply of New and Renewable Energy; Korea Energy Economics Institute: Ulsan, Republic of Korea, 2017. [Google Scholar]
- International Renewable Energy Agency (IRENA). Global Renewables Outlook: Energy Transformation 2050; International Renewable Energy Agency: Masdar City/Abu Dhabi, United Arab Emirates, 2020. [Google Scholar]
- United States Department of Energy. Energy Storage Grand Challenge Roadmap. 2020. Available online: https://www.energy.gov/sites/default/files/2020/12/f81/Energy%20Storage%20Grand%20Challenge%20Roadmap.pdf (accessed on 12 April 2024).
- Korea Electrical Safery Corpotation. Statistics of Electrical Storage by Power Generation Resource. 2023. Available online: https://www.data.go.kr/data/15086616/fileData.do (accessed on 12 April 2024).
- Ministry of Trade, Industry and Energy. Energy Storage Industry Development Strategy; Ministry of Trade, Industry and Energy: Sejong, Republic of Korea, 2023. [Google Scholar]
- Filho, R.D.; Monteiro, A.C.M.; Costa, T.; Vasconcelos, A.; Rode, A.C.; Marinho, M. Strategic Guidelines for Battery Energy Storage System Deployment: Regulatory Framework, Incentives, and Market Planning. Energies 2023, 16, 7272. [Google Scholar] [CrossRef]
- Guerra, O.J. Beyond short-duration energy storage. Nat. Energy 2021, 6, 460–461. [Google Scholar] [CrossRef]
- National Grid Electricity System Operator. NOA Stability Pathfinder RFI Phase 1. 2019. Available online: https://www.nationalgrideso.com/industry-information/balancing-services/pathfinders/noa-stability-pathfinder#Phase-1-(concluded) (accessed on 12 April 2024).
- Pacific Gas and Electric Company. Mid-Term Realability RFO—Phase 2. 2022. Available online: https://www.pge.com/en/about/doing-business-with-pge/wholesale-electric-power-procurement/mid-term-reliability-rfo-phase-2.html (accessed on 12 April 2024).
- Korea Power Exchange (KPX), 2023 Jeju Long Term BESS Contract Competitive Bidding Announcement. 2023. Available online: https://www.kpx.or.kr/board.es?mid=a11201000000&bid=0042&act=view&list_no=70288 (accessed on 12 April 2024).
- Miletić, M.; Pandžić, H.; Yang, D. Operating and Investment Models for Energy Storage Systems. Energies 2020, 13, 4600. [Google Scholar] [CrossRef]
- Moon, Y. Optimal Time to Invest Energy Storage System under Uncertainty Conditions. Energies 2014, 7, 2701–2719. [Google Scholar] [CrossRef]
- Sioshansi, R.; Denholm, P.; Jenkin, T.; Weiss, J. Estimating the value of electricity storage in PJM: Arbitrage and some welfare effects. Energy Econ. 2009, 31, 269–277. [Google Scholar] [CrossRef]
- Salles, M.B.C.; Aziz, M.J.; Hogan, W.W. Potenrial Arbitrage Revenue of Energy Storage Systems in PJM during 2014. In Proceedings of the 2016 IEEE Power and Energy Society General Meeting (PESGM), Boston, MA, USA, 17–21 July 2016; pp. 1–5. [Google Scholar] [CrossRef]
- Coronel, T.; Buzarquis, E.; Blanco, G.A. Analyzing energy storage system for energy arbitrage. In Proceedings of the 2017 IEEE URUCON, Montevideo, Uruguay, 23–25 October 2017; pp. 1–4. [Google Scholar] [CrossRef]
- Nguyen, T.A.; Copp, D.A.; Byrne, R.H. Stacking Revenue from Energy Storage Providing Resilience, T&D Deferral and Arbitrage. In Proceedings of the 2019 IEEE Power & Energy Society General Meeting (PESGM), Atlanta, GA, USA, 4–8 August 2019; pp. 1–5. [Google Scholar] [CrossRef]
- Sang, L.; Xu, Y.; Long, H.; Hu, Q.; Sun, H. Electricity Price Prediction for Energy Storage System Arbitrage: A Decision-Focused Approach. IEEE Trans. Smart Grid 2022, 13, 2822–2832. [Google Scholar] [CrossRef]
- An, J.; Kim, D.-K.; Lee, J.; Joo, S.-K. Least Squares Monte Carlo Simulation-Based Decision-Making Method for Photovoltaic Investment in Korea. Sustainability 2021, 13, 10613. [Google Scholar] [CrossRef]
- Liu, H.; Wang, L.; Li, J.; Shao, L.; Zhang, D. Research on Smart Power Sales Strategy Considering Load Forecasting and Optimal Allocation of Energy Storage System in China. Energies 2023, 16, 3341. [Google Scholar] [CrossRef]
- Chen, H.; Bo, R.; ur Rehman, W. Developing Optimal Energy Arbitrage Strategy for Energy Storage System Using Reinforcement Learning. In Proceedings of the CIRED 2021—The 26th International Conference and Exhibition on Electricity Distribution, Online, 20–23 September 2021; pp. 2266–2270. [Google Scholar] [CrossRef]
- Zubair, M.; Taina, N.; Gadotti, M.; Salles, B.C. Potential Arbitrage Revenue of Energy Storage System for MISO Energy Markets. In Proceedings of the 2023 International Conference on Clean Electrical Power (ICCEP), Terrasini, Italy, 27–29 June 2023. [Google Scholar] [CrossRef]
- Lee, D.; Lee, D.; Jang, H.; Joo, S.-K. Backup Capacity Planning Considering Short-Term Variability of Renewable Energy Resources in a Power System. Electronics 2021, 10, 709. [Google Scholar] [CrossRef]
- Yoon, Y.; Kim, Y.-H. Charge Scheduling of an Energy Storage System under Time-of-Use Pricing and a Demand Charge. Sci. World J. 2014, 2014, 937329. [Google Scholar] [CrossRef]
- Alam, M.M.; Rahman, M.H.; Nurcahyanto, H.; Jang, Y.M. Energy Management by Scheduling ESS with Active Demand Response in Low Voltage Grid. In Proceedings of the 2020 International Conference on Information and Communication Technology Convergence (ICTC), Jeju, Republic of Korea, 21–23 October 2020; pp. 683–686. [Google Scholar] [CrossRef]
- Park, J.-B.; Park, Y.-G.; Roh, J.-H.; Chang, B.-H.; Yoon, Y.-B. An Economic Assessment of Large-scale Battery Energy Storage Systems in the Energy-Shift Application to Korea Power System. Trans. Korean Inst. Electr. Eng. 2015, 64, 384–392. [Google Scholar] [CrossRef]
- Jang, M.; Jeong, H.C.; Kim, T.; Chun, H.-M.; Joo, S.-K. Analysis of Residential Consumers’ Attitudes toward Electricity Tariff and Preferences for Time-of-Use Tariff in Korea. IEEE Access 2022, 10, 26965–26973. [Google Scholar] [CrossRef]
- Hwang, H.-K.; Yoon, A.-Y.; Lee, J.-O.; Chang, J.-W.; Moon, S.-I. Optimal ESS Scheduling for the TOU Tariff based DR and Cost-saving DR. In Proceedings of the 49th Korean Institute of Electrical Engineers Summer Conference, Gangwon, Republic of Korea, 11–13 July 2018; pp. 281–282. [Google Scholar]
- Jin, Y.; Park, M.; Won, D. ESS Optimal Scheduling considering Demand Response for commercial Buildings. In Proceedings of the 2019 7th International Youth Conference on Energy (IYCE), Bled, Slovenia, 3–6 July 2019; pp. 1–6. [Google Scholar] [CrossRef]
- Ko, R.; Kong, S.; Joo, S.-K. Mixed Integer Programming (MIP)-based Energy Storage System Scheduling Method for Reducing the Electricity Purchasing Cost in an Urban Railroad System. Trans. Korean Inst. Electr. Eng. 2015, 64, 1125–1129. [Google Scholar] [CrossRef][Green Version]
- Salles, M.B.C.; Huang, J.; Aziz, M.J.; Hogan, W.W. Potential Arbitrage Revenue of Energy Storage Systems in PJM. Energies 2017, 10, 1100. [Google Scholar] [CrossRef]
- Cha, H.-J.; Lee, S.-E.; Won, D. Implementation of Optimal Scheduling Algorithm for Multi-Functional Battery Energy Storage System. Energies 2019, 12, 1339. [Google Scholar] [CrossRef]
- Korea Power Exchange (KPX). System Marginal Price. Available online: https://www.kpx.or.kr/smpInland.es?mid=a10606080100&device=pc (accessed on 12 April 2024).
- Korea Power Exchange (KPX). Capacity Payment. Available online: https://www.kpx.or.kr/board.es?mid=a10109010500&bid=0080&act=view&list_no=69918 (accessed on 12 April 2024).
- Vitlinsky, I.D.; Cho, G.C.; Smotrov, N.N.; Bitkulov, K.R.; Umurzakov, D.D. Utilization of the Energy Storage System for the Energy Arbitrage and Peak Shaving. In Proceedings of the 2022 4th International Youth Conference on Radio Electronics, Electrical and Power Engineering (REEPE), Moscow, Russia, 17–19 March 2022; pp. 1–6. [Google Scholar] [CrossRef]
- Ministry of Trade, Industry and Energy. Korea Electro-Technical Code. Available online: https://www.law.go.kr/LSW//admRulLsInfoP.do?chrClsCd=&admRulSeq=2100000232752 (accessed on 12 April 2024).
- National Renewable Energy Laboratory (NREL). Life Prediction Model for Grid Connected Li-Ion Battery Energy Storage System; National Renewable Energy Laboratory: Washington, DC, USA, 2017. [Google Scholar]
- International Renewable Energy Agency (IRENA). Electricity Storage Valuation Framewokr: Assesing System Value and Ensuring Project Viability; International Renewable Energy Agency: Masdar City/Abu Dhabi, United Arab Emirates, 2020. [Google Scholar]
- Montes, T.; Etxandi-Santolaya, M.; Eichman, J.; Ferreira, V.J.; Trilla, L.; Corchero, C. Procedure for Assessing the Suitability of Battery Second Life Applications after EV First Life. Batteries 2022, 8, 122. [Google Scholar] [CrossRef]
- Pacific Northwest National Laboratory (PNNL). Washing Ton Clean Energy Fund Grid Modernization Projects: Economic Analysis Final Report; Pacific Northwest National Laboratory: Washington, DC, USA, 2020. [Google Scholar]
- Pacific Gas and Electric Company (PG&E). 2019 SGIP Energy Storage Market Assessment and Cost-Effectiveness Report; Pacific Gas and Electric Company: California, MA, USA, 2019. [Google Scholar]
- Strategen Consulting. Long Duration Energy Storage for California’s Clean, Reliable Grid; Strategen Consulting: California, MA, USA, 2020. [Google Scholar]
- Korea Power Exchange (KPX). Electricity Market Operating Rules. Available online: https://new.kpx.or.kr/board.es?mid=a10205010000&bid=0030&act=view&list_no=71450 (accessed on 12 April 2024).
- Pacific Northwest National Laboratory (PNNL). 2022 Grid Energy Storage Technology Cost and Performance Assessment; Pacific Northwest National Laboratory: Washington, DC, USA, 2022. [Google Scholar]
- Korea Securities Depository (KSD). Korea Overnight Financing Repo Rate (KOFR). Available online: https://www.kofr.kr/rate/rate.jsp (accessed on 12 April 2024).
- Longstaff, F.A.; Schwartz, E.S. Valuing American Options by Simulation: A Simple Least-Squares Approach. Rev. Financ. Stud. 2001, 14, 113–147. [Google Scholar] [CrossRef]
Disclaimer/Publisher’s Note: The statements, opinions and data contained in all publications are solely those of the individual author(s) and contributor(s) and not of MDPI and/or the editor(s). MDPI and/or the editor(s) disclaim responsibility for any injury to people or property resulting from any ideas, methods, instructions or products referred to in the content. |
© 2024 by the authors. Licensee MDPI, Basel, Switzerland. This article is an open access article distributed under the terms and conditions of the Creative Commons Attribution (CC BY) license (https://creativecommons.org/licenses/by/4.0/).