Potential Regenerative Impact of Implementation of Cultural Vernacular Elements (Rowshan) in Jeddah, Saudi Arabia


Abstract
1. Introduction
1.1. Household Electricity Consumption
1.2. Jeddah’s Climate
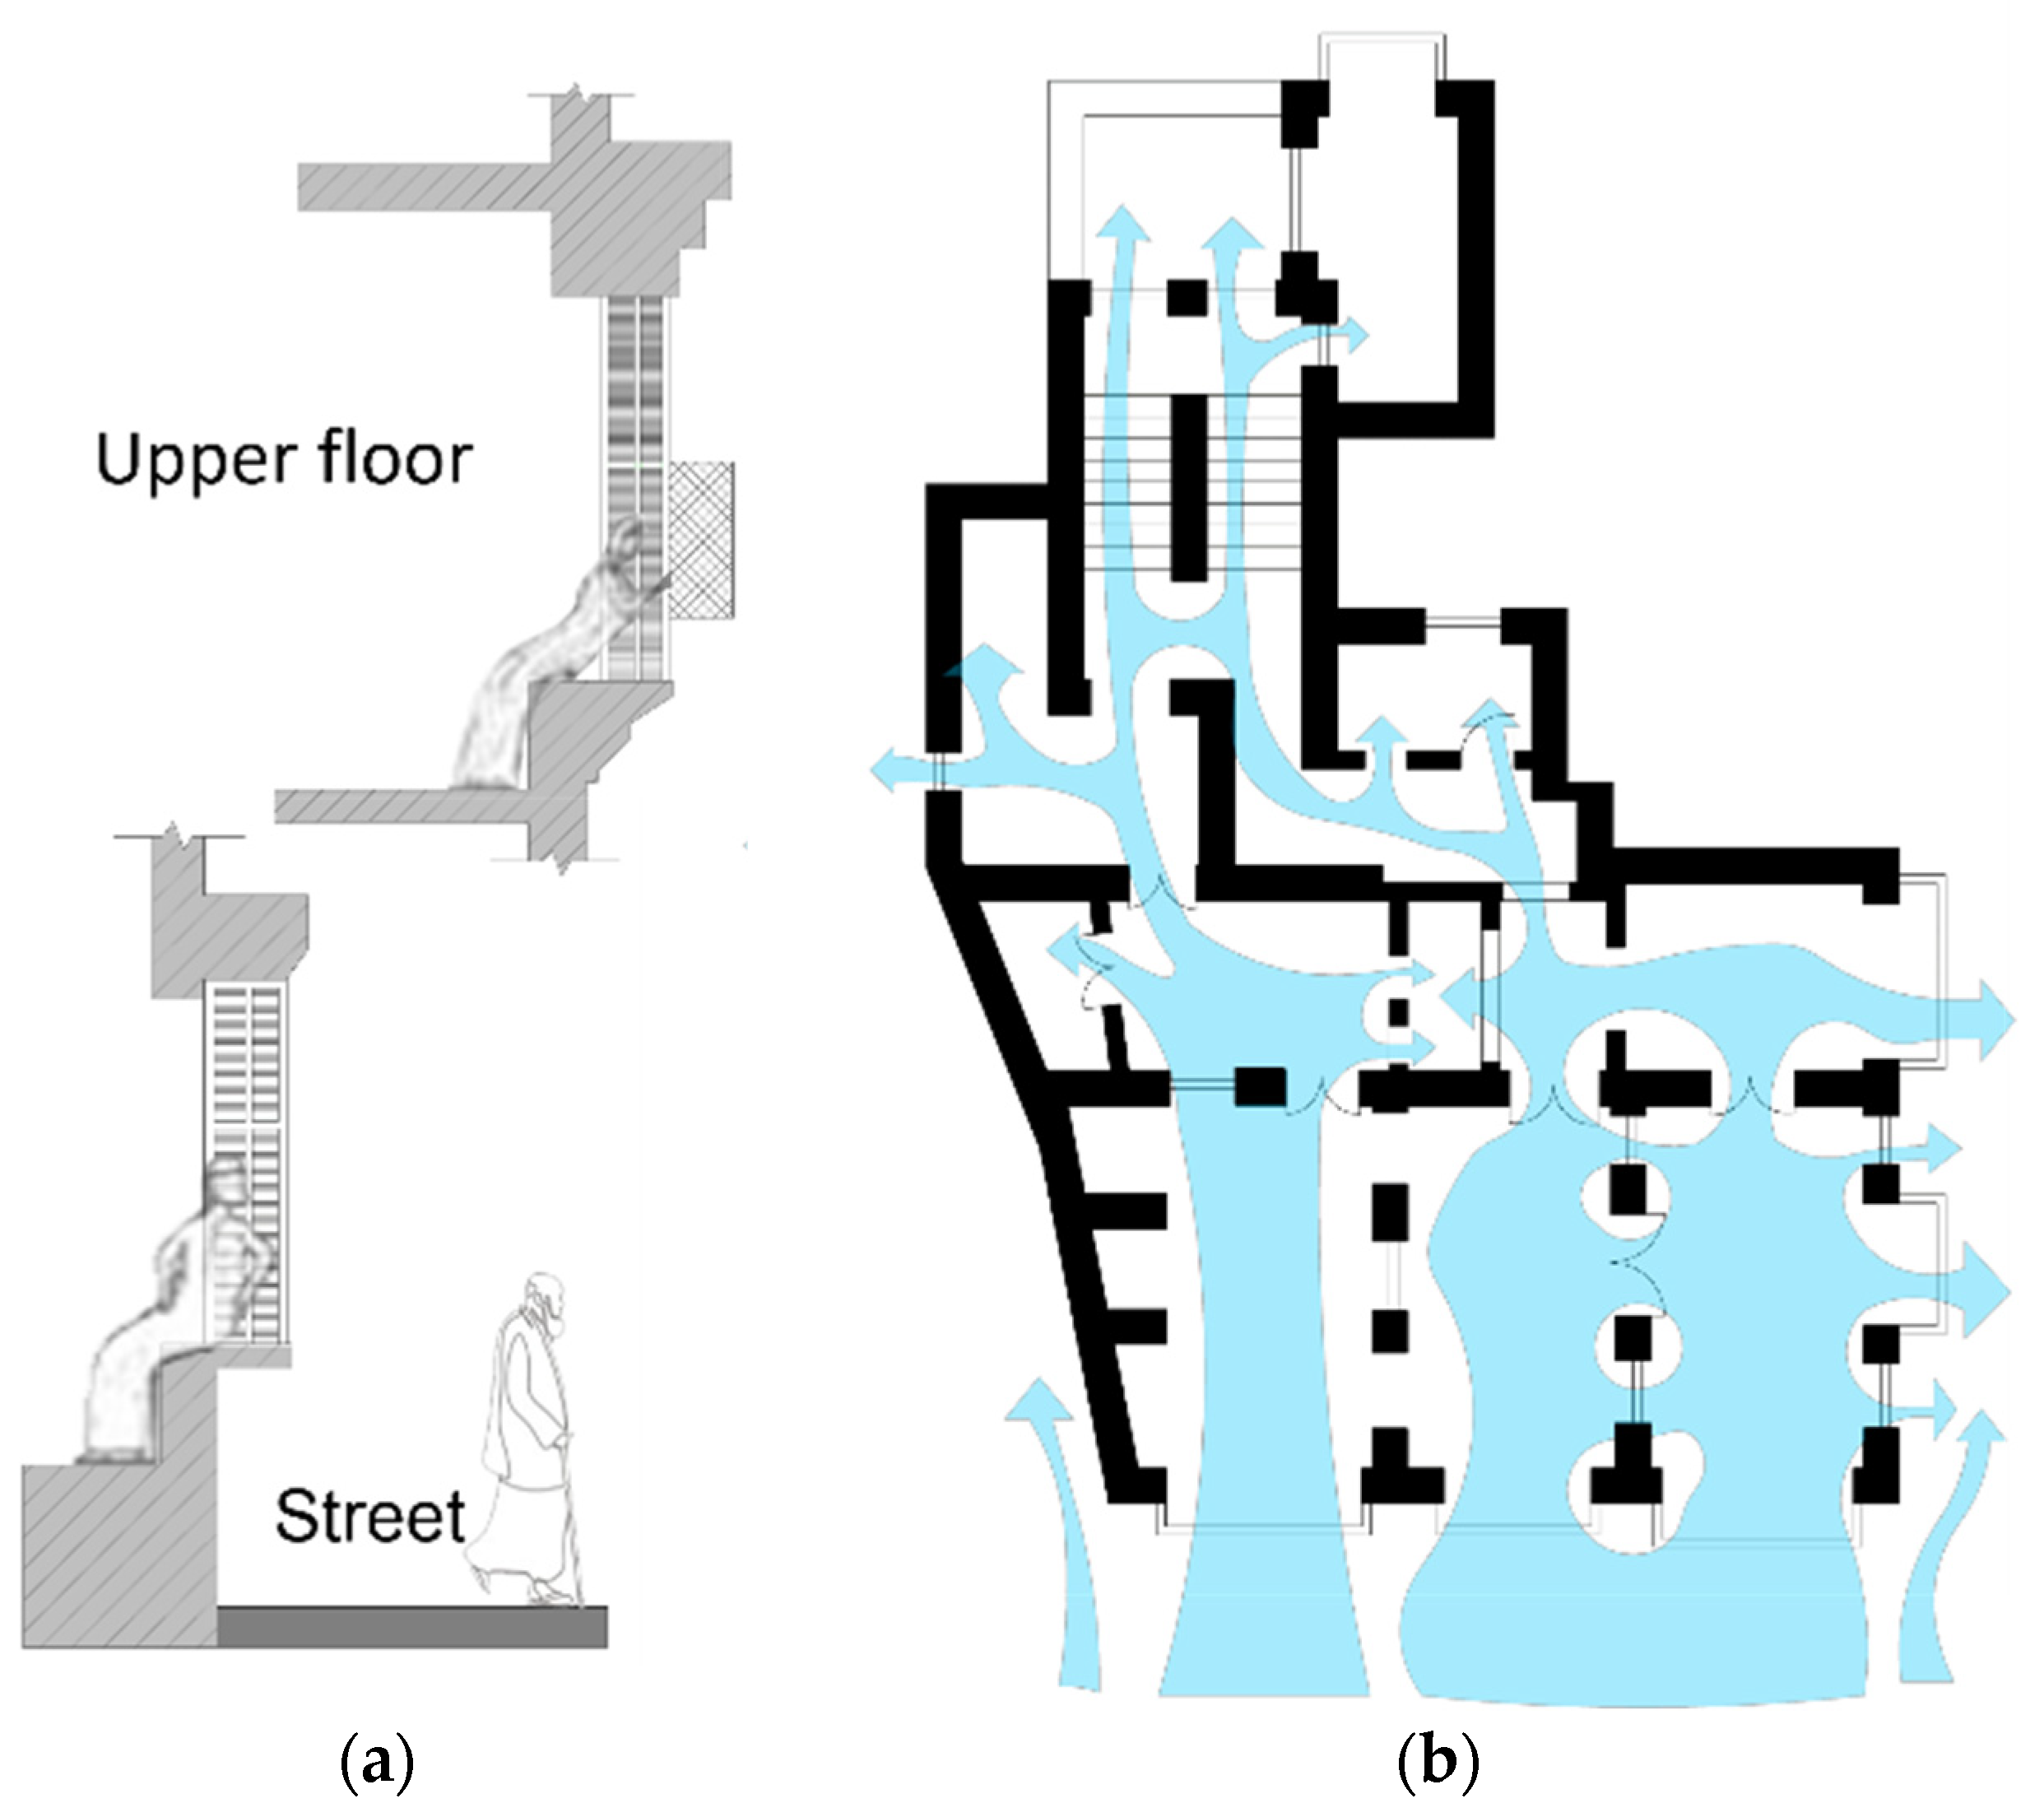
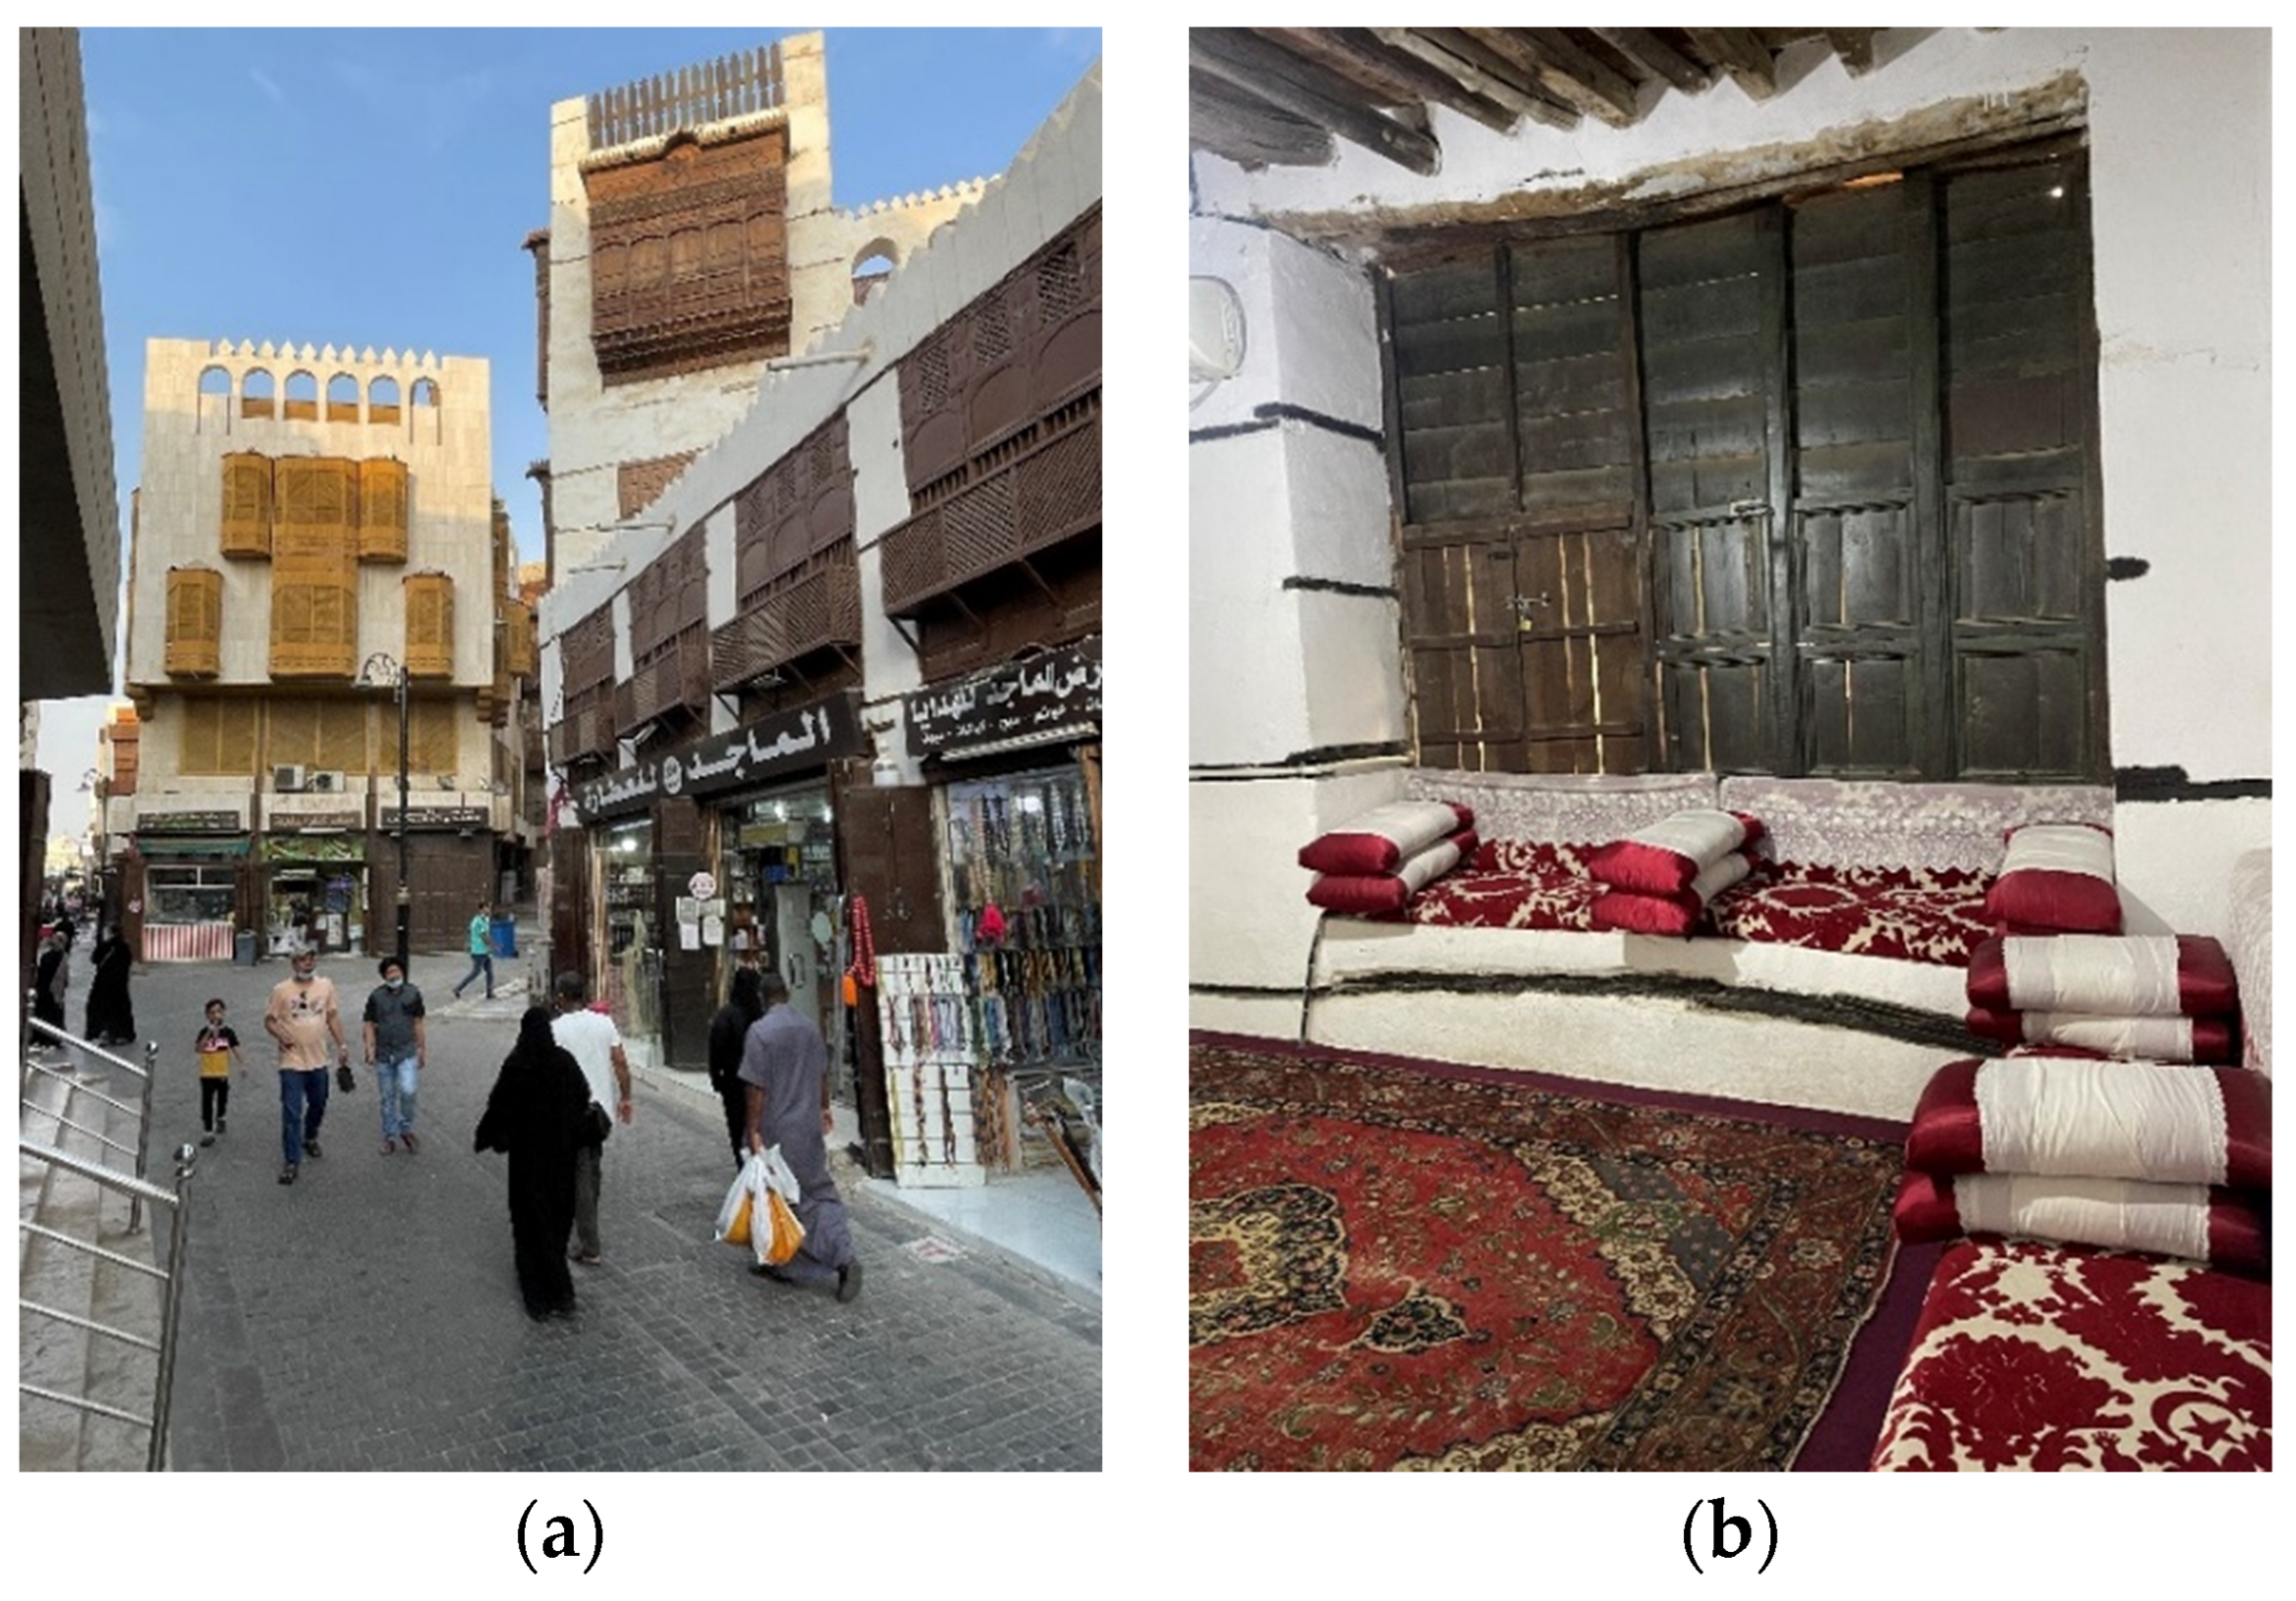
1.3. Architectural Identity of Jeddah as a Historic Town and Rowshan Design
1.4. Modern Rowshan Design and the Challenge of Creating Thermal Comfort through Natural Ventilation
1.5. CFD Analysis of Residential Airflow through Natural Ventilation
2. Materials and Methods
2.1. Data Processing Tools
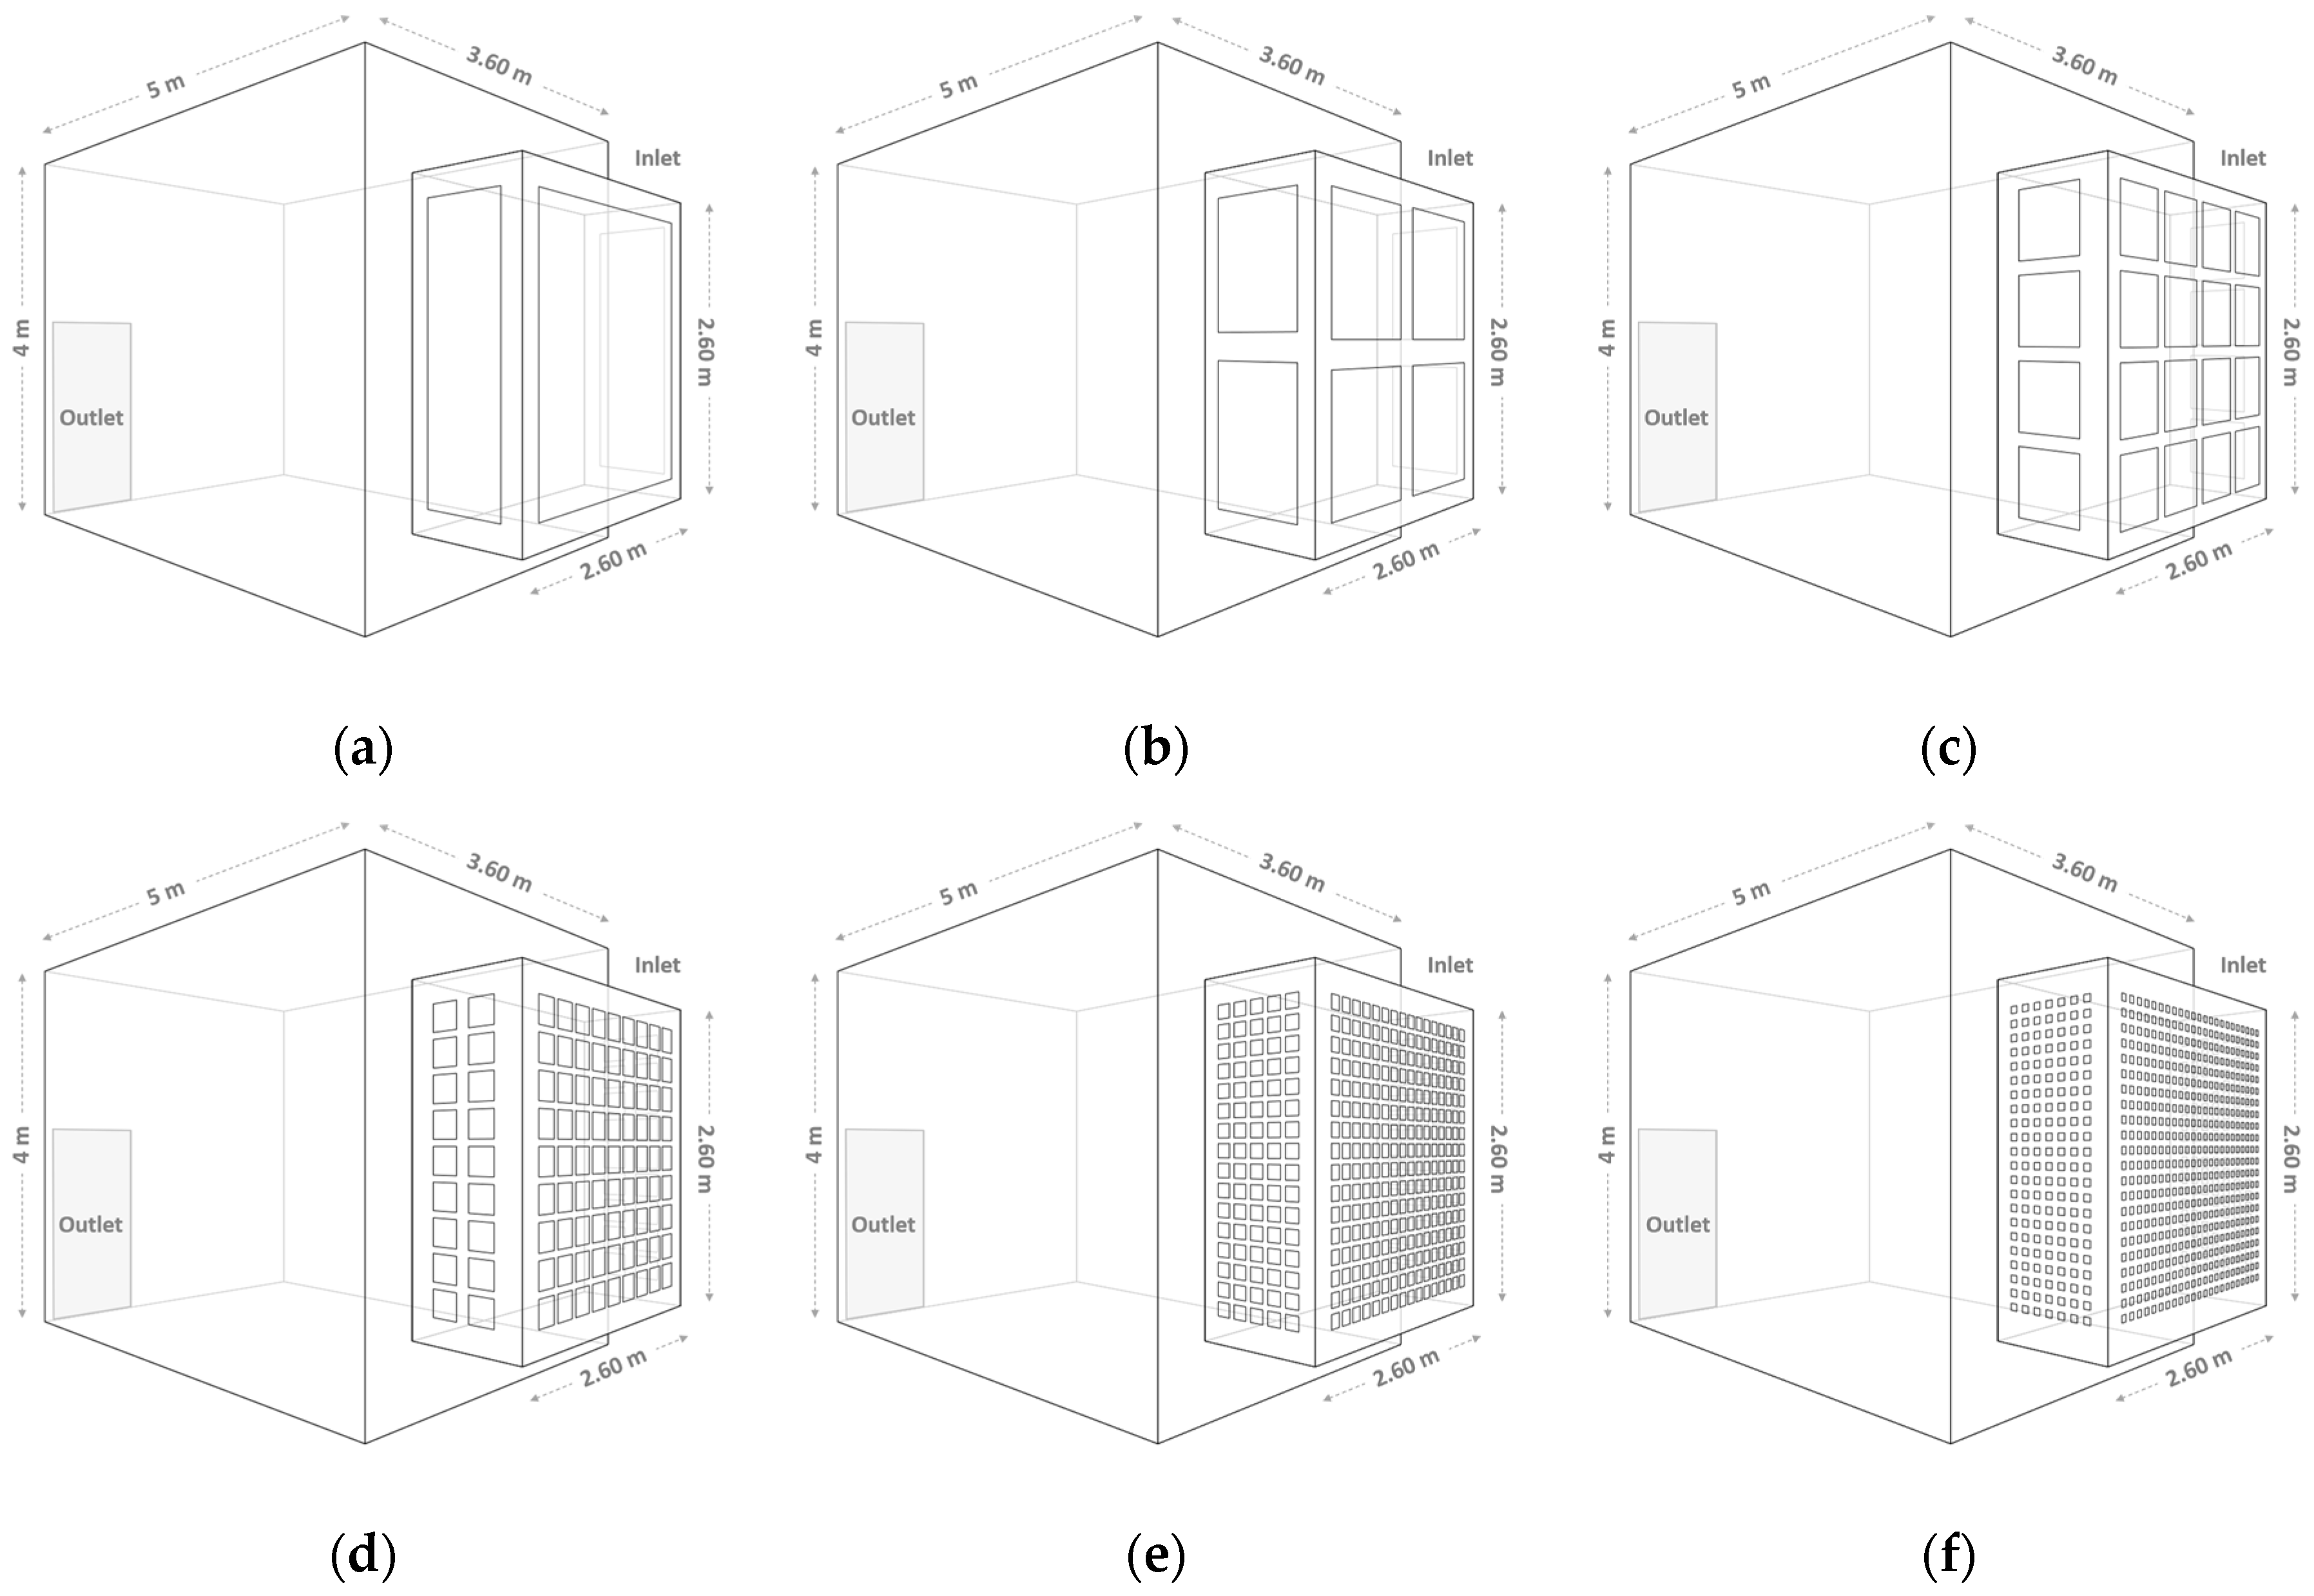
2.2. Investigation Models (Model/Geometry Description)
2.3. Measuring the Outdoor and Indoor Viability Hours for Natural Ventilation through the Air Temperature and Relative Humidity
2.4. Identifying Rooms’ Thermal Comfort Level
2.5. Predicted Mean Vote (PMV) Measurement Process
2.6. Computational Methods for Simulation Process
3. Results and Discussion
3.1. Natural Ventilation Viability for Indoor Conditions Improvement: Driven Airflow Effects
3.2. Addressing the Effect of Rowshans’ Size on Indoor Operative Temperature, Air Volumetric Flow Rate, and PMV
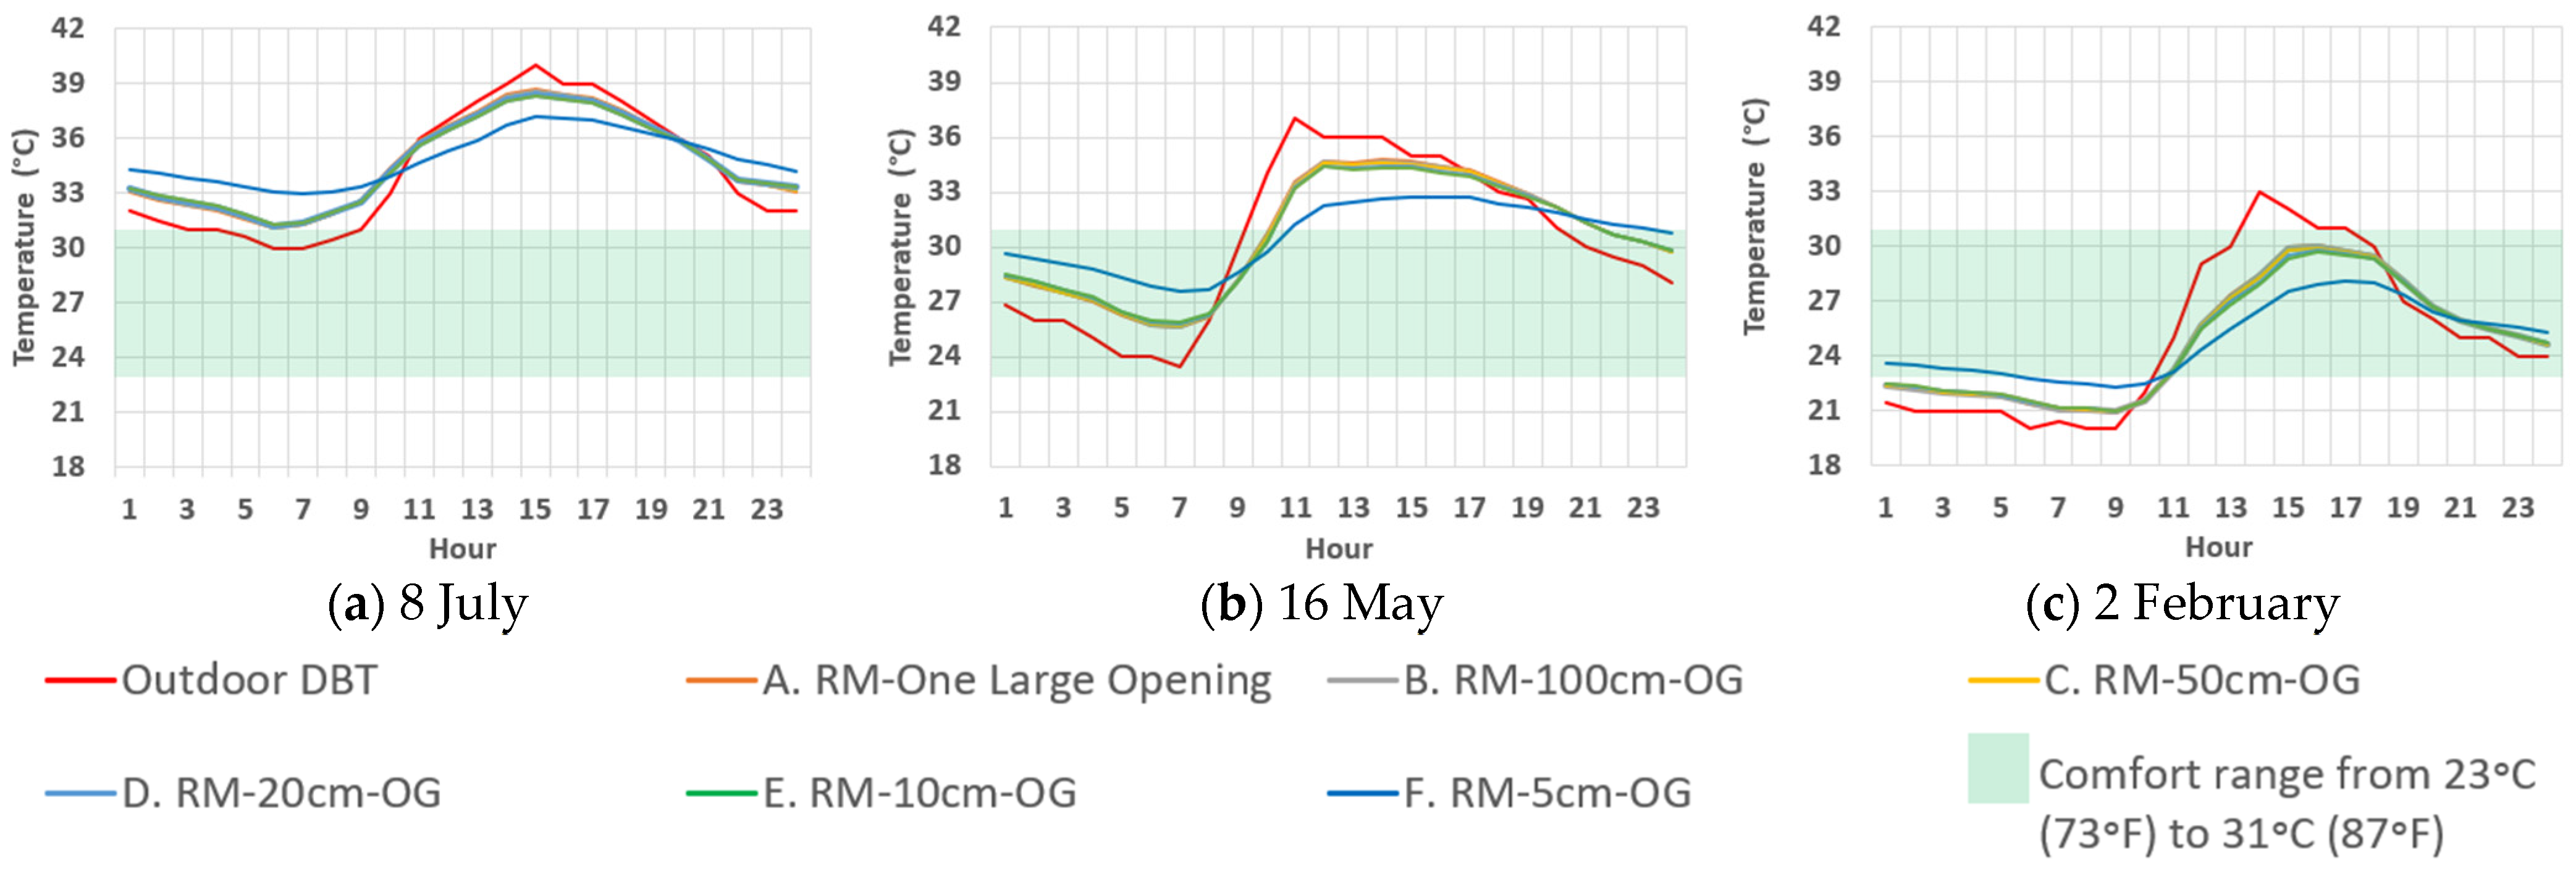
3.2.1. Analysis of Rooms’ Operative Temperature
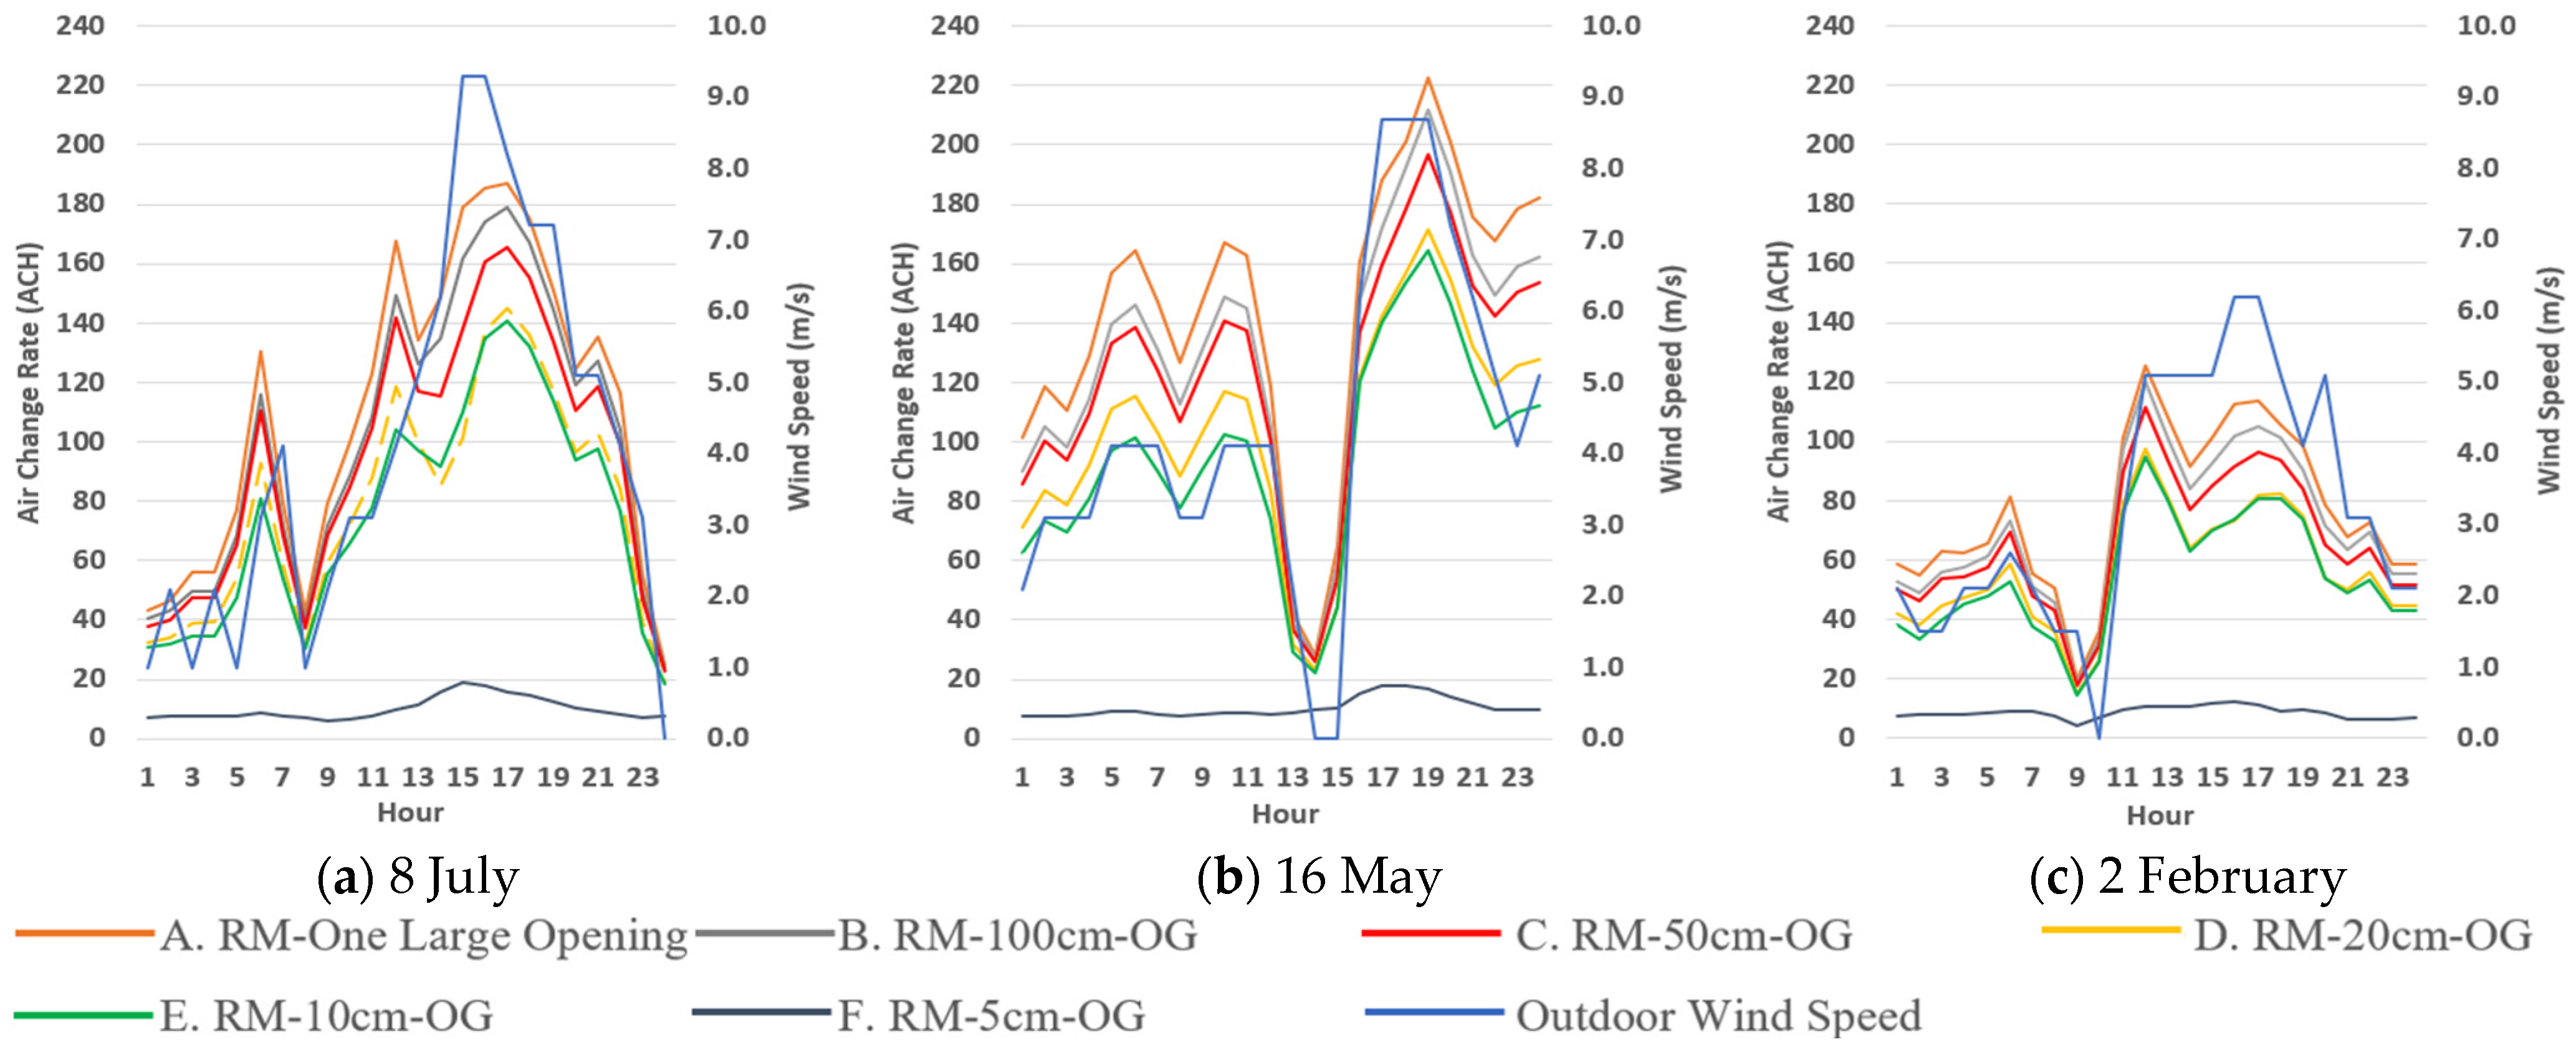
3.2.2. Analysis of Rooms’ Air Volumetric Flow Rate
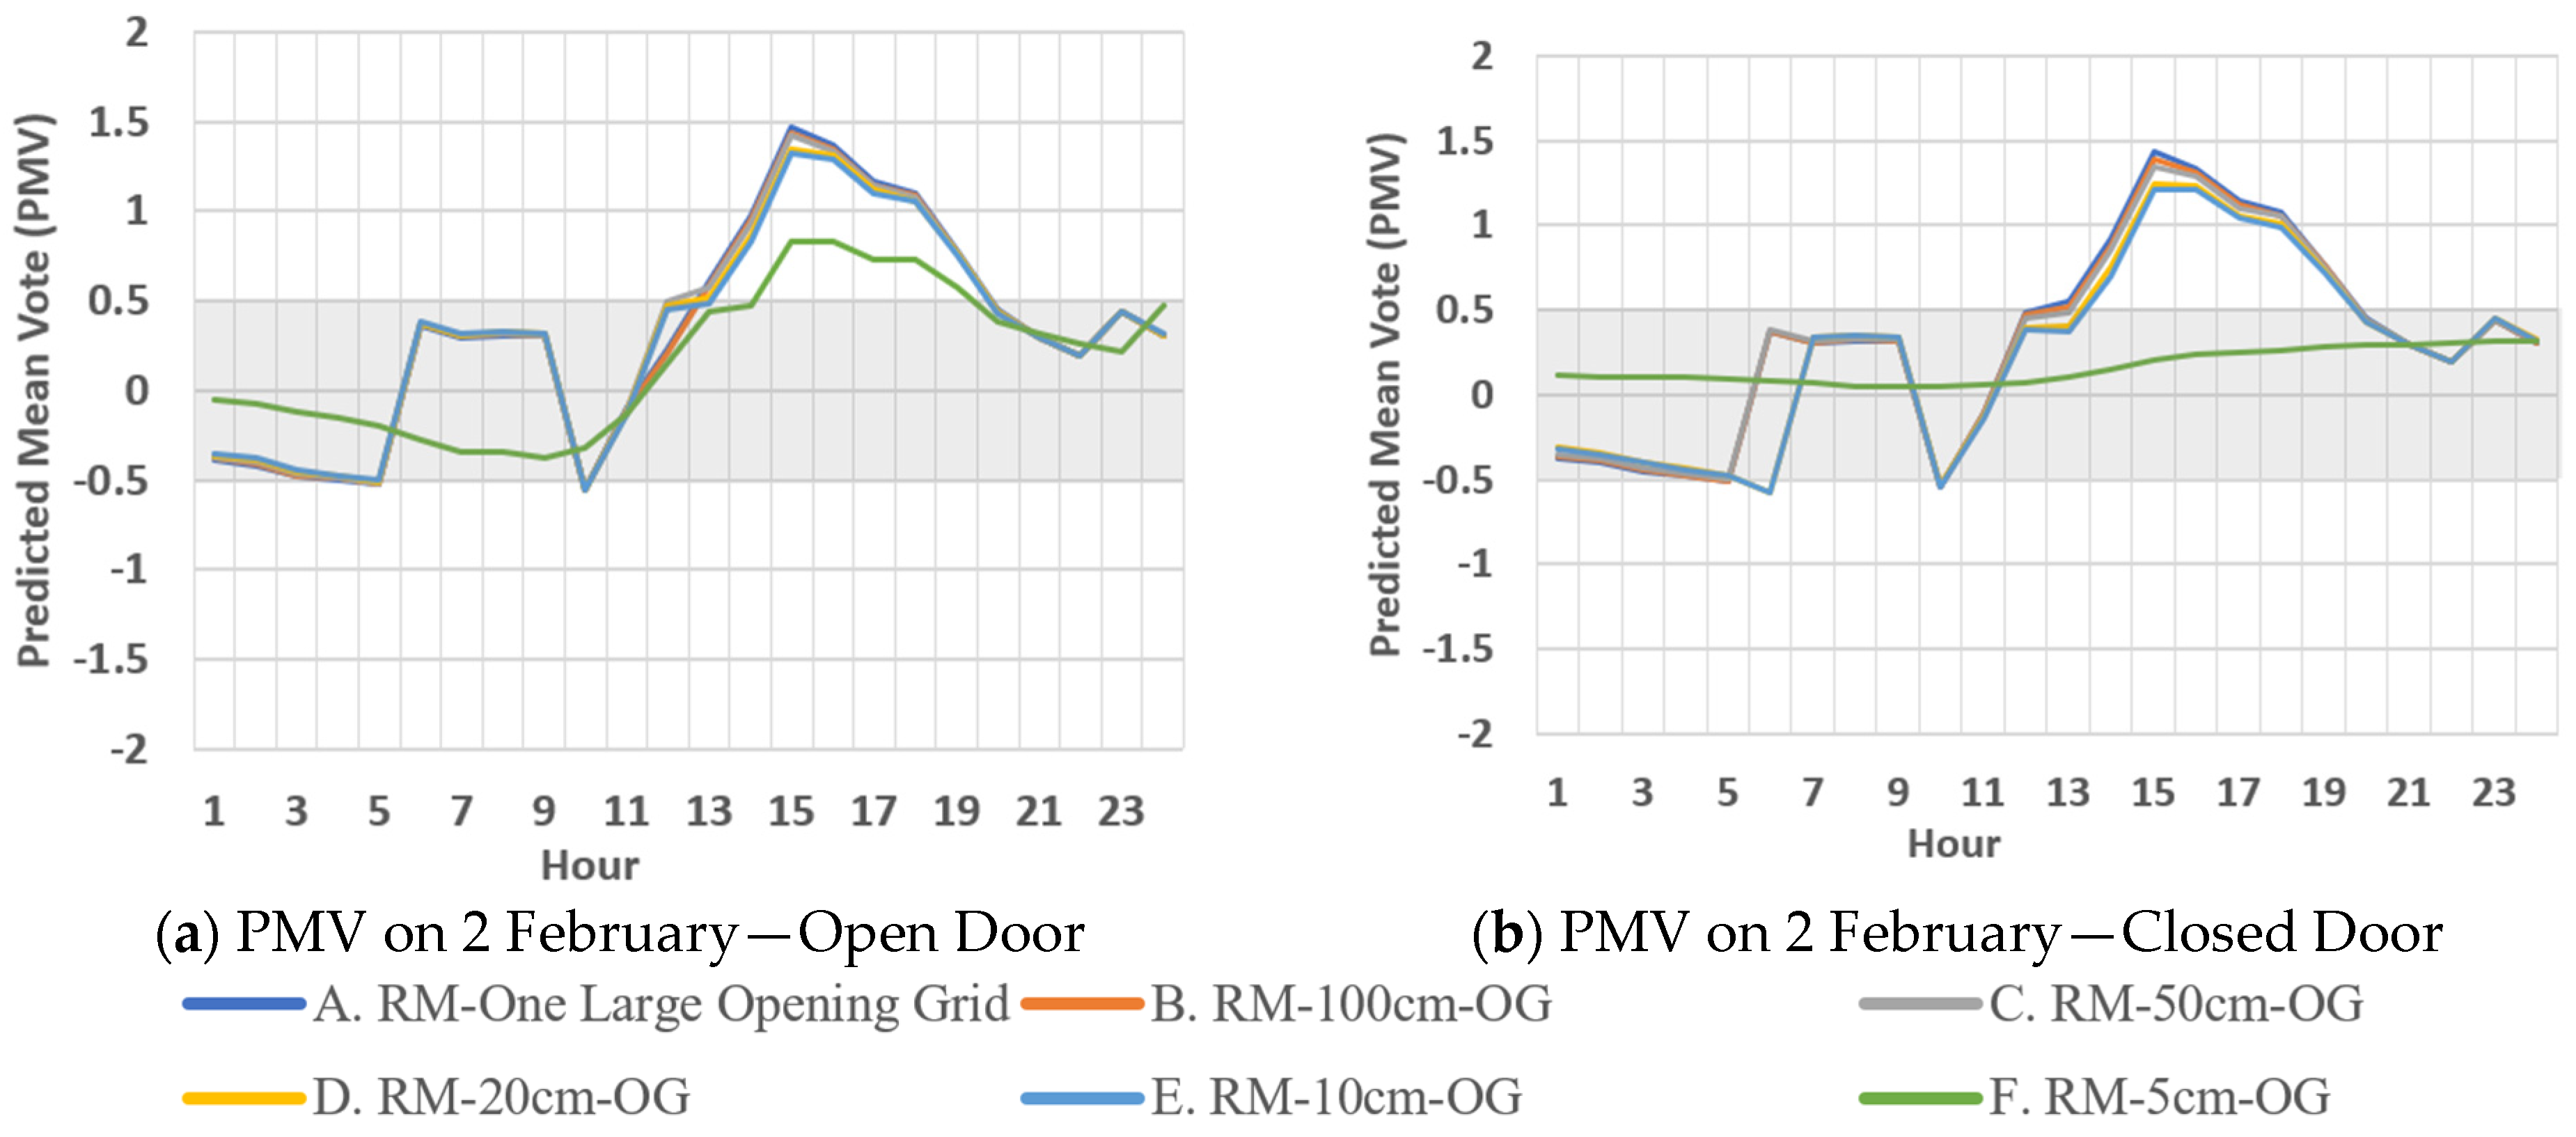
3.2.3. Predicted Mean Vote (PMV) Investigation Focused on the Daily Annual Minimum (2 February) Due to the Higher Potential for Natural Ventilation in Jeddah
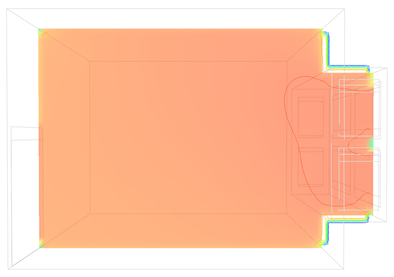
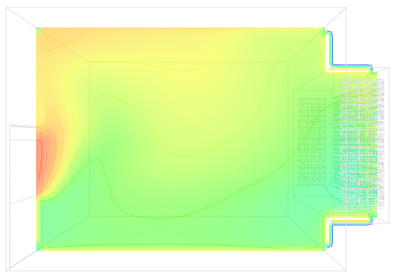
3.3. Rowshan CFD Performance Analysis
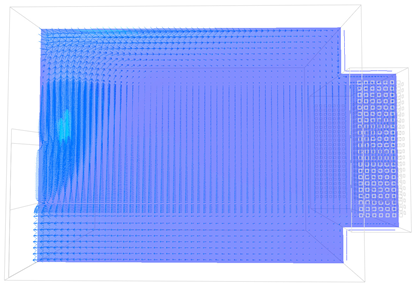
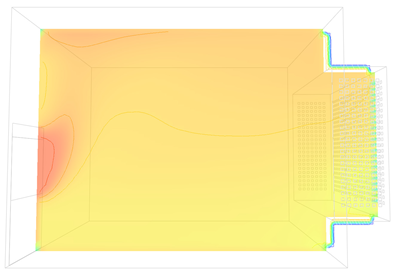
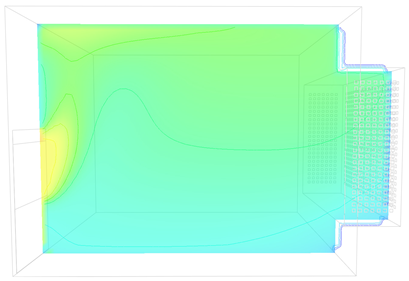
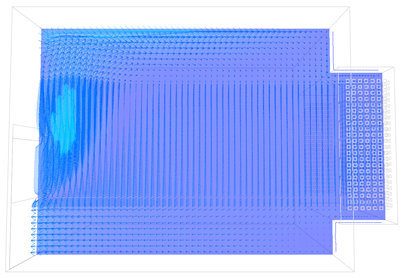
3.3.1. Rowshan Performance with North Orientation
3.3.2. Performance of Rowshan with Minor Perforations with South Orientation
3.3.3. Performance of Rowshan with Minor Perforations with Northwest Orientation
4. Conclusions
Author Contributions
Funding
Data Availability Statement
Acknowledgments
Conflicts of Interest
References
- Khani, S.M.R.; Bahadori, M.N.; Dehghani-Sanij, A.R. Experimental investigation of a modular wind tower in hot and dry regions. Energy Sustain. Dev. 2017, 39, 21–28. [Google Scholar] [CrossRef]
- IEA. Global Electricity Demand Is Growing Faster than Renewables, Driving Strong Increase in Generation from Fossil Fuels. 2021. Available online: https://www.iea.org/news/global-electricity-demand-is-growing-faster-than-renewables-driving-strong-increase-in-generation-from-fossil-fuels (accessed on 15 July 2021).
- IEA. Global Energy & CO2 Status Report; IEA: Paris, France, 2017.
- Elnaklah, R.; Alnuaimi, A.; Alotaibi, B.S.; Topriska, E.; Walker, I.; Natarajan, S. Thermal comfort standards in the Middle East: Current and future challenges. Build. Environ. 2021, 200, 107899. [Google Scholar] [CrossRef]
- Kobayashi, T.; Sandberg, M.; Fujita, T.; Lim, E.; Umemiya, N. Numerical analysis of wind-induced natural ventilation for an isolated cubic room with two openings under small mean wind pressure difference. Build. Environ. 2022, 226, 109694. [Google Scholar] [CrossRef]
- Taleb, H.M. Barriers hindering the utilisation of geothermal resources in Saudi Arabia. Energy Sustain. Dev. 2009, 13, 183–188. [Google Scholar] [CrossRef]
- Alrashed, F.; Asif, M. Trends in Residential Energy Consumption in Saudi Arabia with Particular Reference to the Eastern Province. J. Sustain. Dev. Energy Water Environ. Syst. 2014, 2, 376–387. [Google Scholar] [CrossRef]
- Yarnal, B. Greenhouse Gas Emissions from the Dairy Sector; Department of Geography, College of Earth and Mineral Sciences, The Pennsylvania State University: State College, PA, USA, 2018; Available online: https://www.e-education.psu.edu/geog438w/node/382 (accessed on 4 April 2021).
- Rafique, M.M.; Rehman, S.; Lashin, A.; Al Arifi, N. Analysis of a solar cooling system for climatic conditions of five different cities of Saudi Arabia. Energies 2016, 9, 75. [Google Scholar] [CrossRef]
- Blomberg, T. Role of Potassium Hydroxide in Fouling and Fireside Corrosion Processes in Biomass-Fired Boilers; Alato University: Helsink, Finland, 2020. [Google Scholar]
- Moghaddasi, H.; Culp, C.; Vanegas, J. Net Zero Energy Communities: Integrated Power System, Building and Transport Sectors. Energies 2021, 14, 7065. [Google Scholar] [CrossRef]
- Alturki, F.M. COP26, Climate Change and Saudi Arabia’s Commitment to Climate Solutions. The King Abdullah Petroleum Studies and Research Center (KAPSARC): Riyadh, Saudi Arabia, 2021. Available online: https://www.kapsarc.org/news/cop26-climate-change-and-saudi-arabias-commitment-to-climate-solutions/ (accessed on 6 January 2022).
- Putra, I.D.G.A.; Nimiya, H.; Sopaheluwakan, A.; Kubota, T.; Lee, H.S.; Pradana, R.P.; Alfata, M.N.F.; Perdana, R.B.; Permana, D.S.; Riama, N.F. Development of climate zones for passive cooling techniques in the hot and humid climate of Indonesia. Build. Environ. 2022, 226, 109698. [Google Scholar] [CrossRef]
- Saudi Building Code National Committee—SBC 201. Saudi Building Code-General (SBC 201); The Saudi Building Code National Committee (SBCNC): Riyadh, Saudi Arabia, 2018.
- Jäger-Klein, C.; Mortada, H. Cool Relaxation—Traditional architectural design strategies for air ventilation in the west of Saudi Arabia. J. Comp. Cult. Stud. Archit. 2015, 7, 16–27. [Google Scholar]
- Indraganti, M.; Boussaa, D. A method to estimate the heating and cooling degree-days for different climatic zones of Saudi Arabia. Build. Serv. Eng. Res. Technol. 2017, 38, 327–350. [Google Scholar] [CrossRef]
- UNESCO. Historic Jeddah, the Gate to Makkah. World Heritage Centre—UNESCO. 2016. Available online: https://whc.unesco.org/en/list/1361/ (accessed on 15 April 2020).
- Alawad, A. Using the Architectural Style of heritage Buildings as a Tool to Avoid Health risks-An Analytical Study of Rowshan in Traditional Houses in the City of Jeddah. Procedia Environ. Sci. 2017, 37, 604–613. [Google Scholar] [CrossRef]
- Babsail, M.O.; Al-Qawasmi, J. Vernacular architecture in Saudi Arabia: Revival of displaced traditions. In Vernacular Architecture: Towards a Sustainable Future; CRC Press: Boca Raton, FL, USA, 2015; pp. 99–104. [Google Scholar] [CrossRef]
- Di Turi, S.; Ruggiero, F. Re-interpretation of an ancient passive cooling strategy: A new system of wooden lattice openings. Energy Procedia 2017, 126, 289–296. [Google Scholar] [CrossRef]
- Fatani, K.; Mohamed, M.; Al-Khateeb, S. Sustainable Socio-cultural Guidelines for Neighborhood Design in Jeddah. Procedia Environ. Sci. 2017, 37, 584–593. [Google Scholar] [CrossRef]
- Özsavaş Akçay, A.; Alotman, H. A Theoretical Framework for the Evaluation from the Traditional Mashrabiya to Modern Mashrabiya. J. Hist. Cult. Art Res. 2017, 6, 107. [Google Scholar] [CrossRef]
- Adas, A.A. Wooden bay window (rowshan) conservation in Saudi-hejazi heritage buildings. ISPRS—Int. Arch. Photogramm. Remote Sens. Spat. Inf. Sci. 2013, XL-5/W2, 7–11. [Google Scholar] [CrossRef]
- Bagasi, A.A.; Calautit, J.K.; Karban, A.S. Evaluation of the integration of the traditional architectural element mashrabiya into the ventilation strategy for buildings in hot climates. Energies 2021, 14, 530. [Google Scholar] [CrossRef]
- Mahmoud, A.H.A. An analysis of bioclimatic zones and implications for design of outdoor built environments in Egypt. Build. Environ. 2011, 46, 605–620. [Google Scholar] [CrossRef]
- Huang, X.; Zhang, Q.; Tanaka, I. Optimization of Architectural Form for Thermal Comfort in Naturally Ventilated Gymnasium at Hot and Humid Climate by Orthogonal Experiment. Energies 2021, 14, 3228. [Google Scholar] [CrossRef]
- Maghrabi, A.A. Airflow Characteristics of Modulated Louvered Windows with Reference to the Rowshan of Jeddah, Saudi Arabia. Doctoral Dissertation, University of Sheffield, Sheffield, UK, 2001. [Google Scholar]
- Passe, U.; Battaglia, F. Designing Spaces for Natural Ventilation; Routledge: New York, NY, USA, 2015. [Google Scholar] [CrossRef]
- Rasheed, E.O.; Byrd, H. Can a naturally ventilated office outperform a mixed mode office? Pilot study on occupants’ comfort. Build. Environ. 2018, 137, 34–40. [Google Scholar] [CrossRef]
- Saudi Building Code National Committee—SBC 602. Saudi Energy Conservation Code for Low-Rise (Residential) Buildings (SBC 602); The Saudi Building Code National Committee (SBCNC): Riyadh, Saudi Arabia, 2018.
- ASHRAE Standard 55; Thermal Environmental Conditions for Human Occupancy. ASHRAE: Atlanta, GA, USA, 2017; Volume 7.
- Atkinson, J.; Chartier, Y.; Pessoa-Silva, C.L.; Paul, J.; Li, Y.; Seto, W.-H. (Eds.) Concepts and types of ventilation. In Natural Ventilation for Infection Control in Health-Care Settings; World Health Organization: Geneva, Switzerland, 2009; pp. 7–15. Available online: https://www.ncbi.nlm.nih.gov/books/NBK143277/ (accessed on 10 May 2021).
- IES Room Variables. Available online: https://help.iesve.com/ve2021/room_variables (accessed on 5 May 2021).
- National Association of Home Builders—NAHB. ICC/ASHRAE 700-2015 National Green Building Standard; First Prin.; NAHB: Washington, DC, USA, 2016. [Google Scholar]
- ASHRAE Standards 62.2; Ventilation and Acceptable Indoor Air Quality in Residential Buildings. ASHRAE: Atlanta, GA, USA, 2016.


| Groups | Model Position/Opening Position | Six Simulated Room Models/Code | The Daily Annual Maximum Condition (8 July) | The Daily Annual Average Condition (16 May) | The Daily Annual Minimum Condition (2 February) | |||
|---|---|---|---|---|---|---|---|---|
| DBT | DPT | DBT | DPT | DBT | DPT | |||
| 1 | Faced north to represent the best scenario | (a) Full-size window opening/RM-FullSize-OG | 39 °C | 16 °C | 36 °C | 19 °C | 30 °C | 11 °C |
| (b) 100 × 100 cm opening grids/RM-100 cm-OG | ||||||||
| (c) 50 × 50 cm opening grids/RM-50 cm-OG | ||||||||
| (d) 20 × 20 cm opening grids/RM-20 cm-OG | ||||||||
| (e) 10 × 10 cm opening grids/RM-10 cm-OG | ||||||||
| (f) 5 × 5 cm opening grids/RM-5 cm-OG | ||||||||
| 2 | Faced south to represent the worst scenario | (a) Full-size window opening/RM-FullSize-OG | ||||||
| (b) 100 × 100 cm opening grids/RM-100 cm-OG | ||||||||
| (c) 50 × 50 cm opening grids/RM-50 cm-OG | ||||||||
| (d) 20 × 20 cm opening grids/RM-20 cm-OG | ||||||||
| (e) 10 × 10 cm opening grids/RM-10 cm-OG | ||||||||
| (f) 5 × 5 cm opening grids//RM-5 cm-OG | ||||||||
| 3 | Faced northwest, representing a moderate/average case | (a) Full-size window opening/RM-FullSize-OG | ||||||
| (b) 100 × 100 cm opening grids/RM-100 cm-OG | ||||||||
| (c) 50 × 50 cm opening grids/RM-50 cm-OG | ||||||||
| (d) 20 × 20 cm opening grids/RM-20 cm-OG | ||||||||
| (e) 10 × 10 cm opening grids/RM-10 cm-OG | ||||||||
| (f) 5 × 5 cm opening grids//RM-5 cm-OG | ||||||||
| Simulation Setups | Input Data |
|---|---|
| Turbulence model | k-e model |
| Grid settings | Grid spacing (m): 0.08 Grid line merge tolerance (m): 0.01 |
| Surface heat transfer | MicroFlo in IES-VE 2021 calculates the heat transfer coefficient using local temperature and velocity data around the surface |
| Discretization scheme | “Upwind” scheme |
| Monthly Outdoor Air Temperature and RH (% Hours in the Range 1) | ||
|---|---|---|
| Month | Percentage (%) | Hours (h) |
| January | 56 | 416 |
| February | 47 | 312 |
| March | 41 | 307 |
| April | 57 | 410 |
| May | 29 | 217 |
| June | 17 | 120 |
| July | 11 | 79 |
| August | 0 | 2 |
| September | 6 | 45 |
| October | 15 | 114 |
| November | 64 | 459 |
| December | 38 | 284 |
| Annual | 32 | 2765 |
| Room Model | Latticework Grid (Opening Sizes) | Annual Air Temperature and RH (% Hours in Range 1) | |||
|---|---|---|---|---|---|
| Indoor | Outdoor | ||||
| A | One large opening | 35.1% | 3079 h | 32% | 2765 h |
| B | 100 cm | 35.3% | 3090 h | ||
| C | 50 cm | 35.4% | 3101 h | ||
| D | 20 cm | 35.9% | 3143 h | ||
| E | 10 cm | 36.1% | 3165 h | ||
| F | 5 cm | 42.3% | 3704 h | ||
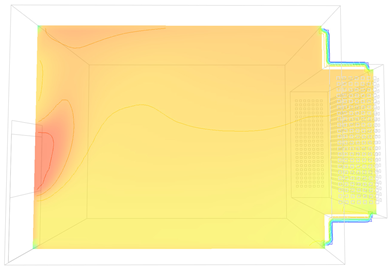
| Outdoor Conditions with North Orientation for Daily Annual Maximum (8 July) at Noon | ||||||||||||
|---|---|---|---|---|---|---|---|---|---|---|---|---|
| DBT: 39 °C | DPT: 16 °C | RH: 27% | Wind Speed (WS): 5.10 m/s | Wind Direction (WD): NW | ||||||||
| Indoor Conditions with North Orientation for Daily Annual Maximum (8 July) at Noon | ||||||||||||
| 100 × 100 cm Opening Grids | 20 × 20 cm Opening Grids | 5 × 5 cm Opening Grids | ||||||||||
| DBT: 38 °C DPT: 17 °C RH: 28% | Top: 38 °C ACH: 126 | MRT: 36.6 °C PMV: +3 (hot) | DBT: 38 °C DPT: 17 °C RH: 28% | Top: 37 °C ACH: 99 | MRT: 36.4 °C PMV: +3 (hot) | DBT: 36 °C DPT: 16 °C RH: 31% | Top: 36 °C ACH: 11 | MRT: 35.3 °C PMV: +3 (hot) | ||||
 |  |  | ||||||||||
 |  |  | ||||||||||
| Temperature Contour and Velocity Vector Field in Section View | ||||||||||||
 | ||||||||||||
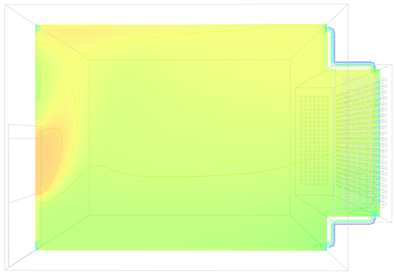
| Outdoor Conditions with North Orientation for Daily Annual Average (16 May) at Noon | ||||||||||||
|---|---|---|---|---|---|---|---|---|---|---|---|---|
| DBT: 36 °C | DPT: 19 °C | RH: 37% | Wind Speed: 5.10 m/s | Wind Direction: WNW | ||||||||
| Indoor Conditions with North Orientation for Daily Annual Average (16 May) at Noon | ||||||||||||
| 100 × 100 cm Opening Grids | 20 × 20 cm Opening Grids | 5 × 5 cm Opening Grids | ||||||||||
| DBT: 36 °C DPT: 19 °C RH: 38% | Top: 35 °C ACH: 101 | MRT: 33.5 °C PMV: +3 (hot) | DBT: 35 °C DPT: 19 °C RH: 38% | Top: 35 °C ACH: 81 | MRT: 33.2 °C PMV: +2.98 (~hot) | DBT: 33 °C DPT: 19 °C RH: 43% | Top: 33 °C ACH: 10 | MRT: 31.6 °C PMV: +2.58 (~hot) | ||||
 |  |  | ||||||||||
 |  |  | ||||||||||
| Temperature Contour and Velocity Vector Field in Section View | ||||||||||||
 | ||||||||||||
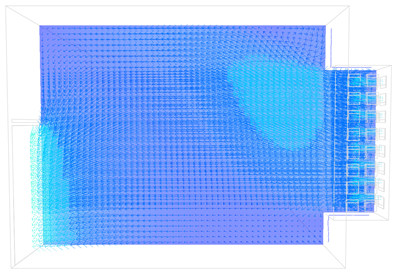
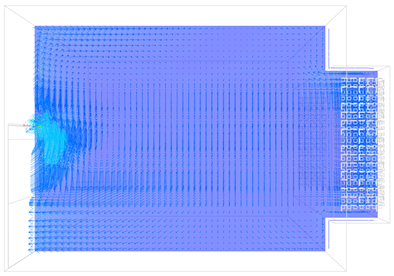
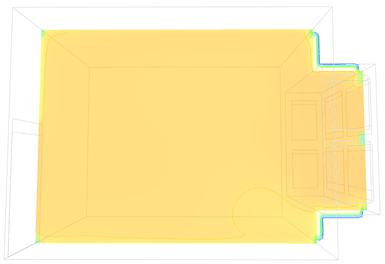
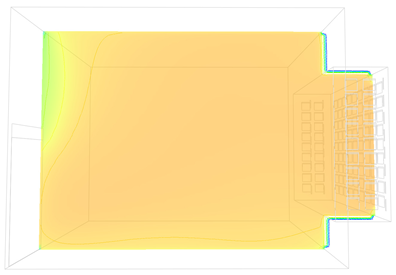
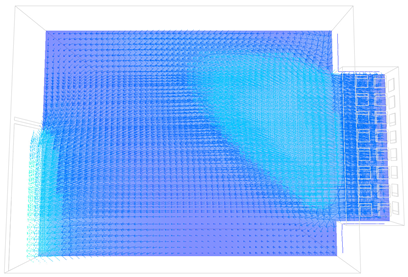
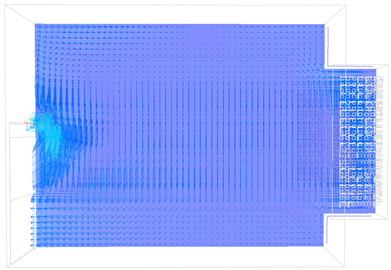
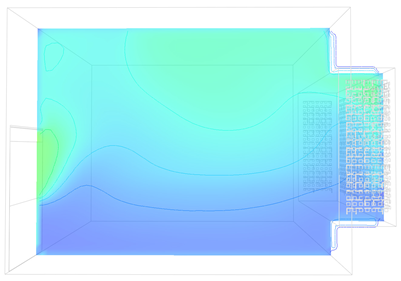
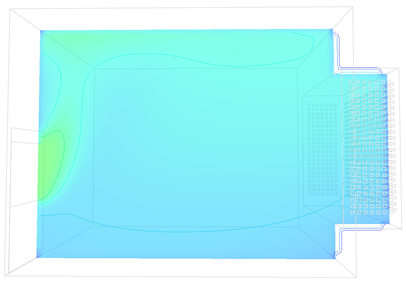
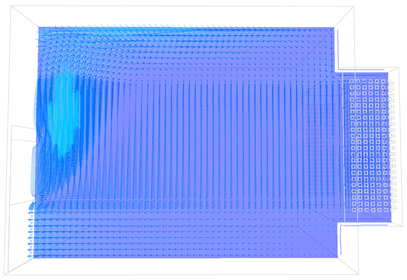
| Outdoor Conditions with North Orientation for Daily Annual Minimum (2 February) at Noon | ||||||||||||
|---|---|---|---|---|---|---|---|---|---|---|---|---|
| DBT: 30 °C | DPT: 11 °C | RH: 33% | Wind speed: 2.10 m/s | Wind Direction: N | ||||||||
| Indoor Conditions with North Orientation for Daily Annual Minimum (2 February) at Noon | ||||||||||||
| 100 × 100 cm Opening Grids | 20 × 20 cm Opening Grids | 5 × 5 cm Opening Grids | ||||||||||
| DBT: 28 °C DPT: 11 °C RH: 33% | Top: 27 °C ACH: 39 | MRT: 26 °C PMV: +1.29 (~slightly warm) | DBT: 28 °C DPT: 11 °C RH: 34% | Top: 27 °C ACH: 31 | MRT: 25.8 °C PMV: +1.24 (~slightly warm) | DBT: 26 °C DPT: 11 °C RH: 38% | Top: 25 °C ACH: 8 | MRT: 24.7 °C PMV: +0.94 (~slightly warm) | ||||
 |  |  | ||||||||||
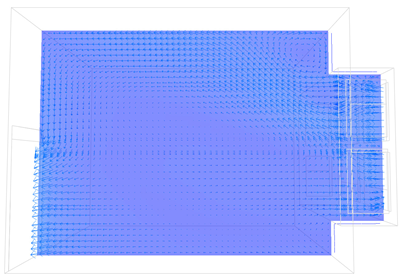 |  |  | ||||||||||
| Temperature Contour and Velocity Vector Field in Section View | ||||||||||||
 | ||||||||||||
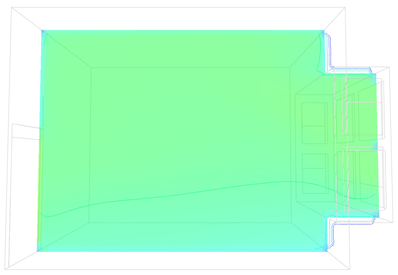
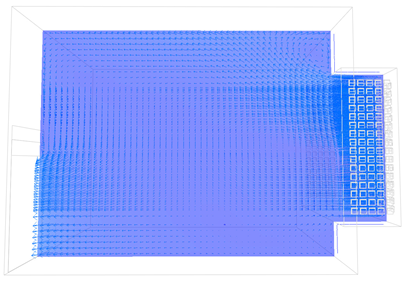
| Outdoor Conditions with South Orientation | ||||||||||
|---|---|---|---|---|---|---|---|---|---|---|
| Daily annual maximum (8 July) at noon | Daily annual average (16 May) at noon | Daily annual minimum (2 February) at noon | ||||||||
| DBT: 38 °C DPT: 16 °C RH: 27% | WD: NW WS: 5.10 m/s | DBT: 36 °C DPT: 19 °C RH: 37% | WD: WNW WS: 5.10 m/s | DBT: 29 °C DPT: 11 °C RH: 33% | WD: N WS: 2.10 m/s | |||||
| Indoor Conditions—Section of the 5 × 5 cm Opening Grid Model (RM-5 cm-OG) | ||||||||||
| DBT: 36 °C DPT: 16 °C RH: 31% | Top: 36 °C ACH: 11 | MRT: 35.4 °C PMV: +3 (hot) | DBT: 33 °C DPT: 19 °C RH: 43% | Top: 33 °C ACH: 11 | MRT: 31.6 °C PMV: +2.58 (~hot) | DBT: 26 °C DPT: 11 °C RH: 38% | Top: 25 °C ACH: 9 | MRT: 24.5 °C PMV: +0.90 (~slightly warm) | ||
 |  |  | ||||||||
 |  |  | ||||||||
| Temperature Contour and Velocity Vector Field in Section View | ||||||||||
 | ||||||||||
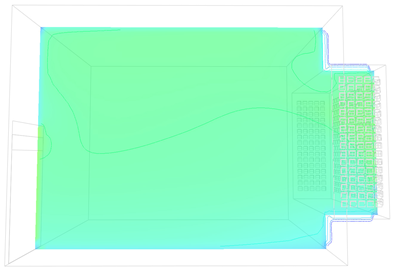
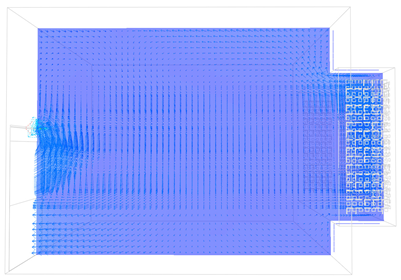
| Outdoor Conditions with Northwest Orientation | ||||||||
|---|---|---|---|---|---|---|---|---|
| Daily annual maximum (8 July) at noon | Daily annual average (16 May) at noon | Daily annual minimum (2 February) at noon | ||||||
| DBT: 39 °C DPT: 16 °C RH: 27% | WD: NW WS: 5.10 m/s | DBT: 36 °C DPT: 19 °C RH: 37% | WD: WNW WS: 5.10 m/s | DBT: 29 °C DPT: 11 °C RH: 33% | WD: N WS: 2.10 m/s | |||
| Indoor Conditions—Section of the 5 × 5 cm Opening Grid Model (RM-5 cm-OG) | ||||||||
| DBT: 37 °C DPT: 16 °C RH: 31% | Top: 36 °C ACH: 11 | MRT: 35.4 °C PMV: +3 (hot) | DBT: 33 °C DPT: 19 °C RH:43% | Top: 33 °C ACH: 11 | MRT: 31.7 °C PMV: +2.60 (~hot) | DBT: 26 °C DPT: 11 °C RH:38% | Top: 25 °C ACH: 8 | MRT: 24.7 °C PMV: +0.94 (~slightly warm) |
 |  |  | ||||||
 |  |  | ||||||
| Temperature Contour and Velocity Vector Field in Section View | ||||||||
 | ||||||||
Disclaimer/Publisher’s Note: The statements, opinions and data contained in all publications are solely those of the individual author(s) and contributor(s) and not of MDPI and/or the editor(s). MDPI and/or the editor(s) disclaim responsibility for any injury to people or property resulting from any ideas, methods, instructions or products referred to in the content. |
© 2024 by the authors. Licensee MDPI, Basel, Switzerland. This article is an open access article distributed under the terms and conditions of the Creative Commons Attribution (CC BY) license (https://creativecommons.org/licenses/by/4.0/).
Share and Cite
Mezaien, A.A.; Baltazar, J.-C. Potential Regenerative Impact of Implementation of Cultural Vernacular Elements (Rowshan) in Jeddah, Saudi Arabia. Energies 2024, 17, 1995. https://doi.org/10.3390/en17091995
Mezaien AA, Baltazar J-C. Potential Regenerative Impact of Implementation of Cultural Vernacular Elements (Rowshan) in Jeddah, Saudi Arabia. Energies. 2024; 17(9):1995. https://doi.org/10.3390/en17091995
Chicago/Turabian StyleMezaien, Ahmed Abdullah, and Juan-Carlos Baltazar. 2024. "Potential Regenerative Impact of Implementation of Cultural Vernacular Elements (Rowshan) in Jeddah, Saudi Arabia" Energies 17, no. 9: 1995. https://doi.org/10.3390/en17091995
APA StyleMezaien, A. A., & Baltazar, J.-C. (2024). Potential Regenerative Impact of Implementation of Cultural Vernacular Elements (Rowshan) in Jeddah, Saudi Arabia. Energies, 17(9), 1995. https://doi.org/10.3390/en17091995