Abstract
Agricultural production, including animal husbandry, is associated with greenhouse gas (GHG) emissions, which have a negative impact on the environment. The purpose of this study was to determine methane and nitrous oxide emissions at the level of individual farms and to identify differences in emissions by type of production. Analyses were conducted using data from the FADN agricultural accounting system, covering the farms in Poland engaged in dairy production and the breeding of other grazing livestock for the period from 2012 to 2021. The relationships and trends of the indicators during the study period were also analyzed. The statistical analysis confirmed the relationship between greenhouse gas emissions and economic performance. In the case of dairy farms, the emissions averaged 137.09 kg·ha−1 of methane and 94.05 kg·ha−1 of nitrous oxide, which were found to increase as the net-added value and farm income increased. The results of the presented research highlight the existence of a link between economic goals and GHG emissions, which is an important contribution to the development of mitigation strategies in livestock production.
1. Introduction
Protecting the natural environment and combating climate change are the most important challenges the modern world faces today. Progressing climate change results from increasing greenhouse gas (GHG) emissions. All development concepts emphasize the role of a low-emission economy, which alone can guarantee an improvement in the quality of the natural environment and an increase in prosperity. Both rich and less wealthy societies benefit from circular economy systems [1].
Agriculture, due to its strong dependence on the environment, significantly contributes to climate change. According to Solazo et al. [2], agricultural production is responsible for over 10% of total carbon dioxide (CO2) emissions in the EU-28. According to the European Environment Agency in the EU, agriculture emits 11% of greenhouse gases [3]. This phenomenon is related to the growing global demand for food and the concurrent application of industrial production methods in agriculture. By improving the efficiency of production, these methods ensure economic benefits; however, they also generate threats to the natural environment.
Combating climate change and enhancing biodiversity are strategic priorities for the European Union. The implementation of the principles adopted under the European Green Deal requires changes in agricultural practices towards more environmentally sustainable farming [4,5]. These activities aim to ensure food safety and contribute to the transformation of the current food system into a sustainable model [6,7,8].
The environmental impacts of the entire agri–food system are multi-faceted and wide-ranging. The negative aspects include primarily greenhouse gas (GHG) emissions and loss of biodiversity [9,10,11,12,13]. Environmental threats are associated with livestock production, which is a major contributor to climate change. Studies show that livestock farming emits approximately 7.1 gigatons of carbon dioxide-equivalent greenhouse gases annually, accounting for approximately 14.5% of all human-generated greenhouse gas emissions worldwide [14,15]. Of these, beef and dairy cattle are the main source of these emissions [14,16,17].
The Intergovernmental Panel on Climate Change (IPCC) reports that methane produced by ruminants accounts for approximately 14–16% of total global greenhouse gas emissions, depending on the country and region [18,19]. In the EU, during the period from 1990 to 2020, CH4 and N2O emissions decreased by 1.4% and 3%, respectively. In 2020, cattle were responsible for 0.5% of total greenhouse gas emissions and 4.4% of CH4 emissions in the EU [20]. In the USA, agricultural sources of greenhouse gases are responsible for 6.2% of greenhouse gas emissions, mainly methane (CH4) and nitrous oxide(N2O), in the country’s economy [21]. Enteric fermentation in ruminants is a major source of emissions, with approximately 45% of the total carbon dioxide equivalent emissions from the two cattle species being methane released from enteric fermentation. Enteric fermentation accounts for approximately 2% of total anthropogenic greenhouse gas emissions in the US, with beef cattle accounting for approximately 72% of these emissions and dairy cattle accounting for approximately 23% in 2008 [22].
Ruminant production systems contribute to varying greenhouse gas emissions, which depend on the country and region [12,18,23]. Therefore, the IPCC encourages the development of country-specific methane emission estimates, which is crucial to improving the precision of overall global methane emission estimates [18,24].
However, the implementation of strategies mitigating GHG emissions encounters certain barriers. According to Van Groenigen et al. [4,25], these include complex and poorly understood systems for controlling GHG sources and a still insufficient level of knowledge regarding the economic and social costs associated with the implementation of mitigation strategies. Progress in technology for monitoring methane emissions from farms has significant consequences for the organization of cattle breeding and environmental management [26]. The implementation of adequate mitigation strategies, which should enjoy universal support, is becoming an urgent necessity.
According to data from the Ministry of the Climate, in 2021, agriculture in Poland was responsible for 8.5% of total greenhouse gas emissions [27]. More than half of the total emissions from the agricultural sector in Poland are related to livestock breeding [28]. The National Centre for Emissions Management (KOBiZE) estimates that methane emissions from enteric fermentation accounted for 34.2% of total methane emissions in 2021 [27]. Similar proportions have been recorded in other countries where livestock production is an essential element of agricultural production [11,29].
Livestock production systems are a significant and complex source of greenhouse gases. Emissions from this sector are expected to increase due to the growing world population and increased demand for food. The demand for meat and other animal-based products in developing countries is forecast to double by 2050 [30]. Meeting this demand will require a global strategy aimed at ensuring sustainable food production. Therefore, it is necessary to implement mitigation technologies aimed at directly reducing emissions related to animal production. It is predicted that CH4 emissions from enteric fermentation may increase by 31% by 2030, and N2O emissions from manure management will increase by 20% [31].
Statistical data indicate that in Poland, from 2002 to 2021, live beef production increased by 133%, and milk production increased by 41.8% [32]. These numbers prove how important activities related to the organization of animal production are in the environmental context. Controlling methane emissions is, therefore, becoming an urgent challenge in the face of growing global concerns about climate change. It is also important to control N2O emissions from animal feces and the nitrogen fertilization of plants grown for animal feed. Agricultural activities related to soil management, including fertilizing the soil with nitrogen, solid animal waste, and burning crop residues, are responsible for approximately 68% of N2O emissions [21]. The cited arguments emphasize the need to address greenhouse gas emissions related to livestock production [33].
The search for effective production technology management tools is one of the key challenges in organizing agricultural production. These are technologies that use fewer resources and are less harmful to the environment [34].
An important aspect of agriculture is its socio-economic dimension. The emphasis is both on producing high-quality, environmentally friendly food and ensuring a fair economic return for farming families. Developing effective solutions in this area requires introducing changes at various stages of the food chain. Nevertheless, our literature review shows that the research results are inconclusive. For example, research by Khan and co-workers [35] suggested a small reduction in greenhouse gas emissions as a result of increased value added in agriculture and the use of renewable energy. However, the research of Zafeiriou et al. [36] presented a different picture: the increase in CO2 emissions may correlate with profits in agriculture, which was confirmed in the context of Spain. The results of research conducted by Sieczko and Koloszko [23] indicated that strategies to reduce the negative impact of agricultural production on the environment require taking into account regional conditions.
The inconclusive results obtained by other authors create the need to continue research at the farm level, considering that agriculture holds the key link in the food chain.
The aim of this research is to investigate the relationships between greenhouse gas emissions and selected economic and ecological indicators by simplifying the model at the farm level. Our previous work [23,37] demonstrated the need to reduce indicators to better explore these relationships while maintaining the substantive value and the possibility of drawing conclusions.
The present study fits into the concept of the European Green Deal (EGD) and broadens the current knowledge on the relationships between economic and ecological indicators and greenhouse gas emissions from livestock production. This topic has not often been addressed in the literature, making the present work a valuable contribution to advancing our understanding of these issues.
2. Methodology
This study used data obtained from the farm accountancy data network (FADN) and published by the Institute of Agriculture and Food Economy [38]. This data are not available in other databases. Although they mainly describe the economic situation of farms, they can also be used for environmental analyses [37,39,40].
The analysis was based on the following indicators: stocking density (LU·ha−1), the balance of soil organic matter (t·ha−1) [41], and the use of mineral fertilizers and plant protection products (PLN·ha−1). The indicator representing the cost of mineral fertilizers and plant protection products has limited use in assessing the sustainability of farms but may have diagnostic value and indicate trends [42]. Stocking density is an indicator of the organization of animal production in terms of the use of natural fertilizers. Soil organic matter is crucial for improving soil fertility. The balance of the soil organic matter was estimated based on the degradation and reproduction coefficients of the organic matter [41]. The value of the coefficient shows how many tons of dry organic matter is lost (−) or gained (+) per year per 1 ha of soil, depending on the species or group of plants grown and the type of soil. For the purpose of this analysis, the coefficients for medium arable soils were adopted.
The selection of the indicators always depends on the data availability [41,43,44,45,46,47]. The indicators adopted for the purpose of this analysis, despite certain limitations, enabled the investigation of the relationship between livestock production and GHG emission intensity.
Methane and nitrous oxide emissions were estimated following the methodology proposed by Wiśniewski [28]. This method involves making estimates based on data from public statistics data and was used by other authors [37,48,49]. This solution is also consistent with the methodology and standard indicators proposed by the Intergovernmental Panel on Climate Change [50] and takes into account the emission factors developed by the National Centre for Emissions Management (KOBiZE). Although the applied methodology is a simplified solution, it allowed us to evaluate the impact farming practices have on the environment. Dick et al. [51] pointed to the practical application of this method, arguing that it enables farmers to choose the production method and the means of implementation with the lowest environmental impact.
The analysis took into account three main sources of greenhouse gases: the enteric fermentation of livestock (the main source of methane emissions), animal feces (the source of methane and nitrous oxide emissions), and nitrous oxide emissions from the use of mineral fertilizers.
The estimates of nitrous oxide emissions from mineral fertilizers were based on the average consumption of fertilizers per ha of utilized agricultural area.
For a detailed methodology for calculating the methane and nitrous oxide emissions, see Koloszko et al. [37].
The following indicators were used to assess the economic situation: farm net value added (SE425 PLN·AWU−1), family farm income (SE420) per 1 ha of farmland (PLN), and financial surplus (PLN). The financial surplus was used to determine farms’ self-financed growth potential [41]. The basis for calculating it was gross income, understood as the sum of the family farm income (SE420) and amortization (SE360). The sum calculated in this way should cover, at the least, the unpaid labor input and loan payments. The unpaid labor input was estimated based on the remuneration for hired labor. In the case of the FADN data, we accepted the following formula: (SE370/SE020) × SE015. The value of the loan payments was omitted in the calculations due to the impossibility of determining it based on the available data. The surplus was calculated in two variants: surplus I, which included the subsidies (subsidies on the current operations SE605 received under the common agricultural policy), and surplus II, which excluded the subsidies.
The used dataset covered the years between 2012 and 2021. The analysis included two types of agricultural holdings: farms specializing in milk production and farms specializing in other grazing livestock production. According to Polish FADN data, 90.1% of the herbivorous animals were fattening cattle. Therefore, the study assumed that the results apply to this group of animals.
The number of farms covered by FADN is different each year, which results from the sampling algorithm included in the system.
To present the results from the 10-year study period, we used arithmetic mean values and standard deviations. The set of input data included twelve features, which represented the dimensions of the described farms, treated as objects in the analysis. To bring the variables closer to the comparative level, the data were normalized using the standardization algorithm according to Formula (1).
where is a non-standardized variable, μ is the population mean, and σ is the population standard deviation.
The studied variables in individual years were subjected to a correlation analysis, in which the R2 coefficient was calculated, and the changes were described using simple linear regression equations. Additionally, a factor analysis was performed using the principal components analysis (PCA) method [52,53]. We accommodated the changing number of farms participating in the study (X1) due to its significant variability over time. Since most of the studied farms did not participate in FADN in all ten years, subsequent years were treated as separate sets of described objects. This non-linearity in the data meant that data from subsequent years could not be treated as dependent on each other but as independent samples. In the context of the PCA, the X1 variable was not included. The PCA analysis showed a group of eleven studied indicators in a new, reduced two- or three-dimensional space. The correlation coefficients between the studied indicators and the components formed new groups of interdependent features, facilitating multi-dimensional interpretation.
An analysis of variance (ANOVA) was also performed, where the factor (at two levels) was the leading type of production on the farm. The mean values of the studied features were compared based on ten repetitions (years). The hypothesis about the equality of the values of the examined coefficients in the two groups of farms in each case was rejected at a significance level of α = 0.01.
3. Results
Family farm income is a key economic category that plays the role of remuneration for labor. Dairy farms clearly stand out in terms of this feature (Table 1).

Table 1.
Mean values of the variables, along with the standard deviation (SD) and standard error of the mean (SEM).
Over 10 years, the value of family farm income per 1 ha of utilized land almost doubled, reaching PLN 4799 in 2021 (R2 = 0.7749). However, in farms specializing in breeding other grazing livestock, the level of farm income was much lower and constituted, on average, 43.5% of the income of milk farms, even though it also increased significantly in the studied period (R2 = 0.5883). Despite the differences in the level of income between the types of farms, the direction of changes in the subsequent years was very similar in both groups (Figure 1).
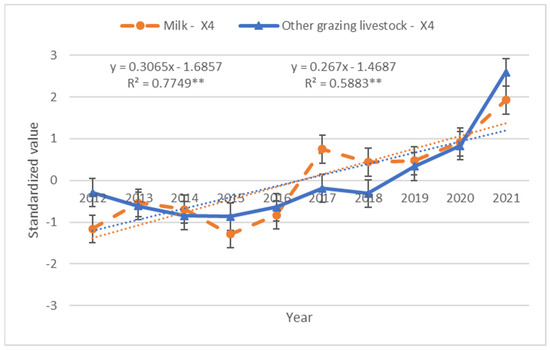
Figure 1.
Family farm income (PLN·ha−1). Level of variability and correlations (features) in the studied period. The course of the linear regression function is marked with a dashed orange line for milk farms and a dashed blue line for other grazing livestock farms. ** significance of correlation coefficient at alpha = 0.01. Source: own calculation based on the FADN data.
In the case of both types of farms, achieving this level of income was possible thanks to subsidies for operating activities. This impacted the farm’s self-financeable growth potential, which is reflected in the value of the financial surplus. In both groups of farms, the value of surplus I (including subsidies) was positive throughout the period under study (R2 = 0.6146 and R2 = 0.8306). The value of surplus II (excluding subsidies) remained positive only in dairy farms, except for 2015. This means that these farms were able to fund their growth without external support using their own resources. This is probably due to investments aimed at improving technology, including reducing GHG emissions and increasing production efficiency.
In contrast, other grazing livestock farms had a negative surplus II value throughout the ten-year period. This proves that without subsidies, they were unable to cover the labor costs of the farm operators and their families. The trend of this feature’s variability course was different in both groups, and it applied to both surplus I and surplus II (Figure 2 and Figure 3). In dairy farms, the value of the financial surplus showed an increasing tendency, while in farms specializing in breeding other grazing livestock, a constant decline in the ability to generate financial surplus was observed.
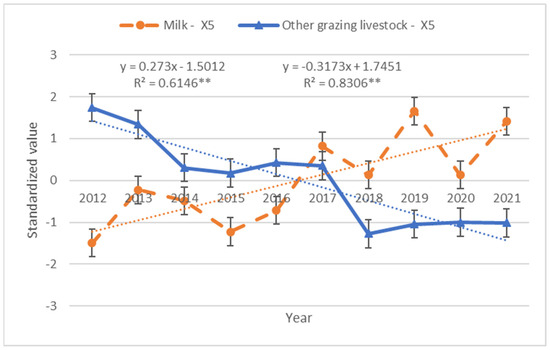
Figure 2.
Financial surplus I (PLN·farm−1). Level of variability and correlations (features) in the studied period. The course of the linear regression function is marked with a dashed orange line for milk farms and a dashed blue line for other grazing livestock farms. ** significance of correlation coefficient at alpha = 0.01. Source: own calculation based on the FADN data.
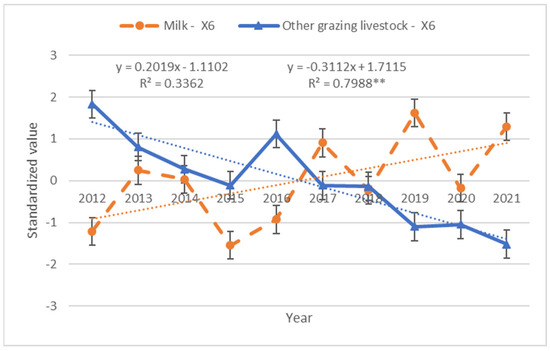
Figure 3.
Financial surplus II (PLN·farm−1). Level of variability and correlations (features) in the studied period. The course of the linear regression function is marked with a dashed orange line for milk farms and a dashed blue line for other grazing livestock farms. ** significance of correlation coefficient at alpha = 0.01. Source: own calculation based on the FADN data.
One of the indicators of ecological balance is stocking density. In this respect, farms specializing in breeding other grazing livestock fared much better. The average stocking density did not pose a threat to the natural environment because it did not exceed the maximum limit of 1.5 LU·ha−1 [54]. In dairy farms, the stocking rate was higher by 0.701 LU·ha−1, which suggests that, at the level of a single farm, environmental requirements were not always respected.
The burden on the natural environment generated by plant protection products and mineral fertilizers, despite differences in consumption levels, was very similar, and an upward trend was observed in both studied groups of farms (Figure 4). The correlation of this variable with most of the others was quite high (Table A1 and Table A2), indicating the complexity of the relationship. The relationships can also be seen in the biplot created from the factor analysis (Figure A1 and Figure A2).
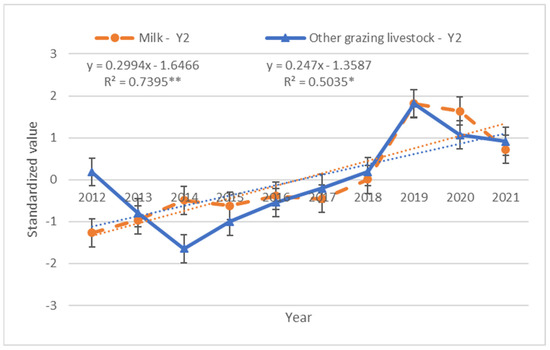
Figure 4.
Fertilizers and crop protection (PLN·ha−1). Level of variability and correlations (features) in the studied period. The course of the linear regression function is marked with a dashed orange line for milk farms and a dashed blue line for other grazing livestock farms. * significance of the correlation coefficient at alpha = 0.05, ** significance of correlation coefficient at alpha = 0.01. Source: own calculation based on the FADN data.
Another indicator of ecological sustainability is the balance of soil organic matter. The value of this indicator was positive on both types of farms, which proves that the practices used in cattle farms contribute to increasing the amount of organic matter in the soil. Nevertheless, dairy farms had almost twice as much reproduction. This difference can be explained by the higher stocking density (r = 0.988, see Table A1) on milk farms and the sowing structure adapted to feed needs. Despite these differences, the tendency to reproduce organic matter was similar in both groups (Figure 5).
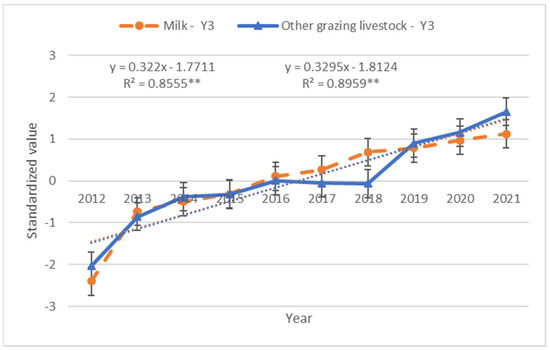
Figure 5.
Soil organic matter balance (t·ha−1). Level of variability and correlations (features) in the studied period. The course of the linear regression function is marked with a dashed orange line for milk farms and a dashed blue line for other grazing livestock farms. ** significance of correlation coefficient at alpha = 0.01. Source: own calculation based on the FADN data.
The impact of agricultural production on the environment was assessed through the prism of greenhouse gas emissions. Both the CH4 and N2O emission levels per 1 ha were higher in dairy farms, which translated into a higher CO2 level (kg ha−1). The emission level should be analyzed in the context of the organizational changes in farms, especially regarding livestock production.
In the first analyzed year, the average number of livestock units in dairy farms was 1.66 LU, and in each subsequent year, it systematically increased, reaching 1.91 LU in 2021 (R2 = 0.9152). The number of animals in other grazing livestock farms also increased, but the growth was remarkably smaller (R2 = 0.4713). The changes in herd size were reflected in the greenhouse gas emissions.
Livestock production is also a source of the nitrogen emissions released from animal feces. In farms with larger herds of animals, the N2O emissions were higher and included nitrogen emissions from animal feces and mineral fertilization. In the studied farms, 92–95% of N2O emissions came from animal feces. Moreover, it should be noted that the trends in greenhouse gas emissions in the studied farm types were different (Figure 6 and Figure 7). The directional coefficient in the linear regression model for other ruminant animals was positive. In contrast, for dairy cows, it was insignificant (Z1) or negative (Z2). As a result, these two groups of animals had different impacts on the emissions of the greenhouse gases studied during the studied period. In dairy farms, the CH4 emissions remained at a similar level throughout the studied period, and in the case of N2O emissions, they decreased in subsequent years. However, in the case of other grazing livestock farms, the emission of both CH4 and N2O constantly increased.
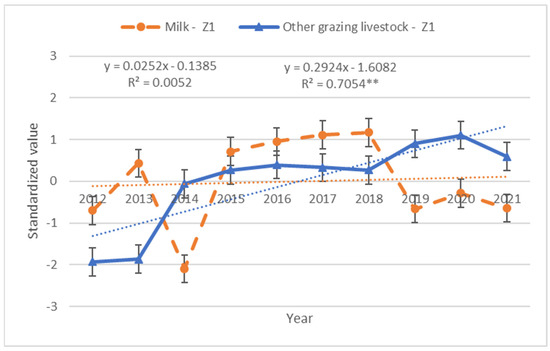
Figure 6.
Emission of CH4 (kg·ha−1). Level of variability and correlations (features) in the studied period. The course of the linear regression function is marked with a dashed orange line for milk farms and a dashed blue line for other grazing livestock farms. ** significance of correlation coefficient at alpha = 0.01. Source: own calculation based on the FADN data.
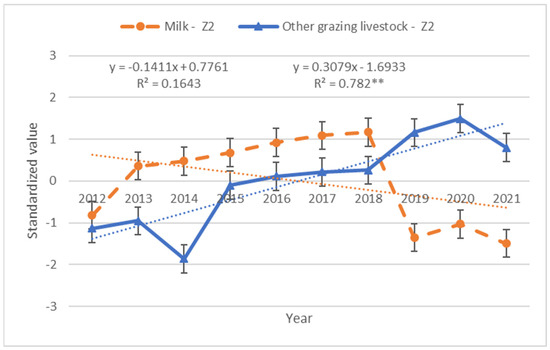
Figure 7.
Emission of N2O (kg·ha−1). Level of variability and correlations (features) in the studied period. The course of the linear regression function is marked with a dashed orange line for milk farms and a dashed blue line for other grazing livestock farms. ** significance of correlation coefficient at alpha = 0.01. Source: own calculation based on the FADN data.
The reduction in eleven dimensions, representing the primary features introduced into the analysis, in the case of milk farms, showed the separation of two main components, which together were responsible for 83.935% of the total variance. The first component explained 58.12% of the total variance and was correlated with all the economic indicators, X2, X3, X4, X5, and X6, and the ecological indicators, Y1, Y2, and Y3 (Table 2). However, the second component, responsible for 25.816% of the variance, was correlated with such features as CH4 emissions (kg·ha−1), N2O emissions (kg·ha−1), and the CO2 equivalent (kg·ha−1). This proved that these farms were highly specialized in milk production. The relationship between the studied indicators and the year of the study is illustrated in detail in the biplot made for the first two principal components (Figure A1). All farm practices described by the examined features had an equally strong impact on the emission of methane and nitrous oxide over the ten-year period.

Table 2.
Eigenvalues and proportions of the total variance in 10 years as explained by the principal components * for the original variables and correlation coefficients between the variables and the PCs in milk farms and other grazing livestock farms.
Other grazing livestock farms are characterized by diverse factors determining the overall GHG emissions. The principal components analysis clearly combined the original features into three main components describing the overall variance (Table 2). The first component was responsible for 42.78% of the total variance, and the most strongly correlated features included the CH4, N2O, and CO2 emissions (kg ha−1), as well as the variable Y3, the soil organic matter balance and two variables characterizing the farm’s potential to fund its own growth, X5 and X6. The second component explained 34.28% of the total variance. The strongest correlations were with economic indicators such as net value added (PLN·AWU−1) and farm income (PLN) and two ecological indicators: the stocking density (Y1) and consumption of mineral fertilizers and crop protection products (Y2). The relationships between the studied indicators and the year of study in the space of the first two principal components are shown in Figure A2. The third component explained 14.96% of the total variance and was most strongly correlated with the utilized agricultural area (ha).
4. Discussion and Conclusions
When we analyze greenhouse gas emissions in the context of livestock production, we see that methane emissions pose a key problem. The main source of this gas is primarily dairy cattle [17]. Research indicates that the intensity of greenhouse gas emissions from milk production changes over time and depends on the milk yield of cows. Increasing the milk yield of cows not only provides economic benefits but is considered an important strategy for mitigating greenhouse gas emissions per production unit. Studies such as the work of Beukes et al. [55] confirmed a decrease in emissions per agricultural area unit resulting from the increase in milk yield.
The study by O’Hara [56] found that with increased per-cow milk productivity, the intensity of greenhouse gas emissions per kilogram of produced milk decreases. Similar conclusions were proposed in the work by Lapple et al. [57], who found that increased productivity was negatively associated with GHG emission intensity. Research conducted by Wolf et al. [58] also confirmed a significant relationship between greenhouse gas emissions and milk yield.
However, research by Zehetmeier et al. [59] showed that the strategy of reducing greenhouse gas emissions by increasing the milk yield of cows has certain limitations. According to this study, the GHG emissions remained approximately constant with increasing milk yield from 6000 to 8000 kg/cow per year, whereas further increases in milk yield (10,000 kg milk/cow per year) resulted in slightly higher (8%) total GHG emissions. This study also found that breeding dairy cattle and beef cattle as co-products led to an increase in greenhouse gas emissions per unit of beef. The conclusion is that the environmental impact (GHG emissions) of increasing the milk yield per cow in dairy farming differs, depending upon the farming system and the assumed level of demand for milk and beef [59]. However, efficiency growth does not always translate directly into lower overall emissions. The reason is technological changes in the animal breeding sector, which reduce the cost of production per liter. It encourages an increase in the production volume, resulting in an increase in emissions [60].
Furthermore, the length of the productive life of a cow impacts greenhouse gas emissions. Research conducted by Brade et al. [61] showed that a longer cow productive life resulted in reduced methane emissions per kilogram of produced milk. For the studied agricultural holdings, the milk productivity of cows in 2012–2021 increased by 15.3%, with a simultaneous increase in the number of cows by 4.23 LU. During the same period, methane emissions (kg ha−1) remained at a similar level, and nitrous oxide emissions (kg ha−1) decreased. The obtained results are consistent with the studies of O’Hara [56], Lappe et al. [57], and Wolf et al. [58].
Changes in N2O emissions are more closely related to agricultural practices than soil properties [62]. Under the common agricultural policy (CAP), measures have been taken to make a significant part of direct payments dependent on adopting and maintaining practices beneficial to the environment and climate, the so-called greening payments. The results of research by other authors suggest that greater environmental benefits from greening are concerned with the reduction of N2O emissions (2.1%) rather than CH4 (0.4%) [2]. The results obtained from milk farms confirm this opinion. According to the experts, the most effective policy instrument for reducing greenhouse gas emissions in the land use sector would be a fee for deforestation [63].
Regarding live cattle, it is difficult to make an accurate assessment because the FADN database lacks data on the slaughter efficiency of cattle. Nevertheless, the results indicate that the CH4 and N2O emissions in farms producing live cattle increased. The direction of these changes was opposite to that observed in dairy farms. The emission level, in this case, probably resulted from the growing number of animals and the size of the utilized agricultural area, which also increased (by almost 2 ha) in the period under study. Field crops, including the area of arable land and the type of crops grown, are crucial factors influencing greenhouse gas emission intensity [64].
When it comes to CH4 and N2O emissions, the increased productivity per LU and potential herd size reduction would currently be the most effective means to reduce methane emissions in the short term [61]. Implementing tools to reduce greenhouse gas emissions seems to be more economically justified than limiting overall agricultural production. Methods of GHG emission from animal production include the use of a high-starch diet, exogenous enzymes, or supplementation with fats. Reducing GHG emissions from agriculture requires innovative technologies to reduce emissions without reducing productivity. Above all, good agricultural practices are important, including breeding progress and effective fertilizer management.
Some mitigation activities will involve high costs or lower productivity. In such a case, financial support may be required, e.g., compensation for lost income [65]. The level of organic fertilization has a significant impact on greenhouse gas emissions. The correct management of organic matter, in addition to maintaining soil fertility and productivity, is a crucial element of environmental protection and greenhouse effect mitigation. Management practices in both studied types of farms contributed to the reproduction of organic matter, which can be considered a beneficial effect. During the entire ten-year period, the value of the organic matter indicator was positive, and in the subsequent years, a constant increase in its value was observed. This is probably due to the adaptation of plant production to feed needs and the use of animal manure. It should be noted that these were farms specializing in livestock production. The average stocking density was 1.82 LU in milk farms and 1.12 LU in other grazing livestock farms. The amount of manure produced by this number of animals ensures the maintenance of a positive soil organic matter balance and, as a result, contributes to reducing the greenhouse effect. Organic matter is inversely proportional to greenhouse gas emission intensity per area unit, which was confirmed in the current analysis, especially with regard to recent years. These results are consistent with the findings of Kuś [66] and our own previous research [23].
There are certain environmental restrictions related to the stocking density. Regarding proper fertilizer management, it is recommended to maintain the stocking rate in the range of 0.5–1.5 LU per hectare of agricultural land. The stocking rates exceeding 2.5 (LU·ha−1) require reducing the herd or disposing of excess natural fertilizers outside the farm [54].
The farm’s self-financeable growth potential could be assessed based on the financial surplus. Only dairy farms were able to fund growth with their own resources. However, the level of the surplus varied, and the available resources did not have to be invested in fixed assets. The calculated surplus only indicates the potential for investment in farm growth. The actual use of resources depends solely on the farmer’s individual decisions.
In summary, the main challenge associated with livestock production is greenhouse gas emissions, especially methane and nitrous oxide. These emissions pose a threat to the environment, so action to mitigate them is necessary. This problem is especially concerning in cattle breeding and methane emissions related to enteric fermentation. Cattle farming contributes significantly to global methane emissions.
The pressure to increase the production of meat and other animal-based products is enormous due to population growth. The food demands resulting from the population growth require a global strategy to ensure sustainable food production and mitigation instruments to directly reduce emissions from livestock production.
It is expected that agriculture will be able to meet the needs of a growing population while contributing to reducing GHG emissions. Intensive agriculture does not have to be a threat to the environment, and achieving sustainable agriculture is possible through the introduction of a high degree of mechanization [67]. Achieving these targets will require intensified production with higher emissions per unit of land but lower emissions per unit of production [68,69]. Increasing the milk yield of cows leads to a reduction in methane emissions per agricultural production unit, which helps achieve both economic and ecological goals.
The introduction of instruments mitigating GHG emissions in agriculture will facilitate the achievement of climate policy goals while significantly limiting the negative impact on the food market and the profitability of the agricultural sector. The implementation of such instruments is economically more justified than limiting agricultural production [70].
This study has made progress toward enhancing our understanding of the relationship between economic goals (important from the perspective of farm families’ wellbeing and ensuring suitable production volume) and greenhouse gas (GHG) emissions. This research also makes a valuable contribution to improving strategies for mitigating emissions from livestock production. Drawing conclusions based on statistical data provides knowledge about the relationships between livestock production and the environment, and a smaller number of parameters describing these relationships facilitates making decisions regarding production and promoting technological innovations with a low environmental impact.
5. Limitations
The conducted analysis has limitations. These include, among others, the insufficient availability of necessary data and difficulties in determining the limit values of many indicators. Another limitation is the selection of farms that participate in the FADN, where the number of farms covered each year may vary due to the data collection algorithms.
To further our research, it would be worth focusing on farms covered by the FADN over a longer period of time. This would enable the assessment of farm practices in terms of the technologies used, compliance with environmental protection requirements, and the effectiveness of the implemented climate policy instruments. We intend to undertake future work in this direction.
Author Contributions
Conceptualization: Z.K.-C. and L.S.; Methodology: L.S., Z.K.-C. and A.S.; Data curation: L.S. and Z.K.-C.; Formal analysis: Z.K.-C. and L.S.; Investigation: L.S., Z.K.-C. and A.S.; Supervision: Z.K.-C.; Writing—original draft: L.S., Z.K.-C. and A.S.; Writing—review and editing: L.S., Z.K.-C. and A.S. All authors have read and agreed to the published version of the manuscript.
Funding
This research received no external funding.
Data Availability Statement
Publicly available datasets were analyzed in this study. The data can be found here: https://fadn.pl/publikacje/wyniki-standardowe-2/wyniki-standardowe-sredniewazone/ (accessed on 19 September 2023).
Conflicts of Interest
The authors declare no conflicts of interest.
Appendix A

Table A1.
Correlation matrix of the variables describing milk production farms.
Table A1.
Correlation matrix of the variables describing milk production farms.
| X2 | X3 | X4 | X5 | X6 | Y1 | Y2 | Y3 | Z1 | Z2 | Z3 | |
|---|---|---|---|---|---|---|---|---|---|---|---|
| X2 | 0.759 | 0.694 | 0.823 | 0.689 | 0.764 | 0.591 | 0.780 | 0.097 | −0.177 | −0.154 | |
| X3 | 0.759 | 0.992 | 0.887 | 0.776 | 0.826 | 0.720 | 0.788 | −0.032 | −0.473 | −0.444 | |
| X4 | 0.694 | 0.992 | 0.868 | 0.770 | 0.812 | 0.686 | 0.776 | −0.016 | −0.434 | −0.406 | |
| X5 | 0.823 | 0.887 | 0.868 | 0.951 | 0.780 | 0.727 | 0.762 | −0.057 | −0.402 | −0.381 | |
| X6 | 0.689 | 0.776 | 0.770 | 0.951 | 0.591 | 0.577 | 0.572 | −0.221 | −0.402 | −0.399 | |
| Y1 | 0.764 | 0.826 | 0.812 | 0.780 | 0.591 | 0.840 | 0.988 | 0.101 | −0.260 | −0.231 | |
| Y2 | 0.591 | 0.720 | 0.686 | 0.727 | 0.577 | 0.840 | 0.783 | −0.194 | −0.602 | −0.583 | |
| Y3 | 0.780 | 0.788 | 0.776 | 0.762 | 0.572 | 0.988 | 0.783 | 0.186 | −0.128 | −0.099 | |
| Z1 | 0.097 | −0.032 | −0.016 | −0.057 | −0.221 | 0.101 | −0.194 | 0.186 | 0.581 | 0.652 | |
| Z2 | −0.177 | −0.473 | −0.434 | −0.402 | −0.402 | −0.260 | −0.602 | −0.128 | 0.581 | 0.996 | |
| Z3 | −0.154 | −0.444 | −0.406 | −0.381 | −0.399 | −0.231 | −0.583 | −0.099 | 0.652 | 0.996 |

Table A2.
Correlation matrix of the variables describing other grazing livestock farms.
Table A2.
Correlation matrix of the variables describing other grazing livestock farms.
| X2 | X3 | X4 | X5 | X6 | Y1 | Y2 | Y3 | Z1 | Z2 | Z3 | |
|---|---|---|---|---|---|---|---|---|---|---|---|
| X2 | 0.417 | 0.184 | −0.292 | −0.388 | −0.160 | −0.146 | 0.471 | 0.314 | 0.104 | 0.131 | |
| X3 | 0.417 | 0.960 | −0.638 | −0.772 | 0.751 | 0.611 | 0.809 | 0.506 | 0.628 | 0.631 | |
| X4 | 0.184 | 0.960 | −0.549 | −0.700 | 0.833 | 0.687 | 0.730 | 0.388 | 0.608 | 0.599 | |
| X5 | −0.292 | −0.638 | −0.549 | 0.869 | −0.530 | −0.585 | −0.857 | −0.854 | −0.756 | −0.788 | |
| X6 | −0.388 | −0.772 | −0.700 | 0.869 | −0.540 | −0.576 | −0.918 | −0.777 | −0.734 | −0.759 | |
| Y1 | −0.160 | 0.751 | 0.833 | −0.530 | −0.540 | 0.880 | 0.550 | 0.402 | 0.672 | 0.659 | |
| Y2 | −0.146 | 0.611 | 0.687 | −0.585 | −0.576 | 0.880 | 0.562 | 0.408 | 0.808 | 0.783 | |
| Y3 | 0.471 | 0.809 | 0.730 | −0.857 | −0.918 | 0.550 | 0.562 | 0.849 | 0.792 | 0.820 | |
| Z1 | 0.314 | 0.506 | 0.388 | −0.854 | −0.777 | 0.402 | 0.408 | 0.849 | 0.741 | 0.791 | |
| Z2 | 0.104 | 0.628 | 0.608 | −0.756 | −0.734 | 0.672 | 0.808 | 0.792 | 0.741 | 0.997 | |
| Z3 | 0.131 | 0.631 | 0.599 | −0.788 | −0.759 | 0.659 | 0.783 | 0.820 | 0.791 | 0.997 |
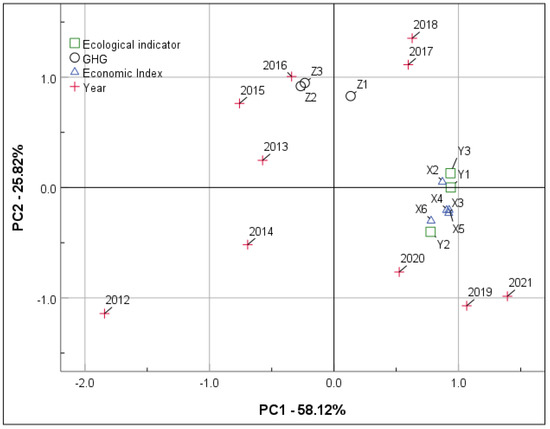
Figure A1.
Relationships between the locations of the studied GHG emission sources (Z1…Z3) and economic indicators (X2…X6) for milk farms in the studied years (2012…2021) in the space of the first two components, PC1 and PC2.
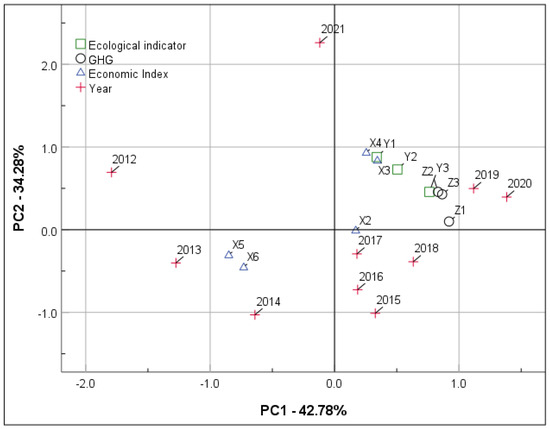
Figure A2.
Relationships between the locations of the studied GHG emission sources (Z1…Z3) and economic indicators (X2…X6) for other grazing livestock farms in the studied years (2012…2021) in the space of the first two components, PC1 and PC2.
References
- Gao, J.; Hou, H.; Zhai, Y.; Woodward, A.; Vardoulakis, S.; Kovats, S.; Wilkinson, P.; Li, L.; Song, X.; Xu, L.; et al. Greenhouse gas emissions reduction in different economic sectors: Mitigation measures, health co-benefits, knowledge gaps and policy implications. Environ. Pollut. 2018, 240, 683–698. [Google Scholar] [CrossRef]
- Solazzo, R.; Donati, M.; Tomasi, L.; Arfini, F. How effective is greening policy in reducing GHG emissions from agriculture? Evidence from Italy. Sci. Total Environ. 2016, 573, 1115–1124. [Google Scholar] [CrossRef]
- EEA Greenhouse Gases—Data Viewer. European Environment Agency. Available online: https://www.eea.europa.eu/data-and-maps/data/data-viewers/greenhouse-gases-viewer (accessed on 20 January 2024).
- European Commission. Communication from the Commission to the European Parliament, The European Council, The Council, The European Economic and Social Committee and The Committee of the Regions, Farm to Fork Strategy for a Fair, Healthy and Environmentally Friendly Food System; European Commission: Brussels, Belgium, 2020. [Google Scholar]
- Sikora, A. European Green Deal—Legal and financial challenges of the climate change. ERA Forum 2020, 21, 681–697. [Google Scholar] [CrossRef]
- Vanham, D.; Leip, A. Sustainable food system policies need to address environmental pressures and impacts: The example of water use and water stress. Sci. Total Environ. 2020, 730, 139151. [Google Scholar] [CrossRef] [PubMed]
- Taning, C.N.T.; Nezzetti, B.; Kleter, G.; Smagghe, G.; Baraldi, E. Does RNAi-Based Technology Fit within EU Sustainability Goals? Trends Biotechnol. 2021, 39, 644–647. [Google Scholar] [CrossRef] [PubMed]
- Riccaboni, A.; Neri, E.; Trovarelli, F.; Pulselli, R.M. Sustainability-oriented research and innovation in “farm to fork” value chains. Curr. Opin. Food Sci. 2021, 42, 102–112. [Google Scholar] [CrossRef]
- Emmerling, C.; Krein, A.; Junk, J. Meta-Analysis of Strategies to Reduce NH3 Emissions from Slurries in European Agriculture and Consequences from Greenhouse Gas Emissions. Agronomy 2020, 10, 1633. [Google Scholar] [CrossRef]
- Nowakowicz-Dębek, B.; Wlazło, Ł.; Szymula, A.; Ossowski, M.; Kasela, M.; Chmielowiec-Korzeniowska, A.; Bis-Wencel, H. Estimating Methane Emissions from a Dairy Farm Using a Computer Program. Atmosphere 2020, 11, 803. [Google Scholar] [CrossRef]
- Tongwane, M.I.; Moeletsi, M.E. A review of greenhouse gas emissions from the agriculture sector in Africa. Agric. Syst. 2018, 166, 124–134. [Google Scholar] [CrossRef]
- Mittenzwei, K. Greenhouse Gas Emissions in Norvegian Agriculture: The Regional and Structural Dimension. Sustainability 2020, 12, 2506. [Google Scholar] [CrossRef]
- Testa, S.; Nielsen, K.R.; Vallentin, S.; Ciccullo, F. Sustainability-oriented innovation in the agri-food system: Current issues and the road ahead. Technol. Forecast. Soc. Change 2022, 179, 121653. [Google Scholar] [CrossRef]
- Gerber, P.J.; Steinfeld, H.; Henderson, B.; Mottet, A.; Opio, C.; Dijkman, J.; Falcucci, A.; Tempio, G. Tackling Climate Change Through Livestock: A Global Assessment of Emissions and Mitigation Opportunities; Food and Agriculture Organization of the United Nations (FAO): Rome, Italy, 2013. [Google Scholar]
- Yadav, B.; Singh, G.; Wankar, A.; Dutta, N.; Chaturvedi, V.; Verma, M.R. Effect of simulated heat stress on dugestibility, methane emission and metabolic adaptability in crossbred cattle. Asian-Australas. J. Anim. Sci. 2016, 29, 1585. [Google Scholar] [CrossRef] [PubMed]
- FAO—Food and Agriculture Organization of the United Nations. Greenhouse Gas Emissions from the Dairy Sector. 2010. Available online: https://www.fao.org/docrep/012/k7930e/k7930e00.pdf (accessed on 20 January 2024).
- Caro, D.; Davis, S.J.; Bastianoni, S.; Caldeira, K. Global and Regional Trends in Greenhouse Gas Emissions from Livestock. Clim. Change 2014, 126, 203–216. [Google Scholar] [CrossRef]
- Tedeschi, L.O.; Abdalla, A.L.; Ivarez, C.; Anuga, S.W.; Arango, J.; Beauchemin, K.A.; Becquet, P.; Berndt, A.; Burns, R.; De Camillis, C.; et al. Quantification of methane emitted by ruminants: A review of methods. J. Anim. Sci. 2022, 100, skac197. [Google Scholar] [CrossRef]
- Climate Change. Synthesis Report. Contribution of Working Groups I, II and III to the Fifth Assessment Report of the Intergovernmental Panel on Climate Change 2014, IPCC Geneva, 151. Available online: https://www.ipcc.ch/site/assets/uploads/2018/05/SYR_AR5_FINAL_full_wcover.pdf (accessed on 20 January 2024).
- Annual European Union Greenhouse Gas Inventory 1990–2020 and Inventory Report 2022. Submission to the UNFCCC Secretariat. European Environment Agency, 27 May 2022. Available online: https://www.eea.europa.eu/publications/annual-european-union-greenhouse-gas-1 (accessed on 6 April 2024).
- Tomasula, P.M.; Nutter, D.W. Mitigation of greenhouse gas emissions in the production of fluid milk. Adv. Food Nutr. Res. 2011, 62, 41–88. [Google Scholar] [CrossRef] [PubMed]
- EPA Sustainable Research Strategy. Office of Research and Development, US Environmental Protection Agency, Washington, DC. 2009. Available online: http://www.epa.gov/Sustainability/pdfs/EPA-12057_SRS_R4-1.pdf (accessed on 20 January 2024).
- Sieczko, L.; Koloszko-Chomentowska, Z. Relationship between economic and ecological indicators and greenhouse gas emissions: The perspective of farms in Poland at the regional level. Econ. Environ. 2023, 3, 382–395. [Google Scholar] [CrossRef]
- Goopy, J.P.; Chang, C.; Tomkins, N. A Comparison of Methodologies for Measuring Methane Emissions from Ruminants; Springer eBooks: Berlin/Heidelberg, Germany, 2016; pp. 97–117. Available online: https://samples.ccafs.cgiar.org/wp-content/uploads/2015/06/Chapter-52.pdf (accessed on 20 January 2024).
- Van Groenigen, J.W.; Schils, R.L.M.; Velthof, G.L.; Kuikman, P.J.; Oudendag, D.A.; Oenema, O. Mitigation strategies for greenhouse gas emissions from Animals production systems: Synergy between measuring and modelling at different scales. Aust. J. Exp. Agric. 2008, 48, 46–53. [Google Scholar] [CrossRef]
- Ellis, J.l.; Bannink, A.; France, J.; Kebreab, E.; Gijkstra, J. Evaluation of enteric methane prediction equations for dairy cows used in whole farms models. Glob. Change Biol. 2010, 16, 3246–3256. [Google Scholar] [CrossRef]
- Krajowy Raport Inwentaryzacyjny 2023. In Inwentaryzacja Emisji i Pochłaniania Gazów Cieplarnianych w Polsce dla lat 1988–2021; KOBiZE: Warszawa, Poland, 2023.
- Wiśniewski, P. Ocena wielkości emisji gazów cieplarnianych ze źródeł rolniczych na poziomie lokalnym w Polsce. Rocznik Ochrona Środowiska 2018, 20, 1811–1829. [Google Scholar]
- D’Aurea, A.P.; da Silva Cardoso, A.; Guimaraes, Y.S.R.; Fernandes, L.B.; Ferrieira, L.E.; Reis, R.A. Mitigating greenhouse gas emissions from beef cattle production in Brazil through animal management. Sustainability 2021, 13, 7207. [Google Scholar] [CrossRef]
- Garnett, T. Livestock- related greenhouse gas emissions: Impacts and options for policy makers. Environ. Sci. Policy 2009, 12, 491–503. [Google Scholar] [CrossRef]
- EPA. Global Anthropogenic Non-CO2 Greenhouse Gas Emissions: 1990–2030. Final report 2011; p. 182. Available online: http://www.epa.gov/climatechange/EPAactivities/economics/nonco2projections.html (accessed on 20 January 2024).
- Statistical Yearbook of the Republic of Poland; GUS: Warsaw, Poland, 2022.
- U.S. Environmental Protection Agency (EPA). Inventory of U.S. Greenhouse Gas Emissions and Sinks: 1990–2019; EPA: Washington, DC, USA, 2021.
- Rebolledo-Leiva, R.; Angulo-Meza, L.; Iriarte, A.; Gonzalez-Araya, M.C. Joint carbo footprint assessment and data envelopment analysis for the reduction of greenhouse gas emissions in agriculture production. Sci. Total Environ. 2017, 593–594, 346. [Google Scholar] [CrossRef]
- Khan, M.T.; Ali, Q.; Ashfag, M. The nexus between greenhouse gas emission, electricity production, renewable energy and agriculture in Pakistan. Renew. Energy 2018, 118, 437–451. [Google Scholar] [CrossRef]
- Zafeiriou, E.; Mallidis, I.; Galanopoulas, K.; Arabatzis, G. Greenhouse Gas Emissions and Economic Performance in EU Agriculture; An Empirical Study in a Non-Linear Framework. Sustainability 2018, 10, 3837. [Google Scholar] [CrossRef]
- Koloszko-Chomentowska, Z.; Sieczko, L.; Trochimczuk, R. Production profile of farms and methane and nitrous oxside emissions. Energies 2021, 14, 4904. [Google Scholar] [CrossRef]
- Polski FADN. Available online: https://fadn.pl/wp-content/uploads/2012/12/RICC-882-rev9.2-Definitions-of-Variables.pdf (accessed on 20 January 2024).
- Piekut, K.; Machnacki, M. Ocena ekologiczno-ekonomiczna gospodarstw rolnych na podstawie danych FADN. Woda Sr. Obsz. 2011, 11, 203–219. [Google Scholar]
- Syp, A.; Osuch, D. Szacowanie emisji gazów cieplarnianych na podstawie danych FADN. Studia i Raporty IUNG-PIB 2017, 52, 69–82. Available online: http://www.iung.pl/sir/zeszyt52_6.pdf (accessed on 15 December 2023).
- Harasim, A. Metoda oceny zrównoważonego rozwoju rolnictwa na poziomie gospodarstwa rolnego. Studia i Raporty IUNG-PIB 2013, 32, 25–75. Available online: https://iung.pl/wp-content/uploads/2009/10/zesz32.pdf (accessed on 20 January 2024).
- Sobczyński, T. Zmiany poziomu zrównoważonego gospodarstw rolnych UE w latach 1989–2005. Rocz. Nauk Rol. Ser. G. 2008, 94, 106–114. [Google Scholar] [CrossRef]
- Castoldi, N.; Bechini, L. Intergated sustainability assesment of cropping systems with agro-ecological and economic indicators in northern Italy. Eur. J. Agron. 2010, 32, 59–72. [Google Scholar] [CrossRef]
- Belanger, V.; Vanasse, A.; Parent, D.; Allard, G.; Pellerin, D. Delta: An integrated indicato—Based self-assessment tool for the evaluation of dairy farms sustainability in Quebec Canada. Agroecol. Sustain. Food Syst. 2015, 39, 1022–1046. [Google Scholar] [CrossRef]
- Escribano, A.J.; Gaspar, J.P.; Mesias, F.J.D.; Moreno, A.F.P.; Escribano, M. A sustainability assesment of organic and conventional beef cattle farms in agroforestry system: The case of the „dehesa” rangelands. ITEA—Informacion Tecnica Economica Agraria 2014, 110, 343–367. Available online: http://bazy.pb.edu.pl:2101/full_record.do?product=UA&search_mode=GeneralSearch&qid=11&SID=W2Wfvl6B (accessed on 20 January 2024).
- Paracchini, M.L.; Bulgheroni, C.; Borreani, G.; Tabacco, E.; Banterle, A.; Bertoni, D.; Rossi, G.; Parolo, G.; Origgi, R.; De Paola, C. A diagnostics system to assess sustainability at a farm level: The SOSTARE model. Agric. Syst. 2015, 133, 35–53. [Google Scholar] [CrossRef]
- Prus, P. Sustainable farming production and its impact on the natural environment—Case study based on a selected group of farms. In Proceedings of the 8th International Scientific Conference on Rural Development—Bioeconomy Challenges, Kaunas, Lithuania, 23–24 November 2017; pp. 1280–1285. [Google Scholar] [CrossRef]
- Ji, E.S.; Park, K.-H. Methane and Nitrous Oxide Emissions from Livestock Agriculture in 16 Local Administrative Districts of Korea. Asian-Australas J. Anim. Sci. 2012, 25, 1768–1774. [Google Scholar] [CrossRef]
- Yue, Q.; Xu, X.; Hiller, J.; Cheng, K.; Pan, G. Mitigating greenhouse gas emissions in agriculture: From farm productin to food consumption. J. Clean. Prod. 2017, 149, 1011–1019. [Google Scholar] [CrossRef]
- IPCC. Guidelines for National Greenhouse Gas Inventories; The Institute for Global Environmental Strategies (IGES) for the IPCC: Geneva, Switzerland, 2006; Available online: https://www.ipcc.ch/report/2006-ipcc-guidelines-for-national-greenhouse-gas-inventories/ (accessed on 20 January 2024).
- Dick, J.; Smith, R.; Lilly, A.; Moxey, A.; Booth, J.; Campbell, C.; Coulter, D. Calculating Farm Scale Greenhouse Gas Emissions; January 2008. Available online: https://www.researchgate.net/publication/267383297 (accessed on 20 January 2024).
- Seber, W.G.A. Multivariate Observations; Wiley & Sons: Hoboken, NJ, USA, 1984. [Google Scholar]
- Morrison, D. Wielowymiarowa Analiza Statystyczna; PWN: Warszawa, Poland, 1990. [Google Scholar]
- Duer, I.; Fotyma, M.; Madej, A. Kodeks Dobrej Praktyki Rolniczej; MRiRW-MŚ-FAPA: Warszawa, Poland, 2002. [Google Scholar]
- Beukes, P.C.; Gregorini, P.; Romera, A.J.; Levy, G.; Waghorn, G.C. Improving production efficiency as a strategy to mitigate greenhouse gas emissions on pastoral dairy farms in New Zealand. Agric. Ecosyst. Environ. 2010, 136, 358–365. [Google Scholar] [CrossRef]
- O’Hara, J.K. State-level trends in the greenhouse gas emission intensity of US milk production. J. Dairy Sci. 2023, 106, 5474–5484. [Google Scholar] [CrossRef]
- Lapple, D.; Carter, C.A.; Buckley, C. EU milk quota abolition dairy expansion and greenhouse gas emissions. Agric. Econ. 2021, 53, 125–142. [Google Scholar] [CrossRef]
- Wolf, P.; Groen, E.A.; Berg, W.; Prochnow, A.; Bakkers, E.A.M.; Heijungs, R.; de Boer, I.J.M. Assessing greenhouse gas emissions of milk production: Which parameters are essential? Int. J. Life Cycle Assess. 2017, 22, 441–455. [Google Scholar] [CrossRef]
- Zehetmeier, M.; Baudracco, J.; Hoffmann, H.; Heissenhuber, A. Does increasing milk yield per cow reduce greenhouse gas emissions? A system approach. Animal 2012, 6, 154–166. [Google Scholar] [CrossRef]
- Common Agricultural Policy and Climate. In Half of EU Climate Spending but Farm Emissions are not Decreasin; Special Report; European Court of Auditors: Luxembourg, 2021; Available online: www.eca.europa.eu/lists/ecadocuments/sr21_16/sr_cap-and-climate_en.pdf (accessed on 20 January 2024).
- Brade, V.W.; Daemmgen, U.; Lebzien, P.; Flachowsky, G. Milk production and emissions of greenhouse gases. Berichte Uber Landwirtsch. 2008, 86, 445–460. [Google Scholar]
- Mei, K.; Wang, Z.; Huang, H.; Zhang, C.; Shang, X.; Dahlgren, R.A.; Zhang, M.; Xia, F. Stimulation of N2O emission by conservation tillage management in agricultural lands: A meta-analysis. Soil Tillage Res. 2018, 182, 86–93. [Google Scholar] [CrossRef]
- Kärkkäinen, L.; Lehtonen, H.; Helin, J.; Lintunen, J.; Peltonen-Sainio, P.; Regina, K.; Uusivuori, J.; Packalen, T. Evaluation of policy instruments for supporting greenhouse gas mitigation efforts in agricultural and urban land use. Land Use Policy 2000, 99, 104991. [Google Scholar] [CrossRef]
- Shakoor, A.; Shakoor, S.; Rehman, A.; Ashraf, F.; Abdullah, M.; Shahzad, S.M.; Farooq, T.H.; Ashraf, M.; Manzoor, M.A.; Altaf, M.M.; et al. Effect of animal manure, crop type, climate zone and soil attributes on greenhouse gas emissions from agricultural soil—A global meta-analysis. J. Clean. Prod. 2021, 278, 124019. [Google Scholar] [CrossRef]
- Allen, B.; Marechal, A. Agriculture GHG Emissions Determining the Potential Contribution to the Effort Sharing Regulation; Report Prepared for Transport and Environment; Institute for European Environmental Policy: London, UK, 2017; Available online: www.transportenvironment.org/wp-content/uploads/2021/07/2017_IEEP_Agriculture_mitigation_potential_in_ESR_final.pdf (accessed on 20 January 2024).
- Kuś, J. Glebowa materia organiczna—Znaczenie zawartość i bilansowanie. Studia i Raporty IUNG-PIB 2015, 45, 27–53. [Google Scholar] [CrossRef]
- Ren, C.; Liu, S.; van Grinsven, H.; Reis, S.; Jin, S.; Liu, H.; Gu, B. The impact of farm size on agricultural sustainability. J. Clean. Prod. 2019, 220, 357–367. [Google Scholar] [CrossRef]
- Blandford, D.; Gaasland, I.; Vardal, E. Extensification versus Intensification in Reducing Greenhouse Gas Emissions in Agriculture: Insights from Norway. Eurochoices 2013, 12, 4–9. [Google Scholar] [CrossRef]
- Ariva, J.; Viira, A.H.; Poldaru, R.; Roots, J. Medium-run projections for greenhouse gas emissions: Arising from agriculture: The case of milk production in Estonia. Agric. Food Sci. 2015, 24, 300–312. [Google Scholar] [CrossRef]
- Wąs, A.; Kobus, P.; Witajeski-Baltvilks, J.; Krupin, V.; Pyrka, M.; Jeszke, R.; Cygler, M. Polska Net-Zero 2050. Wybrane Instrumenty Wdrażania Polityki Klimatycznej w Sektorze Rolnictwa w Perspektywie Roku 2025; KOBiZE: Warszawa, Poland, 2022; Available online: https://climatecake.ios.edu.pl/wp-content/uploads/2022/06/CAKE_instrumenty-redukcji-w-rolnictwie-PL_27 (accessed on 20 January 2024).
Disclaimer/Publisher’s Note: The statements, opinions and data contained in all publications are solely those of the individual author(s) and contributor(s) and not of MDPI and/or the editor(s). MDPI and/or the editor(s) disclaim responsibility for any injury to people or property resulting from any ideas, methods, instructions or products referred to in the content. |
© 2024 by the authors. Licensee MDPI, Basel, Switzerland. This article is an open access article distributed under the terms and conditions of the Creative Commons Attribution (CC BY) license (https://creativecommons.org/licenses/by/4.0/).