Article

Techno-Economic Evaluation of Jet Fuel Production via an Alternative Gasification-Driven Biomass-to-Liquid Pathway and Benchmarking with the State-of-the-Art Fischer–Tropsch and Alcohol-to-Jet Concepts

by
Nikolaos Detsios
1,2,*,
Leda Maragoudaki
1,
Stefano Rebecchi
3,
Koen Quataert
3,
Karel De Winter
3,
Vassilis Stathopoulos
2,
Nikolaos G. Orfanoudakis
2,
Panagiotis Grammelis
1,* and
Konstantinos Atsonios
1
1
Centre for Research & Technology Hellas, Chemical Process and Energy Resources Institute, 6th km. Charilaou-Thermis, GR 57001 Thermi, Greece
2
Department of Agricultural Development, Agri-Food and Natural Resources Management—Evripos Campus, National & Kapodistrian University of Athens, GR 34400 Evia, Greece
3
Bio Base Europe Pilot Plant VZW, Rodenhuizekaai 1, BE 9042 Gent, Belgium
*
Authors to whom correspondence should be addressed.
Energies 2024, 17(7), 1685; https://doi.org/10.3390/en17071685
Submission received: 29 February 2024 / Revised: 24 March 2024 / Accepted: 27 March 2024 / Published: 1 April 2024
(This article belongs to the Special Issue Production of Sustainable Aviation Fuels (SAF) from Renewable Sources)

Abstract

:
Around 65% of the mitigation needed for the targeted net-zero carbon aviation emissions in 2050 is expected to come from Sustainable Aviation Fuels (SAFs). In this study, an alternative gasification-driven Biomass-to-Liquid (BtL) concept for the production of SAFs is introduced and evaluated. In particular, a fuel synthesis scheme based on the double-stage fermentation of the produced syngas (syngas → acetic acid → TAGs) is assessed instead of the conventional Fischer-Tropsch (FT) or Alcohol-to-Jet (AtJ) synthesis. The objective of the present work is the techno-economic evaluation of a large-scale (200 MWth) replication of the mentioned BtL concept, whose performance has been simulated in Aspen PlusTM (V.11) with reasonable upscaling considerations and models validated at a pilot scale. The estimated baseline Total Capital Investment (TCI) of €577 million lies in the typical range of €500–700 million that many recent techno-economic studies adopt for gasification-driven BtL plants of similar capacity, while the estimated annual operating costs of €50 million correspond to a 15–40% OpEx reduction compared to such plants. A discounted cash flow analysis was carried out, and a baseline Minimum Jet Selling Price (MJSP) equal to 1.83 €/L was calculated, while a range of 1.38–2.27 €/L emerged from the sensitivity analysis. This study sets the biological conversion of gasification-derived syngas into triglycerides (TAGs) as a promising alternative route for the production of SAFs. In general, gasification-driven BtL pathways, led by the relatively mature FT and AtJ technologies, are capable of thriving in the coming years based on their capability of advanced feedstock flexibility.

1. Introduction

The aviation industry is considered a constantly and rapidly expanding sector despite the shock to air travel that the COVID-19 pandemic delivered. The International Air Transport Association (IATA) claims that the request for air connectivity will continue to grow. Indicatively, the recovery of international air traffic, following its COVID-19 low point in 2020, accelerated in 2021 and 2022, while in the first quarter of 2023 reached 81.6% of 2019 levels, which were the highest ever measured (more than 4 billion passengers and 64 million tons of cargo). The increasing demands of air traffic lead to increasing demands of aviation fuels (jet fuels). The extensive use of petroleum-derived jet fuels has turned the aviation sector into one of the biggest sources of transport GHG emissions, second only to road transport and responsible for around 4% of the total current GHG emissions. The Paris Agreement’s objectives related to climate change put aviation, along with other sectors, under great pressure and environmental inspection [1,2,3].
At the 77th Annual General Meeting of IATA in 2021, IATA member airlines agreed to commit to net-zero carbon emissions by 2050 to limit the aviation industry’s contribution to global warming. IATA has identified the production of sustainable aviation fuels (SAFs) as the most promising strategy to reduce the environmental impact of the sector. SAFs refer to completely interchangeable substitutes (drop-in) for conventional petroleum-derived jet fuel (i.e., Jet A or Jet A-1) that are produced from sustainable resources (e.g., biogenic feedstock, renewable hydrogen + CO2). The fact that no adaptations are required for the existing fuel systems (i.e., engines, fuel distribution network) establishes SAFs as the key driver in realizing secure and decisive decarbonization of the aviation field. Around 65% of the mitigation needed for net-zero carbon emissions in 2050 is expected to come from SAFs. Indicatively, in 2022, the global SAF production reached around 300 million liters (a 200% increase compared to 2021), and airlines purchased all available quantities of SAF. Hydrogen aviation or electrification requires deep and comprehensive changes in the industry and can only be considered as a long-term alternative [4,5].
Hydroprocessed esters and fatty acids (HEFA), Fischer–Tropsch (FT), Alcohol-to-Jet (AtJ), and Power-to-Liquid (e-jet) are the identified leading SAF technologies towards the targeted fuel transition of the aviation sector. The latest EU proposal, ‘ReFuelEU Aviation’ [6], highlights the key role of HEFA, FT, AtJ, and e-fuels in the emerging jet fuel market. So far, only biofuels (HEFA, FT, AtJ) have secured ASTM certification for commercial use (via blending), while HEFA is currently the only market-proven pathway. E-jet pathways currently struggle to present affordable production costs, but projections for rapid reductions in hydrogen and green electricity prices form a promising future. HEFA jet fuel produced from waste fats, oils, and greases (FOGs) is the most cost-competitive option and is expected to remain the most efficient pathway, at least until 2030. However, the limited supply of feedstock and lack of cultivation areas turn HEFA into a feedstock-constrained pathway that is unable on its own to support the needs of a large-scale fuel transition. Therefore, there are reasonable claims that the next two decades will be dominated by technologies handling advanced feedstock (e.g., biogenic residues/wastes), such as FT and AtJ. The main challenge related to these technologies is the reduction of production costs since the current Biomass-to-Liquid (BtL) pathways usually involve intense capital and operational expenses [7,8,9,10].
The low energy density (due to high oxygen content) and the corrosive nature of pyrolysis bio-oil or the high costs (catalysts, high pressures) of liquefaction have established biomass gasification as the most cost-effective and efficient technology for residual biomass to bio-energy [11,12,13]. Nowadays, FT and AtJ are justifiably the dominant emerging gasification-driven BtL technologies, but the strict specifications of FT (i.e., extended gas-cleaning requirements, high temperatures/pressures) or the several unit operations (i.e., fermentation, dehydration, oligomerization) of AtJ usually lead to high production costs. In this study, an alternative gasification-driven BtL concept for the production of drop-in aviation fuels is introduced and evaluated. In particular, a fuel synthesis scheme based on the double-stage fermentation of the produced syngas is examined instead of the conventional FT or AtJ (via ethanol) synthesis, aiming to establish a competitive BtL technology characterized by mild operating temperatures, low pressures, and potentially reduced costs.
The suggested process chain can be divided into three distinct parts: the thermochemical, the biological, and the thermocatalytic. Concerning the first (thermochemical) part, a Dual Fluidized Bed Gasification (DFBG) unit is considered for the syngas production from biogenic residues followed by a catalytic tar reformer, while for the second (biological) part, a double-stage syngas-to-acetate-to-triglycerides (TAGs) fermentation unit is involved accompanied by a lipids extraction and purification system. The last (thermocatalytic) part refers to the hydrotreatment unit where the obtained TAGs are upgraded into drop-in liquid fuels. The European Horizon 2020 project BioSFerA [14] has undertaken the realization, optimization, implementation at a pilot scale, and scaling up evaluation of the described concept. Extensive conceptualization and design considerations of the novel BtL scheme have been performed [15], while the beneficial environmental impact of the whole process is reflected in 50–80% GHG emission reductions compared to conventional (fossil) routes [16].
The objective of the present study is the comprehensive techno-economic evaluation of this innovative 200 MWth BtL plant, whose performance has been simulated with reasonable upscaling considerations and models validated at a pilot scale. Appropriate business scenarios are developed, and the main capital and operational costs of the concept are estimated. Moreover, sensitivity analysis on multiple operational aspects is performed for the identification of the main cost-drivers of the process. Finally, the financial competitiveness of the technology compared to the current dominant SAF pathways is assessed.

2. Materials and Methods

2.1. Process Description

This section provides an overview of the examined BtL process. The concept was initially defined in [15], where multiple design considerations were thoroughly examined. The technical maturation of the technology via performed experimental activities throughout the value chain during the BioSFerA project [14] enables an updated and more valid integration scheme.
The main operating principles and conditions of each sub-process are presented along with the elected block flow of the integrated BtL concept, while a more detailed Process Flowsheet Diagram (PFD) with the key stream results can be found in the Supplementary Materials (Section A).

2.1.1. Thermochemical Part

The conversion of the biomass feedstock into syngas is carried out with the Dual Fluidized Bed Gasification (DFBG) technology. The DFBG system consists of two interconnected CFB (Circulating Fluidized Bed) reactors, the gasifier (fuel reactor) and the oxidizer (air reactor). The steam that enters the gasifier is generated via the thermal utilization of hot syngas, while the flue gases from the oxidizer are used for the pre-heating of the air that enters the air reactor. Both hot streams (i.e., syngas and flue gas) may be available for further thermal exploitation in a Heat Recovery Steam Generator (HRSG).
The gasification reactions take place in the gasifier, while the produced char, other residues (i.e., ash), and part of the bed material are transported to the oxidizer, where they react with the oxidizing medium (i.e., air) to produce heat. The (hotter) bed material returns to the gasifier, serving as the heating medium for the endothermic steam gasification reactions. The produced raw syngas is filtered at the exit temperature of the gasifier and subsequently catalytically reformed. The remarkable content of light hydrocarbons, along with the non-negligible tars production, indicate the need for catalytic reforming in the downstream process of BtL applications in order to avoid tar-related operational problems and enhance the H2, CO syngas content. The autothermal reformer (ATR) is heated by partial syngas combustion with air, and in addition, the reforming reactions consume steam and/or CO2. The primary function of the catalytic reformer may be to convert tars and hydrocarbon gases to H2 and CO, but it can also be modified to attain several targets relating to the syngas purification requirements for the subsequent fermentation process. For example, the reformer can be designed to largely decompose ammonia (NH3) or hydrogen cyanide (HCN), especially the latter, which has turned out to be a major contaminant causing inhibition of the fermentation bacteria. The latest pilot trials [17] regarding the minimization of gas cleaning steps prior to the biological part revealed that an alkaline scrubber provides sufficient removal of targeted contaminants (mainly H2S and HCN) and secures the desired syngas fermentation efficiency.
The main operating conditions for the thermochemical part are presented in Table 1.

2.1.2. Biological Part

In the first step of the biological part of the process, the interaction of syngas with the acetogenic bacteria under anaerobic conditions leads to acetic acid (acetate) production. For the syngas fermentation stage, after the extended experimental testing, Moorella thermoacetica DSM 2955 was selected as the most efficient acetate producer strain [18]. The operating temperature is set around 55 °C since the optimal temperature range for these strains is 55–60 °C [19]. The operating pressure of the reactor was considered to be 5 bar in order to achieve higher solubility of the reacting gases. Two critical factors that highly influence the fermentation kinetics and, consequently, the acetate productivity are the gas solubility and the ratios of CO2/CO/H2. The unconverted syngas components (off-gas) can be either recycled back to the fermenter or utilized elsewhere in the plant (see Section 2.1.4). The broth containing the produced acetate in low concentration is extracted in a continuous way, and the liquid volume is kept constant by adding a fresh culture medium. A cell recycling system (hollow fiber membrane) is required to keep the cells in the fermenter while extracting the liquid effluent.
The second fermentation step refers to the production of triglycerides (TAGs) via aerobic fermentation of the diluted acetic acid stream (liquid fermentation). Taking into account the relevant experimental trials, Yarrowia lipolytica is the yeast strain that has been selected to be involved in the liquid substrate fermentation of acetate [20,21]. The diluted acetate effluent stream from the syngas fermentation enters the aerobic fermenter, where the targeted TAGs are formed as intracellular products in the presence of oxygen, additional nutrients, salts, and the oleaginous yeast (Y. lipolytica). A cell recycle system (hollow fiber membrane) can be installed to recirculate the cellular biomass in the bioreactor while extracting the spent effluent. At the same time, a gaseous CO2-rich stream is produced and leaves the bioreactor from the top.
Lipids extraction from the oleaginous yeasts is an important step before hydrotreatment. As oleaginous yeasts present in the fermentation broth store lipids in intracellular forms, extraction is required to obtain the TAGs. Cell disruptions alongside lipid extraction steps are critical for large-scale biofuel production in terms of cost adequacy. Mechanical disruption requires energy inputs such as shear forces, electrical pulses, waves, or heat. Mechanical processes generally provide high product recovery yields with good management and scalability, but they are energy-intensive. Among the options actually available, there are novel technologies with considerably lower power consumption, such as steam explosion, centrifugation, and membrane separation, considering different process parameters and extraction procedures. For the suggested concept, based on the insights gained in relevant experimental activities [22], a scalable DSP (downstream processing) train based on steam explosion, microfiltration, and centrifugation was defined for efficient lipids recovery from the fermentation broth. In steam explosion, raw material is exposed to steam at 150–240 °C for several minutes and then subjected to depressurization to ambient conditions. This generates an explosion that causes cell wall disruption. Low pressure and temperature (about 5 bar and 150 °C) seem preferable for steam explosion in order to avoid TAG disruption. Microfiltration/centrifugation has been positively evaluated for its ability to separate oil from the broth deriving from steam explosion. Finally, it has to be noticed that difficulties associated with the formation of emulsions can moderate the TAGs recovery effectiveness.
The main operating conditions for the biological part are presented in Table 2.

2.1.3. Thermocatalytic Part

The final section of the suggested value chain includes the upgrading of microbial oil (TAGs) into drop-in aviation biofuel. The core of the thermocatalytic part of the concept is the hydrotreatment unit, where the consecutive hydrogenation, deoxygenation, isomerization, and fractionation procedures of the purified TAGs take place. Common catalysts for this process are Pt, Ni, or other metals based on Al2O3.
In particular, the saturated fatty acids are converted to straight long-chain alkanes by hydrodeoxygenation and decarboxylation, co-producing propane, methane, water, CO, and CO2. The deoxygenated straight-chain paraffins are selectively hydrocracked or isomerized, yielding highly branched alkanes. The resulting organic product is a mixture of straight and branched CnH2n+2 that can be suitably used as a drop-in liquid fuel.
The main operating conditions for the thermocatalytic part are presented in Table 3.

2.1.4. Integrated Biomass-to-Liquid (BtL) Process Chain

Taking into account the extensive conceptualization and design considerations that are available in [15] as well as the findings from the experimental activities of each sub-process, the integrated process chain was elected, targeting the greatest possible performance and cost efficiency [23]. The optimized configuration of the integrated BtL concept is illustrated in Figure 1.
The major aspects of the integrated concept are:
  • Utilization of the off-gas (unreacted gas) of the anaerobic fermentation (gas fermentation) in the oxidizer of the DFBG unit → higher gasification efficiency, avoidance of technical barriers related to internal gas recycling in the bioreactor (i.e., inerts/contaminants accumulation);
  • Internal hydrogen extraction (and supply to the hydrotreatment unit) from the off-gas of the anaerobic fermentation via PSA (Pressure Swing Adsorption) → avoidance of such an energy/cost-consuming unit like an electrolyzer;
  • Air-driven autothermal reforming of syngas hydrocarbons instead of oxygen-driven, since in the absence of gas recycling in the bioreactor, some nitrogen content in the reformed gas would not be a critical problem → avoidance of operational costs related to the external purchase of industrial oxygen.

2.2. Model Validation

The process model was developed in the commercial software Aspen PlusTM. The simulations were performed at full-scale (200 MWth), and the selected feedstock was crushed bark, the main specifications of which are provided in the Supplementary Materials (Section B). Every available experimental activity was taken into account for the validation of the process. The aim is to enhance the fidelity of the model and the effectiveness of the concept design.

2.2.1. Dual Fluidized Bed Gasification (DFBG)

The actual DFBG pilot runs (200 kWth) performed by VTT [24], as well as the upscaling considerations and full-scale simulations (100 MWth) performed by Sumitomo SHI FW [25] were utilized in order to assess the reliability of the 200 MWth DFBG model that serves the scope of the present study. Thus, Figure 2 presents the correlation between the actual pilot tests (200 kWth) by VTT, the 100 MWth simulations by SHI-FW, and the 200 MWth simulations of this study. The focus is given to the main syngas species (H2, CO, CO2, CH4). In all cases, authothermal DFBG operation was considered (no external fuel, 1% inherent heat losses).
The 200 MWth ‘syngas curve’ (red) matches well with the corresponding 100 MWth syngas composition (orange) simulated by SHI FW. The discrepancies between the simulated commercial applications and the actual pilot runs (blue) are mainly due to the increased nitrogen content (~20%) of the produced gas during the pilot tests. Due to the inherent constraints of a pilot configuration, some air is introduced in the gasifier during the DFBG pilot tests in order to ensure stable performance. This leads to an increased percentage of N2 in the produced gas. On the contrary, the share of purge nitrogen in potential commercial applications is smaller, and the produced syngas is of higher quality (nitrogen-free). As expected, the flue gas composition is almost identical for all three cases.
In summary, the 200 MWth DFBG model seems to be in good agreement with the SHI FW predictions (100 MWth) regarding the operation of a commercial DFBG system, and both large-scale simulation results follow in a logical way the actual experimental results (pilot tests). Thus, it can be considered a reliable tool for the full-scale process simulations of the concept.

2.2.2. Syngas Fermentation (Anaerobic Gas Fermentation)

The optimization of the gas fermentation model was based on data extracted from relevant experimental activities [17,19] as well as on literature studies for similar industrial processes (e.g., gas fermentation for ethanol production).
To represent the growth of the acetogenic bacteria (Moorella thermoacetica) taking place in the reactor, reactions (1) and (2) were added. The elemental formula for the bacteria was considered to be CH1.75O0.5N0.25 [26]. The acetic acid production was simulated by reactions (3) and (4). Based on the literature and the conducted fermentation tests that indicate negligible generation of by-products from M. thermoacetica, no by-product formation was considered in the model.
2 CO + 0.25 NH3 + 0.5 H2O → CH1.75O0.5N0.25 + CO2
CO2 + 2 H2 + 0.25 NH3 → CH1.75O0.5N0.25 + 1.5 H2O
4 CO + 2 H2O → CH3COOH + 2 CO2
2 CO2 + 4 H2 → CH3COOH + 2 H2O
A high gas utilization was assumed since, in large-scale reactors, the increased surface area, the enhanced mixing, the reduced concentration gradients, and the optimal process design allow for efficient gas transfer. Specifically, after reviewing the literature on gas fermentation for ethanol production [27,28], a 90% utilization percentage for CO and an 80% utilization percentage for H2 were selected. Moreover, the low quantity of unreacted syngas (off-gas) eliminates the need for installing a gas recycle system. Instead, it was decided to exploit the off-gas of the fermenter for the enhancement of the DFBG efficiency (see Section 2.1.4).
The applied conversion rates of the utilized gas are presented in Table 4. Non-utilized (unreacted) gas leaves the fermenter from the top.

2.2.3. Acetic Acid Fermentation (Aerobic Liquid Fermentation)

A similar approach for the optimization of the liquid fermentation model was adopted, wherein data were collected from the performed liquid fermentation tests [21,29] as well as from relevant literature studies on microbial oil production.
The fermentation broth from the gas fermenter containing 30 g/L acetic acid is sent directly to the liquid fermenter. The results obtained from the tests indicated that the oleaginous yeast could grow effectively on the broth deriving from the gas fermenter without the necessity of any purification steps. The liquid fermentation was divided into two phases: the growth phase and the lipid production phase. Reaction (5) was added for biomass formation (growth). The elemental formula for the yeast was considered to be CH1.66O0.54N0.14. Reactions (6)–(9) describe the intracellular lipid production phase. Triolein (C57H104O6), tripalmitin (C51H98O6), trilinolein (C57H98O6), and tristearin (C57H110O6) were selected as the representative TAGs produced during this phase.
CH3COOH + 0.908 O2 + 0.147 NH3 → 1.05 CH1.66O0.54N0.14 + 0.95 CO2 + 1.349 H2O
59 CH3COOH + 38 O2 → C57H104O6 + 61 CO2 + 66 H2O
50.11 CH3COOH + 27.72 O2 → C51H98O6 + 49.22 CO2 + 51.22 H2O
62 CH3COOH + 45.5 O2 → C57H98O6 + 67 CO2 + 75 H2O
56 CH3COOH + 30.5 O2 → C57H110O6 + 55 CO2 + 57 H2O
The applied conversion rates of the acetic acid are presented in Table 5. The TAG representation and conversion rates have been set in a way to be consistent with the fatty acid distribution observed during available experimental tests [21] (Figure 3). The airflow rate for the two phases was regulated by the oxygen concentration in the off-gases, as measured during the tests.
In summary, the simulation results of the two-step fermentation process (gas fermentation and liquid fermentation) were compared and found to be consistent with the results obtained from the continuous fermentation tests. This fact indicates the reliability of the biological model that serves the full-scale simulations of the present study.

2.2.4. TAGs Hydrotreatment

For the validation of the hydrotreatment part, the model was updated and enriched with data obtained from the performed experimental activities [30] and data extracted from the literature.
The obtained liquid products are jet and diesel fractions. Appropriate catalytic system selection was assumed for maximization of the jet fraction (80% jet–20% diesel wt. %). The paraffinic composition of the two fuel fractions (as detailed in the Supplementary Materials, Table S3, streams 20 and 21) was based on relevant literature studies focusing on the production of jet-like and diesel-like fuels from hydrotreated oils [31,32,33]. The simulated jet and diesel fuels resulted in Lower Heating Values (LHVs) of 44.4 MJ/kg and 43.8 MJ/kg, respectively. Table 6 provides information on the properties of jet fuel stream deriving from fractionation of the hydrotreated oil, as calculated in Aspen PlusTM, along with the respective specifications for commercial Jet A-1.
As can be seen, the obtained jet fuel stream simulated the targeted fuel relatively well, with most of its properties meeting the specifications for Jet A-1. This can be considered as a form of validation for the model. Moreover, it has to be pointed out that the simulated jet stream consists only of normal paraffins. Although these paraffinic fuel fractions form a solid basis for the representation of the targeted drop-in fuels, the actual drop-in fuels usually also contain iso-paraffins, cycloparaffins, and aromatics in order to meet the necessary standards for safe and efficient use in jet engines.

2.3. Energy and Mass Balance

The Heat and Mass balances of the overall value chain were solved, and the overall performance of the concept was assessed via three critical factors:
  • Energetic Fuel Efficiency (EFE) is the fraction of the chemical energy in the initial feedstock that is transferred to the final fuels;
  • Carbon Utilization (CU) is the fraction of carbon in the initial feedstock that is converted to the final fuels;
  • Liquid Fuel mass yield is the mass flow ratio of liquid fuels (products) to biomass feedstock (feed).
The energy balance of the integrated concept is presented in Figure 4, and the carbon balance in Figure 5.
The estimated EFE from the full-scale simulations is measured at 35.6%. The main energy losses are observed in the double-stage fermentation, especially during the aerobic conversion of acetic acid into TAGs. Moreover, a non-negligible amount of the inlet energy (9.5%) seems to be required by the microorganisms (bacteria and yeast) for their growth. The re-utilization of the off-gases from the gas fermentation for the thermal assistance of the oxidizer leads to enhanced gasification efficiency. The presence of the DFBG unit (two hot outlet gas streams) ensures a remarkably useful excess heat content (17.5%) that can serve any further thermal requirements of the plant (e.g., steam generation for TAGs purification) apart from the pre-heating of air and steam. The obtained Carbon Utilization (CU) of the integrated BtL plant has been calculated equal to 25.4%. A large portion of the inlet carbon (67.9%) ends up in the form of CO2 either at the oxidizer outlet or at the outlet of the aerobic fermenter. The rest carbon ‘expenses’ of the process are minor and consist of the cellular biomass formation (5.6%) as well as the low organic content of wastewater (1.1%).
The electricity requirements of the entire process are estimated at 0.12 MWel/MWth of produced biofuel, mainly sourced from the compression unit prior to gas fermentation. The overall liquid fuel mass yield, expressed in kgproduct/kgfeed, is estimated at 0.134. A summary of the main mass and energy balances as derived from the full-scale process simulations is shown in Table 7.
Utilizing data from previous studies reported in the literature [34,35,36,37], it is evident that the investigated BtL pathway demonstrates competitive values in terms of liquid fuel productivity when compared to already certified technologies that exploit similar feedstock (i.e., FT, AtJ). The following techno-economic assessment of the concept aims to enable a more comprehensive and equitable comparison with the mentioned well-established biofuel production technologies.

2.4. Techno-Economic Analysis and Cost Estimation Methodology

The results of the mass and energy balances represent the basis for the cost estimation efforts. The discounted cash flow rate of return methodology is applied for the economic analysis. A cash flow analysis is performed in Microsoft Excel based on the estimated capital and operating costs. The Minimum Jet fuel Selling Price (MJSP) has been elected as the most suitable indicator for the assessment of the financial competitiveness of the concept as well as the direct comparison with other biofuel routes. The MJSP is obtained by iterating the jet fuel product cost to obtain a net present value (NPV) equal to zero at a specific discount rate.
For the estimation of the capital costs, all the critical equipment inside battery limits (ISBL) is considered. Simple equipment costs such as columns, compressors, pumps, heat exchangers, and flash drums are predicted by the Aspen PlusTM Economic Evaluator. On the contrary, the cost estimation for advanced equipment such as reactors and fermenters is based on data from relevant technical reports [34,38,39,40] and adaptations via equipment scaling exponents. The assumed prices are normalized to the year 2023, using the average annual CEPCI (Chemical Engineering Plant Cost Index) value (803.2) [41]. The validity of the claimed overall costs for the novel biological part is reinforced with their revision from appropriate industry experts (i.e., Biobase Europe Pilot Plant BBEPP) who provide their industrial insight into the aimed cost breakdown of the present study.
The purchased equipment, erection, piping, site improvements, instruments, control systems, and integration are taken into account for the calculation of the direct costs (Total Installed Costs—TIC). The indirect costs (IC), including engineering, contractors, legal fees, etc., are set as 60% of total direct costs. An additional 10% contingencies-oriented cost is applied to the sum of total direct and indirect costs (TDIC) in order to obtain the fixed capital investment (FCI). The total capital investment (TCI) of the project is subsequently determined as the FCI plus the working capital (10% of the FCI) [34,42]. The adopted methodology is presented in Table 8.
The annual operating costs are calculated by including the fixed costs (i.e., employee salaries, maintenance, property insurance) and the variable costs (i.e., feedstock costs, utilities, wastewater discharge, and by-product credits). For the fixed costs, maintenance (repair, catalyst replacement, etc.) was assumed to be 2% of the FCI, and property insurance was set at 0.7% of the FCI [34,38]. The variable annual costs are calculated using the results of the energy and mass balances combined with the market/literature values for the price of utilities, consumables, and disposal services. Revenue streams are generated from the selling of diesel and cellular biomass (yeast biomass) as valuable by-products. Yeast biomass, as derived from TAGs purification, can be utilized in various ways, such as fertilizers, animal feed, or for the enhancement of biogas production [43]. The complete list of consumables and prices, as well as the boundary conditions for the economic analysis, are presented in Table 9.

3. Results and Discussion

3.1. Cost Estimation Results

This section provides the results of the cost estimation process, starting with the TCI and continuing with the calculation of the annual operational financial streams that take part in the cash flow analysis.

3.1.1. Total Capital Investment

The breakdown of the capital costs of the BtL plant is presented in Table 10. Available technical reports [34,39,40] were considered for the cost estimation of the thermochemical part, while for the biological part, apart from available literature studies [51,52], appropriate acetic acid and TAGs productivities-volumes correlations were utilized for the election of the required number of bioreactors [23]. The capital cost for the thermocatalytic part (hydrotreatment/hydrocracking) was estimated as a function of the annual capacity (liquid products) by utilizing relevant technical reports [53,54]. The estimated direct costs of each section were rounded for convenience. A more detailed critical equipment list for each part, on which the estimation of the required capital expenses was based, is attached in the Supplementary Materials (Section C).
The required TCI for the establishment of a 200 MWth BtL plant is estimated at approximately €577 million. The largest proportion of the cost is incurred by the biological part, which represents 53% of the total installed costs. The assumed moderate productivities (3 g/L/h for acetic acid and 0.8 g/L/h for TAGs) for potential commercial applications, supported by relevant literature [55,56,57], led to a relatively large required number of bioreactors (30 fermenters) and subsequently increased capital costs. Costs can be divided among the steps of the biological part as 50% gas fermentation, 40% liquid fermentation, and 10% TAGs recovery. The thermochemical part accounts for 36% of the total installed costs, with DFBG getting the lion’s share (77%) of the relevant costs and the catalytic reformer (8%), gas conditioning (10%) as well as the gas compression unit (5%) combining for the remaining expenses of this part. Finally, the hydrotreatment unit represents 7% of the total installed costs, while the remaining 4% is attributed to storage/utilities. The presence of the hydrotreatment unit in an integrated BtL scheme comes up with design and cost benefits compared to standalone refineries, such as the avoidance of ‘heavy’ pre-treatment of the feed (TAGs) (since appropriate cleaning has been carried out in earlier stages of the value chain) or the avoidance of hydrogen production unit (since the required hydrogen is extracted internally from the off-gases of the biological part via PSA) (Figure 6).
The estimated TCI of €577 million lies in the typical range of €500–700 million that many recent techno-economic studies [58,59,60,61] adopt for the required capital investment of gasification-driven BtL concepts (FT or AtJ) of similar capacity. The path to the decisive reduction of capital costs aimed by the proposed pathway seems to go through the reduction of capital costs related to double-stage fermentation. The latter can be achieved by ensuring higher commercial productivities of acetic acid (>3.5 g/L/h) and TAGs (>1 g/L/h) formation.

3.1.2. Annual Operating Costs

Utilizing the mass and energy balances of the concept detailed in Section 2.3 (and Supplementary Materials) as well as the economic assumptions detailed in Section 2.4, the annual operational financial streams are calculated and presented in Table 11.
The estimated annual operational expenses are around €50 million. About 40% of these expenses appear to be covered by the revenue obtained from diesel and yeast biomass selling. The biomass supply (feedstock costs) represents the highest proportion (42%) of the annual operating costs. A remarkable percentage (21%) of the annual charges is due to fixed maintenance requirements as a result of the extensive infrastructure that accompanies almost every BtL concept that handles advanced feedstock. The low operating pressures of the biological part reflect limited electricity demand (for gas compression) and, consequently, cost, accounting for just 10% of the annual sum. The remaining 27% of the annual operating costs are sourced from employee compensation (labor costs), property insurance, the acquisition of necessary raw materials, and wastewater disposal fees (Figure 7).
The estimated annual operating costs of €50 million correspond to a 15–40% OpEx reduction compared to recent techno-economic studies of typical gasification-driven BtL plants [60,61,62,63]. This fact seems to justify the ambition of the present study to introduce a novel BtL scheme that enables reduced operational costs.

3.2. Minimum Selling Price

The minimum selling price or break-even price of a techno-economic evaluation represents the price at which the targeted product of the BtL process should be sold so that, at the end of the plant’s lifetime, its net present value is equal to zero.
For the main business case of the present study, in which jet fuel is the targeted product, a discounted cash flow analysis (Supplementary Materials—Table S8) was carried out by integrating all the above-mentioned cost estimations and a MJSP equal to 1.83 €/L was calculated.
The thermocatalytic part of the proposed value chain is, in essence, a HEFA plant with microbial oil (TAGs) as feedstock instead of other typical oils. Therefore, taking into account the advantage of the availability of such plants at the commercial level and the similarity of the produced microbial oil with typical HEFA feeds [30], an additional business case is introduced, in which the hydrotreatment of the produced microbial oil is performed in such an external plant. In this case, the crude microbial oil is the end product of the process, and the thermocatalytic part is excluded from the BtL concept and the capital investment. The rationale is not only the avoidance of the construction costs for a new refinery but also to take advantage of the large existing refining infrastructure and experience. In the absence of the hydrotreatment/hydrocracking unit, the estimated TCI of the microbial oil scenario drops to around €527 million, while the annual operating costs are slightly influenced since the majority of them are sourcing from the process steps prior to the hydrotreatment unit (Supplementary Materials—Section D). A discounted cash flow analysis for the microbial oil scenario was performed with the updated boundary conditions, and a Minimum Oil Selling Price (MOSP) equal to 1.32 €/L was obtained (Supplementary Materials—Table S9).
The TCI, the annual operating costs, and the mass balances that were utilized for the discounted cash flow analysis of each business case are presented in Table 12. The economic assumptions presented in Table 9 were kept common for both scenarios.

3.3. Sensitivity Analysis

Sensitivity analysis is probably the most critical aspect of the techno-economic analysis since it not only allows the impact evaluation of various process parameters on the financial performance of the concept but also limits, in a way, the effect of incorrect initial economic assumptions and sources of uncertainty. Section 3.3.1 is dedicated to the assessment of the influence that selected process parameters have on the MJSP formation. Section 3.3.2 presents the estimations regarding the discounted payback period and NPV of both business cases by increasing the potential selling price of jet fuel and microbial oil starting from MJSP and MOSP, respectively.

3.3.1. Minimum Jet Selling Price (MJSP)

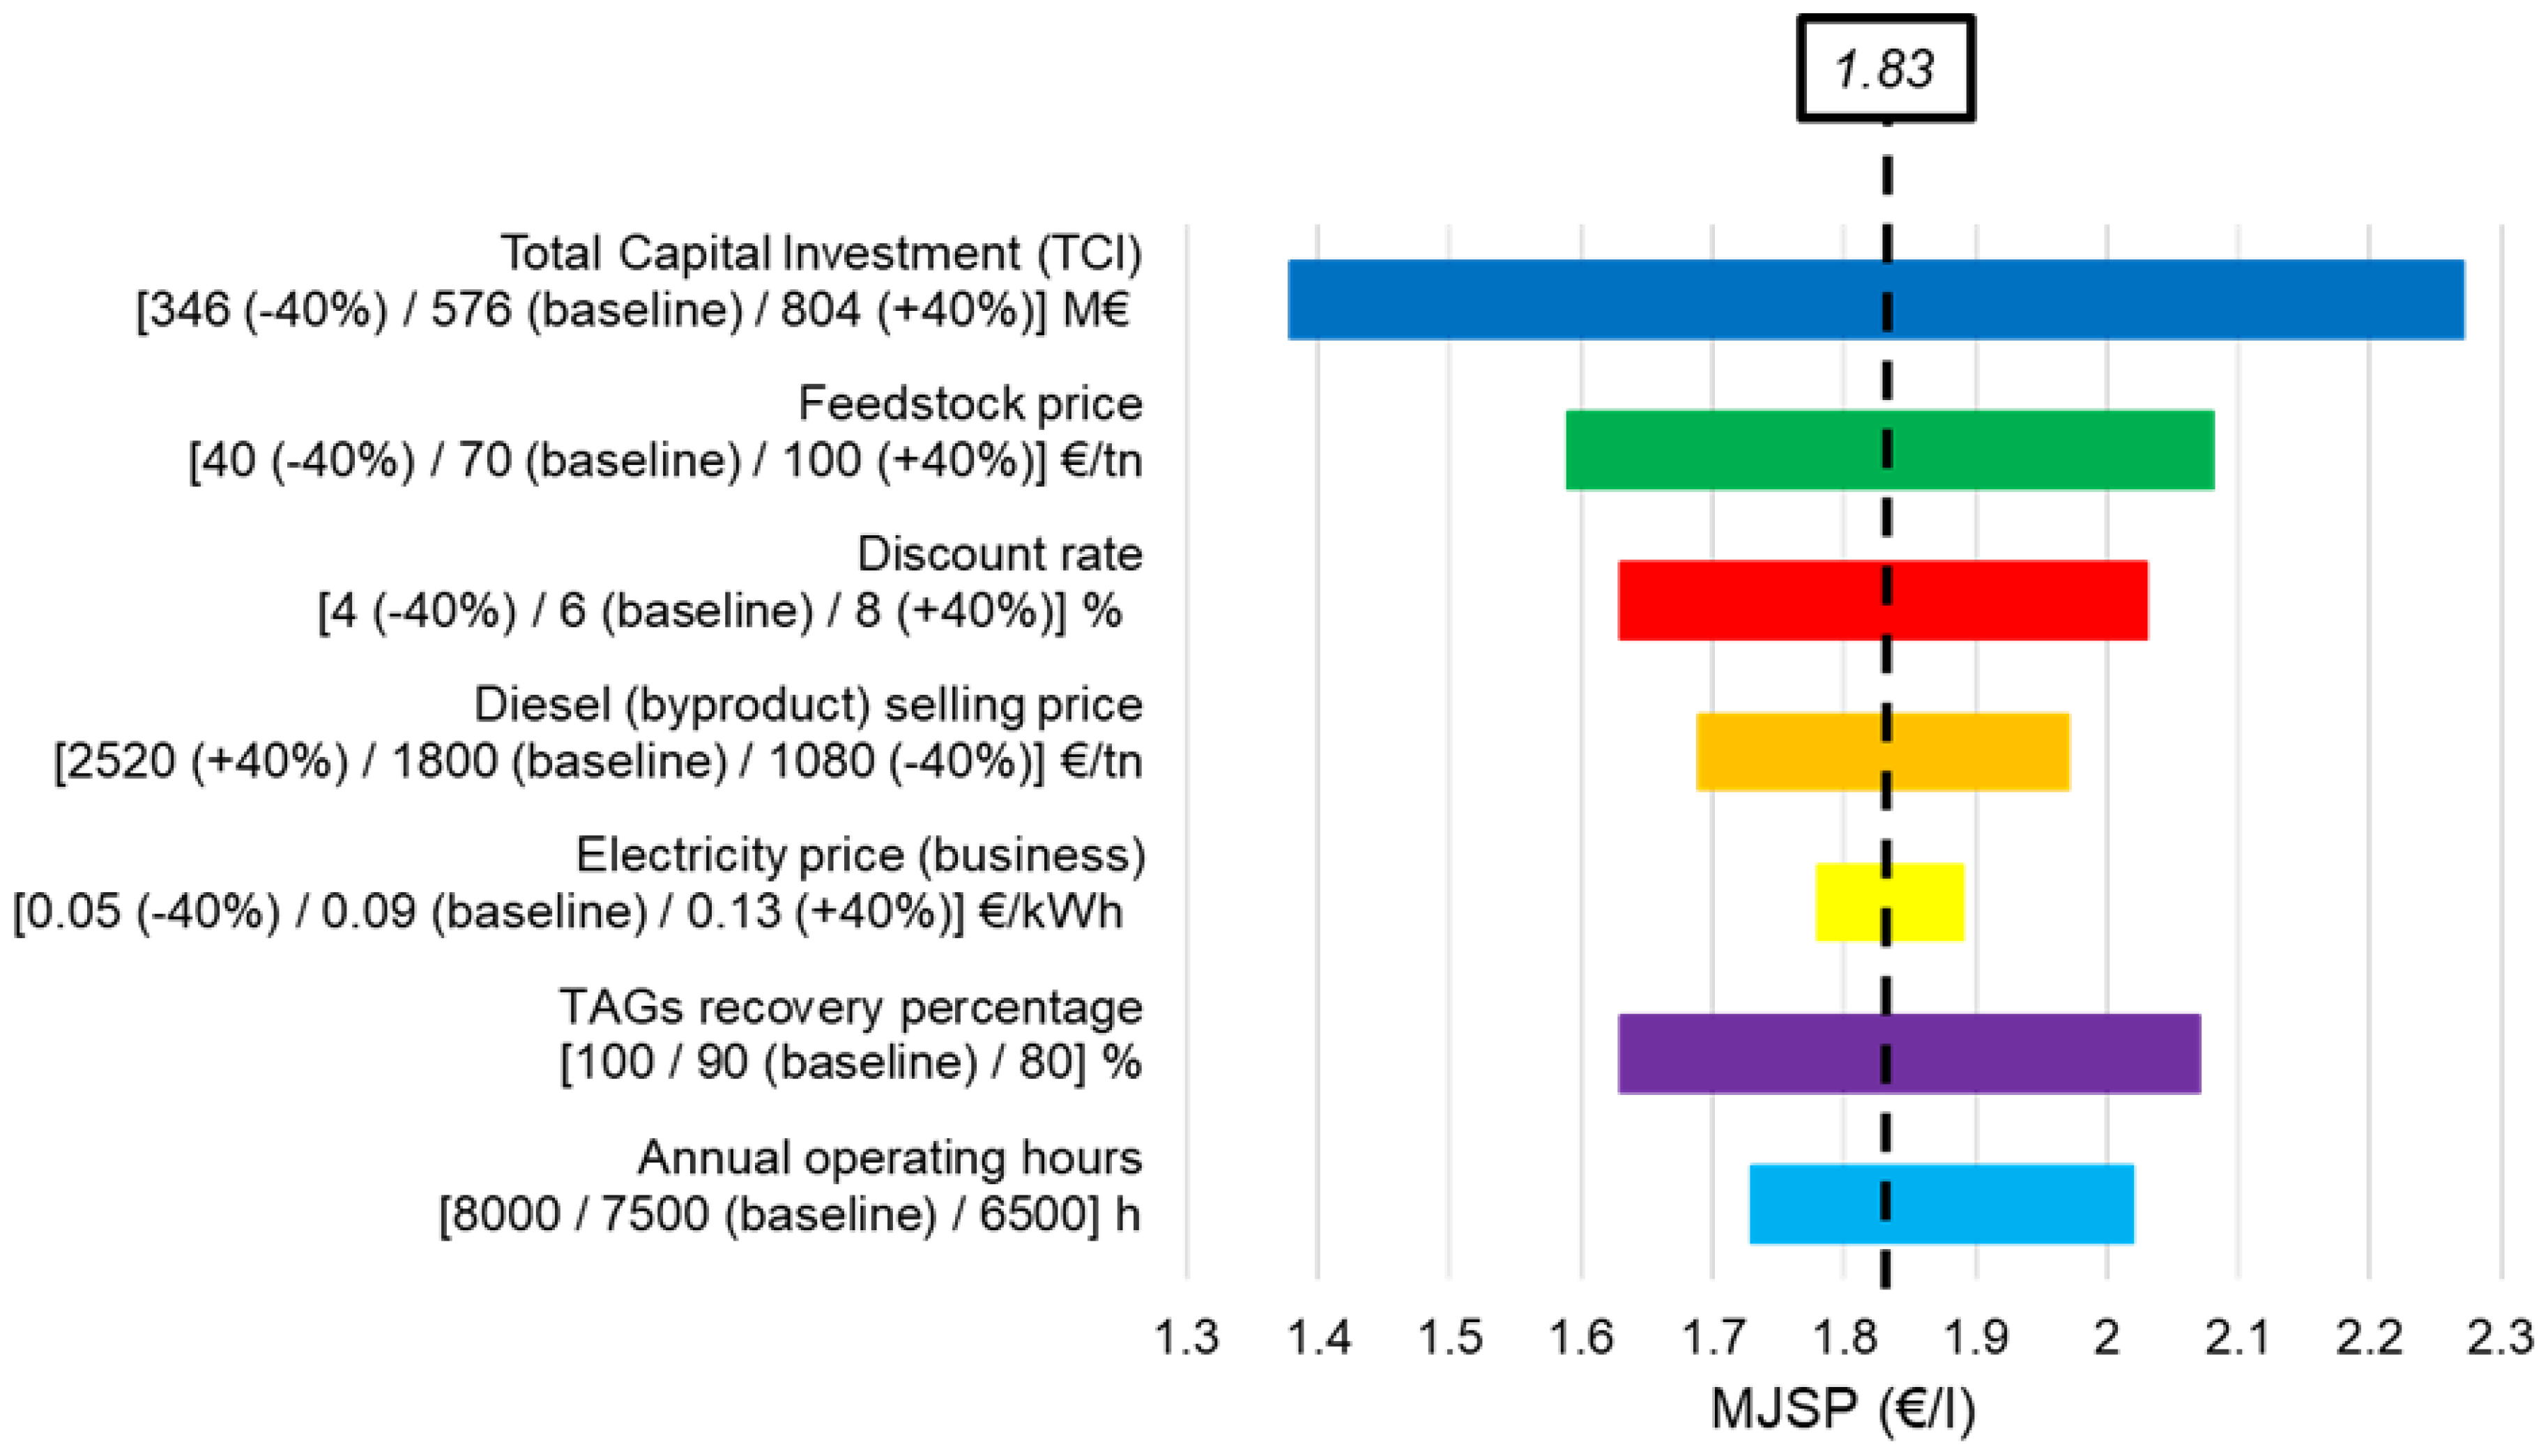
The impact of ±40% variations in baseline TCI, feedstock price, discount rate, diesel selling price, and electricity price on the MJSP is investigated. TAG recovery percentage (from their intracellular form) in the DSP and annual operating hours complete the set of selected parameters for the sensitivity analysis (Figure 8).
TCI and feedstock costs are the parameters with the largest impact on the formation of MJSP and, consequently, the main cost drivers of the process. Considering that an MJSP below 2 €/L would be the minimum prerequisite for competitiveness, TCI below €650 million and feedstock costs below 100 €/t would be desirable for the financial sustainability of the concept. A TCI below €500, and the involvement of cheap feedstock (e.g., biogenic wastes) could move the MJSP in the very competitive advanced biofuels range of 1–1.5 €/L. The relatively low electrical requirements of the examined BtL concept reflect the small impact of the electricity price on the MJSP. Thus, utilization of RES electricity (even in cases that are more expensive than fossil) for further carbon footprint reduction of the plant seems affordable. Moreover, the TAG recovery percentage (DSP efficiency) seems critical for the performance of the whole unit. Although 100% recovery is rather unattainable even in large-scale applications, percentages below 70–80% seem prohibitive for process economics. The assumed maximization of the jet fraction at diesel’s expense leads to an unimpressive effect of the diesel selling price on MJSP, but non-negligible as well since diesel remains the main by-product of the process. A rather remarkable influence on the computed MJSP is also observed from the applied discount rate, while the plant on-stream factor should be over 80% (i.e., >7000 annual operating hours).

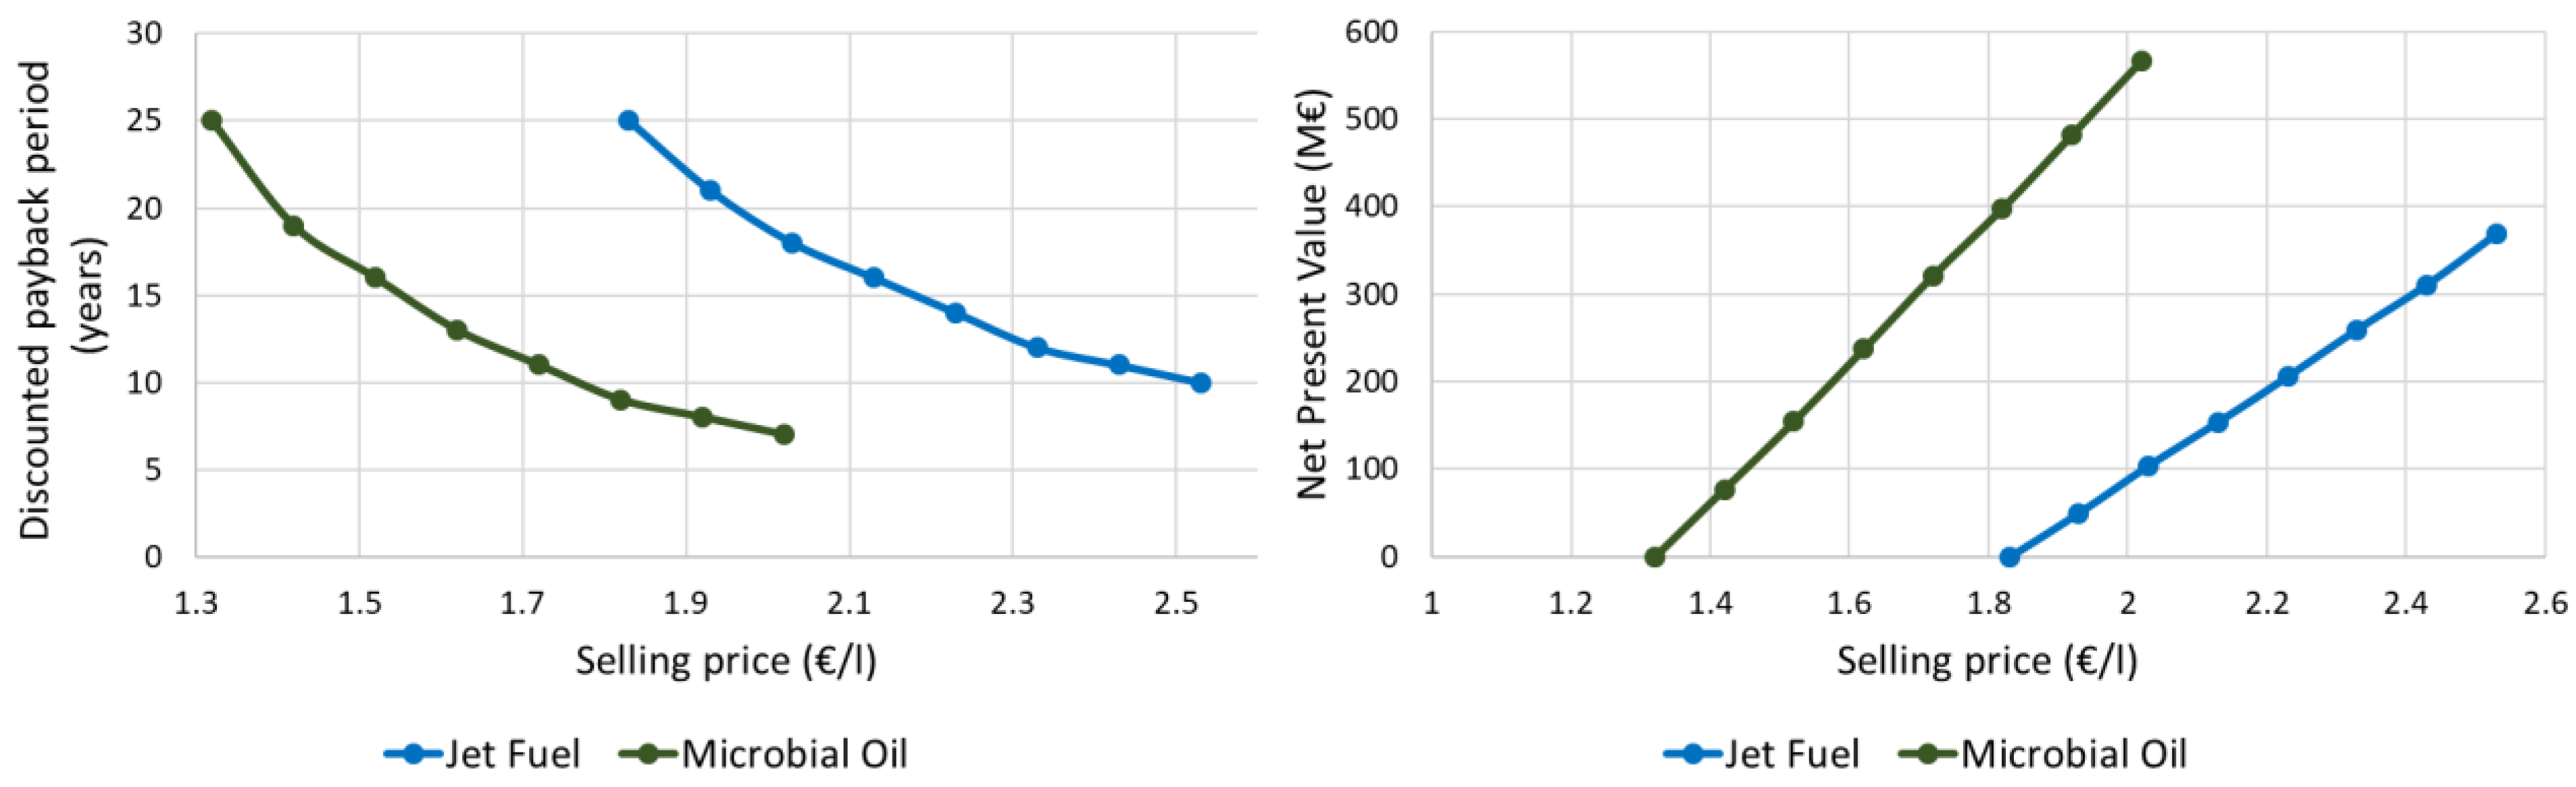
3.3.2. Discounted Payback Period and NPV

Discounted payback period provides the number of years it takes to break even from undertaking the initial capital investment by discounting future cash flows and considering the time value of money. NPV is the difference between the present value of cash inflows and the present value of cash outflows over the plant’s lifetime. A positive NPV is a good initial indication of a potential investment, while a negative one is the opposite. Both discounted payback period and NPV are valuable metrics for the feasibility and profitability of a given project. The shorter the discounted payback period and the higher the net present value, the better for the potential investment.
A sensitivity analysis based on these two parameters is performed for the jet fuel and the microbial oil business cases in order to assess the specifications of the concept and compare the potential of each investment. A fixed selling price increase rate is applied for the jet fuel and the microbial oil starting from the MJSP and MOSP, respectively (Figure 9).
The microbial oil scenario seems, as expected, the most attractive business case, presenting the highest potential in terms of minimization of the payback period and maximization of the NPV. Of course, there is still some distance to cover between the conventional (fossil) fuels prices and the potential selling prices of their low-carbon replacements that would ensure the feasibility and profitability of such BtL investments. However, it becomes apparent that new BtL investments should target intermediate products (e.g., microbial oil) that can be exploited by current refineries (directly or via co-processing) rather than final products (e.g., jet fuel) that require brand-new hydrotreatment facilities. The latter would entail higher risks for the financial sustainability of novel large-scale BtL plants. The connection of newly established sustainable BtL pathways with the current need of commercial refineries to decarbonize their activities via the exploitation of the large existing refining infrastructure could pave the way towards the validation of claims that the next two decades will be dominated by technologies handling advanced feedstock and by refineries that act as hubs of low-carbon oils [64].

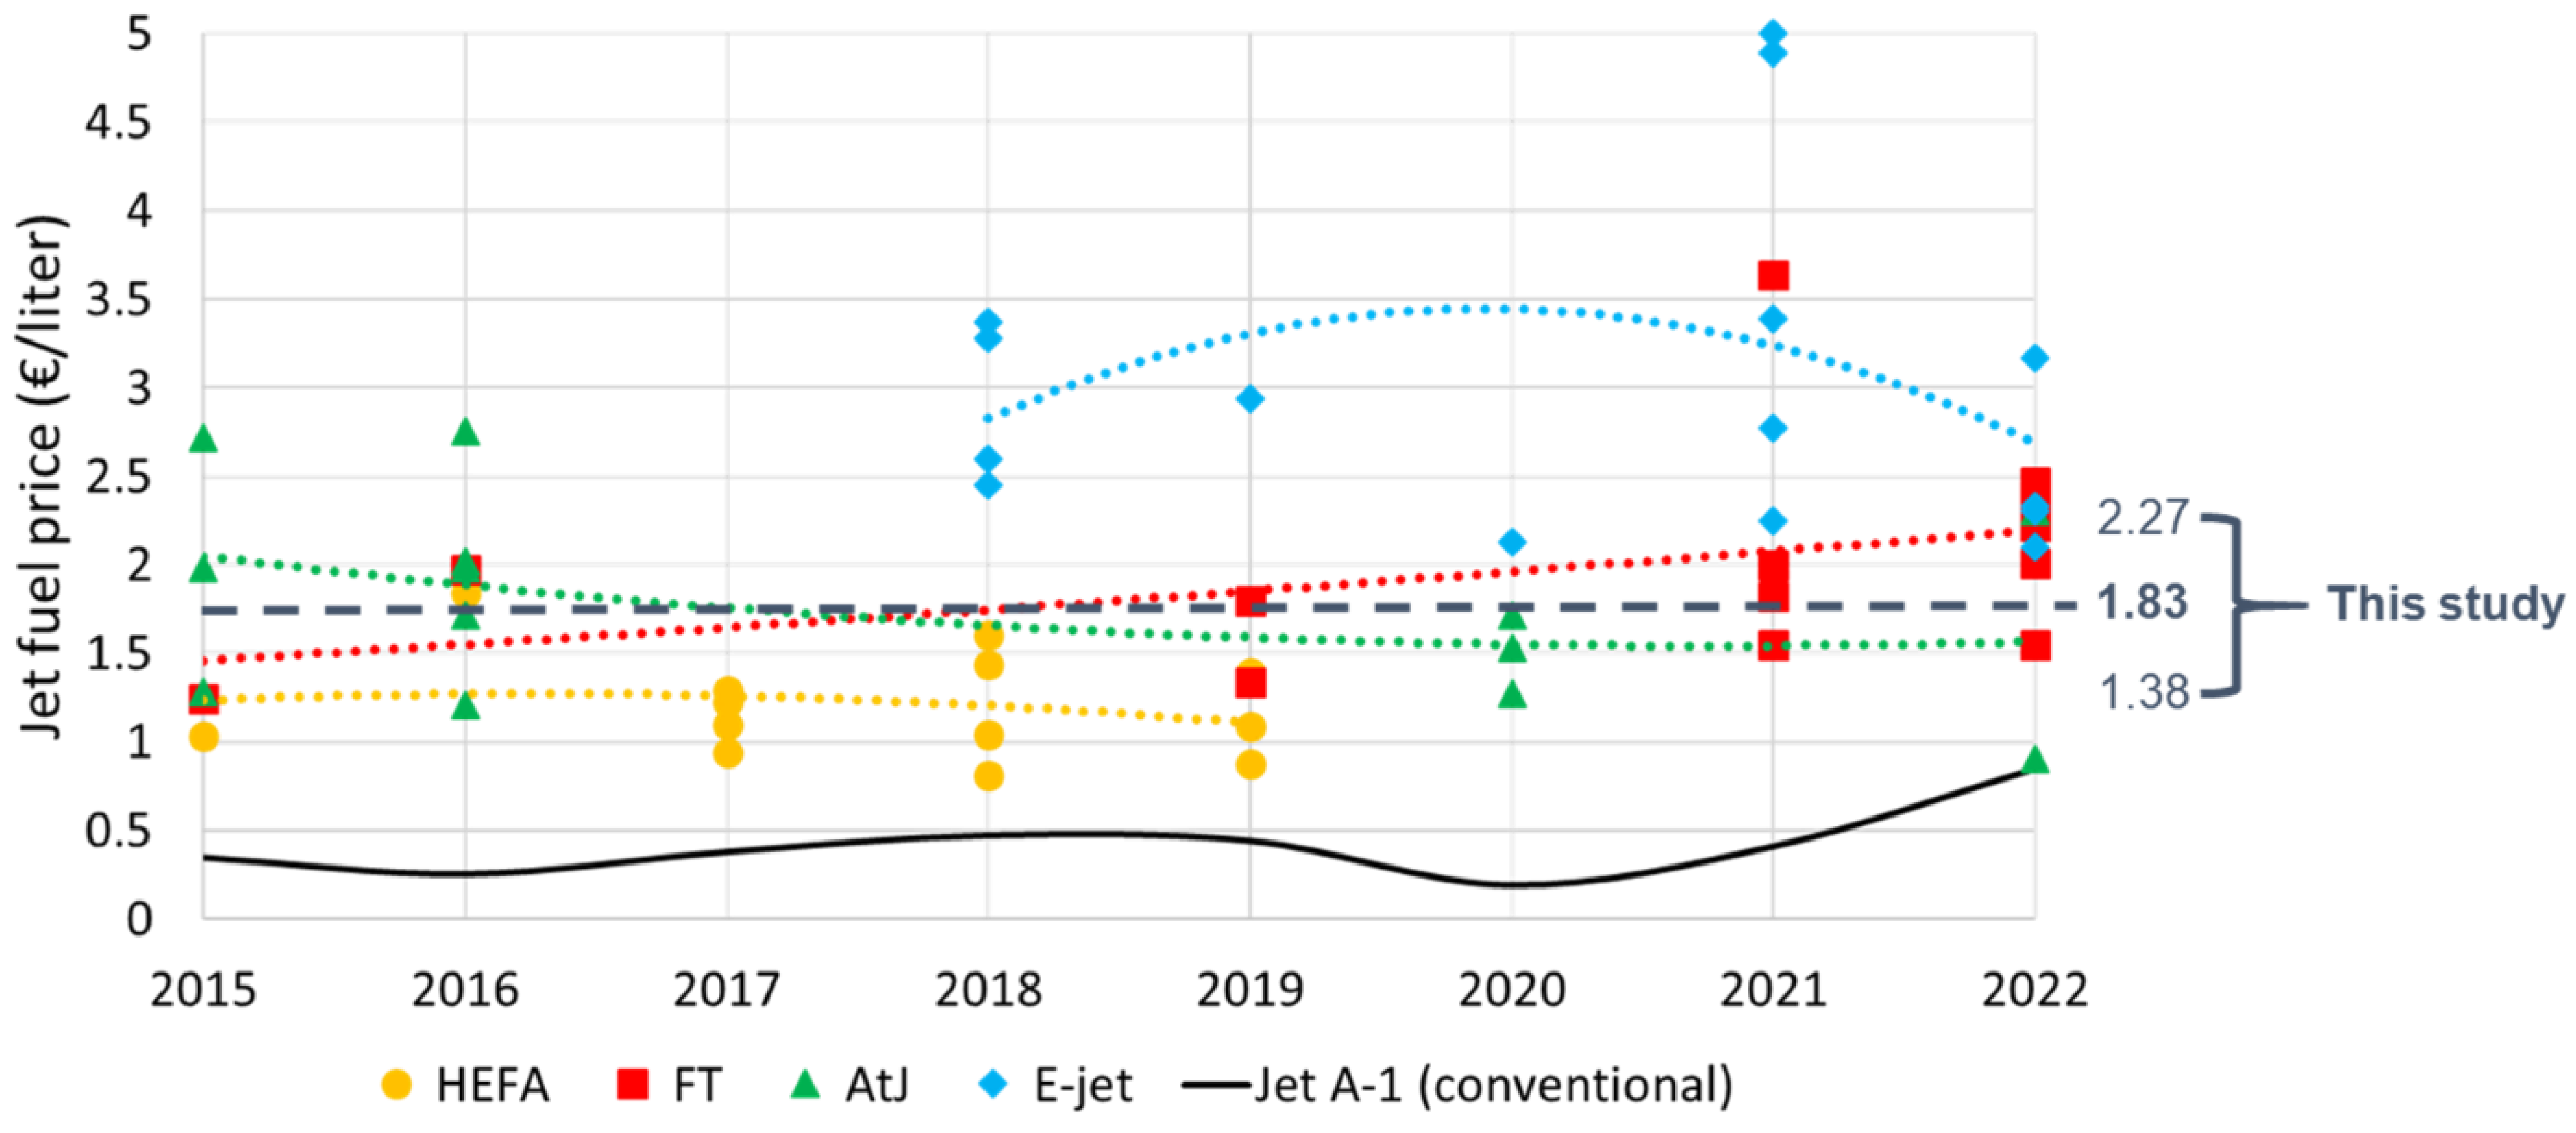
3.4. Benchmarking with the Dominant SAF Technologies

This section aims to conduct an evaluation of the concept presented within this study in terms of financial capabilities and competitiveness compared to the current dominant SAF technologies (i.e., HEFA, FT, AtJ, e-fuels) [6]. MJSP has been elected as an appropriate indicator for this purpose since it is a metric that is often used for the primary economic assessment of a BtL technology and allows for comparison with relevant techno-economic studies. However, direct comparisons with other techno-economic studies are not proper due to possible differentiations in assumed methodology, boundary conditions, or scale. On the contrary, aggregated data that take into account multiple studies seem more suitable for the formation of a holistic perspective and an apt judgment regarding the estimated range of each technology. Hence, the findings of a recent SAFs review study [10] are exploited for positioning the MJSP of the present work among a set of MJSP predictions for dominant SAF technologies. The global average price evolution of conventional jet fuel (Jet A-1) in recent years is attached as well, extracted from [65] (Figure 10).
HEFA-produced SAF is the most cost-competitive option and the only route so far that can consistently compete with conventional jet fuel prices. With selling prices below 1.00 €/L seeming attainable, HEFA has already penetrated the market and can be considered the only state-of-the-art commercial SAF. The respective trend lines for the semi-commercialized FT and AtJ routes, which are also the technologies of greater interest in the context of this study, lie well within the range of 1.50–2.00 €/L. The feedstock flexibility of these two routes results in some deviations regarding the estimation of their production costs, but it is rather safe to claim that cost-effective feedstock can lead to cost-competitive FT and AtJ implementations. The recent establishment of the world’s first ethanol to SAF (AtJ) commercial production facility by LanzaJet [66] acts as a proof for the latter claim and is a breakthrough towards the involvement and accelerated scale-up of additional pathways, apart from HEFA, for the commercial uptake of SAFs. Finally, the e-jet trend line moves around 3.00 €/L and illustrates the current uncertainty that characterizes this kind of fuel [67]. Almost every recent techno-economic study struggles to determine affordable e-jet production costs at present, but they all highlight the significant cost reduction potential in the future, driven mainly by reductions in hydrogen and green electricity prices [68].
The obtained baseline MJSP of 1.83 €/L reveals the preliminary ability of the concept of this study to be financially competitive. The calculated MJSP of 1.83 €/L is within the range of the respective prices from the dominant BtL technologies (1.50–2.00 €/L). According to the performed sensitivity analysis of Section 3.3.1, favorable economic conditions can drop the MJSP up to 1.38 €/L, while unfavorable economic conditions can raise this value to 2.27 €/L. Another factor that should be considered for the financial assessment of the proposed pathway is that the proof of concept has just been carried out at the pilot scale (Technology Readiness Level—TRL 5) within the BioSFerA project [
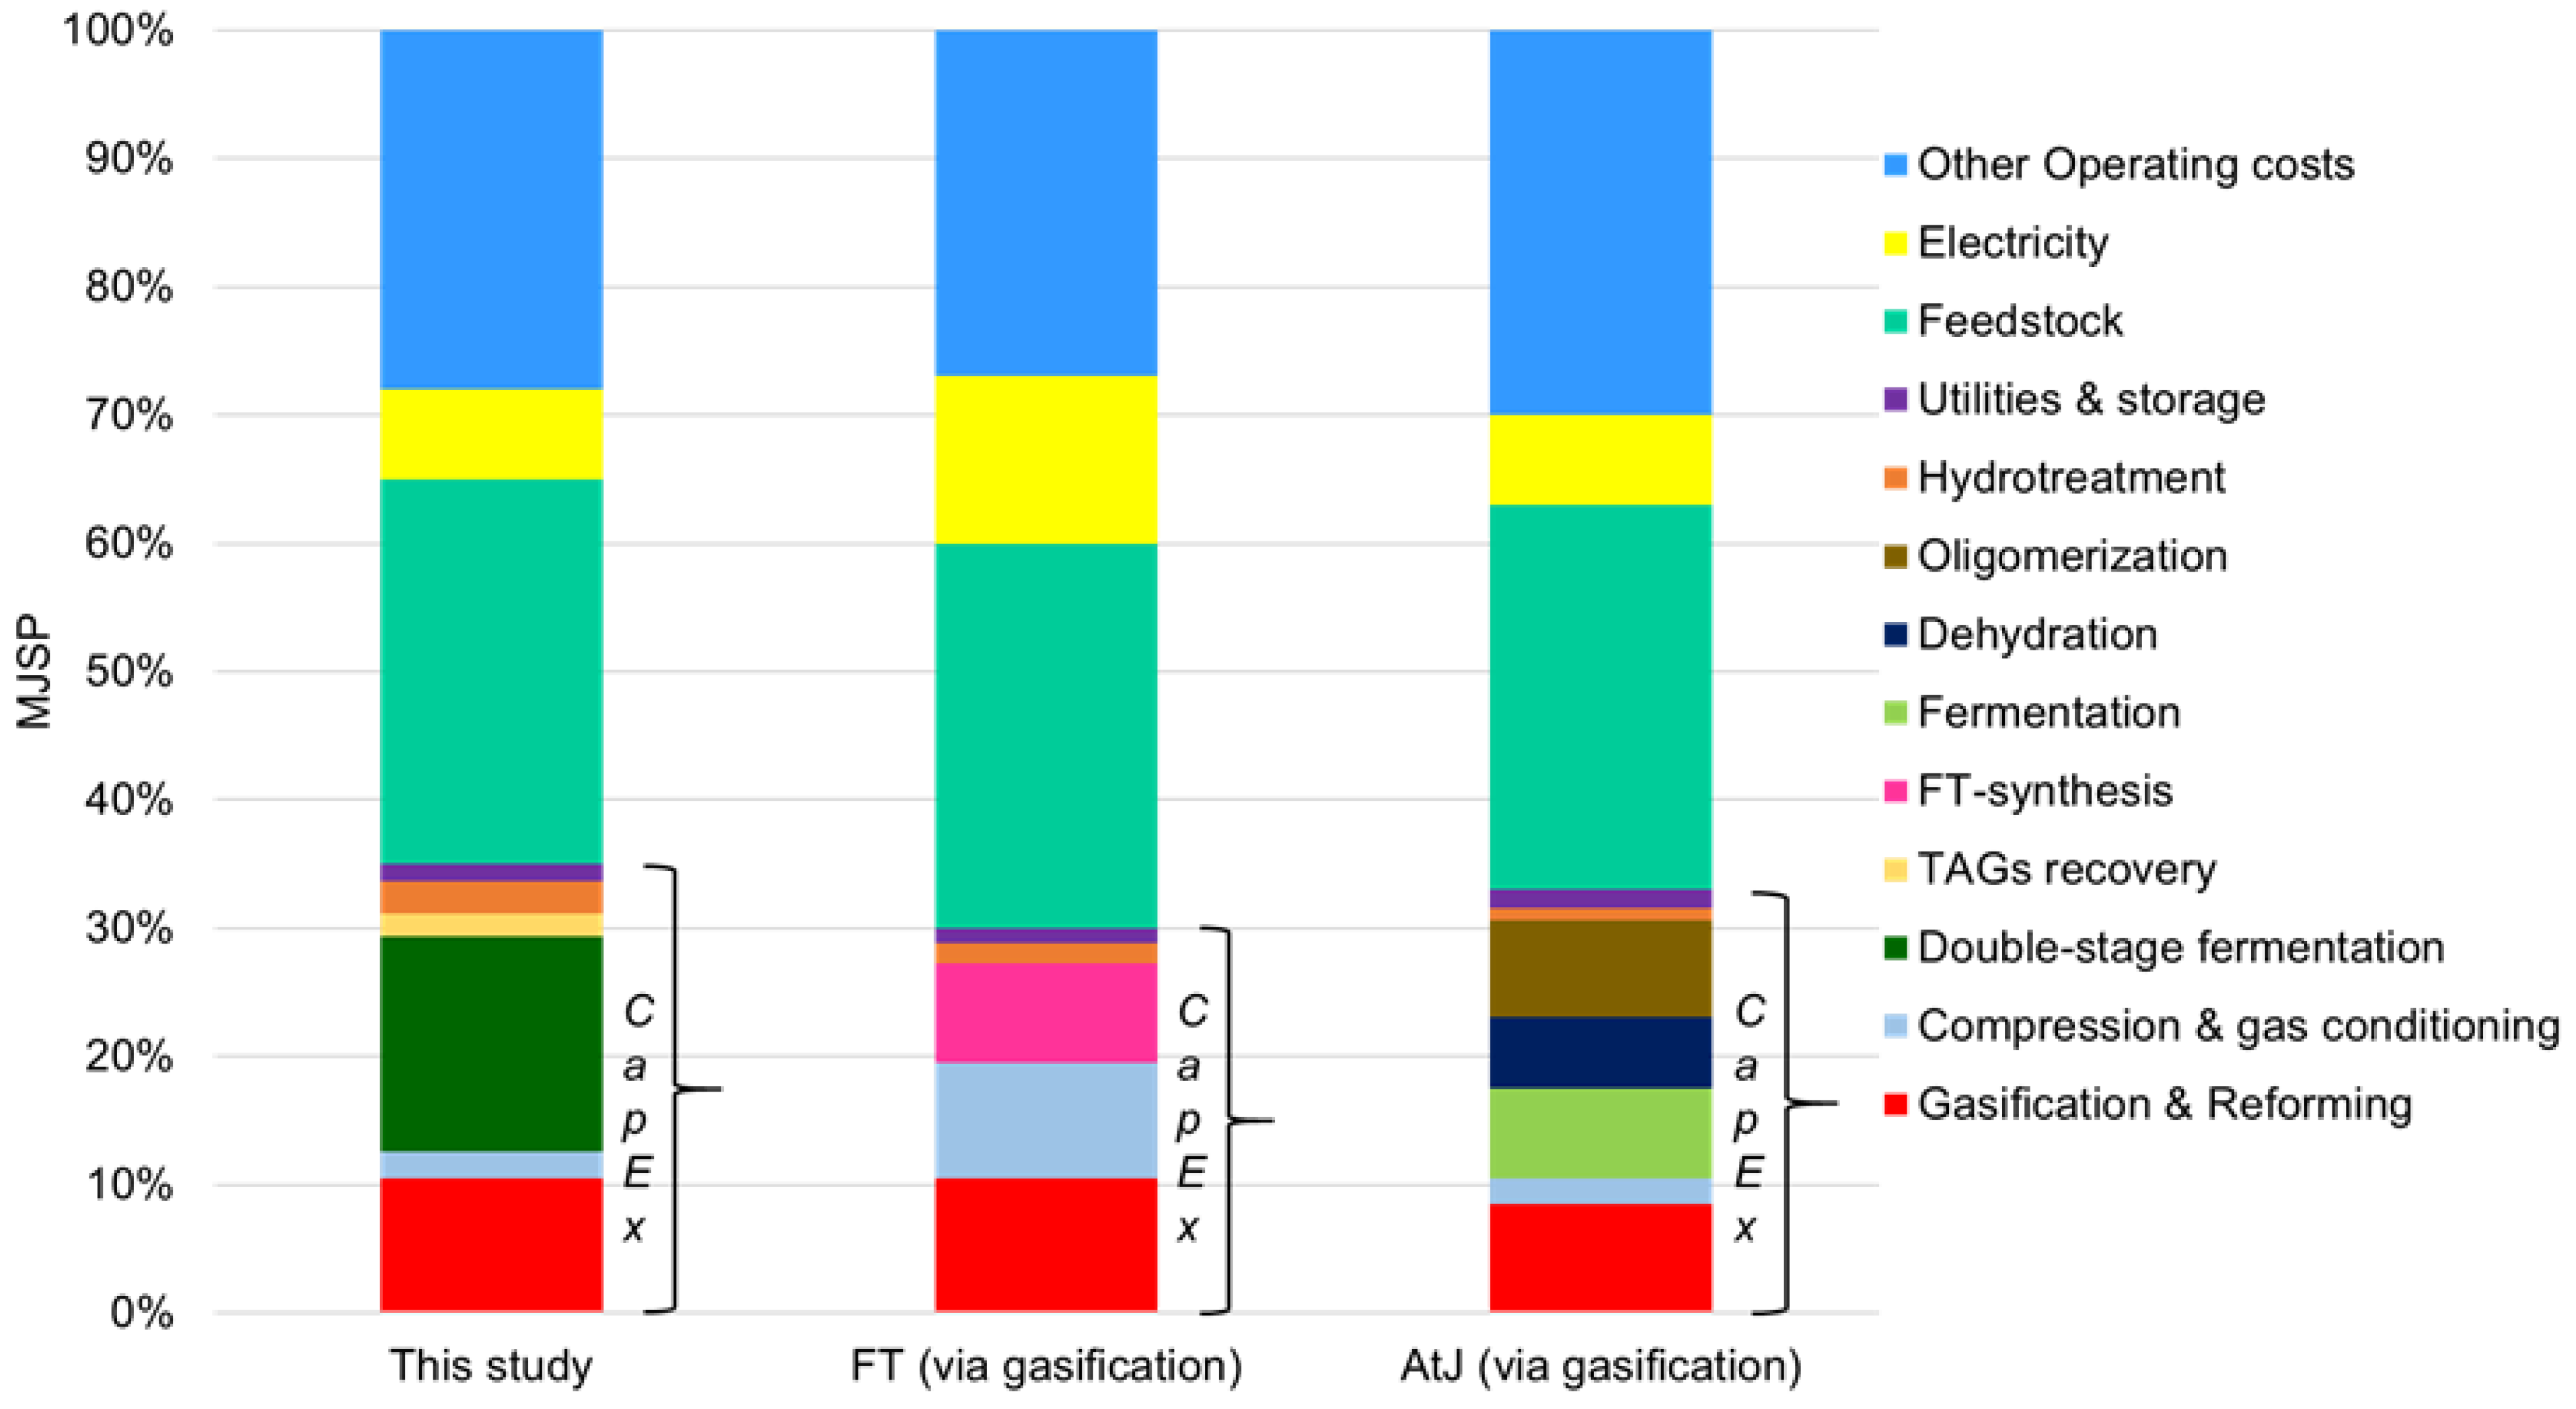
14], while the technological maturity of FT and AtJ pathways are at pre-commercial level (TRL 8–9). Thus, there is rather more room for improvement in terms of technical performance and, subsequently, financial efficiency compared to more established technologies. Aiming to provide an overview of the production costs for the BtL scheme of this study and to identify the aspects to be improved, the calculated MJSP is presented in the form of levelized production costs and compared with the respective cost breakdowns of FT and AtJ gasification-driven pathways, as derived from relevant studies [34,59] (Figure 11).
Taking into account this study’s estimated MJSP (1.83 €/L) as well as the respective positioning of FT’s and AtJ’s MJSPs, mainly in the range of 1.50–2.00 €/L (Figure 10), a qualitative insight into the allocation of their production costs is provided in Figure 11. All three BtL routes present pretty similar distribution regarding the envisaged production costs of the final biofuels. As expected for BtL plants that target advanced feedstock, the CapEx (return on investment) and the feedstock costs combined account for at least 60% of the production costs in each technology. While the feedstock capabilities and the relevant costs are the same for each pathway due to the common presence of gasification at the start of each process, the different terms of gas handling and fuel synthesis reveal the individual specifications of each route. Despite the FT process being the value chain with the fewest conversion steps, the strict specifications of FT synthesis (i.e., proper H2/CO ratio, exhaustive acid gas removal, and high gas pressures/temperatures) burden the overall production costs with extensive equipment for gas conditioning and heavy electricity requirements. Gasification-driven AtJ is a process that, similarly to the concept of this study, is based on milder temperatures, pressures, and subsequently reduced electricity expenses. However, the multiple conversion steps lead to inevitable large capital expenses for this technology as well. Thus, the two dominant technologies usually result in similar production costs in total (Figure 10) and the regulator concerning their competitiveness seems to be the feedstock purchase cost.
The examined concept of this study aims to reach competitive performance levels by avoiding the strict specifications of FT or the several unit operations of the AtJ route that raise the total production costs. Although the simulated BtL scheme seems able to provide equal liquid biofuel yields [15] with FT and AtJ based on reduced operational costs, the initially estimated capital investment of the concept seems as demanding as for the other technologies (30–35% of the levelized production costs). This is mainly due to the large working volumes of the double-stage fermentation and, subsequently, the large, required number of bioreactors. Of course, as already mentioned in Section 3.1.1, higher obtained productivities and concentrations for acetic acid/TAGs production can drastically reduce the capital costs of double-stage fermentation and upgrade the financial competitiveness of the concept.
To sum up, the investigated BtL scheme of the present study appears capable of providing an initially competitive pathway to add to the established and already pre-commercial level FT and AtJ technologies. The reduction of the envisaged capital costs for the biological part via the optimization of the acetic acid/TAGs productivities and concentrations should be the priority on the way to the potential scale-up of the concept. In general, gasification-driven BtL technologies seem adequate to play a leading role in the deployment of SAF production technologies since they usually offer the valuable aspect of feedstock flexibility (forestry/agricultural residues, biogenic wastes, etc.) which can be critical for the implementation of low-cost feedstock scenarios and subsequently the production of advanced biofuels at affordable costs. Finally, it should not be overlooked that BtL based on gasification has yet to be commercialized. Hence, a pioneer plant is expected to be more costly to build and operate than a Nth plant (beneficial scale effect).

4. Conclusions

In this study, an alternative gasification-driven BtL concept for the production of SAFs is introduced and evaluated. In particular, a fuel synthesis scheme based on the double-stage fermentation of the produced syngas (syngas → acetic acid → TAGs) is investigated instead of the conventional FT or AtJ synthesis, aiming to the establishment of an additional competitive BtL technology characterized by mild operating temperatures, low pressures, and consequently affordable production costs. The environmental assessment of the concept has revealed 50–80% potential GHG emission savings compared to conventional (fossil) routes. The main objective of the present work is the techno-economic assessment of a large-scale (200 MWth) replication of the mentioned BtL concept, whose performance has been simulated in Aspen PlusTM with reasonable upscaling considerations and models validated at the pilot scale.
The estimated baseline TCI of €577 million lies in the typical range of €500–700 million that many recent techno-economic studies adopt for the required capital investment of gasification-driven BtL plants (FT or AtJ) of similar capacity, while the estimated annual operating costs of €50 million correspond to a 15–40% OpEx reduction compared to such plants. A discounted cash flow analysis was carried out, and a MJSP equal to 1.83 €/L was calculated. The obtained baseline MJSP reveals the preliminary ability of the concept to be financially competitive since it belongs in the range where the dominant BtL technologies (FT and AtJ) seem to fall (1.50–2.00 €/L). The performed sensitivity analysis indicates that the MJSP can decrease up to 1.38 €/L under good economic terms and increase up to 2.27 €/L under unfavorable economic conditions. TCI and feedstock costs are the main cost-drivers of the process, while the securement of a TAGs recovery percentage (DSP efficiency) over 70–80% seems also a critical aspect.
An additional business case was investigated, in which the hydrotreatment of the produced microbial oil is performed in an external existing plant (refinery). In this case, the microbial oil is the end product of the process, and the thermocatalytic part is excluded from the BtL concept. The reasoning for the election of this scenario is not only the avoidance of the construction costs for a new hydrotreatment facility, but also the exploitation of the extensive refining infrastructure and experience already in place. The respective discounted cash flow analysis resulted in a baseline MOSP equal to 1.32 €/L. The higher potential of the microbial oil scenario in terms of minimizing the payback period and maximizing the NPV suggests that new BtL investments should rather focus on intermediate products (low-carbon oils) that can be upgraded by existing refineries instead of final products (drop-in fuels) that require brand new hydrotreatment facilities. The latter would entail a higher risk for the financial sustainability of novel large-scale BtL projects.
In essence, the techno-economic assessment of this study sets the biological conversion of gasification-derived syngas into TAGs as a promising alternative route for the production of SAFs. The whole value chain was successfully demonstrated at the pilot scale (TRL 5) within the BioSFerA project [14]. The qualitative analysis of the production costs compared to established technologies revealed that the priority towards the potential scale-up of the concept should be the optimization of acetic acid/TAGs productivities and concentrations in order to reduce the capital costs related to double-stage fermentation. The optimization of acetic acid/TAGs productivities and concentrations can be accomplished through advanced metabolic engineering of acetogenic bacteria/oleaginous yeasts, effective design of bioreactors, and proper fermentation conditions.
In general, gasification-driven BtL technologies, led by FT and AtJ that are already at the pre-commercial level, are capable of flourishing in the coming years based on their capability of advanced feedstock flexibility. Key prerequisites for this to happen are continuous efforts for design optimization (reduction of capital costs), appropriate policy incentives, and the efficient connection with the existing refining infrastructure in a scheme that could deliver economic benefits to the industry and beyond.

Supplementary Materials

The following supporting information can be downloaded at https://www.mdpi.com/article/10.3390/en17071685/s1, Figure S1: Integrated PFD of the BtL concept; Table S1: Stream results for the thermochemical part; Table S2: Stream results for the biological part; Table S3: Stream results for the thermocatalytic part; Table S4: Feedstock (crushed bark) properties involved in the process simulations; Table S5: Main equipment considered for the industrial layout of the concept; Table S6: Capital Expenditures (CapEx) of the BtL plant (microbial oil scenario); Table S7: Annual Operational Expenditures (OpEx) of the BtL plant (microbial oil scenario); Table S8: Discounted cash flow analysis for the calculation of MJSP (jet fuel scenario); Table S9: Discounted cash flow analysis for the calculation of MOSP (microbial oil scenario).

Author Contributions

Conceptualization, N.D. and K.A.; methodology, N.D. and L.M.; software, N.D. and L.M.; validation, N.D., S.R., K.Q. and K.D.W.; formal analysis, N.D., L.M., and N.G.O.; investigation, N.D., L.M., S.R., K.Q. and K.D.W.; data curation, N.D.; writing—original draft preparation, N.D. and L.M.; writing—review and editing, K.A., S.R., K.Q., K.D.W. and V.S.; visualization, N.D.; supervision, N.G.O., V.S. and P.G.; project administration, K.A. and P.G. All authors have read and agreed to the published version of the manuscript.

Funding

The authors kindly acknowledge the financial support of the European project ‘BioSFerA’ (https://biosfera-project.eu, accessed on 26 March 2024), funded by the European Union’s Horizon 2020 research and innovation programme (Grant Agreement 884208).

Data Availability Statement

The original contributions presented in the study are included in the article/Supplementary Materials, further inquiries can be directed to the corresponding author.

Conflicts of Interest

Authors Stefano Rebecchi, Koen Quataert and Karel De Winter were employed by the company Bio Base Europe Pilot Plant VZW. The remaining authors declare that the research was conducted in the absence of any commercial or financial relationships that could be construed as a potential conflict of interest.

References

  1. IATA. Annual Review 2021; IATA: Boston, MA, USA, 2021. [Google Scholar]
  2. IATA. Annual Review 2022; IATA: Doha, Qatar, 2022. [Google Scholar]
  3. IATA. Annual Review 2023; IATA: Istanbul, Türkiye, 2023. [Google Scholar]
  4. IATA. Incentives Needed to Increase SAF Production; IATA: Montreal, QB, Canada, 2022. [Google Scholar]
  5. IATA. SAF Volumes Growing but Still Missing Opportunities; IATA: Montreal, QB, Canada, 2023. [Google Scholar]
  6. ReFuelEU Aviation Iniative: Sustainable Aviation Fuels and the Fit for 55 Package; European Commission: Brussels, Belgium, 2022.
  7. Bauen, A.; Bitossi, N.; German, L.; Harris, A.; Leow, K. Sustainable Aviation Fuels. Johns. Matthey Technol. Rev. 2020, 64, 263–278. [Google Scholar] [CrossRef]
  8. Doliente, S.S.; Narayan, A.N.A.; Tapia, J.F.D.; Samsatli, N.J.; Zhao, Y.; Samsatli, S. Bio-aviation Fuel: A Comprehensive Review and Analysis of the Supply Chain Components. Front. Energy Res. 2020, 8, 110. [Google Scholar] [CrossRef]
  9. Dahal, K.; Brynolf, S.; Xisto, C.; Hansson, J.; Grahn, M.; Grönstedt, T.; Lehtveer, M. Techno-economic review of alternative fuels and propulsion systems for the aviation sector. Renew. Sustain. Energy Rev. 2021, 151, 111564. [Google Scholar] [CrossRef]
  10. Detsios, N.; Theodoraki, S.; Maragoudaki, L.; Atsonios, K.; Grammelis, P.; Orfanoudakis, N.G. Recent Advances on Alternative Aviation Fuels/Pathways: A Critical Review. Energies 2023, 16, 1904. [Google Scholar] [CrossRef]
  11. Sikarwar, V.S.; Zhao, M.; Fennell, P.S.; Shah, N.; Anthony, E.J. Progress in biofuel production from gasification. Prog. Energy Combust. Sci. 2017, 61, 189–248. [Google Scholar] [CrossRef]
  12. Detsios, N.; Atsonios, K.; Grammelis, P.; Dieringer, P.; Ströhle, J.; Nikkanen, V.; Orfanoudakis, N.G. A comparative analysis and assessment of dual fluidized bed and chemical looping gasification: Design considerations for commercial use and applicability in BTL schemes. In Proceedings of the 31st European Biomass Conference and Exhibition, EUBCE 2023, Bologna, Italy, 5–8 June 2023. [Google Scholar] [CrossRef]
  13. de Lasa, H.; Salaices, E.; Mazumder, J.; Lucky, R. Catalytic Steam Gasification of Biomass: Catalysts, Thermodynamics and Kinetics. Chem. Rev. 2011, 111, 5404–5433. [Google Scholar] [CrossRef] [PubMed]
  14. BioSFerA—Biofuels Production from Syngas Fermentation for Aviation and Maritime Use. Available online: https://cordis.europa.eu/project/id/884208 (accessed on 26 March 2024).
  15. Detsios, N.; Maragoudaki, L.; Atsonios, K.; Grammelis, P.; Orfanoudakis, N.G. Design considerations of an integrated thermochemical/biochemical route for aviation and maritime biofuel production. Biomass Convers. Biorefinery 2023. [Google Scholar] [CrossRef]
  16. Kourkoumpas, D.-S.; Βon, A.; Sagani, A.; Atsonios, K.; Grammelis, P.; Karellas, S.; Kakaras, E. Life cycle assessment of novel thermochemical—Biochemical biomass-to-liquid pathways for sustainable aviation and maritime fuel production. Bioresour. Technol. 2024, 393, 130115. [Google Scholar] [CrossRef]
  17. BioSFerA Deliverable D4.4 ‘Results of the Pilot Run’. Available online: https://biosfera-project.eu/project/publications-deliverable/ (accessed on 26 March 2024).
  18. BioSFerA Deliverable D3.2 ‘Metabolic Engineering of Acetogenic Bacteria for Efficient Syngas Fermentation and Production of Acetate’. Available online: https://biosfera-project.eu/wp-content/uploads/2022/05/BioSferA_Deliverable_3.2-final.pdf (accessed on 26 March 2024).
  19. BioSFerA Deliverable D3.4 ‘Optimization of Syngas Fermentation Process Parameters for Acetate Production (1st Stage)’. Available online: https://biosfera-project.eu/wp-content/uploads/2023/12/BioSFerA_Deliverable_3.4.pdf (accessed on 26 March 2024).
  20. BioSFerA Deliverable D3.3 ‘Metabolic Engineering of Oleaginous Yeasts for Efficient Acetate Fermentation and Production of Medium and Long Chain TAGs’. Available online: https://biosfera-project.eu/wp-content/uploads/2022/05/BioSferA_Deliverable_3.3-final.pdf (accessed on 26 March 2024).
  21. BioSFerA Deliverable D3.5 ‘Optimization of Acetate Fermentation Process Parameters for C14 and C16-18 TAGs Production (2nd Stage)’. Available online: https://biosfera-project.eu/wp-content/uploads/2023/12/BioSFerA_Deliverable-3.5.pdf (accessed on 26 March 2024).
  22. BioSFerA Deliverable D3.6 ‘Lab Scale Downstream Processing for TAGs Recovery and Purification Using Conventional and Novel Strategies’. Available online: https://biosfera-project.eu/wp-content/uploads/2023/12/BioSFerA_Deliverable-3.6.pdf (accessed on 26 March 2024).
  23. BioSFerA Deliverable D6.2 ‘Results of Full-Chain Process Simulations’. Available online: https://biosfera-project.eu/wp-content/uploads/2023/12/BioSFerA_Deliverable-6.2-PU.pdf (accessed on 26 March 2024).
  24. Kurkela, E.; Kurkela, M.; Tuomi, S.; Frilund, C.; Hiltunen, I. Efficient Use of Biomass Residues for Combined Production of Transport Fuels and Heat; VTT Technical Research Centre of Finland: Espoo, Finland, 2019; VTT Technology 347. [Google Scholar]
  25. BioSFerA Deliverable D6.1 ‘Report on DFB Gasification Modelling’. Available online: https://biosfera-project.eu/wp-content/uploads/2023/12/BioSFerA_Deliverable-6.1-PU.pdf (accessed on 26 March 2024).
  26. Waites, M.J.; Morgan, N.L.; Rockey, J.S.; Higton, G. Industrial Microbiology: An Introduction; Wiley: Hoboken, NJ, USA, 2009. [Google Scholar]
  27. Laird, K. LanzaTech Demonstrates MEG Production from Carbon Emissions. Available online: https://www.sustainableplastics.com/news/lanzatech-demonstrates-meg-production-carbon-emissions (accessed on 29 March 2024).
  28. Arora, D.B.R.; Breshears, F.S.; Gaines, L.D.; Hays, K.S.; Phillips, J.R.; Wikstrom, C.V.; Clausen, E.C.; Gaddy, J.L. Production of Ethanol from Refinery Waste Gases; Final Report April 1994–July 1997; U.S. Department of Energy Office of Scientific and Technical Information: Oak Ridge, TN, USA, 1997. [Google Scholar] [CrossRef]
  29. BioSFerA Deliverable D4.5 ‘Scale-up of TAG Production’. Available online: https://biosfera-project.eu/wp-content/uploads/2023/12/BioSFerA_Deliverable-4.5-PU.pdf (accessed on 29 March 2024).
  30. BioSFerA Deliverable D5.3 ‘Identification of Optimal Operating Window for TAG Upgrading’. Available online: https://biosfera-project.eu/wp-content/uploads/2023/12/BioSFerA_Deliverble-5.3-PU.pdf (accessed on 29 March 2024).
  31. Pires, A.P.; Han, Y.; Kramlich, J.; Garcia-Perez, M. Chemical composition and fuel properties of alternative jet fuels. BioResources 2018, 13, 2632–2657. [Google Scholar] [CrossRef]
  32. Xu, Y.; Keresztes, I.; Condo, A.M.; Phillips, D.; Pepiot, P.; Avedisian, C.T. Droplet combustion characteristics of algae-derived renewable diesel, conventional #2 diesel, and their mixtures. Fuel 2016, 167, 295–305. [Google Scholar] [CrossRef]
  33. Torres, F.A.; Doustdar, O.; Herreros, J.M.; Li, R.; Poku, R.; Tsolakis, A.; Martins, J.; Vieira de Melo, S.A.B. Fischer-Tropsch Diesel and Biofuels Exergy and Energy Analysis for Low Emissions Vehicles. Appl. Sci. 2021, 11, 5958. [Google Scholar] [CrossRef]
  34. Diederichs, G.W.; Ali Mandegari, M.; Farzad, S.; Görgens, J.F. Techno-economic comparison of biojet fuel production from lignocellulose, vegetable oil and sugar cane juice. Bioresour. Technol. 2016, 216, 331–339. [Google Scholar] [CrossRef]
  35. Leibbrandt, N.H.; Aboyade, A.O.; Knoetze, J.H.; Görgens, J.F. Process efficiency of biofuel production via gasification and Fischer–Tropsch synthesis. Fuel 2013, 109, 484–492. [Google Scholar] [CrossRef]
  36. Atsonios, K.; Kougioumtzis, M.-A.; DPanopoulos, K.; Kakaras, E. Alternative thermochemical routes for aviation biofuels via alcohols synthesis: Process modeling, techno-economic assessment and comparison. Appl. Energy 2015, 138, 346–366. [Google Scholar] [CrossRef]
  37. Mawhood, R.; Gazis, E.; de Jong, S.; Hoefnagels, R.; Slade, R. Production pathways for renewable jet fuel: A review of commercialization status and future prospects. Biofuels Bioprod. Biorefining 2016, 10, 462–484. [Google Scholar] [CrossRef]
  38. Humbird, D.; Davis, R.; Tao, L.; Kinchin, C.; Hsu, D.; Aden, A.; Schoen, P.; Lukas, J.; Olthof, B.; Worley, M. Process Design and Economics for Biochemical Conversion of Lignocellulosic Biomass to Ethanol: Dilute-Acid Pretreatment and Enzymatic Hydrolysis of Corn Stover; National Renewable Energy Lab.(NREL): Golden, CO, USA, 2011. [Google Scholar]
  39. Dutta, A.; Talmadge, M.; Hensley, J.; Worley, M.; Dudgeon, D.; Barton, D.; Groendijk, P.; Ferrari, D.; Stears, B.; Searcy, E.M. Process Design and Economics for Conversion of Lignocellulosic Biomass to Ethanol: Thermochemical Pathway by Indirect Gasification and Mixed Alcohol Synthesis; National Renewable Energy Lab.(NREL): Golden, CO, USA, 2011. [Google Scholar]
  40. Swanson, R.M.; Platon, A.; Satrio, J.A.; Brown, R.C. Techno-economic analysis of biomass-to-liquids production based on gasification. Fuel 2010, 89, S11–S19. [Google Scholar] [CrossRef]
  41. Plant Cost Index Archives—Chemical Engineering. Available online: https://www.chemengonline.com/site/plant-cost-index/ (accessed on 26 March 2024).
  42. Peters, M.S.; Timmerhaus, K.D.; West, R.E. Plant Design and Economics for Chemical Engineers; McGraw-Hill Education: New York, NY, USA, 2003. [Google Scholar]
  43. Wani, A.K.; Rahayu, F.; Yustina, I.; Fatah GS, A.; Kariada, I.K.; Antarlina, S.S.; Jufri, A.; Pamungkas, D. Contribution of yeast and its biomass for the preparation of industrially essential materials: A boon to circular economy. Bioresour. Technol. Rep. 2023, 23, 101508. [Google Scholar] [CrossRef]
  44. Salaries in the Category: Chemical Industry. Available online: https://www.paylab.com/ (accessed on 26 March 2024).
  45. BioSFerA Deliverable D2.4 ‘Determination of the Main Input Parameters for the Case Studies’. Available online: https://biosfera-project.eu/ (accessed on 26 March 2024).
  46. Sodium Hydroxide Price Index. Available online: https://businessanalytiq.com/procurementanalytics/index/sodium-hydroxide-price-index/ (accessed on 26 March 2024).
  47. IBNet Tariffs DB. Available online: https://tariffs.ib-net.org/sites/IBNET/TariffTable?countryId=0 (accessed on 26 March 2024).
  48. Electricity Price Statistics. Available online: https://ec.europa.eu/eurostat/statistics-explained/index.php?title=Electricity_price_statistics#Electricity_prices_for_non-household_consumers (accessed on 26 March 2024).
  49. Platts Sustainable Aviation Fuel and Renewable Diesel Prices. Available online: https://www.spglobal.com/commodityinsights/en (accessed on 26 March 2024).
  50. Monthly Price for Fertilizers from 2022 to 2023, by Product. Available online: https://www.statista.com/statistics/1288602/quarterly-fertilizer-price-development-by-product/ (accessed on 26 March 2024).
  51. Nieder-Heitmann, M.; Haigh, K.; Görgens, J.F. Process design and economic evaluation of integrated, multi-product biorefineries for the co-production of bio-energy, succinic acid, and polyhydroxybutyrate (PHB) from sugarcane bagasse and trash lignocelluloses. Biofuels Bioprod. Biorefining 2019, 13, 599–617. [Google Scholar] [CrossRef]
  52. Fei, Q.; Liang, B.; Tao, L.; Tan, E.C.D.; Gonzalez, R.; Henard, C.A.; Guarnieri, M.T. Biological valorization of natural gas for the production of lactic acid: Techno-economic analysis and life cycle assessment. Biochem. Eng. J. 2020, 158, 107500. [Google Scholar] [CrossRef]
  53. Concawe. Refinery 2050: Conceptual Assessment. Exploring Opportunities and Challenges for the EU Refining Industry to Transition Towards a Low-CO2 Intensive Economy; Concawe: Brussels, Belgium, 2019. [Google Scholar]
  54. Concawe. A Clean Planet for All. Impact Assessment on the Potential Implications for Our Refining System and the Link with Refinery 2050; Concawe: Brussels, Belgium, 2020. [Google Scholar]
  55. Kantzow, C.; Mayer, A.; Weuster-Botz, D. Continuous gas fermentation by Acetobacterium woodii in a submerged membrane reactor with full cell retention. J. Biotechnol. 2015, 212, 11–18. [Google Scholar] [CrossRef]
  56. Xu, J.; Liu, N.; Qiao, K.; Vogg, S.; Stephanopoulos, G. Application of metabolic controls for the maximization of lipid production in semicontinuous fermentation. Proc. Natl. Acad. Sci. USA 2017, 114, E5308–E5316. [Google Scholar] [CrossRef] [PubMed]
  57. Qiao, K.; Wasylenko, T.M.; Zhou, K.; Xu, P.; Stephanopoulos, G. Lipid production in Yarrowia lipolytica is maximized by engineering cytosolic redox metabolism. Nat. Biotechnol. 2017, 35, 173–177. [Google Scholar] [CrossRef] [PubMed]
  58. de Jong, S.; Hoefnagels, R.; Faaij, A.P.C.; Slade, R.; Mawhood, B.; Junginger, M. The feasibility of short-term production strategies for renewable jet fuels—A comprehensive techno-economic comparison. Biofuels Bioprod. Biorefining 2015, 9, 778–800. [Google Scholar] [CrossRef]
  59. Pavlenko, N.; Searle, S.Y.; Christensen, A. The Cost of Supporting Alternative Jet Fuels in the European Union; International Council on Clean Transportation (ICCT): Washington, DC, USA, 2019. [Google Scholar]
  60. Shahriar, M.F.; Khanal, A. The current techno-economic, environmental, policy status and perspectives of sustainable aviation fuel (SAF). Fuel 2022, 325, 124905. [Google Scholar] [CrossRef]
  61. Ng, K.S.; Farooq, D.; Yang, A. Global biorenewable development strategies for sustainable aviation fuel production. Renew. Sustain. Energy Rev. 2021, 150, 111502. [Google Scholar] [CrossRef]
  62. Wang, W.-C.; Liu, Y.-C.; Nugroho, R.A.A. Techno-economic analysis of renewable jet fuel production: The comparison between Fischer-Tropsch synthesis and pyrolysis. Energy 2022, 239, 121970. [Google Scholar] [CrossRef]
  63. Gogulancea, V.; Rolfe, A.; Jaffar, M.; Brandoni, C.; Atsonios, K.; Detsios, N.; Dieringer, P.; Huang, Y. Technoeconomic and Environmental Assessment of Biomass Chemical Looping Gasification for Advanced Biofuel Production. Int. J. Energy Res. 2023, 2023, 6101270. [Google Scholar] [CrossRef]
  64. Concawe. Transition towards Low Carbon Fuels by 2050: Scenario Analysis for the European Refining Sector; Concawe: Brussels, Belgium, 2021. [Google Scholar]
  65. Jet Fuel Price Monitor. Available online: https://www.iata.org/en/publications/economics/fuel-monitor/ (accessed on 26 March 2024).
  66. LanzaJet Celebrates Grand Opening of Freedom Pines Fuels Plant, the World’s First Ethanol to Sustainable Aviation Fuel Production Facility. Available online: https://www.lanzajet.com/news-insights/lanzajet-celebrates-grand-opening-of-freedom-pines-fuels-plant-the-worlds-first-ethanol-to-sustainable-aviation-fuel-production-facility (accessed on 26 March 2024).
  67. Atsonios, K.; Li, J.; Inglezakis, V.J. Process analysis and comparative assessment of advanced thermochemical pathways for e-kerosene production. Energy 2023, 278, 127868. [Google Scholar] [CrossRef]
  68. Clean Skies for Tomorrow: Sustainable Aviation Fuels as a Pathway to Net-Zero Aviation; World Economic Forum in collaboration with McKinsey & Company: Davos, Switzerland, 2020.
Figure 1. Block flow diagram of the integrated BtL concept.
Energies 17 01685 g001
Figure 2. Validation of the 200 MWth DFBG model.
Energies 17 01685 g002
Figure 3. Validation of the liquid fermentation model via experimentally measured fatty acid distribution.
Energies 17 01685 g003
Figure 4. Energy balance of the integrated concept (200 MWth full-scale simulations).
Energies 17 01685 g004
Figure 5. Carbon balance of the integrated concept (200 MWth full-scale simulations).
Energies 17 01685 g005
Figure 6. Installed cost breakdown of the main process parts.
Energies 17 01685 g006
Figure 7. Cost breakdown of the annual operational streams.
Energies 17 01685 g007
Figure 8. Sensitivity analysis on MJSP via the variation of key process parameters (dashed line refers to the baseline value).
Energies 17 01685 g008
Figure 9. Sensitivity analysis on discounted payback period and NPV via the variation of final product selling prices.
Energies 17 01685 g009
Figure 10. MJSP positioning of this study among recent MJSP predictions for the dominant SAF technologies [10].
Energies 17 01685 g010
Figure 11. Comparative analysis of levelized production costs for the concept of this study, the FT via gasification, and the AtJ via gasification pathways (as a percentage of total).
Energies 17 01685 g011
Table 1. Operating conditions of the thermochemical part.
ParameterInput
Pressure (bar)1.5
Gasifier temperature (°C)780
Oxidizer temperature (°C)880
Steam-to-biomass ratio (kg/kg dry, ash-free)0.7
Steam pre-heating temperature (°C)350
Air pre-heating temperature (°C)400
Reformer (ATR) temperature (°C)900
Steam-to-carbon ratio (ATR) (mol/mol)1.5
Alkaline scrubber temperature (°C)35
Table 2. Operating conditions of the biological part.
ParameterInput
Gas Fermentation Pressure (bar)5
Gas Fermentation Temperature (°C)55
Liquid Fermentation Pressure (bar)1
Liquid Fermentation Temperature (°C)28
Steam Pressure for Steam Explosion (bar)5
Steam Temperature for Steam Explosion (°C)150
Table 3. Operating conditions of the thermocatalytic part.
ParameterInput
Reactor pressure (bar)100
Reactor temperature (°C)370
Hydrogen-to-TAGs ratio (kg/kg)0.05
Table 4. Conversion rates for syngas fermentation.
ParameterInput
Conversion of CO in Reaction (1)5%
Conversion of H2 in Reaction (2)5%
Conversion of CO in Reaction (3)95%
Conversion of H2 in Reaction (4)95%
Table 5. Conversion rates for acetate fermentation.
ParameterInput
Conversion of CH3COOH in Reaction (5)10.0%
Conversion of CH3COOH in Reaction (6)42.8%
Conversion of CH3COOH in Reaction (7)21.1%
Conversion of CH3COOH in Reaction (8)12.6%
Conversion of CH3COOH in Reaction (9)13.5%
Table 6. Properties of the simulated jet fuel (deriving from fractionation) and Jet A-1 specifications (ASTM D1655).
ParameterUnitSimulated JetJet A-1 Spec
LHVMJ/kg44.4>42.80
Density (15 °C)kg/m3730775–840
Viscosity (−20 °C)mm2/s5.45<8.0
Flash point°C48.5>38.0
Distillation 10%°C170.9<205.0
Distillation 100%°C270.7<300.0
Table 7. Summary of the main simulation results for the BtL concept.
ParameterUnitValue (Simulation Output)
Feed (crushed bark)t/h40.46
Liquid product (jet fuel)t/h4.36
Liquid product (diesel)t/h1.08
Cellular biomass (by-product)t/h1.21
Electric power demandMWel8.20
Energetic Fuel Efficiency (EFE)%35.60
Carbon Utilization (CU)%25.40
Liquid Fuel mass yield (kgproduct/kgfeed)%13.44
Table 8. Total Capital Investment (TCI) methodology.
Direct Capital Costs (Total Installed Costs—TIC)Sum of the Apparent Installed Costs for the Thermochemical, Biological, and Thermocatalytic Parts
Indirect Capital Costs (IC)60% of TIC
Total Direct and Indirect Costs (TDIC)TIC + IC
Contingencies10% of TDIC
Fixed Capital Investment (FCI)TDIC + Contingencies
Working Capital (WC)10% of FCI
Total Capital Investment (TCI)FCI + WC
Table 9. Economic assumptions.
Economic Parameters
Plant lifetime25 years
On-stream factor85% (7446 h per year)
Discount rate6%
Tax rate0%
Construction period2 years (40% 1st year, 60% 2nd year)
Fixed operating costs
Maintenance2% (FCI)
Property insurance0.7% (FCI)
Personnel *100 employees [42]
Average annual salary per employee **35,000 €/year [44]
Variable operating costs
Feedstock cost (crushed bark)70 €/t [45]
Nutrients and chemicals (fermentation)0.6% of biological part direct costs [38]
NaOH makeup for alkaline scrubber230 €/t [46]
Wastewater discharge4 €/t [47]
Electricity price (business)0.09 €/kWh [48]
Diesel (by-product)1800 €/t [49]
Cellular biomass (by-product)700 €/t [50]
* According to annual plant capacity (liquid products). ** For the European chemical industry.
Table 10. Capital Expenditures (CapEx) of the BtL plant.
Dual Fluidized Bed Gasification80,000,000 €
Catalytic Reformer8,500,000 €
Gas Conditioning (coolers, alkaline scrubber)10,500,000 €
Gas Compression5,000,000 €
Gas Fermentation80,000,000 €
Liquid Fermentation64,000,000 €
Downstream Processing (TAGs recovery)16,000,000 €
Hydrotreatment/Hydrocracking22,000,000 €
Utilities and Storage12,000,000 €
Total installed costs (direct costs)298,000,000 €
Indirect costs178,800,000 €
Total direct and indirect costs476,800,000 €
Contingency47,680,000 €
Fixed Capital Investment (FCI)524,480,000 €
Working Capital52,448,000 €
Total Capital Investment (TCI)576,928,000 €
Table 11. Annual Operational Expenditures (OpEx) of the BtL plant.
Feedstock costs21,090,646 €year
Electricity5,361,120 €/year
Maintenance10,489,600 €/year
Labor costs3,500,000 €/year
Nutrients and chemicals1,054,532 €/year
Property Insurance3,671,360 €/year
Solvent makeup2,959,338 €/year
Wastewater discharge1,858,164 €/year
Annual operational expenses49,984,760 €/year
Income from diesel14,475,024 €/year
Income from cellular biomass6,288,716 €/year
Annual revenue streams (by-product credits)20,763,740 €/year
Table 12. Main boundary conditions for the examined business cases and calculated minimum selling prices.
Business CaseJet Fuel ScenarioMicrobial Oil Scenario
TCI (€)576,928,000526,592,000
Annual operating costs (€/year)49,984,76048,749,240
Income from diesel (€/year)14,475,024-
Income from cellular biomass (€/year)6,288,7166,288,716
Biomass feed (t/year)301,295301,295
Produced jet fuel (t/year)32,435-
Produced diesel (t/year)8042-
Produced microbial oil (t/year)-50,395
MJSP (€/L)1.83-
MOSP (€/L)-1.32
Disclaimer/Publisher’s Note: The statements, opinions and data contained in all publications are solely those of the individual author(s) and contributor(s) and not of MDPI and/or the editor(s). MDPI and/or the editor(s) disclaim responsibility for any injury to people or property resulting from any ideas, methods, instructions or products referred to in the content.

