1. Introduction
Fossil fuels, including oil, natural gas, coal, and derivatives, are the main sources of energy used globally [
1,
2]. Although they exist in large quantities on the Earth, the current scenario of high levels of dependence on this type of fuel is worrying as these reserves are finite, and eventually we will no longer be able to rely on them. Another great disadvantage of using non-renewable energy sources is their high environmental impact. Among the various alternative energy sources that already exist, biogas has emerged as a promising biofuel. Biogas is generated through the anaerobic digestion (AD) of organic matter via a fermentation process divided into four distinct main steps [
3]. The biogas composition is mostly biomethane, as well as other gases such as carbon dioxide, hydrogen, nitrogen, and hydrogen sulfide gas [
4].
As biogas has biomass as its raw material, aligning it with another constant concern of the population which is the demand for water, can contribute to a circular economy with the recovery of waste. Sewage treatment using AD has emerged as a technology that can be utilized for water and energy components. AD is a technological alternative that is particularly interesting in warm climates regions. Thus, this option remains in the spotlight in Brazil, a country that, despite being one of the world’s largest economies, still dumps around 50% of its untreated sewage into the environment [
5].
Therefore, in addition to basic sanitation, using sewage as an energy source can be beneficial for reducing the incorrect disposal of this waste, thereby minimizing its environmental impacts [
6]. The biomethane obtained from AD is a natural gas with a high calorific value, and, if emitted uncontrollably, it has a greater heating potential than that of CO
2. Among the possible ways to use this byproduct of sewage treatment are boilers, vehicles, and electricity [
7]. Regarding this last option, in recent years, there has been a global increase in the use of biomethane, with the values increasing from 46,108 to 92,860 GWh between 2010 and 2020 [
8]. When purified to a content of at least 95% biomethane, biogas can replace natural gas in various applications. Several studies have been carried out regarding the advantages and environmental impacts of this substitution, especially considering the generation of biomethane from waste [
9,
10,
11,
12].
Regarding the natural gas scene in Brazil, the country has a high dependence on imports, a limited distribution network, and a growing number of vehicles that use natural gas. Thus, replacing NG with biomethane is an opportunity worth exploring [
3]. In this context, the state of São Paulo (SP) has high potential for biogas production, as it is the most populous in the country, therefore producing the most urban sewage. SP also has the highest consumption of natural gas [
13].
Considering the points elucidated above, the aim of this study was to evaluate the energy potential of sewage generated in the state of São Paulo when using it as a raw material for the production of biomethane, and when using it as an alternative to natural gas in order to reduce CO2 emissions and shift to a more sustainable energy matrix.
2. Material and Methods
2.1. Study Area and Obtaining Input Data
The state of São Paulo (SP) is divided into 645 cities with a total area of 248,219 km
2 and more than 44 million inhabitants. SP currently has sewage treatment for 68% of the population; of the remainder, for 22%, sewage is collected but not treated, and, for 10% of the inhabitants, sewage is neither treated nor collected. Given its economic scene, SP has a higher treatment and collection rate than that of the Brazilian average (around 50%). Among the most widely used sewage treatment technologies are activated sludge systems, which are more common in large cities, and anaerobic systems and stabilization ponds, more common in small- and medium-sized cities [
4,
14].
Data on the sewage collected, GDP per capita, and estimated population for each city in the SP state were obtained from the Brazilian Institute of Geography and Statistics (IBGE) for the year 2022 [
14]. The natural gas demand data for the SP cities were obtained from the “Energy Yearbook by Cities in the State of São Paulo, Base Year 2020” by the São Paulo State Infrastructure and Environment Secretariat [
13].
Moreover, the lower heating value (LHV), specific mass, and CO
2 emission factor for natural gas containing 89.24% (
v/
v) methane and purified biomethane were used for estimates and calculations (
Table 1), as this is the percentage of CO
2 in disregarded raw biogas in the study. It should be noted that, as the CO
2 emission factor of natural gas depends on its application, an average was obtained between the values proposed by Nazari et al. [
15] and Sequeira [
16].
2.2. Calculating the Sewage Energy Potential
Regarding the data on the sewage collected, it was identified that some cities in the state of São Paulo had no information on the volume of sewage collected. For this reason, a mathematical model was developed by means of multiple linear regression, using Thonny software, version 4.1.1, and existing data, in order to estimate the volume for these cities. This correlation is characterized by a linear dependence on the population and the GDP per
capita variables of each city, according to Equation (1), as presented by Oliveira et al. [
20].
where SG is the sewage generation (m
3/d); POP is the population (inhab.); GDP is the gross domestic product per capita (
$/inhab.); and β
0, β
1, and β
2 are the adjustment constants.
Next, Equation (2) from IPCC [
21] was used to calculate the biomethane volume that would be generated annually in upflow anaerobic sludge blanket (UASB) reactors. UASB reactors are digesters which are used repeatedly in Brazil and other warm-climate countries to treat sewage, even low-strength wastewaters such as domestic sewage.
where t
met is the amount of biomethane generated annually via sewage treatment (ton/yr); SG is the volume of sewage collected (m
3/d); BOD is the mean concentration of the biodegradable organic matter of 0.00035 ton/m
3 (0.00020~0.00050 ton/m
3); ε is the efficiency adopted for the UASB reactor, disregarding fugitive methane emissions (75%); the value 0.6 (ton/ton) corresponds to the biomethane emission factor [
21]; and R is the amount of biomethane recovered. The amount of flared or recovered CH
4 for energy use should be subtracted from the total emissions [
21]. In this study, R was considered to be zero because the energy use of sewage does not involve the recovery of biomethane, but rather its transformation into energy. The possible instability of biogas yield, which depends on the methanogenic archaea activity was not considered, as we considered a realistic UASB efficiency in Brazil (75% of BOD removal), and the time basis of one-year can minimize such variations in the estimation.
Equation (3) was used to determine the amount of energy obtained via biomethane in kWh/yr (E
met).
where t
met is the amount of biomethane generated in the year obtained from Equation (2) (ton/yr); 1000 is the conversion factor from ton to kilogram; LHV
met is the biomethane lower heating value (kcal/m
3); ρ
met is the biomethane specific mass (kg/m
3); and 860 is the conversion factor from kcal to kWh.
2.3. Calculating the Amount of Natural Gas to Be Replaced by Biomethane Produced in Sewage Treatment and the Reduction in CO2
To assess the amount of natural gas that could be replaced by biomethane, it was necessary to compare the energy generated by both fuels. The energy demand, owing to natural gas consumption in kWh/yr (E
ng), for each city was calculated using Equation (4).
where NG is the quantity of natural gas consumed (m
3/yr); LHV
ng is the lower heating value for natural gas with 89.24% methane in its composition (kcal/m
3); and 860 is the conversion factor from kcal to kWh.
Thus, the percentage (%) of natural gas that could be replaced by the production of biomethane from sewage (NGRM) was determined using Equation (5).
In order to calculate the amount of carbon dioxide that would no longer be emitted by replacing natural gas with biomethane, the NG was multiplied by the amount of CO
2 emitted per volume of natural gas (ton/m
3). As biogas has a neutral carbon balance, its CO
2 emissions are considered to be zero [
19].
2.4. Process of Reallocating Generation Potential to Meet Demand
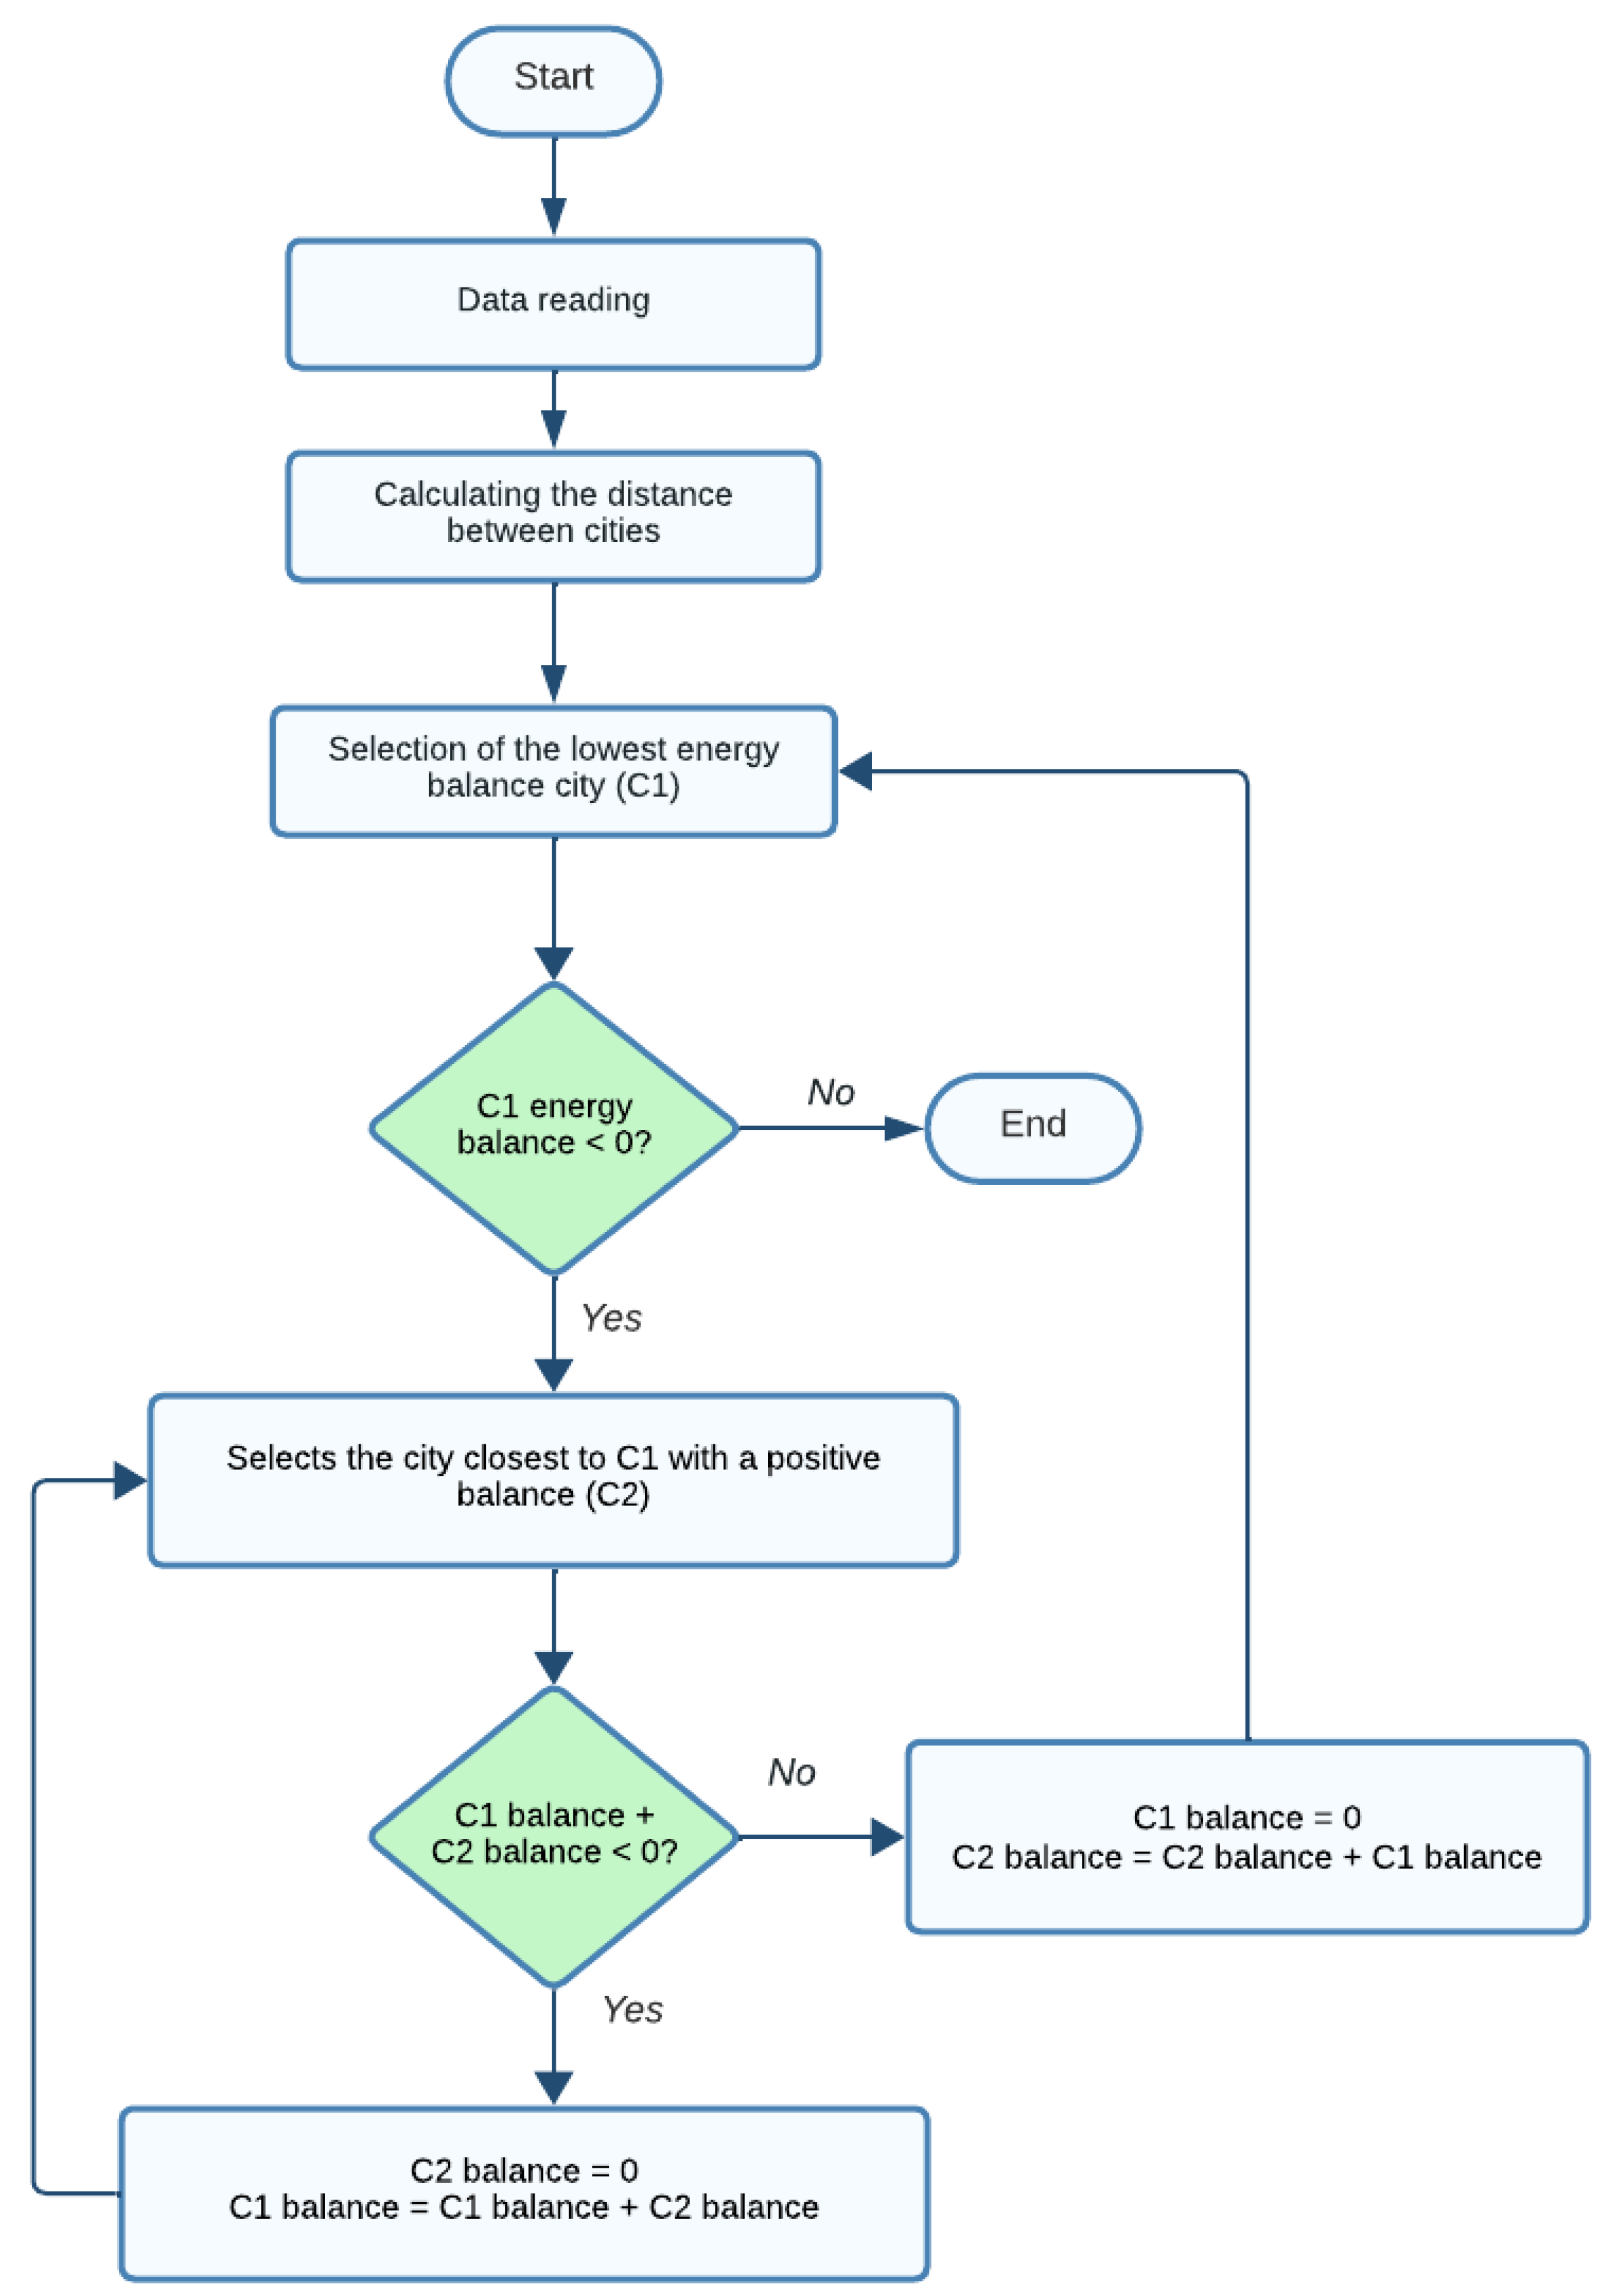
In order to address a possible allocation of biomethane that could potentially be produced in each SP city and sent to currently NG-consuming cities, an optimization algorithm was proposed (
Figure 1).
The step-by-step reallocation process shown in the flowchart in
Figure 1 consists of seven steps as follows:
Step 1: Reading data from the cities, such as geographical coordinates (latitude and longitude) and energy balance (difference between generation potential and natural gas demand).
Step 2: Calculate the distance between cities from geographical coordinates, resulting in a distance matrix.
Step 3: Scanning energy balance data, and selecting the city with the lowest balance (difference between potential methane and NG consume) (city “C1”).
Step 4: If C1 has a deficit in meeting the demand, that is, a balance of less than zero, the city closest to C1 with a positive balance is selected (city “C2”).
Step 5: If C2’s positive balance is sufficient to cover C1’s deficit, C1’s balance, which is negative, is reset to zero (demand completely met), and the amount of energy reallocated to C1 is subtracted from C2’s balance. The optimization process returns to Step 3, and a new city, C1, is selected.
Step 6: If the positive balance of C2 is not enough to cover the deficit of C1, the balance of C1 is added to the balance of C2, and the balance of C2 is reset to zero, owing to the reallocation of surplus energy from C2 to C1. The optimization process returns to Step 4, and a new city, C2, is selected.
Step 7: The optimization process is completed when the city with the lowest energy balance is able to meet the demand, that is, when the lowest energy balance is greater than or equal to zero.
The optimization process returns for each C1 city that initially had a deficit in meeting the demand, in which the C2 city had resources reallocated to C1 and the total distance of this resource moved.
2.5. Financial Analysis
A simplified biodigester (an UASB built in a simplified way) was chosen to estimate the financial assessment. Initially, the cities’ biodigesters were sized according to the volumes of sewage produced by each one. Next, the cost of building and implementing each digester, which is the initial investment value of the system, was calculated. This value also includes a 39% additional cost for installation and the other materials and equipment that make up the system, such as the biogas purification system.
Three simulation scenarios, changing whether or not depreciation and maintenance were included, were carried out as follows: Scenario 1, with depreciation and maintenance; Scenario 2, without depreciation and with maintenance; and Scenario 3, without depreciation and without maintenance. In the case of scenarios without depreciation and maintenance costs, these burdens would be allocated to the sanitation concessionaires. To assess the viability of the project, the net present value (NPV) and the discounted payback (DBP) were calculated for each of the three scenarios.
The NPV is used to obtain the value of the return on the investment at present, and consists of bringing all the cash flows to the current date, adding them to the value of the initial investment, and using a minimum attractiveness rate of return (MARR) as the discount rate. MARR refers to the minimum percentage an investor is willing to receive when making an investment. In this study, a MARR of 5.64% yearly was considered, which is in line with the proposal of Cervi et al. [
22]. In turn, the PBD is the period it takes for the investor to obtain a return on the capital invested, considering the time value of money, that is, the discount rate is also taken into account. This value is obtained by equating the NPV to zero.
All calculations and considerations were made according to the methodology proposed by Oliveira et al. [
20], who used data from the Brazilian National System for Research Construction Costs and Indices (SINAPI) to study anaerobic digesters. For the NG sales price to distributors and free consumers in the São Paulo region, the value of 16 USD/MMBTU was considered [
23].
3. Results and Discussion
3.1. Sewage Energy Potential
In order to estimate the daily volumes of sewage for the cities in the state of São Paulo that do not have sewage collection data (m
3/yr), multiple linear regression was carried out, generating Equation (6).
The model displayed in Equation (6) had a high root mean square error due to the high dispersion of the data. However, the coefficient of determination (R2) was very close to one (R2 = 0.988), indicating a good fit to the data. Thus, using Equation (6), it was possible to obtain the volume of collected sewage for all the cities in the São Paulo state. Equation (2) was then used to calculate the volume of biomethane potentially generated via anaerobic digestion, which resulted in a total of 336,140 ton/yr.
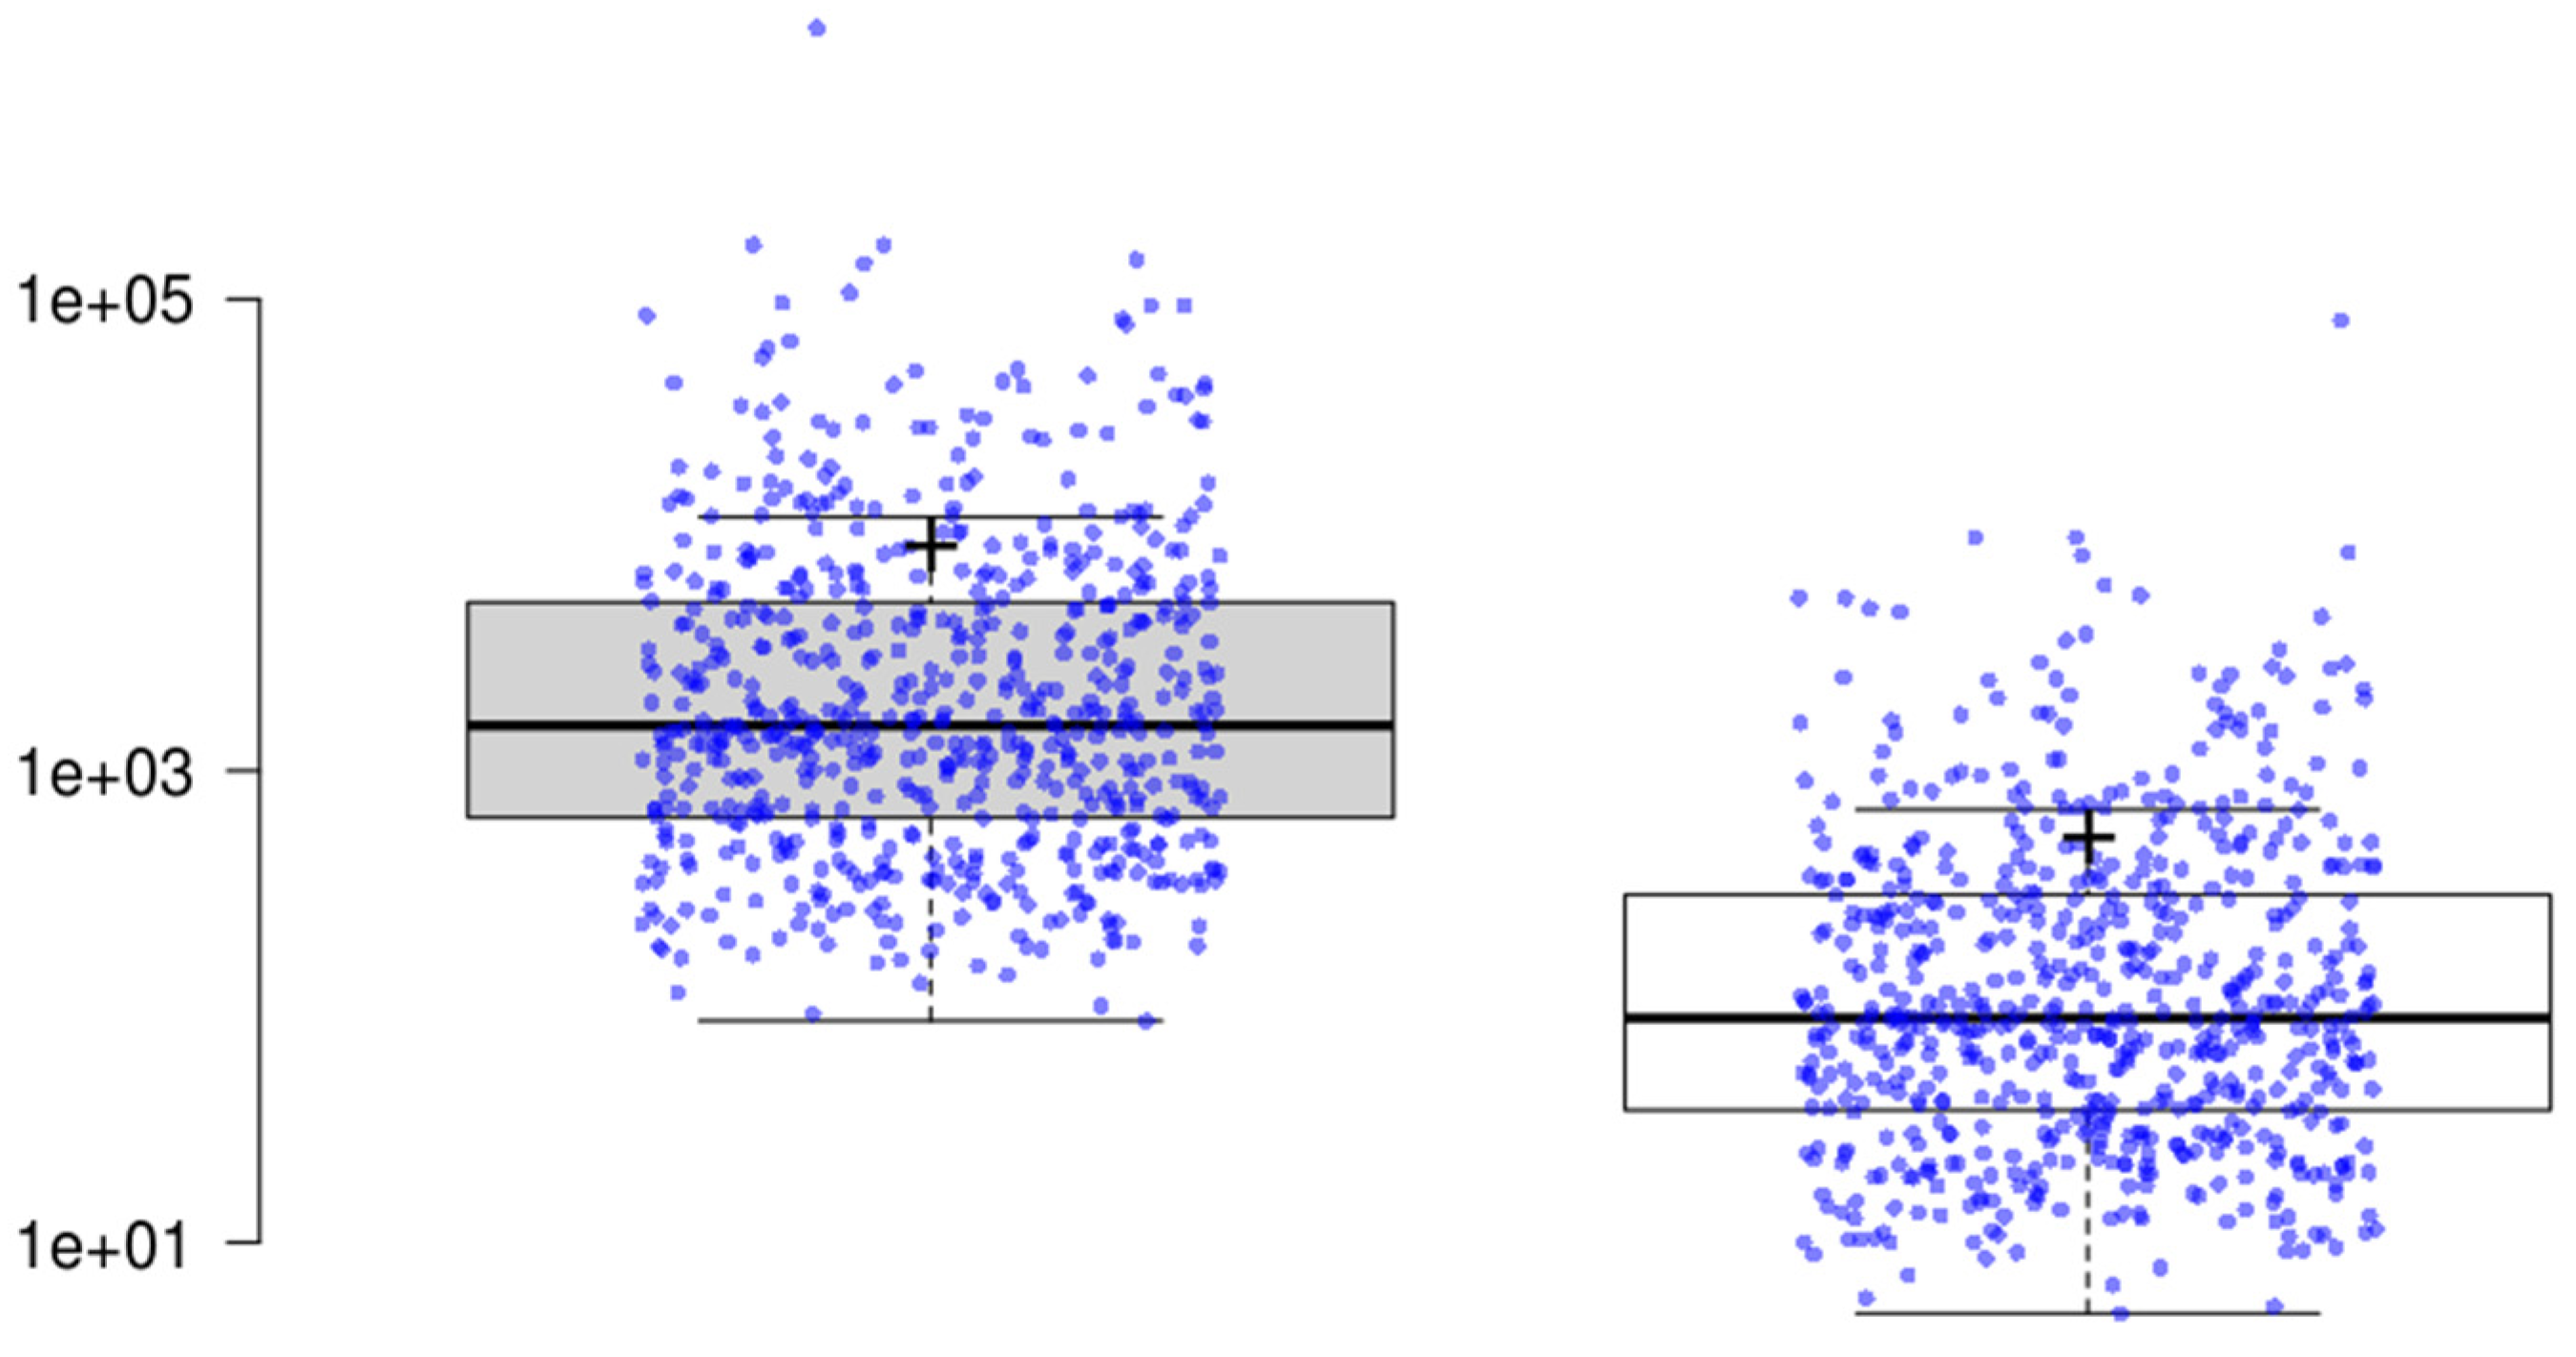
Regarding these predicted values, descriptive statistical analysis showed a high standard deviation and coefficient of variation, largely due to the fact that São Paulo has cities of very different sizes. As the data are highly dispersed, it can be seen that the mean values, close to 9000 m3/yr per city (sewage) and 520 ton/yr per city (biomethane), does not properly represent them.
A quartile analysis was then made (
Figure 2), highlighting that 75% of the cities had a volume of sewage collected of less than 5184 m
3/yr and a rate of biomethane production from this wastewater of less than 298 ton/yr, which can be seen in the third quartile.
3.2. Predicting the Natural Gas Demand Potentially Supplied by Biomethane
Based on data found in the literature, natural gas consumption is 5.11 × 10
9 m
3/yr for the São Paulo state [
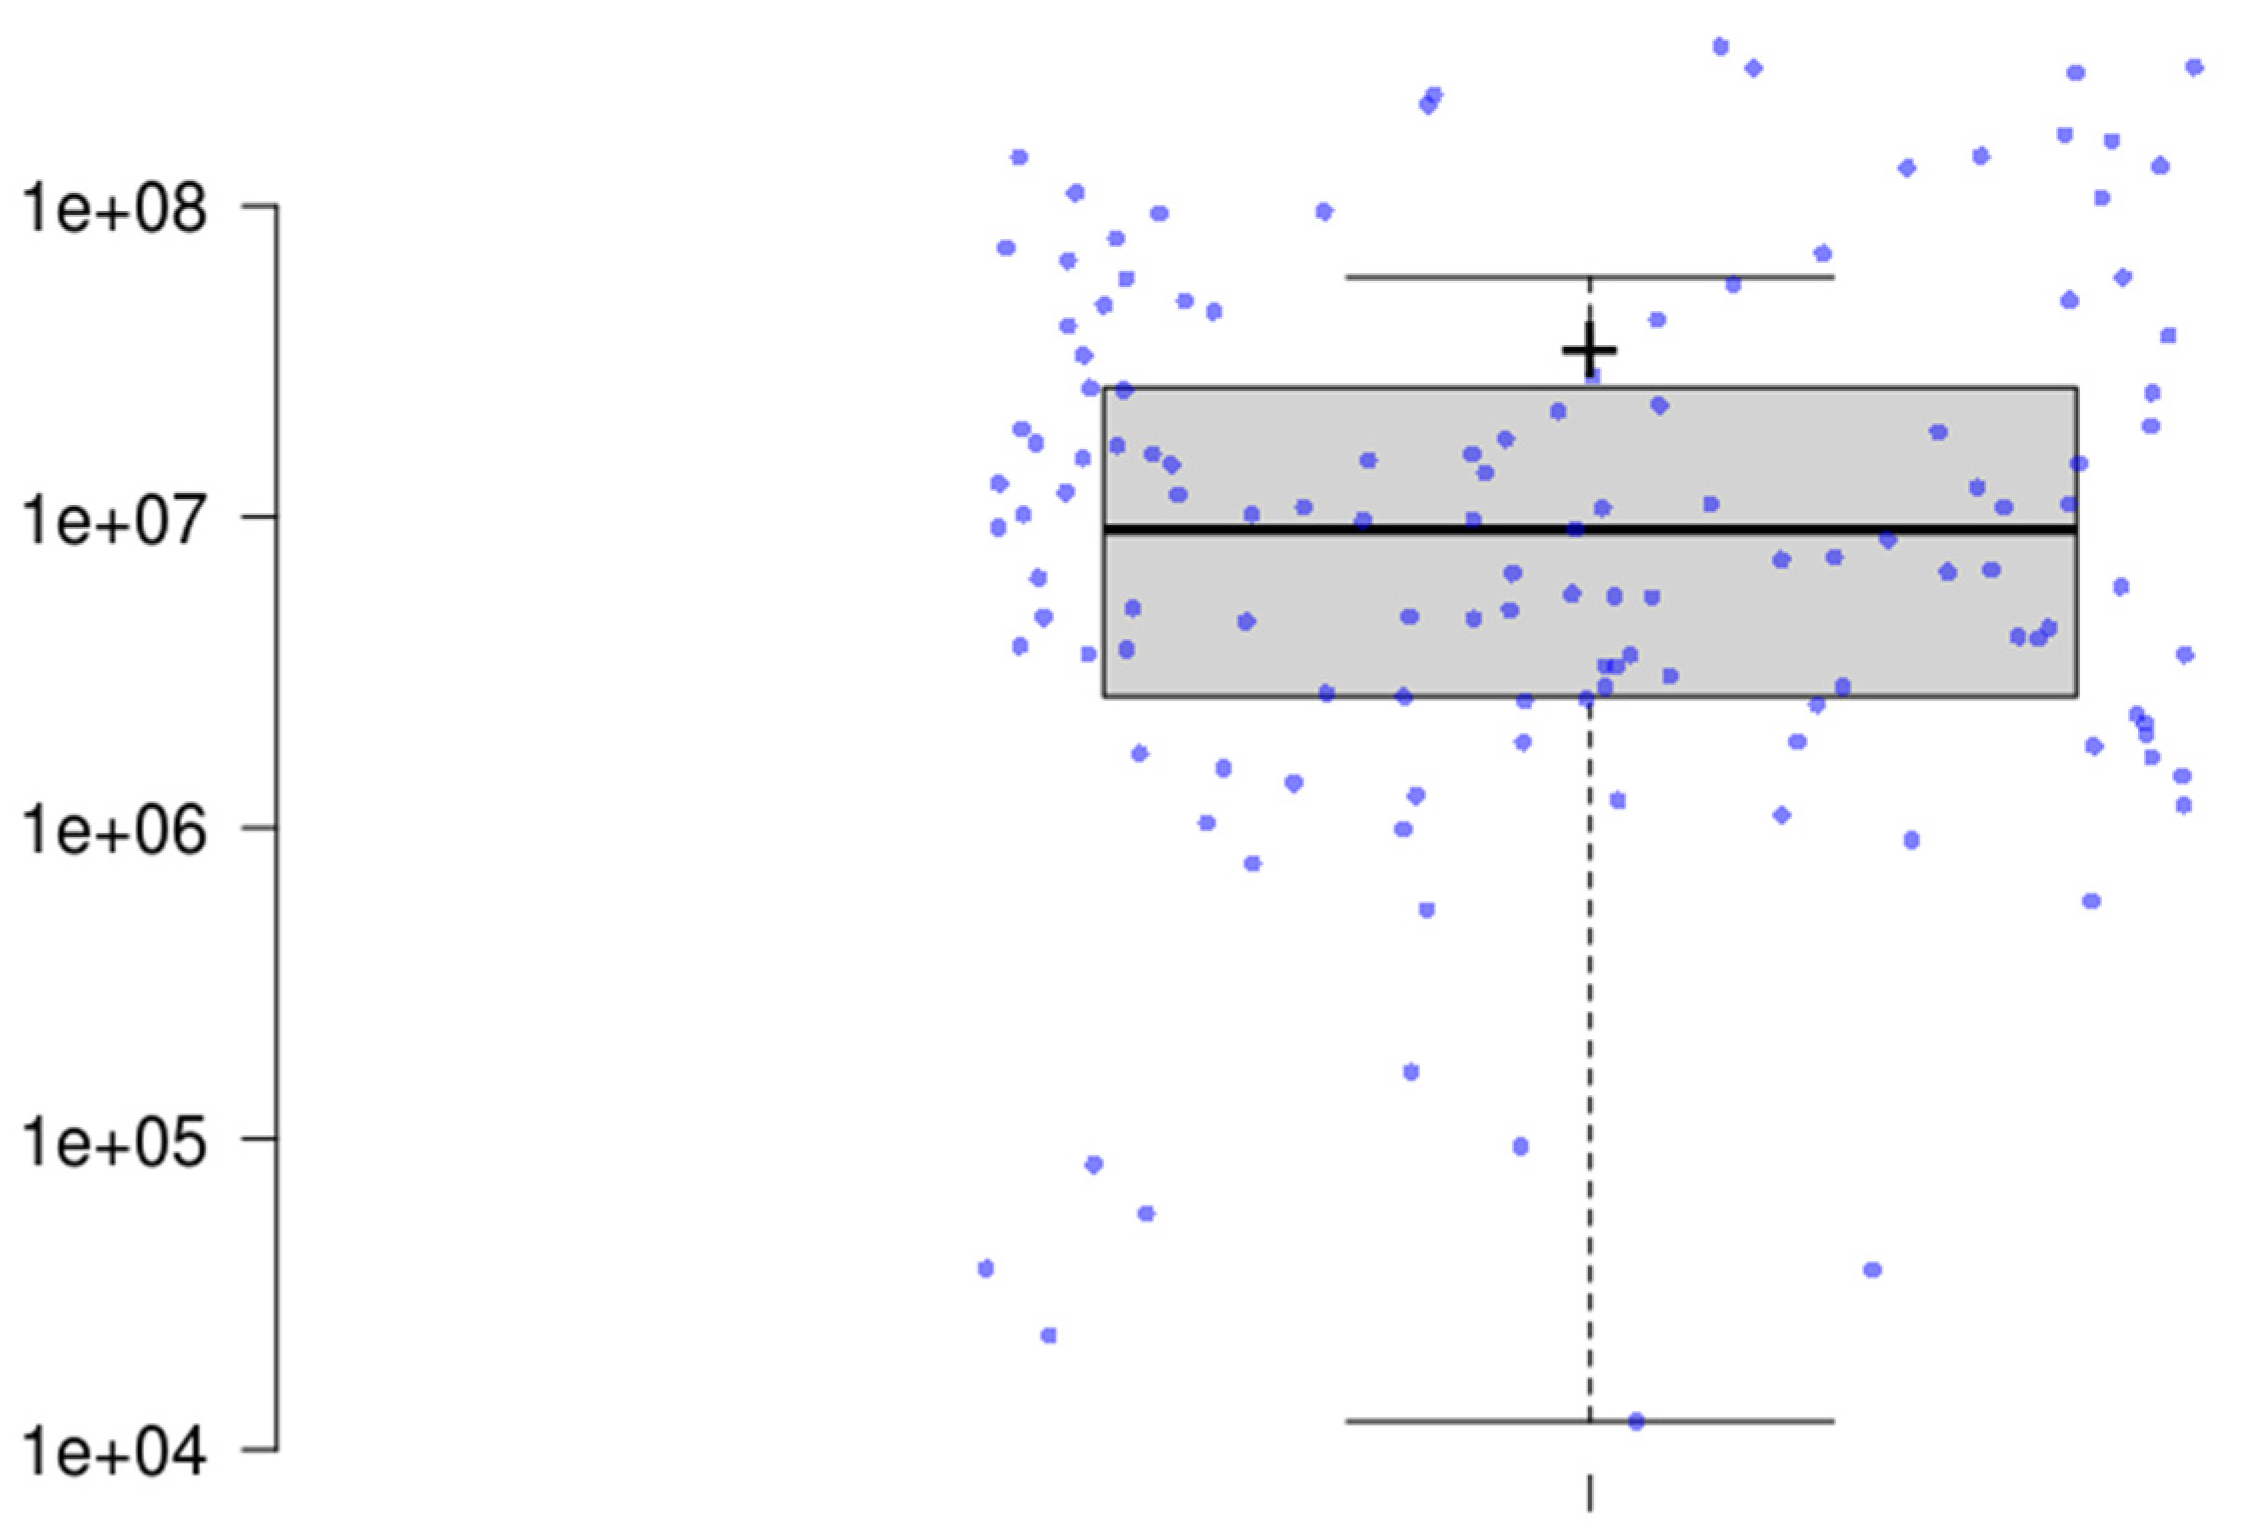
13]. To conduct a descriptive statistical analysis, data from 130 cities with natural gas consumption were used. The results are shown in
Figure 3, and the mean was equal to 39.33 × 10
6 m
3/yr. For a better understanding, the quartile analysis shows that 75% of the cities that consumed natural gas consumed less than 27.75 × 10
6 m
3/yr and 50% of them consumed less than 9.18 × 10
6 m
3/yr.
In order to make a comparison between the energy demand for natural gas and the energy obtained from biomethane produced from sewage treatment, Equation (4) was used to calculate the amount of natural gas energy consumed by each city each year, giving a total of 50.50 × 10⁹ kWh/yr for the whole SP state.
Equation (5) was used to determine the percentage of natural gas energy that could be supplied by the production of biomethane from sewage, which is 9.27%. It is worth noting that of the cities consuming NG, 120 would not have their demand for natural gas fully satisfied by the biomethane produced, whereas, in 10 cities, this volume would exceed the demand.
The city of São Paulo (the state capital) has the greatest potential to produce biogas from domestic sewage, which can be explained by the high sewage production generated by its large population. In addition, the city of Santa Gertrudes (~23,600 inhab.), which is currently the main hub for ceramic tile industries in Brazil, stood out for having one of the three highest consumptions of natural gas, leading to it being the city with the lowest percentage of natural gas supplied from biomethane (Equation (5)), with NG currently being the main source of thermal energy for these industries.
A similar study was conducted in the state of Paraná (the fifth largest Brazilian state) with 239 wastewater treatment plants (WWTPs), where mathematical models were used to verify the energy potential of the by-products of anaerobic sewage treatment. It was concluded that biogas is the main by-product generated by UASB reactors in Paraná; therefore, if used throughout this state, it can meet the energy demand of a city with 111,000 inhabitants. Biogas accounts for 65, 64%, and 74% of the total energy potential (sludge and biogas) of small, medium, and large WWTPs, respectively [
24].
Udaeta et al. [
25] evaluated the potential for electricity production linked to biogas in the WWTPs of São Paulo state, concluding that the use of biomethane would supply the operational electricity annual consumption in these wastewater treatment plants. Recently, Morais et al. [
26] calculated the potential for biomethane production by regulating the disposal of municipal solid wastes in landfills. The value obtained by the authors was 4.68 × 10
9 kWh/yr for the entire São Paulo state.
3.3. Reducing CO2 Emissions
Currently, a quarter of the world’s energy comes from natural gas, and concerns regarding its emissions are continuously growing [
27]. Crane et al. [
11] studied ways to reduce the intensity of CO
2 emissions from natural gas without a transitioning infrastructure, emphasizing some route options. In the current study, we obtained the amount of carbon dioxide that would no longer be emitted when natural gas is replaced with biomethane. Biogas has a neutral carbon balance; therefore, its CO
2 emissions are considered to be zero [
19]. In this way, the amount of CO
2 that would no longer be emitted when replacing natural gas with biomethane is equal to the total volume of CO
2 emitted by natural gas.
The predicted potential to reduce CO2 emissions here is 1.81 × 10⁶ ton/yr, considering the use of biomethane produced in a municipal WWTP within the boundaries of the city itself, at NG-consumption points (industrial, commercial and domestic) in the same city. In the case of reallocation of biomethane between cities, the potential would be proportional to the NGRM for the whole state (9.27%), reaching 2.42 × 10⁶ ton/yr.
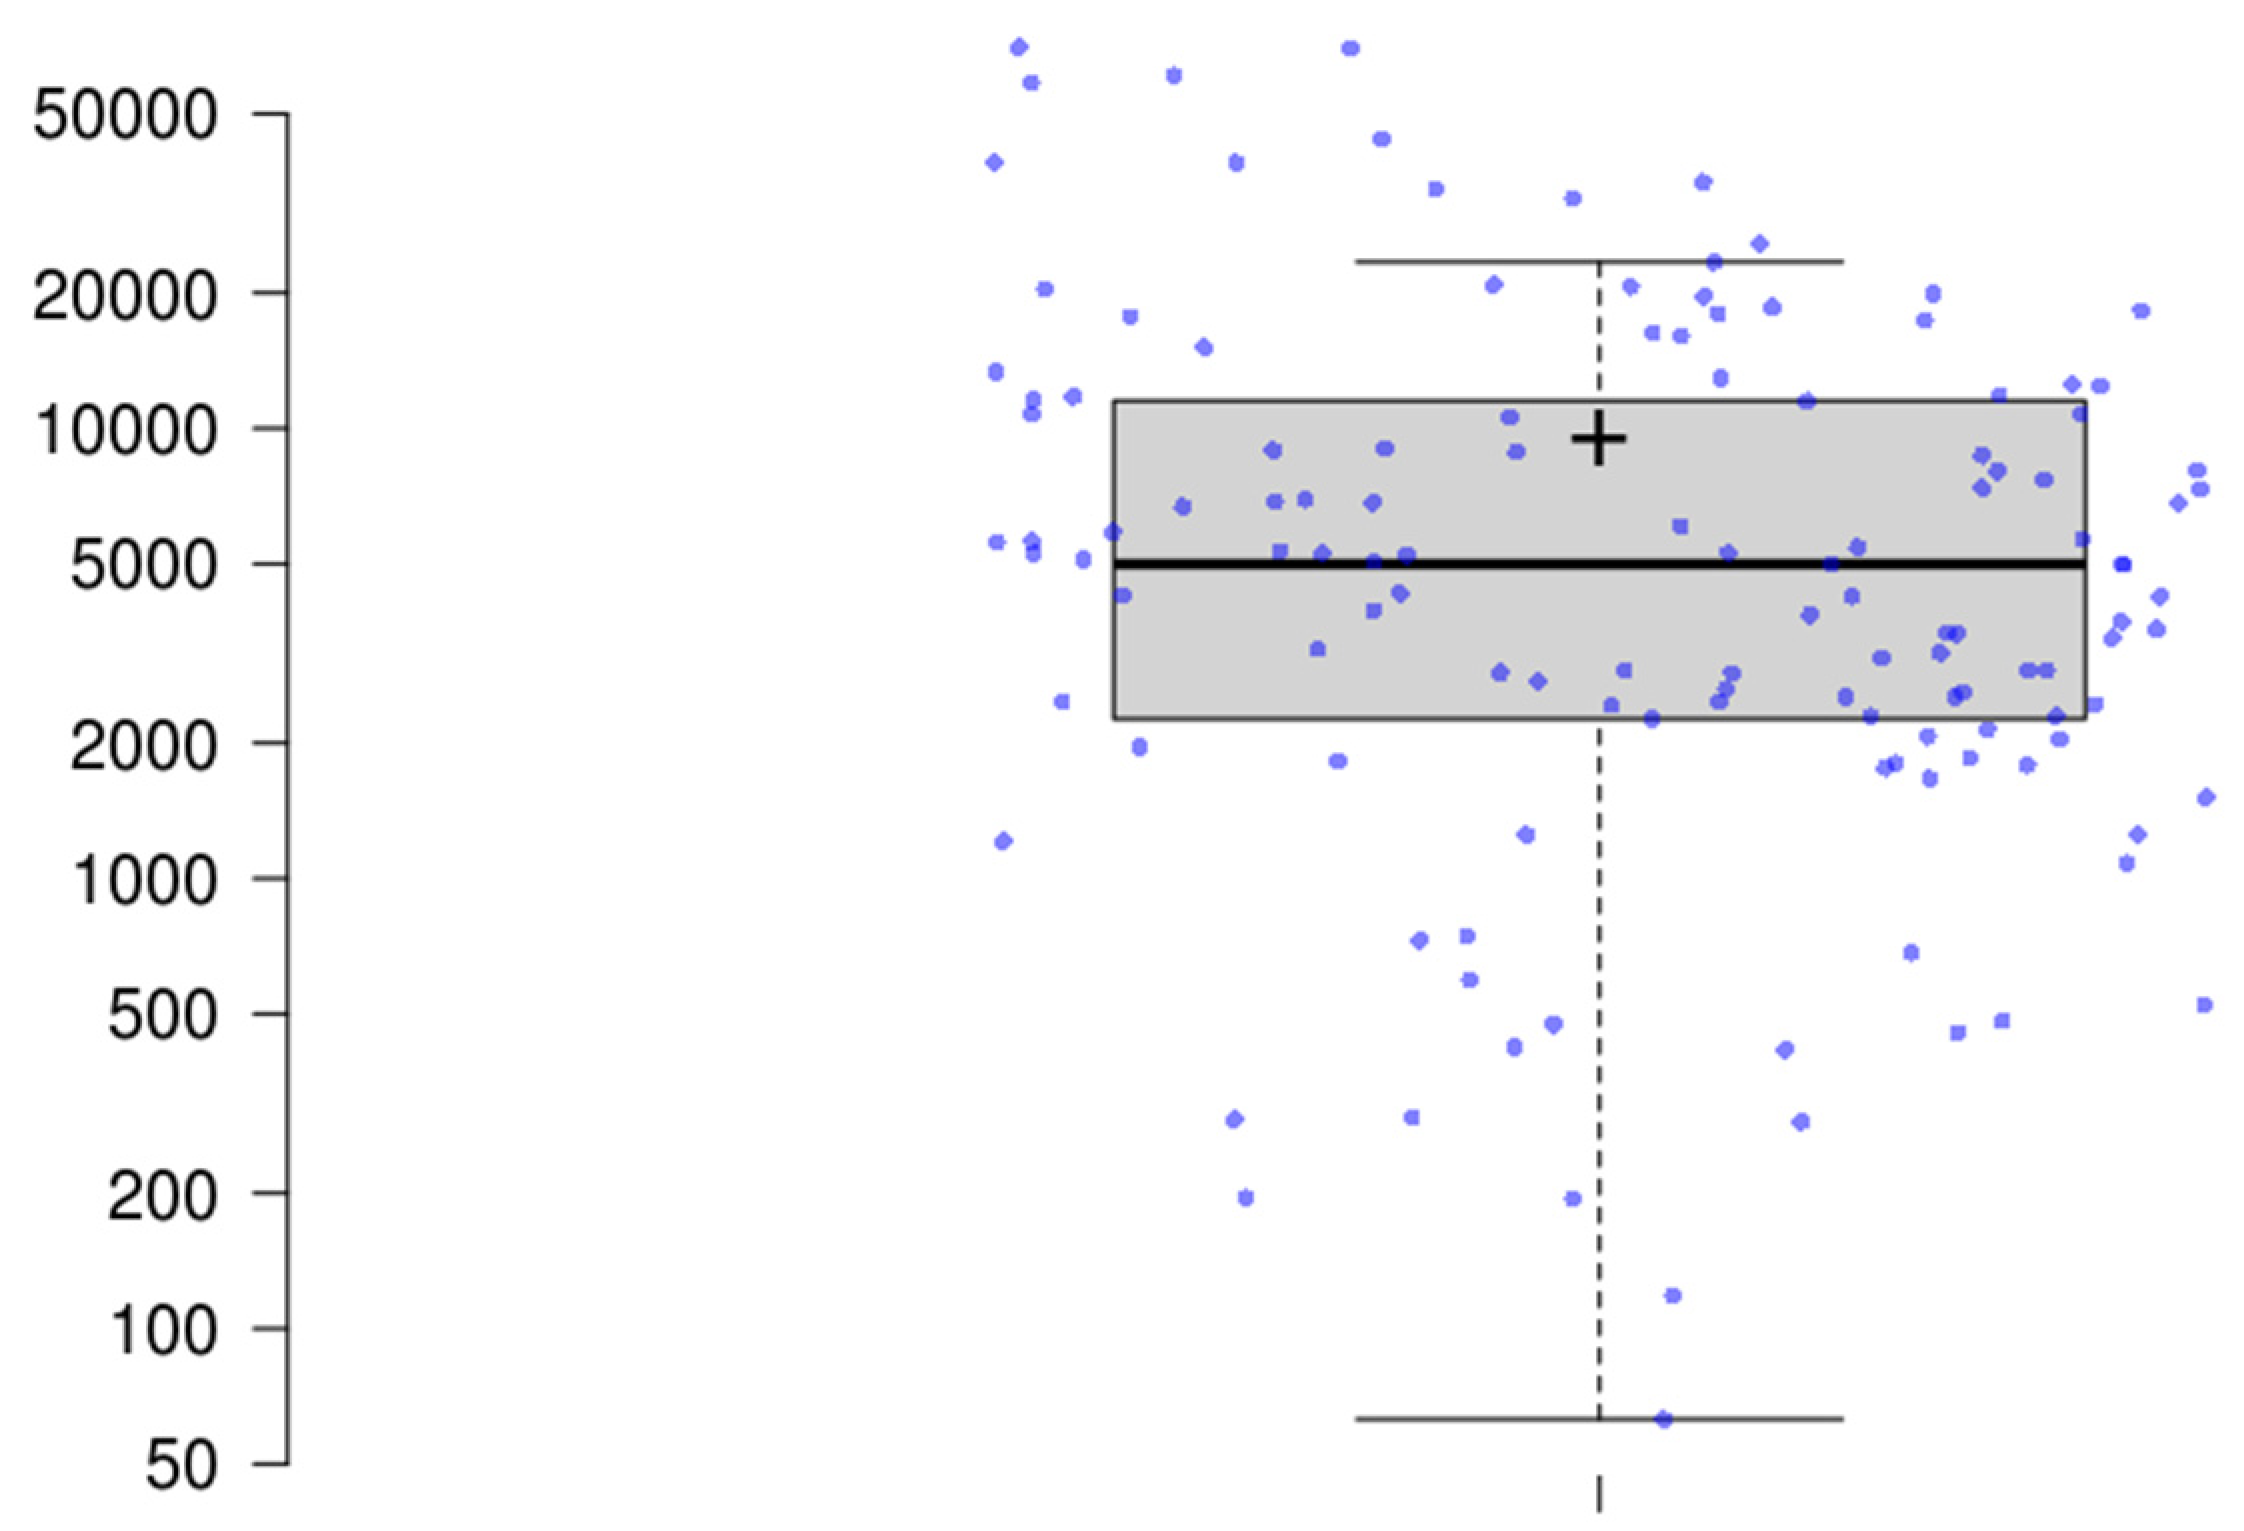
A descriptive statistical analysis of the data relating to the 130 cities that consumed NG also showed high dispersion rates; therefore, the mean reduction in CO
2 emissions is not representative. The quartile analysis (
Figure 4) was then performed, showing that only 25% of the cities that consumed NG would have reduced their CO
2 emissions by more than 11,563 ton/yr. The greatest reduction in CO
2 emissions were predicted for the biggest cities in the state (São Paulo, Campinas, and Guarulhos).
Repele et al. [
9] carried out a study of the life cycle analysis of the biomethane supply system for an industrial natural gas network plant in Latvia, finding that the greatest impacts of this plant are linked to energy, which, for the specific case, was related to transportation, an aspect of the process that is still predominantly non-renewable.
Morais et al. [
26], when studying the potential for energy production from landfills in the Southeast region of Brazil (SP and three other states) over the next 20 years, found a potential that would contribute to an average annual reduction of 467.1 million tons of CO
2 emissions, demonstrating an expressive and sustainable environmental impact. In fact, in the literature, the NG replacement with biomethane is usually completed using solid waste digestion, with few studies using domestic sewage, as presented here. An important point, mentioned by Bakkaloglu et al. [
12], is to pay attention to fugitive CH
4 emissions, which have an expressive impact on this type of approach (NG replacing with CH
4 to reduce GHG emissions).
3.4. Reallocation of Energy Potential
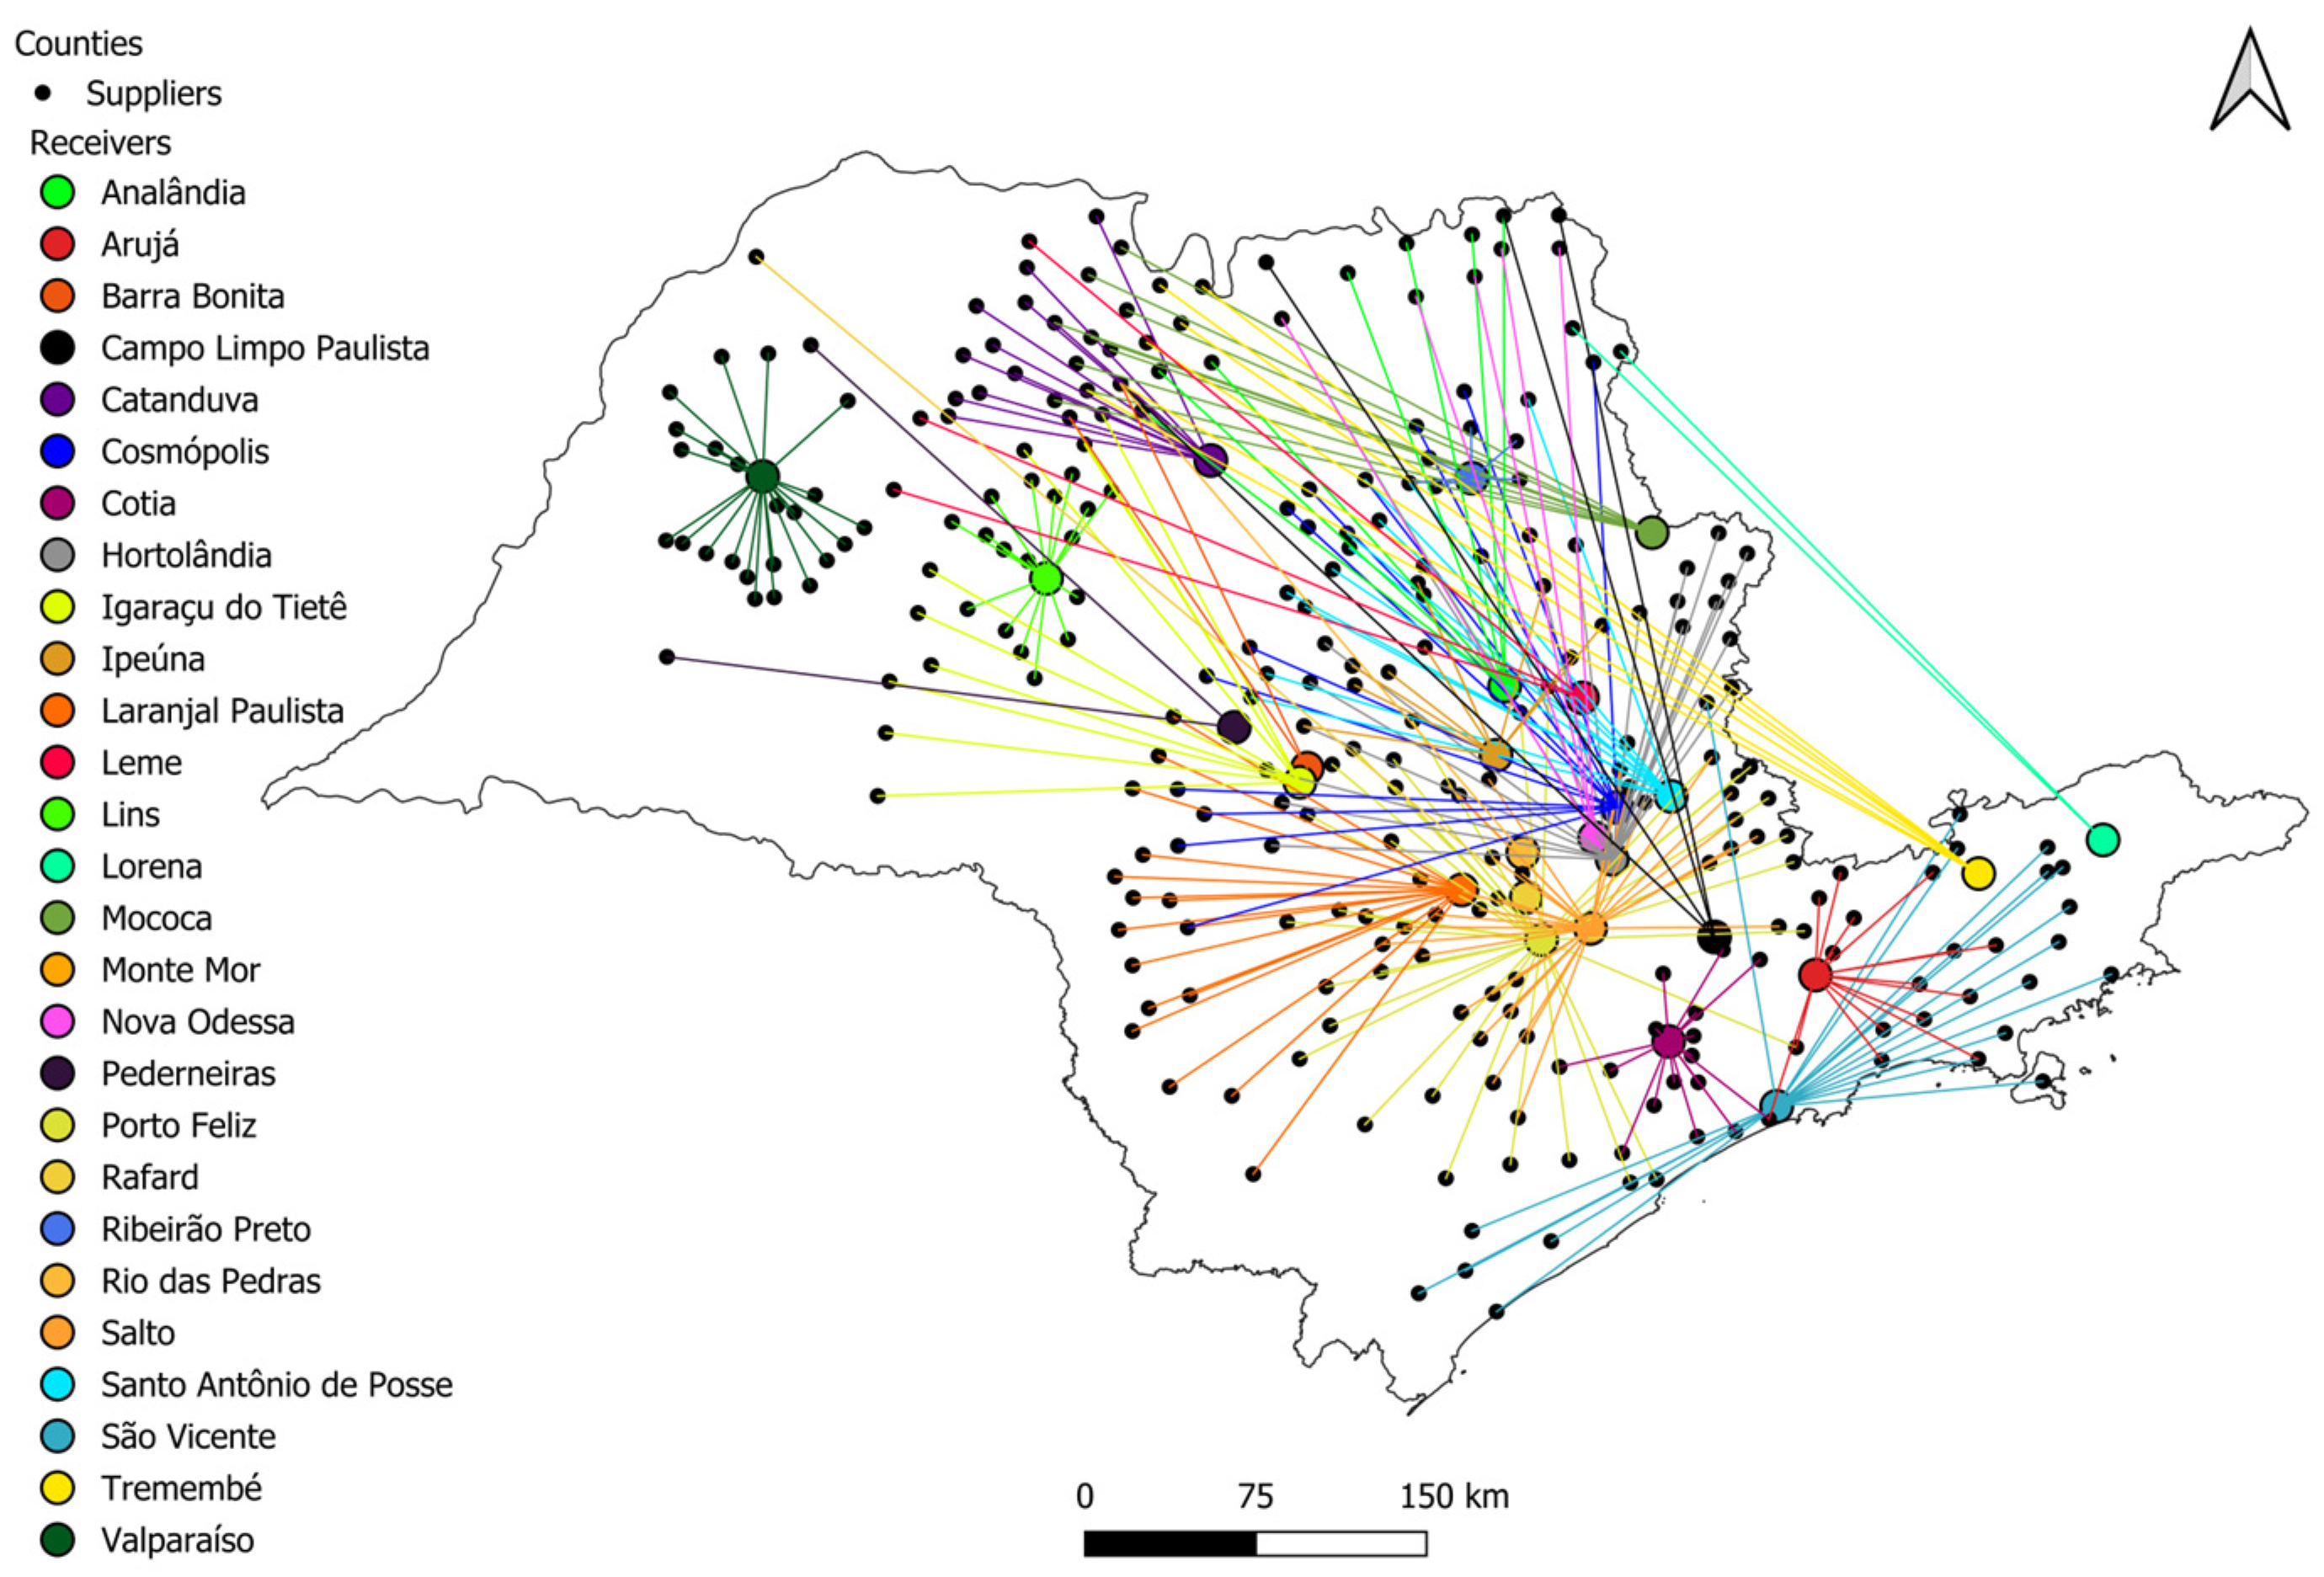
Of the 130 cities that consume natural gas in São Paulo, 120 do not have sufficient biomethane production potential to meet their own demand. The allocation process shown in
Figure 1 was then applied. Allocation began with cities with the smallest energy balance deficits and continued until the balance was greater than or equal to zero. Thus, from a sample space of 645 cities, 576 were considered in the optimization process, 51 of which were NG-consuming municipalities.
Once the allocation process had been carried out, it was necessary to assess the viability of each energy consortium/cooperation system to be created. To do this, the amount of energy transported per kilometer of distance was used as a metric, so that the most viable groupings were those that transported the greatest amount of energy over the shortest distance, thus using less energy to transport biomethane to the consumer.
A ranking was created using this indicator, and 50% of the clusters were disregarded—those with the lowest amount of energy transported per kilometer travelled. In this scenario, 291 cities were found to be capable of supplying the demand of 26 cities that currently use NG. It should be noted that under these conditions, CO2 reduction would be between the previously calculated potential values, equal to 2.22 × 10⁹ ton/yr.
Figure 5 shows the spatialization according to the algorithm developed in this study for allocating plants and optimizing the process for producing biomethane.
When applying the allocation process (
Figure 1 and
Figure 5), it was found that supplying the deficit in one elected city would require using the potential of approximately 10 other cities. The number of cities used in the allocation process from a specific city varied between 1 and 31.
Moraes et al. [
26], when applying a similar algorithm, studied the potential for energy production from landfill sites in southeastern Brazil and optimized the allocation of plants, finding an optimum point for eight plants producing methane from MSW in the São Paulo state. Future studies on the economic viability of this type of allocation could provide greater incentives and aid decision-making in the quest for an increasingly sustainable circular economy.
3.5. Financial Analysis
When calculating the cost of simplified anaerobic reactors for cities, it was found that the NPV and PBD calculations indicated that Scenario 1 was unfeasible to implement due to all cities showing a negative NPV. Moreover, the DPB was greater than the considered 30 year lifespan.
In Scenarios 2 and 3, the investments resulted in a positive NPV and a DPB of less than 30 years; that is, these were viable, which related to the cost and revenue values.
In Scenario 2, the average PBD was 23.6 years, whereas the average in Scenario 3 was 18.3 years. When comparing the three scenarios, it is clear that the investment results improved from Scenario 1 to Scenario 3, as expected, because depreciation and maintenance costs were disregarded.
It should be emphasized that this study did not consider the presence of existing WWTPs. São Paulo has many WWTPs in operation, a great number of which use anaerobic digestion technology. In the non-anaerobic WWTPs, there was no expressive production of biomethane from treating the liquid fraction of sewage.
Two very important factors to consider in studies of this type [
28] are transportation costs and the question of the scalability and size of stations, i.e., the likelihood of larger stations having better viability indicators and economic performance.
It is important to note that the benefits of replacing natural gas with biomethane go beyond the purely financial benefits and should be clear to everyone, especially the population that will benefit. In this sense, Kim et al. [
10], in their study interviewing 1000 families in South Korea regarding the country’s potential to replace natural gas with biomethane, reported that the population would be willing to pay up to 1.32 times more, alongside public policy incentives, for the use of a less polluting source.
4. Conclusions
When studying the potential amount of biomethane from WWTPs to replace natural gas in São Paulo, Brazil, it was observed that, of the 645 cities in the state, 515 had no natural gas consumption. Of the remaining 130 cities, 120 would not have a total supply of natural gas and 10 would have a surplus. Generally, São Paulo has the potential to supply around 10% of the volume of natural gas currently consumed of biomethane from sewage treatment.
As for the economic study for WWTPs, it was found that Scenario 1 (with depreciation and maintenance) was unfeasible, and Scenario 3 generated better results (DPB equal to 18.3 years) than Scenario 2 (DPB equal 23.6 years), as depreciation and maintenance costs were removed.
Regarding the reduction in CO2 emissions, considering two different contexts, one in which biomethane is fully allocated among cities and the other without any allocation, the reduction in CO2 would be 2.42 × 10⁶ ton/yr and 1.81 × 10⁶ to ton/yr, respectively, for the whole São Paulo state.
From an environmental perspective, replacing NG with biomethane would provide benefits, especially in the current demand for less carbonization. Further research, including LCA studies and the possibility of subsidies and/or credit schemes, assessing the logistics of allocating and distributing the biomethane produced are important in aiding future strategies and decisions.
