Abstract
The basic requirements for the design of a switchgear for main 35–220 kV step-down substations are reliability and efficiency. Switchgear circuits are chosen depending on the number of supply and transit lines and transformers, the substation’s place in the power supply system, and the area that can be allocated under the substation construction. The substation switchgear’s reliability depends on the circuit type and the equipment to be installed. When designing, as a rule, standard substation switchgear circuit solutions are chosen with often unreasonably overstated reliability indicators and, as a consequence, capital costs. This paper explores the issues of automated choice of the best option for the 35–220 kV substation switchgear circuit, considering its structural reliability and additional costs for the area allocated under the electrical unit. A distinctive feature of the work is a comprehensive accounting of the reliability indicators of the substation and the influence of the layout of switchgear circuits as a whole on the performance indicators of future electrical installations. The developed technique is used at the pre-design stages and allows for reducing further capital, maintenance, and repair costs for electrical units by up to 14.5%. The developed approach is implemented in the original TER CAD software product.
1. Introduction
The commissioning of new production facilities involves the search for new energy sources and, as a result, the design and construction of new power grid sections and substations. The design of these facilities should be guided by the criteria of reliability and efficiency. To improve the definition of the best balance between these criteria at the design stage, several problems should be resolved, i.e., determining the best network configuration and choosing justified options for the circuit and equipment [1].
When developing an algorithm for defining a feasible connection to an external grid, the component’s throughput and balance limitations should imperatively be considered. The choice of the optimal connection point should also ensure a reliable and cost-efficient power supply. The key problem of the algorithm developed is to determine the economic damage from a power supply interruption [2].
The expediency of structural reliability calculations in the design of power distribution networks is assessed in [3]. The study results show that structural reliability can affect the choice of the power grid option. The parameters and performance of power supply systems should be continuously monitored to assess their reliability. Ref. [4] describes the key systemic problems of ensuring and improving the reliability of power supply. When choosing a circuit, the criteria for the feasibility study of power grid development options [5] and the issues of justifying the aggregated costs of power equipment for transmission lines and substations [6] should be considered.
The authors of [6] describe an approach for assessing statistical reliability indicators in Guangzhou and the development of specific software to improve the efficiency of a power supply system when assessing its reliability. The time for building an equivalent reliability block diagram can be reduced with the developed approach based on a recursive algorithm, as shown in [7]. Ref. [8] describes a monitoring and statistical analysis system for assessing the reliability of power supply to LV consumers.
Ref. [9] studies a probabilistic approach in assessing power supply reliability for renewable energy sources. Ref. [10] describes reliability criteria for the design of power supply systems on commercial vessels. Ref. [11] provides a reliability analysis technique combining a Monte Carlo simulation with an analytical approach. To assess and monitor the reliability of power supply systems, their parameters and indicators should be continuously monitored. Ref. [12] studies the key problems of ensuring and improving the reliability of power supply.
The monitoring of failures and outages in the transmission and distribution of electrical power is important to assess the reliability of network components and ensure power supply to consumers. Ref. [13] analyzed power supply failures and outages to determine the reliability of the distribution grid. Ref. [14] compares various options of typical substation circuits in terms of the reliability of industrial power supply systems and chooses the optimal one.
Ref. [15] describes a systematic procedure for assessing substation development options using a probabilistic cost/benefit analysis. Such a procedure can be applied to assess the reliability and cost of various alternatives. In turn, Ref. [16] proposes to improve the reliability of high-voltage (HV) switchgears using new low-voltage (LV) auxiliary distribution equipment with integrated condition monitoring functions. To do this, new digital equipment opportunities are used.
The model proposed by the authors of [17] assesses the switchgear reliability based on fault tree analysis. A fault tree is built, and the root cause of the failure is tracked down through a layer-by-layer search. Ref. [18] describes the techniques for assessing the reliability of the main substation circuit considering grid development, which helps designers find the grid’s weaknesses and improve its reliability. The universal software for assessing substation reliability, described in [19], implements a reliability analysis technique using the minimum section method.
The analysis of publications shows that the use of modern economic criteria is relevant for choosing optimal design solutions. Therefore, an economic and mathematical model should be developed.
The study is devoted to the development of an integrated approach to determine the choice of an appropriate switchgear circuit for 35–220 kV main step-down substations. The developed technique allows for considering the optimal balance between reliability and efficiency when choosing a circuit and determining its arrangement depending on the area occupied by the open switchgear, which will reduce the cost of prospective capital investments and the cost of maintenance and repair of an electrical installation by up to 14.5%. The approach is implemented in the TER CAD original software product [20]. The study results are intended for electrical engineering departments of agencies involved in the design of the electrical parts of power plants and substations.
The paper consists of the following sections: Section 2 discusses in detail the approach to developing an algorithm for assessing the reliability and efficiency of various circuits of 35–220 kV substation switchgears. Section 3 discusses in detail the issues of determining equivalent reliability indicators for various switchgear circuits. The calculated values of reliability indicators for typical circuits are given. Section 4 describes a technique for determining the circuit arrangement impact on the open switchgear area and provides key performance indicators. Section 4 provides reference tables with reliability indicators provided that standard equipment is installed. In conclusion, the main areas of implementing the study results are shown.
2. Methodology for Feasibility Study of Choosing a 35–220 kV Open Switchgear Circuit Option
To identify the appropriate substation switchgear circuit option, a comprehensive methodology was developed, shown in Figure 1.
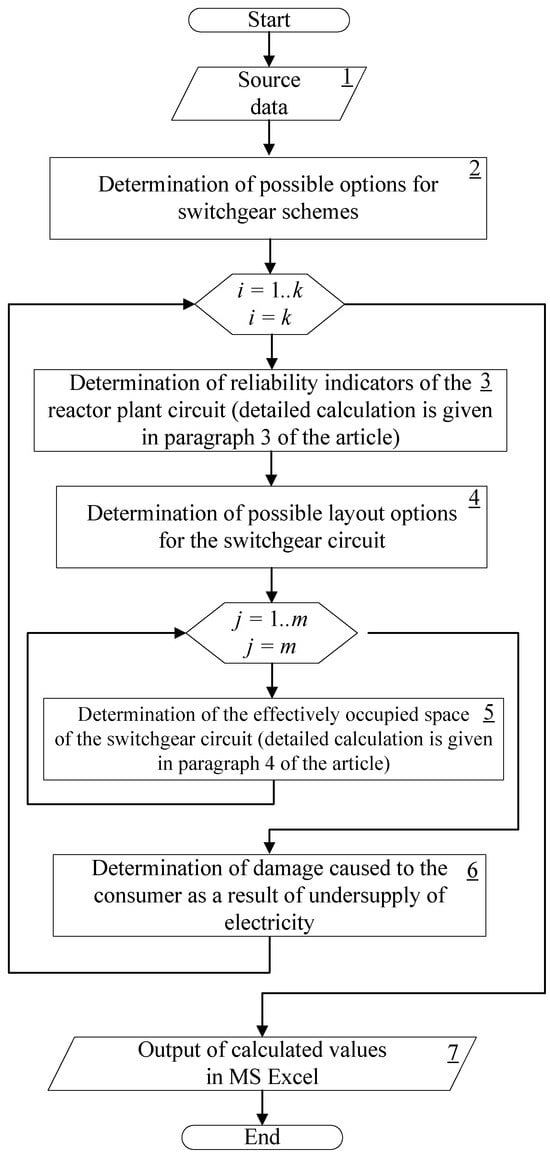
Figure 1.
Block Diagram of the Technique for Technical and Economic Comparison of 35–220 kV Open Switchgear Circuit Options [3].
The source data for the calculation (block 1, Figure 1) suppose manual input, as follows:
- The type and number of power transformers, HV, and LV breaker cells;
- The substation locations (regional attribution), main switchgear circuit, and rated voltage;
- Reliability indicators of power equipment: transmission lines, power transformers, disconnectors, switches;
- Transformer load power;
- The highest load hours and the cost of power losses;
- The load type: industrial enterprise, city, and rural grids.
After entering the source data for the calculation, possible switchgear circuit options k are determined according to the design standards (block 2, Figure 1).
Then (block 3, Figure 1), reliability indicators (failure flow parameter, recovery time) are calculated for each circuit. The calculation for busbar and ring circuits is given in more detail in Section 3 hereof.
Some of the possible switchgear circuit options may have several arrangements. The layout of equipment on an open switchgear affects the area occupied by the substation and the efficiency of its space filling. This is discussed in more detail in Section 4 hereof.
Then, for the best circuit arrangement, the damage from a power outage is determined depending on the obtained values using the methodology described in [2].
Based on the calculation results, reliability, technical, and economic indicators of possible circuit options are derived, considering the feasibility of implementing the circuit arrangement.
3. Assessing the Structural Reliability of Switchgear Circuits
According to the design standards, there are several possible options for the design of switchgear circuits with more than 3 connections. Moreover, each circuit will be characterized by different equivalent reliability indicators, provided that each option comprises the same type of equipment installed (with the same reliability indicators).
In this study, equivalent reliability indicators were calculated for possible switchgear circuit options.
Initially, for each circuit, its characteristics and operation logic, as well as the specifics of switching operations and redundancy, were determined.
A detailed example is given for a single operating switchable and transfer busbar with transformers connected to bus sections via 2 breakers (Figure 2).
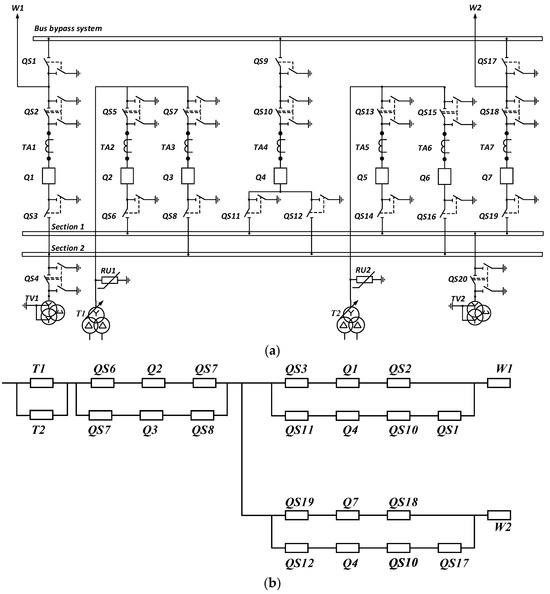
Figure 2.
Single Operating Switchable and Transfer Busbar with Transformers Connected to Bus Sections Via 2 Breakers (No. 12H): single-line circuit (a) and reliability block diagram (b).
In this scheme, the transfer busbar system allows for the redundancy of the supply line and transformer breaker cells. The busbar coupler ensures the emergency operation of two bus sections at the outage of one of the supply lines. Transformer redundancy is arranged on the LV side using an air circuit breaker. Uninterruptable operation of transformers is ensured by their connection via the breaker junction.
For this circuit, a reliability block diagram was built considering the performance of transformers, breakers, power lines, and disconnectors (Figure 2b). The circuit redundancy of equipment and supply lines is considered when building a circuit. The following symbols are used in this circuit: TV—voltage transformer, Q—breaker, FV—surge arrestor, QS—disconnector; T—transformer, W—overhead transmission line, TA—current transformer.
Equivalent transformations are made using well-known equations for series, parallel, and mixed connections of elements [2].
For all structural reliability calculations, three main reliability indicators are determined: the forced downtime coefficient (K), the failure flow parameter (), and the recovery time (). During calculations, block diagrams are transformed relative to two possible connection options—serial and parallel—while for each stage of equivalence, the calculation is carried out relative to the parameter failure rate and forced downtime ratio. The recovery time is determined by the equivalent values of the specified parameters at the final stage of calculations. In the calculation process, the failure rate parameter is taken in units of 1/year, and the resulting recovery time is given in hours.
Reliability indicators, as a rule, must be taken either from reference tables, or data calculated directly for the object must be entered. When calculating the reliability indicators of power transmission lines, the length of the line must be taken into account for the value of the failure current parameter (the reference value of the failure flow parameter must be multiplied by the length expressed in kilometers).
Detailed calculation for the circuit under consideration (Figure 2b):
when –—intermediate values of the coefficients of forced downtime during equivalence;
–—intermediate values of the failure flow parameter during equivalence, 1/year;
… ; … ; –; –—forced downtime coefficients for disconnectors, switches, transformers, and power lines, determined for electrical equipment of block Figure 2b;
… ; … ; –; –—the parameter of the failure flow of disconnectors, switches, transformers, and power lines determined for the electrical equipment of the block Figure 2b, 1/year;
—the equivalent value of the failure flow parameter of the switchgear circuit in question, 1/year;
—the equivalent value of the forced downtime coefficient of the switchgear circuit in question;
—the equivalent value of recovery time of the switchgear circuit in question, year.
In the calculation algorithm, the equivalence process can generally be represented in the form of parallel and series-connected elements: power transmission lines, disconnectors, switches, and transformers.
The common process of determining the equivalent values of the recovery time and the failure flow parameter can be expressed as the following diagram indicating series ‘–‘ and parallel ‘||’ connections:
When considering expression (2), for example, the symbol (QS − Q − QS) means a serial connection of a linear disconnector, a switch, and a bus disconnector; (T1IIT2)—parallel connection of power transformers.
A similar approach was applied for all possible 35–220 kV switchgear circuits (Table 1).

Table 1.
Circuits of Open Switchgears of 35–220 kV Substations.
An algorithm for calculating reliability indicators for a ring circuit with advanced reliability indicators is given below as an example. The calculation of ring circuits, unlike circuits with busbars, has a number of features, especially when the equipment is operating in emergency modes. Such circuits of distribution devices for a voltage of 35–220 kV include circuits—a quadrangle and a hexagon. These schemes are intended for use at hub or transit substations. The circuits are more economical than busbar circuits since the number of connections (lines and transformers) corresponds to the number of switches, and the reliability of these circuits is not inferior to the indicators for the previous version.
Figure 3 shows the hexagon circuit. The transformers are connected via a junction of breakers redundant to each other. When one transformer is disconnected, redundancy is provided on the LV side using an ACB. In the calculation, the longest overhead transmission line is used.
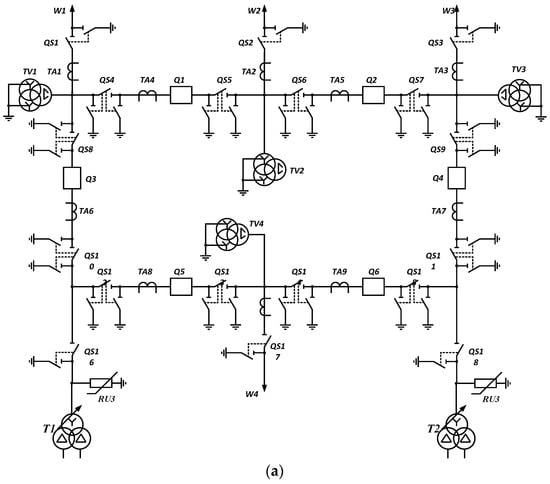
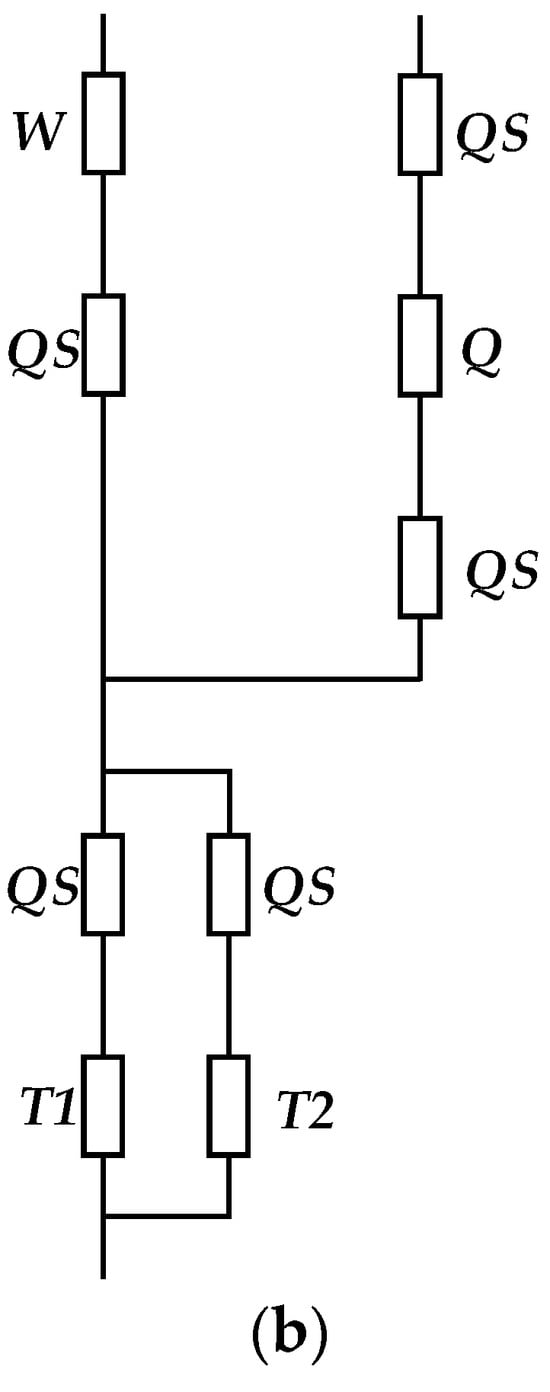
Figure 3.
Hexagon (8) single-line circuit (a) and reliability block diagram (b).
Connection of elements of a reliability block diagram for the Hexagon switchgear circuit:
For the circuits specified in Table 1, equivalent reliability indicators are determined by typical equipment values (Table 2) in the example of 220 kV circuits and equipment (Table 3).
Table 2.
Typical Reliability Indicators for 220 kV Power Equipment.
Table 3.
The 220 kV OSC Reliability Indicators.
The reliability indicators of the elements are determined either by reference tables or by the actual values of the failures of the elements of the object in question. Table 2 shows unified reliability indicators for single-chain overhead power lines, disconnectors (bus and linear), high-voltage switches, and power transformers, with unified reliability indicators for a power of 10–80 MVA.
The reliability indicators indicated in Table 2 in the reference sources can also be given for the voltage levels of 35 kV and 110 kV.
In order to speed up pre-design calculations for choosing the optimal circuit of the distribution device in the developed software product, equivalent reliability indicators were calculated based on the principles specified for algorithms (2) and (3). The following conventions were used in the calculations—the length of the supply line, all other things being equal, was 1 km, and the calculation was carried out for two possible variants of transformer capacities of 10–80 MVA and a capacity of more than 80 MVA. It is advisable to use the obtained values of equivalent reliability indicators to evaluate the choice of a possible substation switchgear option.
The obtained values can be used in pre-design choosing the best switchgear circuit option to determine the material damage from the power supply outage [2].
In these tables: ω is the failure flow parameter, 1/year; K is the forced outage factor; and T is the recovery time, years.
4. Assessing the Area Occupied by a 35–220 kV Substation Switchgear
As noted above, the area occupied by the substation depends on the switchgear circuit and its arrangement, and the layout of the switchgear elements also affects the efficiency of its space-filling. To identify a feasible circuit option considering the rational layout of equipment on the open switchgear territory, the effectively occupied areas of switchgear circuits have been determined herein.
For each of the aforementioned circuits, a comprehensive calculation of the areas was performed while determining the standard-size areas occupied by various equipment depending on the voltage (Table 4).
Table 4.
Factual Calculation of Areas for the Cells under Consideration.
This example is discussed in detail in terms of a circuit with a single operating sectionalized busbar with transformers connected to bus sections via a breaker junction (Figure 2). This circuit can be implemented in two arrangements with a single and double row of breakers (Figure 4 and Figure 5, respectively).
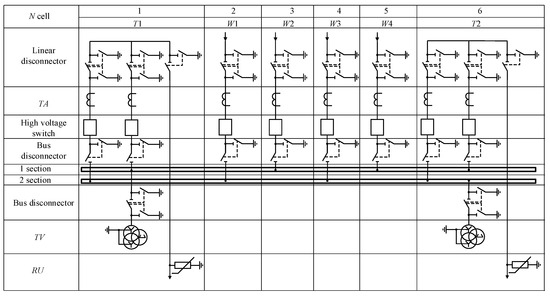
Figure 4.
A Single Operating Sectionalized Busbar with Transformers Connected to Bus Sections Via a Breaker Junction with a Single Row of Breakers.
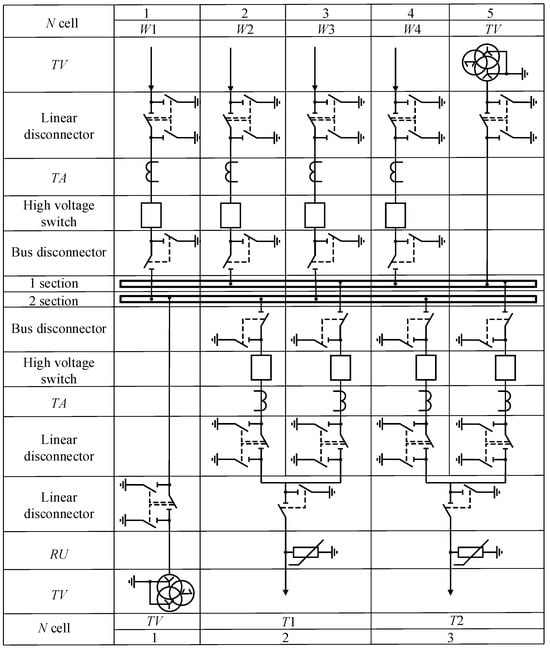
Figure 5.
A Single Operating Sectionalized Busbar with Transformers Connected to Bus Sections Via a Breaker Junction with a Double Row of Breakers.
Figure 6 shows the algorithm for determining the open switchgear area for the circuit under consideration.
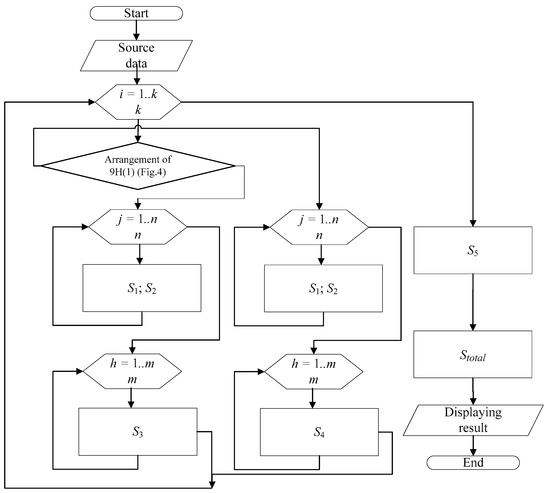
Figure 6.
Algorithm for Calculating Area for the 9H Circuit.
S1 = SHF-D + SD-B;+TA-P + SP-P + SHP;
S2 = SHF-D + SD-B;+TA-P + SP-P + SHP;
S3 = (SD-B;+TA-P + SP-P + SP-LP)∙2;
S4 = (SD-B;+TA-P + SP-P + SP-LP)∙2;
S5 = SP-D-TV + SP-P;
Stotal = S1+ S2+ S3+ S4+ S5.
S2 = SHF-D + SD-B;+TA-P + SP-P + SHP;
S3 = (SD-B;+TA-P + SP-P + SP-LP)∙2;
S4 = (SD-B;+TA-P + SP-P + SP-LP)∙2;
S5 = SP-D-TV + SP-P;
Stotal = S1+ S2+ S3+ S4+ S5.
For example, the areas of these circuits were calculated for m supply lines and n transit lines. The results are given in Table 5.
Table 5.
Resulting Switchgear Areas.
After determining the area occupied by the switchgear circuit, it is expedient to determine the efficiency of the switchgear area space filling. First, the total switchgear area (4) and then, the efficiency of its space filling (5).
where is the area of k-cell, and is the resulting (total) switchgear area for the given arrangement.
where is the area occupied by equipment; is the empty area; and E is the space-filling efficiency of the switchgear area with equipment.
As a rule, the technical and economic comparison of options is performed based on cost indicators, i.e., in this case, to determine the feasible arrangement, the land rental/purchasing costs should be calculated by Equation (6):
where is the switchgear area, m2; is the standard price of land in the constituent entities of the Russian Federation, USD/m2; is the inflation factor; and is the zonal multiplying factor to the base cost of power grid facilities.
The economic efficiency of this measure (choosing the best arrangement for an open switchgear circuit) is determined as follows (7):
where C1 and C2 are the land rental/purchasing costs for the compared switchgear circuit arrangements, m2.
According to Equation (7), S1 and S2 are variables, and their difference will change regardless of the remaining components of the equation P, kinf, and kz. This difference also explicitly reflects the efficiency of one or another option (if the result is negative, S1 will be the most optimal; if the result is positive, on the contrary, S2 will be less than S1). Thus, further calculations can be performed based on S1 and S2, omitting the cost component.
Herewith, the economic (7) and switchgear area space-filling efficiency (6) can be interrelated as follows (8)–(9):
Therefore, both the minimum of alienated land for the switchgear construction (10) and the switchgear area space-filling efficiency (11) can be taken as an optimality criterion.
5. Conclusions
The developed approach allows for identifying the best substation switchgear circuit in terms of power supply reliability and efficiency at the pre-design stage. Reliability is determined by the structural diagram and equipment, and cost efficiency—by assessing the substation switchgear area space-filling efficiency.
The developed approach is implemented in the TER CAD original software product [20]. The economic effect reaches 14.5% due to cost savings during the construction and operation of power facilities.
The study results are intended for electrical engineering departments of agencies involved in the design of the electrical part of substations.
Author Contributions
Conceptualization, A.V.V., A.A.R. and A.S.I.; methodology, V.R.K., A.A.U. and A.S.M.; writing—original draft preparation, A.V.V.; writing—review and editing, V.R.K.; visualization, V.R.K.; project administration, A.A.R.; funding acquisition, A.V.V. and A.S.M. All authors have read and agreed to the published version of the manuscript.
Funding
This work was financially supported by the Moscow Polytechnic University within the framework of the grant named after Pyotr Kapitsa.
Institutional Review Board Statement
Not applicable.
Data Availability Statement
The original contributions presented in the study are included in the article, further inquiries can be directed to the corresponding author.
Conflicts of Interest
The authors declare no conflicts of interest.
References
- Varganova, A.V.; Khramshin, V.R.; Radionov, A.A. Improving Efficiency of Electric Energy System and Grid Operating Modes: Review of Optimization Techniques. Energies 2022, 15, 7177. [Google Scholar] [CrossRef]
- Varganova, A.V.; Irikhov, A.S. Evaluation of external power supply reliability in 6-10 kv networks with distributed generation. Electr. Eng. Syst. Complexes 2021, 3, 22–28. [Google Scholar] [CrossRef]
- Varnavskiy, K.; Nepsha, F.; Chen, Q.; Ermakov, A.; Zhironkin, S. Reliability Assessment of the Configuration of Dynamic Uninterruptible Power Sources: A Case of Data Centers. Energies 2023, 16, 1419. [Google Scholar] [CrossRef]
- Luo, F.; Ge, N.; Xu, J. Power Supply Reliability Analysis of Distribution Systems Considering Data Transmission Quality of Distribution Automation Terminals. Energies 2023, 16, 7826. [Google Scholar] [CrossRef]
- Pantielieieva, I. Realization of the problems related to calculations and analysis of the technical-economic indicators of thermal power station. Sci. Work. Vinnytsia Natl. Tech. Univ. 2017, 4, 11–15. Available online: https://works.vntu.edu.ua/index.php/works/issue/view/42 (accessed on 4 December 2023).
- Weiqing, M.; Huiming, Z.; Chaoqun, K.; Ye, Z. Reliability analysis of power supply based on recursive algorithm. In Proceedings of the IEEE 5th International Conference on Software Engineering and Service Science, Beijing, China, 27–29 June 2014; pp. 327–330. [Google Scholar] [CrossRef]
- Yuan, M.; Liu, Y.; Liu, R.; Niu, X. Monitoring and Analysis of Power Supply Reliability of Low Voltage Consumers. In Proceedings of the International Conference on Power System Technology, Chongqing, China, 22–26 October 2006. [Google Scholar] [CrossRef]
- Wei, T.; Zhen, Z.; Wei, L.; Yuan, G. Research on the Prediction Optimization of Power Outage Duration of 10Kv Distribution Network Based on the Reliability Data of Power Supply Analysis. In Proceedings of the China International Conference on Electricity Distribution (CICED), Tianjin, China, 17–19 September 2018; pp. 496–503. [Google Scholar] [CrossRef]
- Atwa, Y.M.; El-Saadany, E.F. Reliability Evaluation for Distribution System with Renewable Distributed Generation During Islanded Mode of Operation. IEEE Trans. Power Syst. 2009, 24, 572–581. [Google Scholar] [CrossRef]
- Węgrzyn, B. Reliability aspects of power supply marine systems designing. In Proceedings of the Innovative Materials and Technologies in Electrical Engineering (i-MITEL), Sulecin, Poland, 18–20 April 2018. [Google Scholar] [CrossRef]
- Yuan, Y.; Jingyan, Y.; Jianhua, Z.; Xiangning, X. Reliability analysis of power distribution systems based on hybrid method into account of voltage sags. In Proceedings of the International Power Engineering Conference, Singapore, 29 November–2 December 2005; pp. 945–949. [Google Scholar] [CrossRef]
- Papkov, B.; Gerhards, J.; Mahnitko, A. System problems of power supply reliability analysis formalization. In Proceedings of the IEEE 5th International Conference on Power Engineering, Energy and Electrical Drives (POWERENG), Riga, Latvia, 11–13 May 2015; pp. 225–228. [Google Scholar] [CrossRef]
- Gono, R.; Rusek, S.; Kratky, M. Reliability analysis of distribution networks. In Proceedings of the 9th International Conference on Electrical Power Quality and Utilisation, Barcelona, Spain, 9–11 October 2007. [Google Scholar] [CrossRef]
- Chernenko, V. Evaluation of Structural Reliability Parameters of Typical Substation Diagrams. In Proceedings of the International Conference on Industrial Engineering, Applications and Manufacturing (ICIEAM), Sochi, Russia, 25–29 March 2019. [Google Scholar] [CrossRef]
- Bagen, B. A probabilistic procedure for the reliability assessment of substation development options. In Proceedings of the IEEE Electrical Power and Energy Conference, Winnipeg, MB, Canada, 3–5 October 2011; pp. 278–283. [Google Scholar] [CrossRef]
- Thuries, E.; Ebersohl, G.; Dupraz, J.P.; Chetay, O.; Moncorge, J.P. Improvement of high voltage switchgear reliability. In Proceedings of the Fourth International Conference on Trends in Distribution Switchgear, London, UK, 7–9 November 1994; pp. 145–149. [Google Scholar] [CrossRef]
- Zeng, Q.; Chen, G.; Hou, H.; Zeng, J. Reliability Assessment on Switchgear and its Controller Based on Fault Tree Analysis. In Proceedings of the China International Conference on Electricity Distribution (CICED), Tianjin, China, 17–19 September 2018; pp. 972–978. [Google Scholar] [CrossRef]
- Hui, H.; Liu, S.; Zhao, M.; Chen, H. The reliability and economic assessment methods for main electrical connection in substation considering adapting to power grid development. In Proceedings of the IEEE PES Innovative Smart Grid Technologies, Tianjin, China, 21–24 May 2012. [Google Scholar] [CrossRef]
- Goel, L. Electric substation reliability assessment using a Windows-based tool. In Proceedings of the IEEE Power Engineering Society General Meeting, Denver, CO, USA, 6–10 June 2004; pp. 77–82. [Google Scholar] [CrossRef]
- Varganova, A.V.; Irikhov, A.S. TER CAD Certificate of State Registration of Software No. 2021668002 Russian Federation. Available online: https://elibrary.ru/item.asp?id=47258727 (accessed on 4 December 2023).
Disclaimer/Publisher’s Note: The statements, opinions and data contained in all publications are solely those of the individual author(s) and contributor(s) and not of MDPI and/or the editor(s). MDPI and/or the editor(s) disclaim responsibility for any injury to people or property resulting from any ideas, methods, instructions or products referred to in the content. |
© 2024 by the authors. Licensee MDPI, Basel, Switzerland. This article is an open access article distributed under the terms and conditions of the Creative Commons Attribution (CC BY) license (https://creativecommons.org/licenses/by/4.0/).