Article

Research on the Accounting and Prediction of Carbon Emission from Wave Energy Convertor Based on the Whole Lifecycle

1
National Ocean Technology Center, Tianjin 300110, China
2
Institute of Energy, Chinese Academy of Sciences, Guangzhou 510640, China
*
Author to whom correspondence should be addressed.
Energies 2024, 17(7), 1626; https://doi.org/10.3390/en17071626
Submission received: 18 February 2024 / Revised: 21 March 2024 / Accepted: 22 March 2024 / Published: 28 March 2024
(This article belongs to the Section B3: Carbon Emission and Utilization)

Abstract

:
Wave energy, as a significant renewable and clean energy source with vast global reserves, exhibits no greenhouse gas or other pollution during real-sea operational conditions. However, throughout the entire lifecycle, wave energy convertors can produce additional CO2 emissions due to the use of raw materials and emissions during transportation. Based on laboratory test data from a wave energy convertor model, this study ensures consistency between the model and the actual sea-deployed wave energy convertors in terms of performance, materials, and geometric shapes using similarity criteria. Carbon emission factors from China, the European Union, Brazil, and Japan are selected to predict the carbon emissions of wave energy convertors in real-sea conditions. The research indicates: (1) The predicted carbon emission coefficient for unit electricity generation ( E F co 2 ) of wave energy is 0.008–0.057 kg CO2/kWh; when the traditional steel production mode is adopted, the E F co 2 in this paper is 0.014–0.059 kg CO2/kWh, similar to existing research conclusions for the emission factor of CO2 for wave energy convertor (0.012–0.050 kg CO2/kWh). The predicted data on carbon emissions in the lifecycle of wave energy convertors aligns closely with actual operational data. (2) The main source of carbon emissions in the life cycle of a wave energy converter, excluding the recycling of manufacturing metal materials, is the manufacturing stage, which accounts for 90% of the total carbon emissions. When the recycling of manufacturing metal materials is considered, the carbon emissions in the manufacturing stage are reduced, and the carbon emissions in the transport stage are increased, from about 7% to about 20%. (3) Under the most ideal conditions, the carbon payback period for a wave energy convertor ranges from 0.28 to 2.06 years, and the carbon reduction during the design lifespan (20 years) varies from 238.33 t CO2 (minimum) to 261.80 t CO2 (maximum).

1. Introduction

As the current energy crisis deepens, the demand for renewable energy is rapidly increasing. Over the past 40 years, CO2 emissions from the consumption of fossil fuels have nearly doubled [1], emphasizing the global consensus to reduce the share of fossil energy and accelerate the development of renewable energy [2,3]. Wave energy, as a form of marine renewable energy, possesses characteristics such as low intermittency, high energy density, and widespread applicability [4]. With a global total resource reserve of 29,500 TWh/year [5,6], wave energy has extensive prospects [7]. Wave energy convertor, in addition to being a promoter of global carbon reduction by producing electricity without consuming fossil fuels or other fuels, the generated electricity can be equivalently converted into reduced greenhouse gas (GHG) emissions. But it still requires inputs of non-renewable energy and corresponds to GHG emissions throughout its lifecycle. Therefore, it is crucial to scientifically assess the carbon emissions at different stages of the lifecycle of wave energy convertor, calculate the carbon payback period, and determine the carbon emission coefficient per unit of electricity to quantify the impact of wave energy convertor on global carbon emissions. Current international practice for environmental impact assessment employs the Life Cycle Assessment (LCA) method. LCA analyzes the carbon footprint of devices or systems from raw material production to retirement and waste burial, providing a comprehensive view of carbon emissions throughout the entire lifecycle. LCA has been widely applied in the carbon accounting research of various renewable energy sources such as hydropower, solar energy, onshore wind energy, offshore wind energy, hydrogen energy, and nuclear energy. Kev et al. utilized the “OpenLCA software” and the “Eco Invent database”, to analyze the environmental impact of solar power generation. The findings indicate a reduction in carbon emissions from solar power generation with an increasing solar multiplier [8]. Victor Nian optimized carbon emissions accounting throughout the lifecycle of nuclear power generation using the “Kaya Identity” and “Process Chain Analysis” methods [9,10]. Mostafaei et al. analyzed the carbon emissions in three stages of the lifecycle of a Concrete Gravity Dam by employing LCA and pointed out a potential 32% reduction in greenhouse gas (GHG) emissions by assuming a 20% concrete recycling rate [11]. Additionally, Verma et al. made a comparison between wind energy and coal power and highlighted a 98.8% reduction in carbon emissions per unit of electricity generated for wind energy (11.3 g CO2-eq/MWh) [12]. Kaldellis et al. investigated the carbon footprint of onshore and offshore wind energy throughout their lifecycles, along with the environmental uncertainty of greenhouse gas emissions from offshore wind energy [13]. Schreiber et al. assessed the impact of 3 MW power-rated wind turbines on the environment using the LCA method [14]. Zhang et al. compared the carbon emissions associated with hydrogen production throughout the entire lifecycle of onshore and offshore wind energy. The research indicated that onshore wind energy had lower carbon emissions for hydrogen production compared to offshore wind energy, with a carbon emission of 0.0936 kg CO2-eq [15]. Additionally, Wang et al. estimated the unit CO2 emissions per unit of electricity generated throughout the lifecycle for wind power plants in three developed countries and one developing country. The findings suggested that onshore wind energy, with reduced distribution facility requirements, had lower unit CO2 emissions per unit of electricity generated compared to offshore wind energy [16]. Furthermore, Sun et al. analyzed the impact of typhoons on the carbon emissions of offshore wind farms and constructed a comprehensive lifecycle carbon emissions accounting model with typhoons as input conditions [17]. Moreover, Ogunjuyigbe et al., Yan et al., and Liu et al. investigated the lifecycle carbon footprint of hybrid energy systems, distributed energy systems, and multi-energy complementary distributed energy systems [18,19,20]. In summary, LCA technology has been extensively applied in carbon emission studies within the renewable energy field. The maturity of LCA technology in the wind energy sector allows for comprehensive carbon emissions accounting, covering both individual wind turbines and entire wind farms. Given the similarity in principles between wave energy and wind energy, where both capture renewable energy using mechanical devices to generate mechanical energy, adopting and adapting LCA methods from the wind energy field for carbon accounting in wave energy is deemed feasible. However, due to the relatively lower Technology Readiness Level of wave energy compared to wind energy, resulting in limited actual operational data, there is higher uncertainty in assessing carbon emissions throughout the lifecycle of wave energy. This study initially constructs a carbon emission accounting model for wave energy using LCA methods, establishing boundary conditions. Then it utilizes laboratory test data for wave energy models as a basis and employs similarity criteria theory to predict carbon emissions throughout the entire lifecycle. This approach aims to mitigate uncertainties arising from limited operational data and provides a predictive method for assessing carbon emissions during the practical operation of wave energy. Ultimately, it offers valuable insights for the carbon emission accounting of large-scale applications of wave energy.
The paper consists of six sections: introduction, research objectives and scope, research methods, life cycle inventory analysis, life cycle impact assessment, and conclusion.

2. Research Objectives and Scope

2.1. Research Objectives

The primary objective of this study is to conduct laboratory tests on a wave energy convertor model during the development stage, acquire test data, and predict the carbon emissions throughout the entire lifecycle of the wave energy convertor in real-sea conditions based on similarity criteria. To ensure the scientific validity of the predictions, the operating principles and manufacturing materials of the wave energy convertor model in this study remain consistent with those of wave energy convertors deployed in actual sea conditions. The chosen functional unit for the wave energy convertor in this paper is 1 kWh of electricity, and the study predicts the carbon emissions throughout the entire lifecycle of the wave energy convertor in real-sea conditions based on this functional unit.

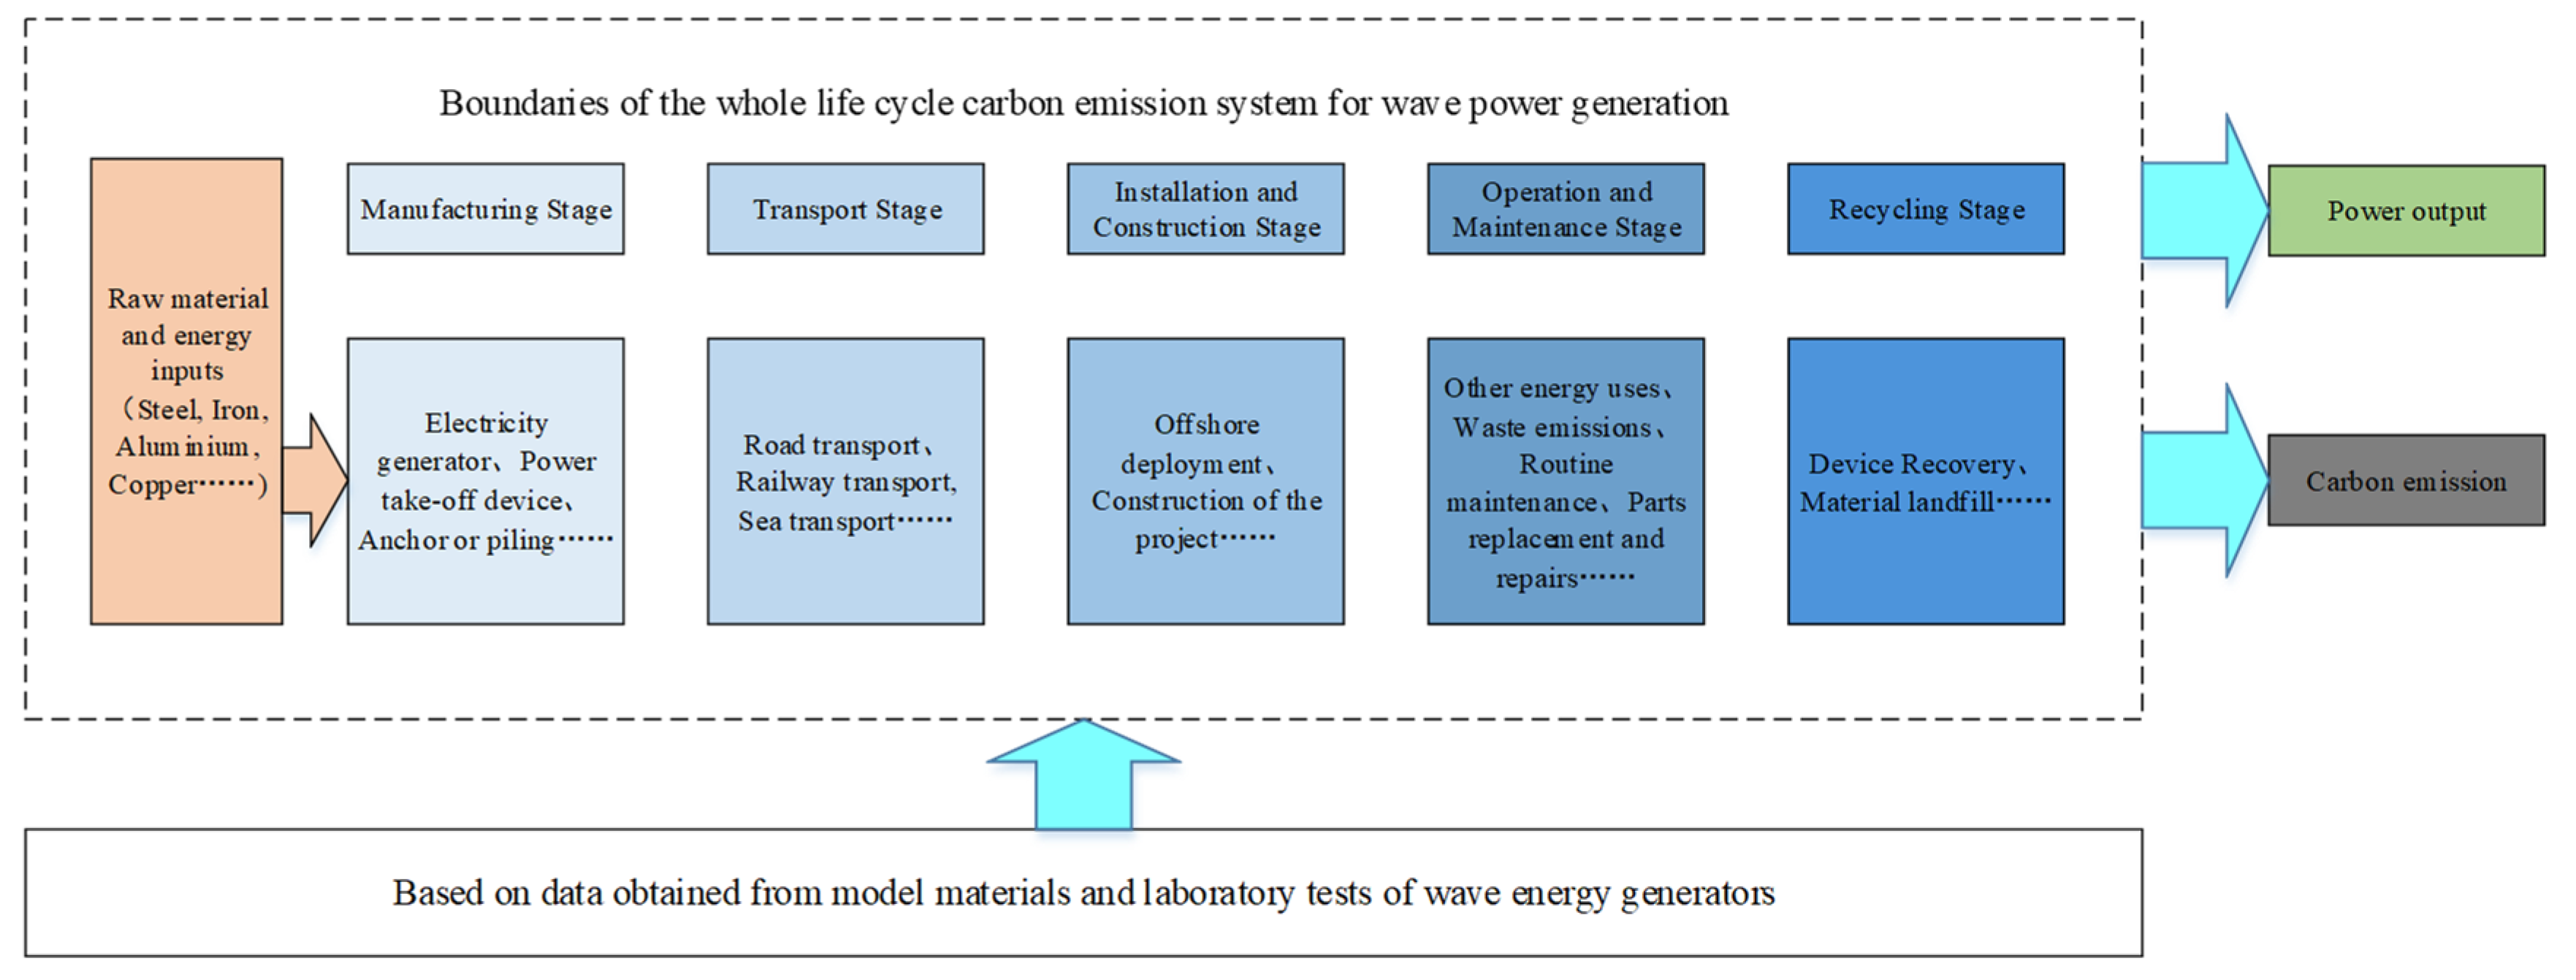
2.2. System Boundary

Applying the LCA method to account for the carbon emissions of wave energy convertor requires defining the system boundary for the entire lifecycle. According to the technological status of wave energy convertor, the lifecycle can be divided into five stages: Manufacturing Stage, Transport Stage, Installation and Construction Stage, Operation and Maintenance Stage, and Recycling Stage. The system boundary diagram for carbon emission accounting throughout the lifecycle of the wave energy converter is illustrated in Figure 1.
Due to the limited availability of operational data for current wave energy convertors, this study predicts carbon emissions throughout the entire lifecycle by obtaining manufacturing material data and tank testing data for the wave energy convertor model. The predictions are made based on similarity criteria theory to simulate carbon emissions in real-sea conditions. In the system boundary for the carbon emission accounting throughout the lifecycle of the wave energy convertor described above, the test data are not considered internal content within the system boundary. Instead, they serve as foundational data for predicting the entire lifecycle of carbon emissions. Therefore, the framework “Based on data obtained from model materials and laboratory tests of wave energy generators” is placed outside the system boundary.

3. Research Methods

3.1. Similarity Criteria

Similarity criteria are one of the most fundamental principles in fluid mechanics. They state that when the experimental environment is fluid and the fluid properties are similar, the motion and stress distribution of two experimentally similar objects in the fluid are also similar. Therefore, by applying similarity criteria, the performance of a wave energy convertor operating in real-sea conditions can be studied by scaling down to the performance of a wave energy model in a laboratory tank environment. Liu et al. suggested that when the dynamic viscosity, gravitational acceleration, and density of the fluid field in the experimental and simulated environments are the same, Froude similarity criteria are more applicable to the study of the hydrodynamic characteristics of scaled models [21]. Additionally, Qiao et al. provided parameters and scale factors for the Froude similarity criteria for wave energy convertors, as shown in Table 1 [22].
To predict the carbon emissions of a wave energy convertor operating in real-sea conditions, it is crucial to determine the manufacturing material and the electricity generation throughout its lifecycle. Using the Froude similarity criteria allows these two factors to be scaled down for experimentation and simulation in a laboratory environment. Therefore, this study first determines the scale factor for the Froude similarity criteria between real-sea conditions and laboratory tank simulation environments. Following this, this study manufactures the wave energy convertor model according to the scale factor while ensuring geometric similarity. Experimental tests are conducted in a tank under specific conditions to measure the device model’s electricity generation performance and calculate the conversion efficiency. This information is then used to estimate the electricity generation throughout the entire lifecycle of the wave energy convertor in real-sea conditions. Additionally, due to adherence to the Froude similarity criteria and geometric similarity, the scale factor can be used to estimate the volume difference between the wave energy convertor model and the actual sea-deployed wave energy convertor.

3.2. Assumptions

Wave energy convertors can be categorized into oscillating water column (OWC), point absorbers, and oscillating bodies [23], each having slightly different material compositions. This study specifically focuses on the oscillating water column type, and thus, the carbon emission calculations may vary for other types of wave energy convertors. To ensure data accuracy, this research maintains identical manufacturing materials between the wave energy model and the actual operating device, assuming the following conditions:
(1)
A Froude similarity criteria scale factor of 3 (λ = 3).
(2)
Similar manufacturing materials for both the wave energy convertor model and the actual sea-deployed wave energy convertor, with both constructed from steel.
(3)
Consistent conversion efficiency is achieved when the wave energy convertor model is proportionally enlarged.
(4)
Wave energy convertor using an anchor-fixed floating method, with the anchor made of steel.
(5)
A 20-year lifespan for the wave energy convertor, with consistent conversion efficiency during operation.
(6)
According to the requirements of IEC/TS 62600-102:2016 Marine energy—Wave, tidal, and other water current converters—Part 102: Wave energy converter power performance assessment at a second location using measured assessment data, the wave energy convertor operates for 8766 h annually [24].

3.3. Research Objects and Data Sources

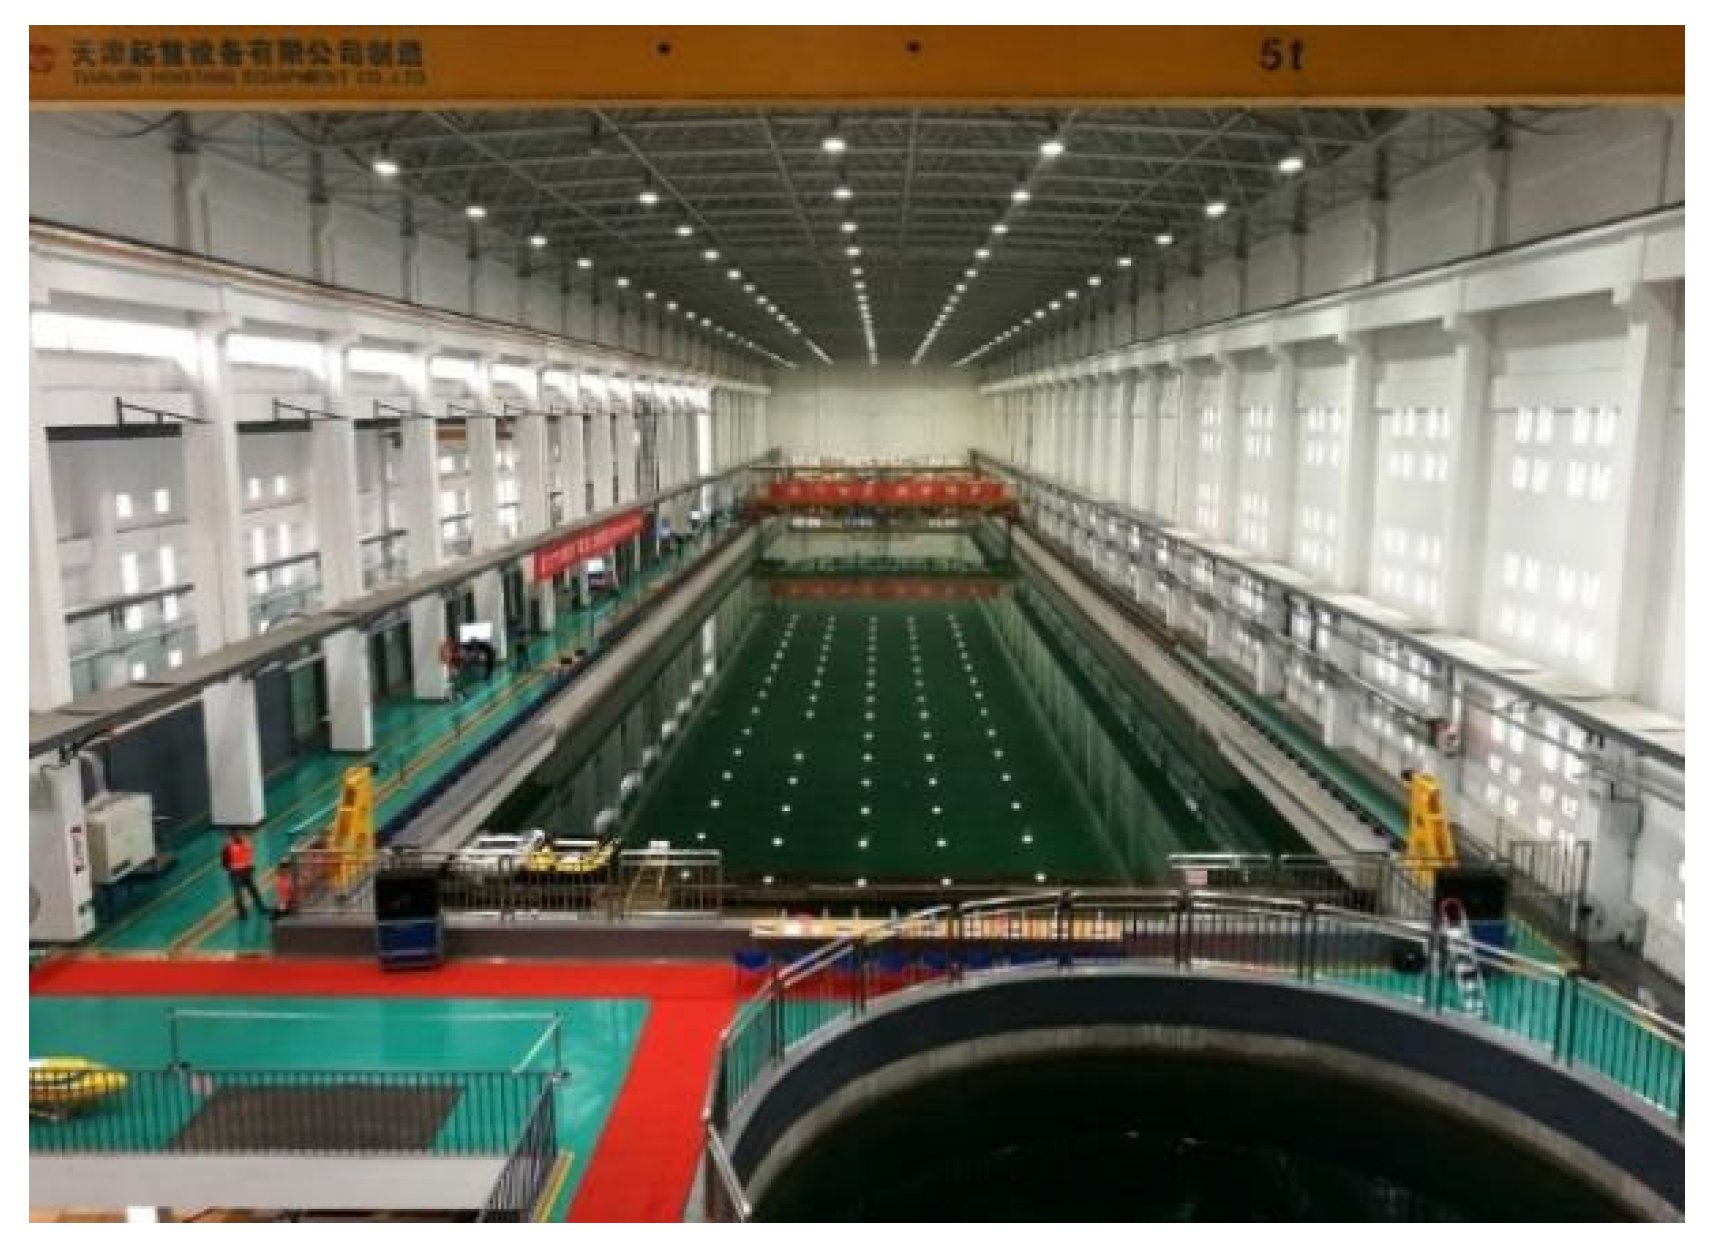
3.3.1. Research Object

This study focuses on an oscillating water column (OWC) wave energy convertor intended for deployment near Dawanshan in Zhuhai, China (21°56′12.40″ N, 113°41′29.30″ E). The average significant wave height in this area ranges from 0.3 m to 1.8 m, with an average spectral peak period of 2.70 s to 8 s and an estimated annual wave energy flux density of 2.2 kW/m [25]. The laboratory tank experiments were conducted on a scaled-down model based on a Froude similarity criteria scale factor of 3 (λ = 3). The model used is a floating single buoy pentagon-shaped OWC wave energy convertor developed by the Institute of Energy, Chinese Academy of Sciences, with dimensions of 4.0 m × 1.8 m × 1.8 m, a wave-facing width of 1.83 m, and a total weight of 1300 kg [26]. The experiments took place in the Ocean Power Environment Laboratory at the National Ocean Technology Center, which has a tank length of 130 m, a width of 18 m, a depth of 6 m, and an experimental water depth of 5 m, capable of generating waves with heights from 0.02 m to 0.60 m and periods from 1 s to 5 s. Refer to Figure 2.
The wave energy convertor model manufactured according to a Froude similarity criteria scale factor of 3 (λ = 3) and the parameters of the intended sea-deployed wave energy convertor are compared in Table 2.
The irregular wave parameters in the laboratory tank experiments conducted according to a scale factor of 3 (λ = 3) and the wave parameters in the intended deployment area are presented in Table 3. The indoor tank experiments included tests for nine different conditions, with the significant wave period being 1.2 times the average period and the average conversion efficiency (ƞ) being 22.1%.

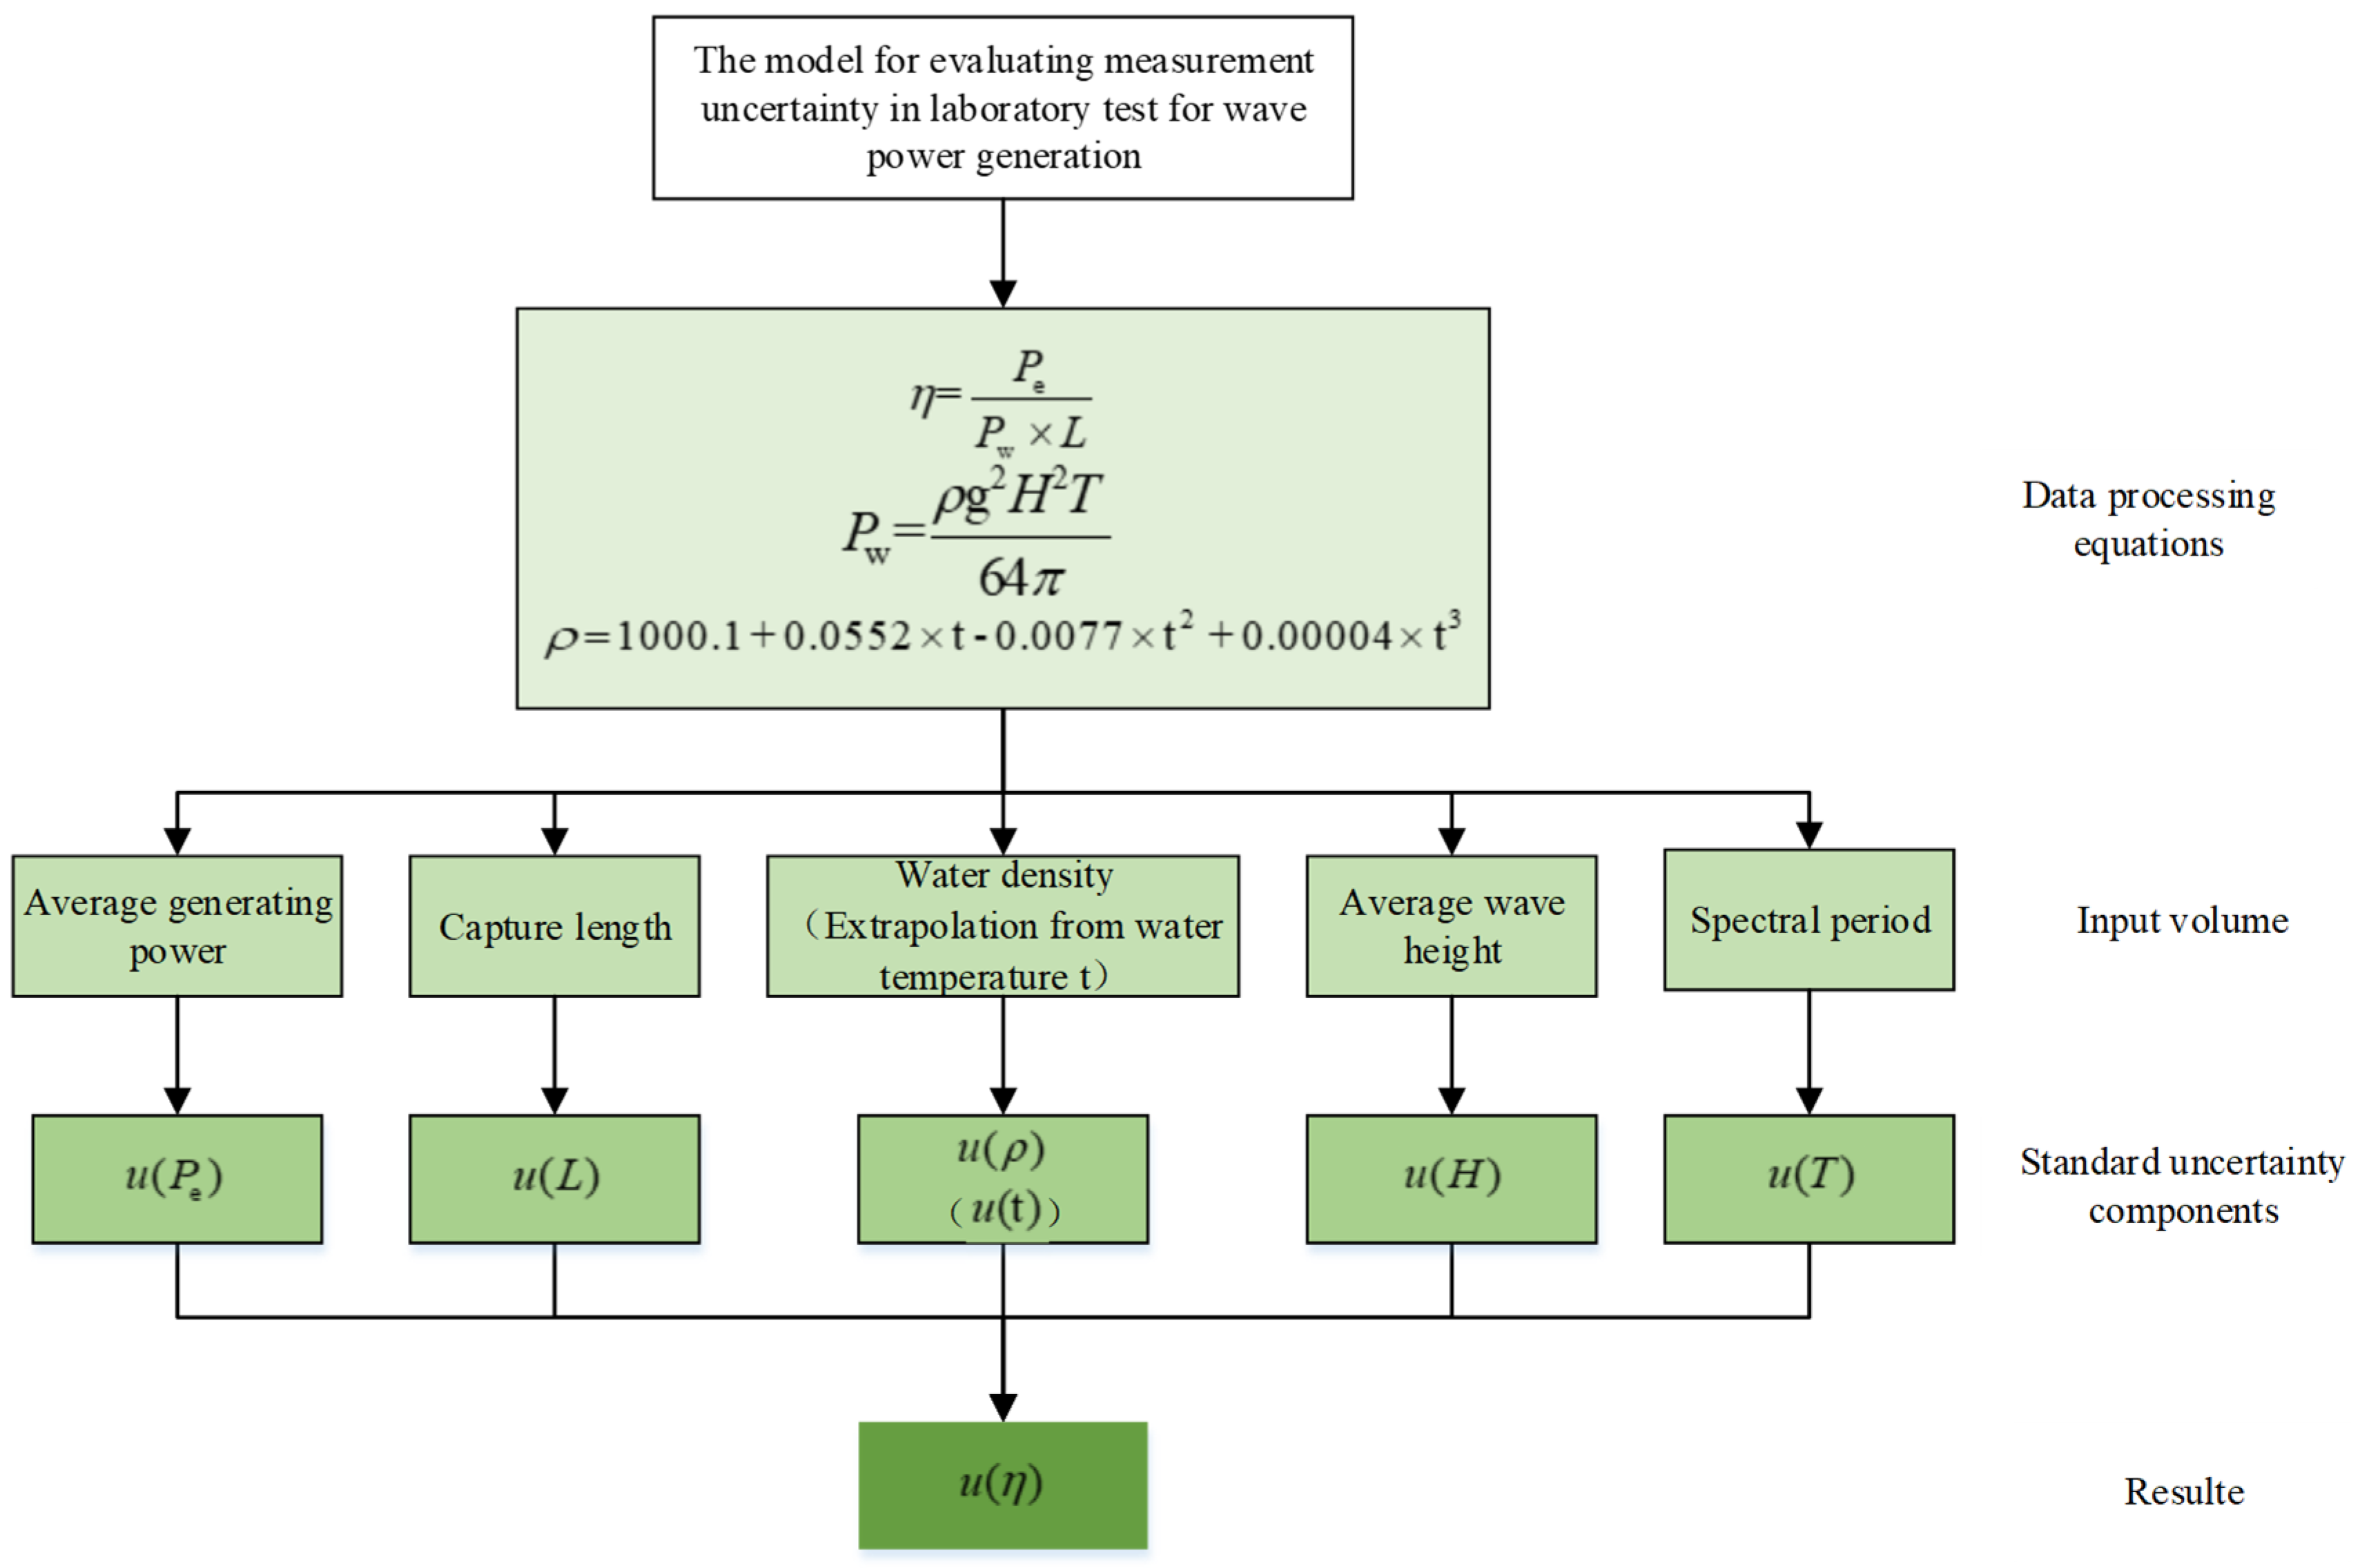
3.3.2. Measurement Uncertainty of Experimental Results

The measurement uncertainty assessment model for this study is depicted in Figure 3.
In the measurement uncertainty assessment, the instruments and equipment used in this study include a power analyzer, a steel tape measure, a thermometer, and a bilinear BG-II/1000MM wave height sensor. The standard measurement uncertainty μ(H) for effective wave height and μ(T) for spectral peak period are obtained from the wave height sensor. The standard measurement uncertainty μ(Pe) for average power generation efficiency is obtained from the power analyzer. The standard measurement uncertainty μ(L) for wave-facing width is obtained using the steel tape measure. While water density cannot be directly measured, the standard measurement uncertainty μ(ρ) of water density can be estimated from the relationship between water temperature and density [27]. Following the GUM method (Guidelines for the Expression of Uncertainty in Measurement) published by ISO and using Equations (1) and (2):
μ ( P W ) = g 2 T H 2 64 π 2 μ 2 ( ρ ) + ρ g 2 H 2 64 π 2 μ 2 ( T ) + ρ g 2 2 T H 64 π 2 μ 2 ( H )
μ ( η ) = P e P w L 2 2 μ 2 ( L ) + 1 P w L 2 μ 2 ( P e ) + P e P w 2 L 2 μ 2 ( P w )
In the end, the measurement uncertainty of the experimental results, with a 95% confidence interval, is 0.75%. Thus, the experimental data in this study is considered reliable.

3.3.3. Data Sources

The experimental data for this study comes from laboratory tests on the wave energy convertor model. The carbon emission factors for each stage of the lifecycle are sourced from the Intergovernmental Panel on Climate Change (IPCC) reports, the IPCC National Greenhouse Gas Inventories Guidelines, provincial greenhouse gas inventory guidelines, carbon emission factors published by the Chinese National Development and Reform Commission (NDRC) for the power grid, and carbon emission factors published by the International Energy Agency (IEA). Additionally, the transportation stage’s carbon emissions are provided by Logward, a German logistics company.

4. Life Cycle Inventory Analysis

4.1. Manufacturing Stage

Carbon emissions (Eman) during the manufacturing stage of the wave power generator are accounted for mainly on the basis of the materials used in the manufacturing. The manufacturing material of the wave energy generator itself can be estimated by scaling up the model, and the anchor system material for fixing the wave energy generator also needs to be considered. Sheng et al. pointed out that the water depth of the wave energy generator to be deployed is about 20 m [25], so the total weight of the anchor system to be equipped with (grappling anchors and anchor chains) is 2 tons, and the total weight of the wave energy convertor system is 12.4 tons. The material used for the wave energy converter in this study is steel, and the carbon emission factor varies according to the country of production, Chinese scholars GAO et al. showed that the average of the carbon emission factor for steel production is 1.97 t CO2/t [28], in addition, IPCC (Intergovernmental Panel on Climate Change, IPCC) pointed out that the carbon emission factor of steel production in the European Union is 1.328 t CO2/t [29], Leão et al. pointed out that the carbon emission factor of steel production in Brazil using Coke-based and iron mix is 1.98 t CO2/t [30] (Table 4), Japanese scholars Honma et al. showed that the raw materials for steel production have the largest share of CO2 emissions from coke, and due to the large proportion of electric power in the production of steel in Japan, its production of steel with a carbon emission factor 0.758 t CO2/t [31] (Table 4). The CO2 emissions from the production of wave energy generators in different countries are shown in Table 4.

4.2. Transport Stage

The carbon emissions during the transport stage (Etra) are calculated based on the weight of the generation device and the mode of transportation. The transport process involves two stages:
(1)
From the land-based manufacturer to the port for storage and debugging (if the device material is entirely produced within China) or from the manufacturer to the port via ship (if the device material is produced outside China);
(2)
From the port to the target offshore area.
The carbon emission in the transportation stage can be obtained by multiplying the weight of the wave energy converter, the transportation distance, and the average carbon emission factor of the transportation mode. Assuming that the weight of the wave energy converter is 12.4 t, and all the materials for the power generation device are produced in Tianjin, China, the direct road distance between Tianjin and Zhuhai can be obtained through the map platform as 2230 km, and the distance from Zhuhai to the sea area where the wave energy converter is deployed is 50 km. The average carbon emission factor of transportation mode is obtained from relevant literature data. The study of Chinese scholars Peng et al. pointed out that the average carbon emission factor of the transportation of trucks with a load capacity of 8–17 t is 0.598 kg/km [32], and Wu et al. pointed out that the average carbon emission factor of the Chinese waterway transportation is 0.008 kg/t/km [33].
When all the materials of the power generation unit are produced in other countries or regions, assuming that the regions are London, UK, Rio de Janeiro, Brazil, and Tokyo, Japan, and the wave energy convertor is transported directly from the ports of the producing countries or regions to the sea area where it is deployed, the carbon emissions during the transport stage are shown in Table 5. According to the data provided by the German logistic company Logward (http://www.logward.com/freebies/co2-calculator accessed on 12 March 2024), the carbon emissions during the transport stage are shown in Table 5.

4.3. Installation and Construction Stage

Carbon emissions (Ei&c) during the installation and construction stages of the wave energy converter unit are mainly determined based on the method of installation and construction [34]. Since the wave energy converter in this study is towed to the target sea area by a ship and directly deployed using mooring fixation, there is no use of materials such as sand, gravel, concrete, cement, etc., and the power generation device occupies a very small area of the sea area, there is no need to consider the impact of carbon emissions due to the installation and construction process of the power generation device on the marine environment, i.e., Ei&c = 0.

4.4. Operation and Maintenance Stage

Carbon emissions (Eo&m) during the operation and maintenance stages of the wave energy convertor are accounted for primarily on the basis of operation and maintenance conditions. Wave energy convertors need to be inspected regularly during official operation, replacing wearable parts and wear and tear items such as hydraulic fluid and oil, and the carbon emissions from the transportation process of personnel and parts generated due to repair and maintenance are also counted in the process of this stage, and this study draws on the carbon emission accounting method of the manufacturing stage of wind power during this stage, Davidsson et al. and Kabir et al. which pointed out that the amount of carbon emissions from the wind power system in the operation and maintenance stage is very small, which accounted for 2–4% on average [35,36], Brussa et al. assumed a carbon emission credit of 5% of the full life cycle in the operation and maintenance stage [37], Nassar et al. selected a median of 3% in their study of carbon emissions from Libyan wind power [38], and due to the similarity of the marine environment in which wave energy converter units and offshore wind power work, the carbon emissions in the operation and maintenance stage of this study were determined according to a median of 3% in order to reduce the uncertainty in the accounting results. The wave energy convertor unit does not require personnel to be on duty during operation, and therefore there are no additional carbon emissions from other energy consumption such as lighting and air conditioning.

4.5. Recycling Stage

Carbon emissions from the recycling stage of wave energy convertors (Erec) are accounted for primarily based on the carbon emissions from the recycling, landfilling, and dismantling of fabricated metal materials; most of the metals in the wave energy convertor can be recycled, and the rest can be disposed of in landfills. The process is similar to that used to calculate carbon emissions in the wind power sector [39]. Nassar et al. showed that the carbon emissions from the dismantling and landfilling stages of wind power account for 0.206% of the whole life cycle carbon emissions [38], and because the wave energy convertor of the study is anchored by moorings, its dismantling and landfilling carbon emissions are negligible, and only the recycling of metals needs to be considered. Since the deployment area of the wave energy convertor is located in the South China Sea, the metal recycling should be estimated according to the productivity of China. Xiang et al. proposed that the metal recycling rate of the offshore wind power device is 92% [40], and considering the operating environment of the wave energy convertor, most of the materials are unable to be recycled because they are corroded or biologically attached by prolonged contact with the sea surface. Therefore, the recycling rate of the metal in this stage is assumed to be 70%.

5. Life Cycle Impact Assessment

5.1. Total Carbon Dioxide Emission Indicator (Econ)

The total life-cycle CO2 emissions (Econ) of a wave energy convertor are cumulated from the carbon emissions of each of the five stages described above, as shown in Equation (3).
E con = E man + E tra + E i & c + E o & m + E rec

5.2. Carbon Emission Factor per Unit of Power Generated ( E F co 2 )

The carbon emission factor per unit of power generated, E F co 2 , is determined by dividing the CO2 emitted by the wave energy convertor over its life cycle by the total amount of electricity produced, Epow, see Equations (4) and (5).
E F co 2 = E con E pow
E pow = J wave × L × η × 20 × 8766
where Epow is obtained from the wave-facing width L (5.49 m), the conversion efficiency ƞ (22.1%) of the actual operating wave energy converter, the annual predicted wave energy current density Jwave (2.2 kW/m) in the waters of Dawanshan, Zhuhai, and the full lifecycle operation time (assuming that the wave energy convertor actually operates for a lifecycle of 20 years and operates for 8766 h per year). Therefore, the power generation capacity of the wave energy converter in the whole life cycle is 4.66 × 10⁵ kWh.

5.3. Carbon Payback Time (CPT)

Carbon payback time is the time when the carbon emission reduction in a wave energy convertor is the same as the full life cycle carbon emission; see Equation (6).
C P T = E con J wave × L × η × E F grid , CM , y
where EFgrid,CM,y is the baseline emission factor for the Chinese regional grid, and according to the information published by the Ministry of Ecology and Environment of the People’s Republic of China, the average value of the baseline emission factor for the Chinese regional grid in China in 2022 is 0.570 t CO2/MWh [41].

5.4. Life Cycle Carbon Emissions Reduction (Ered)

The full life cycle carbon emissions reduction Ered is the difference between the full life cycle carbon emissions reduction and the carbon emissions of the actual operating wave energy convertor; see Equation (7)
E red = E pow × E F grid , CM , y E con
The carbon emission indicators of the whole life cycle of the wave energy convertor are shown in Table 6 and Table 7.

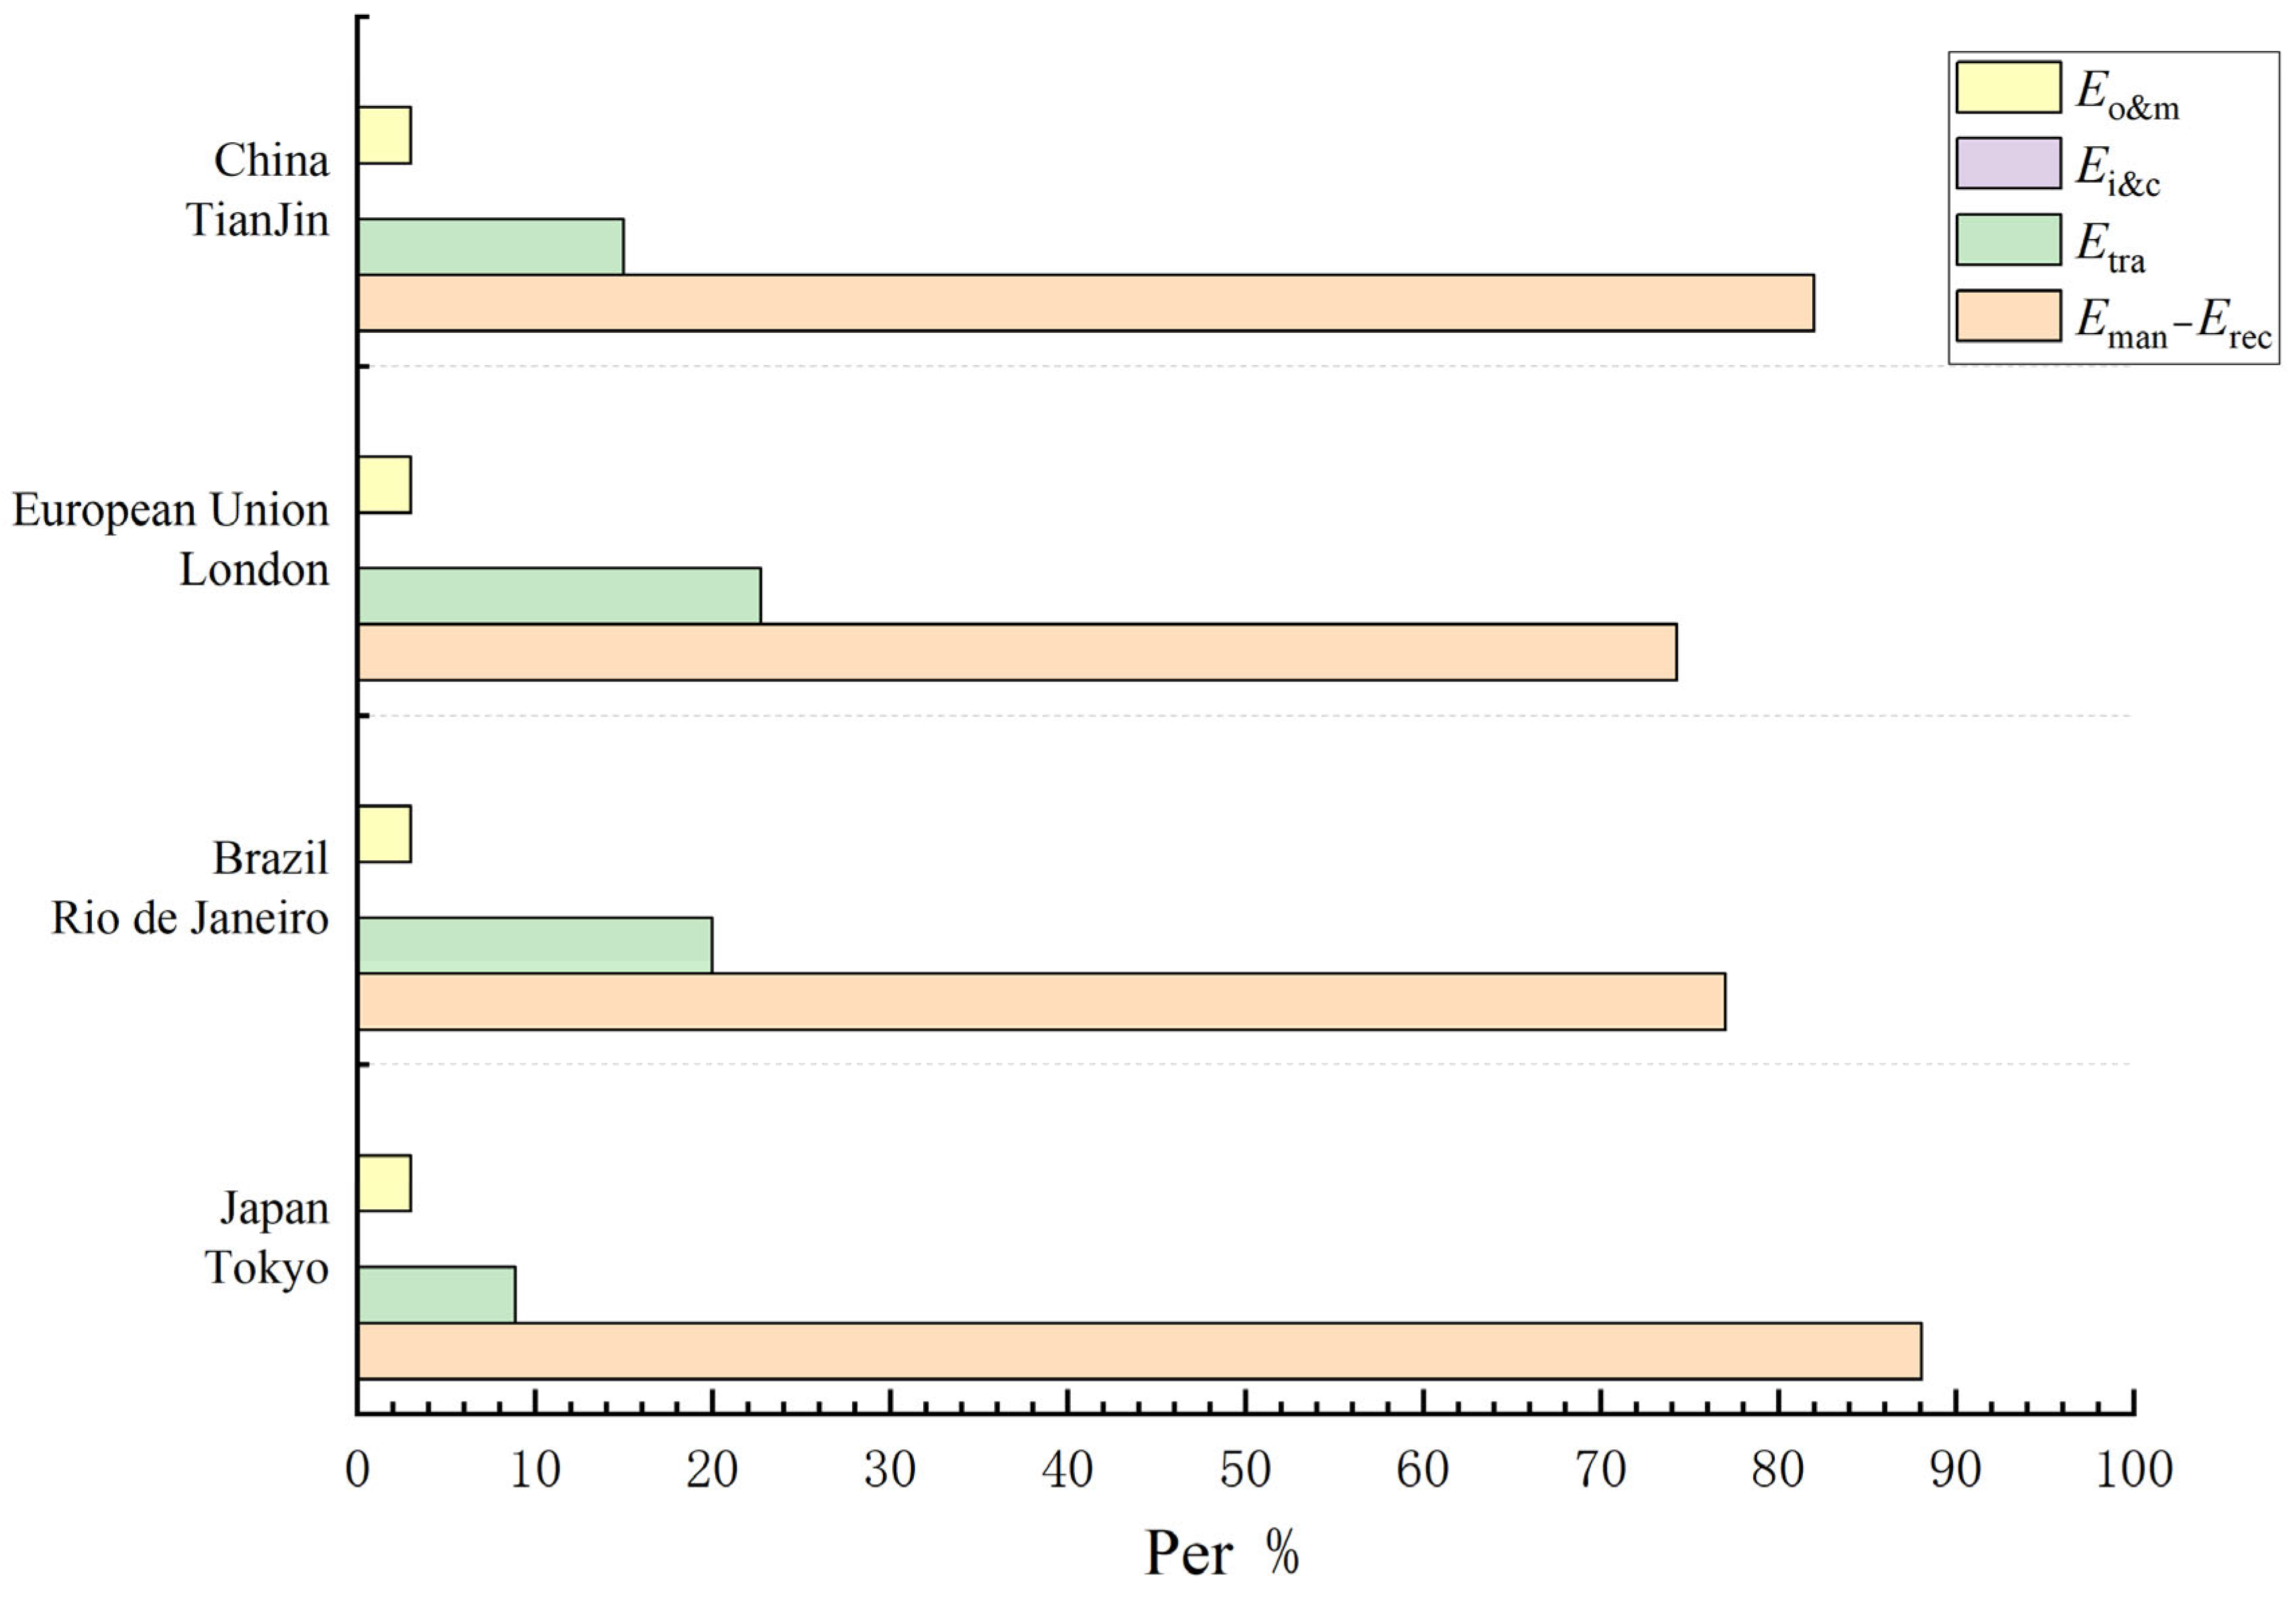
5.5. Analysis and Discussion

This study, utilizing the Life Cycle Assessment (LCA) method, has predicted the carbon emissions throughout the life cycle of the wave energy convertor. Analyzing and calculating the carbon emission indicators (Table 6 and Table 7), it is observed that the Carbon Payback Time for the wave energy convertor ranges from 0.28 to 2.06 years. Over its full life cycle, the device can reduce carbon emissions by 238.33 to 261.80 t CO2. The carbon emission factor for steel production is almost the same in China and Brazil because they are both developing countries. Although Brazil is the farthest away from China, due to the use of waterway transportation, the carbon emission of wave energy converters produced by Brazil is almost the same as that of China in the whole life cycle. In addition, Japan’s steel production has the smallest carbon emission factor due to industrial agglomeration and the increasing share of electricity in steel production, and transportation distances are closer to those of China, so the full life cycle carbon emissions of the wave power generators it produces are about 40% of those of China’s.
Figure 4 and Figure 5 depict the carbon emission proportions, considering and not considering the recycling of metal materials. Without considering metal material recycling, the manufacturing stage is the main stage of carbon emission in the whole life cycle, and the proportion in this stage is almost 90%, followed by the transport stage, which is about 7%. This conclusion is similar to the data in [40]. When considering metal material recycling, the proportion of carbon emissions in the manufacturing stage is reduced, and the proportion of carbon emissions in the transport stage is increased, from about 7% to about 20%. In order to reduce carbon emissions throughout the life cycle of wave power devices, on the one hand, it is necessary to reduce carbon emissions by shortening transportation distances, and on the other hand, it is necessary to reduce carbon emissions at the manufacturing stage by adopting imported manufacturing materials or new materials to replace traditional steel. For example, the Clean Energy Transition Program (CETP) in Europe is supporting the development of high-performance concrete for use in the buoy structure of wave power devices in order to reduce carbon emissions and construction costs [42]. In addition, this paper also suggests that artificial intelligence, machine learning, neural networks, and other technologies should be applied to the energy management system of wave energy converters, so as to maximize the rational planning and utilization of wave energy, and then improve the conversion efficiency of wave energy converter to reduce carbon emissions [43,44,45].
Nassar et al. provide the Emission factor of CO2 of different power plants’ technologies (Table 7 of [38]), as shown in Table 8, where the Emission factor of CO2 for wave energy convertor is significantly lower than thermal power plants, thermal solar energy, and photovoltaic solar energy. It is comparable to hydropower, offshore wind energy, and onshore wind energy, emphasizing the substantial carbon reduction potential of wave energy convertor.

6. Conclusions

This study employed the life cycle assessment method to establish a carbon emission model for wave energy convertor, encompassing five stages: Manufacturing, Transport, Installation and Construction, Operation and Maintenance, and Recycling. Using indoor tank experiment data for the wave energy convertor and carbon emission factors for steel production in China, the European Union, Brazil, and Japan, the actual carbon emissions during the operational stage of the wave energy convertor were predicted. The following conclusions were drawn:
(1)
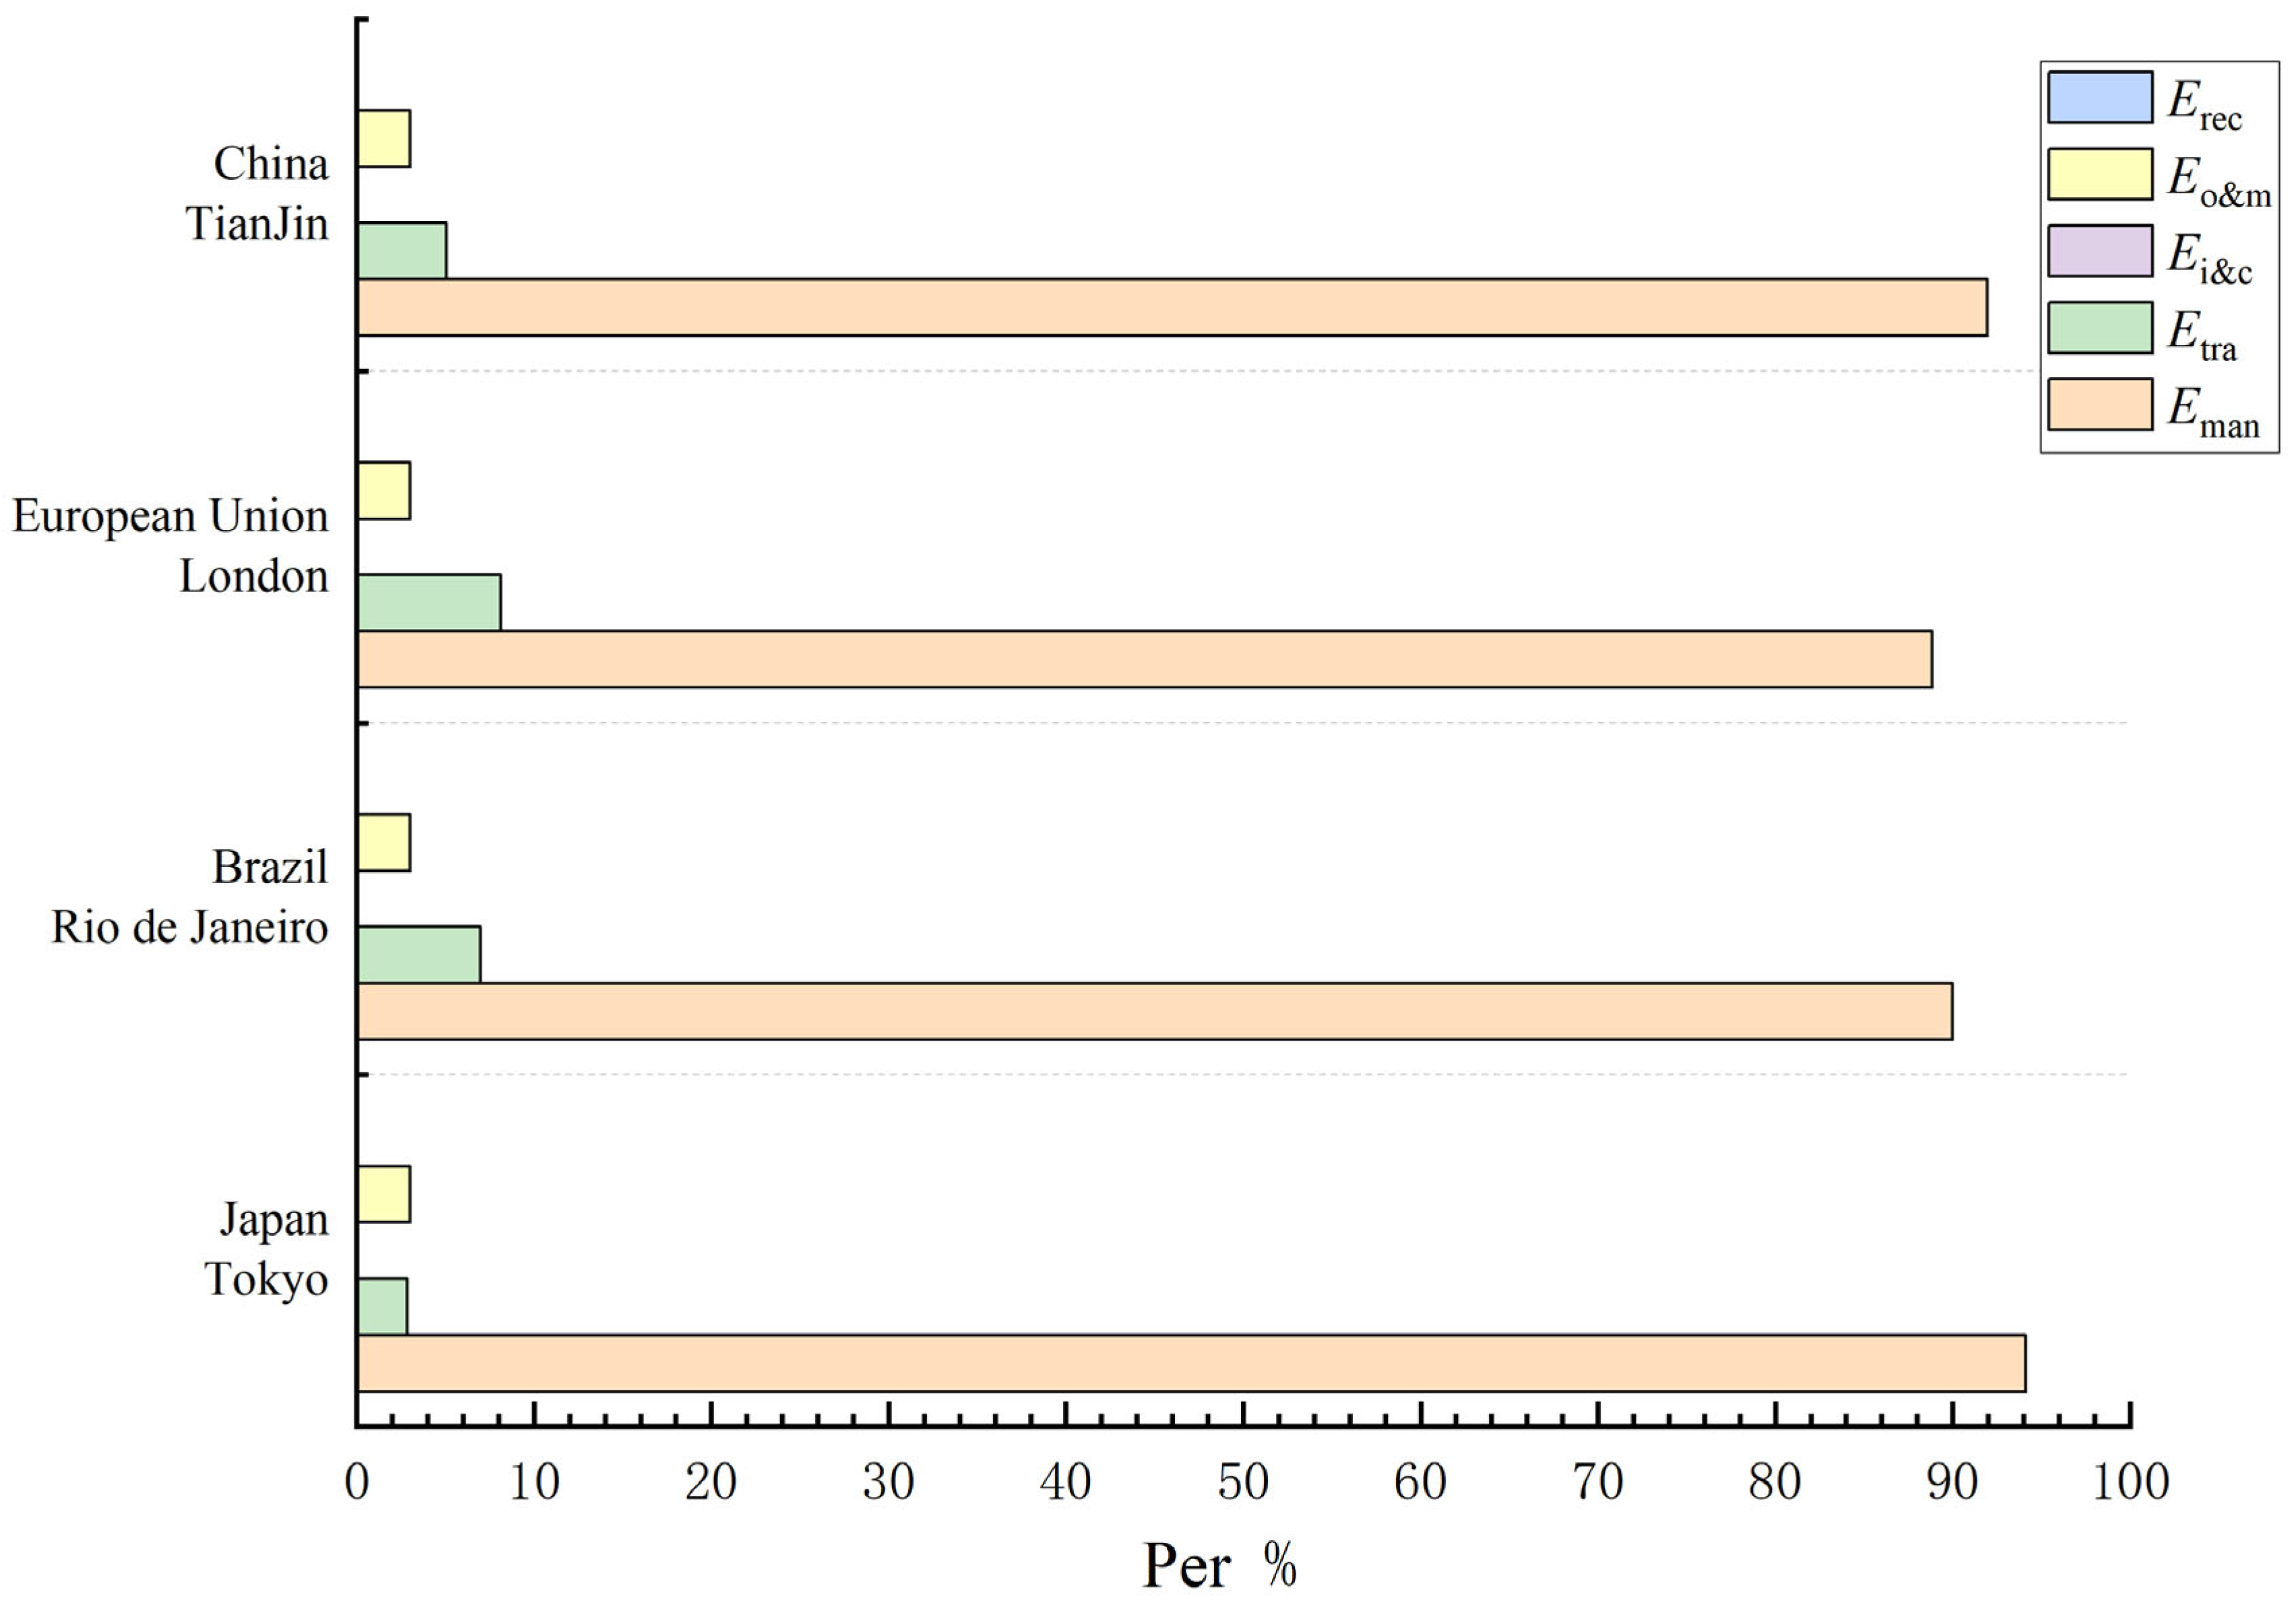
The major contributors to the carbon emissions over the full life cycle of the wave energy convertor are the manufacturing and transport stages. Without considering metal material recycling, carbon emissions predominantly arise from the manufacturing stage. While considering metal material recycling, the carbon emissions in the manufacturing stages are reduced, but they are still the main source of carbon emissions. Due to variations in steel production processes and transportation distances among different countries, there is a significant difference in total carbon emissions during the manufacturing and transport stages, ranging from 2.2 to 2.5 times between the highest and lowest emissions.
(2)
According to the carbon emission model prediction research of the wave energy convertor proposed in this study, when accounting for metal material recycling, the carbon emission coefficient for unit electricity generation ( E F co 2 ) ranges from 0.008 kg CO2/kWh to 0.059 kg CO2/kWh. Because the use of electricity in steel production in Japan is higher than that in other countries, the lowest E F co 2 is 0.008 kg CO2/kWh. When the traditional steel production mode is adopted, the E F co 2 in this paper is 0.014–0.059 kg CO2/kWh. This is in close proximity to the Emission factor of CO2 for wave energy convertor provided in [38] (0.012 kg CO2/kWh to 0.050 kg CO2/kWh), validating the alignment between the proposed carbon emission model and actual operational data for wave energy convertor.
(3)
The lifespan of the wave energy convertor significantly impacts full life-cycle carbon emissions. Considering metal material recycling, the Carbon Payback Time ranges from 0.28 to 0.72 years, and the highest carbon reduction within its lifespan (20 years) can reach 261.80 t CO2. Without considering metal material recycling, the Carbon Payback Time ranges from 0.90 to 2.06 years, and the highest carbon reduction within its lifespan (20 years) can reach 253.72 t CO2. As the lifespan of the wave energy convertor increases, the carbon reduction potential will further rise.
To minimize the overall carbon emissions of wave energy convertors, it is recommended to manufacture them near steel production sources, thereby reducing carbon emissions during transportation. Additionally, improving the device’s performance to enhance conversion efficiency or extending its operational lifespan could further increase the overall carbon reduction. The findings of this study contribute to a deeper understanding of the environmental impact of wave energy convertors, providing theoretical guidance for optimizing design, manufacturing, and operational processes to reduce carbon emissions and supporting the data foundation for promoting sustainable energy development.

Author Contributions

Conceptualization, Y.Z., C.Z. and H.X.; Methodology, J.L.; Validation, H.W. and B.W.; Formal analysis, X.W.; Writing—original draft, J.L.; Writing—review & editing, J.L. All authors have read and agreed to the published version of the manuscript.

Funding

This research was funded by the National Key Research and Development Project of the Ministry of Science and Technology of China, grant number 2023YFC3107505, and the National Natural Science Foundation of China, grant number U20A20106.

Data Availability Statement

The original contributions presented in the study are included in the article, further inquiries can be directed to the corresponding author.

Conflicts of Interest

The authors declare no conflict of interest.

References

  1. International Energy Agency. IEA World Energy Statistics 2018; International Energy Agency: Paris, France, 2018; ISBN 978-92-64-30126-9. [Google Scholar]
  2. Cascajo, R.; García, E.; Quiles, E.; Correcher, A.; Morant, F. Integration of Marine Wave Energy Converters into Seaports: A Case Study in the Port of Valencia. Energies 2019, 12, 787. [Google Scholar] [CrossRef]
  3. Wang, X.; Xia, H.; Guo, Y.; Duan, Y.; Wang, M.; Liu, Y.; Si, H. Research on Field Testing and Assessment Technology of Ocean Energy Converters. Ocean Eng. 2023, 285, 115539. [Google Scholar] [CrossRef]
  4. Sun, P.; Wang, J. Long-Term Variability Analysis of Wave Energy Resources and Its Impact on Wave Energy Converters along the Chinese Coastline. Energy 2024, 288, 129644. [Google Scholar] [CrossRef]
  5. Mørk, G.; Barstow, S.; Kabuth, A.; Pontes, M.T. Assessing the Global Wave Energy Potential. In Proceedings of the 29th International Conference on Ocean, Offshore and Arctic Engineering, Shanghai, China, 6–11 June 2010; ASMEDC: Shanghai, China, 2010; Volume 3, pp. 447–454. [Google Scholar]
  6. Liu, Y.; Huang, M.; Peng, A. Research progress on electrical conversion and control of oscillating water column wave energy converter. Acta Energiae Solaris Sin. 2023, 1–12. [Google Scholar] [CrossRef]
  7. Neill, S.P.; Angeloudis, A.; Robins, P.E.; Walkington, I.; Ward, S.L.; Masters, I.; Lewis, M.J.; Piano, M.; Avdis, A.; Piggott, M.D.; et al. Tidal Range Energy Resource and Optimization—Past Perspectives and Future Challenges. Renew. Energy 2018, 127, 763–778. [Google Scholar] [CrossRef]
  8. Kev, K.; Modi, N.; Milani, D.; Luu, M.T.; Nelson, S.; Abdul Manaf, N.; Wang, X.; Negnevitsky, M.; Abbas, A. A Comparative Life Cycle Impact Assessment for Solar Heat Integration in Post-Combustion Carbon Capture. Energy Convers. Manag. 2023, 297, 117745. [Google Scholar] [CrossRef]
  9. Nian, V.; Chou, S.K.; Su, B.; Bauly, J. Life Cycle Analysis on Carbon Emissions from Power Generation—The Nuclear Energy Example. Appl. Energy 2014, 118, 68–82. [Google Scholar] [CrossRef]
  10. Nian, V. Change Impact Analysis on the Life Cycle Carbon Emissions of Energy Systems—The Nuclear Example. Appl. Energy 2015, 143, 437–450. [Google Scholar] [CrossRef]
  11. Mostafaei, H.; Keshavarz, Z.; Rostampour, M.A.; Mostofinejad, D.; Wu, C. Sustainability Evaluation of a Concrete Gravity Dam: Life Cycle Assessment, Carbon Footprint Analysis, and Life Cycle Costing. Structures 2023, 53, 279–295. [Google Scholar] [CrossRef]
  12. Verma, S.; Paul, A.R.; Haque, N. Selected Environmental Impact Indicators Assessment of Wind Energy in India Using a Life Cycle Assessment. Energies 2022, 15, 3944. [Google Scholar] [CrossRef]
  13. Kaldellis, J.K.; Apostolou, D. Life Cycle Energy and Carbon Footprint of Offshore Wind Energy. Comparison with Onshore Counterpart. Renew. Energy 2017, 108, 72–84. [Google Scholar] [CrossRef]
  14. Schreiber, A.; Marx, J.; Zapp, P. Comparative Life Cycle Assessment of Electricity Generation by Different Wind Turbine Types. J. Clean. Prod. 2019, 233, 561–572. [Google Scholar] [CrossRef]
  15. Zhang, J.; Wang, Z.; He, Y.; Li, M.; Wang, X.; Wang, B.; Zhu, Y.; Cen, K. Comparison of Onshore/Offshore Wind Power Hydrogen Production through Water Electrolysis by Life Cycle Assessment. Sustain. Energy Technol. Assess. 2023, 60, 103515. [Google Scholar] [CrossRef]
  16. Wang, Y.; Sun, T. Life Cycle Assessment of CO2 Emissions from Wind Power Plants: Methodology and Case Studies. Renew. Energy 2012, 43, 30–36. [Google Scholar] [CrossRef]
  17. Sun, Z.; You, X. Life Cycle Carbon Footprint Accounting of an Offshore Wind Farm in Southeast China—Simplified Models and Carbon Benchmarks for Typhoons. Appl. Energy 2024, 355, 122267. [Google Scholar] [CrossRef]
  18. Ogunjuyigbe, A.S.O.; Ayodele, T.R.; Akinola, O.A. Optimal Allocation and Sizing of PV/Wind/Split-Diesel/Battery Hybrid Energy System for Minimizing Life Cycle Cost, Carbon Emission and Dump Energy of Remote Residential Building. Appl. Energy 2016, 171, 153–171. [Google Scholar] [CrossRef]
  19. Yan, Y.; Zhang, H.; Meng, J.; Long, Y.; Zhou, X.; Li, Z.; Wang, Y.; Liang, Y. Carbon Footprint in Building Distributed Energy System: An Optimization-Based Feasibility Analysis for Potential Emission Reduction. J. Clean. Prod. 2019, 239, 117990. [Google Scholar] [CrossRef]
  20. Liu, C.; Wang, H.; Wang, Z.; Liu, Z.; Tang, Y.; Yang, S. Research on Life Cycle Low Carbon Optimization Method of Multi-Energy Complementary Distributed Energy System: A Review. J. Clean. Prod. 2022, 336, 130380. [Google Scholar] [CrossRef]
  21. Liu, Y.; Feng, D.; Deng, S.; Liu, S.; Zhu, Y. Motion Similarity of an Underwater Glider Based on Scaled Model. J. Tianjin Univ. (Sci. Technol.) 2023, 56, 119–126. [Google Scholar]
  22. Qiao, D.; Zhi, G.; Liang, H.; Ning, D.; Yan, J.; Li, B. Scaling Orchestration in Physical Model Test of Oscillating Buoy Wave Energy Converter. Front. Mar. Sci. 2021, 8, 627453. [Google Scholar] [CrossRef]
  23. Liu, Y.; Wu, S.; Wang, D.; Wang, R. Research progress of ocean wave energy converters. J. Shandong Univ. (Eng. Sci.) 2021, 51, 63–75. [Google Scholar]
  24. IEC/TS 62600-102:2016; Marine energy-Wave, tidal and other water current converters-Part 102: Wave energy converter power performance assessment at a second location using measured assessment data. International Electrotechnical Commission (IEC): Geneva, Switzerland, 2016.
  25. Sheng, S.; Zhang, Y.; You, Y.; Jiang, J.; Wang, K.; Wang, Z. Testing and analysis of wave energy resources in Dawanshan energy demonstration field. Acta Energiae Solaris Sin. 2019, 40, 462–465. [Google Scholar]
  26. Wu, R.; Chen, Y.; Peng, Z.; Xue, M.; Li, M.; Wu, B. Influence of circuit on power generation performance of wave energy power generation device using oscillating water column technology. Acta Energiae Solaris Sin. 2022, 43, 410–415. [Google Scholar] [CrossRef]
  27. Shi, S.; Zhen, Y. Uncertainty analysis of submarine scale-mode drag test. J. Exp. Fluid Mech. 2015, 29, 65–71. [Google Scholar]
  28. Gao, C.; Niu, J.; Wang, F. Review of Carbon Emission Accounting Methods and Carbon Emission Factor in Steel Production. Contemp. Econ. Manag. 2021, 43, 33–38. [Google Scholar] [CrossRef]
  29. IPCC. 2019 Refinement to the 2006 IPCC Guidelines for National Greenhouse Gas Inventories; IPCC: Geneva, Switzerland, 2019. [Google Scholar]
  30. Leão, A.S.; Medeiros, D.L.; Santiago, M.A.; Do Carmo Tavares, A.O.; Maranduba, H.L.; Almeida, E.D.S. Rigorous Environmental and Energy Life Cycle Assessment of Blast Furnace Pig Iron in Brazil: The Role of Carbon and Iron Sources, and Co-Product Utilization. Sustain. Mater. Technol. 2023, 36, e00607. [Google Scholar] [CrossRef]
  31. Honma, S.; Ushifusa, Y.; Okamura, S.; Vandercamme, L. Measuring Carbon Emissions Performance of Japan’s Metal Industry: Energy Inputs, Agglomeration, and the Potential for Green Recovery Reduction. Resour. Policy 2023, 82, 103519. [Google Scholar] [CrossRef]
  32. Peng, M.; Li, J.; Hu, H. Research on Fuel Consumption & Carbon Emission Factor of Road Freight Trucks. Automot. Technol. 2015, 4, 37–40. [Google Scholar]
  33. Wu, X.; Mao, B.; Zhou, Q.; Huang, J.; Tong, R. Comparative of Carbon Emission Factor Levels in Different Modes of Transportation Industry. J. East China Jiaotong Univ. 2022, 39, 41–47. [Google Scholar] [CrossRef]
  34. Wu, X.; Li, Z.; Tang, X.; Mi, C.; Chen, Y. Research on Technical Path of Carbon Footprint Accounting for Hydropower Projects. Environ. Impact Assess. 2023, 45, 59–63. [Google Scholar] [CrossRef]
  35. Davidsson, S.; Höök, M.; Wall, G. A Review of Life Cycle Assessments on Wind Energy Systems. Int. J. Life Cycle Assess. 2012, 17, 729–742. [Google Scholar] [CrossRef]
  36. Kabir, M.R.; Rooke, B.; Dassanayake, G.D.M.; Fleck, B.A. Comparative Life Cycle Energy, Emission, and Economic Analysis of 100 kW Nameplate Wind Power Generation. Renew. Energy 2012, 37, 133–141. [Google Scholar] [CrossRef]
  37. Brussa, G.; Grosso, M.; Rigamonti, L. Life Cycle Assessment of a Floating Offshore Wind Farm in Italy. Sustain. Prod. Consum. 2023, 39, 134–144. [Google Scholar] [CrossRef]
  38. Nassar, Y.F.; El-Khozondar, H.J.; El-Osta, W.; Mohammed, S.; Elnaggar, M.; Khaleel, M.; Ahmed, A.; Alsharif, A. Carbon Footprint and Energy Life Cycle Assessment of Wind Energy Industry in Libya. Energy Convers. Manag. 2024, 300, 117846. [Google Scholar] [CrossRef]
  39. Bonou, A.; Laurent, A.; Olsen, S.I. Life Cycle Assessment of Onshore and Offshore Wind Energy-from Theory to Application. Appl. Energy 2016, 180, 327–337. [Google Scholar] [CrossRef]
  40. Xiang, N.; Wang, L.; Qu, Q.; Xiong, C.; Wang, B. Comparison of emissions from offshore and onshore wind power systems based on life cycle assessment. Resour. Sci. 2021, 43, 745–755. [Google Scholar]
  41. Ministry of Ecology and Environment of the People’s Republic of China. The Notice on Doing a Good Job in the Management of Greenhouse Gas Emission Reports for Enterprises in the Power Generation Industry from 2023 to 2025; Ministry of Ecology and Environment of the People’s Republic of China: Beijing, China, 2023. [Google Scholar]
  42. Ocean Harvesting. WECHULL+ Project to Develop Novel Floating Structures Based on High-Performance Concrete and Ocean Harvesting’s Buoy Design. Ocean Harvest. Technol. 2023. Available online: https://oceanharvesting.com/2023/12/19/wechull-project-to-develop-novel-floating-structures-based-on-high-performance-concrete-and-ocean-harvestings-buoy-design/ (accessed on 15 February 2024).
  43. Yu, X.; Ai, T.; Wang, K. Application of Nanogenerators in Acoustics Based on Artificial Intelligence and Machine Learning. APL Mater. 2024, 12, 020602. [Google Scholar] [CrossRef]
  44. Yu, X.; Shang, Y.; Zheng, L.; Wang, K. Application of Nanogenerators in the Field of Acoustics. ACS Appl. Electron. Mater. 2023, 5, 5240–5248. [Google Scholar] [CrossRef]
  45. Gao, J.; Yang, D.; Wang, S.; Li, Z.; Wang, L.; Wang, K. State of Health Estimation of Lithium-Ion Batteries Based on Mixers-Bidirectional Temporal Convolutional Neural Network. J. Energy Storage 2023, 73, 109248. [Google Scholar] [CrossRef]
Figure 1. System Boundary for Carbon Emissions throughout the Lifecycle of a Wave Energy Convertor.
Energies 17 01626 g001
Figure 2. Ocean Power Environment Laboratory at the National Ocean Technology Center.
Energies 17 01626 g002
Figure 3. Measurement Uncertainty Assessment Flowchart for Experimental Results of the Wave Energy Convertor Model in Laboratory Tests.
Energies 17 01626 g003
Figure 4. Carbon emission proportions for different stages of the wave energy convertor’s life cycle (without considering metal material recycling).
Energies 17 01626 g004
Figure 5. Carbon emission proportions for different stages of the wave energy convertor’s life cycle (considering metal material recycling).
Energies 17 01626 g005
Table 1. Parameters and Scale Factors for Froude Similarity Criteria for Wave Energy Convertors.
ParameterScale Factor
Lengthλ
Areaλ2
Volumeλ3
Timeλ0.5
Table 2. Comparison of Parameters between the Wave energy convertor Model and the Intended Sea-Deployed Wave Energy Convertor.
Scale FactorWave Energy Convertor Model ParametersIntended Sea-Deployed Wave Energy Convertor Parameters
Device Sizeλ = 34.0 m × 1.8 m × 1.8 m12 m × 5.4 m × 5.4 m
Wave-Facing Widthλ = 31.83 m5.49 m
Device Weightλ3 = 81300 kg10,400 kg
Table 3. Laboratory Tank Experiment Conditions for the Wave Energy Convertor Model.
No.Wave Energy Convertor Indoor Experiment ParametersIntended Deployment Area Wave ParametersConversion Efficiency (%)
Effective Wave Height
(m)
Significant Wave Period
(s)
Effective Wave Height
λ = 3
Significant Wave Period
λ0.5 = 1.732
10.2172.300.6513.983620.02
20.2202.300.6603.983619.34
30.2192.400.6574.156822.80
40.2202.400.6604.156823.34
50.2262.450.6784.243425.16
60.2272.450.6814.243425.79
70.2182.500.6544.330021.93
80.2192.500.6574.330021.72
90.2272.700.6814.676419.00
Table 4. CO2 Emissions for Wave energy convertor manufacturing in Different Countries or Regions.
Country or RegionCarbon Emission Factor for Steel Production (tCO2/t)Weight of the Wave Energy Convertor (t)CO2 Emissions (t)
China1.97012.424.43
European Union1.32812.416.47
Brazil1.98012.424.56
Japan0.90312.411.20
Table 5. CO2 Emissions for Wave Energy Convertor Transport.
Port of LoadingPort of Destination (Qianshan/Zhuhai)Deployment Sea Area (Dawanshan)The Total of CO2 Emissions
(t)
Distance
(km)
CO2 Emissions
(t)
Water Transport Carbon Emission Factor (kg/t·km)Distance of Water Transport
(km)
Weight
(t)
CO2 Emissions
(t)
China, Tianjin22301.330.0085012.40.011.34
European Union, London17,9411.500.0085012.40.011.51
Brazil, Rio de Janeiro18,6731.900.0085012.40.011.91
Japan, Tokyo29750.330.0085012.40.010.34
Table 6. Carbon emissions over the full life cycle of wave energy convertors (without considering the recycling of manufacturing metal materials).
Country and RegionEman
(tCO2)
Etra
(tCO2)
Ei&c
(tCO2)
Eo&m
(tCO2)
Erec
(tCO2)
Econ
(tCO2)
Epow
(kWh)
E F co 2
(kg CO2/kWh)
CPT
(year)
Ered
(tCO2)
China, TianJin24.431.340Econ × 3%026.564.66 × 1050.0572.00239.05
European Union, London16.471.510Econ × 3%018.534.66 × 1050.0401.40247.08
Brazil, Rio de Janeiro24.561.910Econ × 3%027.294.66 × 1050.0592.06238.33
Japan, Tokyo11.200.340Econ × 3%011.904.66 × 1050.0260.90253.72
Table 7. Carbon emissions over the full life cycle of wave energy convertors (considering the recycling of manufacturing metal materials).
Country and RegionEman
(tCO2)
Etra
(tCO2)
Ei&c
(tCO2)
Eo&m
(tCO2)
Erec
(30%Eman)
Econ
(tCO2)
Epow
(kWh)
E F co 2
(kg CO2/kWh)
CPT
(year)
Ered
(tCO2)
China, TianJin24.431.340Econ × 3%−17.108.944.66 × 1050.0190.67256.68
European Union, London16.471.510Econ × 3%−11.536.654.66 × 1050.0140.50258.97
Brazil, Rio de Janeiro24.561.910Econ × 3%−17.209.564.66 × 1050.0200.72256.06
Japan, Tokyo11.200.340Econ × 3%−7.843.814.66 × 1050.0080.28261.80
Table 8. Emission factor of CO2 for different power generation technologies.
Energy Generation TechnologyEmission Factor (g CO2/kWh)
Thermal power plant800–1500
Biomass energy100–1000
Biogas energy25–600
Thermal solar energy15–150
Photovoltaic solar energy20–200
Geothermal energy10–80
Tidal energy10–80
Wave energy (This paper)19–57
Wave energy12–50
Hydropower2–60
Off-shore wind energy5–70
Onshore wind energy5–70
Nuclear energy10–20
Disclaimer/Publisher’s Note: The statements, opinions and data contained in all publications are solely those of the individual author(s) and contributor(s) and not of MDPI and/or the editor(s). MDPI and/or the editor(s) disclaim responsibility for any injury to people or property resulting from any ideas, methods, instructions or products referred to in the content.

