Abstract
Transitioning to more ambitious electrode formulations facilitates developing high-energy density cells, potentially fulfilling the demands of electric car manufacturers. In this context, the partial replacement of the prevailing anode active material in lithium-ion cells, graphite, with silicon-based materials enhances its capacity. Nevertheless, this requires adapting the rest of the components and harmonizing the electrode integration in the cell to enhance the performance of the resulting high-capacity anodes. Herein, starting from a replacement in the standard graphite anode recipe with 22% silicon suboxide at laboratory scale, the weight fraction of the electrochemically inactive materials was optimized to 2% carbon black/1% dispersant/3% binder combination before deriving an advantage from including single-wall carbon nanotubes in the formulation. In the second part, the recipe was upscaled to a semi-industrial electrode coating and cell assembly line. Then, 1 Ah lithium-ion pouch cells were filled and tested with different commercial electrolytes, aiming at studying the dependency of the Si-based electrodes on the additives included in the composition. Among all the electrolytes employed, the EL2 excelled in terms of capacity retention, obtaining a 48% increase in the number of cycles compared to the baseline electrolyte formulation above the threshold capacity retention value (80% state of health).
1. Introduction
In the last decade, remarkable advances in battery technology have been achieved, marked by the development of systems with higher capacities and rate capabilities. However, batteries have yet to fully meet the demanding standards required to pose a competitive challenge to conventional combustion engines and fuel cell drivetrains. The pursuit of this objective involves a wide-ranging plan, including the reduction of battery weight, extension of their range, enhancement of charging speed, and the mitigation of safety risks. Among many other strategies, the progress in cell chemistry has notably contributed to reaching these requirements. Lately, impressive strides have been achieved on post-lithium systems, i.e., batteries that are based on the shuttling of Na, Mg, Ca, Zn, and Al ions. However, these cell chemistries have not reached a sufficient degree of maturity like their Li-ion-based counterparts, which are still dominating the electronic industry after more than 30 years [1,2,3].
Since the commercialization of the first lithium-ion batteries (LIB) containing a LiCoO2 cathode, research efforts have been dedicated to the development of safer and more sustainable cathode materials. Due to lower cost and less risk potential, the automotive industry has leaned towards the substitution of cobalt by nickel and manganese in the so-called nickel manganese cobalt oxide (LiNixMnyCozO2 with x + y + z = 1, NMC) cathodes [4,5,6]. Simultaneously, there has been a growing emphasis on redesigning the anodes to obtain higher capacities at the cell level. While lithium metal anodes were presented as a possible option, the safety concerns associated with the formation of dendrites on the surface of the anode made researchers change the strategy [7]. In this sense, graphite was considered as an alternative solution due to the stabler and safer operation principle of intercalating the lithium ions (Li+) in the layered carbon host [8,9]. However, this implies a capacity reduction from 3861 mA·h·g−1 to 372 mA·h·g−1 of the lithiated graphite [10]. A promising option that could boost the theoretical gravimetric capacity involves transitioning from lithium metal to alloys. Silicon (Si) emerges as a viable choice due to its abundance, safety, affordability, and high storage capacity [11,12,13]. When reacting with Li, it forms an alloy composed of Li15Si4 with a theoretical capacity of 3579 mA·h·g−1 [14]. Moreover, Si anodes serve as a safer replacement because they can mitigate the deposition of Li at the electrode surface, an issue associated with graphite electrodes, due to the slightly higher lithiation potential (~0.4 V vs Li/Li+) [13]. However, the full lithiation of Si can lead to a large volume expansion (>300%) that can deteriorate the electrode’s integrity, thus causing the isolation of active material from the binder and carbon additives [15,16]. In addition, the repeated expansion and contraction of the particles lead to continuous side reactions at the Si/electrolyte interface, causing ongoing electrolyte decomposition and a progressive decline in active lithium [17]. Thus, silicon has been blended with graphite in most of the cases, being present in small concentrations [18].
In recent years, diverse methods have been investigated to address this mechanical strain challenge. One approach involves the active development of nanostructured Si materials, recognized for their ability to mitigate particle fractures [19,20]. Among these structures, Si nanoparticles have emerged prominently due to their relatively straightforward processing methods, offering reduced costs compared to more intricate structures, such as nanowires, nanohollows, and nanotubes [21,22,23]. It is equally crucial to maintain effective conductivity in Si powder blends with electronic insulator binders. To address this, carbon-based conductive additives have emerged as the most practical approach. Carbon black (CB) is a common zero-dimensional material that establishes point-to-point contacts among Si particles, albeit offering inefficient electronic pathways [24]. Consequently, a higher quantity of CB is necessary for electrode formulations to achieve adequate conductivity. In contrast, carbon nanotubes (CNT), especially single-walled CNT (SWCNT), possess a one-dimensional structure with notable porosity and surface area [25]. This material can create three-dimensional conductive networks between other CNT and Si particles, presenting an appealing alternative as a conductive additive [26,27]. Nevertheless, the addition of the conductive agent does not directly impact the energy density. Hence, optimizing its quantity is essential to attain optimal conductivity while maintaining a respectable energy density.
A successful strategy to overcome the issue of the mechanical stability of silicon upon cycling has consisted of replacing this Si with Si-based components. Today, Si-containing anodes in the battery industry typically employ silicon (sub)oxide (SiOx) [6,28], constraining volume expansion during lithiation to ~120% [29,30]. Nevertheless, the specific capacity is also lower than that of pure silicon (1000–1300 mA·h·g−1, based on the formation of Li15Si4, depending on the degree of oxidation of SiOx [31]). Indeed, the reactivity of the SiOx towards lithium varies with the silicon and oxygen content. There is a trade-off between the oxygen and silicon content in the suboxides in terms of cycling stability and initial capacity efficiency. It is widely accepted that the interaction of lithium ions with O-rich SiOx results in higher amounts of lithium oxides (Li2O) and lithium silicates (Li4SiO4) formed during the initial lithiation process together with Li15Si4, the reversible Li–Si alloy providing capacity in the subsequent delithiation. Li2O and Li4SiO4 help to accommodate the volume expansion that occurs during cycling. These compounds act as a buffer, absorbing some of the volume expansion and reducing the mechanical stress on the material, ultimately benefiting the long-term cycling stability of silicon oxide materials used in Li-ion battery anodes. However, the presence of these compounds enhances the voltage hysteresis, and the lithium consumed for their formation is not electrochemically reversed [32,33].
In academia, energy density calculations often focus solely on active materials, while in industry, this parameter must be considered at the cell level [34]. Values derived without acknowledging the previously discussed practical limitations in Si-dominant systems tend to be artificially overestimated, thus hindering the commercial viability of pure Si anodes. Recent studies by Kim et al. elucidated some critical factors influencing the practical energy density of Si-containing batteries, such as electrode swelling and operational cut-off voltage [35]. Their findings indicate that cells with over 10 wt.% SiOx exhibit higher energy densities than commercial graphite cells. Nevertheless, those cells surpassing 20 wt.% SiOx in the anode demonstrate reduced energy densities due to heightened electrode swelling, necessitating greater free space that diminishes the stack count within the confined pouch cell space.
Pursuing the filling of the gap between the laboratory scale and industrial scale is one of the main goals of this work. Similar to the final validation step here, several works report the use of Si-based materials in pouch cell format but do not usually include the electrode development phase at the laboratory scale. Nevertheless, they reach significant conclusions related to the causes of the capacity fade of the cells. Wang et al. [36] analyzed the influence of the lower cut-off voltage on the performance of commercial LiNi0.8Co0.1Mn0.1O2 (NMC811)//graphite–SiOx pouch batteries of 50 Ah. The capacity retention of the cells was increased by increasing the lower cut-off voltage from 2.8 V to 3.0 V, which also caused a decrease in the operation temperature. The degradation of NMC//Si-based anode pouch cells was also studied by De Sutter et al. [37]. In their work, they reported an innovative cell set-up to monitor the influence of different stressors on the capacity retention of 1.4 Ah pouch cells. They identified an optimal initial pressure (7.5 kg in their work) and determined that increasing the current density, the depth of discharge, and the temperature negatively impacted the capacity retention. Furthermore, monitoring the pressure evolution over the battery lifetime evidenced an increase in the cell pressure when decreasing the capacity retention. In the second part of their work [38], they proposed a modeling methodology to estimate the cell capacity fade based on pressure measurements with a relative error of <1%. They suggested that the pressure evolution will become a key factor in designing future battery packs consisting of novel and high-capacity materials. These two studies are well aligned with Louli et al. [39], who followed the expansion–contraction evolution of NCA//SiOx-graphite cells by means of Archimedes’ method. They found that SiO has a large charge/discharge hysteresis, leading to an asymmetric volume expansion profile. In addition, they did not find differences in this behavior regardless of the Si-based material used (SiO, Si-alloy, or carbon-coated nano Si). The inhomogeneous volume expansion, together with inhomogeneities across the electrodes, was also identified by Graae et al. [14] as a main cause leading to cell degradation. In their study, neutron diffraction was used in NMC811//Si-graphite 5 Ah pouch cells to build up a 2D map of the anode and cathode lithiation and their corresponding volume variation.
In addition, numerous electrolyte additives have been reported to mitigate the continuous regeneration of the solid electrolyte interphase (SEI), promoting a stable surface film on the silicon electrode that can eventually lead to a better cyclability of the cells [40,41]. Among the most used solvents in Li-ion batteries, alkyl carbonates stand out for their broad stability potential windows crucial for systems employing 4 V (vs. Li/Li+) cathodes. In these solvents, active material particles are stable due to the formation of a passivation layer on its surface generated by the reduction of solvent molecules at high potentials [40,42]. In addition, vinylene carbonate (VC) is a known and trusted reactive additive that can reduce the irreversible capacity by inhibiting salt reduction [43,44]. VC’s ability to form polymeric surface species during reduction augments the cohesiveness and flexibility of surface films, presenting superior passivation compared to films composed solely of Li salts. On the other hand, fluoroethylene carbonate (FEC) has been introduced in the electrolyte in low concentration (<20 wt.%) due to its ability to reduce LiF levels on the surface, thereby improving cycling performance [45]. The presence of FEC is mandatory for the correct cycling of Si-based electrodes, but the increase in the viscosity of the electrolyte (leading to lower rate capability) and its elevated price make it recommendable to minimize its content [43,46]. Thus, the selection of an adequate electrolyte can be decisive for the successful implementation of Si-based electrodes in the cell production industry.
In alignment with these insights, in the present study, a negative electrode containing 22 wt.% of SiOx was fabricated in CIDETEC’s semi-industrial electrode production line, after optimization of the anodic formulation in the laboratory. The starting point of this research was a formulation already established in-house for graphite electrode manufacturing. The weight ratios of the inactive components (carbon black, dispersant, and binder) were adapted and SWCNT were included in the recipe to boost the performance of the SiOx-containing anodes. Afterwards, 1 Ah pouch cells were assembled to validate the advances. Finally, a benchmarking of different commercial electrolytes was conducted to ensure the prolonged cycle life of the assembled 1 Ah pouch cells. All the variables studied herein have been evidenced to influence the performance of the resulting negative electrodes and cells. This work aims to contribute to research groups working on the development and optimization of Si-based anodes.
2. Materials and Methods
2.1. Electrode Preparation
In the first part of this study, the formulation of the negative electrode was optimized. The active materials in these anodes were graphite (SMG-N-H3, Hitachi, Tokyo, Japan) and silicon suboxide (SiOx, confidential provider). The weight percentage of these components in the total weight of the anode coating was 72% and 22%, respectively. The other electrode components were carbon black (C-NERGY Super C45, IMERYS Carbon & Graphite, Paris, France) as the conductive additive, carboxymethyl cellulose (CMC, Walocel 2000, DOW Chemical Company, Midland, USA) as the disperser and the thickener, and styrene butadiene rubber (SBR, BM451B, ZEON Corporation, Chiyoda, Japan) as the binder. The weight percentages were varied in this part of the study and the different samples prepared are summarized in Table 1.

Table 1.
Summary of the samples prepared by adjusting the weight fraction of the electrochemically inactive electrode components.
Cx/Dy/Bz-type (x + y + z = 6) sample labeling was used, with C, D, and B used to identify carbon, dispersant, and binder, respectively, while x, y, and z were the corresponding weight fractions. In a later part of the optimization of the electrode, single-wall carbon nanotubes (SWCNT, TUBALL 0.4% H2O, OCSiAl, Luxembourg) replaced 0.1% of the carbon black. The electrolyte components were mixed in water under mechanical stirring (RW20D, IKA, Staufen im Breisgau, Germany) to produce the laboratory-scale slurries. These slurries consisted of 50 g of solids and the solid-to-liquid ratio was 1/0.63. The pH of the slurry was adjusted using 1.2 mL of a 50% H3PO4 solution. The slurries were deposited on an 8 μm-thick copper current collector (Furukawa, Tokyo, Japan) using a doctor blade. The coatings were dried in a convection oven at 80 °C. The target loading of the coatings was 3.3 mAh·cm−2 based on the estimated specific capacity (550 mAh·g−1). The coatings were calendered to 1.3 g cm−3 using a table-top calender machine (DPM solutions). The loading of the electrodes was verified by punching (EL-cut devices from EL-Cell) and weighting discs of 16.6 mm diameter. The density of the coatings was determined by measuring the thickness of the coatings, which was conducted using a micrometer (389–271C, Mitutoyo, Kanagawa, Japan).
The formulation optimized at the laboratory scale was upscaled to a semi-industrial electrode production line. For that aim, a 2 kg-solids slurry was prepared in a TX-5 Inoue mixer. The slurry was coated on both sides of the current collector using a semi-industrial coater (Werner Mathis AG, Oberhasli, Switzerland) with a knife system. The coating was dried in the same line in three consecutive convection ovens at 50, 60, and 70 °C. The coating obtained was calendered to the target density in a semi-industrial calendaring machine (LDHY 400-N45, Xingtai Naknor Technology Co., Xingtai, China). The same methodology followed at the laboratory scale was used to calculate the density of the coatings. The areal loading, however, was determined by cutting 5 cm × 5 cm samples from the coatings.
On the other hand, the cathode formulation consisted of 95% LiNi0.8Mn0.1Co0.1O2 (NMC811, T81R, Targray, Kirkland, Canada) as the active material, 2% carbon black (C-NERGY Super C65, IMERYS Carbon & Graphite, Paris, France) as the conductive additive, and 3% poly-vinylidene fluoride (PVDF, Solef® 5130, Solvay, Brussels, Belgium) as the binder. A 2.5 kg-solids slurry was prepared using N-methyl pyrrolidone (NMP, Synthesis grade, Scharlab, Barcelona, Spain) as the solvent. The coating procedure was the same as for the anode, being the sole difference in the drying temperature used: in this case, the ovens in the coating line were set at 105, 115, and 120 °C. The calendering and validation conditions were the same as those followed for the anode coating. The loading and density target values for the cathode were 3.0 mAh·cm−2 (based on a specific capacity of 200 mAh·g−1) and 3.2 g·cm−3, respectively.
The rheological behavior of one sample of each laboratory scale slurry and three per pilot line slurry was analyzed in a DHR2 rheometer from TA instruments. Furthermore, the adhesion strength of the coated electrodes on the current collector was measured using the 90° peel test (LS1 model, Lloyd Instruments Ltd., Bognor Regis, UK) on three stripes of 2 cm width. Finally, the correct dispersion of the different components of the calendered electrodes was verified utilizing a field emission scanning electron microscope (FE-SEM, ULTRA plus, ZEISS, Oberkochen, Germany).
2.2. Cell Assembly
All the cells in this study were assembled in a dry room with a dew point of −50 °C. The performance in the first cycles of the anodes elaborated at laboratory scale was evaluated in CR2025-type (Hohsen, Osaka, Japan) half coin cell (HCC) configuration. For that aim, discs of 16.6 mm in diameter were punched from the coatings. These electrodes were dried at 120 °C in a vacuum for 16 h. The cell cases were cleaned with ethanol in an ultrasonic bath for 15 min and dried at 60 °C for 1 h. Finally, the separators were dried at 60 °C in a vacuum for 16 h. The reference and the counter electrode in these cells was a disc of lithium (Albemarle Corporation, Charlotte, NC, USA) of 18.2 mm diameter. The electrolyte consisted of 1 mol·L−1 lithium hexafluorophosphate (LiPF6) in mixture of ethylene carbonate (EC), ethyl methyl carbonate (EMC), and dimethyl carbonate (DMC) (1:1:1) with 10 wt.% fluoroethylene carbonate (FEC), 1 wt.% vinylidene carbonate (VC), and 1% wt.% lithium bis(trifluoromethane sulfonyl)imide (LiTFSI) and was purchased from Solvionic. A total of 100 μL of electrolyte was used to impregnate the separator (Whatman GF/A, Whatman plc, Maidstone, UK) and the electrodes. This electrolyte formulation will be referred to hereafter as the Baseline electrolyte.
The capacity retention of the laboratory-scale anodes was evaluated in full coin cell (FCC) configuration. The sole difference for the HCC was the use of the NMC811 electrodes prepared at the coating line as the positive electrode (16.6 mm diameter) and 17.7 mm diameter anodes as the counter and the reference electrode.
Finally, the electrodes manufactured in the semi-industrial coating lines were used to assemble pouch cells. Electrodes were obtained from these coatings using a semiautomatic die-cutting unit (MTI Corp., Richmond, VA, USA). The dimensions of the anodes and the cathodes were 10 cm × 6.1 cm and 9.8 cm × 5.9 cm, respectively. The electrodes and the separator were dried under the same conditions as for the coin cells, while the aluminum laminated foil (ALF) and the flanges (tabs) were dried at 60 °C in a vacuum for 16 h. The separator for the pouch cells was a trilayer microporous membrane with an adhesive layer on each side (R0542C, Celgard, Charlotte, NC, USA). These layers were used to laminate the cathodes before stacking them with the anodes. The electrodes were stacked manually using a guiding tool to guarantee the stack alignment. Each cell consisted of four anodes and three cathodes. After stacking, the tabs of the electrodes were ultrasonically welded to terminal tabs (200 µm-thick Al (+) and Ni-plated Cu (−)). The stack was later placed in between two squared pieces of ALF. Three sides of these pieces of ALF were thermally sealed, while the other was used to add 3.7 mL of electrolyte. Twelve pouch cells were assembled, and six different electrolytes were tested. Thus, each electrolyte was tested in two cells. Apart from the Baseline electrolyte, the five other electrolytes were purchased from E-Lyte Innovation. The formulation of these electrolytes was not disclosed, but further information about them is available in Table 2.
Table 2.
Description of the electrolytes studied.
After the addition of the electrolyte, adequate impregnation was promoted by manually massaging the cells and by conducting two vacuum steps on the cells. Finally, the cells were subjected to −920 mBar and sealed under this pressure using a vacuum chamber sealer. The cells were subjected to a routine analysis of voltage and AC resistance at 1 kHz using a multimeter (BT3554, Hioki E. E. Corporation, Nagano, Japan) and placed between pressure plates. Then, 200 kPa pressure was fixed for the cells using a hydraulic press.
Afterward, the cells were formed and later brought back to the dry room for the degassing step. The cells were opened and weighed to ensure that no electrolyte was lost in this step. Finally, they were sealed back under −920 mBar.
2.3. Electrochemical Testing
All the cells in this study were studied in a room at 25 °C ± 1 °C controlled by air conditioning. The galvanostatic cycling tests were performed using a Basytec Cell Test System potentiostat (BaSyTec GmbH, Asselfingen, Germany). The HCC for the laboratory scale anode formulation optimization was subjected to a single formation cycle at 0.05C constant current between 10 mV and 1 V. The lithiation step included a constant voltage (CV) step at 10 mV until a current of 0.025C. Five cycles at 0.33C followed the formation cycle using the same voltage range. In these cycles, the CV step in the lithiation was stopped at 0.1C.
The capacity retention in FCC was evaluated following a similar protocol as that described in HCC. In both cases, the formation was conducted at 0.05C and followed by cycles at 0.33C. In the case of the FCC, the voltage range was 2.8 V–4.2 V, and the charge CV was until 0.025C in the formation cycle and until 0.1C in the rest of the cycles. The experiment was finalized when the state of health (SOH) dropped below 80%.
The formation protocol was the same in FCC and the pouch cell format. After the degassing of the pouch cells, discharge rate capability experiments were conducted with the cells containing different electrolytes. In these experiments, all the charges were performed at 0.33C with a CV step until 0.1C. The discharge rates studied were the following: 3 × 0.1C (three cycles at 0.1C), 3 × 0.33C, 3 × 0.5C, 1 × 0.33C, 3 × 1C, 1 × 0.33C, and 3 × 2C. After the discharge rate capacity tests, the capacity retention of the cells was evaluated. To that aim, the cells were subjected to 1 × 0.33C + 9 × 1C discharge C-rates (with charges at 0.33C with CV step until 0.1C) galvanostatic cycling blocks. The discharge capacity obtained in the 0.33C cycles in each block was used to calculate the SOH. The full testing protocol is described in Table S1. The tests were automatically stopped once the SOH value measured was below 80%. After that, the cells were analyzed through electrochemical impedance spectroscopy (EIS). These tests were performed in a Potentiostat/Galvanostat PGSTAT30 (Metrohm, Herisau, Switzerland) equipped with a Frequency Response Analyzer (FRA2, N4L, Auckland, New Zealand). Impedance spectra were fitted using Zview software version 3.5f (Scribner LLC, Southern Pines, NC, USA).
3. Results and Discussion
3.1. Balance between C45, CMC, and SBR
Electrodes with different fractions of C45, CMC, and SBR were prepared at a laboratory scale. The evaluation of these electrodes was initiated with the measurement of the adhesion strength. The 90° peel test results are shown in Table 3.
Table 3.
Results of the 90° peel test experiments with the different samples.
The formulation reproducing the baseline graphite formulation (C2/D2/B2) provided the lowest adhesion strength: 3.0 ± 0.1 N·m−1. The increase in the binder content showed a beneficial effect in this parameter: 9.2 ± 2.7 and 12.2 ± 8.2 N·m−1 were obtained with the C2/D1/B3 and the C1/D2/B3 coatings. The high dispersion in the results of the latter could be indicative of the improper dispersion of the component, although was not detected in the analysis of the electrode by FE-SEM, as will be evidenced in the following lines. These results pointed out the need to increase the binder content when partially replacing graphite with SiOx. As observed in a previous work analyzing water-based electrodes [47], the adhesion strength decreased when increasing the conductive carbon percentage. In addition, despite CMC being used as a dispersant, it also presents binding capabilities [48]. Considering CMC as a co-binder, the sample with the highest binder amount provided the highest peel strength.
Afterward, the dispersion of the different components was evaluated using FE-SEM. The micrographs obtained are shown in Figure S1. The component more severely affecting the adequate dispersion of the components should be the dispersant, which increased in the concentration can benefit the dispersion, and the conductive carbon. The latter tends to agglomerate during water processing due to its hydrophobicity [49], and an increase in its concentration should increase the chance of having an unsuccessful dispersion of the components. Nevertheless, no differences were observed in the FE-SEM images obtained, with no agglomerates visible. Thus, it was concluded that the differences in the material ratios in this study do not significantly impact the quality of the dispersion of the components. The last phase of the evaluation of the coatings consisted of their electrochemical evaluation: half coin cells (HCC) were assembled and tested, and the results are shown in Figure 1.
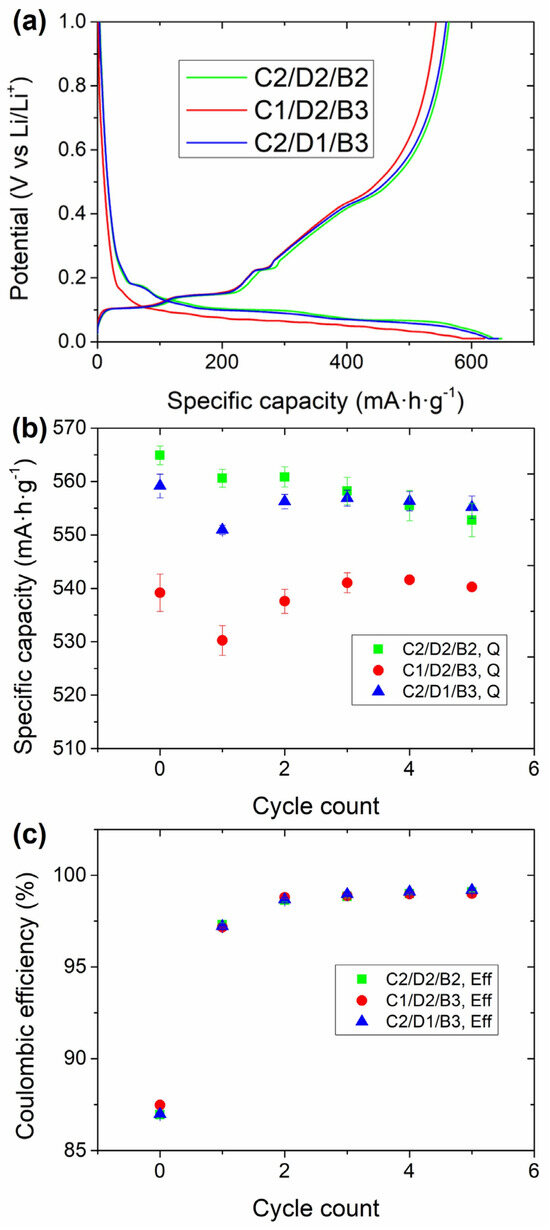
Figure 1.
Electrochemical evaluation in half coin cells of the C2/D2/B2, C2/D1/B3, and C2/D1/B3 electrodes. (a) Formation cycle at 0.05C (cycle #0), (b) delithiation capacity, and (c) Coulombic efficiency of the first five cycles (at 0.33C). The cells were cycled between 0.01 and 1 V.
The formation cycle (at 0.05C) of the electrodes with the different fractions of inactive components (i.e., C45, CMC, and SBR) is shown in Figure 1a. Above 0.2 V no defined plateaus were observed for any of the samples. On the contrary, a plateau between 0.4 and 0.5 V could be observed in the delithiation (charge) plateau, attributed to the electrochemical activity of SiOx. In the lithiation step, three well-defined plateaus at 0.18, 0.12, and 0.08 V could be observed for the C2/D2/B2 and the C2/D1/B1 samples, lower than the lithiation steps of graphite (0.17, 0.10, and 0.06 V) [50]. These plateaus correspond to the formation of LiC36, LiC12, and LiC6 in each plateau. The presence of SiOx leads to a delay in the intercalation of Li+ ions in graphite due to the different chemical potentials of these two active materials [51]. Nevertheless, the cells with C1/D2/B3 exhibited higher polarization upon lithiation, reaching earlier to the cut-off potential (0.01 V), and achieving lower lithiation capacity. The lithiation capacities for the C1/D2/B3, C2/D2/B2, and C2/D1/B3 cells were 616 ± 4, 650 ± 1, and 643 ± 3 mAh·g−1, respectively. As already mentioned, the delithiation of SiOx could be observed between 0.4 and 0.5 V of the subsequent charge. Before reaching that potential, three defined plateaus were obtained at 0.1, 0.14, and 0.21 V, corresponding to the delithiation of graphite. The extension of the plateaus associated with the delithiation of graphite was the same for the three samples, while the delithiation capacity ascribed to SiOx was lower for the sample consisting of C1/D2/B3. 540 ± 4, 565 ± 2, and 559 ± 2 mAh·g−1 were obtained with the cells consisting of the C1/D2/B3, C2/D2/B2, and C2/D1/B3 anodes, respectively. Regarding the first-cycle Coulombic efficiencies, the values obtained were 87.5 ± 0.1, 87.0 ± 0.2, and 88.1 ± 0.2%, respectively (Figure 1c). The cells providing the worst first-cycle efficiencies were those with the lowest SBR fraction. This could be associated with a higher degree of mechanical instability towards the volumetric expansion and contraction of SiOx with lower binder content.
Three main conclusions could be obtained from these experiments: (i) the lithiation of the samples with 2% C45 was better in terms of capacity and polarization than that with 1% C45; (ii) the active material more severely affected by this absence of C45 was SiOx; and (iii) the irreversibility (in terms of first cycle efficiency) was higher with the sample with the lowest content of SBR. Thus, 1% C45 might not be enough conductive additive to form a conductive network efficiently interconnecting the different components of the electrode while keeping the binder percentage above 2% can be beneficial to improve the mechanical stability of the electrode.
Increasing the current density to 0.33C and cycling at this rate for five cycles further evidenced the trend observed in the formation cycle: the cells with 1% of C45 continued providing lower delithiation capacity. However, the Coulombic efficiencies were similar for all the cells: it was ~98% for all the samples in the first 0.33C cycle, and close to 100% in the following ones. This could indicate that the impact of the binder content could not be that significant in these cycles.
All in all, Table S2 was built up to summarize all the factors studied in this section to facilitate the decision on the inactive component balance to be selected for the next step of the optimization process. The electrochemical performance with C1/D2/B3 was below that of the rest of the formulations due to the polarization observed, and even if the adhesion with this sample was the highest, it was discarded. It is worth noting that an increase in polarization can lead to lithium plating in a two-electrode full-cell format, in which there is no cut-off limit based on the potential of the anode. Thus, the other two electrode formulations were preferred in this regard. On the other hand, the peel strength results with C2/D2/B2 were the lowest, which can make it difficult to manipulate the electrodes if they are upscaled to a semi-industrial scale. Furthermore, the higher content of CMC did not provide an advantage in any of the fields for the C2/D1/B3 formulation. In fact, the first cycle efficiency with 2% SBR was lower, which can be problematic for maintaining the mechanical stability of the electrodes after a significant number of cycles in full-cell format. Also, the coating with C2/D1/B3 provided a good or the best result for all the parameters studied. This was, therefore, the formulation selected for the next optimization stage. To improve the comprehension of these results, they have been summarized in a radar plot in Figure 2.
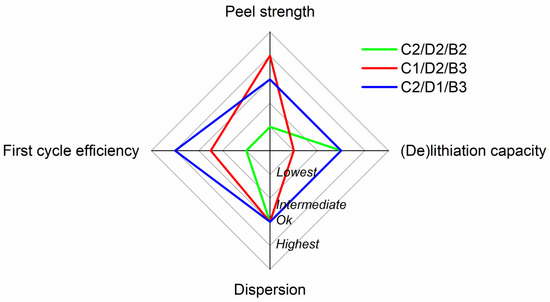
Figure 2.
Radar plot summarizing the results in the analysis of the balance of the different inactive components. 1, 2.5, 3, and 4 values are used to quantify “Lowest”, “Intermediate”, “Acceptable” and “Highest” from Table S2, respectively.
3.2. Addition of Nanotubes
The analysis conducted in the previous section revealed the importance of constructing an efficient electron-conducting network to obtain an optimum electrochemical performance. To improve this conducting network, C45 was partially substituted by single-wall carbon nanotubes (SWCNT). The material manufacturer recommended including it in 0.1% in weight in the anode formulation: fractions below that value would have a lower impact on the electrochemical performance, while above that value the agglomeration of these SWCNT could occur. Thus, a coating consisting of 72 wt.% of graphite, 22 wt.% of SiOx, 3 wt.% of SBR, 1.9 wt.% of C45, 1 wt.% of CMC and 0.1 wt.% of SWCNT was prepared. The first significant difference was observed in the rheological behavior of the slurry (Figure 3). Even if both the SWCNT-containing and the SWCNT-less samples showed a non-Newtonian behavior with shear thinning, the viscosity of the SWCNT-containing slurry was higher for all the shear rates analyzed. This is even more remarkable considering that the solid-to-liquid (S/L) ratio was higher for the SWCNT-free slurry (1/0.79) than for the SWCNT-containing one (1/1). The high surface area of the SWCNT makes it necessary for a higher amount of water to form the solvophobic sphere of the slurry, which increases its viscosity. The adhesion strength of the coating obtained was also impacted by the addition of SWCNT (Table S3): the peel tests reveal an increase of this parameter from 9.2 ± 2.7 to 17.3 ± 1.3 N·m−1. This indicates that an effective SWCNT network had been formed, enhancing the cohesion of the coating particles and the current collector, which should also have an impact on the electrochemical response.
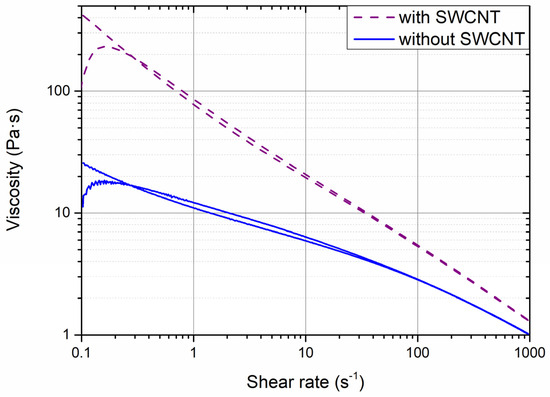
Figure 3.
Rheological analysis of the slurries with and without SWCNT.
The electrochemical performance of the HCC consisting of the anodes with and without SWCNT is shown in Figure 4. Both the delithiation capacity (Figure 4a) and the Coulombic efficiency (Figure 4b) were increased in the presence of SWCNT. Indeed, the impact on the Coulombic efficiency was not solely observed for the first cycle; it was higher for the five cycles analyzed. For a more detailed analysis of the influence of the SWCNT, the first 0.33C cycle is represented in Figure 4c.
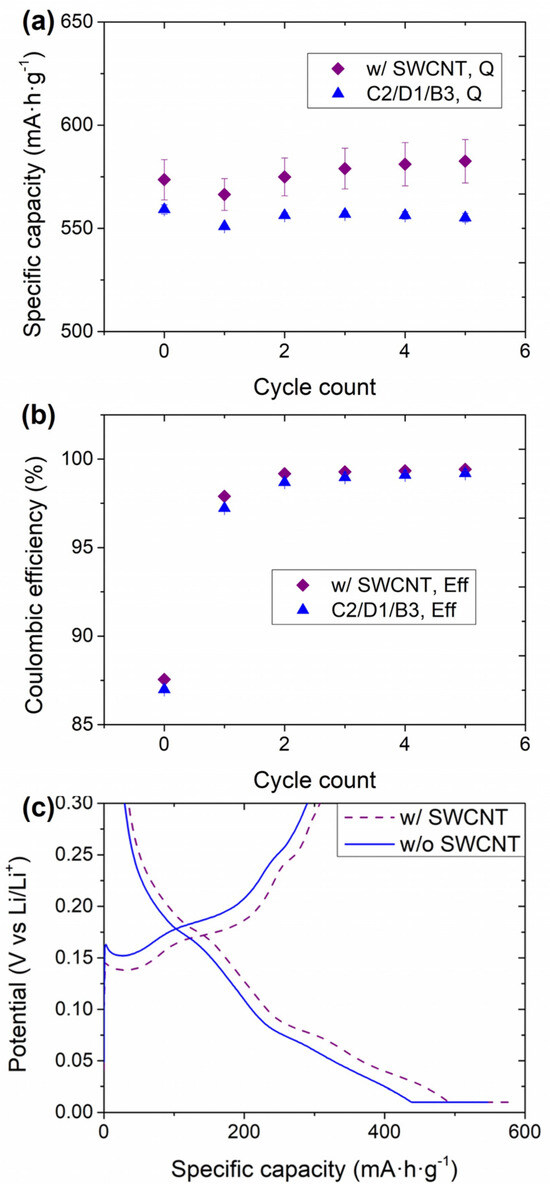
Figure 4.
Electrochemical performance of the anodes with and without SWCNT in HCC: (a) evolution of the delithiation capacity in the formation (0.05C) and the first five 0.33C cycles, and (b) Coulombic efficiency in these cycles, and (c) galvanostatic profile of the first 0.33C cycle between 0.01 V–0.3 V. The potential window (vs. Li/Li+) for these tests was 0.01 V–1 V.
It is worth mentioning that even though the galvanostatic cycling was performed between 0.01 V and 1 V, only the part between 0.01 V and 0.3 V is shown in Figure 4c to give more clear evidence of the difference in the polarization of the samples with and without SWCNT. At 0.33C, the plateaus were less defined than those at 0.05C in Figure 1a. Nevertheless, pseudo-plateaus at 0.18, 0.75, and 0.04 V could be observed for the sample without SWCNT. Finally, there was a significant part of the lithiation occurring in the constant voltage (CV) step of the lithiation due to the increased C-rate (see Figure 1a for comparison with the lithiation at 0.05C). The CV step is included to achieve a higher degree of lithiation of the active materials without reaching 0 V (which would cause Li plating), therefore minimizing the impact of the polarization on the lithiation capacity. The addition of SWCNT influenced both the flatness of the plateaus and the polarization of the electrochemical reactions associated with each of them, ultimately leading to higher capacity values. In addition, the CV fraction of the cells with SWCNT was lower (~15%) than for the cells without them (~23%). This is indicative of an adequate conductive network facilitated by the presence of the SWCNT. The impact of this network on capacity retention was studied in full coin cell (FCC) configuration using NMC811-based electrodes as cathodes, and the results are shown in Figure 5.
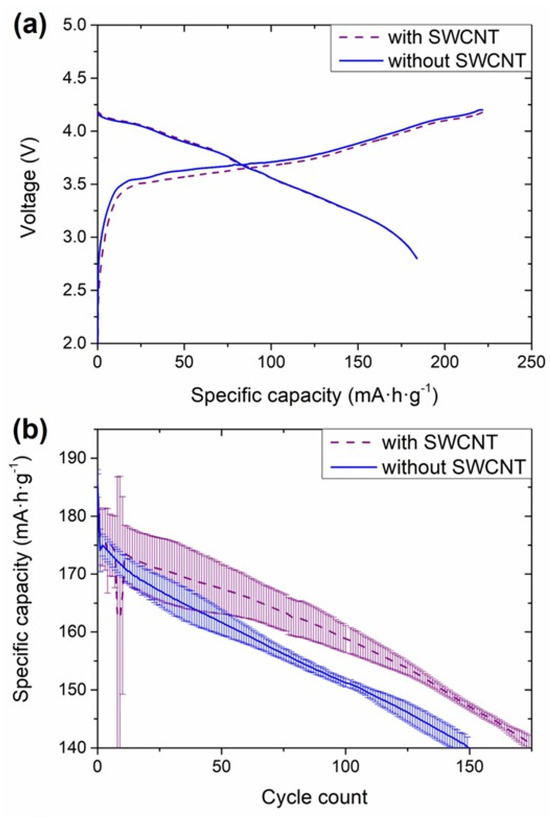
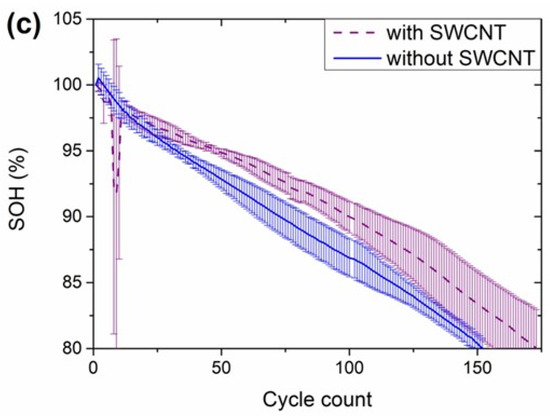
Figure 5.
Electrochemical performance of the full coin cells consisting of NMC811 cathodes and anodes with and without SWCNT. (a) Formation cycle at 0.05C, (b) discharge capacity in the subsequent cycling tests at 0.33C, and (c) state-of-health (SOH) of the cells upon these cycling tests. The voltage window for these cells was 2.8–4.2 V.
The polarization observed in HCC was evidenced in the first charge in FCC configuration, in which 226 ± 2 and 223 ± 2 mAh·g−1 were obtained with the cells consisting of anodes with and without SWCNT, respectively (Figure 5a). Even if there was no impact on the polarization of the discharge curve, the capacity decreased from 186 ± 2 to 185 ± 2 mAh·g−1 in the absence of SWCNT. These small differences, smaller than in HCC, might be associated with the lower utilization of the anode in FCC; in this configuration, the anode was in excess of 10% with respect to the cathode, while in HCC the anode is more severely pushed to its limits in terms of lithiation and delithiation capacity due to the quasi-infinite lithium inventory. Nevertheless, the main differences in the electrochemical performance were observed in the retention of the capacity upon cycling (Figure 4c and Figure 5b): until the 10th cycle, similar discharge capacities were obtained with both types of anodes. From that cycle, the capacity decay of the cells without SWCNT was steeper than for the cells with nanotubes. It is worth mentioning that the capacity fade for the cells with SWCNT in cycles 10–11 occurred because the potentiostat was stopped for the verification of the testing channels. The cells without SWCNT achieved 151 cycles before reaching 80% SOH, defined as the end of life (EOL), while 174 cycles were achieved with anodes consisting of SWCNT. As the low mechanical stability of the anodes, leading to the pulverization and loss of electrical contact of Si-based materials is one of the main degradation routes for Si-based anodes (together with the loss of cyclable lithium for the continuous build-up of the SEI layer), the results obtained in FCC are indicative of an improved mechanical stability of the electrodes due to the presence of a nanotube network. The anode recipe upscale, therefore, included SWCNT in the formulation.
3.3. Electrolyte Benchmarking
The upscaling of the anode developed at a laboratory scale to a semi-industrial scale was performed at the CIDETEC electrode manufacturing line. An anode coating consisting of 72 wt.% of graphite, 22 wt.% of SiOx, 3 wt.% of SBR, 1.9 wt.% of C45, 1 wt.% of CMC and 0.1 wt.% of SWCNT was elaborated and calendered at this line. Electrodes were cut for this coating and used to assemble multilayer pouch cells with NMC811-based cathodes. Each cell consisted of three cathodes and four anodes for an expected capacity of almost 1 Ah. These cells were used to face the next step of the optimization: the selection of an adequate electrolyte. Si-based electrodes are dependent on the type of electrolyte used and the additives included in the formulation of the latter. As an example, there is a wide number of works reporting the influence of fluoroethylene carbonate (FEC) as an additive on the electrochemical performance of the cells [43,46,52]. For the electrolyte benchmarking, E-Lyte Innovations was contacted to supply electrolytes with different formulations. E-Lyte does not disclose the exact formulation of the electrolytes supplied but provides some clues to facilitate the interpretation of the electrochemical results. The electrolytes tested have been included and described in Table 2 (Section 2.2). EL1 was provided as a similar product of the Baseline electrolyte and was mentioned that the formulation of these electrolytes differed “only a little”. For EL2, FEC content was increased to analyze the dependence of our Si-based electrode on the concentration of this additive. On the other hand, the FEC content was lower in EL3 and EL4 and was partially replaced by another (undisclosed) fluorinated additive. Furthermore, in the case of EL4, half of the LiPF6 was replaced by LiFSI, which should enhance the rate capability of the cells. Finally, EL5 was supplied as “a very good electrolyte for graphite electrodes and smaller silicon contents”, including both LiPF6 and LiFSI Li-salts and an anti-gassing additive, as well as an undisclosed SEI-forming additive. Two cells were filled with each of these electrolytes and subjected to rate-capability and capacity retention tests. The results are shown in Figure 6.
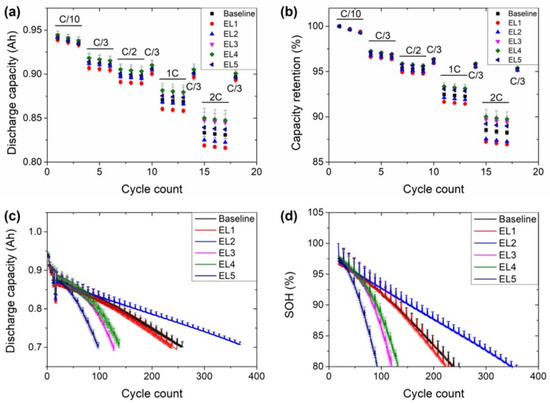
Figure 6.
Electrochemical experiments with the NMC811//Gr-SiOx cells filled with the different electrolytes: (a) rate-capability tests, (b) capacity retention in these tests, (c) 1C cycling tests (with capacity check-up cycles at 0.33C) and (d) evolution of the state-of-health (SOH) upon these cycling tests.
Firstly, it is worth mentioning that the formation cycle of the cells is not shown as no differences in the galvanostatic curves, the capacities observed, and the Coulombic efficiencies were observed for the cells with the different electrolytes. Due to the limited number of cells available, both the rate-capability and the capacity retention experiments were conducted on the same cells. Thus, the rate-capability tests were limited to 2C discharge current density, and no charge rate-capability tests were performed (charge C-rate was kept at 0.33C in all the experiment). This limitation aimed to avoid damaging the cells for the upcoming cycling tests. The full testing protocol is summarized in Table S1. Small differences with the different electrolytes started to be observed since the first cycles of the rate-capability test (Figure 6a). At 0.1C discharge C-rates the electrochemical response was slightly better with EL4, and slightly worse with EL1. This could be considered anecdotic if the rate-capability with EL4 and EL1 were not the best and the worst, respectively, for all the C-rates studied (Figure 6a,b). The differences were further enhanced when increasing from 0.1C to 0.33C, 0.5C, 1C, and 2C. Recovery 0.33C cycles were introduced between the cycles with the highest current densities studied to analyze the capacity decay of the cells. As expected based on the experiments in FCC (Figure 5), the capacity in these check-up cycles was lower with increasing the number of cycles, but the capacity decay compared with the three 0.33C cycles at the beginning of the rate-capability experiment was not significant, providing evidence that the cells were not damaged due to the current densities that they were subjected to. All the cells retained between 85% and 90% of the initial capacity at 2C (Figure 6b). A closer look at the results at this C-rate shows that the response to the rate-capability tests with decreasing performance was EL4 > EL3 > EL5 > Baseline > EL2 > EL1. Based on the information provided, EL3, EL4, and EL5 look the most promising for rate-capability purposes: they had the lowest additive concentration and, therefore, should have the lowest viscosity. EL4 provided better performance than EL3, which could be explained due to the replacement of LiPF6 with LiFSI, decreasing the viscosity of the electrolyte. On the other hand, it is difficult to ascribe the difference in the rate-capability experiments to the differences in the formulation between EL4 and EL5, but the presence of the anti-gassing and SEI-forming additives could impact the viscosity of the electrolyte. Furthermore, the chemical composition of the SEI with the latter additive could also be different, maybe more resistive, for EL5. In addition, the comment of E-Lyte Innovation considering the electrolyte adequate for graphite and lower-Si content electrodes (this was not commented for the rest of the electrolytes) could be indicative of the lower compatibility of this electrolyte with the anodes in these cells. On the other hand, the electrolytes with the highest FEC content provided the worst rate-capability results. The performance with EL1 was worse than with the Baseline electrolyte, likely due to the increase in the viscosity caused by the increase in the LiPF6 concentration and the substitution of 1% LiTFSI by VC in the electrolyte provided by E-Lyte Innovations. Surprisingly, the results were better with EL2 than with EL1 even if the FEC concentration was higher for the former. The suppression of VC as well as the selection of carbonates might be responsible for the improved response with EL2.
The performance in terms of capacity retention was not the same as observed in the rate capability tests. At the beginning of life, the capacity with all the electrolytes was very similar (Figure 6c); as expected, the capacity was higher in the cycles at 0.33C (one cycle at this current every 10 cycles) than in the cycles at 1C. The cycles at 0.33C were used to calculate the state of health (SOH) of the cells. There were two distinctive trends for the capacity retention curves (Figure 6d). On the one hand, the electrolytes providing the lowest capacity retention (EL3, EL4, and EL5) had initially a gradual capacity drop, but the capacity fade was stripped after a certain cycle. On the other hand, the cells with the electrolytes achieving the highest capacity retention (EL1, EL2, and Baseline) had a more linear drop of capacity with the number of cycles. A closer look at the evolution of the SOH with electrolytes EL1 and Baseline, however, shows that the capacity fade was slightly accelerated after ~125 cycles. The capacity retention of the cells with the different electrolytes is well aligned with the FEC content of the electrolytes (Table 2). The cells with the lowest capacity retention were those with less than 5% FEC. A direct comparison between EL3 (128 cycles above 80% SOH) and EL4 (138 cycles) shows that the replacement of 50% LiPF6 by LiFSI did not significantly impact the cycle life of the cells. On the other hand, the cells with 10% FEC (EL1 and Baseline) provided almost the same number of cycles (258 and 248 cycles, respectively) before dropping below 80% SOH. As EL1 was a reproduction of the Baseline electrolyte, the results are coherent. Finally, the cells with EL2 achieved 368 cycles. In this electrolyte, FEC was not considered a simple additive by E-Lyte Innovation due to its high concentration. The cycling performance of these cells can compete with that reported by Wand et al. using a similar anode formulation [53]. In a later work, they obtained a higher capacity retention using less SiOx [36] but these cells consisted of anodes with lower specific capacity (450 mA·h·g−1, while it was 500 mA·h·g−1 in the anodes developed in this work).
The inflection point in the capacity retention curves could be associated with the consumption of FEC below a certain critical concentration [46,53]. FEC is known for being a recommended additive for the building of a stable SEI in silicon-based anodes [52]. The composition (and, consequently, the resistance) of the SEI is affected by the composition of the electrolyte. Thus, electrochemical impedance spectroscopy (EIS) analysis was performed on the cells at their EOL (all of them at 0% of the state of charge) to try to obtain further information on the SEI with the different electrolytes (Figure 7). Nevertheless, these experiments were less clarifying than expected. Two types of impedance spectra were obtained depending on the electrolyte used: the Nyquist diagram of the cells with the Baseline and EL1 electrolytes (Figure 7a) had two partially overlapped semicircles with an increase of the absolute value of the imaginary impedance (Z″) by the end of the spectra, at the lowest frequencies, similar to those in literature [46,53]. On the other hand, a single semicircle was observed for the cells with the rest of the electrolytes (EL2-EL5). The Nyquist diagrams of all the cells are displayed in Figure S2. In some cases, it is possible to confirm the presence of two overlapped semicircles by analyzing the Bode diagram, but this was not the case for the cells with these electrolytes (Figure S3).
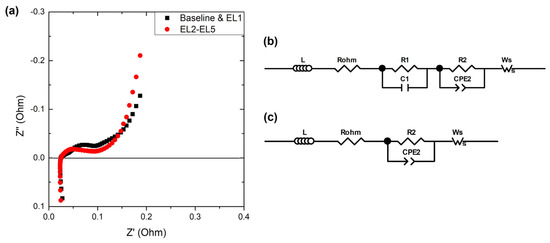
Figure 7.
(a) Examples of Nyquist diagrams obtained by the end of life of the cells with Baseline and EL1 electrolytes (black squares) and EL2-EL5 electrolytes (red dots). Equivalent circuits used to fit the spectra with (b) Baseline and EL1 electrolytes, and (c) EL2-EL5 electrolytes.
The highest frequency of both types of spectra appears in the positive quadrant of Z″ and is ascribed to the inductive effect of the wires and contact of the measurement system. It was fitted using an inductor (L) in the equivalent circuits (Figure 7b,c) to fit both types of impedance spectra [54]. In addition, as already mentioned, both types of spectra showed an increase in the absolute value of Z″ at the lowest frequencies scanned. This is related to the diffusion of lithium in the electrolytes and was fitted using a short Warburg component (Ws) [55,56]. The intersection of the real impedance (R’) with the spectra is referred to as the ohmic resistance (Rohm) of the cell, and it is used to track the stability of the cell, with the electrolyte as its most significant contributor [57,58,59]. Regarding the intermediate frequencies, at least two semicircles are usually differentiated, as observed in the spectra with Baseline and EL1 electrolytes [60]. The semicircle at higher frequencies is usually ascribed to interfacial resistances, with the SEI and the cathode–electrolyte interphase (CEI) as its most significant contributors. They were fitted with a resistance (R1) in parallel with a capacitor (C1) (Figure 7b). It is followed (and partially overlapped) by a depressed semicircle, which is related to the charge transfer resistance. This was fitted with a resistance (R2) in parallel with a constant phase element (CPE2). The latter is an “imperfect” capacitor, visible as a depressed semicircle in the Nyquist diagram. The porosity of the electrodes is one of the most significant parameters causing this “imperfection” [54,61]. The spectra with electrolytes EL2-EL5 could not be fitted with the equivalent circuit in Figure 7b with error values below 10% and the equivalent circuit had to be adapted. For these electrolytes, a single resistance (R1 + 2) in parallel with a constant phase element (CPE1 + 2) was used. The cause for this difference remains unclear but might be due to the electrolyte used. It is likely that R1-C1 and R2-CPE2 were present in the semicircle of the electrolytes EL2-EL5 but could not be deconvoluted. Based on the information provided by the electrolyte manufacturer (Table 2), it could be expected that the linear carbonates and their concentrations were different for the electrolytes EL2-EL5. This could lead to a different SEI composition [62], which would affect the response to the impedance spectroscopy analysis. In addition, as the electrolyte EL1 was a reproduction of the Baseline electrolyte, it could be assumed that the carbonate selection and their fraction would be similar. Nevertheless, it would be necessary to know the exact formulation of the electrolyte to validate this hypothesis. In any case, as already mentioned, the experiment was less clarifying than expected, but we believed that could be positive to include it as in most cases, the electrolyte formulation is not disclosed in commercial LIB. To compare the results with the different electrolytes, the sum of R1 and R2 was used for Baseline and EL1 electrolytes. The resistance values obtained for the cells with each electrolyte are compared in Figure 8.
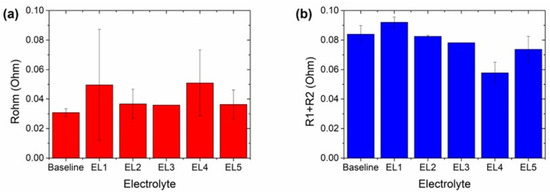
Figure 8.
Comparison of the (a) ohmic and (b) R1 + R2 obtained from the fitting of the impedance spectra with the different electrolytes using the equivalent.
It is worth mentioning that there was an incident with one cell with EL3 during its disconnection from the potentiostat and only one cell was subjected to impedance analysis. Thus, no error bars are observed in Figure 8 the resistance values obtained for electrolyte. The ohmic resistances (Figure 8a) were similar for most of the cells and higher for the cells with EL1 and EL4. Nevertheless, the error bars were also larger for these electrolytes. In fact, one cell with each of these electrolytes had higher ohmic resistance. Excluding these two cells, all the cells showed similar Rohm values regardless of the number of cycles achieved. Thus, it can be concluded that all the electrolytes were stable and compatible with the cell configuration and electrode chemistries selected, and none of the cells reached 80% SOH due to a degradation of the electrolyte. On the other hand, both double-layer and charge transfer resistances (R1 + R2) should increase with the number of cycles (Figure 8b). This is well aligned with the lower values obtained for EL3, EL4, and EL5. The resistance for EL5 was higher than for EL3 and EL4 despite the cells with EL5 being those that achieved the lowest number of cycles. This could be attributed to the SEI-building additive in this electrolyte. Regarding Baseline, EL1, and EL2 electrolytes, it is remarkable that R1 + R2 for the latter was lower than for the other two electrolytes even if its cycle life was ~45% higher. In addition, the cells with EL2 were the sole ones not undergoing an inflection in the capacity retention curve, likely indicating a different degradation mechanism.
As already stated, the impedance measurements were less clarifying than expected but were useful in confirming the stability of the electrolytes in the cell environment. Furthermore, in most of the cases, the R1 + R2 resistance was increased with the number of cycles excluding two cases: (i) the resistance increased significantly due to the SEI-formation additive in EL5, and (ii) the resistance was lower for the cells not undergoing an inflection point in the capacity retention curve. Thus, the abrupter capacity fades after this could be ascribed to the formation of a more restrictive SEI after that point due to the consumption of FEC.
4. Conclusions
In this work, a standard anode recipe for graphite electrode manufacturing has been adapted and optimized to partially substitute graphite with SiOx and enhance the energy density. The conductive carbon, dispersant, and binder contents were modified as it was evidenced that an increase in the binder content was necessary to provide sufficient adhesion strength. Furthermore, a decrease in the dispersant content did not affect the quality of the electrodes. The best CB/CMC/SBR ratio to obtain a good balance between the coating feasibility and the electrochemical performance was 2/1/3. In addition, the partial substitution of conductive carbon by SWCNT (0.1%) decreased the polarization and enhanced the capacity retention of the cells due to the formation of a conductive matrix. The anode recipe, from which >550 mA·h·g−1 were obtained at the laboratory-development phase, was upscaled to a semi-industrial electrode manufacturing line and Li-ion cells of 1 Ah were assembled with these anodes and an NMC811 cathode. The optimization process continued with the benchmarking of electrolytes. It was evidenced that the lower the additive concentration in the electrolyte, the higher the rate capability of the cells. Nevertheless, it was also observed that the higher the FEC content, the higher the cycle life of the cells. In particular, the cycle-life of the cells was increased from 248 cycles (with the Baseline electrolyte) to 368 cycles (with EL2) above 80% SOH just by switching the electrolyte used. The use of one or another electrolyte should be decided based on the final application of the cells. In any case, the optimization process of an anode recipe, its successful upscaling to pilot scale, and its harmonization in a full cell of 1 Ah cells are shown. This work aims to be useful for research groups working on the optimization of anode recipes for high-energy-density Li-ion cells.
Supplementary Materials
The following supporting information can be downloaded at: https://www.mdpi.com/article/10.3390/en17071616/s1, Figure S1: FE-SEM images of the (a–c) C2/D2/B2, (d–f) C2/D1/B3, and (g–i) C2/D1/B3 electrodes under different magnifications; Figure S2. Nyquist diagrams obtained by the end of life of the cells. (a) All the cells, (b) only the cells with EL1 and the Baseline electrolyte, and (c) only the cells with the electrolytes EL2, EL3, EL4, and EL5; Figure S3: Examples of Bode diagrams obtained by the end of life of the cells with Baseline and EL1 electrolytes (black dots) and EL2-EL5 electrolytes (red dots); Table S1: Summary of the testing protocol used to cycle the pouch cells. Constant current (CC) and constant voltage (CV) phases are specified in the description of the charge conditions and finalization criteria; Table S2: Summary of the results of the different experiments to evaluate the performance of the anodes with different electrochemically inactive component fractions; Table S3: Peel test results for the coatings with and without SWCNT.
Author Contributions
Conceptualization, I.L.-M. and I.U.; methodology, I.L.-M. and I.U.; formal analysis, I.C.; investigation, I.U.; resources, A.E.-B.; data curation, I.C.; writing—original draft preparation, I.U., I.L.-M. and I.C.; writing—review and editing, I.d.M. and A.E.-B.; supervision, H.-J.G. and A.E.-B.; project administration, I.L.-M.; funding acquisition, I.U. and A.E.-B. All authors have read and agreed to the published version of the manuscript.
Funding
This research received no external funding.
Data Availability Statement
The original contributions presented in the study are included in the article/Supplementary Material, further inquiries can be directed to the corresponding author.
Acknowledgments
The authors gratefully acknowledge Jasmina Agote, Judith Pérez, and Carmen Palacios from CIDETEC for the laboratory-scale electrode preparation, coin cell assembly, and SEM measurements. In addition, the authors thank the Electrode Manufacturing and Cell Assembly groups at CIDETEC for the pouch cell electrode manufacturing and the pouch cell assembly. Furthermore, the authors want to acknowledge the support of E-Lyte Innovations and OCSiAl at different stages of the optimization process.
Conflicts of Interest
The authors declare no conflicts of interest.
References
- Fong, R.; von Sacken, U.; Dahn, J.R. Studies of Lithium Intercalation into Carbons Using Nonaqueous Electrochemical Cells. J. Electrochem. Soc. 1990, 137, 2009–2013. [Google Scholar] [CrossRef]
- Masahisa Fujimoto, A.; Noriyuki Yoshinaga, S.; Koji Ueno, H.; Nobuhiro Furukawa, I.; Toshiyuki Nohma, K.; Masatoshi Takahashi, S. Lithium Secondary Battery. Patent Number 5686138, 11 November 1997. pp. 1–55. [Google Scholar]
- Li, M.; Lu, J.; Chen, Z.; Amine, K. 30 Years of Lithium-Ion Batteries. Adv. Mater. 2018, 30, 1800561. [Google Scholar] [CrossRef] [PubMed]
- Günter, F.J.; Wassiliadis, N. State of the Art of Lithium-Ion Pouch Cells in Automotive Applications: Cell Teardown and Characterization. J. Electrochem. Soc. 2022, 169, 030515. [Google Scholar] [CrossRef]
- Ding, Y.; Cano, Z.P.; Yu, A.; Lu, J.; Chen, Z. Automotive Li-Ion Batteries: Current Status and Future Perspectives. Electrochem. Energy Rev. 2019, 2, 1–28. [Google Scholar] [CrossRef]
- Houache, M.S.E.; Yim, C.H.; Karkar, Z.; Abu-Lebdeh, Y. On the Current and Future Outlook of Battery Chemistries for Electric Vehicles—Mini Review. Batteries 2022, 8, 70. [Google Scholar] [CrossRef]
- Jetybayeva, A.; Aaron, D.S.; Belharouak, I.; Mench, M.M. Critical Review on Recently Developed Lithium and Non-Lithium Anode-Based Solid-State Lithium-Ion Batteries. J. Power Sources 2023, 566, 232914. [Google Scholar] [CrossRef]
- Besenhard, J.O. The Electrochemical Preparation and Properties of Ionic Alkali Metal-and NR4-Graphite Intercalation Compounds in Organic Electrolytes. Carbon. N. Y. 1976, 14, 111–115. [Google Scholar] [CrossRef]
- Li, J.; Fleetwood, J.; Hawley, W.B.; Kays, W. From Materials to Cell: State-of-the-Art and Prospective Technologies for Lithium-Ion Battery Electrode Processing. Chem. Rev. 2022, 122, 903–956. [Google Scholar] [CrossRef]
- Rohan, R.; Kuo, T.-C.; Chiou, C.-Y.; Chang, Y.-L.; Li, C.-C.; Lee, J.-T. Low-Cost and Sustainable Corn Starch as a High-Performance Aqueous Binder in Silicon Anodes via in Situ Cross-Linking. J. Power Sources 2018, 396, 459–466. [Google Scholar] [CrossRef]
- Feng, Z.Y.; Peng, W.J.; Wang, Z.X.; Guo, H.J.; Li, X.H.; Yan, G.C.; Wang, J.X. Review of Silicon-Based Alloys for Lithium-Ion Battery Anodes. Int. J. Miner. Metall. Mater. 2021, 28, 1549–1564. [Google Scholar] [CrossRef]
- Liu, Q.; Hu, Y.; Yu, X.; Qin, Y.; Meng, T.; Hu, X. The Pursuit of Commercial Silicon-Based Microparticle Anodes for Advanced Lithium-Ion Batteries: A Review. Nano Res. Energy 2022, 1, e9120037. [Google Scholar] [CrossRef]
- Feng, K.; Li, M.; Liu, W.; Kashkooli, A.G.; Xiao, X.; Cai, M.; Chen, Z. Silicon-Based Anodes for Lithium-Ion Batteries: From Fundamentals to Practical Applications. Small 2018, 14, 1702737. [Google Scholar] [CrossRef] [PubMed]
- Graae, K.V.; Li, X.; Sørensen, D.R.; Ayerbe, E.; Boyano, I.; Sheptyakov, D.; Jørgensen, M.R.V.; Norby, P. Time and Space Resolved Operando Synchrotron X-Ray and Neutron Diffraction Study of NMC811/Si–Gr 5 Ah Pouch Cells. J. Power Sources 2023, 570, 232993. [Google Scholar] [CrossRef]
- Kumar, R.; Tokranov, A.; Sheldon, B.W.; Xiao, X.; Huang, Z.; Li, C.; Mueller, T. In Situ and Operando Investigations of Failure Mechanisms of the Solid Electrolyte Interphase on Silicon Electrodes. ACS Energy Lett. 2016, 1, 689–697. [Google Scholar] [CrossRef]
- Beaulieu, L.Y.; Hatchard, T.D.; Bonakdarpour, A.; Fleischauer, M.D.; Dahn, J.R. Reaction of Li with Alloy Thin Films Studied by In Situ AFM. J. Electrochem. Soc. 2003, 150, A1457. [Google Scholar] [CrossRef]
- Petibon, R.; Chevrier, V.L.; Aiken, C.P.; Hall, D.S.; Hyatt, S.R.; Shunmugasundaram, R.; Dahn, J.R. Studies of the Capacity Fade Mechanisms of LiCoO2/Si-Alloy: Graphite Cells. J. Electrochem. Soc. 2016, 163, A1146–A1156. [Google Scholar] [CrossRef]
- Chae, S.; Choi, S.-H.; Namhyung, K.; Sung, J.; Cho, J. Integration of Graphite and Silicon Anodes for the Commercialization of High-Energy Lithium-Ion Batteries. Angew. Chem. 2019, 59, 110–135. [Google Scholar] [CrossRef] [PubMed]
- Zhang, M.; Zhang, T.; Ma, Y.; Chen, Y. Latest Development of Nanostructured Si/C Materials for Lithium Anode Studies and Applications. Energy Storage Mater. 2016, 4, 1–14. [Google Scholar] [CrossRef]
- Ma, Z.; Li, T.; Huang, Y.L.; Liu, J.; Zhou, Y.; Xue, D. Critical Silicon-Anode Size for Averting Lithiation-Induced Mechanical Failure of Lithium-Ion Batteries. RSC Adv. 2013, 3, 7398. [Google Scholar] [CrossRef]
- Song, T.; Xia, J.; Lee, J.H.; Lee, D.H.; Kwon, M.S.; Choi, J.M.; Wu, J.; Doo, S.K.; Chang, H.; Park, W.I.; et al. Arrays of Sealed Silicon Nanotubes as Anodes for Lithium Ion Batteries. Nano Lett. 2010, 10, 1710–1716. [Google Scholar] [CrossRef]
- Wu, H.; Zheng, G.; Liu, N.; Carney, T.J.; Yang, Y.; Cui, Y. Engineering Empty Space between Si Nanoparticles for Lithium-Ion Battery Anodes. Nano Lett. 2012, 12, 904–909. [Google Scholar] [CrossRef]
- Chan, C.K.; Peng, H.; Liu, G.; McIlwrath, K.; Zhang, X.F.; Huggins, R.A.; Cui, Y. High-Performance Lithium Battery Anodes Using Silicon Nanowires. Nat. Nanotechnol. 2008, 3, 31–35. [Google Scholar] [CrossRef]
- Lin, Q.; Harb, J.N. Implementation of a Thick-Film Composite Li-Ion Microcathode Using Carbon Nanotubes as the Conductive Filler. J. Electrochem. Soc. 2004, 151, A1115. [Google Scholar] [CrossRef]
- De Volder, M.F.L.; Tawfick, S.H.; Baughman, R.H.; Hart, A.J. Carbon Nanotubes: Present and Future Commercial Applications. Science (1979) 2013, 339, 535–539. [Google Scholar] [CrossRef] [PubMed]
- Landi, B.J.; Ganter, M.J.; Cress, C.D.; DiLeo, R.A.; Raffaelle, R.P. Carbon Nanotubes for Lithium Ion Batteries. Energy Environ. Sci. 2009, 2, 638. [Google Scholar] [CrossRef]
- Ikonen, T.; Kalidas, N.; Lahtinen, K.; Isoniemi, T.; Toppari, J.J.; Vázquez, E.; Herrero-Chamorro, M.A.; Fierro, J.L.G.; Kallio, T.; Lehto, V.P. Conjugation with Carbon Nanotubes Improves the Performance of Mesoporous Silicon as Li-Ion Battery Anode. Sci. Rep. 2020, 10, 5589. [Google Scholar] [CrossRef] [PubMed]
- Alcaide, F.; Álvarez, G.; Bekaert, E.; Bonilla, F.; Gucciardi, E.; Urdampilleta, I.; Vicedo, R.; Ayerbe, E. Exploring the Influence of Temperature on Anode Degradation in Cycling-Aged Commercial Cylindrical Graphite-Si|NCA Cells. J. Electrochem. Soc. 2023, 170, 080523. [Google Scholar] [CrossRef]
- Qiao, Y.; Yang, S.; Ma, Z.; Yang, Y.; Hong, X.; Fu, Z. Solid-State Corrosion of Lithium for Prelithiation of SiOx-C Composite Anode with Carbon-Incorporated Lithium Phosphorus Oxynitride. Nano Res. 2022, 16, 8394–8404. [Google Scholar] [CrossRef]
- Pegel, H.; von Kessel, O.; Heugel, P.; Deich, T.; Tübke, J.; Birke, K.P.; Sauer, D.U. Volume and Thickness Change of NMC811|SiOx-Graphite Large-Format Lithium-Ion Cells: From Pouch Cell to Active Material Level. J. Power Sources 2022, 537, 231443. [Google Scholar] [CrossRef]
- Suh, S.S.; Yoon, W.Y.; Kim, D.H.; Kwon, S.U.; Kim, J.H.; Kim, Y.U.; Jeong, C.U.; Chan, Y.Y.; Kang, S.H.; Lee, J.K. Electrochemical Behavior of SiOx Anodes with Variation of Oxygen Ratio for Li-Ion Batteries. Electrochim. Acta 2014, 148, 111–117. [Google Scholar] [CrossRef]
- Liu, Z.; Yu, Q.; Zhao, Y.; He, R.; Xu, M.; Feng, S.; Li, S.; Zhou, L.; Mai, L. Silicon Oxides: A Promising Family of Anode Materials for Lithium-Ion Batteries. Chem. Soc. Rev. 2019, 48, 285–309. [Google Scholar] [CrossRef] [PubMed]
- Jiao, M.; Wang, Y.; Ye, C.; Wang, C.; Zhang, W.; Liang, C. High-Capacity SiOx (0 ≤ x ≤ 2) as Promising Anode Materials for next-Generation Lithium-Ion Batteries. J. Alloys Compd. 2020, 842, 155774. [Google Scholar] [CrossRef]
- Frith, J.T.; Lacey, M.J.; Ulissi, U. A Non-Academic Perspective on the Future of Lithium-Based Batteries. Nat. Commun. 2023, 14, 420. [Google Scholar] [CrossRef] [PubMed]
- Kim, N.; Kim, Y.; Sung, J.; Cho, J. Issues Impeding the Commercialization of Laboratory Innovations for Energy-Dense Si-Containing Lithium-Ion Batteries. Nat. Energy 2023, 8, 921–933. [Google Scholar] [CrossRef]
- Wang, L.; Zhang, B.; Hu, Y.; Su, Z.; Zhao, T.; Li, A. Effect of Lower Cut-off Voltage on LiNi0.8Co0.1Mn0.1O2/Graphite-SiOx Pouch Battery. J. Solid. State Electrochem. 2021, 25, 1743–1751. [Google Scholar] [CrossRef]
- De Sutter, L.; Berckmans, G.; Marinaro, M.; Smekens, J.; Firouz, Y.; Wohlfahrt-Mehrens, M.; van Mierlo, J.; Omar, N. Comprehensive Aging Analysis of Volumetric Constrained Lithium-Ion Pouch Cells with High Concentration Silicon-Alloy Anodes. Energy 2018, 11, 2948. [Google Scholar] [CrossRef]
- De Sutter, L.; Berckmans, G.; Marinaro, M.; Wohlfahrt-Mehrens, M.; Berecibar, M.; Van Mierlo, J. Mechanical Behavior of Silicon-Graphite Pouch Cells under External Compressive Load: Implications and Opportunities for Battery Pack Design. J. Power Sources 2020, 451, 227774. [Google Scholar] [CrossRef]
- Louli, A.J.; Li, J.; Trussler, S.; Fell, C.R.; Dahn, J.R. Volume, Pressure and Thickness Evolution of Li-Ion Pouch Cells with Silicon-Composite Negative Electrodes. J. Electrochem. Soc. 2017, 164, A2689–A2696. [Google Scholar] [CrossRef]
- Choi, N.-S.; Yew, K.H.; Kim, H.; Kim, S.-S.; Choi, W.-U. Surface Layer Formed on Silicon Thin-Film Electrode in Lithium Bis(Oxalato) Borate-Based Electrolyte. J. Power Sources 2007, 172, 404–409. [Google Scholar] [CrossRef]
- Chevrier, V.L.; Krause, L.J.; Jensen, L.D.; Huynh, C.; Triemert, M.; Bowen, E.L.; Thorson, J. Design of Positive Electrodes for Li-Ion Full Cells with Silicon. J. Electrochem. Soc. 2018, 165, A2968–A2977. [Google Scholar] [CrossRef]
- Horowitz, Y.; Han, H.L.; Somorjai, G.A. Identifying the Decomposition of Diethyl Carbonate in Binary Electrolyte Solutions in Contact with Silicon Anodes—A Sum Frequency Generation Vibrational Spectroscopy Study. Ind. Eng. Chem. Res. 2018, 57, 1480–1486. [Google Scholar] [CrossRef]
- Jaumann, T.; Balach, J.; Langklotz, U.; Sauchuk, V.; Fritsch, M.; Michaelis, A.; Teltevskij, V.; Mikhailova, D.; Oswald, S.; Klose, M.; et al. Lifetime vs. Rate Capability: Understanding the Role of FEC and VC in High-Energy Li-Ion Batteries with Nano-Silicon Anodes. Energy Storage Mater. 2017, 6, 26–35. [Google Scholar] [CrossRef]
- Qian, Y.; Hu, S.; Zou, X.; Deng, Z.; Xu, Y.; Cao, Z.; Kang, Y.; Deng, Y.; Shi, Q.; Xu, K.; et al. How Electrolyte Additives Work in Li-Ion Batteries. Energy Storage Mater. 2019, 20, 208–215. [Google Scholar] [CrossRef]
- Schwenke, K.U.; Solchenbach, S.; Demeaux, J.; Lucht, B.L.; Gasteiger, H.A. The Impact of CO2 Evolved from VC and FEC during Formation of Graphite Anodes in Lithium-Ion Batteries. J. Electrochem. Soc. 2019, 166, A2035–A2047. [Google Scholar] [CrossRef]
- Jung, R.; Metzger, M.; Haering, D.; Solchenbach, S.; Marino, C.; Tsiouvaras, N.; Stinner, C.; Gasteiger, H.A. Consumption of Fluoroethylene Carbonate (FEC) on Si-C Composite Electrodes for Li-Ion Batteries. J. Electrochem. Soc. 2016, 163, A1705–A1716. [Google Scholar] [CrossRef]
- Lizaso, L.; Urdampilleta, I.; Bengoechea, M.; Boyano, I.; Grande, H.-J.; Landa-Medrano, I.; Eguia-Barrio, A.; De Meatza, I. Waterborne LiNi0.5Mn1.5O4 Cathode Formulation Optimization through Design of Experiments and Upscaling to 1 Ah Li-Ion Pouch Cells. Energy 2023, 16, 7327. [Google Scholar] [CrossRef]
- Karkar, Z.; Guyomard, D.; Roué, L.; Lestriez, B. A Comparative Study of Polyacrylic Acid (PAA) and Carboxymethyl Cellulose (CMC) Binders for Si-Based Electrodes. Electrochim. Acta 2017, 258, 453–466. [Google Scholar] [CrossRef]
- Bresser, D.; Buchholz, D.; Moretti, A.; Varzi, A.; Passerini, S. Alternative Binders for Sustainable Electrochemical Energy Storage-the Transition to Aqueous Electrode Processing and Bio-Derived Polymers. Energy Environ. Sci. 2018, 11, 3096–3127. [Google Scholar] [CrossRef]
- Levi, M.D.; Aurbach, D. The Mechanism of Lithium Intercalation in Graphite Film Electrodes in Aprotic Media. Part 1. High Resolution Slow Scan Rate Cyclic Voltammetric Studies and Modeling. J. Electroanal. Chem. 1997, 421, 79–88. [Google Scholar] [CrossRef]
- Ashuri, M.; He, Q.; Shaw, L.L. Silicon Oxides for Li-Ion Battery Anode Applications: Toward Long-Term Cycling Stability. J. Power Sources 2023, 559, 232660. [Google Scholar] [CrossRef]
- Andersen, H.F.; Foss, C.E.L.; Voje, J.; Tronstad, R.; Mokkelbost, T.; Vullum, P.E.; Ulvestad, A.; Kirkengen, M.; Mæhlen, J.P. Silicon-Carbon Composite Anodes from Industrial Battery Grade Silicon. Sci. Rep. 2019, 9, 14814. [Google Scholar] [CrossRef]
- Wang, L.; Zhang, B.; Pang, J.; Liu, Y.; Wang, X.; Chang, Z.; Lu, S. Aging Process Analysis of LiNi0.88Co0.09Al0.03O2/Graphite–SiOx Pouch Cell. Electrochim. Acta 2018, 286, 219–230. [Google Scholar] [CrossRef]
- Ovejas, V.; Cuadras, A. Impedance Characterization of an LCO-NMC/Graphite Cell: Ohmic Conduction, SEI Transport and Charge-Transfer Phenomenon. Batteries 2018, 4, 43. [Google Scholar] [CrossRef]
- Nguyen, T.Q.; Breitkopf, C. Determination of Diffusion Coefficients Using Impedance Spectroscopy Data. J. Electrochem. Soc. 2018, 165, E826–E831. [Google Scholar] [CrossRef]
- Zhang, M.; Liu, Y.; Li, D.; Cui, X.; Wang, L.; Li, L.; Wang, K. Electrochemical Impedance Spectroscopy: A New Chapter in the Fast and Accurate Estimation of the State of Health for Lithium-Ion Batteries. Energy 2023, 16, 1599. [Google Scholar] [CrossRef]
- Dai, H.; Jiang, B.; Wei, X. Impedance Characterization and Modeling of Lithium-Ion Batteries Considering the Internal Temperature Gradient. Energy 2018, 11, 220. [Google Scholar] [CrossRef]
- Tokur, M.; Aydin, A.; Cetinkaya, T.; Akbulut, H. Shoring Up the Lithium Ion Batteries with Multi-Component Silicon Yolk-Shell Anodes for Grid-Scale Storage Systems: Experimental and Computational Mechanical Studies. J. Electrochem. Soc. 2017, 164, A2238–A2250. [Google Scholar] [CrossRef]
- Son, S.; Cao, L.; Yoon, T.; Cresce, A.; Hafner, S.E.; Liu, J.; Groner, M.; Xu, K.; Ban, C. Interfacially Induced Cascading Failure in Graphite-Silicon Composite Anodes. Adv. Sci. 2018, 6, 1801007. [Google Scholar] [CrossRef] [PubMed]
- Raccichini, R.; Amores, M.; Hinds, G. Critical Review of the Use of Reference Electrodes in Li-Ion Batteries: A Diagnostic Perspective. Batteries 2019, 5, 12. [Google Scholar] [CrossRef]
- Ross Macdonald, J. Note on the Parameterization of the Constant-Phase Admittance Element. Solid. State Ion. 1984, 13, 147–149. [Google Scholar] [CrossRef]
- Wu, Z.Y.; Lu, Y.Q.; Li, J.T.; Zanna, S.; Seyeux, A.; Huang, L.; Sun, S.G.; Marcus, P.; Światowska, J. Influence of Carbonate Solvents on Solid Electrolyte Interphase Composition over Si Electrodes Monitored by in Situ and Ex Situ Spectroscopies. ACS Omega 2021, 6, 27335–27350. [Google Scholar] [CrossRef] [PubMed]
Disclaimer/Publisher’s Note: The statements, opinions and data contained in all publications are solely those of the individual author(s) and contributor(s) and not of MDPI and/or the editor(s). MDPI and/or the editor(s) disclaim responsibility for any injury to people or property resulting from any ideas, methods, instructions or products referred to in the content. |
© 2024 by the authors. Licensee MDPI, Basel, Switzerland. This article is an open access article distributed under the terms and conditions of the Creative Commons Attribution (CC BY) license (https://creativecommons.org/licenses/by/4.0/).