Abstract
Hydro-pneumatic energy storage is a form of compressed-air energy storage that can provide the long-duration storage required for integrating intermittent renewable energies into electrical power grids. This paper presents results based on numerical modelling and laboratory tests for a kilowatt-scale HPES system tested at the University of Malta. This paper presents measurements of the discharge cycle, in which energy stored in compressed air within a pressure vessel is hydro-pneumatically converted back into electricity via a Pelton turbine and fed into the national electricity grid. The tests were conducted using a hydraulic turbine operated under different fixed-turbine rotational speed settings, with the pressure being allowed to decrease gradually during the HPES system’s discharge cycle. The system’s overall efficiency accounted for flow losses, turbine inefficiencies, and electrical losses. The tests showed that this efficiency was practically independent of the compressed-air pressure of specific water turbine runner speeds, despite the water turbine operating at fixed speeds. A numerical model developed in MATLAB Simulink (R2022a) was also presented for use simulating the hydraulic performance of the system during the discharge cycle. The model used secondary loss coefficients for the hydraulic circuit and derived velocity coefficients from computational fluid dynamics (CFD) for the Pelton turbine nozzle. We achieved very good agreement between the predictions based on numerical modelling and the measurements taken during laboratory testing.
1. Introduction
Today, there is a significant drive to accelerate the integration of renewable energy resources (RESs) into national power grids in order to curb carbon dioxide (CO2) emissions and mitigate climate change [1,2,3]. During the year 2023, Europe saw a record increase in the installed solar photovoltaic capacity, which rose from 204.09 GW to 259.99 GW [4,5], whereas the installed wind capacity increased from 204 GW to 221 GW [6,7]. However, the high penetration rate of intermittent RESs, such as wind and solar power, into electricity networks is creating grid management problems. These are primarily being caused by the mismatch between the RES supply and the electricity demand from consumers [8,9,10].
Energy storage systems (ESSs) are now becoming essential to efforts to address RES intermittency and enable the decarbonisation of the global economy [11,12]. ESSs help to reduce power fluctuations on short-term timescales, whilst also storing excess energy during periods of high wind and solar power production for use during periods of high energy demand.
Many different forms of storage exist. For recent overviews of different ESS technologies, the reader is referred to studies by Ibrahim et al. and Olabi et al. [13,14]. Hydro-pneumatic energy storage (HPES) is a form of mechanical ESS where energy is stored as compressed air. The stored air is compressed and expanded hydraulically via a liquid piston, with the energy being converted from electrical into hydraulic power (and vice-versa) using hydraulic machines in lieu of air compressors and expanders. Thus, HPES systems may be compared to traditional pumped hydro energy storage (PHES) systems. In the case of HPES systems, the head is created pneumatically instead of relying on gravitational potential energy. It should be noted, however, that when compared to PHES, HPES systems are subjected to highly variable operating heads, thus making it significantly more challenging to operate hydraulic machines at high efficiencies over wide operational ranges.
The University of Malta (UM) is developing an HPES technology that is primarily intended for offshore deployment. A first prototype has already been tested and this achieved promising results [15]. The present paper is related to a second HPES prototype that is currently under development as part of the EU-funded project MUSICA (Multiple-Use-of Space for Island Clean Autonomy) [16]. The prototype will be integrated into an offshore, floating multi-use platform (MUP), which will also integrate different forms of RES (a wind turbine, solar photovoltaic panels, and wave-power converters), a Li-Ion battery bank, and a desalination unit to provide a stable source of electrical power and potable water to the island of Oinousses, Greece, where the platform is to be deployed. This paper deals with an HPES system being developed by the UM for the MUSICA project, with a particular focus on the discharge cycle of the system.
1.1. Background
The HPES system under consideration consists of three main components: (1) a pressure vessel (or multiple vessels), acting as an accumulator of gas, and a hydraulic fluid acting as a liquid piston; (2) a hydraulic pump; and (3) a hydraulic turbine. Energy is stored within the pressure vessel/s (also collectively referred to as the accumulator) in the form of compressed air or pneumatic energy. The hydraulic pump is used to charge the system, whereas the hydraulic turbine is used during the discharge cycle to regenerate electrical energy. In the present study, air is used as the gas under compression, while desalinated water is used as the hydraulic fluid.
The operation of HPES systems using a liquid piston grants specific advantages when compared to regular compressed-air energy storage (CAES) systems. The use of a liquid piston enables the compression and expansion process to approach isothermal conditions. This allows for the HPES system to operate without the use of thermal energy storage, as is usually required for adiabatic CAES systems [17]. The liquid piston also eliminates issues related to frictional losses or gas leaks when using a regular, solid piston such as those used in air compressors. Another important aspect is the fact that HPES systems have reduced footprints since they use more power-dense hydraulic machinery instead of air compressors or expanders. The system is also ideal given that regular, off-the-shelf hydraulic and pneumatic components may be used, thus improving the storage system’s performance by using reliable and proven technologies.
An initial study into HPES systems by Wang et al. [18] explored the idea of combining PHES with a traditional CAES system. The investigation showed that such technology can have simpler structures, whilst yielding better operational performance and costs when compared with traditional CAES. Additionally, it was not found to have geological requirements, such as those seen in the case of PHES. It should be noted, however, that this was only a theoretical study.
Experimental studies into HPES systems were carried out by Buhagiar et al. [15], Camargos et al. [19], and Odukomaiya et al. [20]. The experimental study carried out by the team at UM [15] primarily focussed on the thermodynamic aspects relating to the energy stored within the compressed air inside the pressure vessel. The prototype used a hydraulic pump to charge the system. However, it did not use a hydraulic turbine to regenerate electricity since the focus of the study, which aimed to investigate thermal efficiency, was limited to hydraulic power inputs and outputs at the pressure vessel’s ports.
In the case of the studies by Camargos et al. and Odukomaiya et al., the physical experiments were conducted on complete HPES systems, each comprising both a hydraulic pump and turbine. In both cases, the developed systems used small-scale hydraulic components with basic control features. From a point of view of recovering discharge energy, both studies used a hydraulic turbine connected to a set of resistor banks, with the electrical power not being supplied back to the grid [19,20].
For the HPES systems being proposed, the hydraulic turbine of choice was a Pelton turbine [15,19,20]. This was chosen because Pelton wheel turbines are ideal for use in conditions with high pressures and low flow rates, corresponding to low specific speeds, such as those experienced within HPES systems [21]. It should be noted that such turbines may achieve relatively high operational hydraulic efficiencies, but only if operated within a particular operational window in relation to the blade–jet speed ratio. The blade–jet speed ratio is the ratio of the linear velocity of the Pelton wheel turbine buckets compared to the water jet’s velocity when impacting the turbine buckets. Pelton wheel turbines may achieve very high operational hydraulic efficiencies when operated at a theoretical blade–jet speed ratio of 0.5 [21]. When the operation blade–jet speed ratio strays from this ideal operational window, the operational efficiency of the Pelton wheel turbine drops drastically on either side of the optimal range of the bell shape trend, as shown in Figure 1.
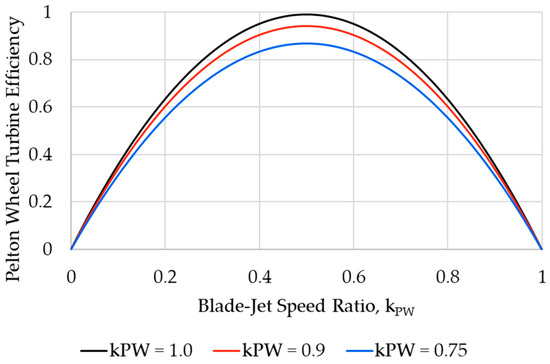
Figure 1.
Pelton wheel turbine operational characteristics based on Equations (10), (14) and (18).
Maintaining a high Pelton turbine efficiency in PHES is usually straightforward, given that the variation in the fluid supply pressure with time is, in many cases, minimal. This is, however, not possible in HPES systems since the pressure within HPES systems drops by a factor of at least 2 during the discharge cycle [15]. Thus, as the pressure drops within the HPES system during the discharge cycle, it is essential for HPES systems to maintain constant monitoring and control of the operational turbine’s angular velocity, such that the blade–jet speed ratio is retained at the optimal value (~0.5). Such control was achieved in the studies by Camargos et al. and Odukomaiya et al. using a variable transformer [19,20]. However, as noted, such systems were not connected to the grid, and thus these studies may have failed to accurately demonstrate the performance of the Pelton wheel hydraulic turbine when connected to the power grid. It should also be noted that the open literature related to the operation of grid-connected Pelton wheel turbines under significant differences in head pressure is very lacking.
Some hydraulic components, for example manifolds and nozzles, do not possess hydraulic performance characteristics, such as pressure drops. In such cases, computational fluid dynamics (CFD) may be employed to induce such characteristics. These components can then be used in hydraulic circuit analysis models in order simulate the performance of entire systems. Such studies were carried out by Zardin et al. [22] and Moujaes et al. [23], with pressure drops analysed across hydraulic manifolds and hydraulic fittings, respectively, using CFD simulations, whilst studies by Stivala et al. [24] and Zhang et al. [25] analysed the performance characteristics of Pelton wheel turbine nozzles using multi-phase CFD simulations. In all four cases, CFD proved very useful in understanding the effect of the geometries of particular components on hydraulic performance, leading to good estimates of particular characteristics, which could be used in further analyses of complete systems.
1.2. HPES System Being Developed for the MUSICA Project
The HPES system being developed for the MUSICA project is split into two main sections: (i) the pressure containment system (PCS), which consists of bundles of pressure vessels placed in a vertical orientation inside four corner columns of the MUP (these act as the main accumulators of pneumatic energy); and (ii) the energy conversion unit (ECU), which is a containerised unit housing the main hydraulic, electrical, and control systems of the HPES system. A schematic of the HPES system being developed is presented in Figure 2. The Pelton turbine’s energy recovery electrical generator, integrated into the ECU, is rated at 15 kW. The overall system is designed for an operational pre-charge pressure range of 25.6 bar and a peak operating pressure of 64 bar in its fully charged state.
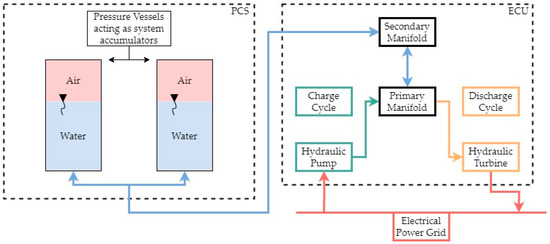
Figure 2.
HPES system schematic showing the pressure containment system (PCS) on the left and the energy conversion unit (ECU) on the right.
The ECU designed for deployment on the MUSICA MUP is currently being tested on the UM to better understand the performance of the different hydraulic components. For this purpose, a small 1000-litre pressure vessel was employed. This acted as an accumulator in place of the PCS for use on the MUP. The pressure vessel used was limited to a maximum operational pressure of 32 bar.
It is important to emphasize that the ECU was connected to the laboratory electrical grid, with a 400 V AC connection acting as the electrical power source or sink during the charge or discharge cycles, respectively. This allowed for accurate testing of the operation of the ECU when supplying power to the electrical grid.
The experiments being carried out on the ECU focussed on the performance of the hydraulic and electrical systems. Thermodynamic analysis of the accumulator during storage was outside the scope of the present study. The first experiments to be conducted on the system were focussed on the charge cycle of the storage system. The results obtained from the charge cycle tests have been separately published [26]. The present work presents the characteristics of the discharging cycle, which involved the operation of the Pelton turbine and the injection of energy into the grid.
1.3. Paper Overview
This paper examines the efficiency of the following ECU components, which are used for the conversion of pneumatic energy into electricity during PCS discharge:
- The hydraulic circuit, consisting of hoses and manifolds, which supplies pressurised water from the accumulator to the Pelton turbine;
- The Pelton turbine assembly, operated at different constant speed settings;
- The coupled electrical generator and regenerative variable-speed drive.
This work addresses current knowledge gaps by presenting an experimental analysis of the hydraulic and electrical efficiency of HPES discharge when operating the Pelton turbine at different speed settings. This is of significance for HPES systems as it will improve our understanding of the impact of operating Pelton turbines at constant speeds on the overall efficiency of grid-connected systems when subjected to decaying supply pressures. The results obtained from the physical tests were furthermore used to validate a numerical model representing the ECU using MATLAB Simulink® (R2022a). This numerical model will enable future work by providing avenues for improving the design of large-scale systems without the need for costly and timely experiments.
It should be noted that performance data pertaining to hydraulic 90° elbow fittings, custom hydraulic manifolds, and the turbine nozzle, were not initially available when we were setting up the numerical model. Such data gaps were either due to the data not being provided by the suppliers or due to it being difficult to measure data directly within the physical ECU setup. Thus, computational fluid dynamics (CFD) was employed to derive estimated performance characteristics in relation to these hydraulic components, with these data then being used to complete the numerical model. Figure 3 shows the flow of information and data between the different experiments.
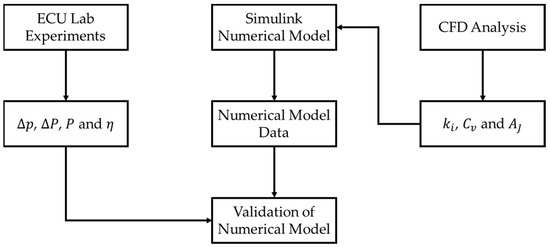
Figure 3.
Data transfer between experiments carried out for this study.
This paper is organised as follows: Section 2 presents the background theory pertaining to this study; Section 3 presents the experimental setup used for the physical experiments carried out on the ECU; Section 4 presents the numerical model developed using MATLAB Simulink and the CFD analysis used with the numerical model; Section 5 presents the Results obtained from both the physical experiments and numerical models, along with discussions of the results obtained; and finally, Section 6 summarises the main conclusions of this study.
2. Background Theory
2.1. Hydraulic Circuit
The hydraulic circuit consists of a series of hydraulic fittings, manifolds, and flexible hoses. These are used to connect the accumulator to the ECU and to route the hydraulic supply via a suite of sensors to the hydraulic turbine assembly inlet. In this section, the main parameters requiring calculation are the hydraulic circuit pressure drop, as per Equations (1)–(3), the power drop, as per Equations (4)–(6), and overall hydraulic circuit efficiency when delivering hydraulic power from the accumulator to the turbine nozzle inlet, as per Equation (7). The setup of the different hydraulic circuit sections is explained in further detail in Section 3.1.
Hydraulic pressure drops:
Hydraulic power drops:
Hydraulic circuit efficiency:
The pressure drops across the hydraulic circuit were measured using pressure sensors distributed along the hydraulic circuit, whilst a common flow rate was measured at one point of the circuit using a flow meter. Pressure drop coefficients were required in order to calculate the hydraulic manifolds and other hydraulic components within the numerical model. These were calculated as part of CFD modelling using Equation (8).
Hydraulic components pressure drop coefficients were found from
where represents the different components’ pressure drop coefficients, represents the pressure drop across the components’ inlet and outlet ports, and is the water velocity across the component in question.
2.2. Hydraulic Turbine Assembly
2.2.1. Hydraulic Turbine Nozzle
The first component used in hydraulic turbine assembly is the turbine nozzle. In this component, the pressurised hydraulic supply is converted into a high-velocity water jet, which powers the Pelton wheel turbine. For this component, the main pertinent parameters to be calculated were the water jet velocity, determined as per Equation (9), and the water jet power at the nozzle outlet, determined as per Equation (10). For this section, the only sensor utilised was a pressure sensor at the nozzle inlet.
Water jet velocity:
Water jet power:
The nozzle coefficient of velocity and jet area were derived from CFD simulation results since no data were provided by the Pelton turbine supplier. The values used within the numerical model are listed in Section 4.2.2.
2.2.2. Pelton Wheel Turbine
The second component of the hydraulic turbine assembly is the Pelton wheel turbine. In this component, kinetic energy from the water jet is converted into rotational kinetic energy around a vertical-axis shaft.
The first parameter to be measured is the resistive torque around the turbine’s shaft, which is determined as a function of the turbine’s angular velocity, as per Equation (11). It should be noted that this resistive torque covers all torque counteracting the turbine, including frictional losses at the turbine shaft, windage losses (including aerodynamic drag) within the Pelton wheel casing, and frictional losses within the electrical generator. In order to obtain this function, the turbine was operated at a constant velocity about its vertical axis in motoring mode and without any water jet impinging on the turbine. The resultant resistive torque around the shaft was provided by the turbine electrical control drive’s torque measurement.
Pelton wheel resistive torque:
Another parameter to be measured is the Pelton wheel operational blade–jet speed ratio, calculated as per Equation (12). This was calculated by comparing bucket linear velocity (calculated using the operational angular velocity, as provided by the turbine electrical control drive) to water jet velocity found using Equation (9).
Blade–jet speed ratio:
During operation, the turbine electrical control drive was used with a shaft torque measurement. The torque measurement gave the resultant net shaft torque output to the generator, which was a function of the torque generated by the turbine and the frictional torque opposing the Pelton wheel turbine. The power output at the turbine shaft could thus be calculated using the turbine shaft torque measurement, as per Equation (13).
Pelton wheel turbine shaft power:
The results obtained from the experiments into the ECU were compared to equations extracted from theoretical models of regular Pelton wheel turbines [21]. Equations (14)–(17) were used as the basis for the Pelton wheel turbine numerical model, as implemented in Matlab Simulink. The theoretical model for the Pelton wheel turbine’s generated power used the following formula:
The theoretical model for the Pelton wheel turbine-generated torque is
The theoretical model for the Pelton wheel turbine shaft power uses
The Pelton wheel turbine shaft torque can be found from
The parameter is known as the Pelton wheel bucket angle, which is the geometric acute angle between the water jet approaching the buckets and the water jet leaving the Pelton wheel buckets. The parameter is usually referred to as the bucket frictional coefficient. However, as recent studies have demonstrated [27], the flow exiting the buckets becomes highly 3D in nature, leading to substantial momentum loss. The simplistic model of Equation (14) can account for such effects by increasing the value of .
The final parameter relating to the Pelton wheel turbine was the hydraulic turbine efficiency, as calculated using Equation (18), which relates to the performance of the hydraulic turbine in converting hydraulic power at the nozzle inlet into kinetic energy at the turbine’s output shaft. The Pelton wheel turbine assembly’s efficiency may be found from
2.3. Electrical Components
The efficiency of the electrical components, namely the electrical generator and the electrical variable speed drive, may be calculated by comparing the power of the hydraulic turbine shaft to the electrical power supplied to the grid using Equation (19). This combined efficiency thus covers the losses in both the electrical generator and turbine control drive.
When calculating the electrical components’ efficiency, the following equation is used:
where is the electrical power supplied to the grid.
2.4. Overall ECU Performance
The overall ECU performance, namely the discharge-cycle efficiency, may be the calculated using Equation (20). This result thus covers the performance of all the components used within the ECU. The overall ECU efficiency may be calculated from
3. Equipment Setup of the Energy Conversion Unit (ECU)
The ECU setup for the discharge-cycle experiments consists of three main sections:
- The hydraulic circuit, which provides hydraulic power, sourced from the storage accumulator, to the hydraulic turbine inlet;
- The hydraulic turbine, which converts hydraulic power from the accumulator into rotational power about a shaft;
- The main electrical components, which include an electrical generator, directly connected to the main hydraulic turbine shaft, and an electrical motor regeneration-enabled drive for controlling the generator and providing a controlled electrical power supply to the power grid.
3.1. Hydraulic Circuit Setup
Figure 4 shows a schematic of the ECU hydraulic circuit setup used for the experimental campaign, with the ECU using a single 1000 L pressure vessel as the only storage accumulator.
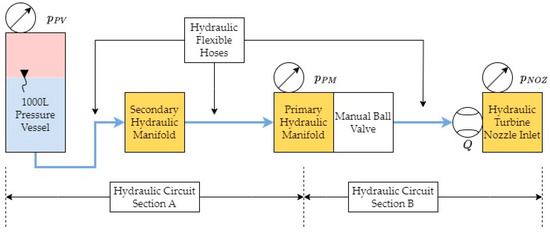
Figure 4.
ECU Hydraulic circuit schematic showing Sections A and B.
The hydraulic circuit section of the ECU comprises hydraulic hoses, fittings, and manifolds that are used to route the hydraulic supply from the accumulator to the hydraulic turbine. The hydraulic circuit includes a primary hydraulic manifold, which is used to connect the ECU’s hydraulic pump and hydraulic turbine to the main circuit. A secondary hydraulic manifold is integrated into the ECU’s hydraulic circuit to enable the ECU to be connected to multiple pressure vessels when necessary, thus increasing the HPES system’s energy storage capacity. The hydraulic circuit also includes a set of electrically controlled valves and pressure relief valves to enable full autonomous and safe control of the HPES system when integrated into the MUP.
The hydraulic setup used for the discharge-cycle experiments comprised a 1000 L pressure vessel (accumulator), which acted as the main hydraulic power source. The hydraulic supply was conveyed to the ECU via a flexible hose, which was connected to the ECU at the secondary hydraulic manifold. The secondary hydraulic manifold was in turn connected to the primary hydraulic manifold via another hose, and the primary manifold was connected in turn to the hydraulic turbine via a third hose. A manually controlled ball valve was placed between the primary manifold and the hydraulic turbine inlet pipe to allow for manual control of the flow into the turbine during the discharge cycles or during maintenance. It should be noted that, although the primary manifold is connected to the hydraulic pump as well, this is blocked off from the main hydraulic circuit during the discharge cycle using a directional check (or non-return) valve.
The accumulator had the lowest hydraulic pressure rating, at 32 bar. Thus, all discharge-cycle runs for this study were carried out over a pressure range from 30 bar (maximum charged pressure) down to a pre-charge level of 10 bar. For each discharge cycle, the accumulator was first pre-charged to the 10 bar pre-charge level using an air compressor. The ECU hydraulic pump was then used to charge the accumulator up to 30 bar (fully charged pressure level) in what was essentially an HPES charge cycle. It should be noted that, although the pre-charge level was 10 bar, each discharge cycle was only run until the pressure dropped to 11 bar. This was performed to allow enough time to close off the manual ball valve at the primary hydraulic manifold, thus limiting the risk of any air loss into the hydraulic circuit. Between each discharge-cycle run, the accumulator was safely discharged from any remaining water and re-charged in the same manner for the subsequent discharge-cycle run in order to ensure that the same accumulator conditions were used for each discharge-cycle test.
The ECU hydraulic circuit was equipped with four sensors:
- Pressure sensor at the accumulator (pressure vessel, );
- Pressure sensor at the primary manifold ();
- Pressure sensor at the turbine nozzle inlet ();
- Flow meter just before the turbine nozzle inlet ().
The locations of the different sensors used in the hydraulic circuit are also shown in Figure 4. The hydraulic circuit was split into two separate sections in order to help provide an indication of the different pressure drops across the hydraulic circuit. The pressure drop across section A was measured using sensors and , whilst the pressure drop across section B was measured using sensors and .
3.2. The Hydraulic Turbine Setup
Figure 5 shows a schematic of the hydraulic turbine assembly, including the electrical generator and electrical turbine control drive. The hydraulic turbine used was a vertical-axis Pelton wheel hydraulic turbine. The turbine was provided by the supplier as a single-unit assembly, including an electrically controllable turbine nozzle spear valve and an electrical generator of an appropriate size for the Pelton wheel. The turbine assembly was provided with a stainless-steel casing usually intended for applications in PHES where the turbine would be placed on concrete foundations with a large drainage hole at the bottom to expel water during operation. For drainage purposes, a custom-made fibreglass water catchment tray was thus fitted and sealed beneath the turbine to allow for the exhaust water to be contained, whilst also providing a drainage port via rigid plastic water pipes to allow for the spent water to be routed to an underground cistern for storage and recirculation.
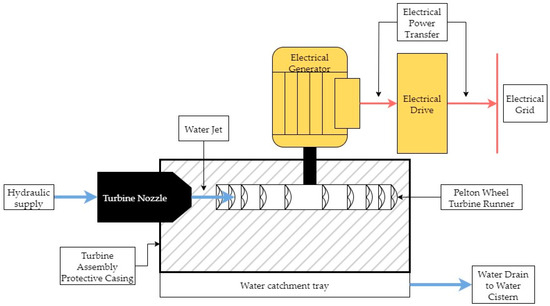
Figure 5.
HPES ECU hydraulic turbine assembly schematic.
The turbine nozzle spear valve was controlled by applying voltage to its ports. The turbine nozzle control was equipped with limit switches to indicate fully open and fully closed positions, as well as a linear potentiometer to be used to indicate the exact position of the nozzle spear. For the discharge-cycle experiments, the nozzle position was given as a percentage of the fully open linear position (i.e., a 20% nozzle open position indicates that the spear is set at the 20% linear position as compared to the 100% fully open nozzle position). Since the turbine nozzle position was fixed during the preparation of the ECU before each run, the flow onto the hydraulic turbine was controlled via the manual ball valve placed between the hydraulic turbine nozzle inlet and the primary hydraulic manifold.
3.3. Setup of Electrical Components
In order to be obtain a bi-directional power flow in the experimental setup, the generator was driven by a regenerative variable-speed drive. This drive could also be used to vary the angular velocity of the generator and hence the hydraulic turbine. The speed could be controlled in both motoring mode (where the turbine generator was operated as a regular electrical motor) and during regenerative mode (where the turbine generator was operated as an electrical generator). It should be noted that the turbine drive could shift between motoring mode and regenerative mode automatically, depending on the net torque at the turbine shaft.
For the discharge cycle, the hydraulic turbine generator was first started in motoring mode, drawing electrical power from the grid in order to rotate the turbine. Once the turbine achieved the angular velocity that was set in the electrical drive parameters, the hydraulic supply could be enabled using the manual ball valve at the primary hydraulic manifold, thus powering the hydraulic turbine. During the start of the accumulator discharge process, the electrical drive changed mode, shifting automatically from motoring to regenerative activity, thus providing electrical power to the grid whilst simultaneously maintaining the hydraulic turbine’s angular velocity at a set level. When the hydraulic supply was closed off at the end of the discharge cycle, the drive automatically switched back to motoring mode.
The electrical drive could output multiple parameters, with a maximum selection of two parameters enabled for analogue output. For the discharge-cycle experiments, the two output parameters exported were the operational angular velocity (RPM) and the generator shaft’s net torque.
A three-phase power quality analyser was installed on the output of the electrical drive in order to measure energy flows to and from the electrical grid. The instrument provided an accurate profile of the energy flow through the ECU during the experiment. The net energy delivered by the ECU to the electrical grid during the discharge cycle was extracted from the logged data.
3.4. Data Logger and System Control
A Campbell Scientific CR1000 data logger was used as the main data logger when collecting data from the different sensors positioned within the HPES ECU. Table 1 lists the different sensors connected to the data logger.

Table 1.
HPES ECU discharge-cycle sensors.
It should be noted that the data logger was set to have a sampling rate of 1 Hz.
Control over the HPES ECU during each discharge cycle was achieved using the components listed in Table 2.

Table 2.
HPES ECU discharge-cycle control systems.
3.5. HPES System Operation
3.5.1. Main Discharge-Cycle Experiments
The main operation of the HPES ECU during the discharge cycle consisted of the following steps:
- The hydraulic turbine nozzle spear valve was set to the required position corresponding to a particular run. It should be noted that, at this point, the ball valve between the primary manifold and the hydraulic turbine was kept closed.
- The data logger and power quality analyser were initialised.
- The accumulator was prepared for a particular discharge cycle by first pre-charging it to 10 bar using an air compressor. The ECU hydraulic pump was then used to charge the pressure vessel to 30 bar.
- The hydraulic turbine was started in motoring mode from its electrical control drive using the corresponding cycle angular velocity (RPM, speed) setting.
- Once the hydraulic turbine achieved a steady angular velocity, the ball valve at the primary manifold was opened. This provided a hydraulic supply with which to operate the turbine, thus starting a discharge cycle.
- The discharge of the accumulator was allowed to continue until the system’s state of charge (SOC) approached 11 bar. At this point, the ball valve at the primary hydraulic manifold was closed, concluding that particular discharge cycle.
- At this point, the discharge cycle was concluded and all equipment, such as turbine drive and data loggers, were switched off.
In order to prepare the system for subsequent discharge-cycle runs, the accumulator was purged of any stored water to ensure that all discharge-cycle runs were carried out using the same initial conditions within the accumulator.
It should be noted that, in certain cases, particularly when the cycle approached lower pressures towards the end of runs and when using a smaller nozzle opening and high turbine angular velocities, situations resulted where the turbine drive remained in motoring mode, even though a hydraulic supply was still enabled. This was because the hydraulic turbine generated less torque than the frictional torque acting against the hydraulic turbine. This was particularly the case with the run when using a 20% nozzle spear valve position and an operational angular velocity of 1750 RPM. In this case, even at the maximum pressure of 30 bar, the hydraulic turbine generated less torque than the frictional torque acting on the turbine. In such cases, the hydraulic supply was immediately closed to prevent damage to the Pelton wheel turbine.
Thirty different discharge-cycle runs were carried out to cover for the different combinations of operational angular velocities and nozzle spear valve positions, as per Table 3. Note that the codes listed in Table 3 are the same as those used in the results presented in Section 5.

Table 3.
Different discharge-cycle run settings.
3.5.2. Steady-State Runs for Resistive Torque
In order to calculate the resistive torque acting on the hydraulic turbine , the hydraulic turbine was operated at a steady state for a set period (30 s) without a supply of hydraulic power. In such runs, the net shaft torque measurement taken from the turbine drive thus indicated the resistive torque acting against the turbine for that particular angular velocity. These runs were carried out for the six different angular velocities listed in Table 3.
4. Numerical Modelling
The numerical modelling aspect of this study was split into two sections:
- A numerical model, developed using MATLAB Simulink (R2022a) to represent the full HPES ECU model used during the discharge cycle;
- CFD analyses, performed to model different hydraulic components for which no performance characteristics were available (specifically: , and ).
4.1. MATLAB Simulink Numerical Model
The development of the MATLAB Simulink (R2022a) [28] model enabled a more detailed study of the HPES ECU whilst providing an avenue for testing the different modifications to the ECU design without the need for modifications to the physical ECU.
The numerical model was developed by using a combination of Simulink and Simscape programmable blocks within the Simulink environment. Simscape blocks were used to represent the various physical elements of the ECU, with isothermal hydraulic blocks being used to represent the hydraulic circuit of the ECU, whilst rotational mechanical element blocks were used to represent the mechanical aspects of hydraulic turbine assembly. On the other hand, Simulink blocks were used to implement mathematical and theoretical models, performing tasks such as determining the performance characteristics of a Pelton turbine, since such components had no relevant or representative physical blocks within the Simscape model library.
4.1.1. Numerical Model for the Hydraulic Circuit
The full circuit used in the HPES ECU, shown in Figure 4, was represented in full within the numerical model using Simscape isothermal–hydraulic physical representation blocks. This was implemented using standard blocks such as flexible hoses and hydraulic fittings.
Each Simscape block was set up with the same physical characteristics used within the ECU, such as diameter, length, and vertical position. In certain cases, such as for discharge coefficients relating to valves, manufacturer data were used wherever possible. In other cases, however, such as for the two custom-made hydraulic manifolds, data relating to discharge coefficients and pressure drop coefficients were obtained from the CFD analysis, as explained in Section 4.2.
The blocks used within the numerical model’s hydraulic circuit can be split into the accumulator, the pressure drop of different hydraulic components, the pipe flow’s pressure drop, and the spear valve (needle valve).
The accumulator was represented using a gas-charged accumulator block. This block used the polytropic process, shown in Equation (21), to model an accumulator undergoing polytropic compression or expansion processes. Note that, in Equation (21), and are the accumulator pressure and air volume at a particular instance, respectively, whilst is the expansion and compression processes’ polytropic index. For the ECU numerical model, the polytropic index was set to 1.3 since this corresponded to the discharge process undertaken by the ECU accumulator during the physical experiments. It should be noted, however, that setting this parameter did not have any effect on the results presented in this study.
All hydraulic fittings, whether they were local resistances (such as those from Tee fittings or valves) or area changes (due to hydraulic adapters having different nominal hydraulic diameters at either port), followed the pressure drop theory shown in Equation (22). In Equation (22), is the component pressure drop coefficient, is the mass flow across the component, and is the hydraulic area. The pressure drop may be found from
The blocks used to represent pipes calculated the relevant pressure drop using the Darcy–Weisbach Equation (23). In Equation (23), represents the fluid’s (water) kinematic viscosity, is the pipe’s frictional coefficient, is the pipe length, is the mass flow across the pipe’s ports, whilst and represent the pipe’s diameter and area, respectively. It should be noted that the equation also includes an additional length component to represent additional losses within the pipe due to bends and curves. The frictional coefficient was calculated using the Haaland Equation (24), where represents the surface roughness within the pipe and represents the Reynolds number. The surface roughness, , was set to the value of 38 µm as suggested in [29].
The spear valve (needle valve block) used Equation (25) which is analogous to that employed in Equation (9). In this case, is the mass flow across the valve, is the nozzle outlet area, and is the pressure drop between the nozzle inlet and outlet ports.
Three pressure sensors and a flow meter were installed for data collection in an analogous manner to the HPES ECU used for performance analysis.
4.1.2. Numerical Model Hydraulic Turbine Assembly
The hydraulic turbine was split into three sections: (i) the hydraulic turbine mechanical (rotational) section; (ii) the hydraulic turbine nozzle section; and (iii) the Pelton wheel turbine section.
The hydraulic turbine mechanical section consisted of rotational–mechanical physical representation blocks. An inertia block was used to represent the overall hydraulic turbine, including the generator, and this used data provided by the turbine supplier. A fixed rotational speed driver was used to represent the electrical generator, which was being driven and controlled to a set angular velocity by the electrical control drive, whilst two torque sources were used to represent the frictional torque opposing the turbine and the torque generated by the Pelton wheel turbine. The rotational–mechanical blocks used Equation (26) to calculate the angular velocities and resultant torques. In Equation (26), is the resultant torque on the system, is the system inertia, and is the system change of angular velocity with time (acceleration).
Simulink mathematical blocks were used to calculate the performance of the turbine nozzle based on the models explained in Section 2.2.1. The calculation of water jet velocity was based on the pressure at the turbine nozzle inlet, as measured from the hydraulic circuit section of the numerical model, with the water jet velocity then being used in the Pelton wheel turbine section. Simulink mathematical blocks were also used to calculate the performance of the Pelton wheel turbine based on the models in Section 2.2.2. The calculated Pelton wheel torque was then used in the hydraulic turbine mechanical section.
It should be noted that the hydraulic turbine assembly model was only limited to the torque and power output at the turbine assembly shaft (i.e., and ). The electrical aspects of the HPES ECU, namely the electrical generator and the electrical drive, were not implemented because the main purpose of numerical modelling in the present study was to study hydraulic losses.
4.2. CFD Analysis
A CFD analysis was carried out for hydraulic components when not all data pertaining to their performance characteristics were provided by suppliers or identified in the literature review. These components included the 90° ‘Elbow’ fittings, the custom-made primary and secondary hydraulic manifolds, and the hydraulic turbine nozzle.
In the case of the 90° fittings and the manifolds, the CFD analyses were carried out to determine the pressure drop coefficient using Equation (8). In the case of the turbine nozzle, CFD analysis was used to derive the nozzle’s coefficient of velocity using Equation (9) as well as the water jet’s cross-sectional area at nozzle outlets for the different nozzle spear positions used.
4.2.1. CFD Analysis Procedure and Methods
In the cases of the elbow fittings and the hydraulic manifolds, similar procedures and methods were implemented. For these components, the CFD analyses comprised a methodology whereby a flow of water was passed through the component, with the pressure drop being measured across the inlet and outlet ports of each component. Multiple simulations were carried out using different flow rates for each model, with the pressure drop coefficient being calculated from the resultant pressure drops. It was noted that the pressure drop coefficients were independent of flow rates, as expected from Equation (8). Figure 6 shows a velocity streamline plot for the flow of water within the primary manifold as an example of the modelling carried out, with the hydraulic flow going from the top port to the port on the right-hand side of the hydraulic fitting.
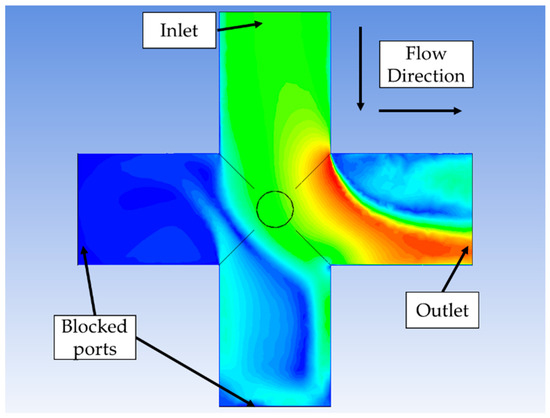
Figure 6.
CFD analysis showing a velocity streamline from the inlet to the outlet of the primary hydraulic manifold.
In the case of the turbine nozzle, the multi-phase volume-of-fluid (VoF) approach was adopted. In this case, CFD analysis was used to represent the nozzle while it was discharging water into ambient air, hence the use of two phases. The nozzle’s geometry was modified for each case, representing the five different nozzle spear positions used during the discharge-cycle experiments. Each nozzle spear position was used with different pressure levels, indicating different nozzle inlet pressures. For each analysis, the water jet cross-sectional area was measured using a line surface at the nozzle outlet, whilst the coefficient of velocity was measured by using the average water jet velocity across the aforementioned line surface at the nozzle outlet with Equation (9).
Figure 7 shows a phase contour plot as well as a velocity contour for the same nozzle settings, with both cases using the nozzle when set at a 60% position for 30 bar of pressure. Note that, in Figure 7, flow goes from left to right, with the red phase representing atmospheric air and the blue phase representing the water phase. The peak velocity extracted from the velocity contour plot was 77.6 m/s. The axis of symmetry used in the 2D axisymmetric setup is indicated using a dashed black line in Figure 7.
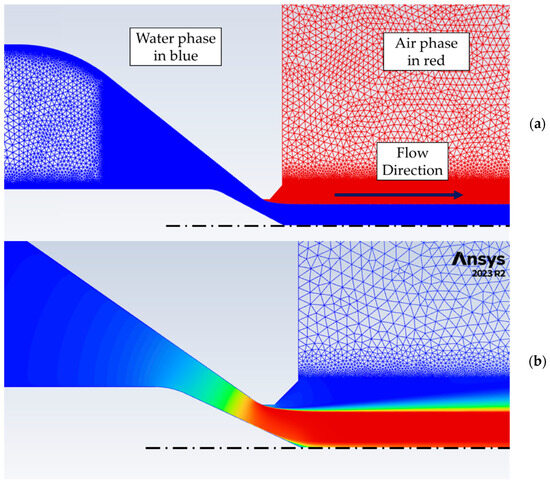
Figure 7.
Phase (a) and velocity (b) contour plots of CFD analysis for turbine nozzle set at spear position 60%.
It should be noted that a mesh study was conducted at the start of every analysis to ensure that mesh independence was achieved. In all cases, the mesh was continuously refined until results were found to be within 0.1% of each other. An example of the convergence obtained for a nozzle set to the 80% spear position is shown in Figure 8. Moreover, in all cases, mesh inflations were used to ensure that wall y+ values were lower than 1 across all walls.
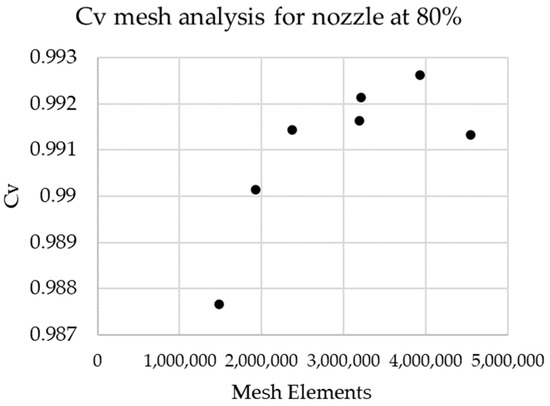
Figure 8.
Example of mesh convergence for CFD analyses.
All CFD analyses used the Reynolds-averaged Navier–Stokes (RANS) k-ω SST turbulence model, whilst being set at steady states with pseudo-time steps to help stabilise the analyses. Three-dimensional (3D) models were used for the hydraulic elbows and manifolds, whilst a 2D axisymmetric geometric model was used for the turbine nozzle.
4.2.2. CFD Analysis Results
Table 4 shows the CFD analysis results pertaining to the pressure drop coefficients for the 90° elbows and the hydraulic manifolds.

Table 4.
Results from the CFD analyses for the hydraulic elbows and manifolds.
Table 5 shows the CFD analysis results pertaining to the hydraulic turbine nozzle.

Table 5.
Results from the CFD Analysis for the hydraulic turbine nozzle.
5. Results and Discussion
This section presents the results obtained from the physical experiments carried out using the HPES ECU setup, with comparisons being made, where possible, to the results obtained from the numerical model developed to represent the same ECU.
This section will first go over the performance of the hydraulic circuit, the hydraulic turbine, and the electrical components, followed by an examination of the overall efficiency of the ECU performance.
Note that, within this section, results referring to the physical experiments carried out on the HPES ECU are labelled with “ECU”, whilst those referring to the numerical modelling developed using Simlink are labelled with “Sim”. All nozzle settings are labelled with an “N” prefix, whilst the hydraulic turbine’s operational speed settings are labelled with an “S”, as indicated in Table 3.
It should also be noted that, in certain cases, the results for cycles using turbine angular velocities of 1750 and 1500 RPM may only show short operational periods or be removed. This is because, in such cases, the torque generated by the Pelton turbine is lower than the frictional torque as the pressure drops, leading to the turbine being operated in a motoring mode with net electrical power being drawn from the grid. In such cases, the hydraulic supply to the turbine is shut off immediately, cutting the cycle short in order to prevent any damage to the hydraulic turbine.
5.1. Hydraulic Circuit
The first results to be discussed are those related to the performance of the hydraulic circuit. These concern the performance characteristics of the ECU components between the outlet port at the accumulator to the hydraulic turbine nozzle inlet.
5.1.1. Hydraulic Power Supply from the Accumulator
The hydraulic power supply at the accumulator outlet may be considered the maximum power available for use during the discharge cycle. In this case, the hydraulic power supply from the accumulator was dependent on its internal pressure (can also be referred to as the HPES system’s state of charge, SOC) and on the flow rate within the hydraulic circuit. The flow rate within the hydraulic circuit was in turn a function of the pressure within the accumulator and the turbine’s nozzle spear position (which affects the nozzle outlet diameter).
Figure 9 shows the flow rate within the hydraulic circuit and the available hydraulic power from the accumulator outlet, as calculated using Equation (6) (in this case, the accumulator pressure was used instead of a pressure change).
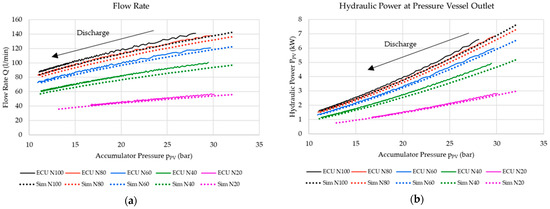
Figure 9.
(a) Hydraulic circuit flow rate and (b) hydraulic power at accumulator outlet.
As shown in Figure 9, the hydraulic power available at the accumulator outlet decreases as the SOC of the system decreases. The results also show that the hydraulic power at the accumulator outlet, calculated using the numerical model, was slightly lower than the that seen in the results obtained from the physical experiments. This was because the flow rate, as calculated within the numerical model for the hydraulic circuit, resulted in a marginally lower value, as shown in Figure 9a. The flow rates calculated using the numerical model were lower than the results obtained from the ECU by around 3% to 7%, with the highest difference occurring between the two flow rates. The difference was recorded at 10.9% for a case using the nozzle with a spear setting of 40%. The lower flow rate within the numerical model may be attributed to the standard spear valve block used within the numerical model, which might not model the ECU turbine nozzle accurately over the complete operational pressure range.
5.1.2. Pressure Drops within Hydraulic Circuit
The pressure drops across sections A and B of the hydraulic circuit and for the full hydraulic circuit, as calculated using Equations (1)–(3), are presented in Figure 10.
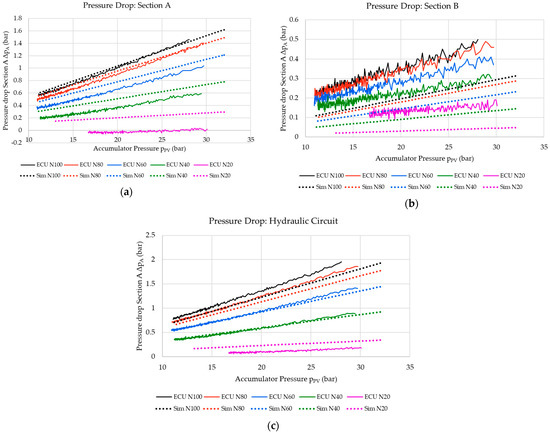
Figure 10.
Pressure drop across (a) Section A, (b) Section B of the hydraulic circuit, and (c) for the full hydraulic circuit.
The ECU hydraulic circuit recorded the highest pressure drops within Section A of the ECU hydraulic circuit since this was longer than Section B and comprised more components. The highest pressure drop occurred during discharge-cycle runs when using the maximum nozzle opening setting (i.e., fully open at the 100% spear position) since this yielded the highest flow rates. In this case, the highest pressure drop recorded was 1.5 bar. It should be noted that the pressure drop is negative for certain physical experiments using a 20% nozzle spear setting due to possible inaccuracies coming from the pressure sensors due to the pressure difference between the two sensors used being lower than their accuracy (as presented in Table 1).
Discrepancies were noted between the results obtained from the physical ECU and those from the numerical model. These discrepancies between physical and numerical models may be attributed to the accuracy of the sensors used (particularly when measuring low pressures within section B), as well to minor errors in how the sensors are implemented within the Simulink model when compared to the physical ECU due to programme constraints. The disparity between experimental and numerical model results is negligible and very close to the uncertainty levels of the measurement sensors. Furthermore, both the measurements and the numerical models show that the pressure drops in sections A and B are very small.
5.1.3. Power Drops within Hydraulic Circuit
With the pressure drop and the flow rates being known, it was possible to evaluate the overall power lost within the hydraulic circuit using Equations (4)–(6). Figure 11 shows the power lost within Sections A and B of the hydraulic circuit and the power loss across the full hydraulic circuit. Figure 12 shows the hydraulic power available at the accumulator outlet compared to the hydraulic power at the hydraulic turbine nozzle for reference. It can be observed that, if they were converted into percentage values with respect to the power available at the accumulator outlet, the results would be the same as those presented in Figure 10.
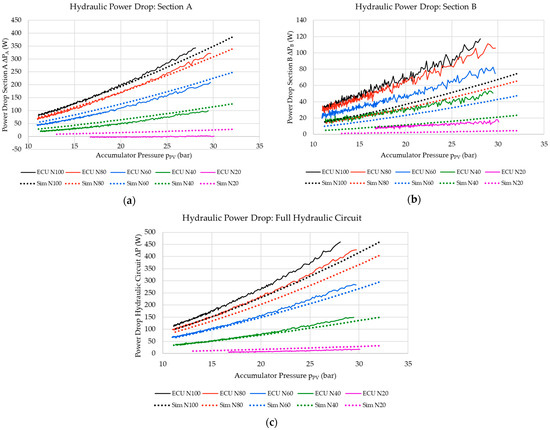
Figure 11.
Power lost within (a) Section A and (b) Section B of the hydraulic circuit and (c) for the full hydraulic circuit.
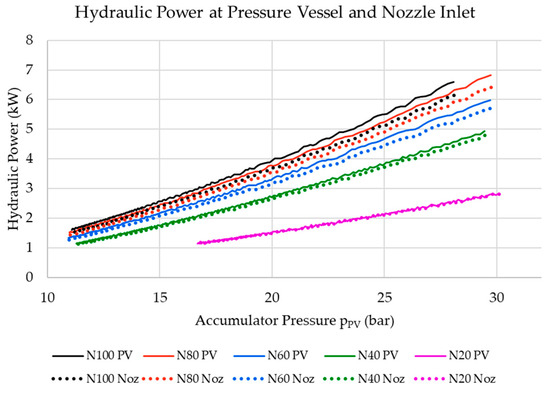
Figure 12.
Hydraulic power at the hydraulic turbine nozzle inlet plotted against the hydraulic power at the pressure vessel outlet.
Similarly to the pressure drops, the highest power losses were obtained when using the fully open turbine nozzle spear setting since this resulted in the highest flow rates. As the flow rates decreased, the overall power loss decreased as well, increasing the effectiveness of the hydraulic circuit in transferring the supply of hydraulic power from the pressure vessel to the hydraulic turbine. A detailed presentation of the efficiency of the hydraulic circuit is presented in Section 5.1.4.
The results show that the Simulink model achieved results that were very close to the experimental ones, indicating that the numerical model may be considered a reasonable representation of the performance of the ECU hydraulic circuit. This is particularly true with regards to discharge-cycle runs using lower flow rates. The discrepancy between the physical ECU and the numerical model results may be due to the difference in flow rates between the two sets of data. Another source of such discrepancies could be the fact that particular hydraulic flow phenomena and the interactions between different hydraulic components are not accurately modelled or represented within standard MATLAB Simscape models.
5.1.4. Hydraulic Circuit Efficiency
Figure 13 shows the hydraulic circuit’s efficiency when transferring hydraulic power from the accumulator to the turbine nozzle inlet. The hydraulic circuit efficiency was calculated using Equation (7). For this section, the operational efficiency was relatively high, with efficiency being the highest during cycles using lower flow rates and when there were lower nozzle opening settings. This was because lower flow rates yielded lower pressure and power drops within the hydraulic circuit. An important observation was that the efficiency remained relatively constant throughout the cycle, irrespective of the drop in pressure and flow rate during the discharge cycle.
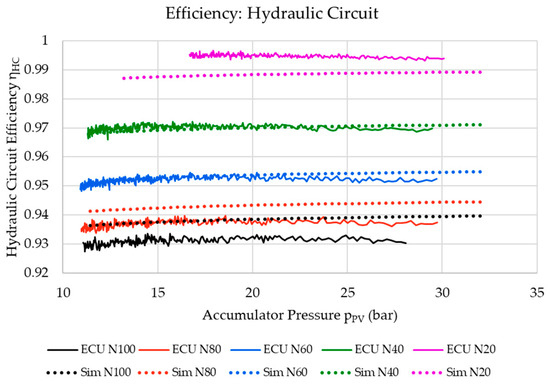
Figure 13.
Hydraulic circuit operational efficiency.
As for the numerical model, the estimated hydraulic efficiencies were found to be in very close agreement with those derived from the measurements. This indicated that the discrepancies present between the physical ECU results and those from the numerical model for the pressure and power drops had minimal effects on the overall performance characteristics comparison between the two systems.
5.2. Hydraulic Turbine Assembly
This section discusses the performance of the hydraulic turbine based on both the physical experiments and on the numerical model.
5.2.1. The Hydraulic Turbine Nozzle
Figure 14 shows the resultant water jet velocity at the turbine nozzle as calculated using Equation (9), whilst Figure 15 shows the water jet power at the turbine nozzle outlet as calculated using Equation (10). In these cases, both calculations are displayed as functions of the hydraulic turbine nozzle inlet pressure in order to exclude the effects of the pressure drops within the hydraulic circuit, thus enabling the analysis to be solely concerned with the performance of the turbine nozzle.
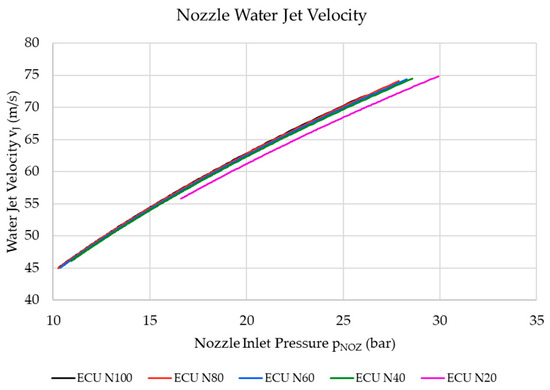
Figure 14.
Water jet velocity at turbine nozzle outlet.
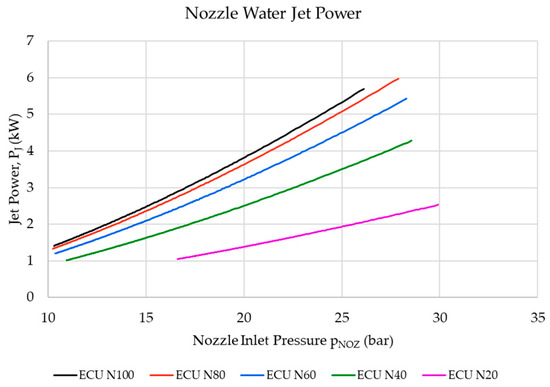
Figure 15.
Water jet power at turbine nozzle outlet.
The resulting water jets were similar for most of the nozzle positions since the nozzle coefficient of velocity remained relatively unchanged across the 100% and 40% spear position settings, as displayed in Table 5. The water velocity for the 20% open position was noticeably lower than the other nozzle settings due to a lower nozzle coefficient of velocity.
Although the differences in water jet velocities between the different nozzle spear positions can be considered to be relatively minor, the effect of such differences in velocities can been seen to have quite a considerable effect on the water jet’s power, as shown in Figure 15. This indicates that even a small change in the turbine nozzle coefficient of velocity can have a noticeable effect on the overall power of the water jet used to operate the Pelton wheel turbine.
The analyses concerning the water jet velocities and water jet powers shown in Figure 14 and Figure 15 pertain to the results obtained from the physical experiments performed on the ECU. The results from the numerical model are not shown since these use the same mathematical Equations (9) and (10), and thus yield the same results.
5.2.2. The Hydraulic Turbine’s Resistive Torque
Steady-state runs were carried out on the ECU hydraulic turbine, as per Section 3.5.2, in order to determine the hydraulic turbine’s resistive torque, as a function of turbine angular velocity. Figure 16 shows the resultant net resistive torque as measured by the ECU turbine’s electrical control drive. During this operation, the Pelton wheel turbine was not supplied with hydraulic power and the hydraulic turbine’s generator was operated in motoring mode.
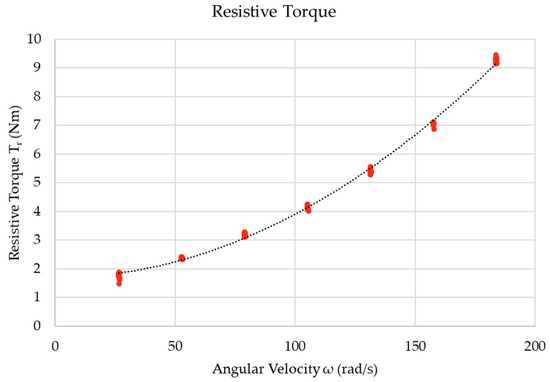
Figure 16.
Hydraulic Turbine Resistive Torque.
The resultant trendline yielded a relationship between the resistive torque and the turbine’s angular velocity, as per Equation (27). It should be noted that the trendline yielded a coefficient of determination () of 0.998, indicating that Equation (27) is a good representation of the resistive torque throughout the operational range.
5.2.3. The Hydraulic Turbine’s Blade–Jet Speed Ratio
The turbine’s operational blade–jet speed ratio () is a function of the turbine’s angular velocity and water jet velocity. This is a particular hydraulic performance parameter that may be used to describe the operation and performance of a given turbine. An example of how the blade–jet speed ratio changes over the course of a discharge cycle is shown in Figure 17, with the blade–jet speed ratios being calculated as per Equation (12). In this case, it is shown that the blade–jet speed ratio increases as the system’s pressure decreases over a cycle. This creates a situation where the overall performance of Pelton wheel turbine changes over time. Figure 17 only shows the blade–jet speed ratio obtained for cycles using the 100% open nozzle spear setting. As for the remaining nozzle spear positions, the blade–jet speed ratios are relatively similar and follow the same relationship, albeit at a slightly higher blade–jet speed ratio due to the lower water jet velocities for the nozzle spear settings between 80% and 20%.
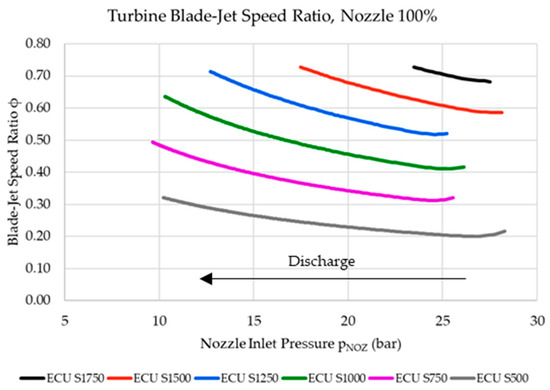
Figure 17.
Blade–jet speed ratio of the cycles using a nozzle setting of 100% open.
5.2.4. The Pelton Wheel Hydraulic Turbine
Figure 18 shows the resultant net shaft torque generated by the hydraulic turbine during the different discharge cycles for both the physical ECU and the numerical model. In this case, the results shown cover the discharge cycles obtained using nozzle spear settings of 100% and 20%. In these cases, the shaft torque was obtained from the turbine control drive torque measurement, whilst the shaft torque derived from the numerical model was calculated using Equation (17).
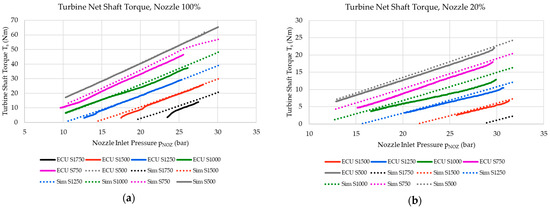
Figure 18.
Net shaft torque for (a) the 100% nozzle spear setting and (b) the 20% nozzle spear setting.
As shown in the results, the resultant torques generated at the hydraulic turbine shaft follow a quasi-linear relationship with the system pressure. This is also shown in the results obtained from the numerical model, with these showing that the theoretical models pertaining to the Pelton wheel’s characteristics are suitable for representing the performance of the ECU hydraulic turbine for most cases.
It should be noted that cycles performed using 1750 RPM angular velocity yielded the largest discrepancy between the physical ECU results and the numerical model results. Such a discrepancy may be attributed to particular losses within the turbine that are not accounted for in the numerical model.
A similar discrepancy was noted in all the cycles performed using the 20% nozzle spear setting, and these could be attributed to the performance characteristics of this particular nozzle setting not being accurately represented in the CFD modelling. The results for the nozzle spear setting of 20%, shown in Figure 18b, did not include the results for the ECU at the 1750 RPM speed setting since these yielded negative torque values throughout the cycle. This indicated that the turbine was still operating in motoring mode, with the torque generated by the Pelton wheel turbine being lower than the resultant frictional torque acting on the hydraulic turbine assembly.
The results pertaining to the 80%, 60%, and 40% nozzle spear settings followed the same trends as those shown in Figure 18, with the resultant shaft torque and discrepancy between the numerical model and the ECU results falling between those values shown for the 100% and 20% nozzle spear settings.
Figure 19 shows the resultant net power output at the turbine shaft as it was observed during both the physical experiments on the ECU and the numerical model, with these results being calculated using Equations (14) and (17), respectively. As shown in Figure 19, the Pelton wheel shaft power was linearly dependent on the system’s SOC for most of the testing range. Similarly to the results pertaining to the net resultant torque output at the turbine shaft, the numerical model results represent the physical ECU results quite accurately. The cases of the cycles using the speed setting of an RPM of 1750 and the nozzle position setting of 20% once again had the largest discrepancies from the physical ECU, indicating that more detailed analysis is required to examine how nozzle closure affects turbine performance when the latter is connected to a discharging accumulator.
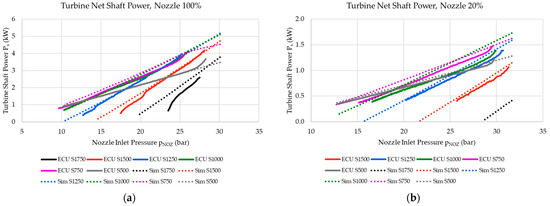
Figure 19.
Net shaft power for (a) the 100% nozzle spear setting and (b) the 20% nozzle spear setting.
The net shaft power output indicates that there are ideal turbine operational angular velocities that yield higher efficiencies. This is noted in Figure 19, where turbine operational speeds of 1250, 1000, and 750 RPM are shown to yield higher power outputs when compared to the other speed settings for the same hydraulic power supply. Further details on this matter are presented during the discussion of the hydraulic turbine efficiency in Section 5.2.5.
The results pertaining to the 80%, 60%, and 40% nozzle spear settings followed the same trends as shown in Figure 19, with the resultant shaft torque and discrepancy between the numerical model and the ECU results falling between those shown for the 100% and 20% nozzle spear settings.
5.2.5. Hydraulic Turbine Assembly Efficiency
Hydraulic turbine assembly efficiency considers the losses at the turbine nozzle and the losses in Pelton wheel turbine, which include hydraulic losses, friction, and windage losses due to the turbine rotating about its vertical shaft. Figure 20 shows the resultant hydraulic turbine efficiency compared to the blade–jet speed ratio for both the physical ECU and the numerical models. The efficiencies for both the physical ECU and the numerical model were calculated using Equation (18).
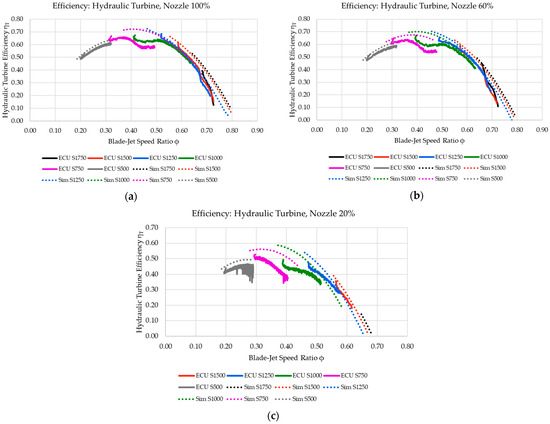
Figure 20.
Hydraulic turbine efficiency for (a) the 100% nozzle spear setting, (b) the 60% nozzle spear setting, and (c) the 20% nozzle spear setting (c).
The results show that the hydraulic turbine efficiency tends to follow theoretical models pertaining to Pelton wheel turbine efficiencies. In this case, the Pelton wheel turbine follows the general bell-shaped relationship between the turbine efficiency and the operational blade–jet speed ratio, as presented earlier in Figure 1. It should be noted, however, that a discrepancy is present between the results derived from the numerical model and those from the physical ECU for the blade–jet speed ratio within the range of 0.4 to 0.5. The Pelton wheel turbine is expected to reach peak operational efficiencies in this blade–jet speed ratio range. Since the discrepancy appears to occur at a particular range of blade–jet speed ratio (even though turbine operational speeds and system SOC are different in each case), this might indicate a particular frictional or operational effect at this particular blade–jet speed ratio, which might be inherently related to the specific Pelton wheel turbine being used. Such effects could possibly include the water jet not clearing the Pelton wheel runner adequately after impacting the turbine buckets. This is particularly noteworthy since the Pelton runner is horizontal and thus half of the water jet is redirected upwards towards the top of the turbine casing, and then possibly causing interference by falling back down onto the turbine runner.
When comparing the results obtained from the physical ECU to the numerical model, it becomes evident that the numerical model can be considered to represent the physical ECU adequately. When considering Equation (14) as it is used within the numerical model, whilst most parameters are either operational variables (such as and ) or physical constants (such as or the geometrical angle ) that can easily be quantified or set, the turbine bucket’s frictional coefficient is highly dependent on the physical state (specifically, on the surface roughness) of the buckets. The value was set empirically to 0.72 since this enabled the numerical model to yield the closest results to those of the physical ECU. Such a value is within the expected values, as shown in the study by Gupta et al. [27]. However, further studies are suggested on the setting and sensitivity of the bucket frictional coefficient, with studies also suggested to observe the change in this value across the operational life of this specific Pelton wheel turbine.
The Pelton wheel bucket angle was set to 11° since this was the geometric dimension quoted by the turbine supplier.
The peak hydraulic efficiencies achieved were around 65%. This is expected from a small-scale Pelton wheel turbine, such as that used within the ECU. Larger-scale turbines can achieve operational efficiencies exceeding 90% due to the increase in Reynolds number and higher operational supply pressures.
5.3. Electrical Components
This section presents results pertaining to the electrical components of the ECU used during the discharge cycle, namely the electrical generator and the electrical drive. The numerical model excluded the electrical components and thus the comparison between the physical ECU and the numerical model was limited up to the shaft output seen at the hydraulic turbine.
5.3.1. Electrical Power Output
Figure 21 shows the net electrical power output to the grid during the different ECU discharge cycles. The results are provided with the relative hydraulic power at the accumulator outlet, thus indicating the net discharge-cycle output compared to the gross power available. When comparing the results shown in Figure 21 to those in Figure 19, it may be noted that the electrical drive results in a constant operational electrical power requirement of approximately 400 W.
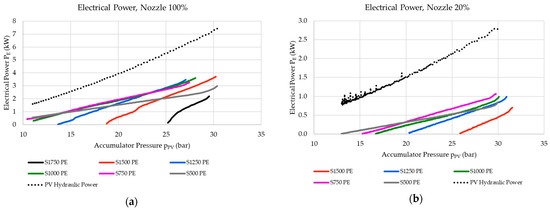
Figure 21.
ECU electrical power output for (a) the 100% nozzle spear setting and (b) the 20% nozzle spear setting.
5.3.2. Electrical Efficiency
Figure 22 shows the electrical efficiency of the turbine electrical generator and the electrical drive. The results in Figure 22 were calculated using Equation (19). The results show that the electrical components maintain a relatively high and constant efficiency throughout their operation, except when operating with low load conditions. This is in agreement with the expected performance of regular electrical motors, as shown by Burt et al. [30].
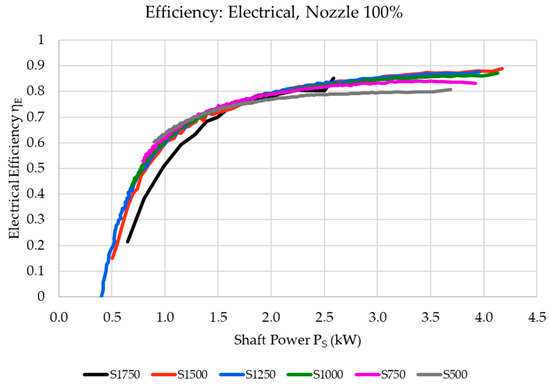
Figure 22.
ECU electrical efficiency.
It should be noted that the generator used was rated to 15 kW, which was double the peak electrical power generated during the discharge cycles. For such applications, a smaller electrical generator would have been better suited to maintaining higher electrical efficiencies throughout the full operational range.
5.4. The ECU’s Overall Efficiency
The overall ECU efficiency, as presented in Figure 23, shows the ECU performance in terms of converting the hydraulic power supply from the pressure vessel into electrical power, which is then supplied to the grid. Thus, these results show the overall performance of the ECU as an interaction between all the components within the system, with the overall ECU efficiency being calculated using Equation (20). The results show that, across certain operational speeds, the efficiency of the system tends to become less dependent on the system’s SOC. This is particularly evident for turbine operation speeds at and below the 1250 RPM speed setting. Conversely, the higher the speed settings are, the higher the dependency of the overall ECU efficiency on the system’s SOC will be. It is also apparent that such higher speeds effectively limit the operation of the ECU, curtailing the ECU’s operation.
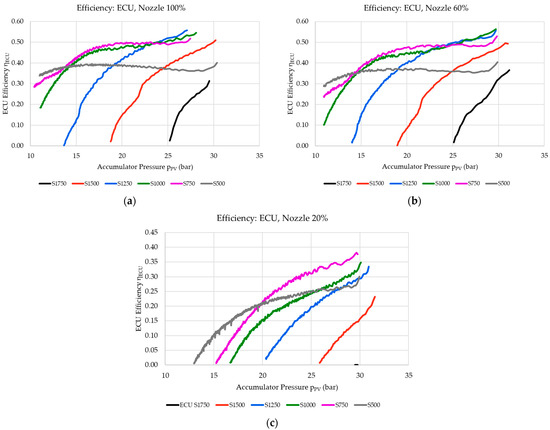
Figure 23.
Overall ECU efficiency for (a) the 100% nozzle spear setting, (b) the 60% nozzle spear setting, and (c) the 20% nozzle spear setting.
The results thus indicate that there is an ideal operational window relating to system pressure and turbine angular velocities, which provide higher operational efficiencies. When the system is operated outside of this ideal operational window, the overall ECU efficiency drops drastically. To obtain ideal ECU operation, we suggest continuously monitoring and controlling ECU operational parameters. This may be primarily achieved through the control of the hydraulic turbine operational angular velocity instead of maintaining a fixed-speed operation, as was the case in the present study. It is also imperative that all components are sized in relation to the operational conditions that are expected to be implemented.
6. Concluding Remarks
A small-scale HPES ECU was subjected to a set of discharge cycles to measure its performance during such cycles. The experiments examined the overall combined efficiency of the different components making up the ECU discharge and electrical generation hardware, with the operation of the ECU being carried out while also being connected to an electrical power grid. It should be noted that, for these experiments, the overall combined efficiencies were observed in relation to the drop in system pressure, or SOC, during a discharge cycle whilst operating the hydraulic turbine under different fixed speeds.
A numerical model was developed to represent the physical ECU. The results from the discharge cycle for the physical ECU were compared to those from the numerical model, with the comparison indicating that the numerical model may be considered a reliable representation of the physical ECU.
6.1. Key Conclusions
The key conclusions from the study presented may be summarised as follows:
- Overall discharge-cycle efficiency achieved by the ECU approached peaks of 55%, but only when operating under optimal bucket–jet speed ratios. The hydraulic circuit and turbine nozzle had minimal effects on the overall performance of the ECU, with the largest contributor to the overall ECU performance being the Pelton wheel turbine. The results clearly indicate that control over the turbine operational speed is essential to ensuring that operations occur in the ideal blade–jet speed ratio operational window as the overall system’s SOC decreases. This thus allows for the ECU to operate at optimal efficiency through a discharge cycle.
- When considering the full range of components, it was noticed that the ECU efficiency remains relatively constant over a particular pressure range. This indicates that, when operating close to the ideal blade–jet speed ratio, the efficiency remains relatively constant as the SOC decreases. However, in cases that diverge from ideal blade–jet speed ratio operational conditions, the efficiency drops drastically, with the system becoming increasingly sensitive to changes in the SOC.
- The numerical model achieved results that compared relatively well with the experimental results achieved for the physical ECU. However, particular operational phenomena relating to the physical ECU, such as the drop in efficiency when operating at the theoretical ideal blade–jet speed ratio or frictional effects, were not completely modelled.
- The results indicated that the electrical components selected, particularly the electrical generator, matched the expected operational characteristics of the HPES system. Whilst such components have relatively high operational efficiencies over most of their operational range, when such components are operated with low load factors, their efficiency drops drastically.
6.2. Future Work
Further tests of the ECU are required for higher pressures because the lower pressures at which the ECU was operated in the laboratory set-up leads to higher viscous losses (hydraulic) and lower electrical efficiencies (electrical generator). Further tests are planned in order to test the ECU under higher pressures of about 64 bar for the purpose of analysing the operational characteristics of the system under higher pressures.
The numerical model may also be used to help provide possible avenues for design-related and operational improvements to the ECU. Further work should also be carried out on the numerical model in order to analyse the effect of particular settings (such as the bucket friction coefficient) and to explore the sensitivity of the overall numerical model to such parameters. Further CFD analysis, along with particle imaging velocimetry (PIV), may be used to analyse the operation of the Pelton wheel turbine in more detail. This will lead to a better understanding of the performance of the turbine nozzle at multiple spear settings, as well as the performance of the Pelton wheel buckets, with a particular focus on the bucket frictional coefficient, .
Analyses of the combination of the results from both the discharge and the charge cycle [26] and the results from the thermodynamic study of the storage aspects of the system [15] will be carried out to obtain a more complete study of the HPES system being developed. This will focus particularly on the round-trip efficiency of the system (i.e., the electrical power input in relation to electrical power output).
Author Contributions
Conceptualization, T.S., R.N.F., L.A. and D.B.; Data Curation, L.A., T.S., J.L. and C.S.S.; Funding Acquisition, T.S.; Investigation, L.A.; Methodology, L.A.; Project Administration, T.S. and R.N.F.; Resources, T.S., R.N.F., J.L. and C.S.S.; Software, L.A.; Supervision, T.S. and R.N.F.; Validation, L.A.; Visualization, L.A.; Writing—original draft, L.A.; Writing—review & editing, T.S., R.N.F., J.L. and D.B. All authors have read and agreed to the published version of the manuscript.
Funding
This project has received funding from the European Union’s Horizon 2020 research and innovation programme under grant agreement number 862252.
Data Availability Statement
The original contributions presented in this study are included in the article. Further inquiries can be directed to the corresponding author.
Acknowledgments
The authors would like to thank James Saliba, Assistant Laboratory Manager within the Department of Mechanical Engineering, University of Malta, for his technical support and assistance during the setup and utilisation of the setup used for this study.
Conflicts of Interest
Author Daniel Buhagiar was employed by the company FLASC B.V. The remaining authors declare that the research was conducted in the absence of any commercial or financial relationships that could be construed as a potential conflict of interest.
Abbreviations
| AC | alternating current |
| CAES | compressed-air energy storage |
| CFD | computational fluid dynamics |
| CO2 | carbon dioxide |
| ECU | energy conversion unit |
| ESS | energy storage system |
| HPES | hydro-pneumatic energy storage system |
| MUP | multi-use platform |
| PCS | pressure containment system |
| PHES | pumped hydro energy storage |
| RES | renewable energy source |
| RPM | revolutions per minute |
| SOC | state of charge |
| UM | University of Malta |
| Nomenclature | |
| Hydraulic component hydraulic area, m2 | |
| Water jet area at hydraulic turbine nozzle outlet, m2 | |
| Hydraulic turbine nozzle coefficient of velocity | |
| Pipe hydraulic diameter, m | |
| Pipe frictional coefficient | |
| Mass moment of inertia, kg·m2 | |
| Hydraulic component pressure drop coefficients | |
| Pelton wheel turbine bucket frictional factor | |
| Pipe physical and additional lengths | |
| Mass flow rate, kg·s−1 | |
| Polytropic index | |
| Gauge pressure, Pa | |
| Pressure drop across full ECU hydraulic circuit or section/component, Pa | |
| Power drops across ECU hydraulic circuit or section/component, W | |
| Power, W | |
| Flow rate in hydraulic circuit, m3·s−1 | |
| Pelton wheel turbine bucket radial position from shaft, m | |
| Reynolds number | |
| Resistive torque at hydraulic turbine assembly, Nm | |
| Torque, Nm | |
| Time, s | |
| Pelton wheel turbine bucket linear velocity, m·s−1 | |
| Volume, m3 | |
| Water jet velocity at hydraulic turbine nozzle outlet, m·s−1 | |
| Water velocity across hydraulic component, m·s−1 | |
| Greek | |
| Pipe surface roughness, m | |
| Efficiency | |
| Pelton wheel turbine bucket angle, ° | |
| Water kinematic viscosity, m2·s−1 | |
| Water density, kg·m−3 | |
| Blade–jet speed ratio | |
| Hydraulic turbine angular velocity, rad·s−1 | |
| Subscripts | |
| A | Hydraulic circuit section A |
| B | Hydraulic circuit section B |
| E | Electrical |
| HC | Hydraulic circuit (complete circuit) |
| J | Water jet |
| PM | Primary hydraulic manifold |
| NOZ | Hydraulic turbine nozzle inlet |
| PV | Pressure vessel/Accumulator |
| PW | Pelton wheel turbine power or torque |
| PW-T | Pelton wheel turbine power or torque as per theoretical models |
| S | Shaft power or torque |
| S-T | Shaft power or torque as per theoretical models |
| T | Hydraulic turbine assembly |
References
- IRENA. Future of Wind: Deployment, Investment, Technology, Grid Integration and Socio-Economic Aspects; International Renewable Energy Agency: Abu Dhabi, United Arab Emirates, 2019. [Google Scholar]
- IRENA. Future of Solar Photovoltaic: Deployment, Investment, Technology, Grid Integration and Socio-Economic; International Renewable Energy Agency: Abu Dhabi, United Arab Emirates, 2019. [Google Scholar]
- Ellabban, O.; Abu-Rub, H.; Blaabjerg, F. Renewable energy resources: Current status, future prospects and their enabling technology. Renew. Sustain. Energy Rev. 2014, 39, 748–764. [Google Scholar] [CrossRef]
- European Commission. Available online: https://energy.ec.europa.eu/topics/renewable-energy/solar-energy_en (accessed on 24 March 2024).
- SolarPower Europe. Available online: https://www.solarpowereurope.org/press-releases/new-report-eu-solar-reaches-record-heights-of-56-gw-in-2023-but-warns-of-clouds-on-the-horizon (accessed on 24 March 2024).
- European Commission. Available online: https://energy.ec.europa.eu/topics/renewable-energy/eu-wind-energy_en (accessed on 24 March 2024).
- WindEurope. Available online: https://windeurope.org/newsroom/press-releases/the-eu-built-a-record-17-gw-of-new-wind-energy-in-2023-wind-now-19-percent-of-electricity-production/#:~:text=The%20IEA%20estimates%20that%20Europe,Europe’s%20wind%20energy%20supply%20chain (accessed on 24 March 2024).
- Jenniches, S. Assessing the regional economic impacts of renewable energy sources—A literature review. Renew. Sustain. Energy Rev. 2018, 93, 35–51. [Google Scholar] [CrossRef]
- Sinsel, S.R.; Riemke, R.L.; Hoffmann, V.H. Challenges and solution technologies for the integration of variable renewable energy sources—A review. Renew. Energy 2020, 145, 2271–2285. [Google Scholar] [CrossRef]
- Maciejowska, K. Assessing the impact of renewable energy sources on the electricity price level and variability—A quantile regression approach. Energy Econ. 2020, 85, 104532. [Google Scholar] [CrossRef]
- IRENA. Electricity Storage and Renewables: Costs and Markets to 2030; International Renewable Energy Agency: Abu Dhabi, United Arab Emirates, 2017. [Google Scholar]
- Amrouche, S.O.; Rekioua, D.; Rekioua, T.; Bacha, S. Overview of energy storage in renewable energy systems. Int. J. Hydrog. Energy 2016, 41, 20914–20927. [Google Scholar] [CrossRef]
- Ibrahim, H.; Ilinca, A.; Perron, J. Energy storage systems—Characteristics and comparison. Renew. Sustain. Energy Rev. 2008, 12, 1221–1250. [Google Scholar] [CrossRef]
- Olabi, A.G. Renewable energy and energy storage systems. Energy 2017, 136, 1–6. [Google Scholar] [CrossRef]
- Buhagiar, D.; Sant, T.; Farrugia, R.N.; Aquilina, L.; Farrugia, D.; Strati, F.M. Small-scale Experimental Testing of a Novel Marine Floating Platform with Integrated Hydro-Pneumatic Energy Storage. J. Energy Storage 2019, 24, 100774. [Google Scholar] [CrossRef]
- European Commission. Horizon 2020 Multiple-use-of Space for Island Clean Autonomy. Available online: https://cordis.europa.eu/project/id/862252 (accessed on 24 March 2024).
- Wang, J.; Lu, K.; Ma, L.; Wang, J.; Dooner, M.; Miao, S.; Li, J.; Wang, D. Overview of Compressed Air Energy Storage and Technology Development. Energies 2017, 10, 991. [Google Scholar] [CrossRef]
- Wang, H.; Wang, L.; Wang, X.; Yao, E. A novel pumped hydro combined with compressed air energy storage system. Energies 2013, 6, 1554–1567. [Google Scholar] [CrossRef]
- Camargos, T.P.; Pottie, D.L.; Ferreira, R.A.; Maia, T.A.; Porto, M.P. Experimental study of a PH-CAES system: Proof of concept. Energy 2018, 165, 630–638. [Google Scholar] [CrossRef]
- Odukomaiya, A.; Abu-Heiba, A.; Graham, S.; Momen, A.M. Experimental and analytical evaluation of a hydro-pneumatic compressed-air Ground-Level Integrated Diverse Energy Storage (GLIDES) system. Appl. Energy 2018, 221, 75–85. [Google Scholar] [CrossRef]
- White, F.M. Fluid Mechanics; McGraw-Hill: New York, NY, USA, 2011. [Google Scholar]
- Zardin, B.; Cillo, G.; Rinaldini, C.A.; Mattarelli, E.; Borghi, M. Pressure Losses in Hydraulic Manifolds. Energies 2017, 10, 310. [Google Scholar] [CrossRef]
- Moujaes, S.F.; Deshmukh, S. Three-Dimensional CFD Predications and Experimental Comparison of Pressure Drop of Some Common Pipe Fittings in Turbulent Flow. J. Energy Eng. 2006, 132, 61–66. [Google Scholar] [CrossRef]
- Stivala, D.; Rossi, M.; Renzi, M. Velocity profiles in a water jet of a Pelton nozzle: CFD simulations on both 2D and 3D geometries. IOP Conference Series. Earth Environ. Sci. 2021, 774, 12106. [Google Scholar]
- Zhang, J.; Xiao, Y.X.; Wang, J.Q.; Zhou, X.J.; Xia, M.; Zeng, C.J.; Wang, S.H.; Wang, S.W. Optimal design of a pelton turbine nozzle via 3D numerical simulation. IOP Conference Series. Earth Environ. Sci. 2018, 163, 12066. [Google Scholar]
- Aquilina, L.; Sant, T.; Farrugia, R.N. An experimental analysis for the charging cycle of a hydro-pneumatic energy storage system. In Proceedings of the 7th Offshore Energy and Storage Symposium (OSES 2023), St. Julians, Malta, 12–14 July 2023. [Google Scholar]
- Gupta, V.; Prasad, V.; Khare, R. Numerical simulation of six jet Pelton turbine model. Energy 2016, 104, 24–32. [Google Scholar] [CrossRef]
- Mathworks. Simulink. Available online: https://uk.mathworks.com/products/simulink.html (accessed on 24 March 2024).
- Neutrium. Absolulte Roughness of Pipe Materials. Available online: https://neutrium.net/fluid-flow/absolute-roughness-of-pipe-material/ (accessed on 24 March 2024).
- Burt, M.; Piao, X.; Gaudi, F.; Busch, B.; Taufik, N.F. Electric Motor Efficiency under Variable Frequencies and Loads. J. Irrig. Drain. Eng. 2008, 134, 129–136. [Google Scholar] [CrossRef]
Disclaimer/Publisher’s Note: The statements, opinions and data contained in all publications are solely those of the individual author(s) and contributor(s) and not of MDPI and/or the editor(s). MDPI and/or the editor(s) disclaim responsibility for any injury to people or property resulting from any ideas, methods, instructions or products referred to in the content. |
© 2024 by the authors. Licensee MDPI, Basel, Switzerland. This article is an open access article distributed under the terms and conditions of the Creative Commons Attribution (CC BY) license (https://creativecommons.org/licenses/by/4.0/).