Abstract
Natural convection heat transfer from an inclined array of square cross-section cylinders is experimentally studied. Three cylinders of side length D = 0.02 m and 1 m length are used to form the inclined array. Three-cylinder axis inclination angles to the horizontal of 30°, 45°, and 60° are considered. The cylinders are heated using an internal heating element of constant heat flux. Surface temperatures are measured along the three surfaces of each cylinder; upper, lower, and the front side at nine points spaced evenly by 10 cm. The local circumference average temperature is obtained at each point. Four center-to-center distances to side length S/D = 1.25, 1.75, 2.25, and 2.75 are used. Local Nusselt numbers and the modified Rayleigh numbers are obtained for each cylinder at each circumference averaged temperature point. Results show that the lower cylinder heat transfer is least affected by the array compared to that of its single one followed by the middle and the upper cylinder for all S/D and the inclination angles used. The Nusselt number is degraded from that of the single cylinder at a small S/D and that degradation decreases as the S/D increases for all angles. It is observed that the Nusselt number enhances at the small cylinder axis tilt angle of 30°, followed by 45°, and 60°, especially at high modified Rayleigh numbers. New novel general empirical correlations for Nusselt numbers are obtained for each S/D using the cylinder axis tilt angle, the modified Rayleigh numbers, and the cylinder number in the array as parameters. A new general correlation is obtained for the array using the modified Rayleigh number, S/D, the cylinder axis tilt angle, and the cylinder sequential order number as parameters. These new correlations will help any engineering applications using such a configuration of the array.
1. Introduction
Free convection heat transfer from heated objects such as cylinders, plates, and many others has multiple uses in engineering; for example, in solar collected technology, heat exchangers, electronic cooling devices, nuclear reactors, and many other applications. Natural convection heat transfer from heated vertical arrays of horizontal cylinders in air was reported experimentally by Marsters [1]. In his experiment, the effect of different cylinder spacing on natural convection was obtained with three, five, and nine cylinders. His results showed that the surface temperature of the cylinders increased downstream at a small center-to-center distance but decreased at a large distance, and that the lower cylinder Nusselt number is almost the same as its single one. However, the other downstream cylinders had significant differences between their single ones. Sparrow and Niethammer [2], have experimentally studied the heat transfer effect on the upper cylinder in two horizontal cylinders in a vertical array. Different center-to-center distances were used at high Rayleigh numbers, and they play a vital role in the degradation or enhancement of the heat transfer from the upper cylinder. It was observed that the Nusselt number reached its maximum at a separation distance between seven and nine in the cylinder diameter. Many authors have attacked such a problem in different geometric types of horizontal or vertical arrays. Sadeghipour and Asheghi [3] have reported results of experimental work of free convection from a vertical array of isothermal horizontal cylinders between two and eight at low Rayleigh numbers. Their results showed that the downstream cylinder heat transfer either enhanced or degraded depending on the location of the cylinder in the array and the geometry of the array. A general correlation was developed using Rayleigh numbers, spacing distance, and the number of cylinders as parameters. Corcione [4] has developed a numerical correlation for any cylinder in the array of isothermal vertical cylinders in the air, and also for the whole array. His study was conducted for variable center-to center-distance and the result shows that the heat transfer from the downstream cylinder depended on its position in the array and the number of cylinders used in each array. Laminar natural convection from a vertical array of isothermal horizontal elliptic cylinders was studied experimentally by Yousefi and Ashjaee [5]. Their results showed that the heat transfer from each cylinder in the array depended on the separation distance, Rayleigh number, and the position of the cylinder in the array. An empirical correlation was found for every single cylinder in the array.
Free convection heat transfer from one and two cylinders oriented horizontally in water was studied experimentally by Reymond et al. [6]. The results showed that the plume rising from the lower cylinder had an enhancing effect on the upper cylinder. D’Orazio and Fontana [7] have experimentally investigated the natural convection from two vertical arrays of horizontal cylinders in the air using the Schlieren technique. They observed that each cylinder might have reduced or enhanced the Nusselt number compared to that of its single one, which depends on its location, the geometry of the array, and the Rayleigh number. Grafsrønningen and Jensen [8] have reported an experimental work on natural convection from two different Rayleigh numbers using three heated horizontal cylinders in a vertical array form. Their results showed that the Nusselt numbers of the middle cylinder increased compared to that of the lower one for all separation distances used. However, the Nusselt numbers of the upper cylinder increased compared to that of the lower cylinder but decreased compared to the values of the middle cylinder. Shyam et al. [9] have numerically investigated the laminar natural convection from two cylinders oriented vertically in power-law fluids. The average Nusselt number of the upper cylinder was found to be dependent on the center-to-center distance between the cylinders, Grashof numbers, and the power-law index. Natural convection from two attached horizontal cylinders forming a vertical array was studied numerically by Liu et al. [10]. Their results in the form of isothermal and streamlined contours, average Nusselt numbers were reported at various Rayleigh numbers. They have also suggested numerical correlations for the single cylinders and the whole array. Ali et al. [11] investigated the effect of tube location in a vertical array of horizontal cylinders of square cross-section on natural convection heat transfer. They have studied the effect of center-to-center distance on the heat transfer from each tube in the array. Nusselt number experimental correlations were developed for each tube in the array. Razzaghpanah et al. [12] have numerically studied free convection heat transfer from a horizontal row of isothermally heated cylinders in molten solar salt. They proposed correlations for the average Nusselt number as a function of the Rayleigh number and the cylinder center-to-center distance spacing. Free convection heat transfer from a vertical array of horizontally heated cylinders was reported numerically by Cianfrini et al. [13]. The array, which was formed of two cylinders, was immersed inside a water-filled rectangular enclosure, which was cooled at the sides. Their study showed that the maximum heat transfer was obtained at an optimum cylinder spacing at any Rayleigh number. Goswami et al. [14] have numerically studied an array of two cylinders subject to low Rayleigh numbers. Those cylinders were confined inside an enclosure with non-uniformly cooled side walls. Their results showed Nusselt numbers dependent on the distance between the two cylinders and the value of the Rayleigh numbers. A triangular array of three isothermal horizontal cylinders has been studied by Gibbons et al. [15] in two different positions in the water. Their study focused on the plume interaction between the cylinders in the two different positions. Alsuhaibani et al. [16] have recently reported the effect of center-to-center distance of vertical square tubes, which form a horizontal array, on natural convection heat transfer in air. They obtained different experimental correlations for each tube at different center-to-center distances and reported an overall correlation using the distance and the modified Rayleigh numbers as parameters. Olayemi et al. [17] studied numerically the effect of tilt angle, aspect ratio, and the Rayleigh numbers of heated rectangular cylinders inside cold square enclosures on free convection heat transfer and fluid flow. Their results showed that heat transfer was generally enhanced for increasing Rayleigh number, aspect ratio, and orientation angle. The inclination angle of the objects affects the buoyancy force, which plays a vital role in natural convection heat transfer from such objects. The literature survey above shows that there are very few papers discussing the role of inclined arrays of cylinders in heat transfer. Therefore, the current study focuses on the effect of the inclination angle on the natural convection heat transfer from an inclined array of square cross-sections. The heat transfer mechanism is discussed, and new novel empirical correlations are obtained for each square cylinder and a newer general overall correlation for the array is obtained, which is necessary for any engineering applications using such configurations.
2. Experimental Test Rig
Figure 1a shows a schematic of the experimental test rig and Figure 2a shows the real picture of it. Two-cylinder holders (Figure 2c–e), upper and lower (shown in black in Figure 2a) are designed to accommodate the three inclined square cylinders, forming an array. Wood spacers are used inside the holder to keep the separation distance between the cylinders as shown in Figure 2c. Each holder has a screw bolt welded from one side to the holder and fixed with a nut to one of the moving bars from the other side as shown in Figure 2e–g. The objective of the moving bars is to enable horizontal adjustment according to each angle of the array. The moving bars have holes to allow for the cylinder holder’s bar to be fixed with it through the nut to adjust the required tilt angle. Three-cylinder axis tilt angles (ϕ) of 30°, 45°, and 60° are studied. It should be noted that the array tilt angle measured from the negative horizontal axis ψ is related to the cylinder tilt angle through as shown in Figure 1c, or it could be interpreted as from the positive horizontal axis. In addition to that, only the plane of the tube array perpendicular to the horizontal plane is considered in this study. Each cylinder has a square cross-section of side 0.02 m, an area of 0.0004 m2, and is equipped with a central heating element (H) that has an exterior diameter of 0.0066 m Figure 1b,d. The cylinders are made of polished mild steel (grade SS15-5ph) and have a length of 1 m. The cylinders have a uniform wall thickness of 0.002 m. Each cylinder is sealed at its ends using Bakelite, a material with a thermal conductivity of 0.15 W/(m K) [18], to reduce any possible heat transfer loss along its axis. Each Bakelite end has a thickness of 2.06 cm. The cylinders are filled with sand to facilitate consistent lateral heat conduction from the heating source to the outer surface of the cylinder (Figure 1b). Surface temperature data were collected at nine evenly spaced spots on each cylinder, with a distance of 0.1 m between each point. The measurements are obtained on three distinct surfaces: lower, upper, and front or back side (due to symmetry). This is depicted in Figure 1d. Therefore, each square cylinder is equipped with a total of 27 calibrated self-adhesive type K thermocouples (Chromel/Alumel) that were securely attached. In addition, two thermocouples are fixed to the outer surface of the Bakelite ends, while two other thermocouples are introduced inside the Bakelite material, positioned in line with its inner surface at each end of the cylinder. An additional thermocouple is employed to measure the surrounding air temperature. The cylinders are positioned at intervals (S) of 2.5, 3.5, 4.5, and 5.5 cm (Figure 1c). The array of cylinders is fixed with the moving bars, and in turn, the moving bars are fixed with the stand of a fixed frame as shown in Figure 2f. The setup is in a controlled room environment measuring 4.4 × 3.0 m2. The room was devoid of windows, air conditioning, or ventilation openings, and had only one entrance covered by a thick curtain to restrict forced air convection. The experiment investigates different S/D ratios, specifically 1.25, 1.75, 2.25, and 2.75. The surface temperatures are obtained by a 94-channel data-gathering system that is connected to a computer. These temperatures are then utilized for subsequent analysis. The voltage regulator is used to adjust the electrical power input to the heating element (H) of each tube. A wattmeter is used to measure the power consumption of each cylinder, taking into account losses due to axial conduction and radiation. This information is then used to compute the heat flux per unit surface area of the cylinder. The input power is controlled to maintain the tube surface temperature below 100 °C. Figure 2b shows a close-up section showing the cylinders and the attached thermocouples.
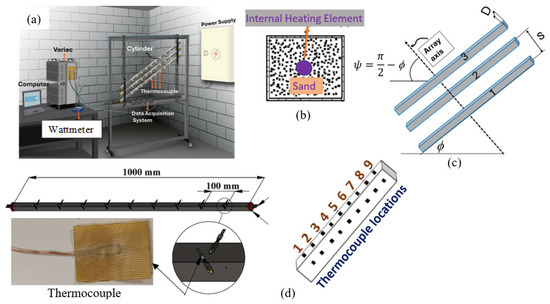
Figure 1.
Experimental setup: (a) schematic of the experimental test rig, (b) cross-section of the cylinder showing the sand and the inside heater, (c) sequential order of the cylinder in the array 1, 2, and 3, and (d) thermocouple locations, sequential order, and shape.
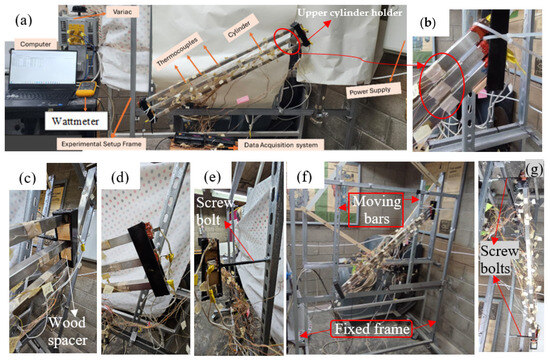
Figure 2.
Real photo of the experimental setup: (a) all components, (b) close-up section of the thermocouples, (c) left side view of the cylinder holder, (d) front view, (e) right view, (f) fixed and moving frames of the setup, and (g) top view of the array showing the screw bolts.
3. Experimental Analysis
Uniform heat generation occurs inside each cylinder and is mainly dispersed through convection and radiation at the outer surface. Additionally, a portion of the heat is carried by conduction through the end caps constructed of Bakelite. The quantitative expression of this phenomenon is represented by Equation (1).
The heat fluxes from the surface of the cylinder, resulting from convection and radiation, are denoted as and , respectively. Equations (2) and (3) provide a full explanation of the measurement of heat flux caused by radiation () and the conductive heat loss through the Bakelite end caps ).
The variables and in Equation (3) correspond to the temperatures recorded at the inner and outer surfaces of the Bakelite end plates, respectively. The characters kbk and δ represent the thermal conductivity and thickness of Bakelite, respectively. The calculation of the radiative heat flux, represented as , involves calculating the average surface temperature of each heat flux on the cylinder, and T∞ is the absolute surrounding temperature. Moreover, the surface emissivity (ε) of the cylinder is approximated to be 0.27 [19] for polished mild steel. Furthermore, stand for the Stefan–Boltzmann constant and the shape factor between each tube and the ambient, and γ = 1 for the lower and the upper cylinders and 2 for the middle cylinder. Equation (4) presents the shape factor between two long parallel tubes [19]. As suggested by [1], it assumes that neighboring tubes are in radiant balance since the radiation exchange between similar cylinders is small and will be neglected and the net exchange is considered with the room walls. The estimated amount of radiation heat transfer is obtained at most, 29% of the total heat flux. This study assesses the convection heat transfer coefficient for axial heat transfer, which is averaged over the circumference temperature. Equation (6) determines the circumference average surface temperature at a specific longitudinal station i along the cylinder axis at each heat flux.
The variable “j” denotes the sequence number of each thermocouple that is circumferentially positioned at a particular station i on the exterior of the cylinder and i changes from 1 to 9. The physical properties are obtained at the local arithmetic mean surface temperature along the axial axis for each distinct heat flux.
According to the above temperature distribution, there are nine values at each heat flux for each cylinder in the array, and represents the laboratory ambient temperature, which is between 18 and 25 °C. The local heat transfer coefficient, abbreviated as , can be determined as the average of the axial circumference for each tube.
Therefore, the dimensionless Nusselt and modified Rayleigh numbers can be calculated using Equation (9), where the local distance x along the cylinder axis is used as a characteristic length.
4. Experimental Uncertainties
Experimental uncertainties are estimated using primary measurement uncertainties. The uncertainties stem from the assessment of emissivity, measurement of temperature, and computation of surface area, with respective errors of ±0.02, ±0.5 °C, and ±0.003 m2. The documentation for the wattmeter states that the accuracy of voltage measurement is 0.5% of the reading ±2 counts, with a resolution of 0.1 V. The accuracy of the current measurement is specified as 0.7% of the reading ±5 counts, with a resolution of 1 mA and an additional 1 mA. It is crucial to highlight that, for every heat flux, a total of 40 temperature measurement scans were performed utilizing the data collecting equipment, and the outcomes were averaged. The uncertainty in the results was determined using the approach suggested by Kline and McClintock [20] and Moffat [21]. Table 1 displays the highest levels of uncertainty linked to the computed outcomes.

Table 1.
Maximum percentage uncertainties of specified parameters.
5. Result and Discussion
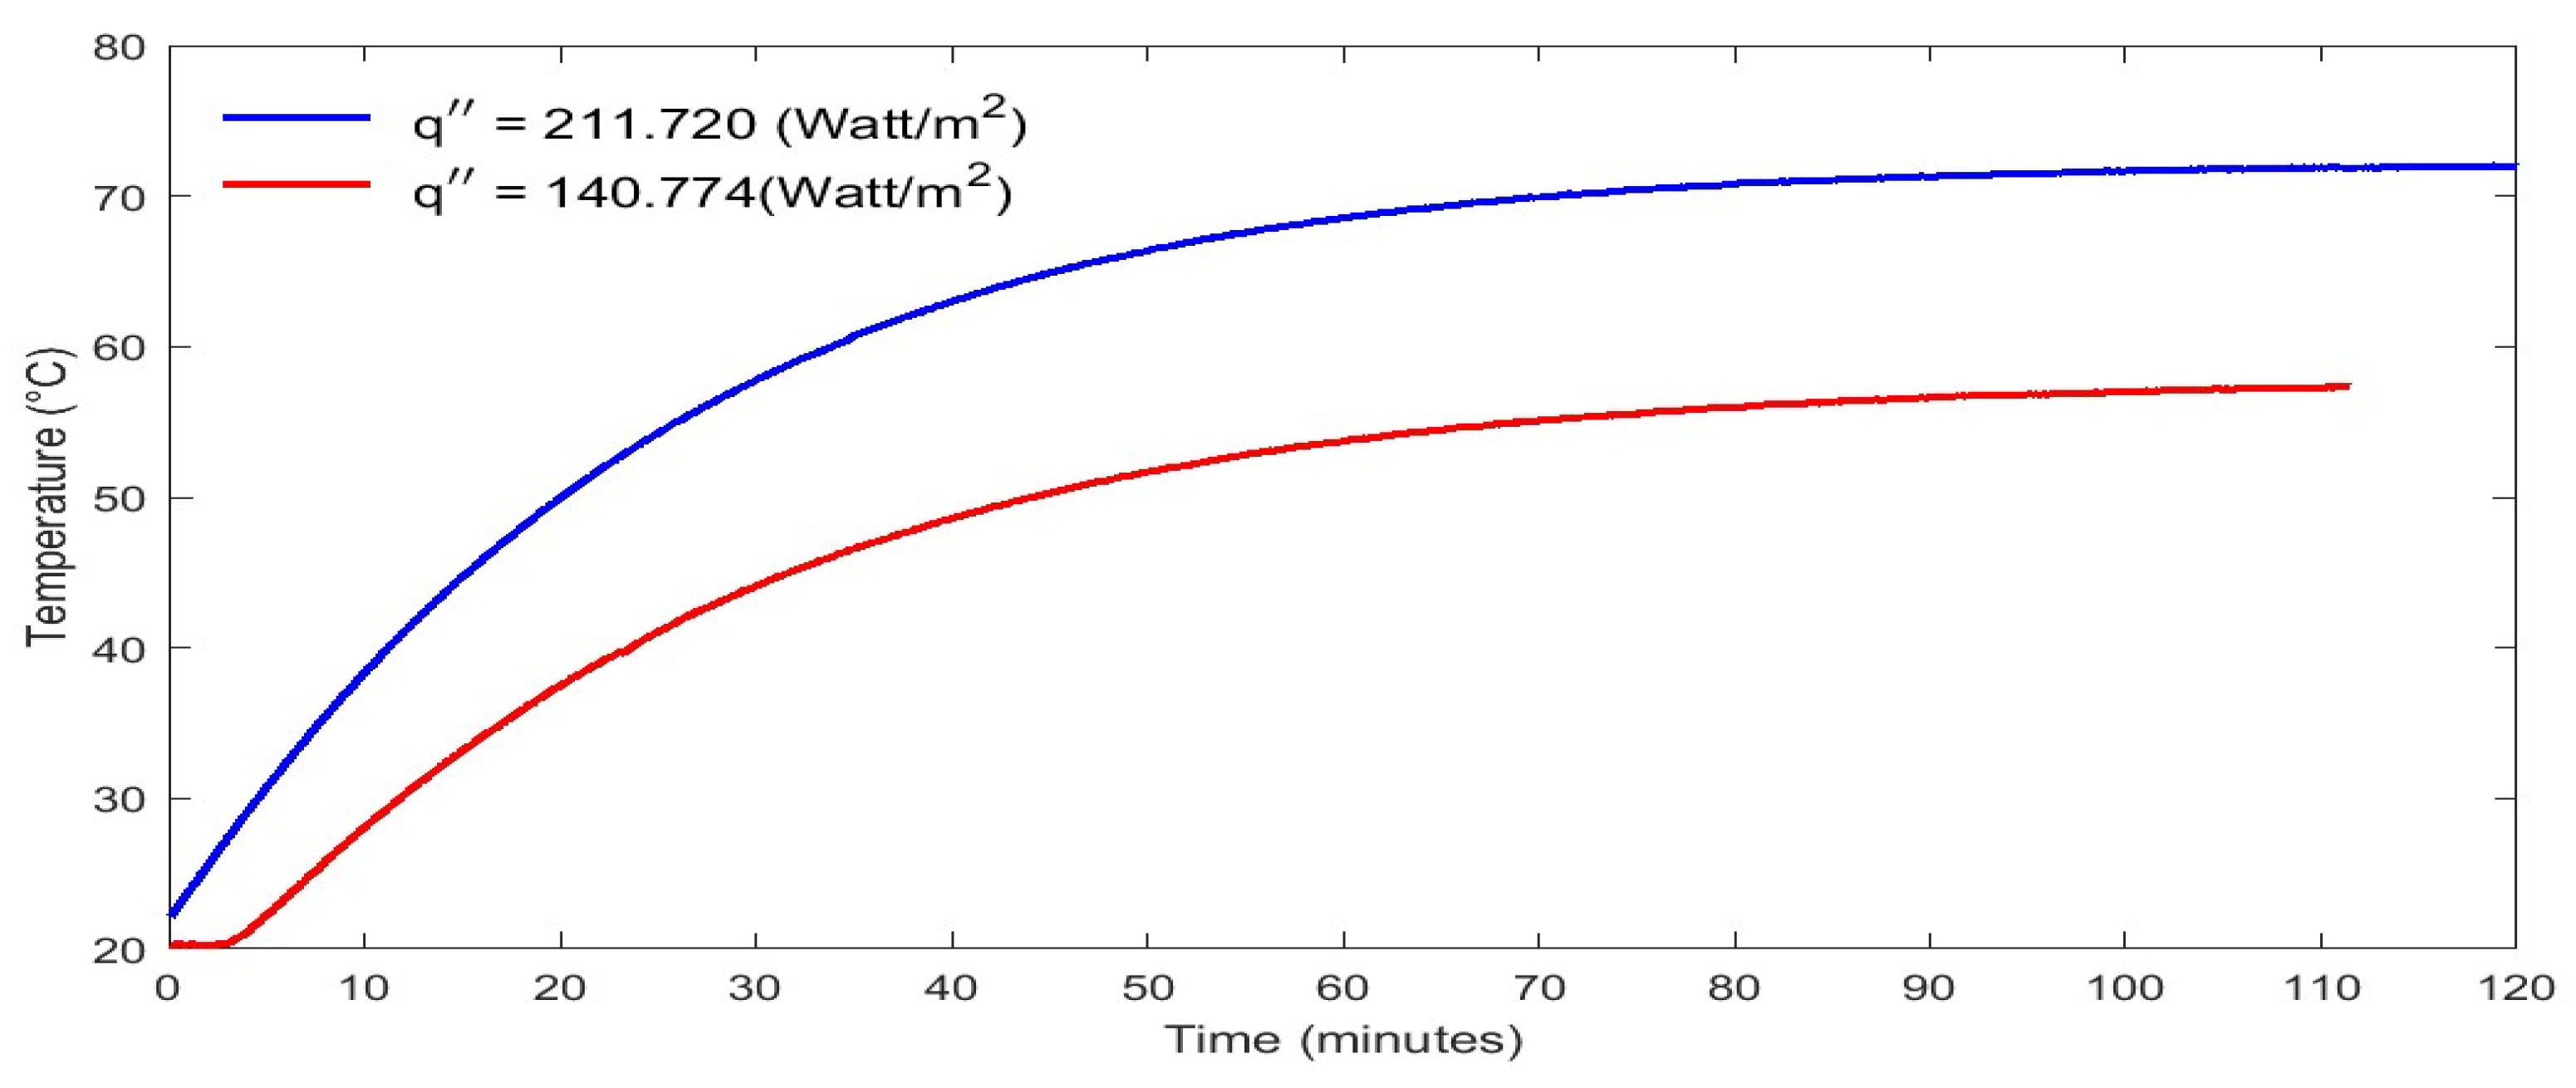
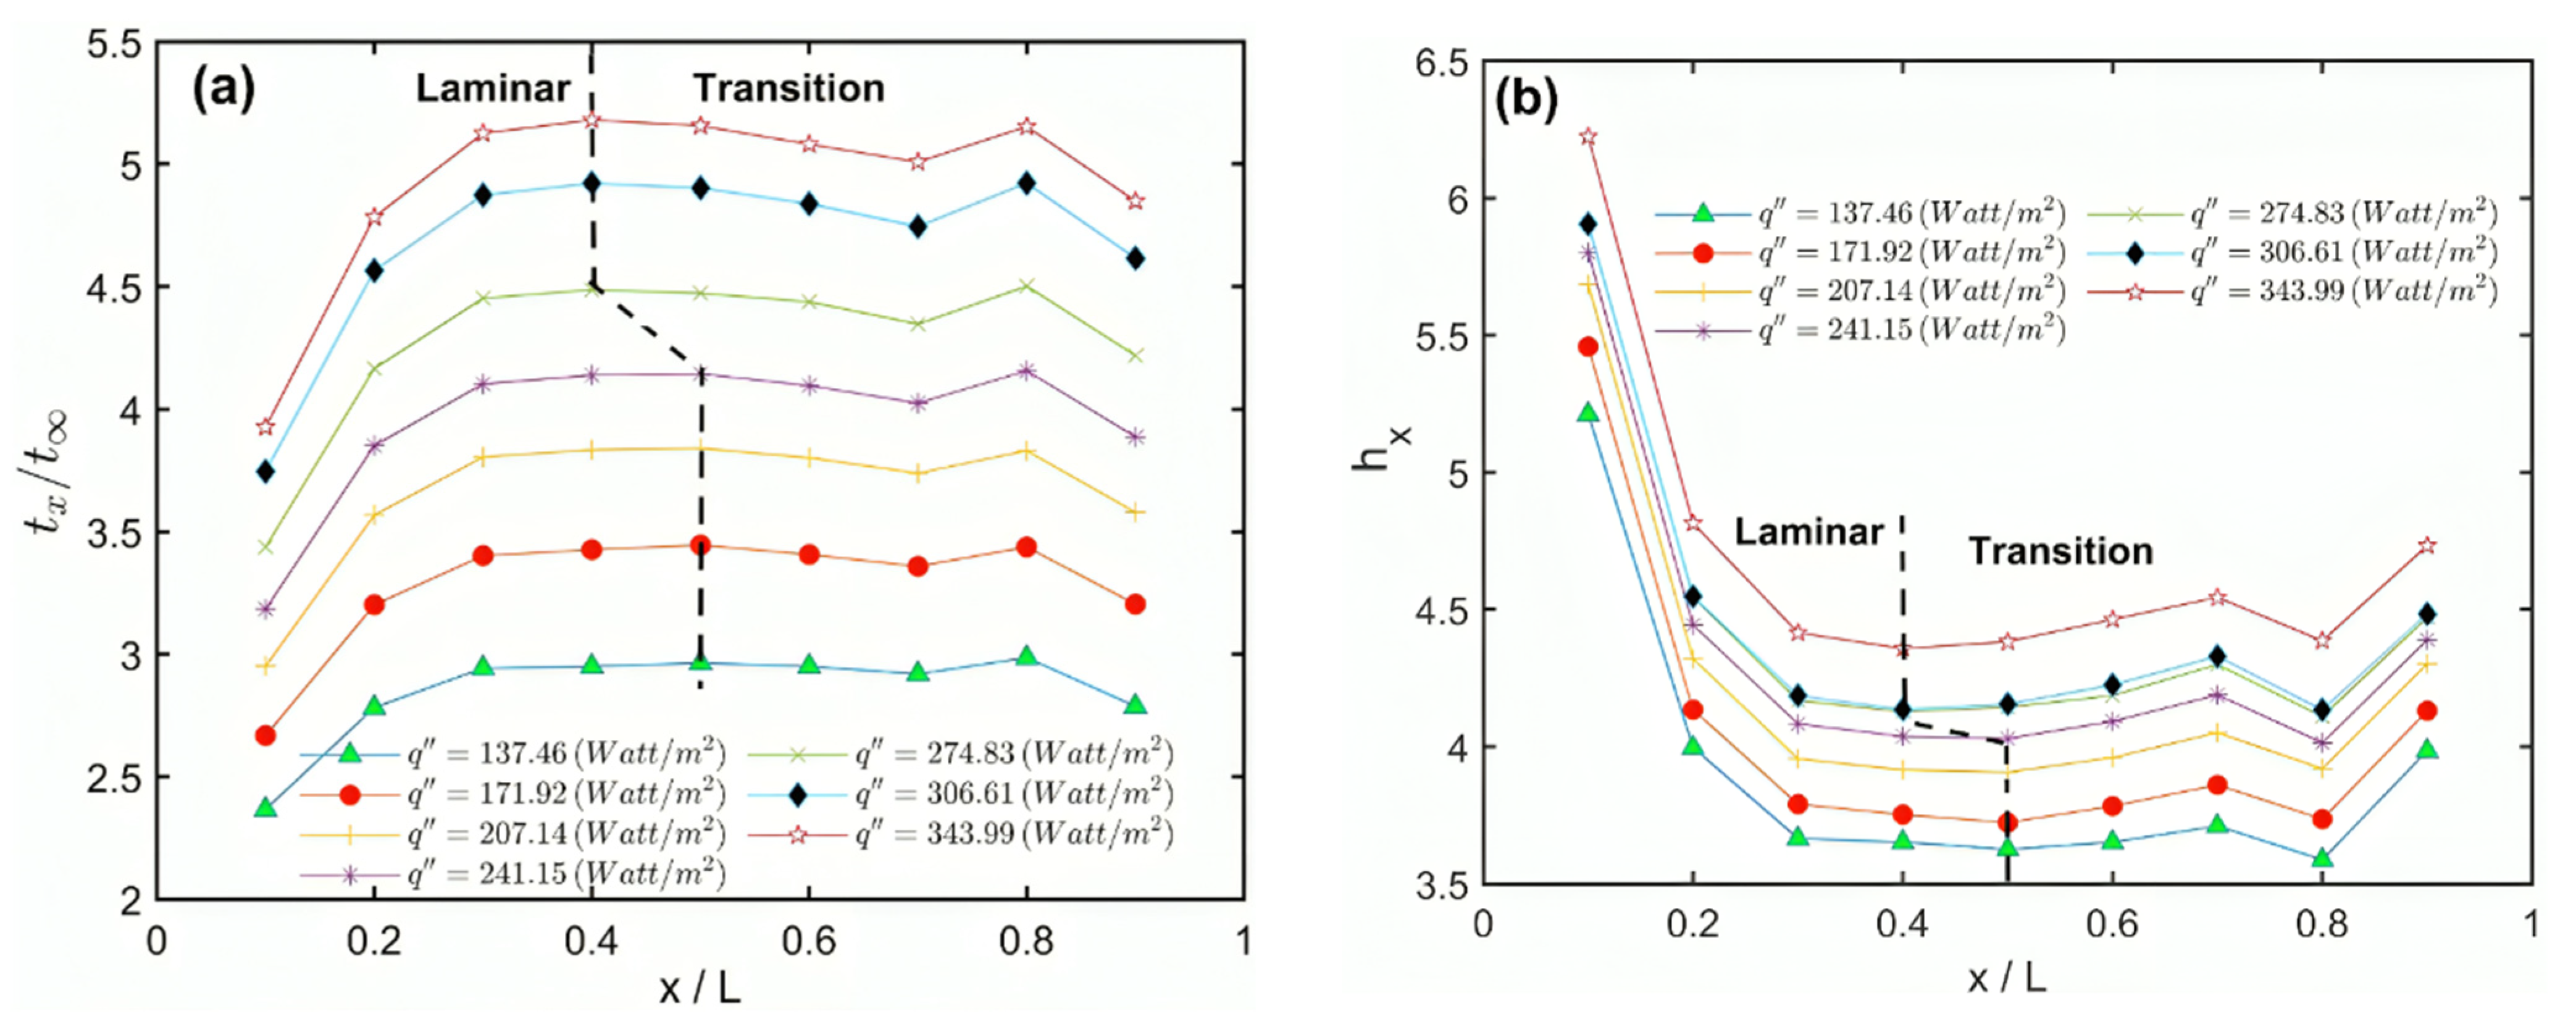
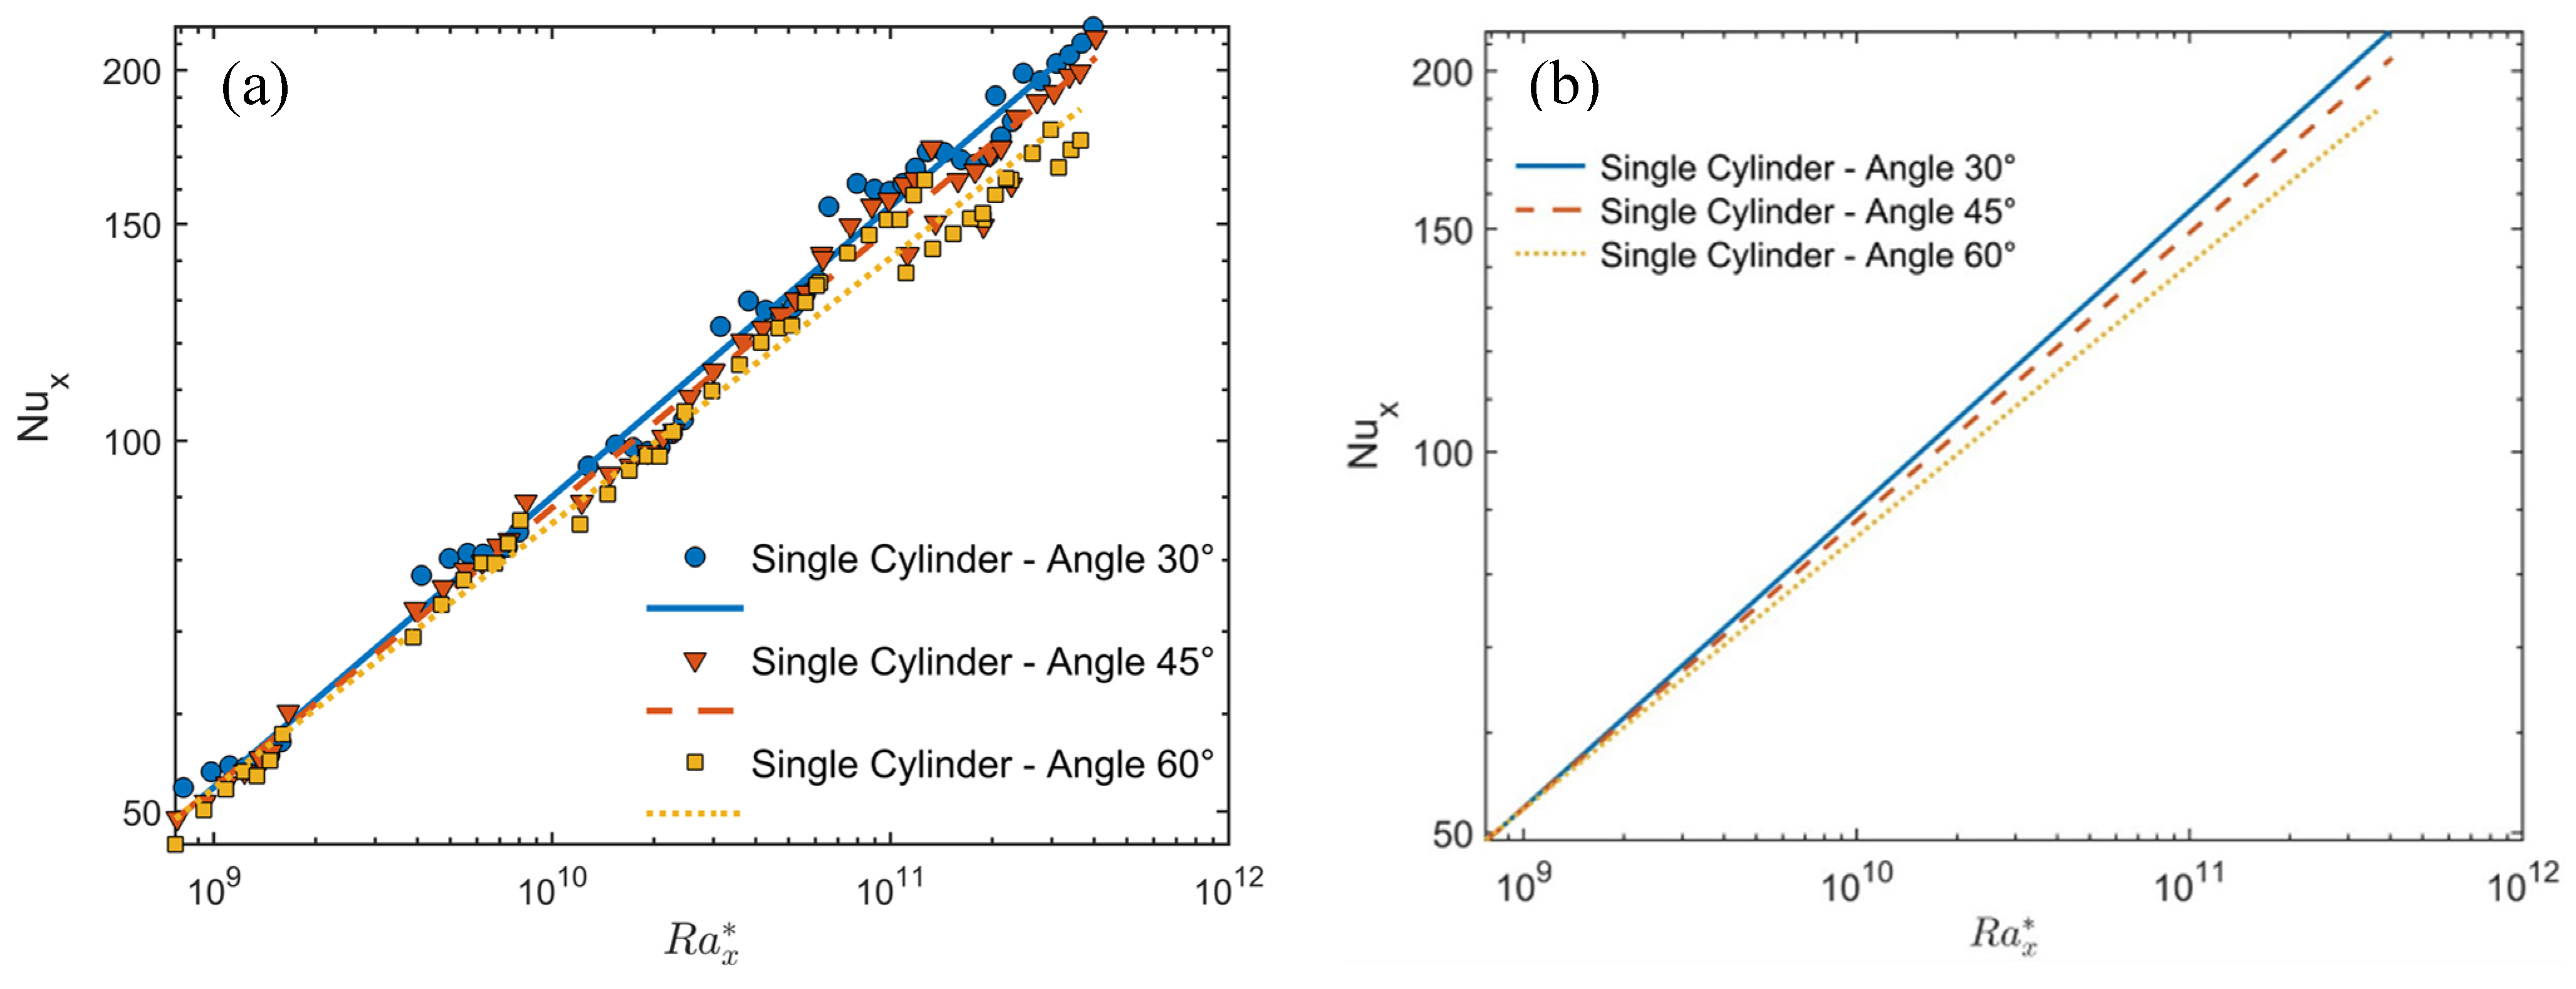
The temperature readings are taken after the system of the inclined array reaches a steady state. Therefore, Figure 3 shows the steady-state temperature condition at two different heat fluxes. It seems that the system takes about 100 min to reach the steady state condition. Figure 4a,b shows the circumference averaged temperature and heat transfer coefficient profiles, respectively, at different heat fluxes of cylinder number 1 (upper cylinder) in the array at a 60° angle of inclination. It should be noted that the axial temperature is normalized by the ambient temperature, which appears in the vertical axis of Figure 4a. Figure 4a indicates that the temperature increases up to a maximum value (dashed line) and then slightly decreases due to the end effects. The temperature is almost uniform between the dimensionless axial coordinate (0.2 ≤ x/L ≤ 0.7). The local heat transfer coefficient shown in Figure 4b decreases up to a minimum critical point (dashed line) and then slightly increases. The region on the left of the dashed line presents a laminar regime and the region on the right presents the transition regime, as is discussed in detail later. Table 2 shows the modified Rayleigh numbers, heat flux by convection, and radiation at these critical points shown in Figure 4a,b. Figure 5a,b show the local axial circumference averaged Nusselt numbers Nux for the single square cylinder versus the axial modified Rayleigh numbers . In this figure, each profile presents a single cylinder when it existed alone (not in the array of cylinders) at a specified tilt angle of 30°, 45°, or 60°. Figure 5a shows the experimental data point at each angle with the curve fitting at each angle and Figure 5b shows the curve fitting at each angle without the experimental data points for clarity. The curve fitting correlation for the single cylinder at each angle is obtained and listed in Table 3. Table 3 shows also the overall correlation using the cylinder axis tilt angle as a parameter. It should be noted that these correlations will be taken as references for comparisons with the same cylinder when it exists in the array to clarify the degradation in Nux due to the other cylinders, which will be spaced according to different S/D ratios. This figure indicates that increasing the tilted angle degrades the Nusselt numbers, especially at high Rayleigh numbers. Table 3 shows this degradation at = 4 × 10¹¹ from that at 30°. Figure 6 shows the percentage difference between the predicted overall correlation (4) of the single cylinder at all angles and the experimental data. This figure indicates that the difference is in the range of ±10% to the ideal fit.
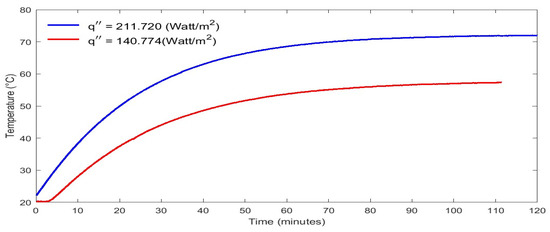
Figure 3.
Steady-state condition at two different heat fluxes.
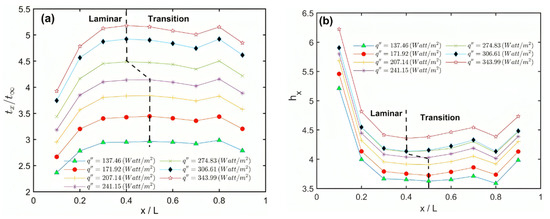
Figure 4.
Natural convection profiles at various heat fluxes along the inclined axial direction: (a) normalized surface temperature and (b) heat transfer coefficient (W/m2 K).
Table 2.
Important parameters at the critical points shown in Figure 4a,b.
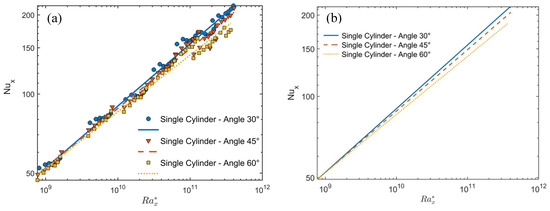
Figure 5.
Circumference averaged Nusselt numbers Nux versus the axial modified Rayleigh numbers for the single cylinder at different inclination angles. (a) Experimental data points and curve fitting lines, and (b) curve fitting lines with no data for clarity.
Table 3.
Correlations for single cylinders at different tilt angles and the overall correlation for 1 × 10⁹ ≤ ≤ 4 × 10¹¹.
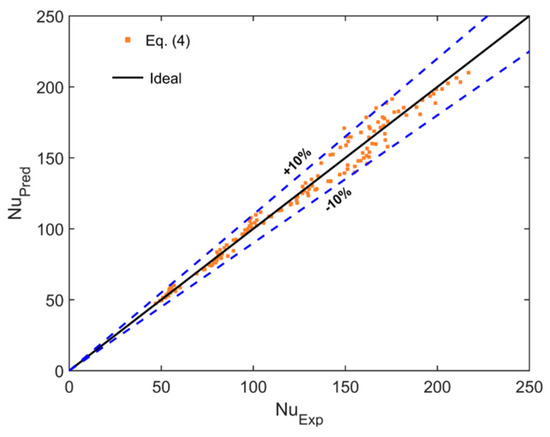
Figure 6.
Percentage difference between the predicted and the experimental Nusselt numbers.
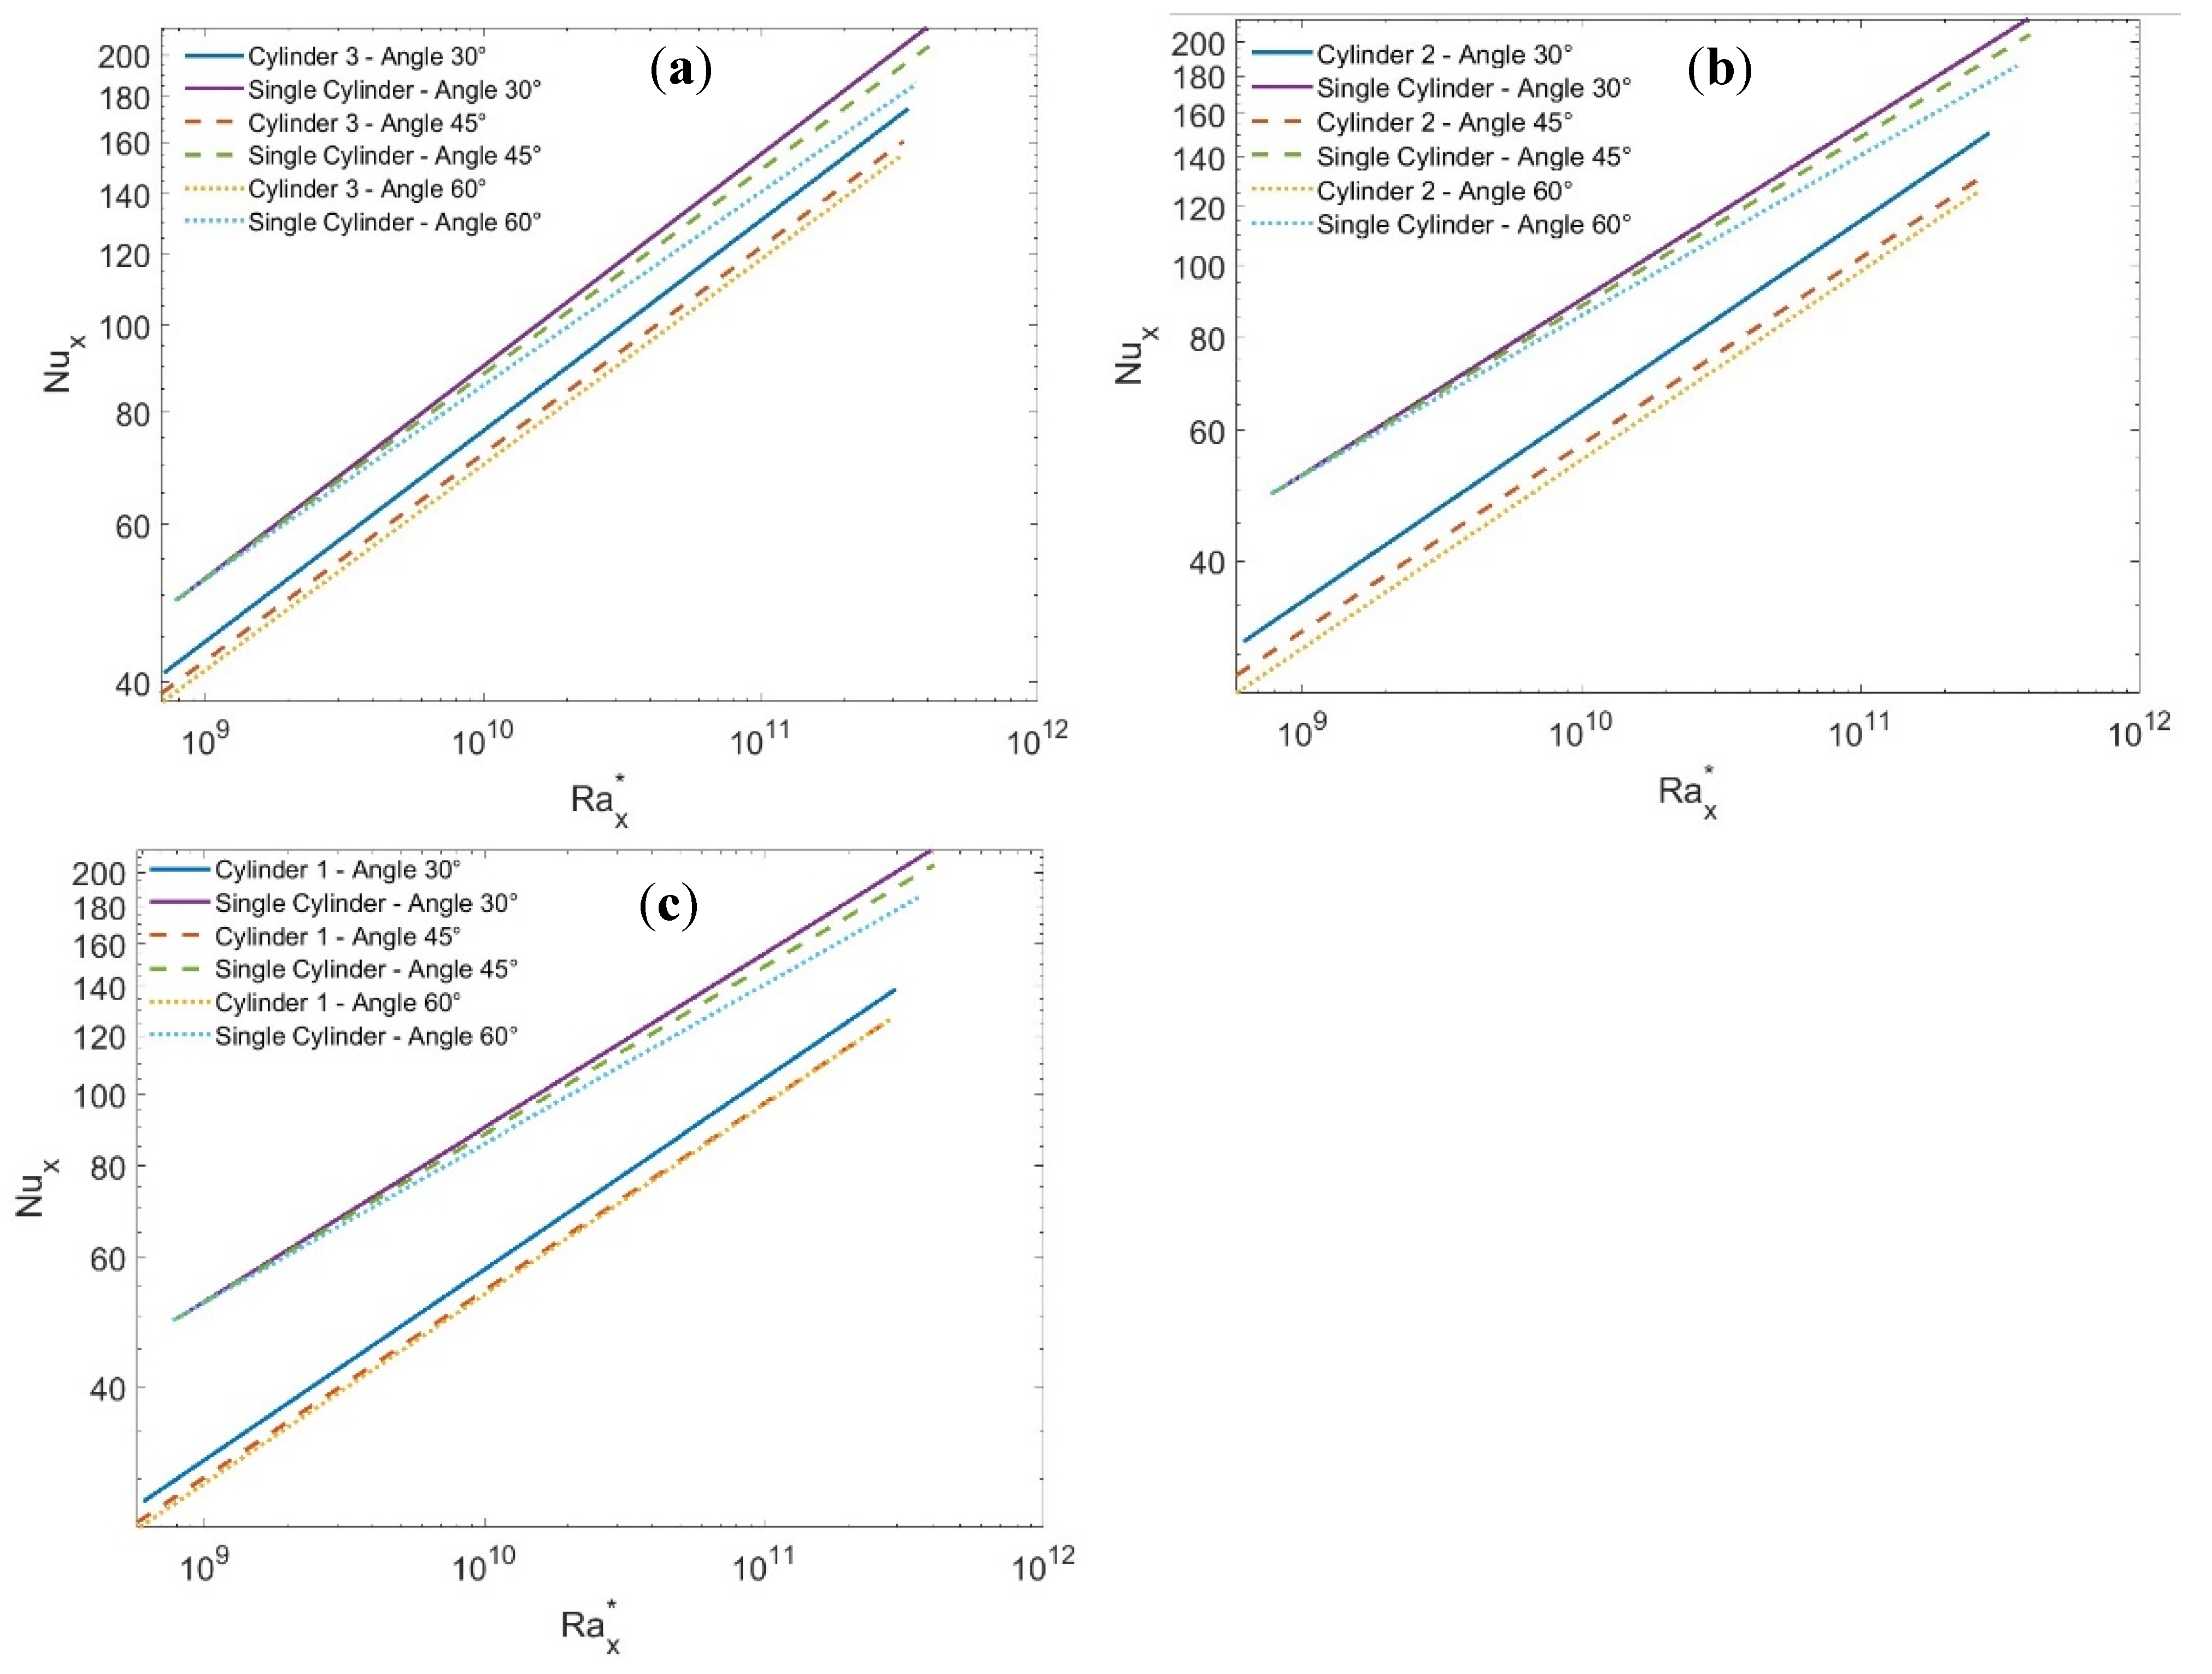
Figure 7 shows the experimental data values of Nux versus at S/D = 1.25 for each cylinder of the array at the three-cylinder axis tilt angles 30°, 45°, and 60° with their curve fitting. Furthermore, the data for a single cylinder only are also included in the figure to show the degradation effect on the value of Nux due to the position of the cylinder in the array either at the top (cylinder #1, Figure 7a), the middle (cylinder #2, Figure 7b), or the bottom (cylinder #3, Figure 7c). It is noticed that the Nnx profiles for cylinder number 3 are closer to that of the single cylinder followed by cylinder number 2 and 3, respectively, for all angles. Moreover, the sequential order of the angle is led by 30° and followed by 45°, and 60°, for all cylinders.
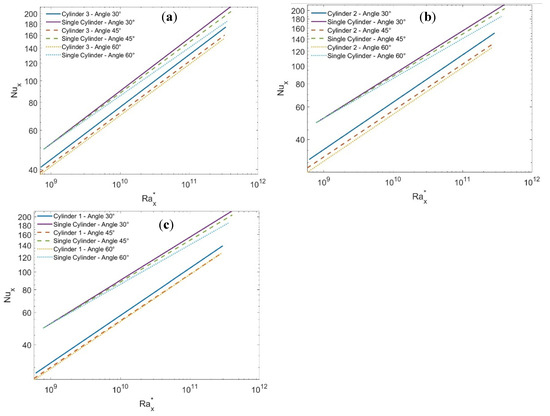
Figure 7.
Nusselt numbers versus the modified Rayleigh numbers at different tilt angles for S/D = 1.25 compared to that of a single cylinder: (a) cylinder number 1, (b) cylinder number 2, and (c) cylinder number 3.
The physical interpretation of that is related to the competition between the thermal boundary layer (TBL) accumulated at each cylinder and the natural convection velocity (NCV) created by the rising plume. The first tends to degrade the heat transfer from that cylinder and the latter tends to enhance it. For cylinder number 3, which is subject to the double effect of TBL, one is from its upper surface and the other is from the lower surface of the middle cylinder (in the case of a small S/D ratio) in addition to the TBL from its lower surface. The effect of these two competing components depends on the S/D ratio at each angle, which tends to lower the degradation effect as the S/D increases. Based on that, the profiles of Nux for cylinder 3 are closer to its single (Figure 7c), followed by cylinder number 2 (Figure 7b), and number 1 (Figure 7a).
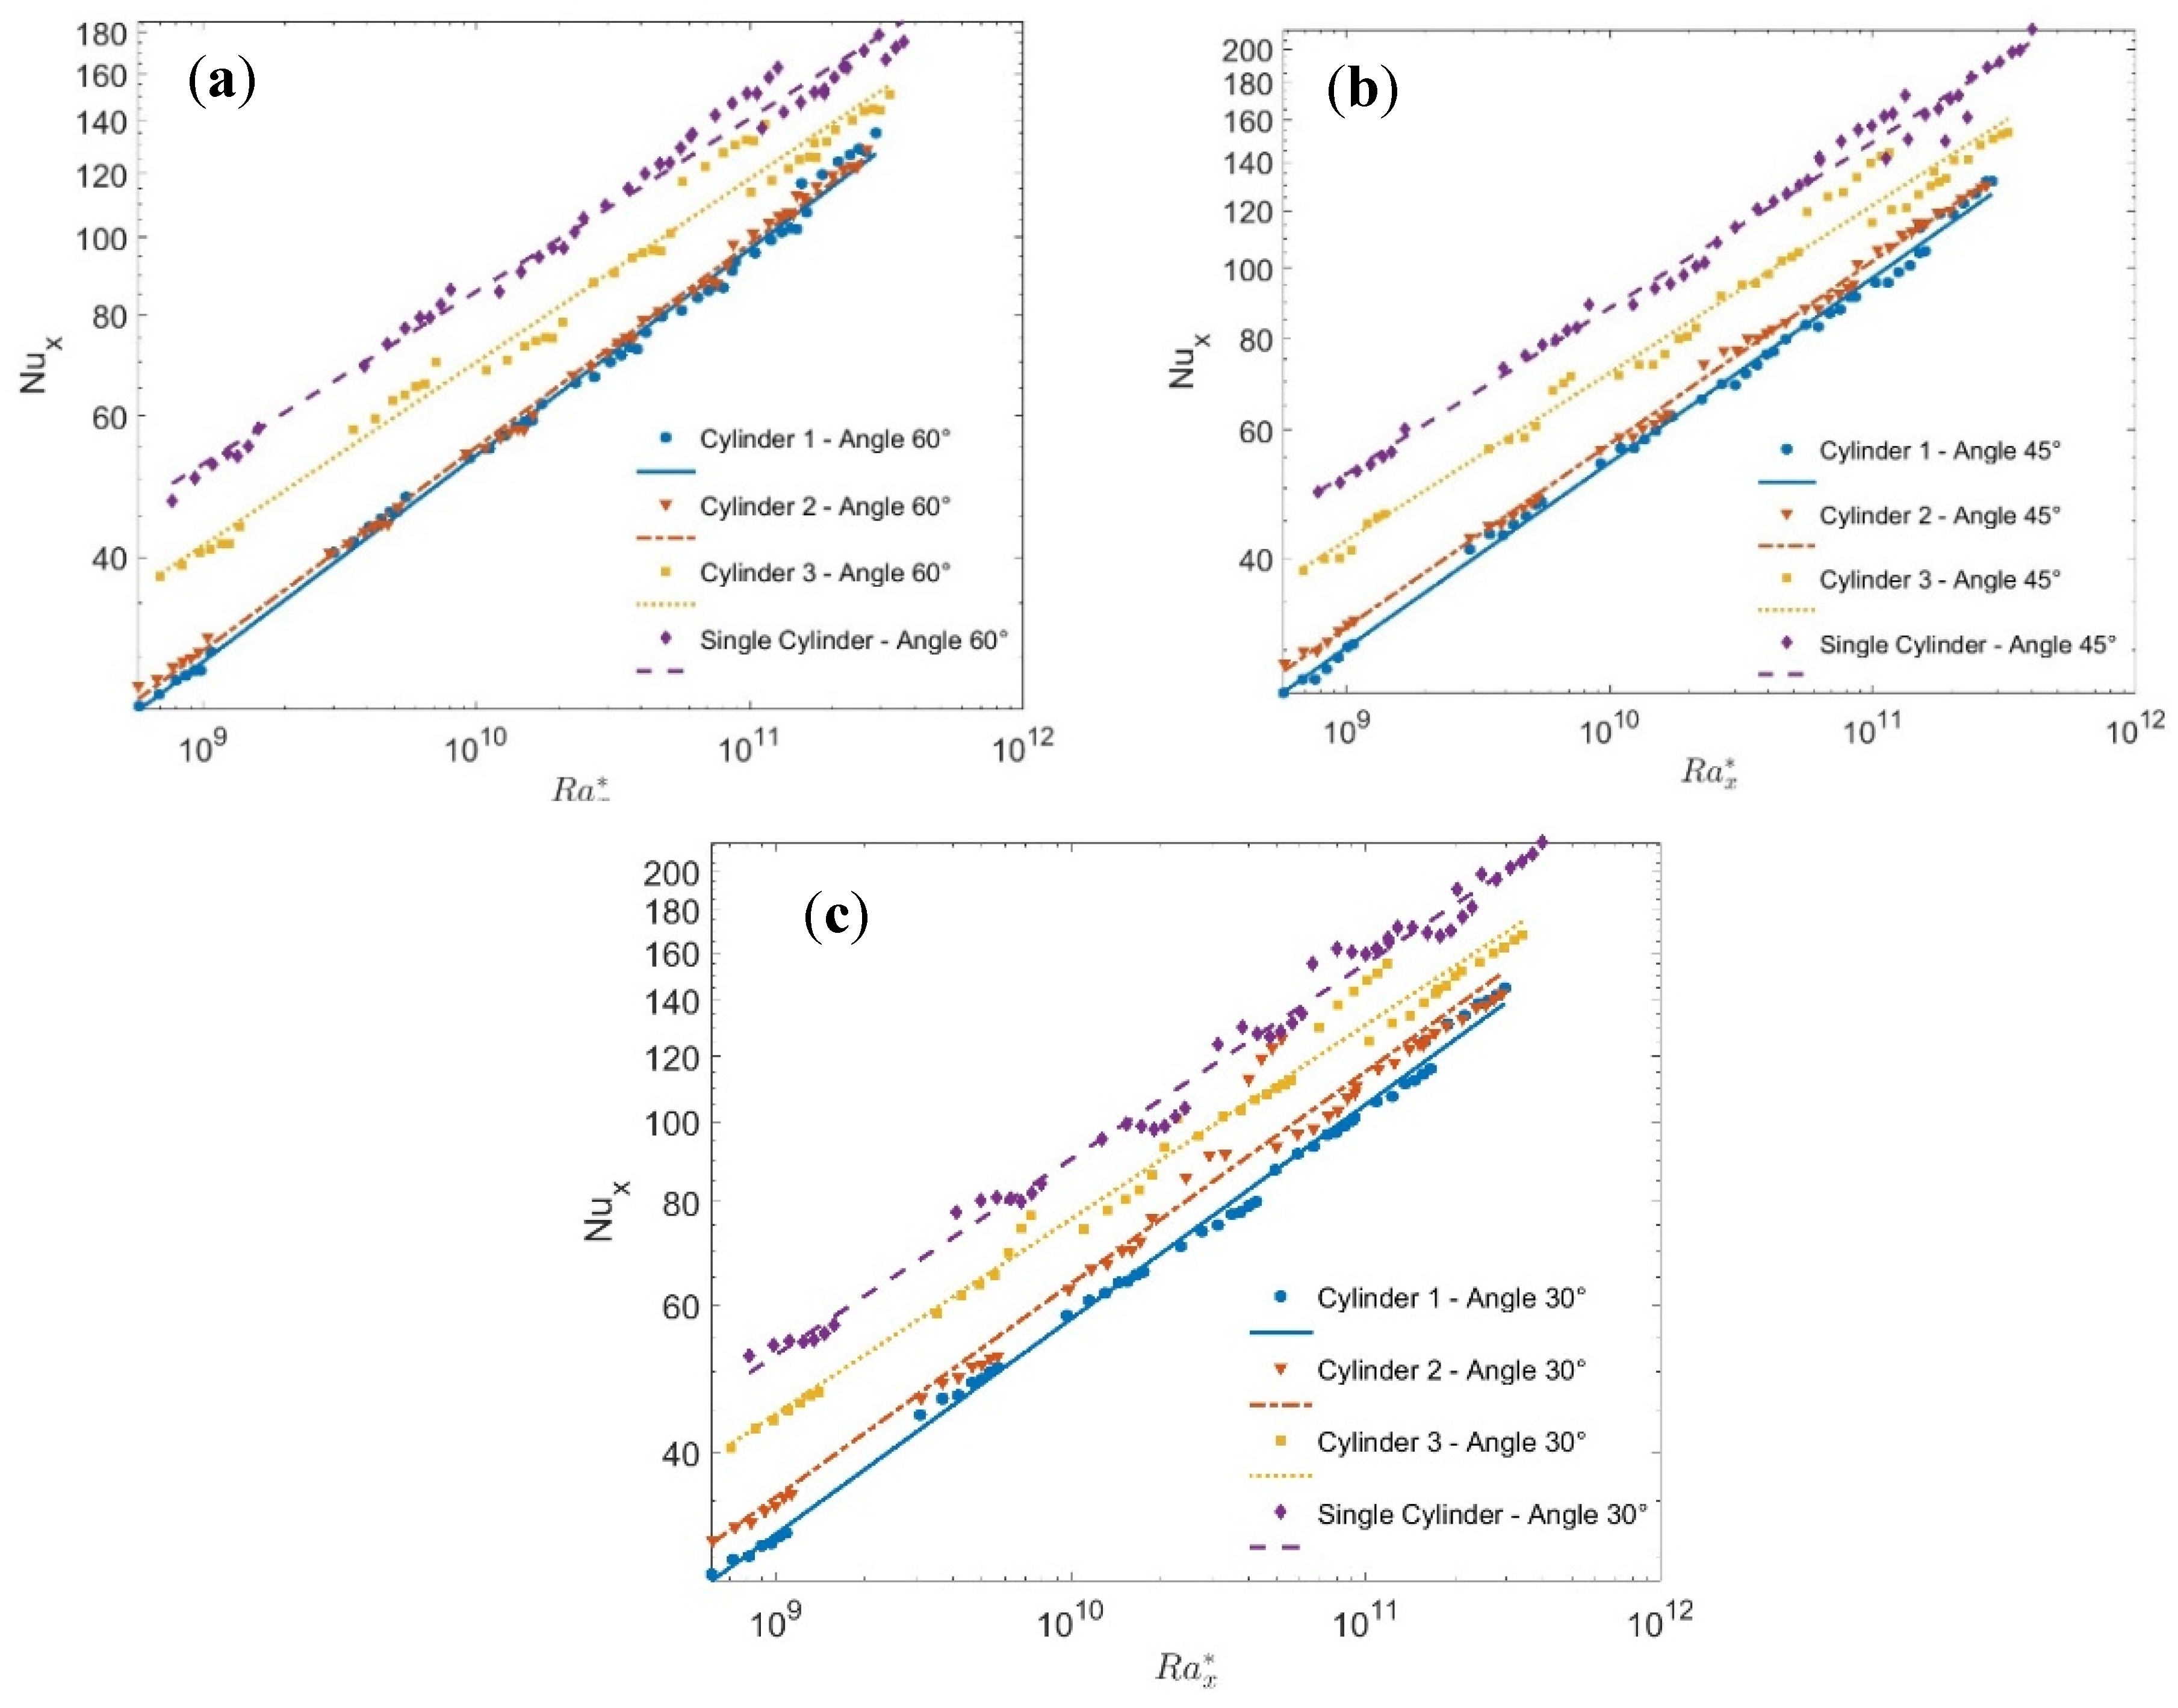
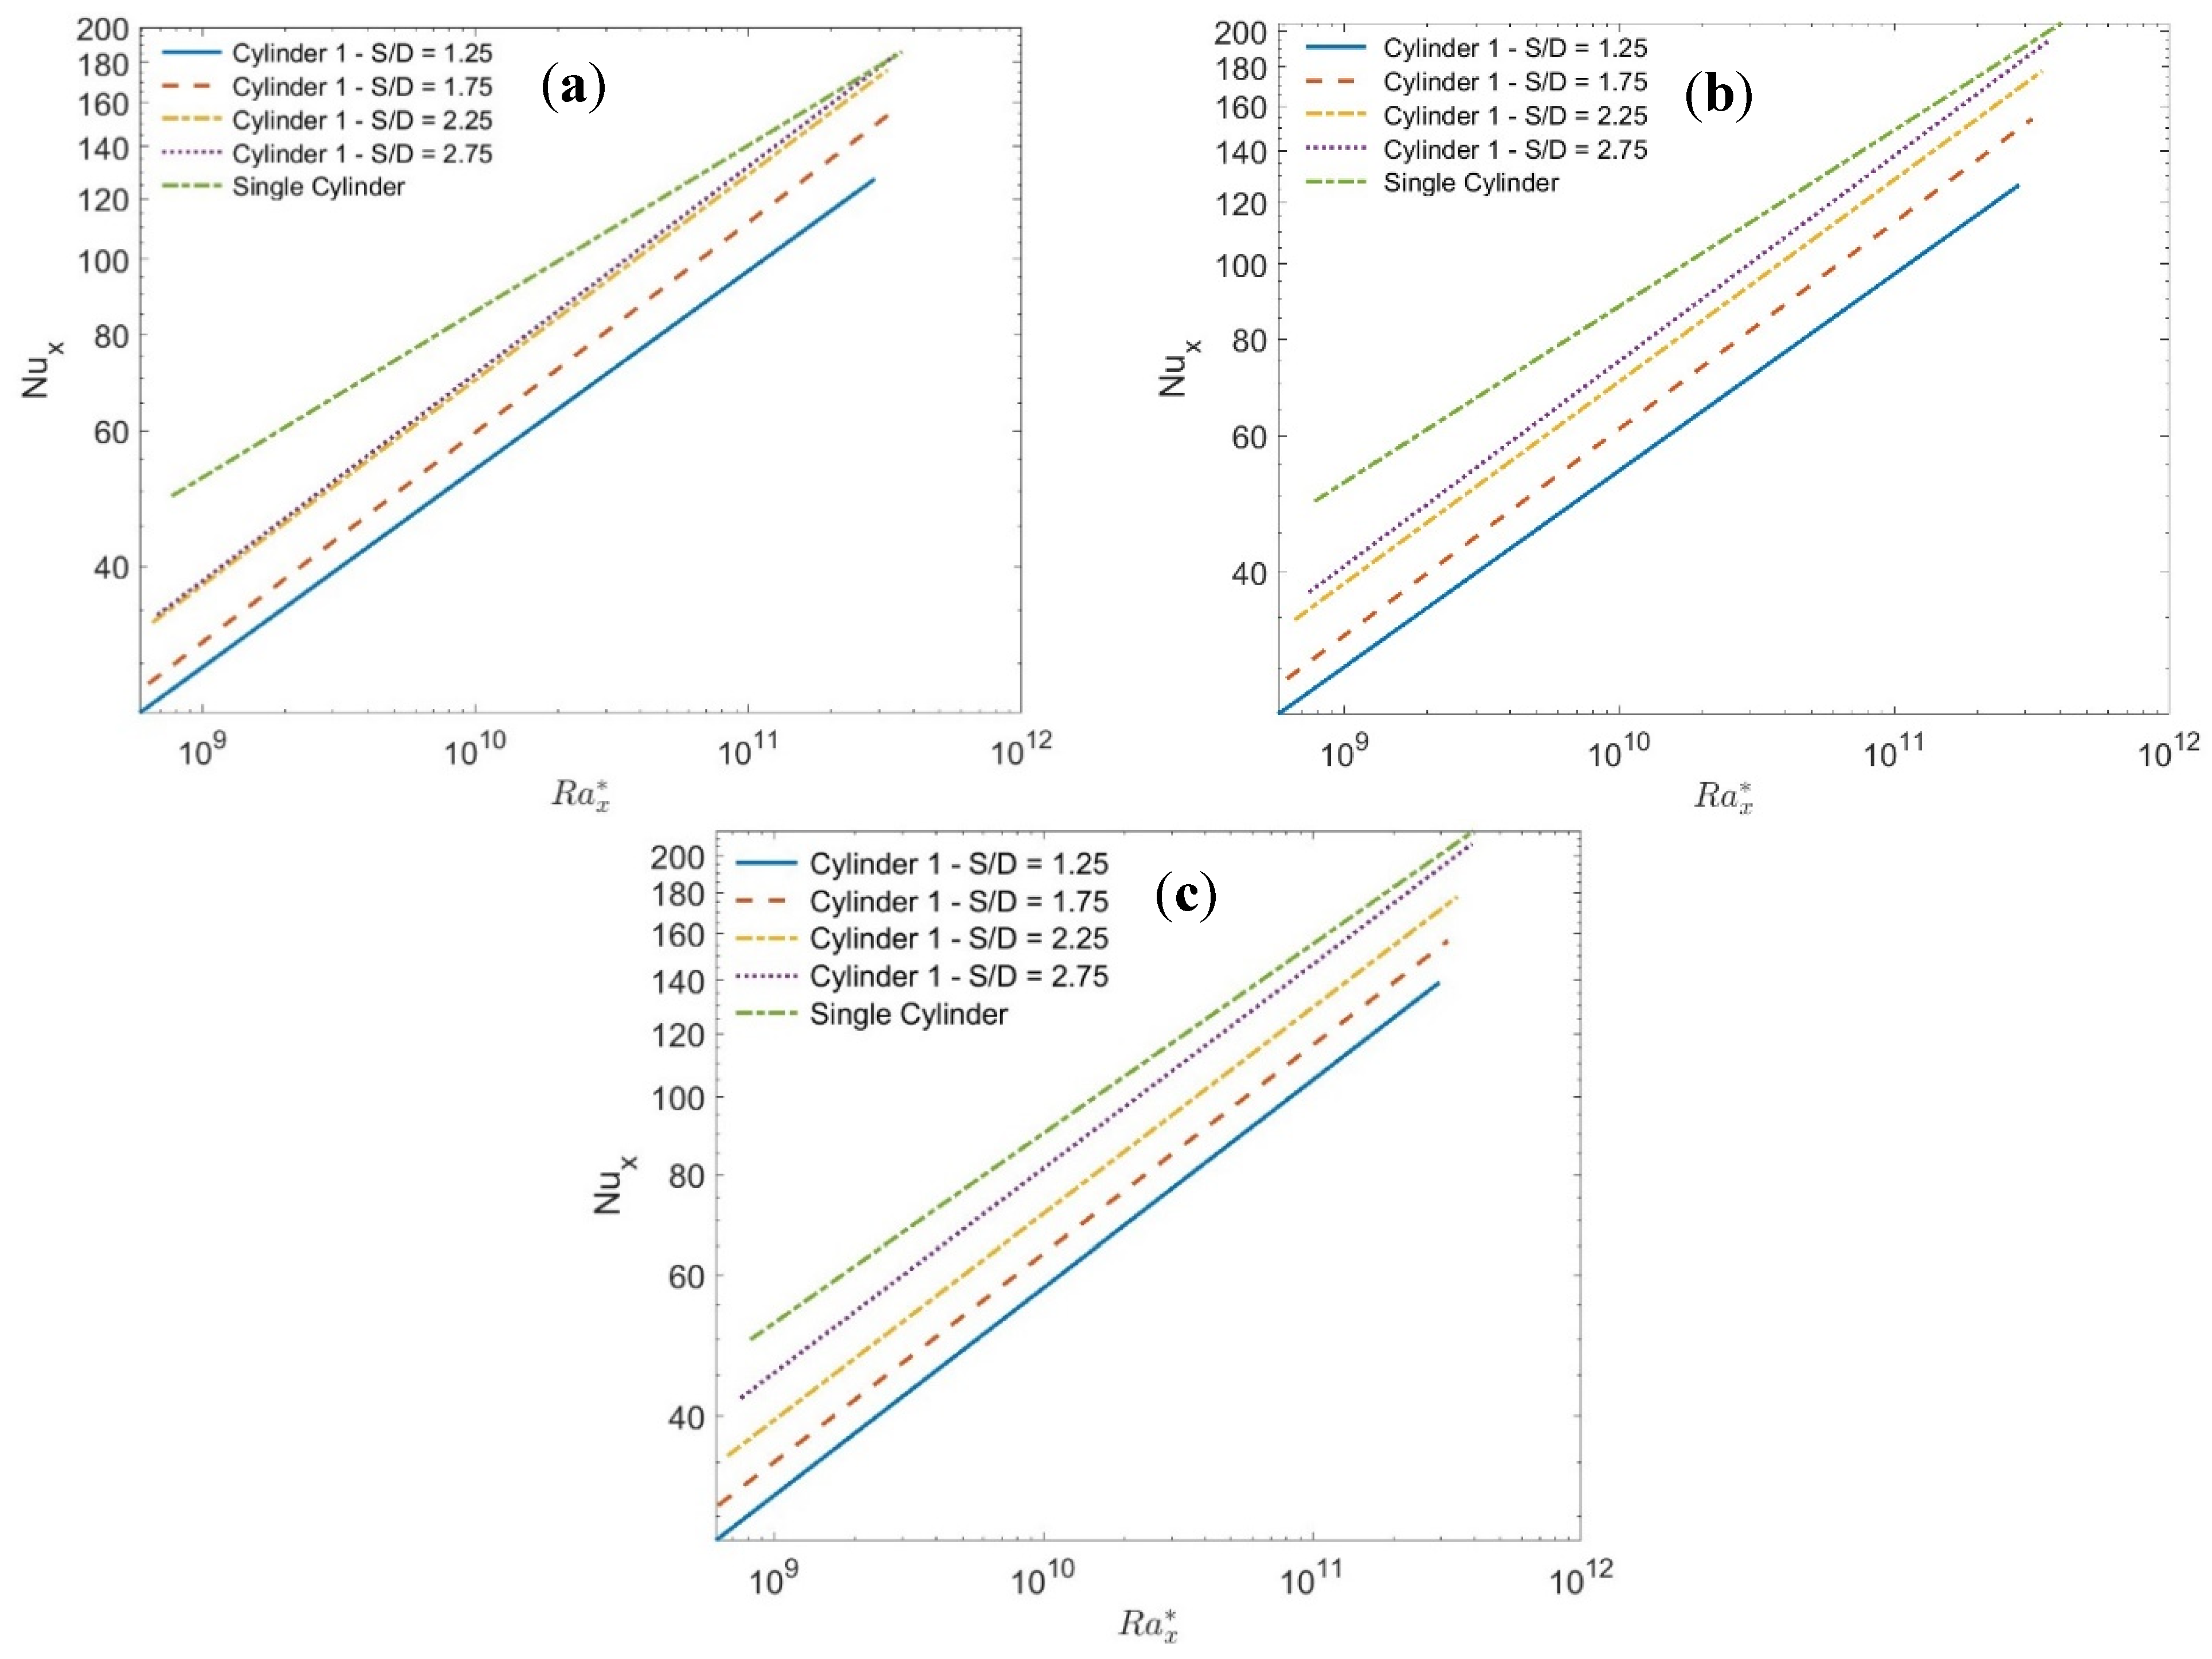
Figure 8 shows a comparison of the Nux profile at 60° (Figure 8a), 45° (Figure 8b), and 30° (Figure 8c) to their corresponding single one. In all figures at all angles, cylinder number 3 is slightly affected by the accumulated plume; therefore, it is closer to the single cylinder. However, the profile of cylinder number 1 depends on the competition between the effect of the rising plume from the second cylinder, which enhances the heat transfer for that cylinder, leading to its profile becoming almost similar to that of cylinder number 2, as shown in Figure 8a for a 60° angle. On the other hand, for a 45° angle, the effect of the rising plume on enhancing the heat transfer is less than the effect of the accumulated TBL, which leads to a small amount of degradation, as shown in Figure 8b. Figure 8c shows the effect of accumulated TBL, which tends to degrade the heat transfer of cylinder number 1 compared to number 2, and the result is making its profile lower than that of number 2. It should be noted that as S/D increases the plume interaction effect between cylinders decreases, which tends to enhance the heat transfer to approach that of a single cylinder at the same cylinder axis tilt angle. Figure 9 shows Nux profiles for different S/D at tilt angles 30°, 45°, and 60° in Figure 9a, Figure 9b and Figure 9c, respectively. The lines shown in the figures present the fitting curves through the data and the experimental symbols are taken off for clarity of the figure. This figure indicates that at each cylinder axis tilt angle as the S/D increases, less degradation from the single cylinder occurs, which means that the interacting effect between the cylinders is reduced as S/D increases. It should be noted that other cylinders give similar profiles for Nux. General correlations (14)–(17) for Nux profiles are obtained for each S/D using , the cylinder axis tilt angle (ϕ), and the cylinder number (cy) as parameters as shown in Table 4. An overall correlation (18) for Nux using these parameters in addition to the S/D is also obtained and given in Table 4. The difference between the predicted correlation and the experimental data for each S/D is obtained as ±13% of the ideal fit. By inspection of the overall obtained correlations (14)–(18), the exponent of the modified Rayleigh is in the range 0.243–0.253, therefore the local heat transfer coefficient can be scaled for this range as and , respectively. This indicates that as the axial distance along the cylinder increases, the local heat transfer decreases, or at most, slightly increases. This confirms that the mode of heat transfer is mostly laminar [22,23], followed by transition, as confirmed in Figure 4b.
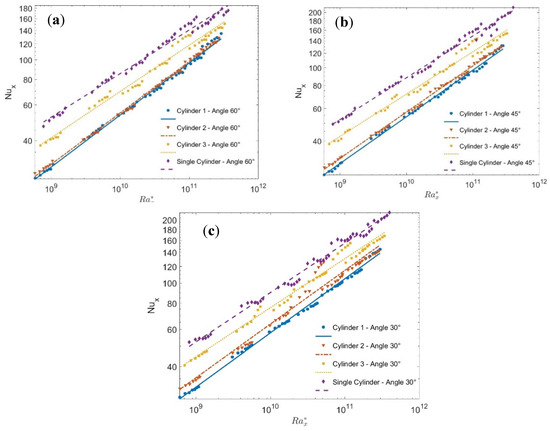
Figure 8.
Nusselt number profiles of each cylinder at different cylinder axis tilt angles compared to the single cylinder for S/D = 1.25, straight lines present the curve fitting: (a) at 60°, (b) 45°, and (c) 30°.
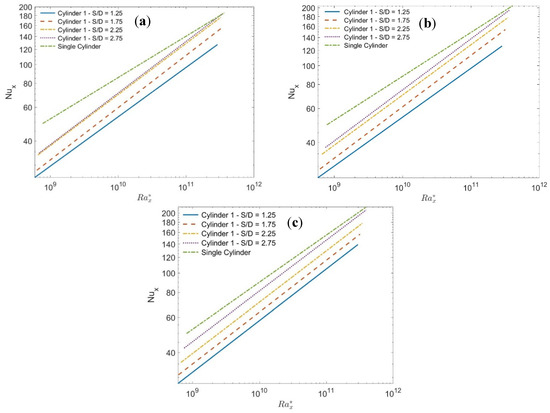
Figure 9.
Nusselt number profiles for cylinder number 1 at different S/D compared to the single cylinder; (a) at 30°, (b) 45°, and (c) 60°, lines present the curve fitting.
Table 4.
General correlations for different S/D and the overall correlation for Nux for 6 × 10⁹ ≤ ≤ 3 × 10¹¹.
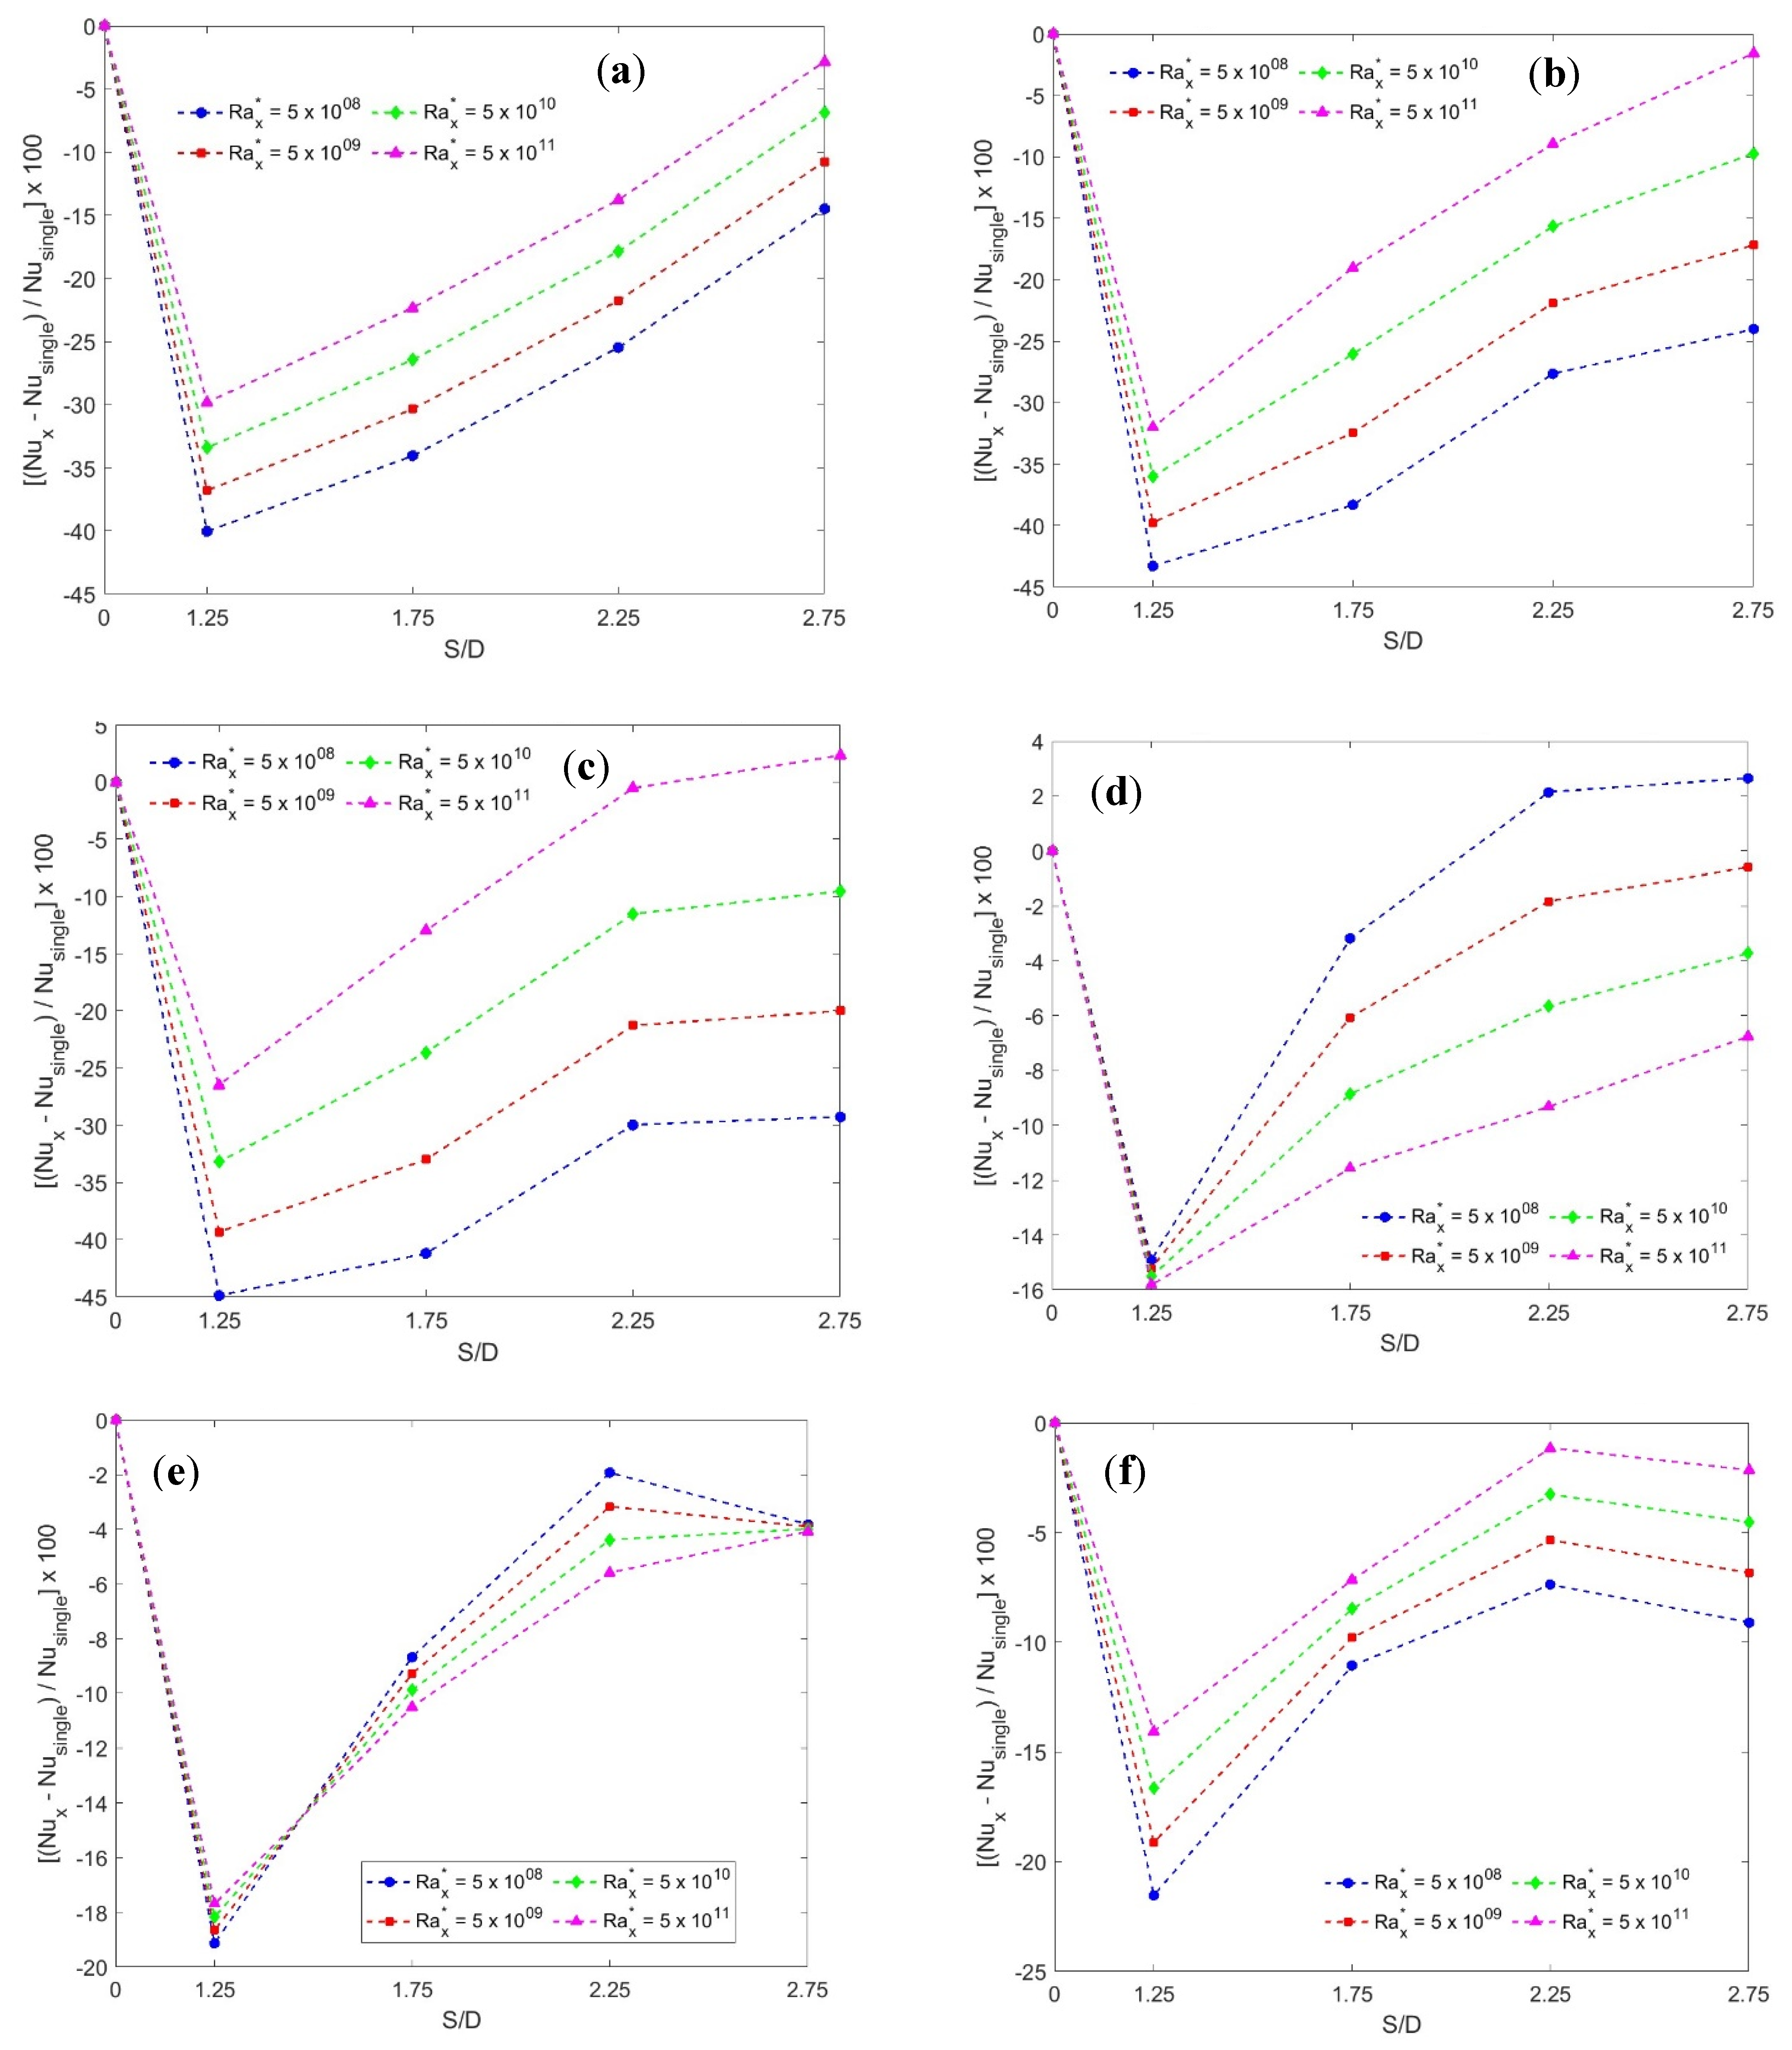
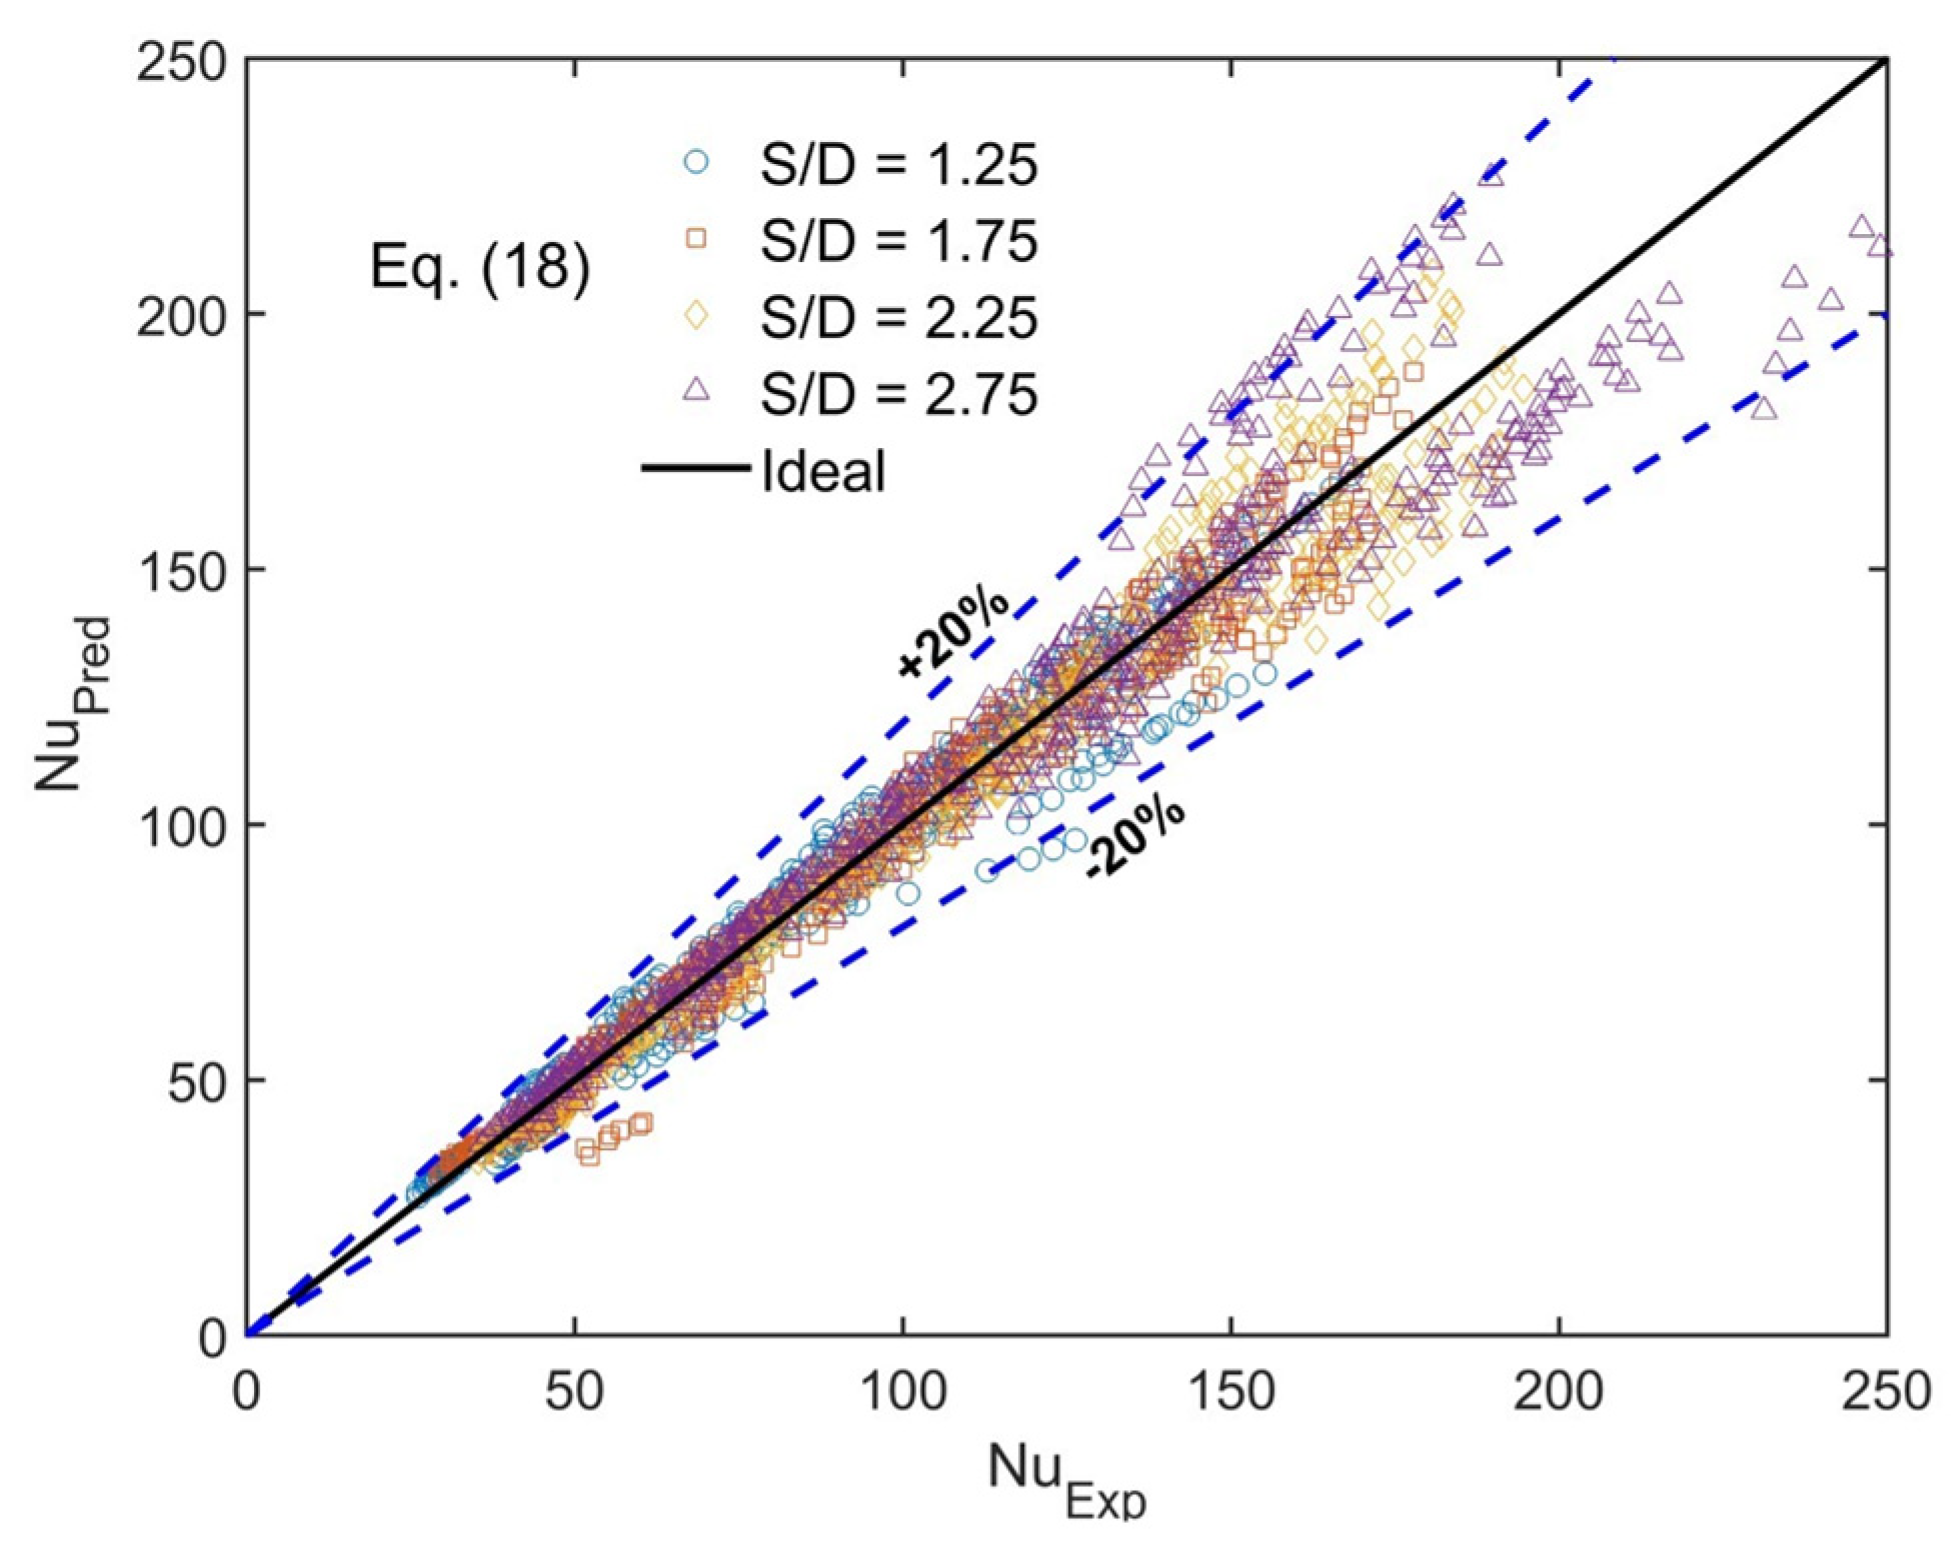
Figure 10a–f shows the Nusselt numbers degradation for cylinder numbers 1 and 3 in Figure 10a–c and Figure 10d–f, respectively. The small S/D = 1.25 has the maximum degradation in Nux for all cylinders at all Rayleigh numbers, which indicates that the effect of accumulation of the thermal boundary overcomes any possible enhancement due to the rising plume from the heated cylinders. However, as the S/D increases, the degradation effect decreases until it approaches that of the single cylinder (S/D = 0) at large S/D = 2.75. It should be noted that the degradation profiles depend on both Rayleigh numbers and the sequential order of the cylinder in the inclined array, in addition to the S/D ratio. The accuracy of correlations (14)–(17) compared to the real experimental data and that of the best fit is obtained as ±13%. On the other hand, the percentage of the difference in the overall correlation (18) for all S/D with the best fit is obtained as ±20%, as shown in Figure 11.
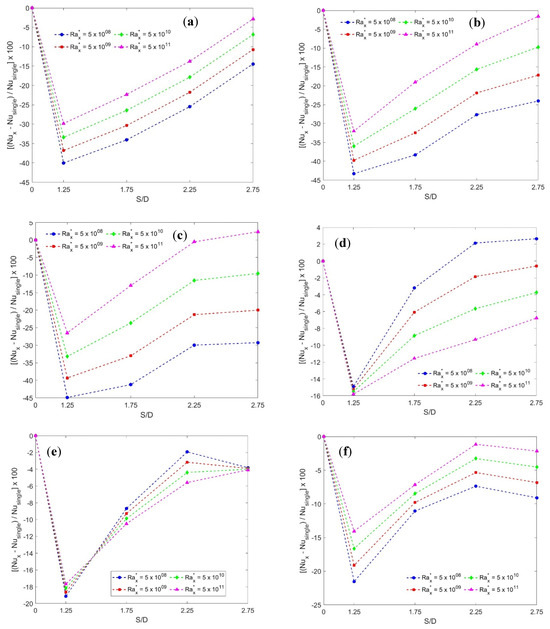
Figure 10.
Percentage degradation in Nux compared to the single cylinder (S/D = 0): (a) Cy #1 at 30°, (b) Cy #1 at 45°, (c) Cy #1 at 60°, (d) Cy #3 at 30°, (e) Cy #3 at 45°, and (f) Cy #3 at 60°.

Figure 11.
Accuracy of the overall correlation (18) with the ideal fit.
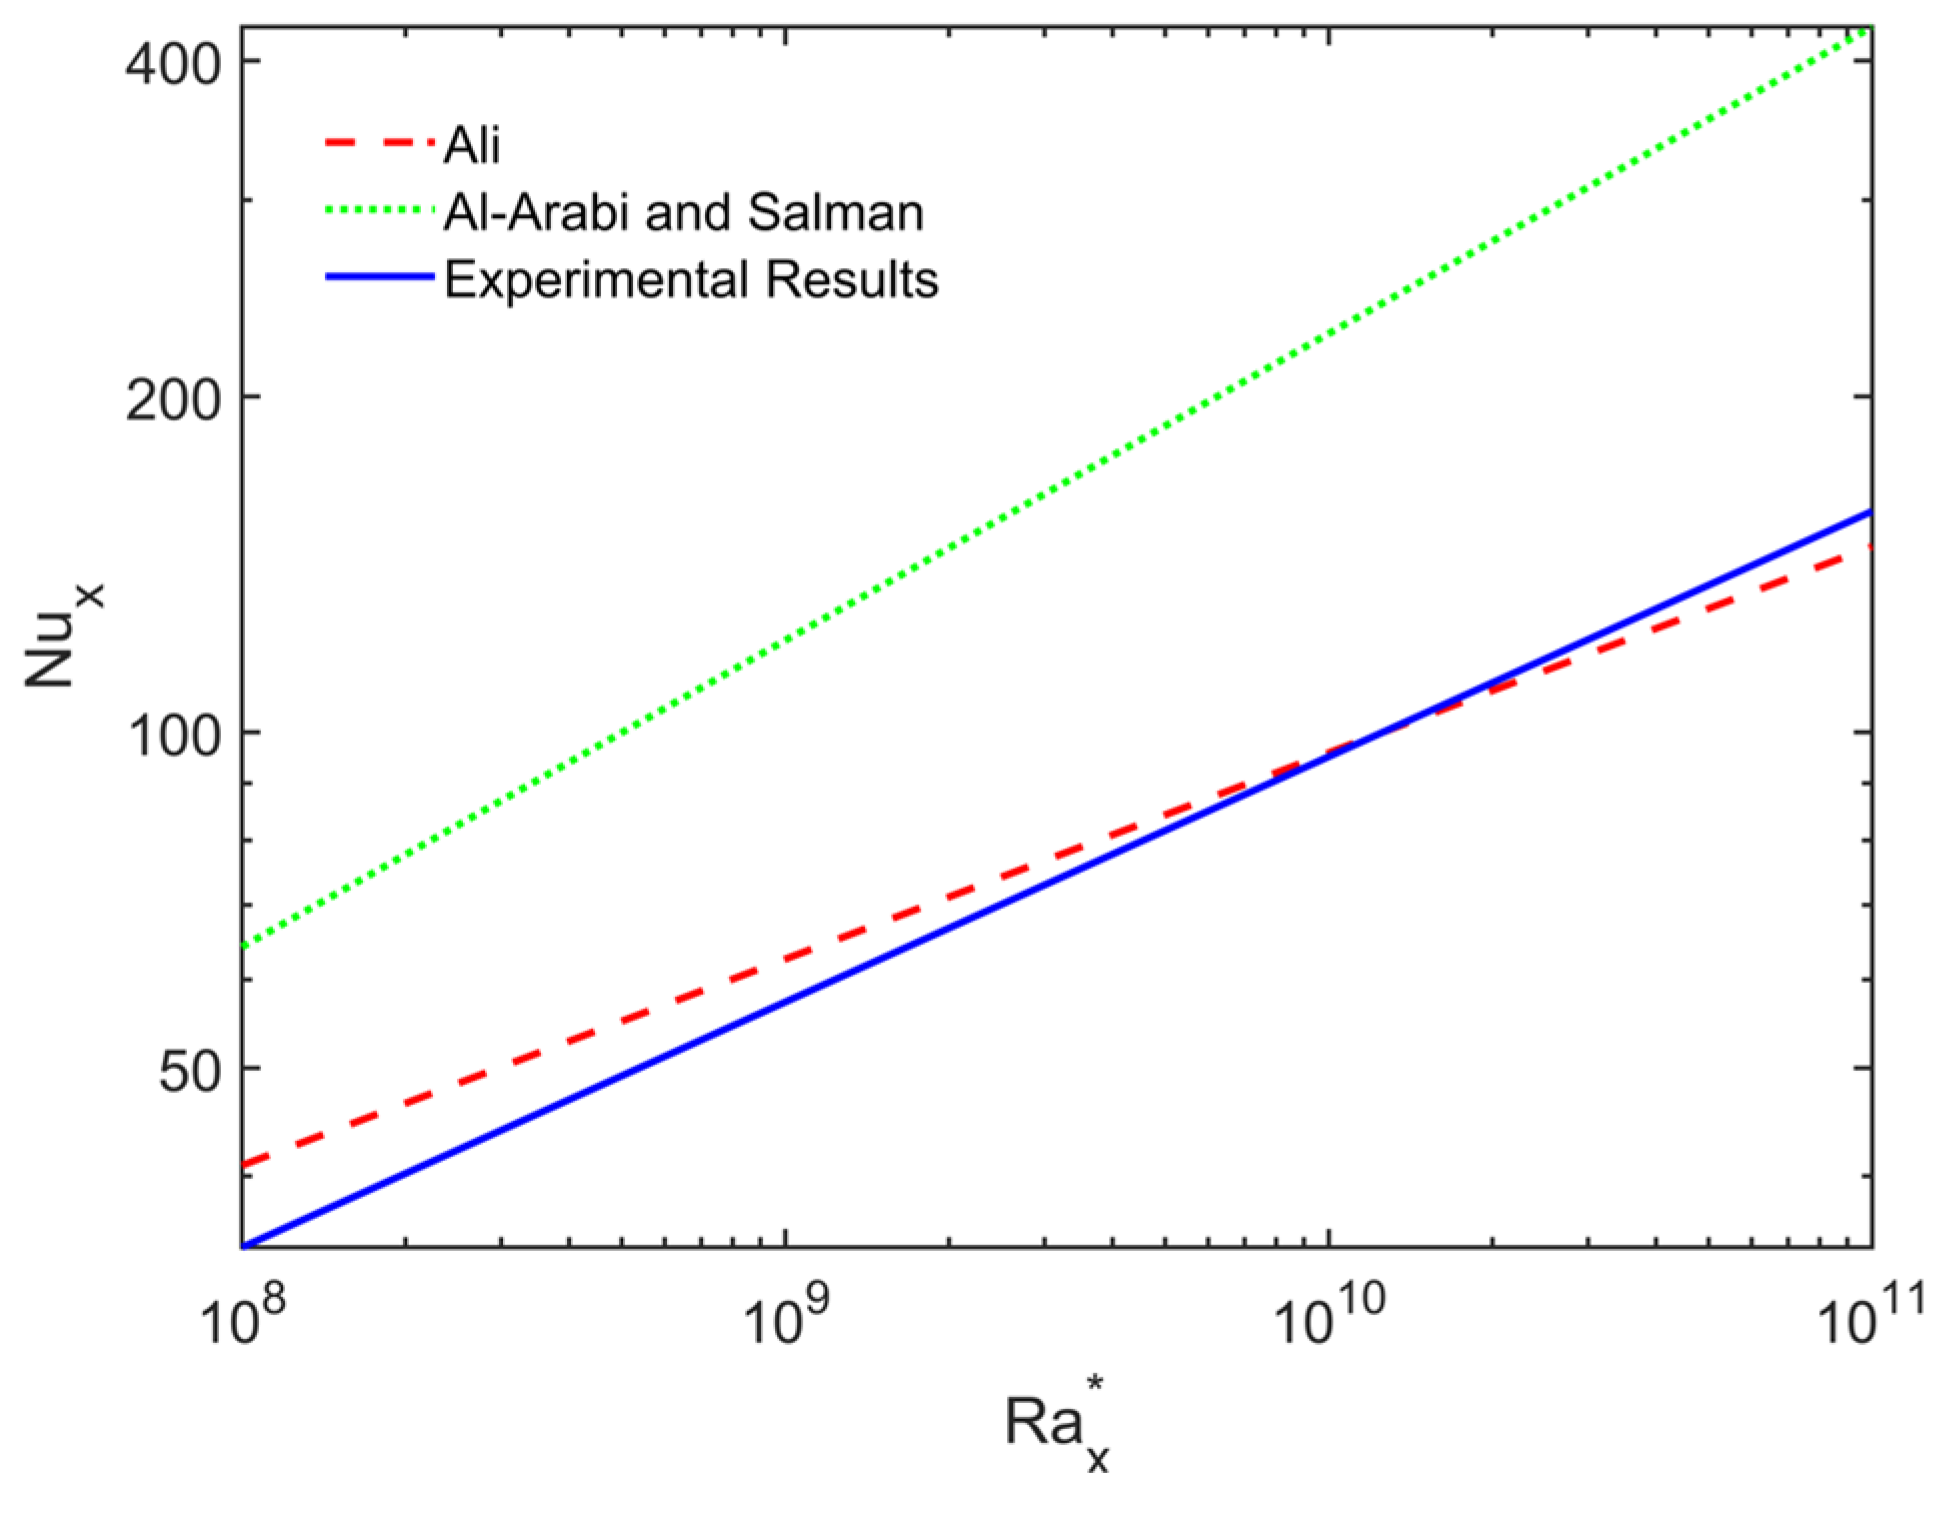
Figure 12 shows a comparison between the current local experimental work of the inclined single cylinder at an angle of 60° with those available in the literature for the tilted square cylinder of Ali [22] and the inclined circular cylinder of Al-Arabi and Salman [24]. This figure shows a good alignment between the current data and those of [22] since both have almost the same aspect ratio (L/D = 50). However, the comparison with [24] is not one-to-one, since they have almost half of the aspect ratio (L/D = 25) and they have a circular cross-section.
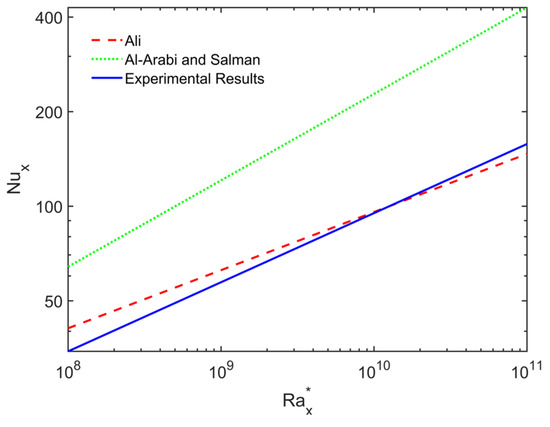
Figure 12.
Comparison between the natural convection heat transfer from the single cylinder used at an angle of 60° and the work of Ali [22] and Al-Arabi and Salman [24].
6. Conclusions
Natural convection heat transfer from an inclined array of square cross-section cylinders is experimentally investigated. The results showed that the center-to-center distance plays a vital role in the degradation of heat transfer from that of single cylinders and this degradation is enhanced as the separation distance increases at all cylinder axis tilt angles and especially at high Rayleigh numbers. The small cylinder axis tilt angle has a lower degradation than high ones compared to that of single inclined cylinders. The percentage of degradation at each cylinder axis tilt angle corresponding to each separation distance is quantified and obtained relative to that of the single cylinders. Empirical correlations are obtained for each cylinder in the array at a specific separation distance for each cylinder axis tilt angle. The Nusselt numbers are correlated with the modified Rayleigh numbers, the cylinder axis tilt angle, and the cylinder number in the array for each separation distance (14)–(17). A new overall general correlation (18) for the whole array is obtained using all the parameters, such as the modified Rayleigh numbers, cylinder axis tilt angle, separation distance, and the cylinder number as it is located in the array. These correlations are useful for any engineering applications using such configuration of the tilted array in several heat transfer applications.
7. Future Work
This work could be extended to study the effect of the middle cylinder in an array containing more cylinders, such as five or seven cylinders, and to observe the degree of degradation in each case. This study could also be extended to consider the case of a non-perpendicular plane of the tube array to the horizontal.
Author Contributions
Conceptualization, Z.A.-S. and M.A.; Methodology, Z.A.-S. and R.A.; Validation, Z.A.-S. and R.A.; Formal analysis, Z.A.-S.; Investigation, Z.A.-S., M.A. and R.A.; Resources, M.A.; Data curation, Z.A.-S. and R.A.; Writing—original draft, M.A.; Writing—review & editing, M.A.; Supervision, M.A.; Project administration, M.A. All authors have read and agreed to the published version of the manuscript.
Funding
The authors would like to appreciate the support and funding from the Researchers Supporting Project number (RSPD2024R983), King Saud University, Riyadh, Saudi Arabia.
Data Availability Statement
The original contributions presented in the study are included in the article, further inquiries can be directed to the corresponding author.
Conflicts of Interest
The authors declare that there are no conflicts of interest.
Nomenclature
| Symbol | Description |
| As | The surface area of the cylinder, m2 |
| Abk | End plate cross-section area of the Bakelite, m2 |
| D | Side of the square cylinder as a characteristic length, m |
| IEP | Input Electrical Power, W |
| F12 | Shape factor between two long parallel cylinders |
| F1∞ | Shape factor between any cylinder and the ambient |
| g | acceleration due to gravity, m/s2 |
| H | Heating element |
| h | Convection heat transfer coefficient, Wm−2 K−1 |
| k | Thermal conductivity, W m−1 K−1 |
| L | Cylinder length, (=1 m) |
| Nu | Nusselt number, h x/k |
| q″ | Convection heat flux, W/m2 |
| qr | Radiation heat flux, W/m2 |
| Heat lost by conduction through the Bakelite end plates, W/m2 | |
| R2 | Coefficient of determination (correlation coefficient) |
| Ra* | Modified Rayleigh number, |
| S | Cylinder center-to-center distance, m |
| S/D | Dimensionless center-to-center ratio |
| T | Absolute Temperature |
| t | Temperature, °C |
| tiB | Inside surface temperature of the Bakelite end plate, °C |
| toB | The outside surface temperature of the Bakelite end plate, °C |
| x | Axial distance, m |
| Greek symbols | |
| thermal diffusivity, m2 s−1 | |
| coefficient for thermal expansion, K−1 | |
| Bakelite thickness, m | |
| Emissivity | |
| ϕ | The cylinder axis tilt angle to the horizontal |
| γ | Constant appears in Equation (5) |
| Arithmetic mean temperature defined by Equation (7), K | |
| Kinematics viscosity, m2 s−1 | |
| Stefan–Boltzmann constant, (=) | |
| Array tilt angle, | |
| Subscripts | |
| bk | Bakelite |
| j | Indices in the perimeter direction from 1 to 3 |
| i | Indices in the axial direction ranging from1 to 9 |
| x | Characteristic length, m |
| ∞ | ambient condition |
| Superscripts | |
| - | averaged value |
References
- Marsters, G.F. Arrays of heated horizontal cylinders in natural convection. Int. J. Heat Mass Transf. 1972, 15, 921–933. [Google Scholar] [CrossRef]
- Sparrow, E.M.; Niethammer, J.E. Effect of Vertical Separation Distance and Cylinder-to-Cylinder Temperature Imbalance on Natural Convection for a Pair of Horizontal Cylinders. J. Heat Transfer. 1981, 103, 638–644. [Google Scholar] [CrossRef]
- Sadeghipour, M.S.; Asheghi, M. Free convection heat transfer from arrays of vertically separated horizontal cylinders at low Rayleigh numbers. Int. J. Heat Mass Transfer 1994, 37, 103–109. [Google Scholar] [CrossRef]
- Corcione, M. Correlating equations for free convection heat transfer from horizontal isothermal cylinders set in a vertical array. Int. J. Heat Mass Transf. 2005, 48, 3660–3673. [Google Scholar] [CrossRef]
- Yousefi, T.; Ashjaee, M. Experimental study of natural convection heat transfer from vertical array of isothermal horizontal elliptic cylinders. Exp. Therm. Fluid Sci. 2007, 32, 240–248. [Google Scholar] [CrossRef]
- Reymond, O.; Murray, D.B.; O’Donovan, T.S. Natural convection heat transfer from two horizontal cylinders. Exp. Therm. Fluid Sci. 2008, 32, 1702–1709. [Google Scholar] [CrossRef]
- D’Orazio, A.; Fontana, L. Experimental study of free convection from a pair of vertical arrays of horizontal cylinders at very low Rayleigh numbers. Int. J. Heat Mass Transf. 2010, 53, 3131–3142. [Google Scholar] [CrossRef]
- Grafsrønningen, S.; Jensen, A. Natural convection heat transfer from three vertically arranged horizontal cylinders with dissimilar separation distance at moderately high Rayleigh numbers. Int. J. Heat Mass Transf. 2013, 57, 519–527. [Google Scholar] [CrossRef]
- Shyam, R.; Sasmal, C.; Chhabra, R.P. Natural convection heat transfer from two vertically aligned circular cylinders in power-law fluids. Int. J. Heat Mass Transf. 2013, 64, 1127–1152. [Google Scholar] [CrossRef]
- Liu, J.; Liu, H.; Zhen, Q.; Lu, W. Laminar natural convection heat transfer from a pair of attached horizontal cylinders set in a vertical array. Appl. Therm. Eng. 2017, 115, 1004–1019. [Google Scholar] [CrossRef]
- Ali, M.; Nuhait, A.; Almuzaiqer, R. The Effect of Square Tube Location in a Vertical Array of Square Tubes on Natural Convection Heat Transfer. Heat Transf. Eng. 2018, 39, 1036–1051. [Google Scholar] [CrossRef]
- Razzaghpanah, Z.; Sarunac, N.; Javanshir, A.; Khalesi, J. Natural convection heat transfer from a horizontal row of finite number of heated circular cylinders immersed in molten solar salt. J. Energy Storage 2019, 22, 176–187. [Google Scholar] [CrossRef]
- Cianfrini, M.; Corcione, M.; Quintino, A.; Spena, V.A. Laminar natural convection from a vertical array of horizontal heated cylinders inside a water-filled rectangular enclosure cooled at sides. Int. J. Numer. Methods Heat Fluid Flow 2020, 30, 2607–2623. [Google Scholar] [CrossRef]
- Goswami, N.; Randive, P.R.; Pati, S. Natural Convection from a Pair of Heated Cylinders in a Square Cavity with Non-uniform Temperature on the Side Walls. J. Inst. Eng. India Ser. C 2020, 102, 389–396. [Google Scholar] [CrossRef]
- Gibbons, M.J.; Yates, S.G.; O’Shaughnessy, S.M.; Persoons, T.; Murray, D.B. Natural convection from a triangular array of isothermal horizontal cylinders. Exp. Therm. Fluid Sci. 2021, 127, 110413. [Google Scholar] [CrossRef]
- Alsuhaibani, Z.; Ali, M.; Saleh, N.S. Center-to-Center Distance’s Effect between Vertical Square Tubes of a Horizontal Array on Natural Convection Heat Transfer. Appl. Sci. 2023, 13, 6345. [Google Scholar] [CrossRef]
- Olayemi, O.; Al-Farhany, K.; Olabemiwo, J.; Victor, O.O.; Odetunde, C.; Kayode, I. Parametric study of natural convection heat transfer from an inclined rectangular cylinder embedded in a square enclosure. Aust. J. Mech. Enegineering 2023, 21, 668–681. [Google Scholar] [CrossRef]
- William, D.; Callister, W.D.J. Materials Science and Engineering an Introduction, 6th ed.; John Wiley & Sons: New York, NY, USA, 2003; Chapter 19; p. 660. [Google Scholar]
- Siegel, R.; Howell, J.R. Thermal Radiation Heat Transfer, 3rd ed.; McGraw-Hill: New York, NY, USA, 1992. [Google Scholar]
- Kline, S.J.; McClintock, F.A. Describing Uncertainties in Single-Sample Experiments. ASME Mech. Eng. 1953, 75, 3–8. [Google Scholar]
- Moffat, R.J. Describing Uncertainties in Experimental Results. Exp. Therm. Fluid Sci. 1988, 1, 3–7. [Google Scholar] [CrossRef]
- Ali, M. Experimental free convection heat transfer from inclined square cylinders. Heat Mass Transfer 2016, 53, 1643–1655. [Google Scholar] [CrossRef]
- Burmeister, L.C. Convection Heat Transfer; John Wiley & Sons: Hoboken, NJ, USA, 1983. [Google Scholar]
- Al-Arabi, M.; Salman, Y. Laminar natural convection heat transfer from an inclined cylinder. Int. J. Heat Mass Transfer. 1980, 23, 45–51. [Google Scholar] [CrossRef]


Disclaimer/Publisher’s Note: The statements, opinions and data contained in all publications are solely those of the individual author(s) and contributor(s) and not of MDPI and/or the editor(s). MDPI and/or the editor(s) disclaim responsibility for any injury to people or property resulting from any ideas, methods, instructions or products referred to in the content. |
© 2024 by the authors. Licensee MDPI, Basel, Switzerland. This article is an open access article distributed under the terms and conditions of the Creative Commons Attribution (CC BY) license (https://creativecommons.org/licenses/by/4.0/).