Article

Determining Fast Battery Charging Profiles Using an Equivalent Circuit Model and a Direct Optimal Control Approach

by
Julio Gonzalez-Saenz
and
Victor Becerra
*
School of Energy and Electronic Engineering, University of Portsmouth, Portsmouth PO1 3DJ, UK
*
Author to whom correspondence should be addressed.
Energies 2024, 17(6), 1470; https://doi.org/10.3390/en17061470
Submission received: 23 January 2024 / Revised: 14 March 2024 / Accepted: 15 March 2024 / Published: 19 March 2024

Abstract

:
This work used an electrical equivalent circuit model combined with a temperature model and computational optimal control methods to determine minimum time charging profiles for a lithium–ion battery. To effectively address the problem, an optimal control problem formulation and direct solution approach were adopted. The results showed that, in most cases studied, the solution to the battery’s fast-charging problem resembled the constant current–constant voltage (CC-CV) charging protocol, with the advantage being that our proposed approach optimally determined the switching time between the CC and CV phases, as well as the final time of the charging process. Considering path constraints related to the terminal voltage and temperature gradient between the cell core and case, the results also showed that additional rules could be incorporated into the protocol to protect the battery against under/over voltage-related damage and high-temperature differences between the core and its case. This work addressed several challenges and knowledge gaps, including emulating the CC-CV protocol using a multi-phase optimal control approach and direct collocation methods, and improving it by including efficiency and degradation terms in the objective function and safety constraints. To the authors’ knowledge, this is the first time the CC-CV protocol has been represented as the solution to a multi-phase optimal control problem.

1. Introduction

The criteria for fast charging mandate that a fully charged battery achieves its maximum discharge capacity within the shortest charging time while ensuring the safety of the user and the device [1]. A critical barrier to fast charging is the temperature at the battery’s core since it promotes the growth of dendrites due to lithium plating [2]. The effects of different temperature ranges when operating a typical lithium–ion battery are presented in Table 1 [3]. Keeping the temperature within the recommended operating range is crucial to prevent damage to the battery and other severe consequences. Over the past five years, there were 507 cases of fire in electric vehicles caused by battery explosions in the U.K. alone [4].
Car manufacturers consider controlling the temperature inside a battery pack very seriously. Reports indicate [2] that the battery of a typical electric vehicle can be replenished from fully discharged to a state of charge of 80% in just 30 min, at a ≈2C charging current, where C is the nominal battery capacity in Ah, and at ambient temperature. However, at lower temperatures, the process of charging the same amount of energy would take an additional 60 min at a <C/1.5 charging current, making the total time required for charging 90 min.
Another restriction imposed on fast charging is the charging voltage. Table 2 summarises the damage caused by over- or under-charging a lithium–ion battery.
Generally, battery manufacturers provide a charging guide for fast charging while keeping the battery within safe temperature limits. The constant current–constant voltage (CC-CV) approach is commonly used and does not require a mathematical model of the battery. This method is cost-effective and ensures voltage constraints within safety windows. CC-CV profiles are designed to avoid battery abuse risks and are often considered reference protocols in the literature [7,8].
Another essential consideration in the battery’s fast-charging algorithms is capacity reduction, also known as battery degradation, measured by the state of health ( S o h ). Although degradation cannot be avoided, it can be mitigated by limiting the factors that create it in the first place. As electrochemical models are outside the scope of this work, the degradation prediction model employed in this work is heuristic. A valuable examination of the empirical degradation of lithium–ion batteries is given in [9].
The research aims of this work were twofold: first, to investigate the CC-CV charging profile from the point of view of an optimal control problem; second, to present a multi-phase optimal control formulation that allows computing charging profiles to achieve the fastest charging time while considering safety constraints to protect batteries and their users, as well as energy efficiency.
The remainder of this paper is organised as follows. Section 2 explores existing procedures for fast charging and developing models for lithium–ion batteries. Section 3 discusses the formulation of fast charging for batteries as an optimal control problem and the CC-CV procedure. The work includes three different formulations of the optimal control problem. Section 4 presents the results and discusses the fast charging protocol optimisation strategies. We place particular emphasis on studying how temperature impacts the performance of the fast-charging protocol. Section 5 concludes the study by summarising the key findings and providing recommendations for future research.
To the authors’ knowledge, this is the first research effort to investigate the CC-CV protocol with temperature and voltage path constraints by formulating it as a multi-phase optimal control problem. As will be shown, the CC-CV strategy that manufacturers recommend is not precisely optimal and can potentially cause unnecessary degradation to the battery if the generated heat is not appropriately constrained.

2. Literature Review

Numerous publications have demonstrated that the primary challenge in achieving fast charging lies in improving the charging protocol rather than focusing solely on battery chemistry [10]. For example, in the popular Tesla Model 3, manufactured by Tesla, Inc., Austin, TX, USA, the battery can be charged up to an 80% state of charge ( S o C ) in less than 30 min, but not without affecting its longevity [11].
Recent studies have reported ultra-fast charging strategies using particular cell structures. The self-heating lithium–ion battery enabled 15 minfast charging of lithium–ion batteries at any temperature (even at −50 °C) while still preserving a remarkable life cycle [2]. Also, ref. [12] reported stable lithium deposition with a recharge time of 45 min when charging a battery at −60 °C under a monolayer-regulated interface. Furthermore, the authors in [13] proposed new carbon-based electrode materials for fast-charging lithium–ion batteries. The reported results demonstrate the achievement of a charging time of less than 10 min to reach 80% capacity while ensuring the absence of lithium plating even after 300 cycles.
Nonetheless, the commercial battery studied in the Mat4Bat project and the results reported by [14,15] showed that it lost approximately 75% of its capacity in 50 cycles when 1C was applied at 5 °C. The same cells passed the 4000 cycles at 25 °C to reach the 75% capacity degradation. In [16], the authors cycled identical batteries at different temperatures while targeting an 8% capacity fade in all tests. The results showed a strong correlation between the life cycle of a battery and the temperature. The results indicated that an increment of 20 °C caused a 50% reduction in battery life. A study published in [17] showed that ‘capacity fade’ strongly depends on three main variables: the operating temperature, the total number of complete battery cycles, and the C-rate. These primary findings are consistent with research showing that the life cycle of lithium–ion batteries drops considerably with temperature.
In [18], the authors analysed the capacity fade of a Sony 18650 1.8 Ah lithium–ion cell (Sony Energy Devices Corporation, Tokyo, Japan) when charged/discharged at high temperatures. The results showed that after 800 cycles, the cells lost 36% of their initial capacity at 45 °C. The results also showed that cells cycled at 55 °C lost more than 70% of their initial capacity after 600 cycles. Experimentation was conducted in a lithium–ion battery at high temperatures and current rates in [19]. It was reported that the experimental data obtained from charging the battery at 6C to the designated capacity showed a 240-s charging time improvement (580 s vs. 820 s) at 55 °C, compared with 25 °C. This result might indicate that the charging time of the battery improves when the temperature rises; however, internal battery degradation is not reported, which is a significant omission.

2.1. Optimised Charging Methods

The straightforward constant current–constant voltage protocol is the charging strategy that most lithium–ion battery manufacturers recommend. During the constant current phase, a high charging current is maintained constant until a cut-off voltage is reached. This phase is responsible for almost fully charging the battery while keeping it under the limits of overcharging. Then, the strategy switches to the constant voltage phase. The charging current gradually decreases in this region while the battery voltage remains constant. The excess current is needed to reach the capacity at the top of the charge. Still, it does not consider internal battery temperature or time optimisation. These considerations are critical factors in ensuring low degradation rates. Typically, the battery terminal voltage, or V T , determines the time to change from CC to CV. The conventional transition from CC to CV effectively prevents overcharging, while the total charging time can be extended [20]. Usually, the empirical maximum charging time is formally included as part of the specification.
In [21], the authors formulate the fast charging problem as an optimal control problem with a temperature constraint. The study showed that the optimal charging strategy fits the classic CC-CV approach. Charging methodologies such as pulse charging [22,23], boost charging [24], multistage constant current [7,25], and variable current profiles [26] were created to overcome the limitations of simple charging methods. In [27], the authors applied the Taguchi method to a multistage constant current charging method to determine the optimal rapid charging pattern. Similarly, each of the above-mentioned strategies has different methods to search for the optimised current profile for a fast charging strategy. Although all these strategies consider heat dissipation and protecting the battery from overheating, not all consider temperature constraints.
Some authors use artificial intelligence approaches to find the optimal way to charge batteries. One research study [1] used particle swarm optimisation and found a charging profile that could charge batteries to 90% capacity in just 51 min. This method also extended the battery’s life by 22% compared to traditional charging. However, this study did not consider the effects of temperature on the battery. The authors of [28] proposed a battery charger with a fuzzy logic controller charging algorithm that could reduce the charging time by 50% at 4 C. However, this method also failed to take temperature into account. A third study by [29] used a neural network and found an optimised charging current profile that improved the charging time by 7.85% compared to traditional charging. However, all of these studies required many experiments to find the best settings for the algorithm, as noted in [30,31,32].

2.2. Fast Charging as an Optimal Control Problem

Few studies have investigated the fast-charging battery problem formulated as an optimal control problem. The authors of [33] employed a basic model to determine the optimal equilibrium voltage required for a lithium–ion battery. According to the findings, the bang–bang control trajectory is optimal for the charging profile because it “switches from one extreme to the other within the bounds” [33]. The research also presented a robust algorithm but did not consider the temperature to formulate the battery’s dynamics. The authors of reference [34] formulated the problem as an optimal control problem. They used the Legendre–Gauss–Radau pseudo-spectral method with an adaptive mesh refinement algorithm to find numerical solutions. The authors proposed a simple degradation schema based on an empirical model given in [35] but overlooked the need to bind the temperature during charging.
The solution to the battery’s fast-charging optimal control problem is challenging due to the complexity of the underlying models; thus, numerical methods have become indispensable tools for solving them. An approach to solving such problems involves using indirect methods based on the optimality conditions that can be found through the calculus of variations.
Although indirect methods are common in the literature, they experience several drawbacks [36]. Direct methods have been proposed to overcome these drawbacks. One of the direct methods usually employed to solve an optimal control problem involves a global approximation of the solution using a pseudo-spectral approach. Compared with local approximations, these methods provide accurate results but at higher computational costs due to their complexity. Another option that is also used is the local discretisation method. These methods provide enough accuracy at a reasonable computational cost. Also, it is possible to improve the accuracy of these methods by using mesh refinement techniques and multi-runs with a hot start with increasingly finer solution grids. An example of such a method is trapezoidal discretisation [37].

2.3. Battery Models

Broadly speaking, two main modelling strategies have been adopted in the research community to study the behaviour of a rechargeable electrochemical battery cell [38]:
  • Electrochemical modelling of the inner battery cell behaviour;
  • Electric equivalent network or abstract modelling (also called an equivalent circuit model), where the battery is modelled as an electric circuit of passive electronic components.

2.3.1. Electrochemical Models

An electrochemical model provides profound insight into the battery by modelling the internal electrochemical processes using porous electrodes and the concentrated solution theory. There are many plausible electrochemical models for lithium–ion batteries, each with advantages and disadvantages [39]. The author of [40] argues that the electrochemical model is the most suitable model to predict the internal states of the battery, such as ageing or degradation. A well-known model is the porous pseudo-two-dimensional model developed by Doyle, Fuller, and Newman [41,42,43], known by the acronym DFN. The model presented in [44] has extended DFN to include temperature at the expense of increased complexity.
Degradation in lithium–ion batteries is generally associated with a passive film formation on the negative electrode, known as the solid electrolyte interphase. High temperature has been widely recognised as a crucial factor influencing the growth of the solid electrolyte interphase. It is important to recognise that the relationship between the temperature and solid electrolyte interphase growth is not linear and depends on various factors, including battery chemistry, electrode materials, electrolyte composition, and operating conditions [45]. Thus, by limiting the temperature rise, its growth can also be restricted [46,47,48].

2.3.2. Equivalent Circuit Models

The second category, the equivalent circuit model, combines voltage sources, capacitors, and resistors in a circuit that mimics the dynamic behaviour of the battery, as can be measured from the battery terminals. This modelling approach provides good information about the battery, requires low computational efforts, and needs only a few parameters. Equivalent circuit models also offer relatively high accuracy (1–5% error) [49,50]. Although equivalent circuit models do not represent the electrochemical processes that occur inside the battery, they can be tailored to meet specific needs using passive components. These models are also valuable in a straightforward manner, simulating thermal and degradation processes, as indicated in [51]. Moreover, they are relatively economical in terms of computational resources when predicting battery performance under various operating conditions, like the maximum load current, cut-off charging voltage, and state of charge profiles. Many papers in the literature propose different configurations for equivalent circuit models. They include linear parameter-varying observers [52], adaptive sliding mode observers [53], and artificial neural networks [54]. The equivalent circuit model also simplifies the application of extended [55,56], unscented [57], and adaptive Kalman filters [58], as well as particle filters [59]. The author of [40] contends that the equivalent circuit model is unsuitable for exploring internal battery dynamics. In contrast, the same author acknowledges that it is the preferred modelling technique used in implementing algorithms in battery management systems.
Given that an equivalent circuit model does not perform the prediction of detailed electrochemical processes, degradation can only be represented empirically with these models. One attempt to use equivalent circuit techniques to model degradation is the model developed in [60]. The formulation uses artificial intelligence to predict the degradation through a 2-RC model in a CC-CV charging profile. Although the experimental results are satisfactory, the approach for formulating an optimal control problem is not feasible. Reference [34] provides sufficient details to capture battery degradation in an elementary dynamics equation. Furthermore, this mathematical representation of degradation is well-suited for use in an optimal control formulation.
Consequently, and because this study does not need access to an abundance of internal states provided by electrochemical battery models, the conventional equivalent circuit model coupled with a degradation model is considered suitable for this study.

3. Battery’s Fast-Charging Problem Statement

The problem under investigation in this work consists of finding the optimal current profile that will charge a lithium–ion battery in the fastest time by considering the effects of the temperature and battery degradation during exactly one cycle at ambient temperature (25 °C).
The typical charging time for a lithium–ion battery is around 180 min [61], but this varies widely, depending on different factors. This charging time typically represents the period from a partially empty battery, i.e., 20% of capacity, until the state of charge reaches 99% of the total capacity. Generally, the manufacturer suggests a current profile that optimises the charging time in the best possible way to prevent battery damage caused by temperature. However, the manufacturer seldom describes the influence of the temperature in the battery. They solely rely on the charger to avoid prematurely damaging the battery. Interestingly, the manufacturer provides a cut-off time, which does not necessarily guarantee an optimal (or even the fastest) charging profile.
Notably, a lithium–ion battery performs better when exposed to heat [62]. Heat facilitates electron migration and reduces the electrode polarisation [63]. Therefore, a trade-off should exist between the recharge current and the safety margin on the battery’s temperature during charging to prolong its lifetime.
Several considerations typically constrain the fast charging process. There is a lower and upper limit on the voltages across the terminals. Also, the state of charge is constrained to a maximum value, such as 99%. Moreover, some types of lithium–ion batteries cannot be fully discharged, so the state of charge cannot be lower than a specific minimum value, such as 20 % . Furthermore, the terminal voltage must not drop below 2.2 V in many cases because internal Cu elements can induce elevated self-discharge currents and produce an electrical short circuit [64].

3.1. The CC-CV Algorithm

Algorithm 1 describes the constant current–constant voltage (CC-CV) protocol, which is a commonly used charge strategy for lithium–ion batteries. The procedure starts by applying a constant current, I m a x , until the battery reaches v m a x . Then, the current starts decreasing while the voltage is kept constant. The process stops when the current reaches I m i n or the maximum recommended time, T t o t a l , expires. Note that the risk of damaging the battery due to thermal exposure is mitigated through the use of a fixed time. This approach offers a relatively straightforward method of implementation.
Algorithm 1 CC-CV cycle
1: procedure CC-CV ( v m i n , v m a x , I m a x , I m i n , T t o t a l , t s w i t c h )
2:     while  ( v b a t t ( t ) < v m a x and t t s w i t c h ) do
3:         CC charge at I m a x
        end while
4:     while ( | I ( t ) | > I m i n and t T t o t a l ) do
5:         CV constant at v m a x
6:         Decrease I ( t )
        end while
    end of procedure

3.2. The Battery Model

Despite the drawbacks of the equivalent circuit model, it remains extensively utilised in practical engineering applications. This success is due to its simplicity, ease of implementation, and the computational efficiency it offers. Consequently, we decided to adopt this modelling approach in this work. The equivalent circuit model provides enough insight into the battery’s behaviour while limiting complexity. Also, as the equivalent circuit model consists of passive components, it represents the battery dynamics using a relatively simple set of differential equations, making it relatively easy to apply optimal control methods to find the optimal charging current profile.
The research object of this work is the cylindrical lithium–iron–phosphate ( LiFeSO 4 ) battery cell A123 ANR26650M1. Figure 1 shows a simple representation of the equivalent circuit model that can be used to represent this battery cell. The model is based on the Randles model, referred to in the literature as the second-order resistor–capacitor (RC) network, and is considered a grey-box model [65]. Although this model is widely used for the study of lead acid batteries [66], it has been successfully used for lithium–ion battery modelling as well [34]. This simple model has demonstrated good accuracy when compared with experimental data. The model’s accuracy relies on the design of the experiment [57], aimed at calibrating a model’s parameter values, the quality of the acquired experimental data, and the approach used for parameter estimation.
The temperature dependency (and the degradation process) requires that the dynamics of the equivalent circuit model be coupled with a temperature model. A good number of models found in the literature fit this requirement. For example, refs. [67,68,69,70,71] provide different types of models of thermal coupling. However, one of the simplest and best-documented models is found in [72]. The model includes temperature dynamics and an extra equation to consider capacity fading. These additions provide a basic understanding of the evolution of the battery’s capacity during charging cycles.
It is well known that low temperatures reduce battery capacity and performance. Thus, as a general rule, a minimum electrolyte temperature of 278.15 K should be carefully observed [73] to avoid battery damage. Likewise, high temperatures above 308.15 K should be avoided, as they lead to a more significant reduction in the life cycle.

3.3. Mathematical Representation of the Equivalent Circuit Model

The equivalent circuit model represented by the set of differential equations presented in (1) is coupled with a thermal model. The model used in this work corresponds to an equivalent circuit coupled with a thermal model, which allows the problem formulation to specify temperature and voltage path constraints to prevent battery damage. The dynamics of the lithium–ion battery are modelled by the following set of differential equations extracted from [34], but expressed in state space form, as follows:
x ˙ 1 = u 3600 C x ˙ 2 = x 2 R 1 C 1 + u C 1 x ˙ 3 = x 3 R 2 C 2 + u C 2 x ˙ 4 = x 5 x 4 R c C c + ( x 2 + x 3 + u R 0 ) u C c x ˙ 5 = T a x 5 R u C s x 5 x 4 R c C s x ˙ 6 = u 2 ( 3600 ) N ( c , x 4 )
where all variables and parameters are defined in Table 3, u is the input current (referring to the current I ( t ) indicated in Figure 1; we assume u ( t ) I ( t ) ), c is a normalised measure of the electric current defined in Equation (3), which is determined by dividing the current, u, in A by the nominal capacity of the battery in Ah [34].
The function N ( c , x 4 ) is defined by the following:
N ( c , x 4 ) = 3600 A t o l ( c , x 4 ) C
where
c = u C
A t o l ( c , x 4 ) = 20 M ( c ) exp E a ( c ) R x 4 1 2
and
E a ( c ) = 31700 370.3 c
The pre-exponential factor M ( c ) was interpolated from the following experimental values given in [34]: M ( 0.5 ) = 31,630, M ( 2 ) = 21,681, M ( 6 ) = 12,934, and M ( 10 ) = 15,512.
The state vector is defined as follows:
x = [ x 1 x 2 x 3 x 4 x 5 x 6 ] T
The electrical parameters, R u , R c , C s , C c , R 0 , R 1 , R 2 , C 1 , and C 2 were acquired from [75]. It is worth noting that [75] cites [34], which provides the experimental data points from which the values of R 0 , R 1 , R 2 , C 1 , and C 2 are interpolated. Furthermore, the input charging current is, by convention, always positive.
The voltage at the terminals, V T , is given by Equation (6):
V T = V O C ( x 1 ) + x 2 + x 3 + R 0 u
where V O C represents the open circuit voltage. The data points for the V O C (·) curve were extracted digitally from Figure 4 in reference [76]. The actual open circuit voltage value was obtained by using spline interpolation.
In this work, the state of health is defined according to [34]. The authors explain that the model is based on empirical data captured during the experimental battery cycles at different temperatures and charging currents. Furthermore, the model includes degradation due to the cycle charge and calendar ageing.

4. Battery’s Fast-Charging Problem Formulation

This section presents the formulation of the typical fast-charging optimal control problem. In order to fast-charge a lithium–ion battery, it is necessary to determine a charging policy that can charge the battery from a minimum state of charge, usually above the 0% state of charge, to a maximum capacity, typically below 99% of the state of charge, in the shortest possible time, without causing any harm to the battery’s health. The problem can be stated by describing the dynamics of the battery, subject to a finite set of initial conditions, state boundaries, and equality and inequality constraints. As part of the formulation, it is possible to include penalty terms to consider some aspects influencing the charging process.
An optimal control problem is usually formulated as follows. Determine the optimal state trajectory, x ( · ) R n , and the control, u ( · ) R m , such that the functional, J, is optimised in the interval, t [ t 0 , t f ] , where t 0 and t f R are the initial and final times, respectively. The independent variable is t R . The objective functional, J, is given in (7):
J = Ψ ( x ( t 0 ) , t o , x ( t f ) , t f ) + t 0 t f L ( x ( t ) , u ( t ) , t ) d t
where Ψ : R n × R × R n × R R is the end cost, the integral term is the running cost, and the scalar function L : R n × R m × R R is the integrand. The problem is subject to the system state equations
x ˙ = f ( x ( t ) , u ( t ) , t )
Moreover, a set of inequality constraints, known as events, can be used to express the initial and terminal conditions:
e L e [ x ( t 0 ) , u ( t 0 ) , x ( t f ) , u ( t f ) , t 0 , t f ] e U
The problem might also have time-dependent inequality constraints or path constraints:
h L h [ x ( t ) , u ( t ) , t ] h U , t [ t 0 , t f ]
where L and U refer to lower and upper bounds, respectively. The functions f , e and h are defined in Equation (11)
f : R n × R m × [ t 0 , t f ] R n e : R n × R m × R n × R m × R × R R s h : R n × R m × [ t 0 , t f ] R r
where r , s N . There are, in addition, bound constraints on the decision variables as given by Equations (12)–(15)
u L u ( t ) u U , t [ t 0 , t f ] ,
x L x ( t ) x U , t [ t 0 , t f ] ,
t f t 0 0
t f t ^ f
where the last inequality turns into equality when the final time t f is fixed.
Some optimal control problems may be divided into phases, which means that the time domain of the problem is divided into two or more segments, which may overlap. Assuming that the phases are sequential (there is no overlap between the time domain segments), these problems may have discontinuities in the state variables at interior points, as well as discontinuities in the state equations. Furthermore, the performance index may also reflect the phase structure. In this work, we defined three optimal control problems with two phases. For simplicity of presentation, the general optimal control problem defined above involves a single phase. A general multi-phase formulation is given in [37].
Given the nature of the optimal charging time, the optimal control problem will be formulated for three different cases, as shown in Table 4:

4.1. Case 1: Two-Phase Optimal Control Problem with Configurable Switching Time

This formulation represents the emulation of the CC-CV protocol as a minimum-time optimal control problem. The charging process is formulated as a two-phase optimal control problem, with phase 1 defined by the time interval t [ t 0 , t s ] , and phase 2 defined by the time interval t [ t s , t f ] , where t 0 is fixed, and t s and t f , with t s < t f , are free to be chosen. Henceforth, we use the notation ( · ) ( i ) to indicate that the function or variable ( · ) is defined in phase i. In this case, the input current, u, has a given constant value, I 0 , during phase 1, while it is optimised during phase 2. The aim is to find the control trajectory in phase 2, u ( 2 ) ( t ) , t [ t s , t f ] , the state trajectories in phases 1 and 2, x ( 1 ) ( t ) , t [ t 0 , t s ] , and x ( 2 ) , t [ t s , t f ] , respectively, the switching time t s [ t 0 , t f ) , and the final time, t f ( t s , t ^ f ] , where t ^ f is an upper bound for t f , which minimises the objective functional expressed in Equation (16):
J = t f
subject to the dynamics of the battery as shown in Equation (1), with the state variables bounded as per Equation (17)
0.1 x 1 ( 1 , 2 ) 0.99 0.1 x 2 ( 1 , 2 ) 0.6 0.1 x 3 ( 1 , 2 ) 0.6 278.15 x 4 ( 1 , 2 ) 318.15 278.15 x 5 ( 1 , 2 ) 318.15 0 x 6 ( 1 , 2 ) 1.0
with the control variable bounded as per Equation (18):
u ( 1 ) = I 0 0 u ( 2 ) I 0
and a single algebraic path constraint, given by the following:
2.2 V T ( 1 , 2 ) 3.6
with the following definition for the terminal voltage V T ( 1 , 2 )
V T ( 1 , 2 ) = V O C ( x 1 ( 1 , 2 ) ) + x 2 ( 1 , 2 ) + x 3 ( 1 , 2 ) + R 0 u ( 1 , 2 )
where V O C is the open circuit voltage. We use the notation x k ( 1 , 2 ) , with k { 1 , 2 , , 6 } , u ( 1 , 2 ) , and V T ( 1 , 2 ) , to indicate that the same expressions apply for phases 1 and 2.
The initial condition, x ( 1 ) ( t 0 ) , is given by Equation (21), as follows:
x ( 1 ) ( t 0 ) = [ 0.1 , 0 , 0 , 278.15 , 278.15 , 1.0 ] T
The target value for V T ( 1 ) at the final time of phase 1, t s , is given by the Equation (22), representing the voltage at the terminals of the battery at the end of phase 1, as follows:
V T ( 1 ) ( t s ) = V O C ( x 1 ( 1 ) ( t s ) ) + x 2 ( 1 ) ( t s ) + x 3 ( 1 ) ( t s ) + R 0 u ( 1 ) ( t s ) = 3.6
Additionally, the target value for x 1 ( 2 ) at the final time, t f , is given by Equation (23), representing the target state of charge at the end of the charging period, as follows:
x 1 ( 2 ) ( t f ) = 0.99
The linkage constraint between phases 1 and 2 is given by Equation (24), as follows:
x ( 2 ) ( t s ) = x ( 1 ) ( t s )

4.2. Case 2: Two-Phase Optimal Control Problem with Two Path Constraints

This formulation considers the minimisation of the charging time and energy losses. The problem is formulated as a two-phase optimal control problem, with phase 1 defined by the time interval t [ t 0 , t s ] , and phase 2 defined by the time interval t [ t s , t f ] , where t 0 is fixed, and t s and t f , with t s < t f , are free to be chosen. The aim is to find the control trajectory in phases 1 and 2, u ( 1 ) ( t ) , t [ t 0 , t s ] , and u ( 2 ) ( t ) , t [ t s , t f ] , respectively, the state trajectories in phases 1 and 2, x ( 1 ) ( t ) , t [ t 0 , t s ] , and x ( 2 ) , t [ t s , t f ] , respectively, the switching time t s [ t 0 , t f ) , and the final time t f [ t s , t ^ f ] , where t ^ f is an upper bound for t f , which minimises the objective functional expressed in Equation (25).
J = t f + ρ t 0 t s ( u ( 1 ) ) 2 R 0 + ( x 2 ( 1 ) ) 2 R 1 + ( x 3 ( 1 ) ) 2 R 2 d t + ρ t s t f ( u ( 2 ) ) 2 R 0 + ( x 2 ( 2 ) ) 2 R 1 + ( x 3 ( 2 ) ) 2 R 2 d t
where the integral terms represent internal heat losses, and ρ > 0 is a penalty factor.
The state variables for phase 1 are bounded as per (26)
0.1 x 1 ( 1 ) 0.99 0 x 2 ( 1 ) 0.6 0 x 3 ( 1 ) 0.6 278.15 x 4 ( 1 ) 318.15 278.15 x 5 ( 1 ) 318.15 0 x 6 ( 1 ) 1.0
the control is bounded as per Equation (27)
0 u ( 1 ) I m a x
where I m a x is the maximum continuous charging current, and the initial conditions are given by the following:
x ( 1 ) ( t 0 ) = [ 0.1 , 0 , 0 , 278.15 , 278.15 , 1.0 ] T
and two path constraints to safeguard the battery against damage due to under-/over-voltage and temperature gradients are given by the following:
2.2 V T ( 1 ) 3.6 0 ( x 4 ( 1 ) x 5 ( 1 ) ) τ
τ { 1.5 , 5.8 } is a parameter that relaxes the bound on the temperature gradient path constraint.
Furthermore, the following equation defines the terminal voltage V T ( 1 ) :
V T ( 1 ) = V O C ( x 1 ( 1 ) ) + x 2 ( 1 ) + x 3 ( 1 ) + R 0 u ( 1 )
The target value for V T ( 1 ) at the final time of phase 1, t s , is given by the Equation (31), representing the voltage at the terminals of the battery at the end of phase 1, as follows:
V T ( 1 ) ( t s ) = V O C ( x 1 ( 1 ) ( t s ) ) + x 2 ( 1 ) ( t s ) + x 3 ( 1 ) ( t s ) + R 0 u ( 1 ) ( t s ) = 3.6
Similarly, the state variables for phase 2 are bounded as per Equation (32), as follows:
0.1 x 1 ( 2 ) 0.99 0 x 2 ( 2 ) 0.6 0 x 3 ( 2 ) 0.6 278.15 x 4 ( 2 ) 318.15 278.15 x 5 ( 2 ) 318.15 0 x 6 ( 2 ) 1.0
the control is bounded as per Equation (33), as follows:
0 u ( 2 ) I m a x
and two path constraints are given by the following:
2.2 V T ( 2 ) 3.6 0 ( x 4 ( 2 ) x 5 ( 2 ) ) τ
where τ { 1.5 , 5.8 } . Furthermore, the following equation defines the terminal voltage V T :
V T ( 2 ) = V O C ( x 1 ( 2 ) ) + x 2 ( 2 ) + x 3 ( 2 ) + R 0 u ( 2 )
For phase 2, there is a final condition given by Equation (36), as follows:
x 1 ( 2 ) ( t f ) = 0.99
Finally, the linkage constraint between phases 1 and 2 is given by the following:
x ( 2 ) ( t s ) = x ( 1 ) ( t s )

4.3. Case 3: Two-Phase Optimal Control Problem with Two Path Constraints and Parameterisation of the Endpoint Cost

In this case, the endpoint cost is parameterised to reflect a trade-off between the desire to minimise the charging time and battery degradation. As in case 2, the objective functional also includes a term that accounts for energy losses. The charging process is formulated as a two-phase optimal control problem with the parameterisation of the endpoint cost. The aim is to find the control trajectory in phases 1 and 2, u ( 1 ) ( t ) , t [ t 0 , t s ] and u ( 2 ) ( t ) , t [ t s , t f ] , respectively, the state trajectories in phases 1 and 2, x ( 1 ) ( t ) , t [ t 0 , t s ] , and x ( 2 ) , t [ t s , t f ] , respectively, the switching time t s [ t 0 , t f ) , and the final time t f [ t s , t ^ f ] , where t ^ f is an upper bound for t f , which minimises the objective functional expressed in Equation (38). Path constraints similar to those in the previous case have been implemented to safeguard the battery against damage due to under-/over-voltage and temperature gradients.
J = f ( t f , x 6 , β ) + ρ t 0 t s ( u 2 ( 1 ) ) 2 R 0 + ( x 2 ( 1 ) ) 2 R 1 + ( x 3 ( 1 ) ) 2 R 2 d t + ρ t s t f ( u 2 ( 2 ) ) 2 R 0 + ( x 2 ( 2 ) ) 2 R 1 + ( x 3 ( 2 ) ) 2 R 2 d t
where f ( t f , x 6 , β ) is given by the following:
f ( t f , x 6 , β ) = β t f + ( 1 β ) x 6 ( t 0 ) x 6 ( t f )
The parameter β ( 0 β 1 ) determines the trade-off between the charging time and battery degradation when considering the endpoint cost. By adjusting the value of β , it is possible to assign different levels of importance to these factors effectively. A higher value of β would prioritise minimising the charging time, while a lower value would emphasise reducing battery degradation.
The state variables for phase 1 are bounded as per (40), as follows:
0 x 1 ( 1 ) 0.99 0 x 2 ( 1 ) 0.9 0 x 3 ( 1 ) 0.9 278.15 x 4 ( 1 ) 318.15 278.15 x 5 ( 1 ) 318.15 0 x 6 ( 1 ) 1.0
the control is bounded as per Equation (47), as follows:
0 u ( 1 ) I m a x
the initial conditions are given by the following:
x ( 1 ) ( t 0 ) = [ 0.1 , 0 , 0 , 278.15 , 278.15 , 1.0 ] T
and two path constraints are given by the following:
2.2 V T ( 1 ) 3.6 0 ( x 4 ( 1 ) x 5 ( 1 ) ) 1.5
Furthermore, the following equation defines the terminal voltage V T ( 1 ) :
V T ( 1 ) = V O C ( x 1 ( 1 ) ) + x 2 ( 1 ) + x 3 ( 1 ) + R 0 u ( 1 )
The target value for V T ( 1 ) at the final time of phase 1, t s , is given by Equation (45), representing the voltage at the terminals of the battery at the end of phase 1, as follows:
V T ( 1 ) ( t s ) = V O C ( x 1 ( 1 ) ( t s ) ) + x 2 ( 1 ) ( t s ) + x 3 ( 1 ) ( t s ) + R 0 u ( 1 ) ( t s ) = 3.6
Similarly, the state variables for phase 2 are bounded as per Equation (46), as follows:
0.1 x 1 ( 2 ) 0.99 0 x 2 ( 2 ) 0.6 0 x 3 ( 2 ) 0.6 278.15 x 4 ( 2 ) 318.15 278.15 x 5 ( 2 ) 318.15 0 x 6 ( 2 ) 1.0
the control is bounded as per Equation (47), as follows:
0 u ( 2 ) I m a x
and two path constraints are given by the following:
2.2 V T ( 2 ) 3.6 0 ( x 4 ( 2 ) x 5 ( 2 ) ) 1.5
Furthermore, the expressions for the terminal voltage V T ( 2 ) , the terminal constraint, and the linkage constraints are similar to the previous case and are given by Equations (35), (36) and (37), respectively.

5. Results and Discussion

Generally, optimal control problems are challenging to solve analytically; thus, numerical methods are commonly used for their solution [37,77,78,79,80]. This work uses the trapezoidal discretisation method because it results in good accuracy and a relatively fast computational time. Without loss of generality, it is assumed that the initial time is t 0 = 0 .
All computations were performed using PSOPT version 5.0 to numerically implement and solve optimal control problems. PSOPT [74] is an open-source, optimal control solver written in C++, which uses IPOPT Release 13.12 as the nonlinear programming (NLP) solver.
Henceforth, degradation is defined as the difference in the state of health between the initial time and the final time, x 6 ( t 0 ) x 6 ( t f ) .

5.1. Characteristics of the Battery Cell

The specifications of the battery cell being modelled in this work [81] are shown in Table 5:
The nominal battery capacity in amp-hours (Ah), represents the quantity of the electric charge, which can be accumulated during the charge phase, stored in an open circuit, and released during the discharge.

5.2. Case 1: Two-Phase Minimum Time Charging

This case follows the problem formulation described in Section 4.1. The optimal control problem formulation consisted of two phases, where the optimal control solver calculated the switching time between phases, t s , as well as the final time, t f . This case is the emulation of the CC-CV protocol using an optimal control approach. The calculations were performed with different initial constant charging currents during phase 1, u ( 1 ) ( t ) , where u ( 1 ) ( t ) =   I 0 = { 4 C , 5 C , 6 C } , and t [ t 0 , t s ] . The results of the numerical simulation are presented in Table 6. The table reveals the dependency of this switching time on the initial current values, I 0 . Additionally, it shows that the battery degradation rate is 16% lower at 4C (2.68 × 10 5 ) compared to 6C (3.22 × 10 5 ).
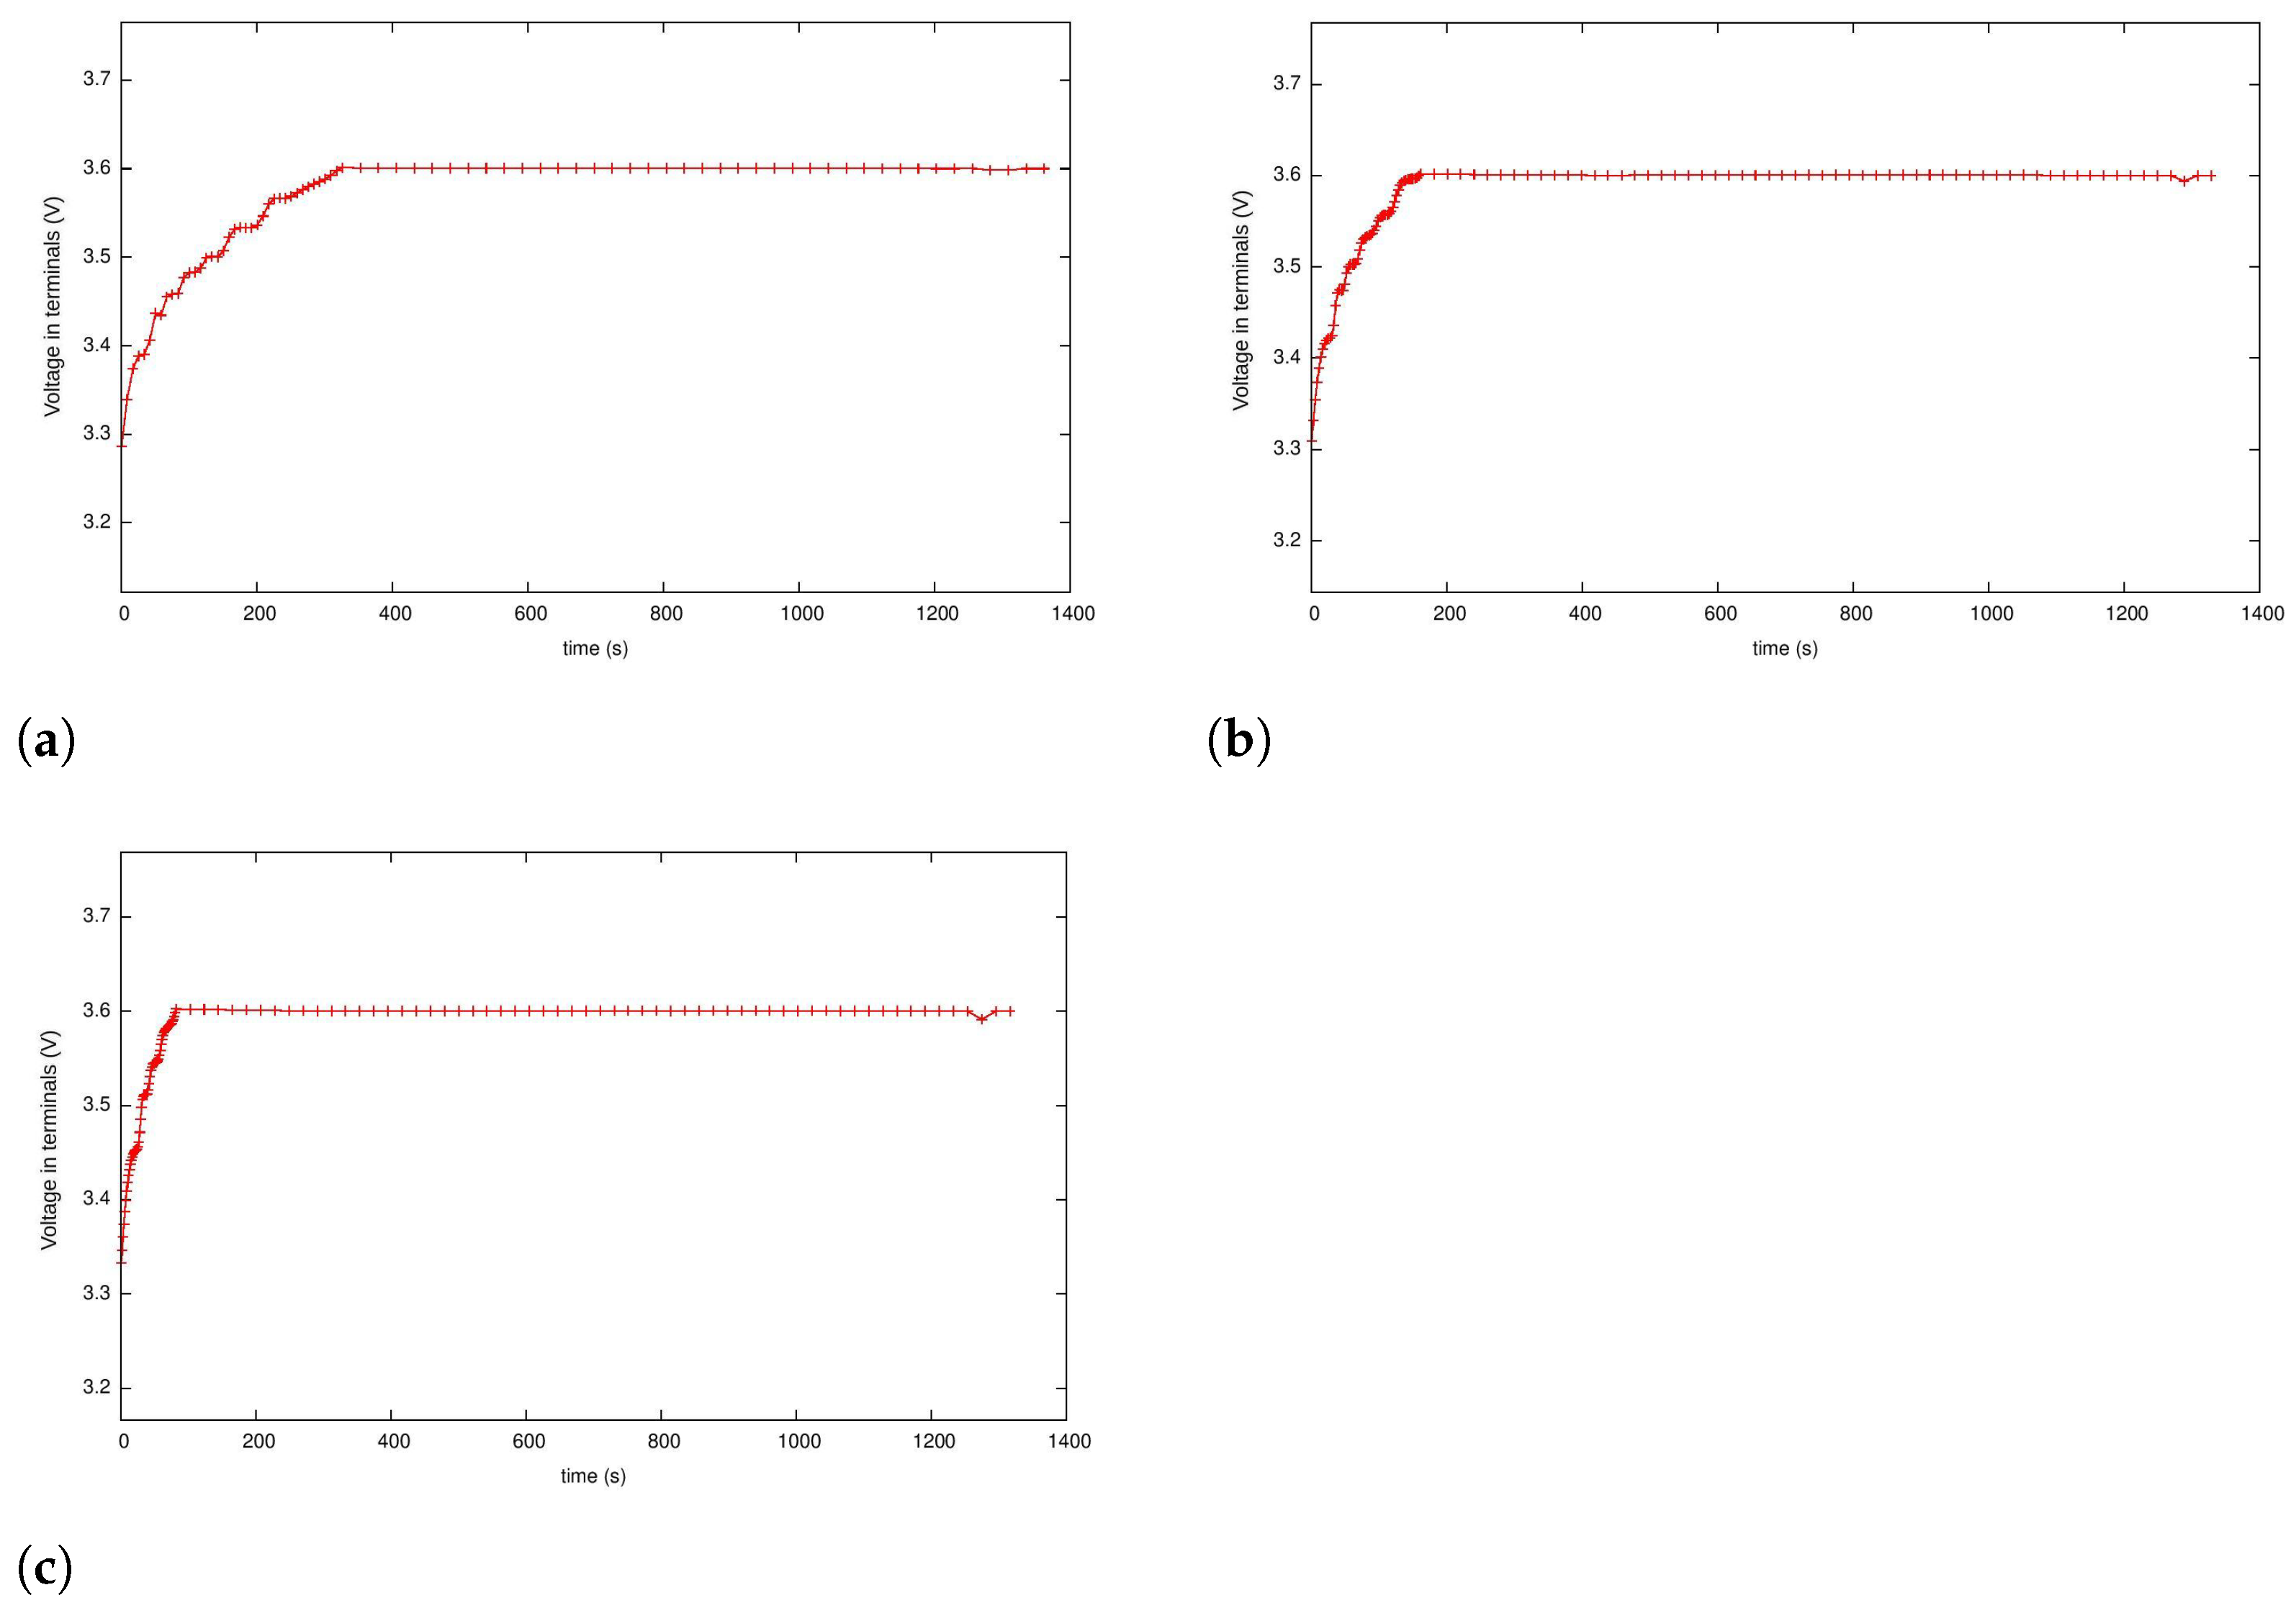
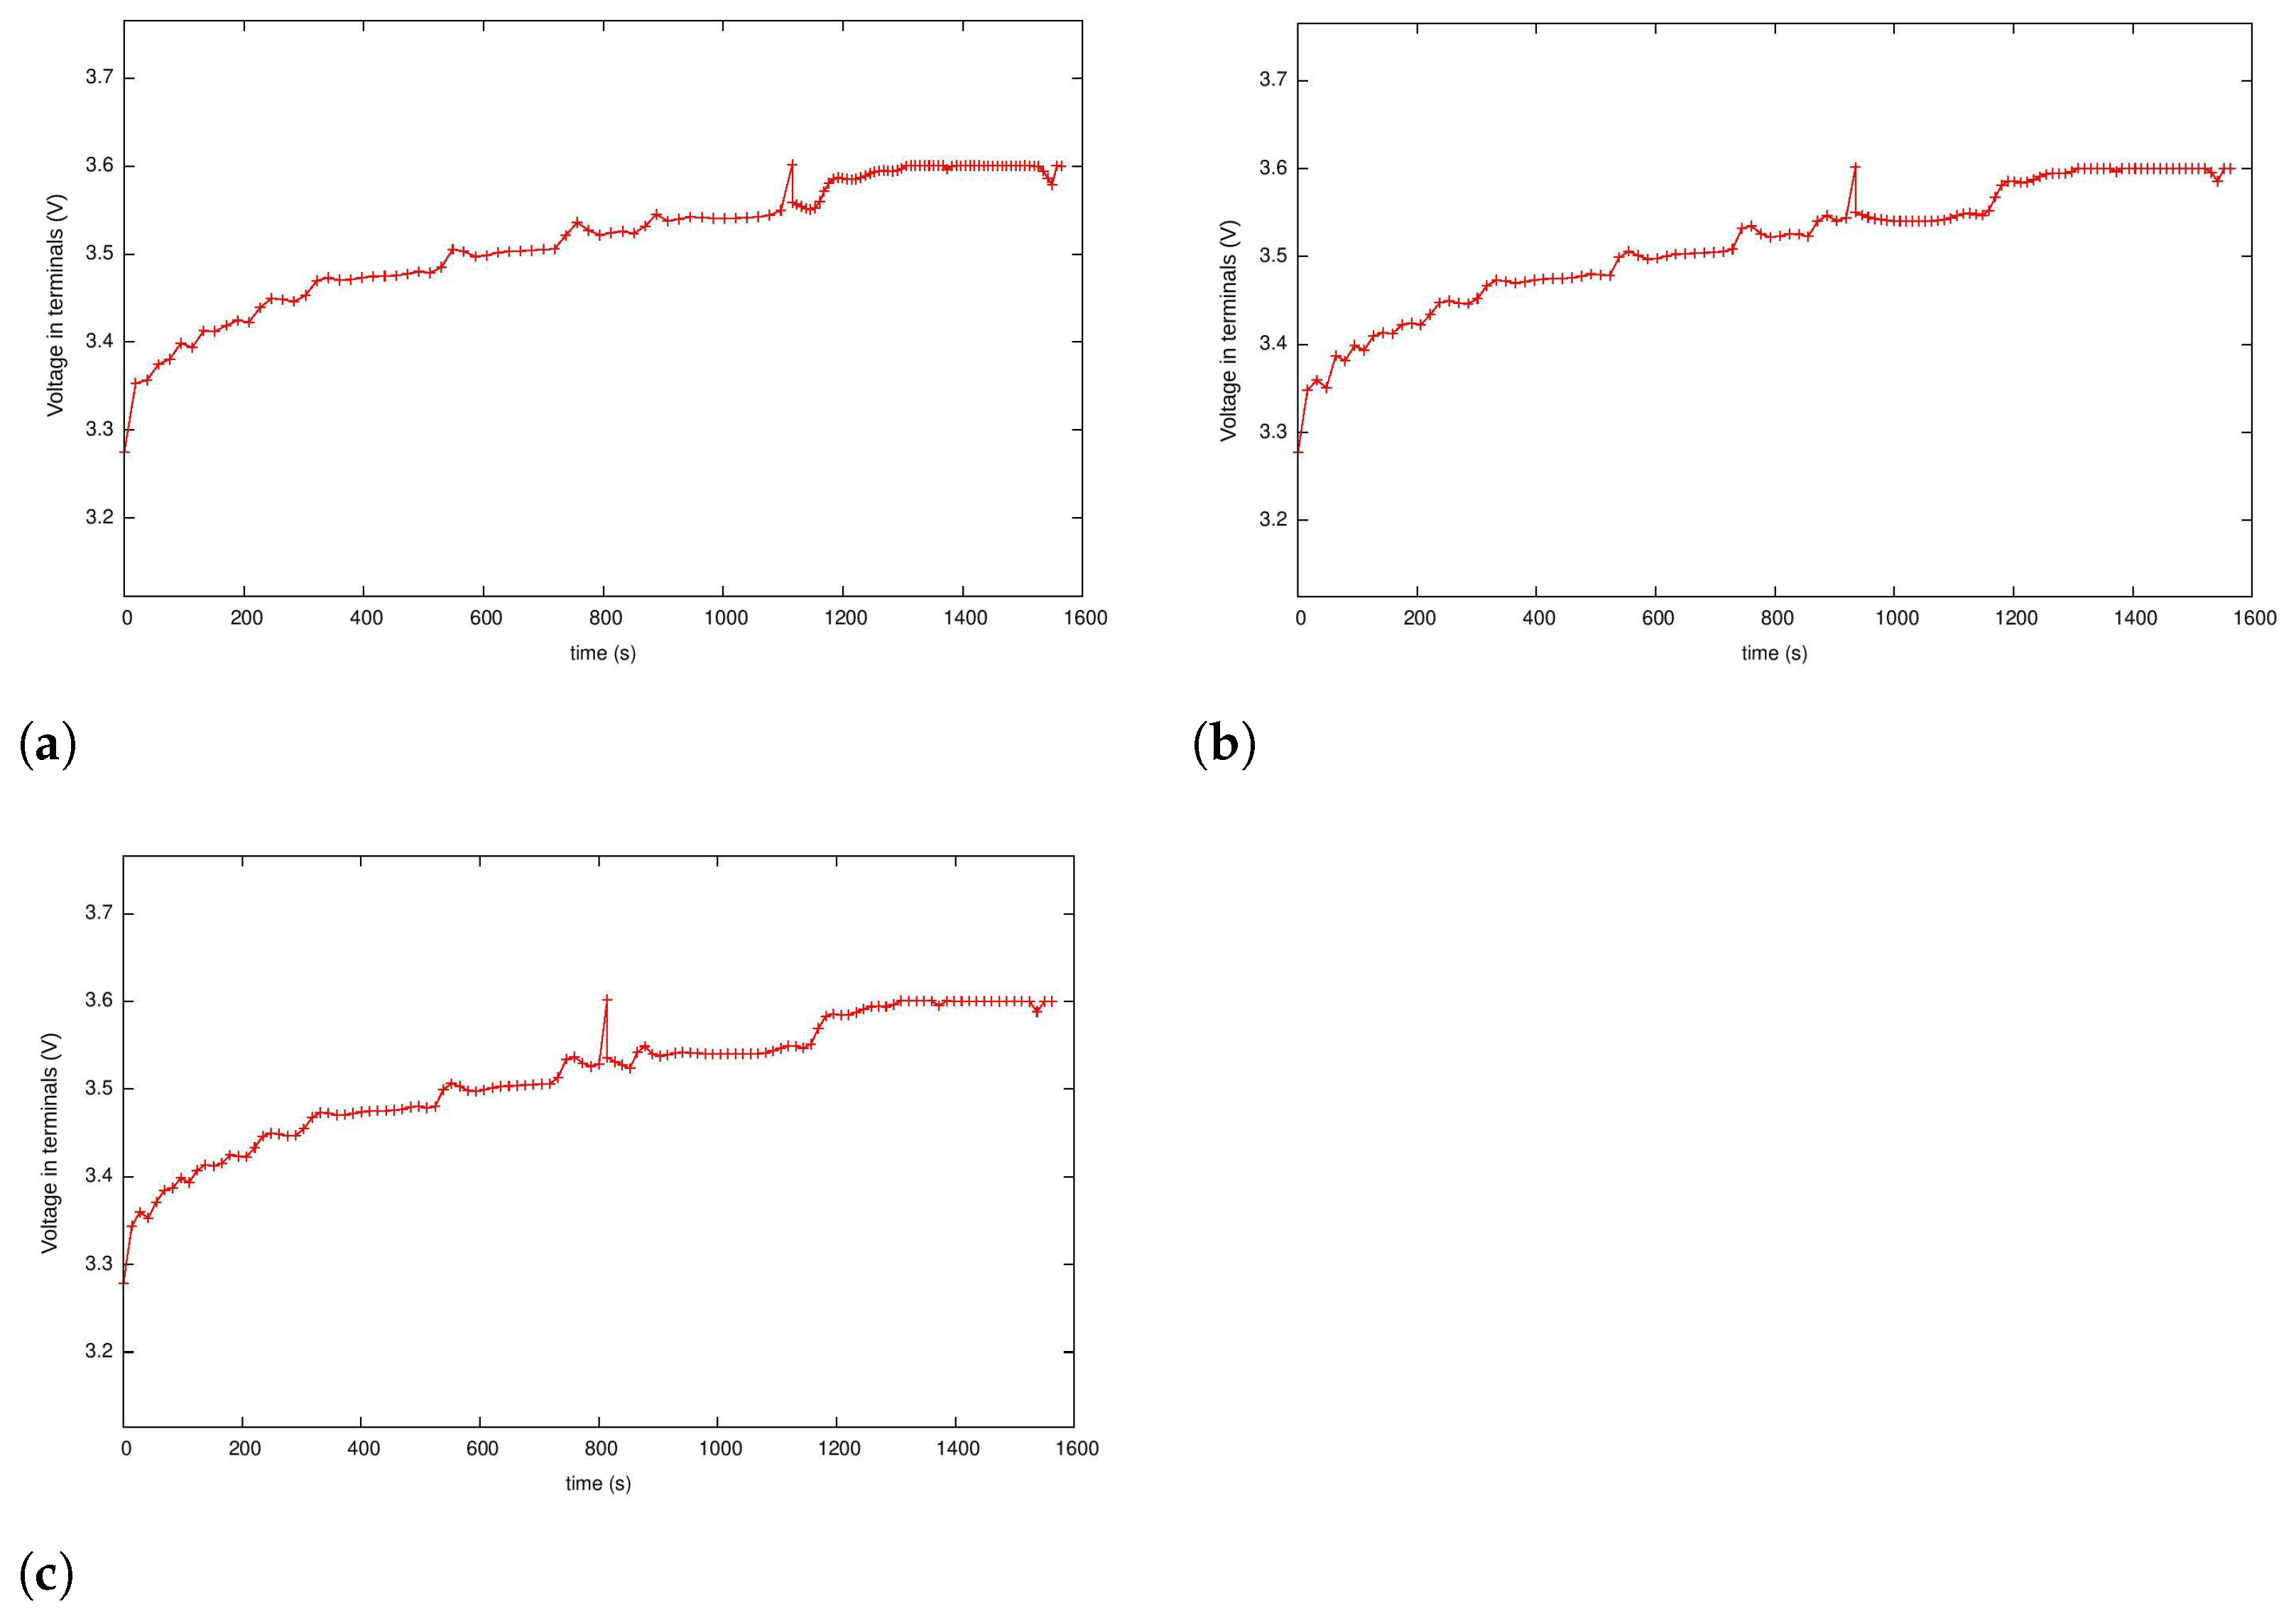
Figure 2 illustrates the control trajectories for all simulated cases, and Figure 3 shows the voltages at the terminals ( V T ). These results show that the proposed emulation results in trajectories that resemble the application of the CC-CV protocol.
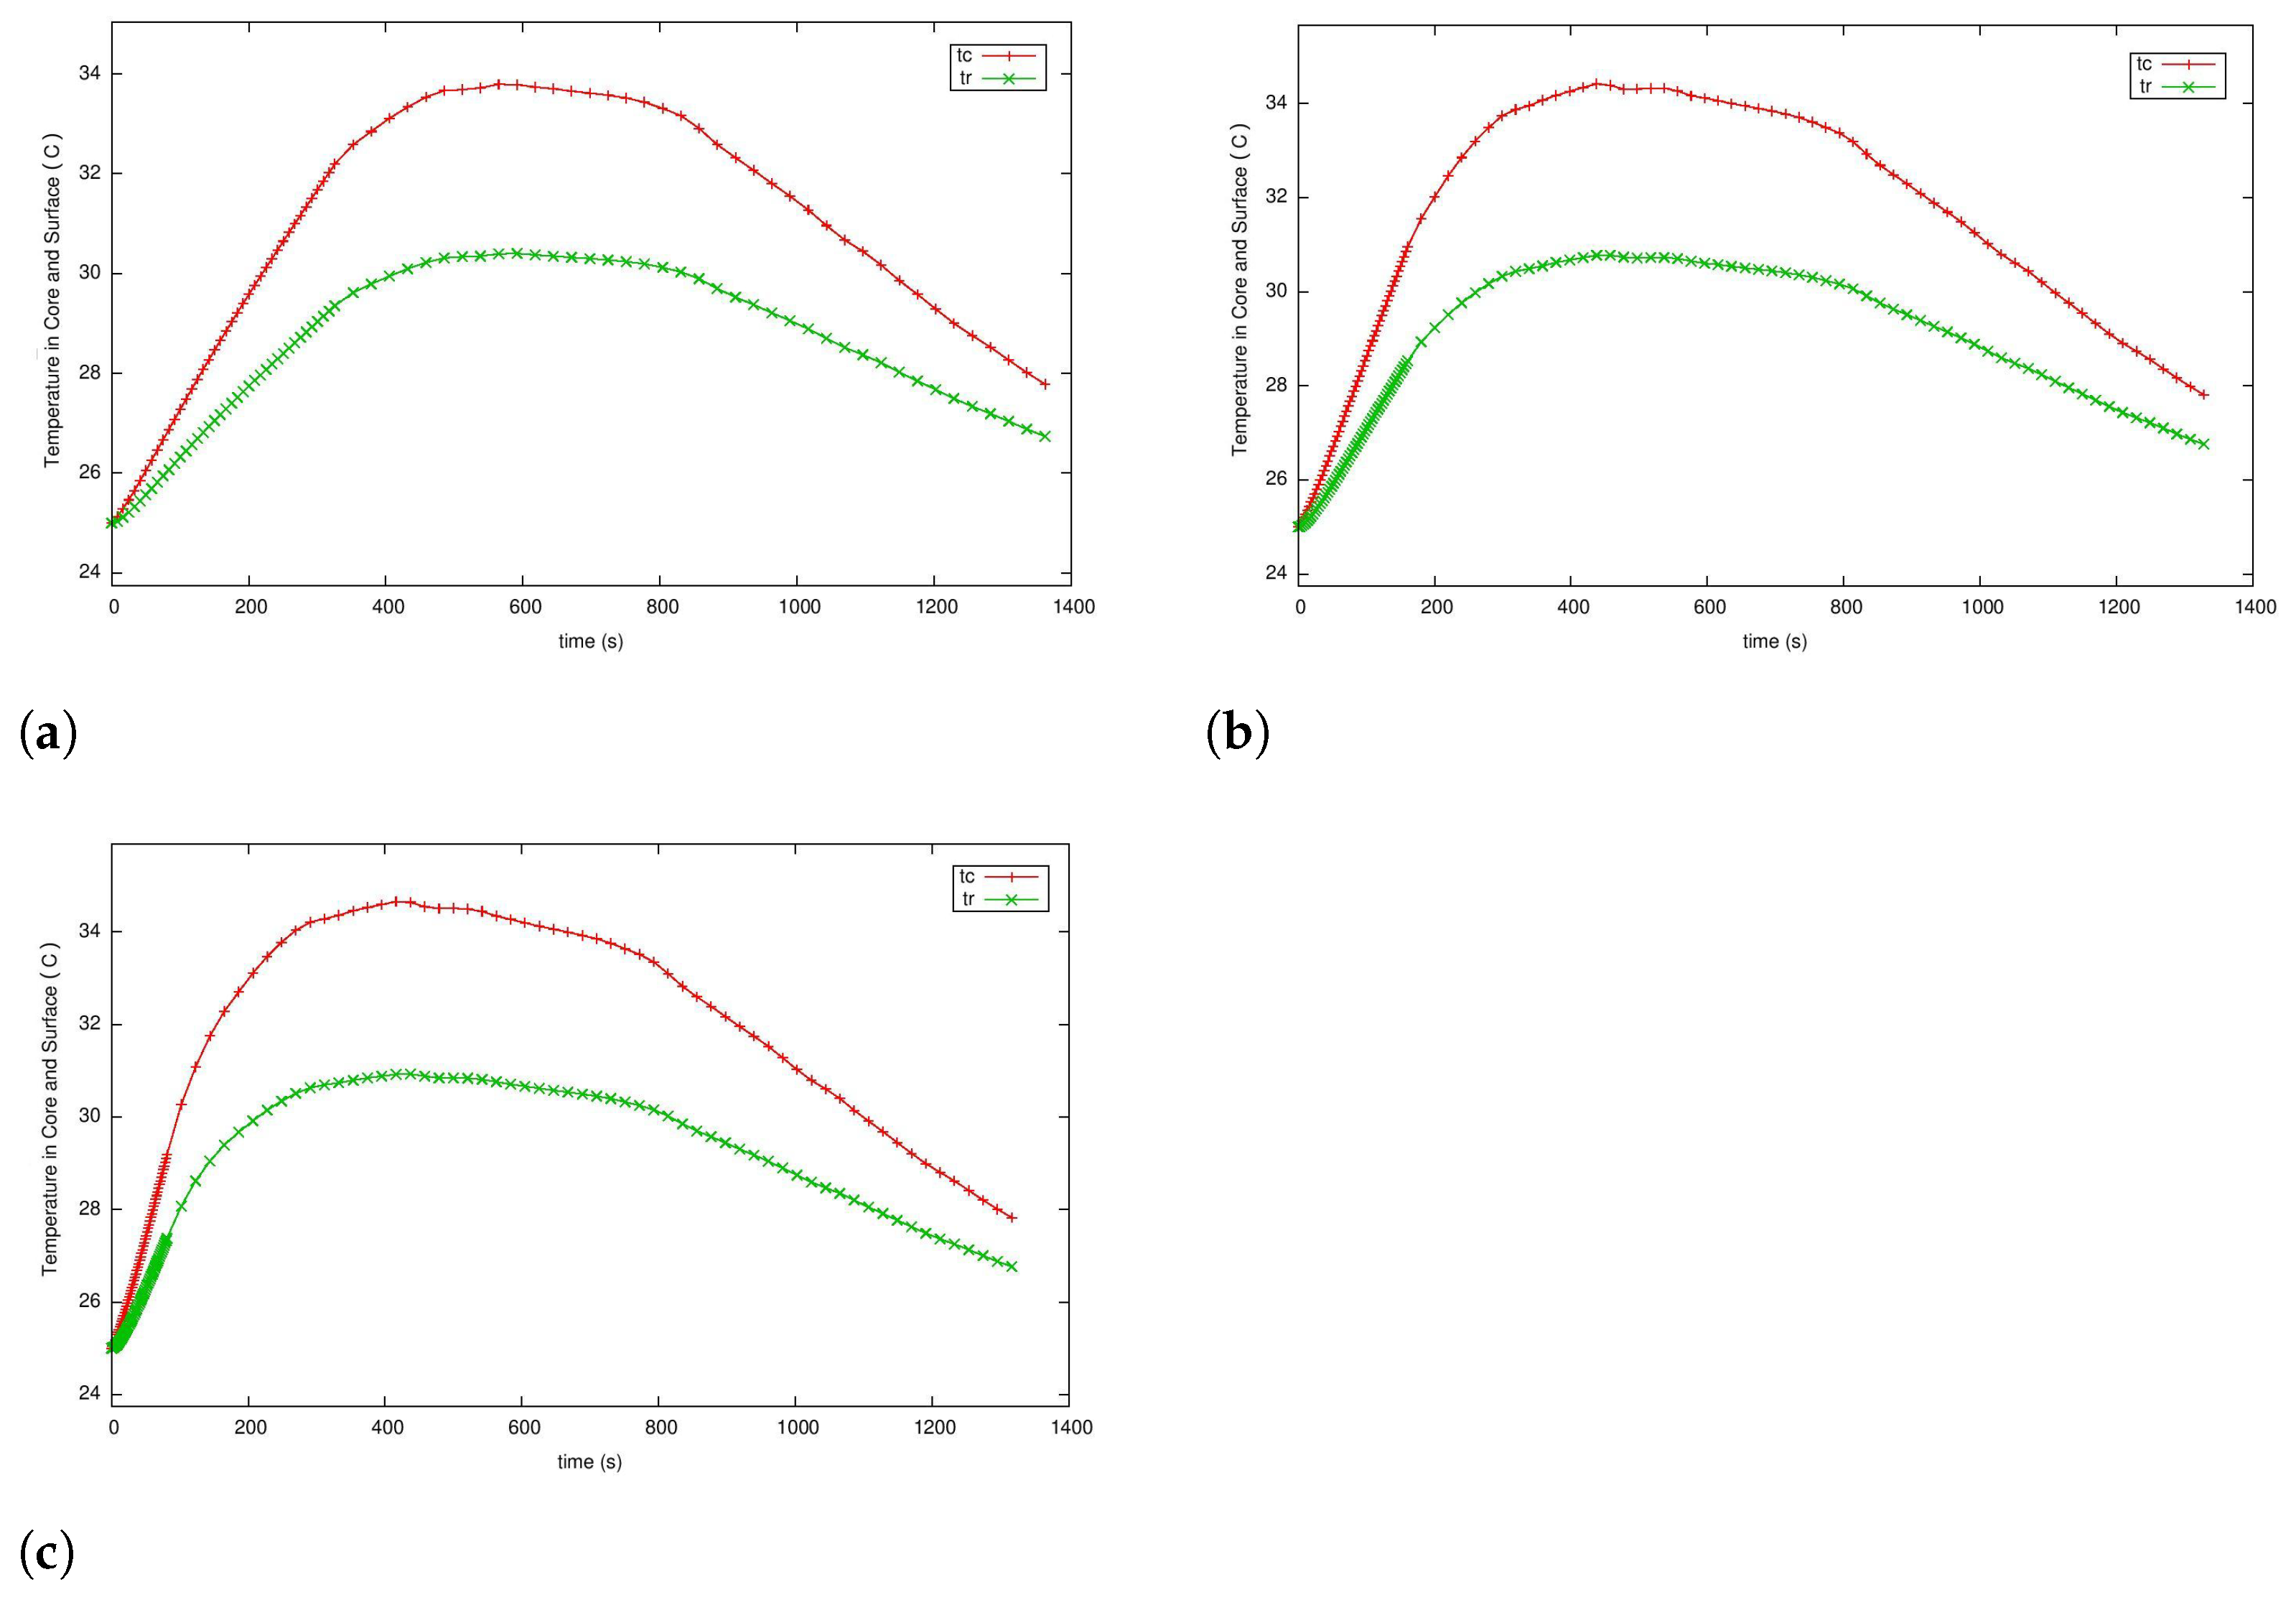
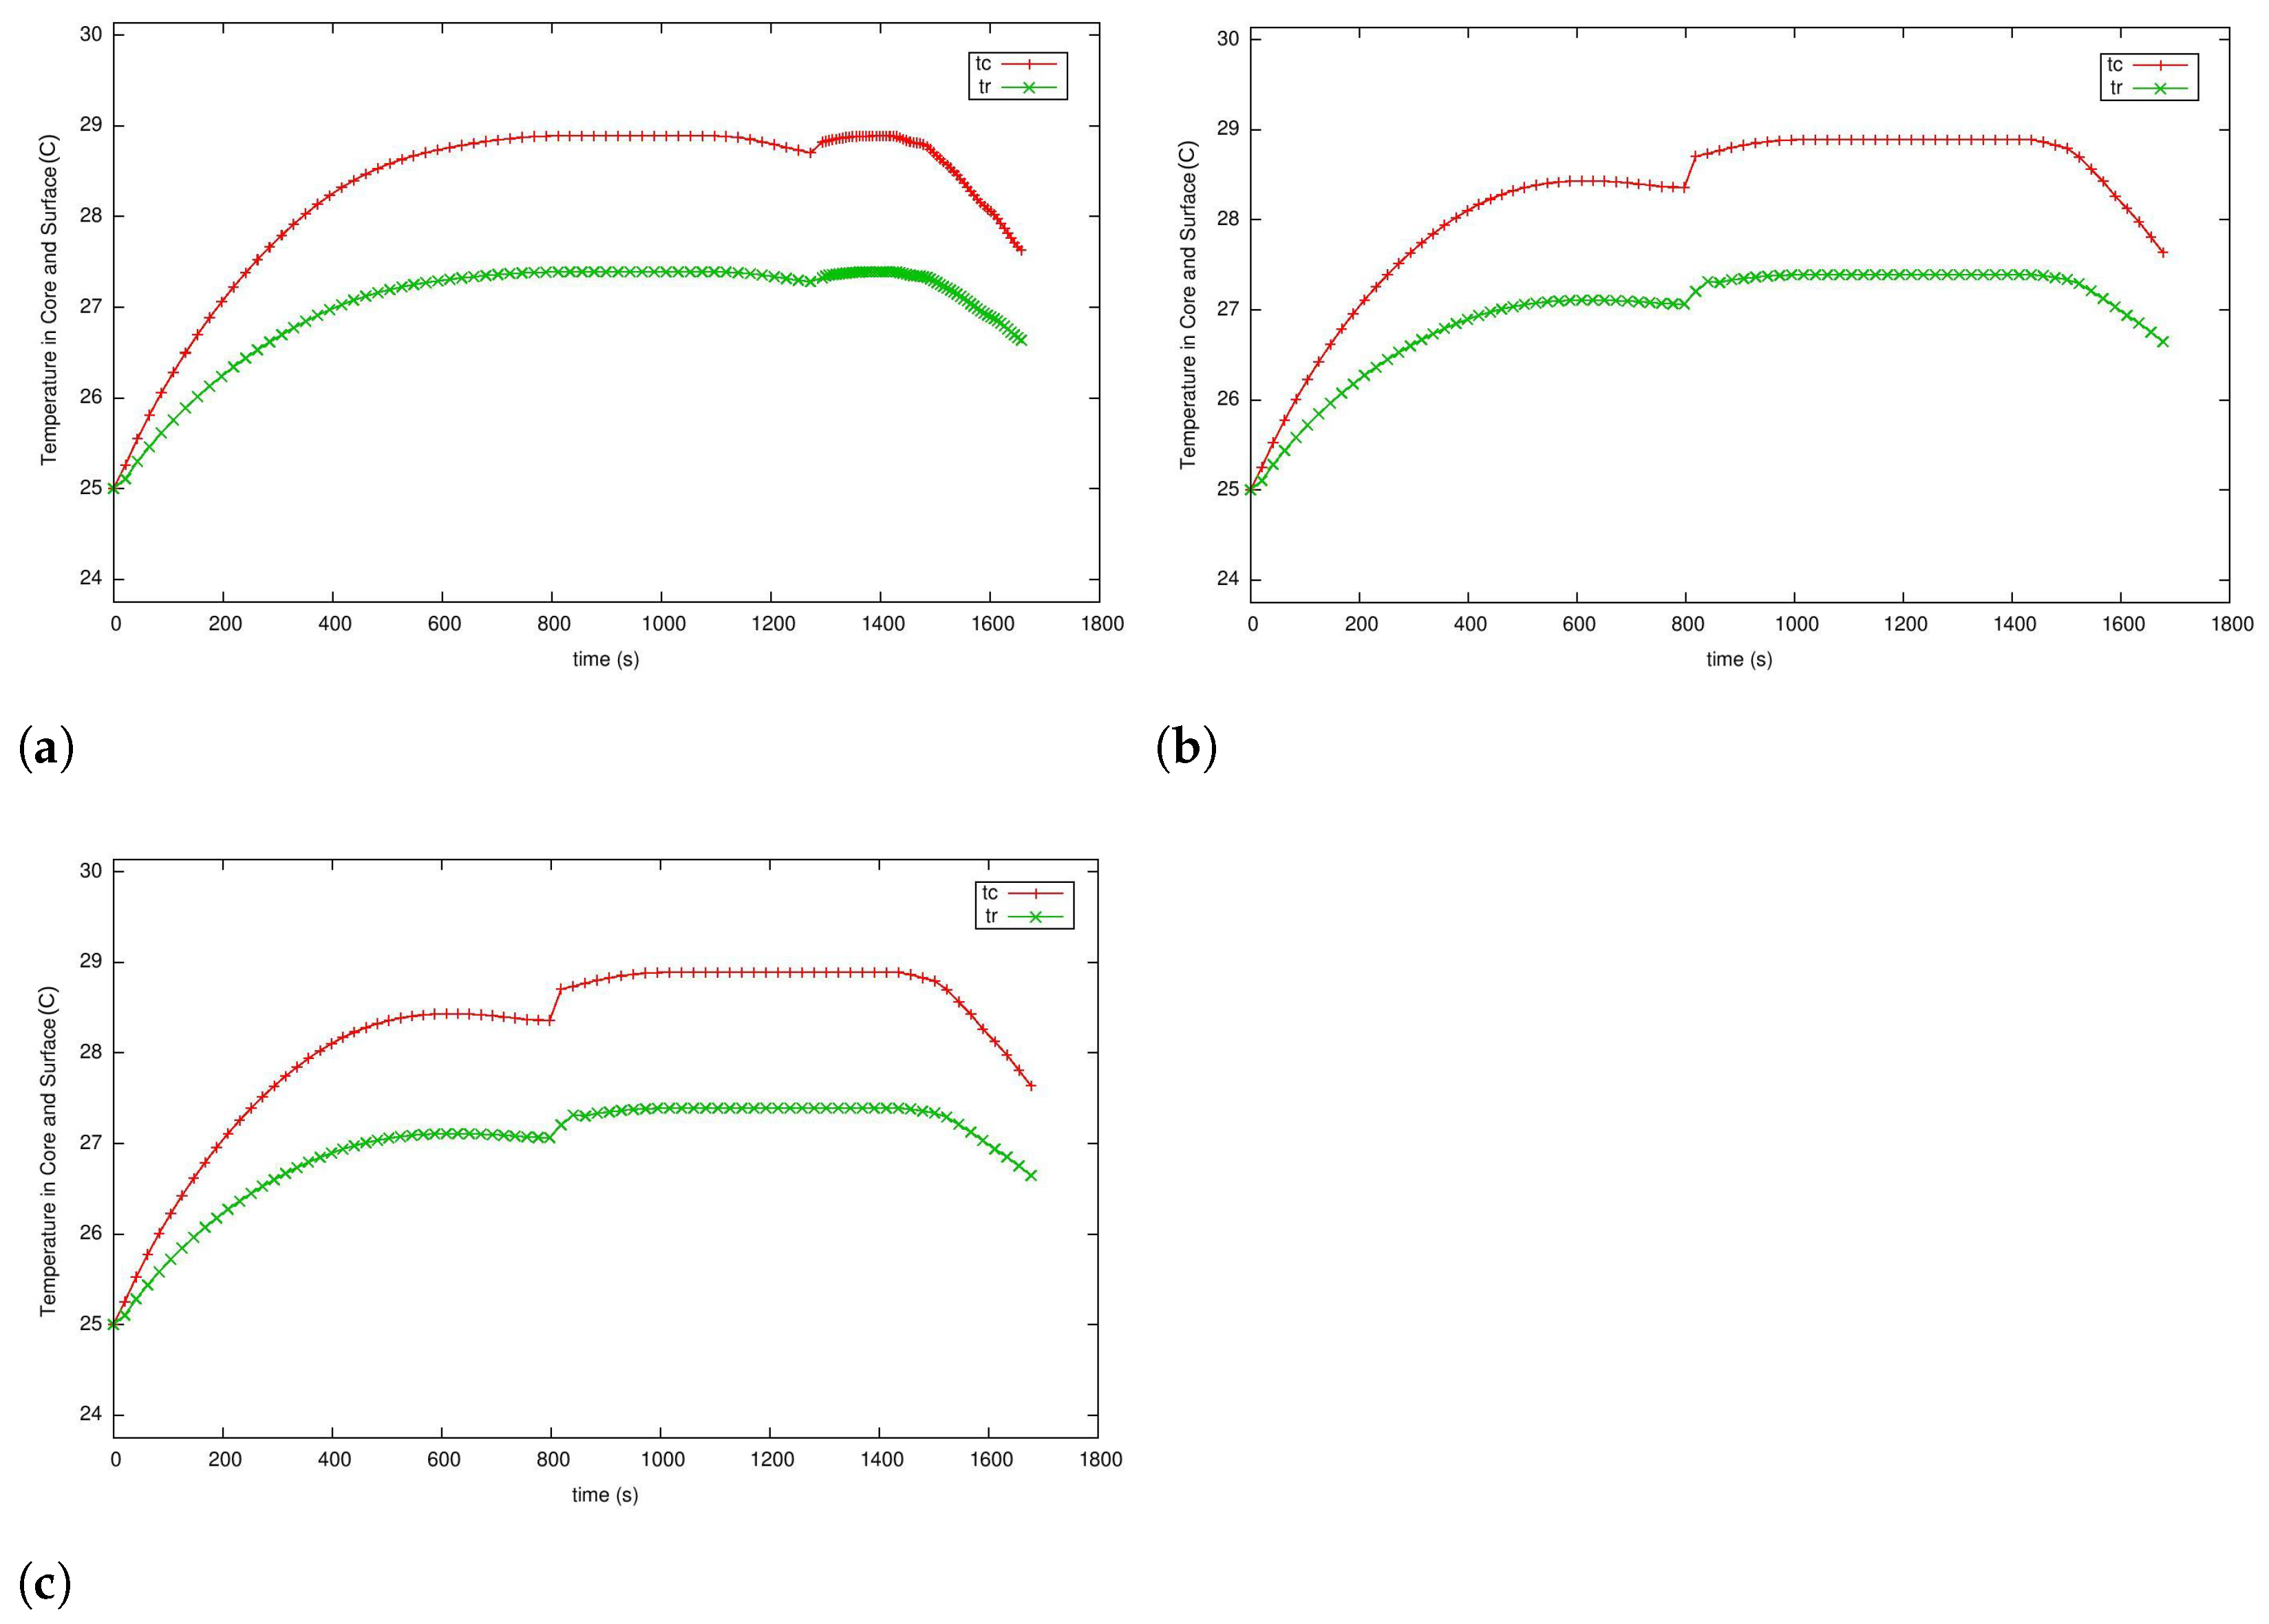
Figure 4 displays the temperatures at the core and cell surfaces for the different simulation cases. As shown in the figure, similar behaviours in the temperature at the core and at the surface are observed for different initial currents. In phase 1, the temperature increases linearly because the applied current is constant. During phase 2, the temperature increases at the start of the phase but decreases as the current approaches zero. Moreover, it is observed that the temperature difference between the core and the surface remains at around 4 K. This difference can be controlled using a temperature path constraint, which will be studied in the next section.
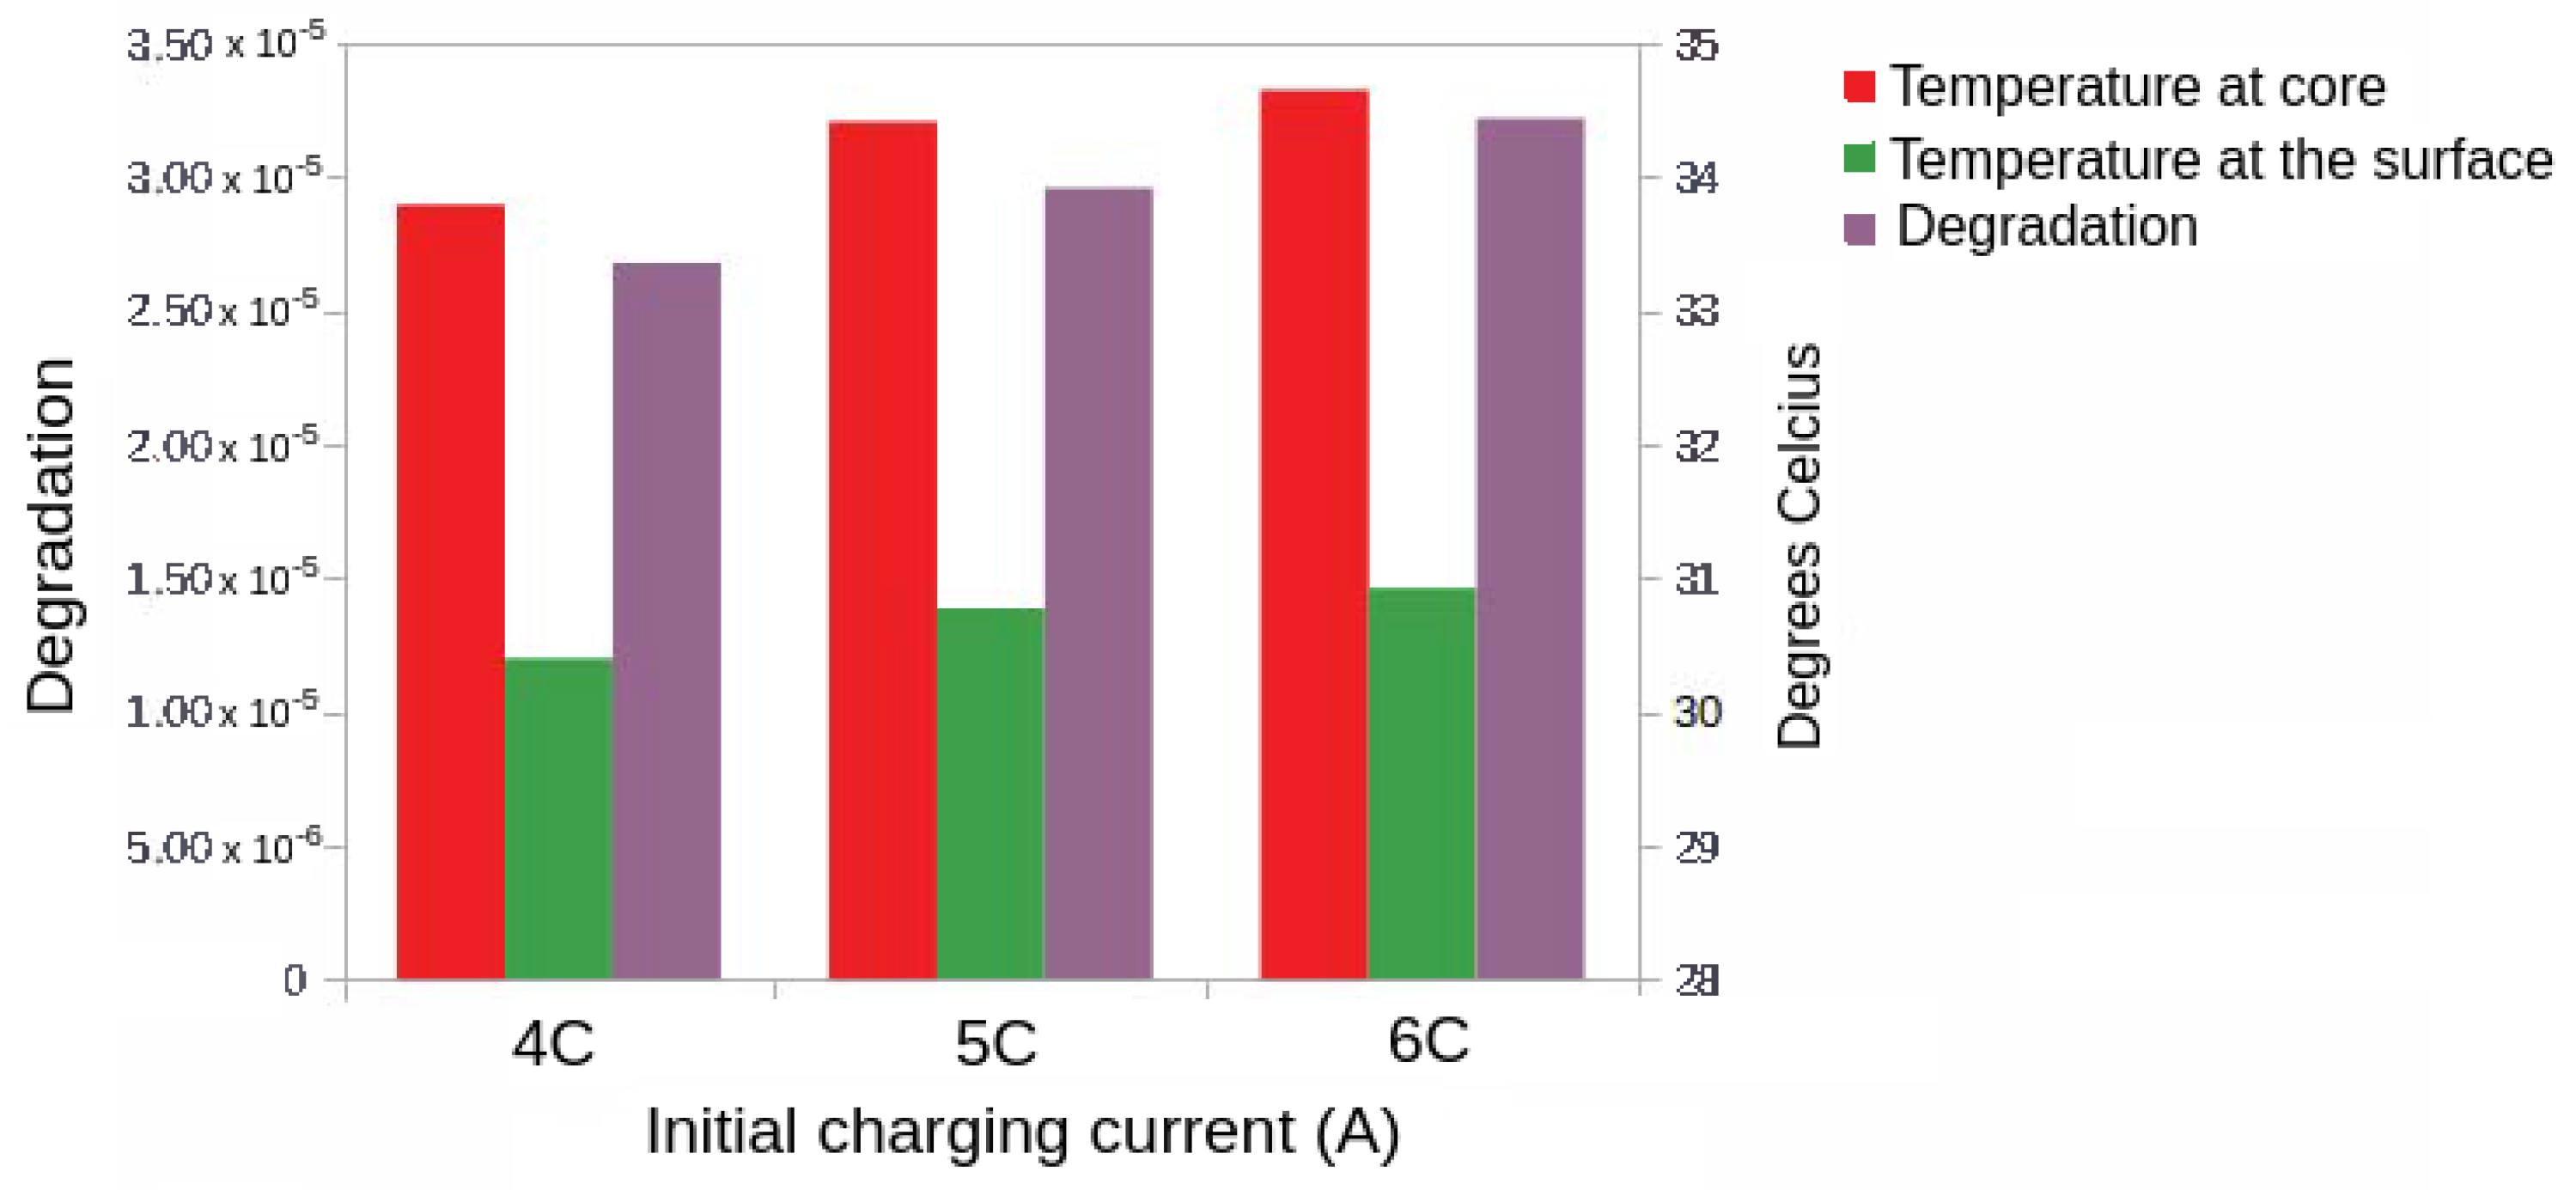
Figure 5 compares the temperature at the core and the surface against degradation. As observed, an increase in the initial current triggers an increase in the temperature at the core and the surface. Thus, the degradation increased as a result of the increase in the temperature.

5.3. Case 2: Fast Charging as a Two-Phase Optimal Control Problem with Temperature and Terminal Voltage Path Constraints

In this case, the formulation of the optimal control problem is according to Section 4.2, A second path constraint is included to manage the temperature gradient between the battery’s core and surface. This constraint is intended to safeguard the battery against temperature-related harm that might result from a rise in the core temperature. The penalty factor for energy losses was chosen as ρ = 1 .

5.4. Case 2a: Fast Charging without Temperature Path Constraint

In this case, the temperature gradient between the core and surface was not constrained, which is equivalent to setting τ = 5.8 K. The simulation was conducted with three values for the maximum charging current.
The solution for the optimal control problem is summarised in Table 7. The results were obtained for the maximum charging current values of 4C, 5C, and 6C. Moreover, the parameter, τ , in Equation (29) is defined as τ = 5.8 K, as suggested by Figure 4c. By setting this upper limit, the temperature path constraint remains inactive throughout the simulation.
The optimal cost remains consistent despite different maximum charging currents. In this scenario, the switching time is 814 s for a 6C maximum input current, down from 1153 for 4C. However, the final time, t f , remains similar at around 1564 s.
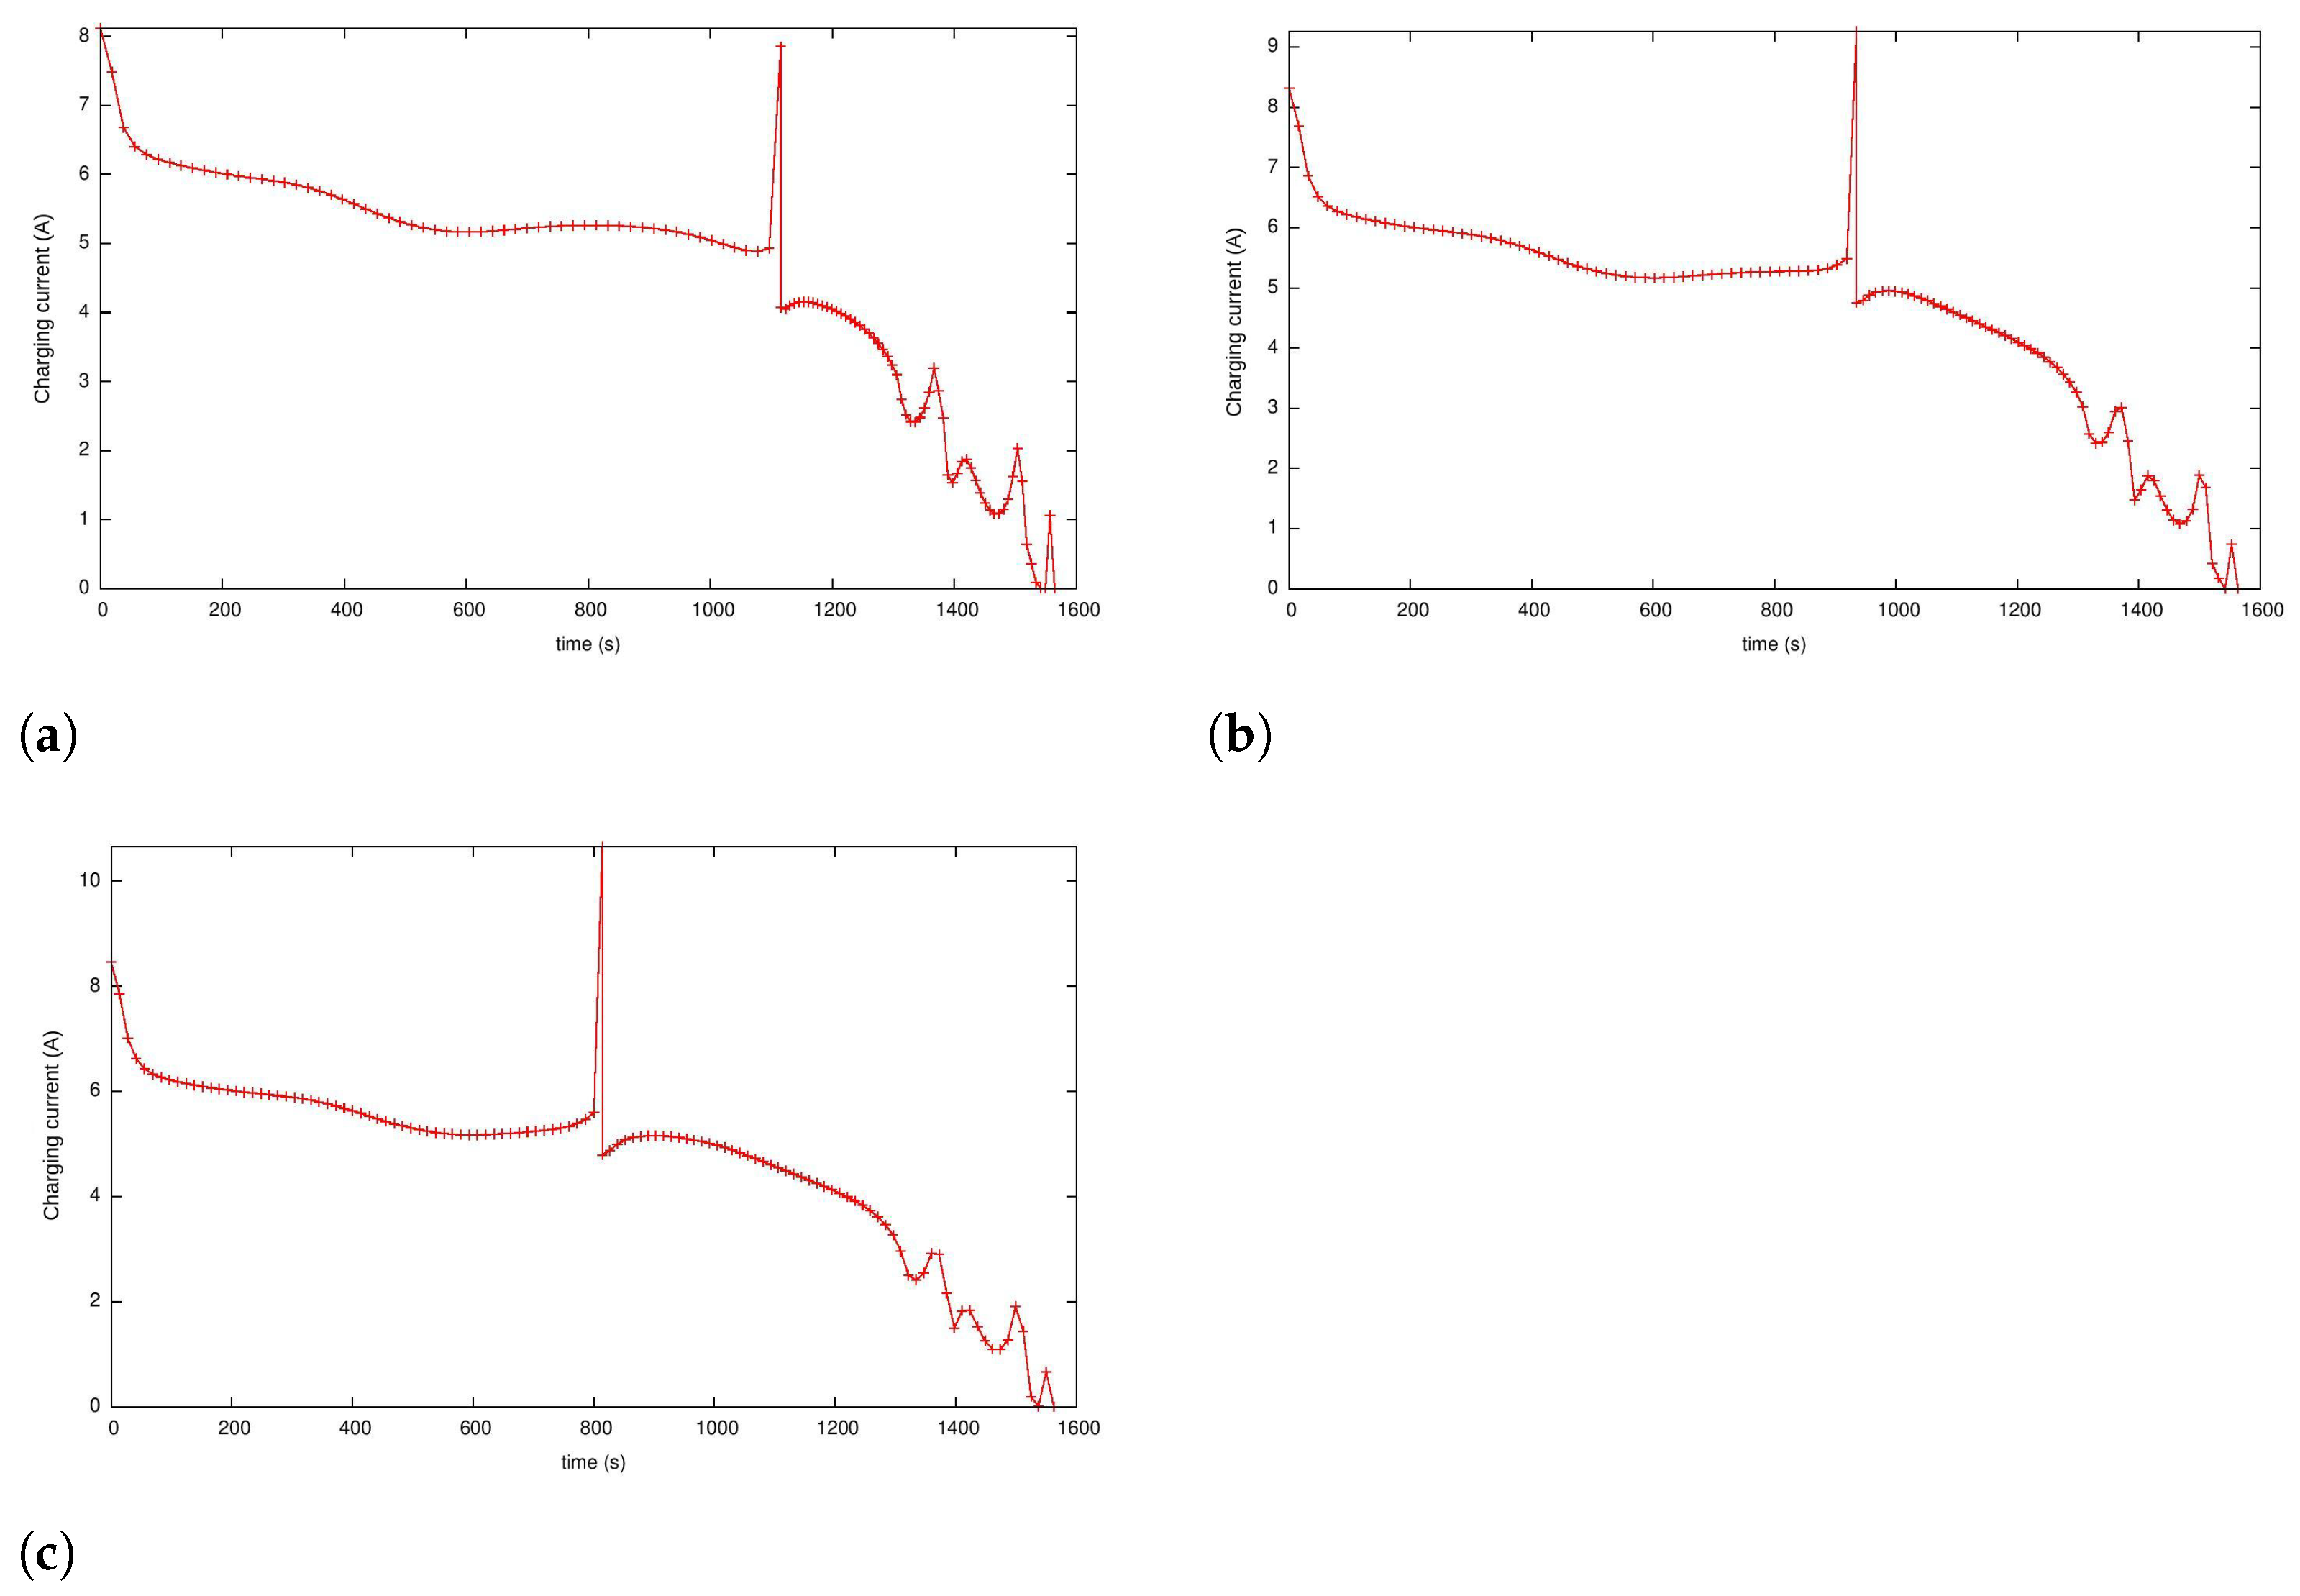
Figure 6 and Figure 7 show the optimal input current trajectories, u, and voltages at the terminals, V T , respectively. Upon analysing these figures, it becomes evident that there is a sudden current surge when the control switches from phase 1 to phase 2. This spike is primarily due to the endpoint constraint at the end of phase 1 ( V T = 3.6 V) that must be met. Consequently, the current increases to raise the voltage and satisfy the endpoint constraint.
A comparison of the temperature in the core and the surface is shown in Figure 8.
The CC-CV protocol emulation results of case 1 show that the temperature difference between the core and the surface of the cell can be as high as 4.5 K. This apparently small temperature difference can cause permanent damage to the battery. Therefore, in the next section, we adjusted the temperature constraint to reduce the temperature gradient to 1.5 K. This modification offers a practical solution to the optimal control problem and ensures that the battery is protected from high-temperature gradients.

5.4.1. Case 2b: Fast Charging with the Temperature Path Constraint

For this experiment, the temperature path constraint was set to protect the battery against a high-temperature difference between its core and the surface. The simulation was conducted with different maximum charging currents, namely 4C, 5C, and 6C.

Results and Discussion

A summary of the numerical results can be found in Table 8. The temperature gradient path constraint limit was set to 1.5 K, resulting in the battery taking more time to reach its final target of a 99% state of charge, compared with the previous case. Specifically, it took around 1660 s to reach this target. Similarly, the switching time increased because the battery needed more charge to reach the endpoint constraint in phase 1, V T ( 1 ) , which was set at 3.6 V.
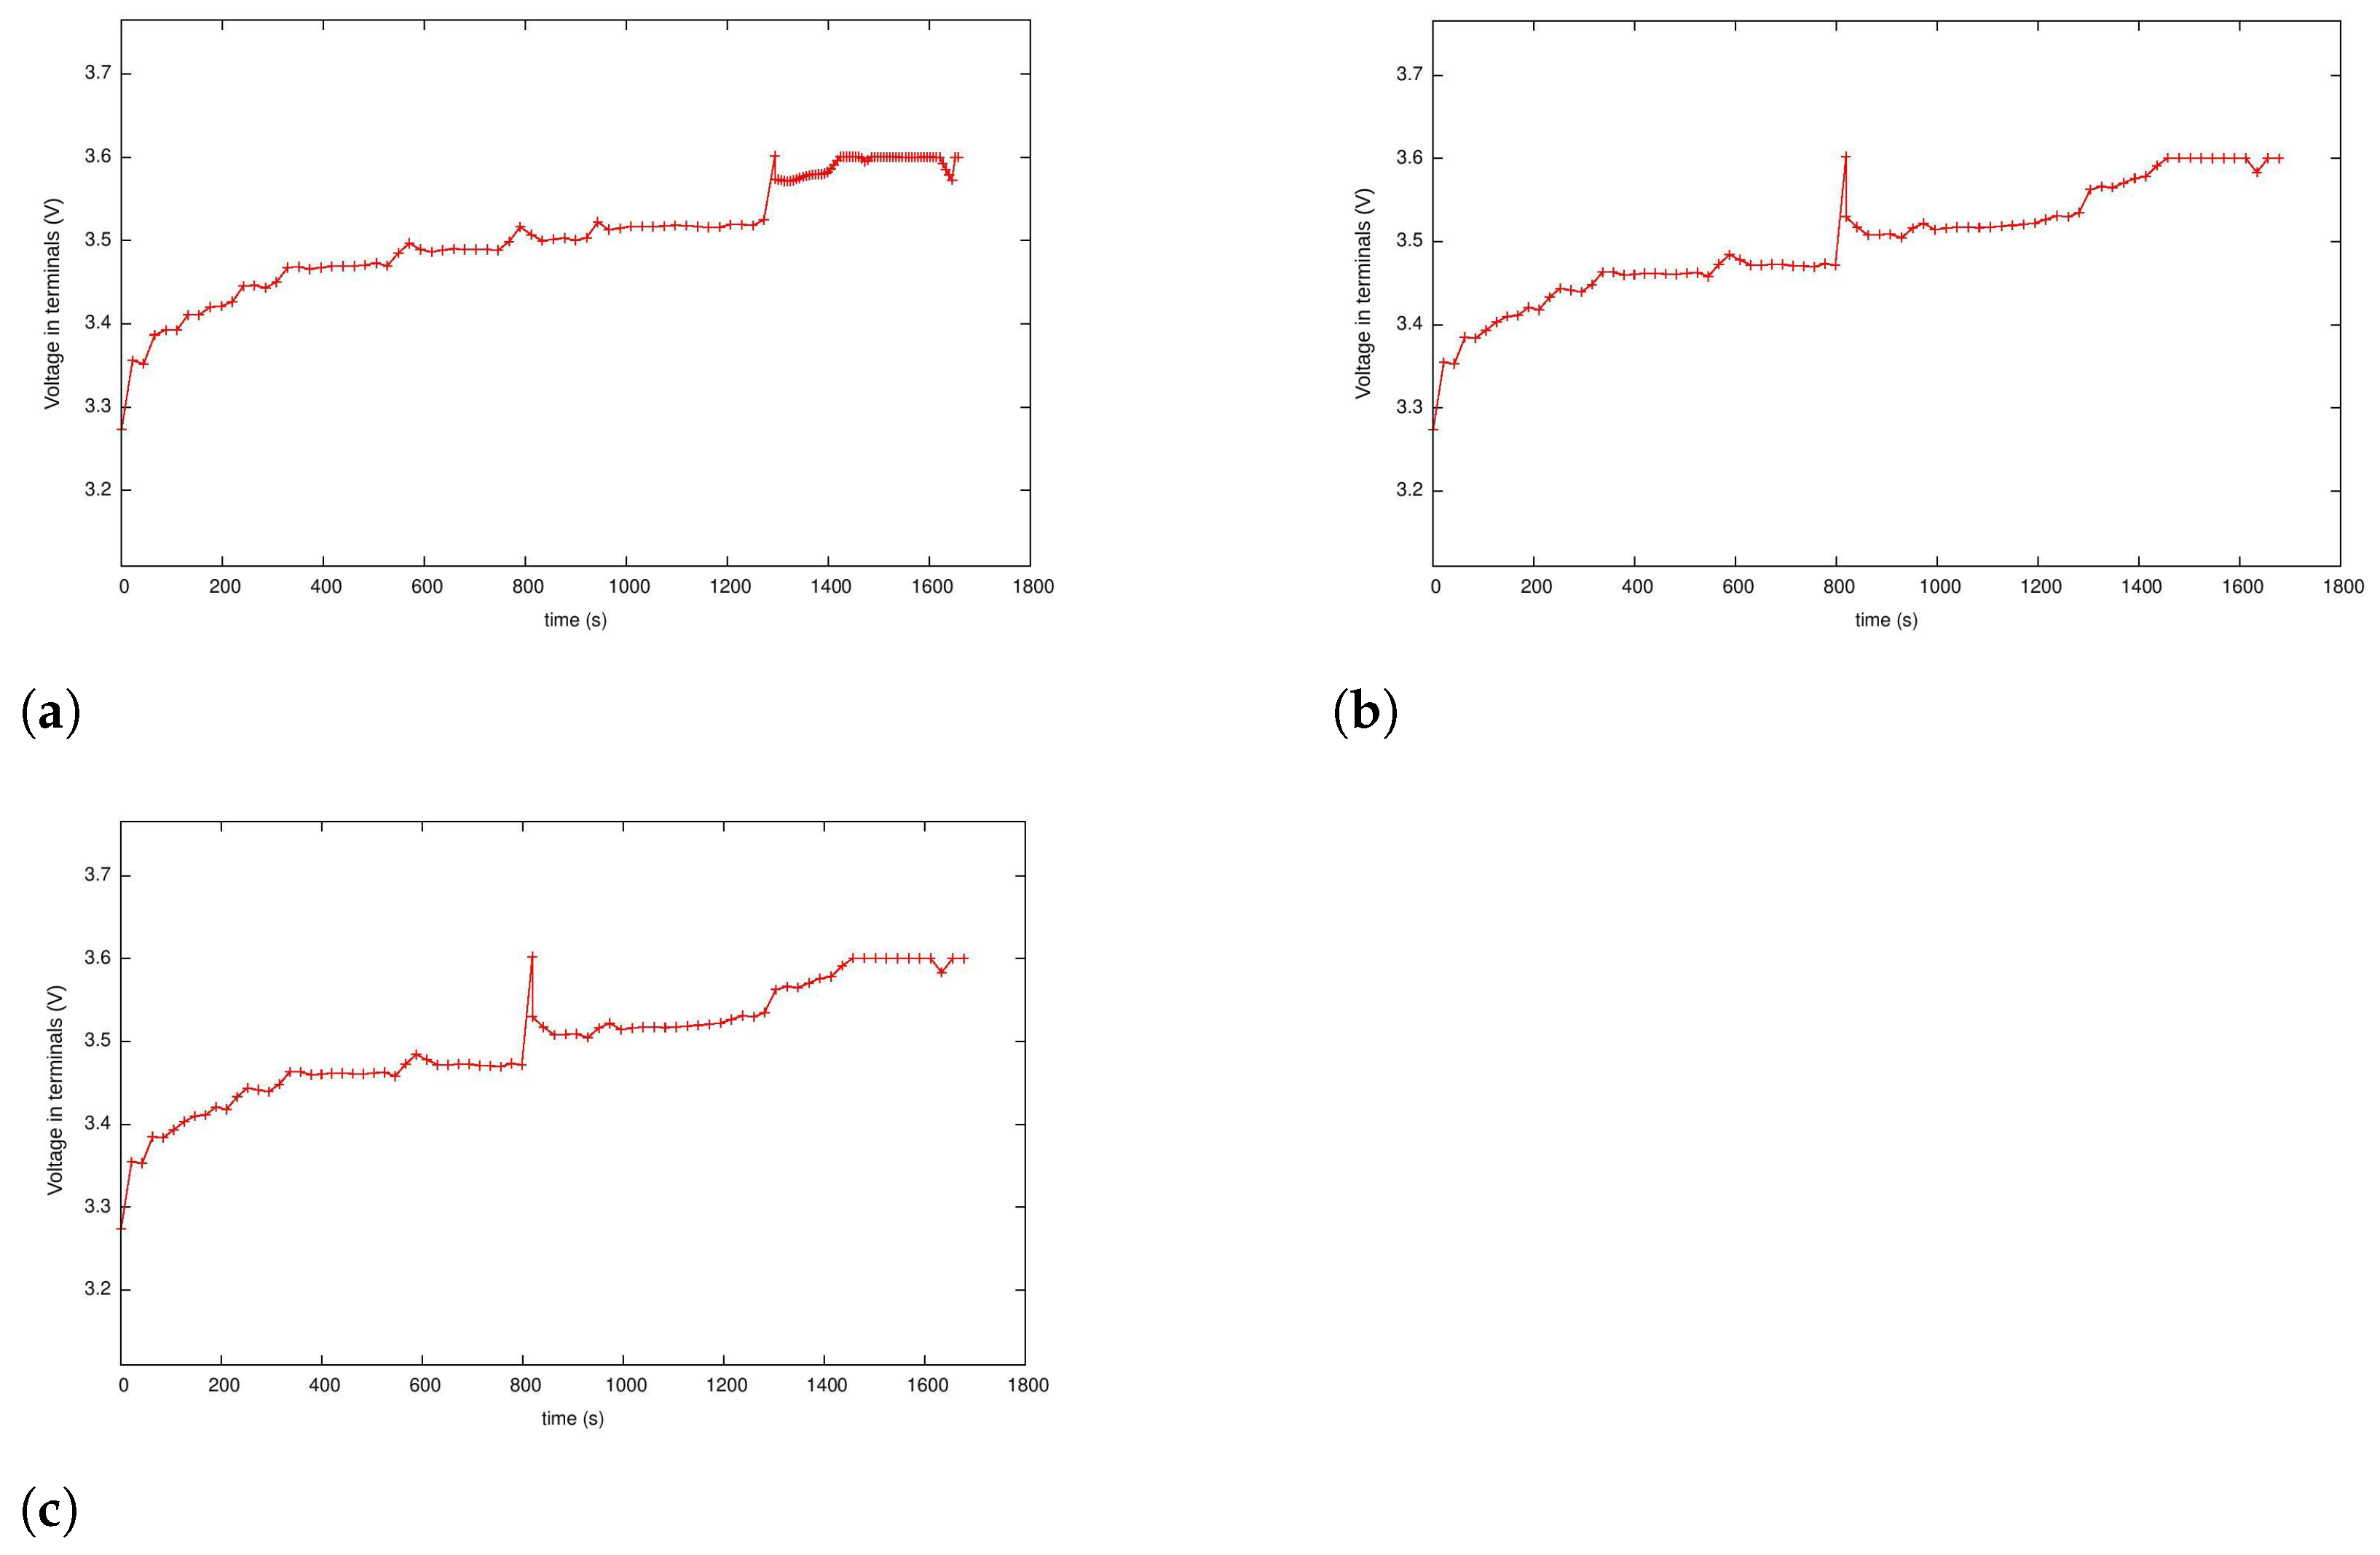
The optimal trajectory for the charging current is shown in Figure 9, and the terminal voltage is shown in Figure 10. As can be observed, there is a spike in the current to enforce the terminal constraint in phase 1. Furthermore, the terminal voltage increased to 3.6 V—as expected at the end of phase 1—but returned to a lower value in phase 2, before increasing again.
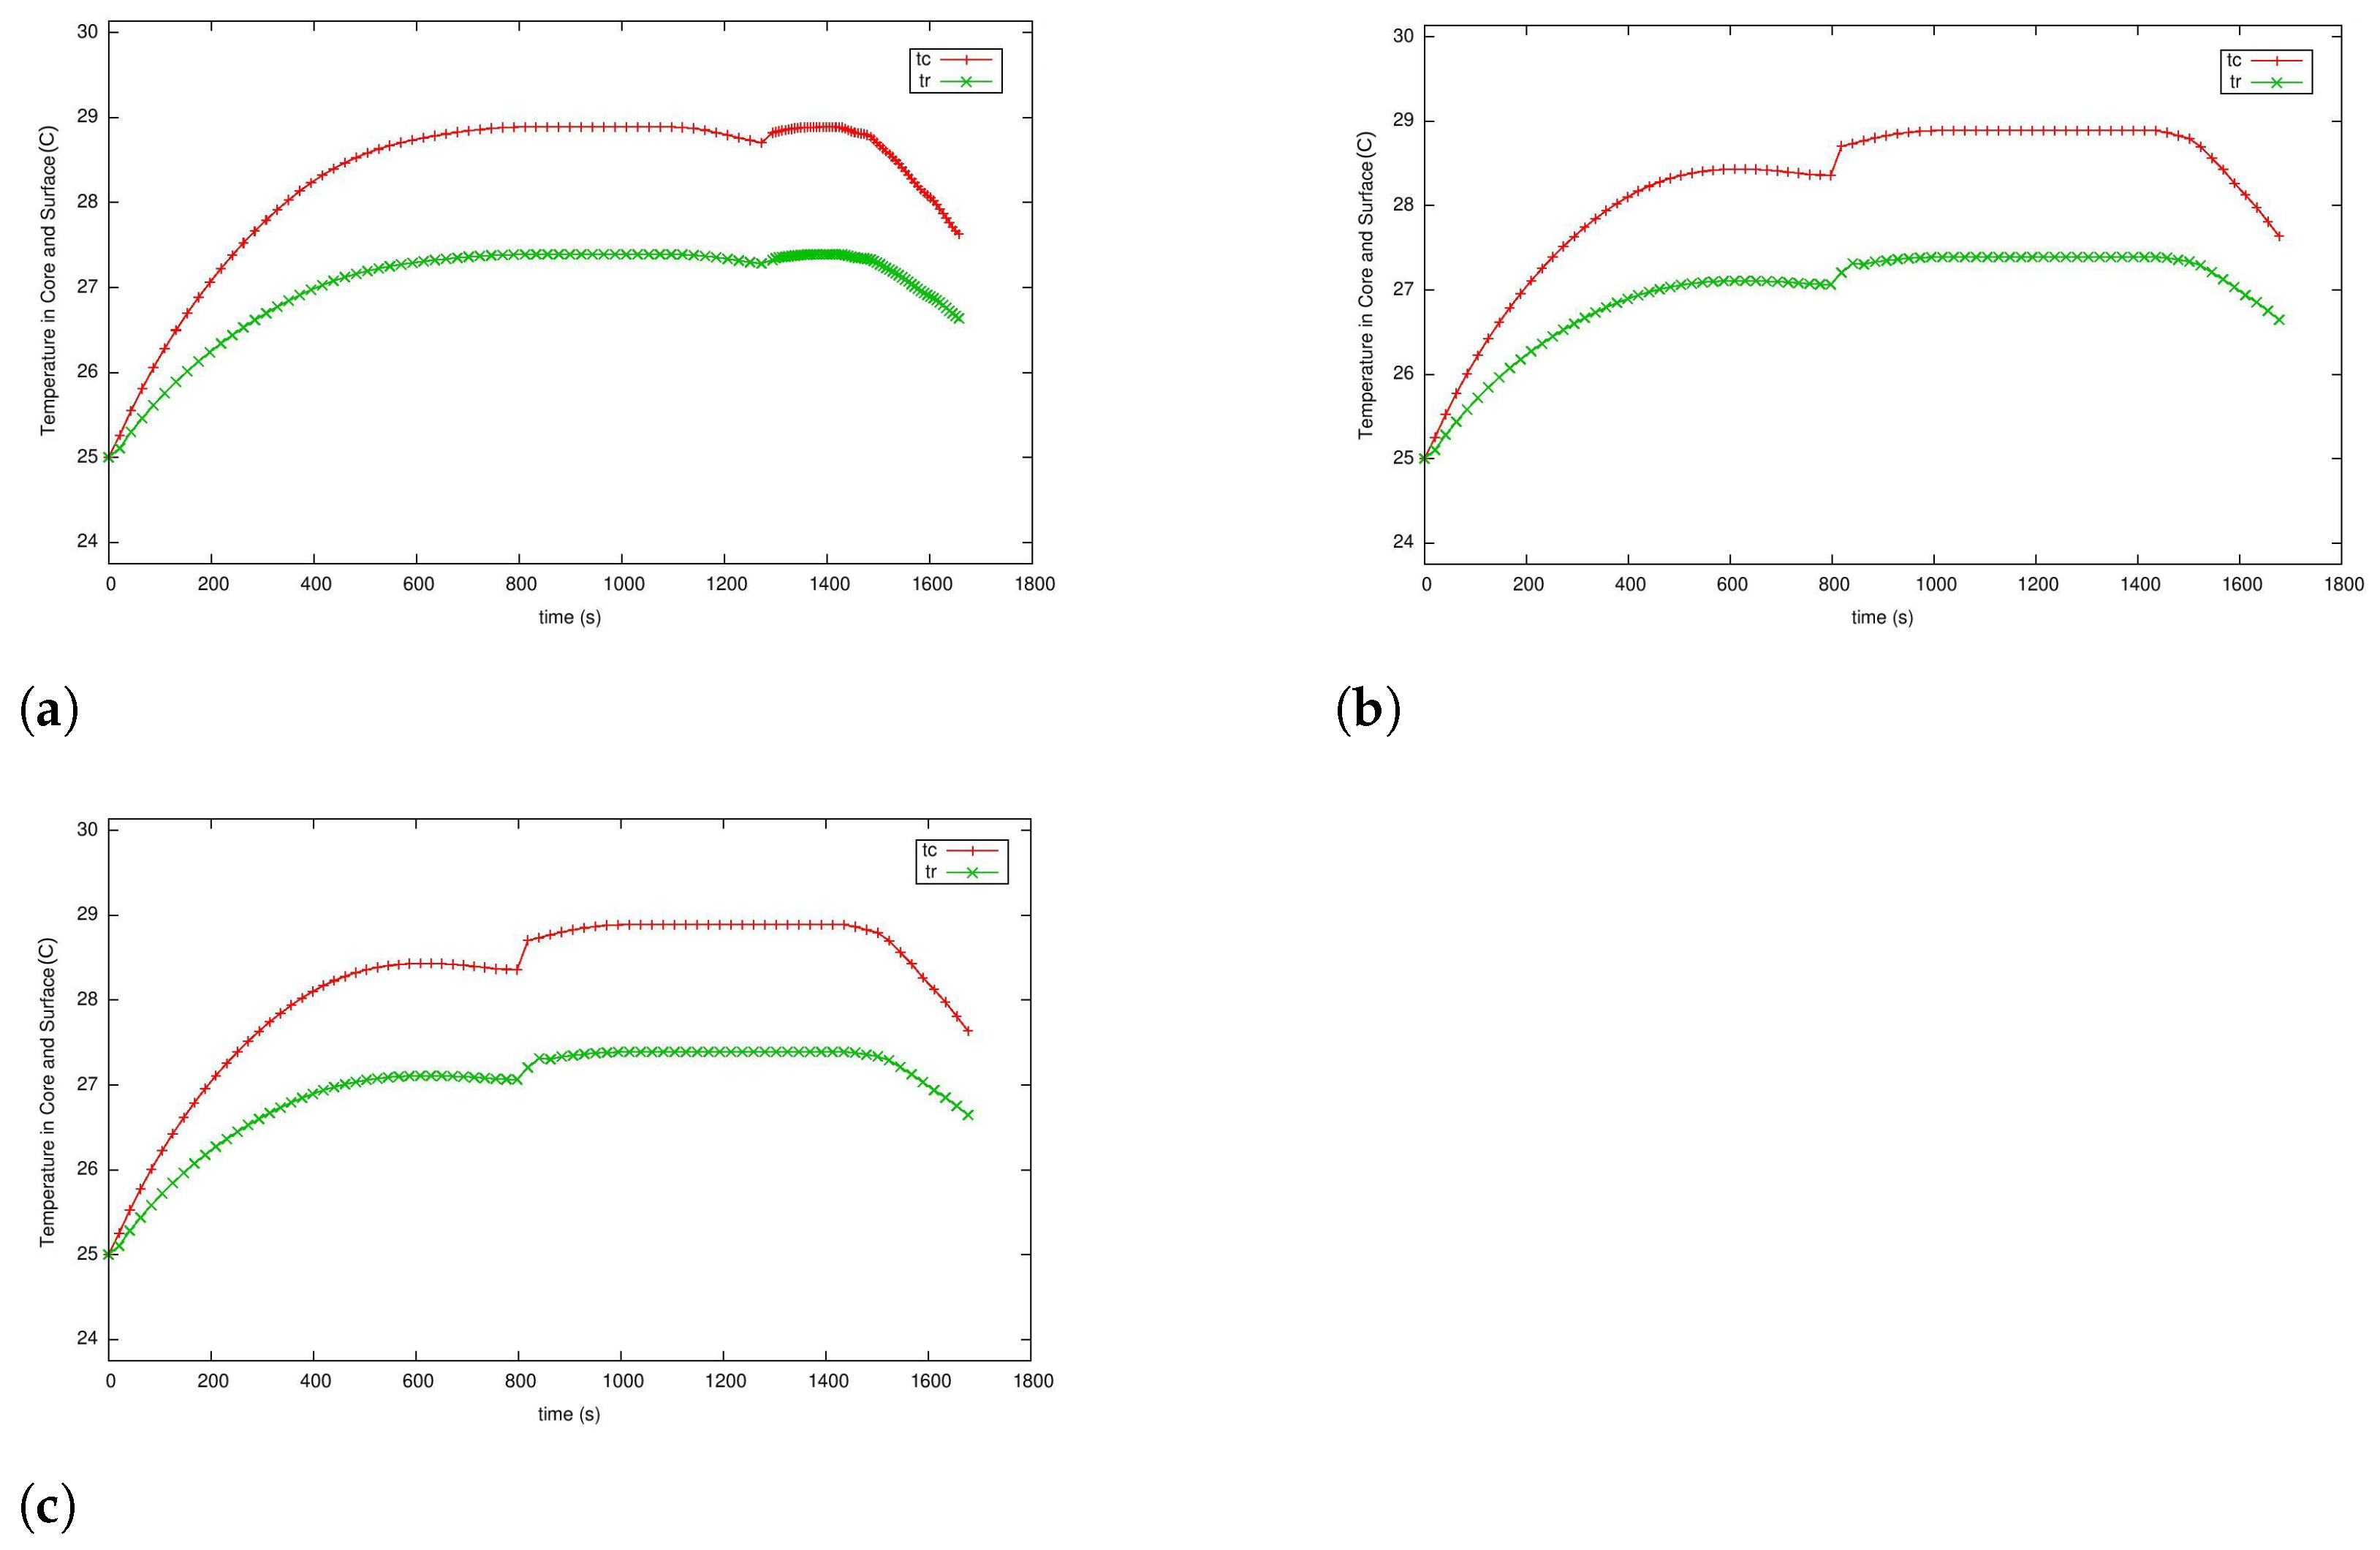
Figure 11 shows the core and surface temperatures. As observed, the temperature path constraint successfully limited the temperature gradient to 1.5 K, protecting the battery. It is possible to further reduce the temperature difference between the core and the surface of the battery to increase its safety. Although different values of τ were tested in the experiment, only the results for τ = 1.5 K are presented due to limited space.

5.4.2. Case 3: Fast Charging Considering Degradation in the Endpoint Cost

In this case, the control problem is formulated according to Section 4.3. The experiment aimed to determine how degradation affects the endpoint cost and how incorporating degradation in the endpoint cost affects the charging profile. The experiment focused on a single case where the maximum input current was 5 C and τ = 1.5 K. The penalty factor for energy losses was chosen as ρ = 1 .
Table 9 shows that setting β = 0.75 results in values that are similar to those obtained for case 2a. Also, the results show that reducing the values of β increased the switching time and the final time. There is clearly a trade-off between the total charging time and the desire to reduce battery degradation.
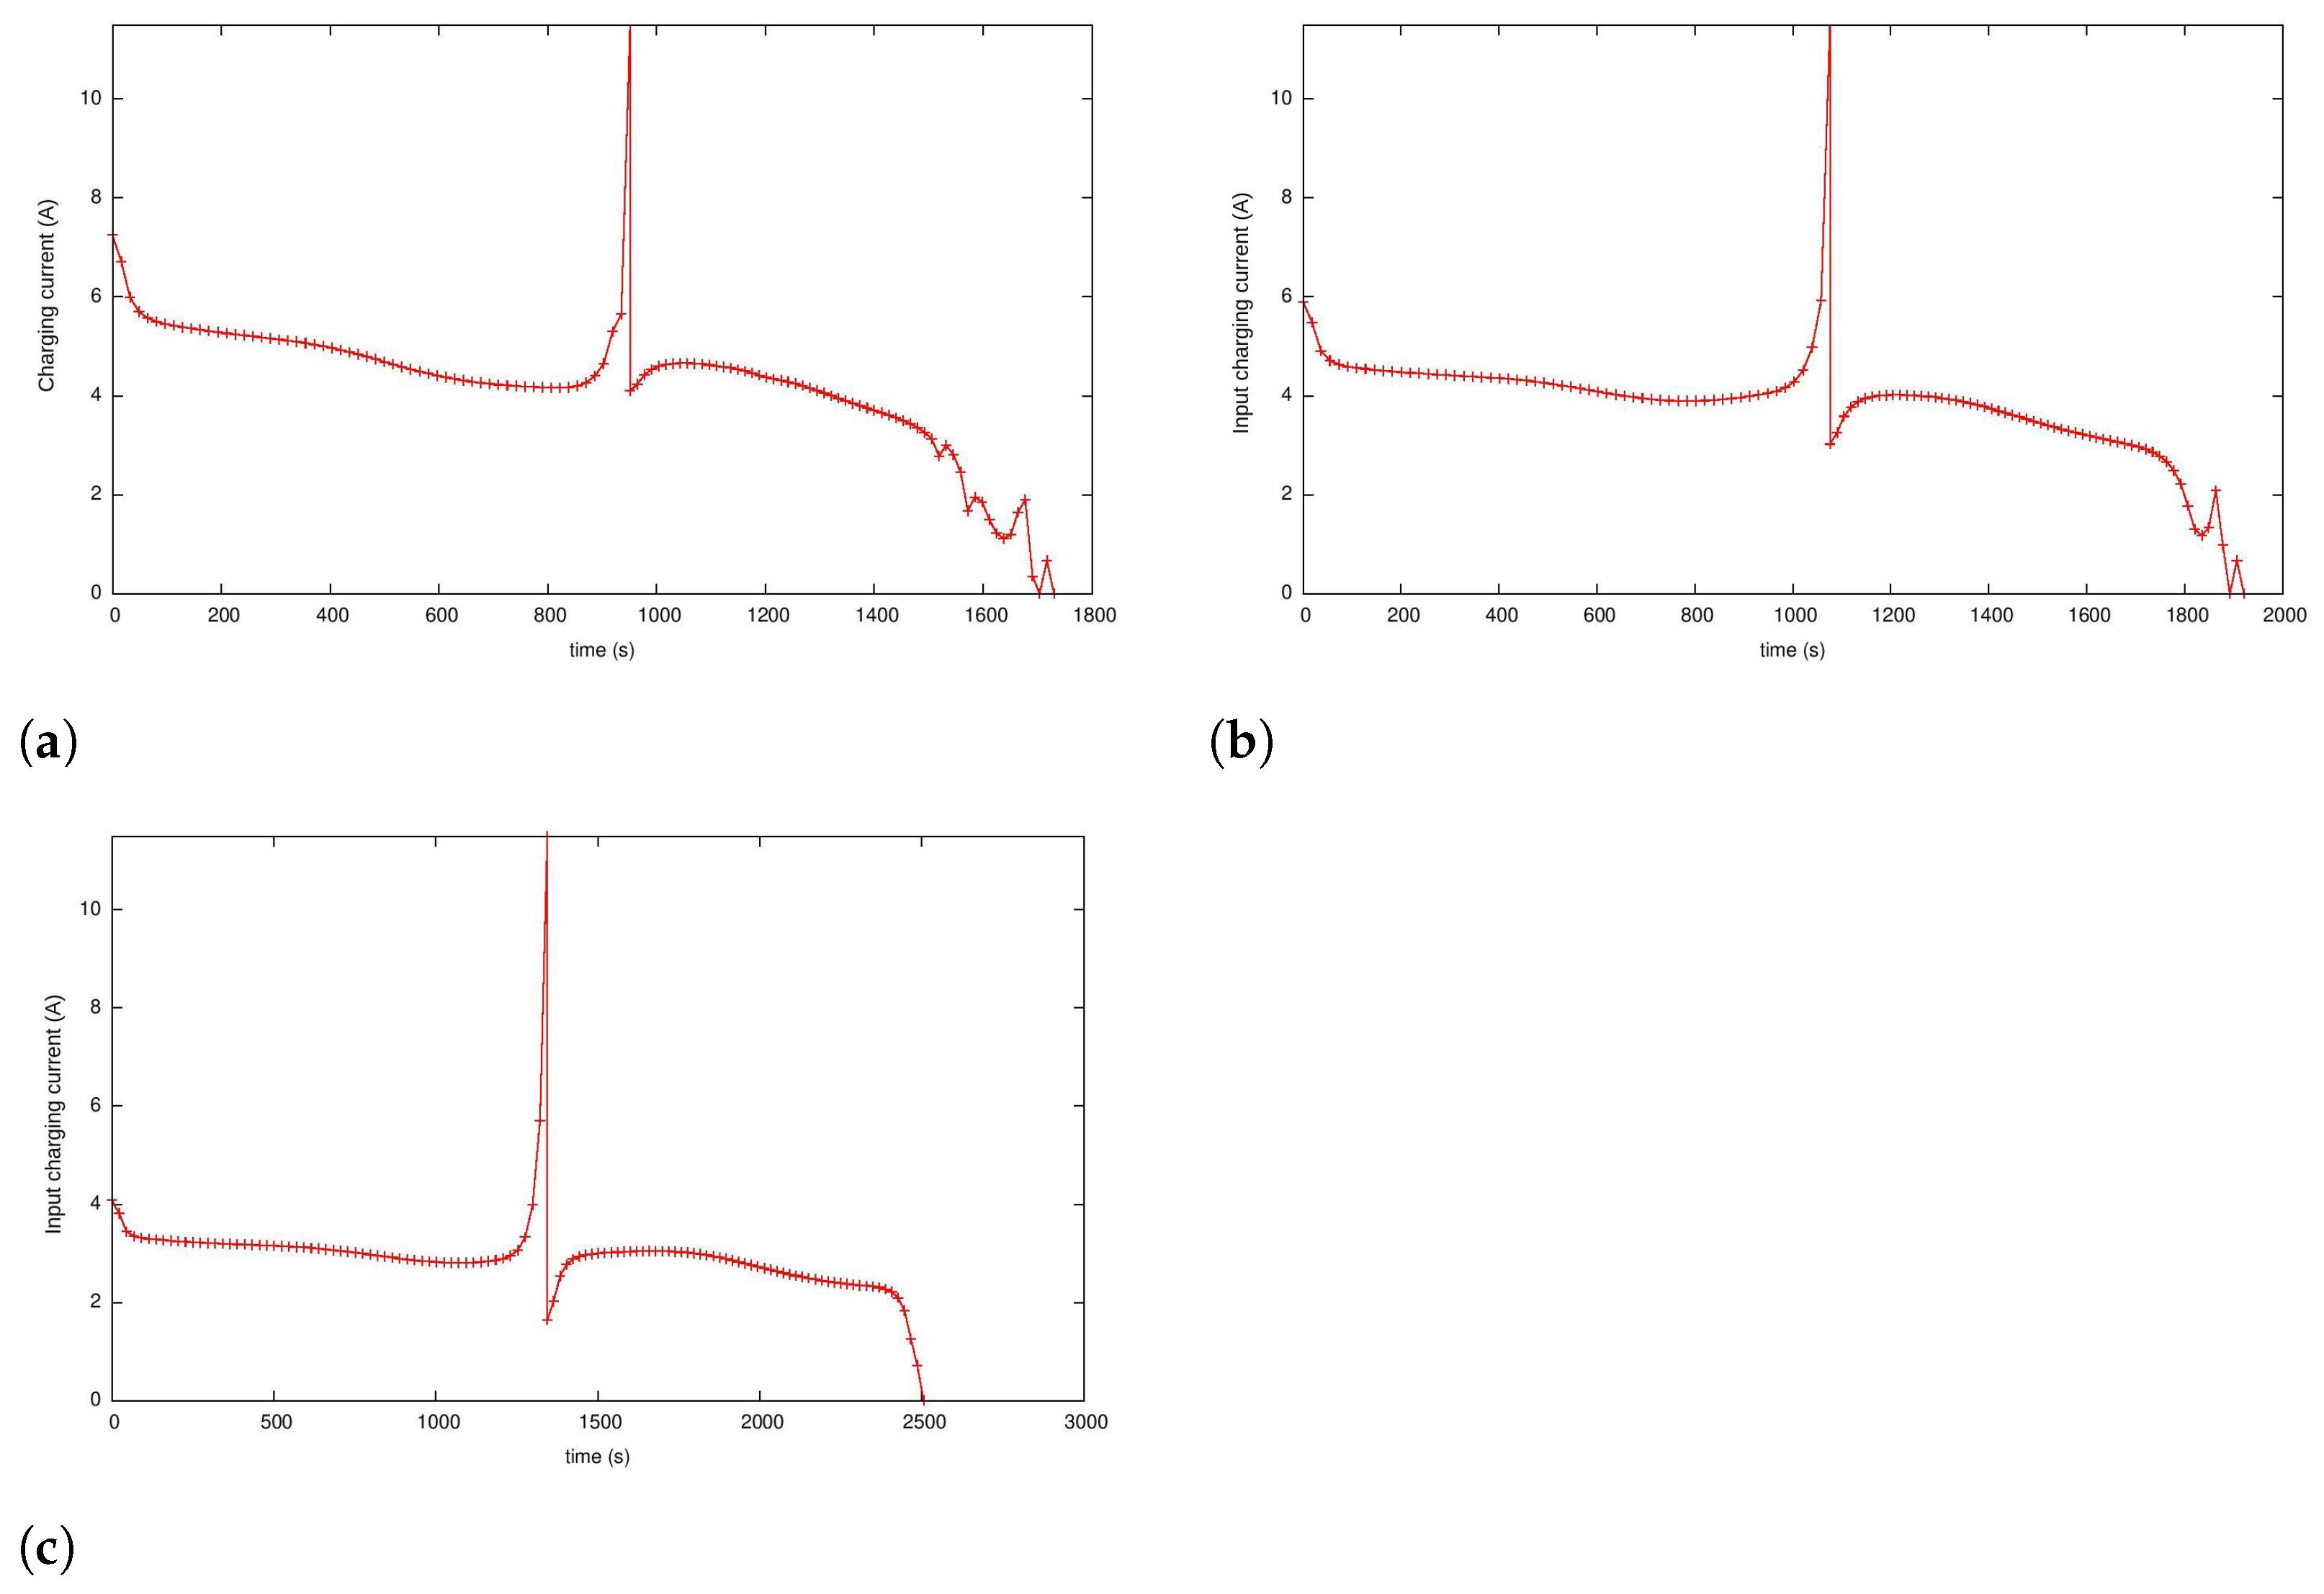
Figure 12 shows the optimal input current trajectories for different values of parameter β .
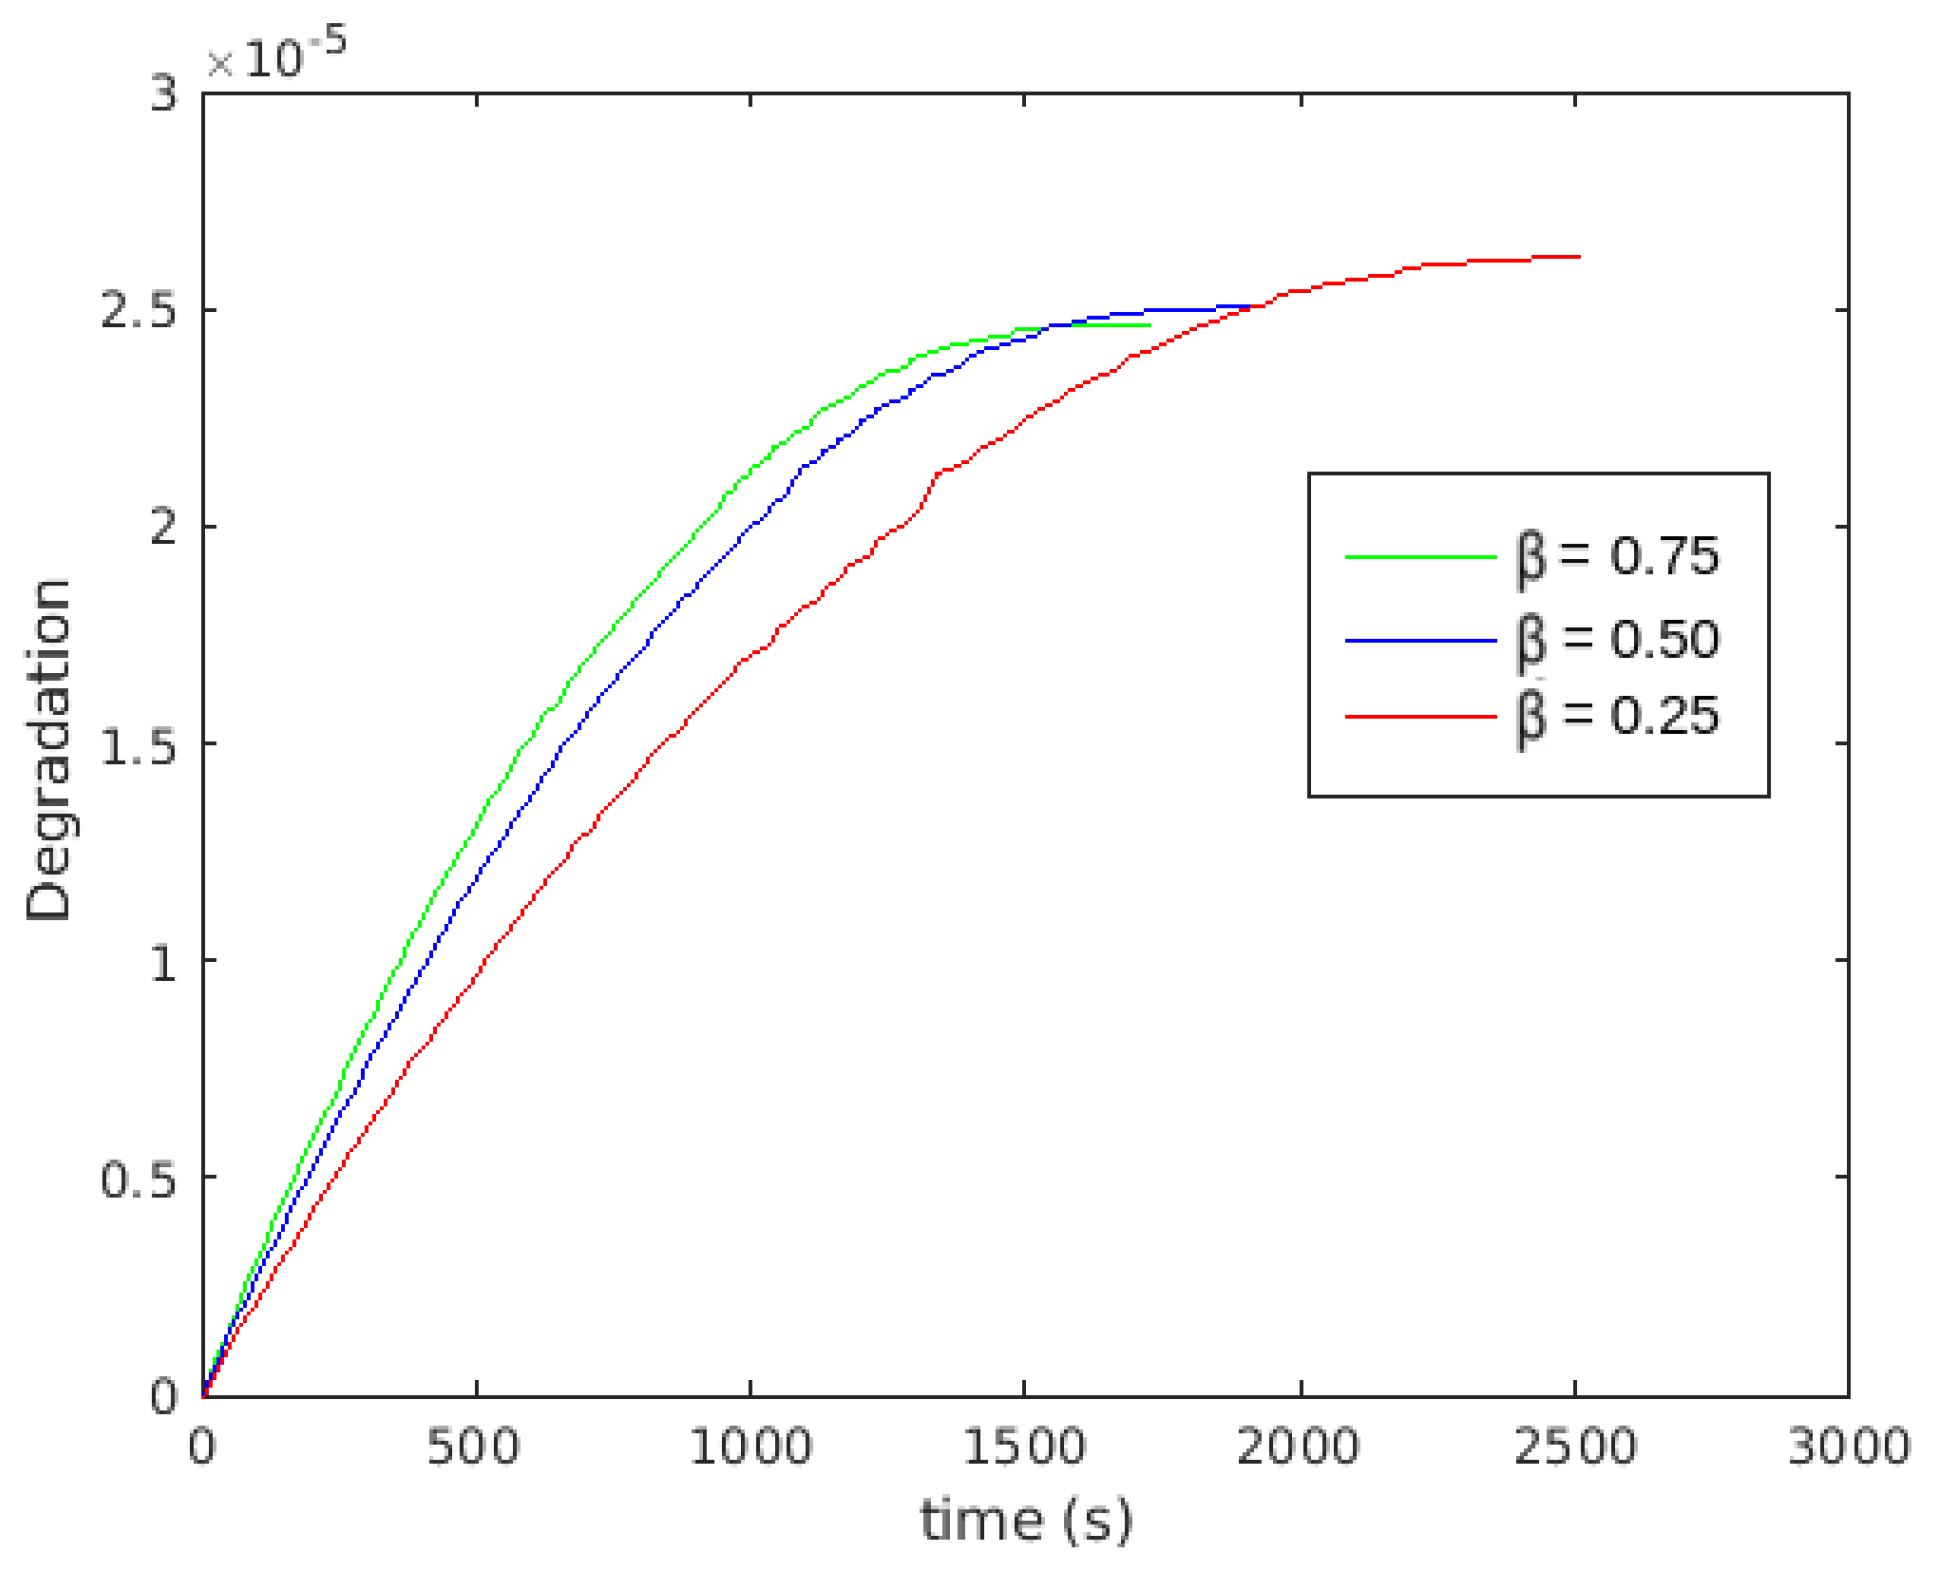
Figure 13 shows the battery degradation over time for different values of the parameter β . The graph shows that battery degradation is less for smaller values of β than the values of β closer to one. However, it should be noted that the charging time increased by 30% when comparing the case of β = 0.25 with the case of β = 1. Consequently, increasing the importance of the degradation in the endpoint cost results in an increase in the total charging time, which is an expected result.

6. Conclusions

This research analysed the optimal charging of lithium–ion batteries at low and medium current rates through optimal control methods. We conducted detailed simulation experiments using the electric equivalent circuit battery model. The charging current included 4C, 5C, and 6C. The first experiment consisted of achieving the minimum battery charging time, where we emulated the CC-CV charging profile. Further experiments considered the temperature and the cost of degradation in the formulation. From the numerical simulation results, we obtained profiles that resemble the well-known CC-CV charging protocol. Therefore, as a first conclusion, the constant current–constant voltage charging protocol approximates an optimal charging profile at lower and medium charging rates. This work proposed improvements to the existing charging protocols, mainly in the constant current phase. The numerical simulation showed that the internal temperature gradient can be maintained within a range of 1.5 °C using our proposed optimal control approach. The results presented in the study specifically target an ANR26650M1B battery cell. However, the methods can potentially be used for any battery model of any chemistry.
To the authors’ knowledge, this work is the first to study the CC-CV protocol with temperature and voltage path constraints as a multi-phase optimal control problem using direct collocation methods. Thermal runaway was not analysed and could occur if the battery pack is not adequately protected.
The proposed approach has some limitations that need to be considered. The degradation analysis only covers a single cycle and does not consider the potential differences in capacity degradation across multiple cycles. This view does not explain how the battery’s performance may degrade over time and under different operating conditions. Furthermore, the battery model does not consider the complex chemistry of the battery. As a result, the thermal model employed may not accurately capture the thermal behaviour of the battery, which is essential for predicting its lifespan. Moreover, more advanced models are necessary to perform a more accurate analysis of pulse charging. Such models should consider electrochemical factors such as dendrite growth, solid electrolyte interphase formation, and polarisation effects in the electrodes and electrolytes. Therefore, depending on the application’s requirements, the presented methodology may not provide a sufficiently accurate estimate of battery degradation and thermal dynamics, indicating the need for further research.

Author Contributions

Conceptualisation, J.G.-S. and V.B.; methodology, J.G.-S.; software, J.G.-S.; validation, J.G.-S. and V.B.; formal analysis, J.G.-S.; investigation, J.G.-S.; resources, J.G.-S. and V.B.; writing—original draft preparation, J.G.-S.; writing—review and editing, V.B.; visualisation, J.G.-S.; supervision, V.B. All authors have read and agreed to the published version of the manuscript.

Funding

This research received no external funding.

Data Availability Statement

The data presented in this study are available upon request from the corresponding author. The data are not publicly available as the first author’s PhD thesis was not submitted at the time of the publication of this work.

Conflicts of Interest

The authors declare no conflicts of interest.

References

  1. Liu, C.L.; Wang, S.C.; Liu, Y.H.; Tsai, M.C. An Optimum Fast Charging Pattern Search for Li-Ion Batteries Using Particle Swarm Optimization. In Proceedings of the 6th International Conference on Soft Computing and Intelligent Systems, and the 13th International Symposium on Advanced Intelligence Systems, SCIS-ISIS 2012, Kobe, Japan, 20–24 November 2012. [Google Scholar]
  2. Yang, X.; Zhang, G.; Ge, S.; Wang, C.Y. Fast charging of lithium-ion batteries at all temperatures. Proc. Natl. Acad. Sci. USA 2018, 115, 7266–7271. [Google Scholar] [CrossRef] [PubMed]
  3. Lu, L.; Han, X.; Li, J.; Hua, J.; Ouyang, M. A review on the key issues for lithium-ion batter management in electric vehicles. J. Power Sources 2013, 226, 272–288. [Google Scholar] [CrossRef]
  4. CESafety. FoI Data Reveals Extent of Electric Vehicle Battery Fires in UK. Available online: https://www.fsmatters.com/FoI-data-reveals-extent-of-EV-fires-in-UK (accessed on 11 November 2022).
  5. O’Kane, S.E.; Ai, W.; Madabattula, G.; Alonso-Alvarez, D.; Timms, R.; Sulzer, V.; Edge, J.S.; Wu, B.; Offer, G.J.; Marinescu, M. Lithium-ion battery degradation: How to model it. Phys. Chem. Chem. Phys. 2022, 24, 7909–7922. [Google Scholar] [CrossRef] [PubMed]
  6. Ramadass, P.; Haran, B.; Gomadam, P.; White, R.; Popov, B. Development of First Principles Capacity Fade Model for Li-Ion Cells. J. Electrochem. Soc. 2004, 151, A196. [Google Scholar] [CrossRef]
  7. Keil, P.; Jossen, A. Charging protocols for lithium-ion batteries and their impact on cycle life—An experimental study with different 18650 high-power cells. J. Energy Storage 2016, 6, 125–141. [Google Scholar] [CrossRef]
  8. Abdel-Monem, M.; Trad, K.; Omar, N.; Hegazy, O.; Van den Bossche, P.; Van Mierlo, J. Influence analysis of static and dynamic fast-charging current profiles on ageing performance of commercial lithium-ion batteries. Energy 2017, 120, 179–191. [Google Scholar] [CrossRef]
  9. Juhlin, O. Modeling of Battery Degradation in Electrified Vehicles. Master’s Thesis, Linköping University, Linköping, Sweden, 2016. [Google Scholar]
  10. Lei, S.; Zeng, Z.; Cheng, S.; Xie, J. Fast-charging of lithium-ion batteries: A review of electrolyte design aspects. Battery Energy 2023, 2, 20230018. [Google Scholar] [CrossRef]
  11. Weiss, M.; Ruess, R.; Kasnatscheew, J.; Levartovsky, Y.; Levy, N.; Minnmann, P.; Stolz, L.; Waldmann, T.; Wohlfahrt-Mehrens, M.; Aurbach, D.; et al. Fast Charging of Lithium-Ion Batteries: A Review of Materials Aspects. Adv. Energy Mater. 2021, 11, 2101126. [Google Scholar] [CrossRef]
  12. Gao, Y.; Rojas, T.; Wang, K.; Liu, S.; Daiwei Wang, T.C.; Wang, H.; Ngo, A.T.; Wang, D. Low-temperature and high-rate-charging lithium metal batteries enabled by an electrochemically active monolayer-regulated interface. Nat. Energy 2020, 5, 534–542. [Google Scholar] [CrossRef]
  13. Li, L.; Zhang, D.; Deng, J.; Gou, Y.; Fang, J.; Cui, H.; Zhao, Y.; Cao, M. Carbon-based materials for fast charging lithium-ion batteries. Carbon 2021, 183, 721–734. [Google Scholar] [CrossRef]
  14. Reniers, J.M.; Mulder, G.; Ober-Blöbaum, S.; Howey, D.A. Improving optimal control of grid-connected lithium-ion batteries through more accurate battery and degradation modelling. J. Power Sources 2018, 379, 91–102. [Google Scholar] [CrossRef]
  15. Cordis. Advanced Materials for Batteries: Research Results. Available online: https://cordis.europa.eu/project/id/608931/reporting (accessed on 5 November 2022).
  16. Schimpe, M.; von Kuepach, M.E.; Naumann, M.; Hesse, H.C.; Smith, K.; Jossen, A. Comprehensive Modeling of Temperature-Dependent Degradation Mechanisms in Lithium Iron Phosphate Batteries. J. Electrochem. Soc. 2018, 165, A181–A193. [Google Scholar] [CrossRef]
  17. Xu, M.; Wang, R.; Zhao, P.; Wang, X. Fast charging optimization for lithium-ion batteries based on dynamic programming algorithm and electrochemical-thermal-capacity fade coupled model. J. Power Sources 2019, 438, 227015. [Google Scholar] [CrossRef]
  18. Ramadass, P.; Haran, B.; White, R.; Popov, B.N. Capacity fade of Sony 18650 cells cycled at elevated temperatures: Part II. Capacity fade analysis. J. Power Sources 2002, 112, 614–620. [Google Scholar] [CrossRef]
  19. Yin, P.; Wang, N.; Shang, Y.; Gu, P.; Duan, B.; Zhang, C. Study on the Effect of High Temperature and High-Current Rate on Fast Charging of Lithium-ion Batteries. In Proceedings of the 2021 40th Chinese Control Conference (CCC), Shanghai, China, 26–28 July 2021; pp. 5841–5846. [Google Scholar]
  20. Moon, J.S.; Lee, J.H.; Ha, I.Y.; Lee, T.K.; Won, C.Y. An Efficient Battery Charging Algorithm based on State-of-Charge Estimation for Electric Vehicle. In Proceedings of the 2011 International Conference on Electrical Machines and Systems, Beijing, China, 20–23 August 2011. [Google Scholar]
  21. Abdollahi, A.; Han, X.; Avvari, G.; Raghunathan, N.; Balasingam, B.; Pattipati, K.; Bar-Shalom, Y. Optimal battery charging, Part I: Minimizing time-to-charge, energy loss, and temperature rise for OCV-resistance battery model. J. Power Sources 2016, 303, 388–398. [Google Scholar] [CrossRef]
  22. Kannan, D. An Introduction to Fast Charging and Pulse Charging. Available online: https://medium.com/batterybits/an-introduction-to-fast-charging-and-pulse-charging-21cd21a599ae (accessed on 18 November 2022).
  23. Wu, Y.; Long, X.; Lu, J.; Wu, Y.; Zhou, R.; Liu, L. Effect of temperature on the high-rate pulse charging of lithium-ion batteries. J. Electroanal. Chem. 2022, 922, 116773. [Google Scholar] [CrossRef]
  24. Notten, P.; het Veld, J.O.; van Beek, J. Boostcharging Li-ion batteries: A challenging new charging concept. J. Power Sources 2005, 145, 89–94. [Google Scholar] [CrossRef]
  25. Wu, C.; Liu, Y.; Zhou, T.; Cao, S.A. Multistage Current Charging Method for Energy Storage Device of Microgrid Considering Energy Consumption and Capacity of Lithium Battery. Energies 2022, 15, 4526. [Google Scholar] [CrossRef]
  26. Cho, I.H.; Lee, P.Y.; Kim, J.H. Analysis of the Effect of the Variable Charging Current Control Method on Cycle Life of Li-ion Batteries. Energies 2019, 12, 3023. [Google Scholar] [CrossRef]
  27. Liu, Y.H.; Luo, Y.F. Search for an Optimal Rapid-Charging Pattern for Li-Ion Batteries Using the Taguchi Approach. IEEE Ind. Electron. 2010, 57, 3963–3971. [Google Scholar] [CrossRef]
  28. Cheng, M.W.; Wang, S.M.; Lee, Y.S.; Hsiao, S.H. Fuzzy controlled fast charging system for lithium-ion batteries. In Proceedings of the 2009 International Conference on PEDS, Taipei, Taiwan, 2–5 November 2009; pp. 1498–1503. [Google Scholar]
  29. Velho, R.; Calado, M.; Pombo, J.; Fermeiro, J.; Mariano, S. New Charging Algorithm for Li-Ion Battery Packs Based on Artificial Neural Networks. Batteries 2022, 8, 89–94. [Google Scholar]
  30. Liu, C.; Liu, L. Optimizing Battery Design for Fast Charge through a Genetic Algorithm Based Multi-Objective Optimization Framework. ECS Trans. 2017, 77, 257–267. [Google Scholar] [CrossRef]
  31. Jain, S.; Simon, D. Genetic Algorithm Based Charge Optimization of Lithium-Ion Batteries in Small Satellites. In Proceedings of the 19th Annual AIAA/USU Conference on Small Satellites, Logan, UT, USA, 8–11 August 2005. [Google Scholar]
  32. Shepherd, C. Design of Primary and Secondary Cells—Part 2. An Equation Describing Battery Discharge. J. Electrochem. Soc. 1965, 112, 657–664. [Google Scholar] [CrossRef]
  33. Lee, S.; Kim, Y.; Siegel, J.B.; Stefanopoulou, A.G. Optimal control for fast acquisition of equilibrium voltage for Li-ion batteries. J. Energy Storage 2021, 40, 102814. [Google Scholar] [CrossRef]
  34. Perez, H.E.; Hu, X.; Dey, S.; Moura, S.J. Optimal Charging of Li-Ion Batteries with Coupled Electro-Thermal-Aging Dynamics. IEEE Trans. Veh. Technol. 2017, 66, 7761–7770. [Google Scholar] [CrossRef]
  35. Wang, J.; Liu, P.; Hicks-Garner, J.; Sherman, E.; Soukiazian, S.; Verbrugge, M.; Tataria, H.; Musser, J.; Finamore, P. Cycle-life model for graphite-LiFePO4 cells. J. Power Sources 2011, 196, 3942–3948. [Google Scholar] [CrossRef]
  36. García-Heras, J.; Soler, M.; Sáez, F.J. A Comparison of Optimal Control Methods for Minimum Fuel Cruise at Constant Altitude and Course with Fixed Arrival Time. Procedia Eng. 2014, 80, 231–244, 3rd International Symposium on Aircraft Airworthiness (ISAA 2013). [Google Scholar] [CrossRef]
  37. Betts, J.T. Practical Methods for Optimal Control and Estimation Using Nonlinear Programming, 2nd ed.; Society for Industrial and Applied Mathematics: Philadelphia, PA, USA, 2010. [Google Scholar]
  38. Morad, M. Mathematical Modeling of Lithium-Ion Batteries and Improving Mathematics Learning Experience for Engineering Students. Master’s Thesis, University of Kansas, Kansas City, KS, USA, 2017. [Google Scholar]
  39. Adachi, M.; Kuhn, Y.; Horstmann, B.; Osborne, M.A.; Howey, D.A. Bayesian Model Selection of Lithium-Ion Battery Models via Bayesian Quadrature. IFAC-PapersOnLine 2023, 56, 10521–10526. [Google Scholar] [CrossRef]
  40. Liu, J. Computationally Efficient Online Model-Based Control and Estimation for Lithium-Ion Batteries. Ph.D. Thesis, The Pennsylvania State University, State College, PA, USA, 2017. [Google Scholar]
  41. Doyle, C.; Fuller, T.F.; Newman, J. Modeling of galvanostatic charge and discharge of the lithium/polymer/insertion cell. J. Electrochem. Soc. 1993, 140, 1526–1533. [Google Scholar] [CrossRef]
  42. Doyle, C.; Newman, J. The use of mathematical modeling in the design of lithium/polymer battery systems. Electrochim. Acta 1995, 40, 2191–2196. [Google Scholar] [CrossRef]
  43. Doyle, C. Design and Simulation of Lithium Rechargeable Batteries. Ph.D. Thesis, University of California, Berkley, CA, USA, 1995. [Google Scholar]
  44. Rao, L.; Newman, J. Heat-Generation Rate and General Energy Balance for Insertion Battery Systems. J. Electrochem. Soc. 1997, 144, 2697. [Google Scholar] [CrossRef]
  45. Wu, J.; Ihsan-Ul-Haq, M.; Chen, Y.; Kim, J.K. Understanding solid electrolyte interphases: Advanced characterization techniques and theoretical simulations. Nano Energy 2021, 89, 106489. [Google Scholar] [CrossRef]
  46. Mohtat, P.; Pannala, S.; Sulzer, V.; Siegel, J.B.; Stefanopoulou, A.G. An Algorithmic Safety VEST for Li-ion Batteries During Fast Charging. IFAC-PapersOnLine 2021, 54, 522–527. [Google Scholar] [CrossRef]
  47. Haruta, M.; Okubo, T.; Masuo, Y.; Yoshida, S.; Tomita, A.; Takenaka, T.; Doi, T.; Inaba, M. Temperature effects on SEI formation and cyclability of Si nanoflake powder anode in the presence of SEI-forming additives. Electrochim. Acta 2017, 224, 186–193. [Google Scholar] [CrossRef]
  48. Dong, H.; Wang, J.; Wang, P.; Ding, H.; Song, R.; Zhang, N.S.; Zhao, D.N.; Zhang, L.J.; Li, S.Y. Effect of temperature on formation and evolution of solid electrolyte interphase on SiGraphite@C anodes. J. Energy Chem. 2022, 64, 190–200. [Google Scholar] [CrossRef]
  49. Świerczynski, M.; Stroe, D.I.; Stan, A.I.; Teodorescu, R.; Sauer, D.U. Selection and Performance-Degradation Modeling of LiMO2/Li4Ti5O12 and LiFePO4/C Battery Cells as Suitable Energy Storage Systems for Grid Integration with Wind Power Plants: An Example for the Primary Frequency Regulation Service. IEEE Trans. Sustain. Energy 2014, 5, 90–101. [Google Scholar] [CrossRef]
  50. Shabani, M.; Dahlquist, E.; Wallin, F.; Yan, J. Techno-economic impacts of battery performance models and control strategies on optimal design of a grid-connected PV system. Energy Convers. Manag. 2021, 245, 114617. [Google Scholar] [CrossRef]
  51. Appleton, S.; Fotouhi, A. A Model-Based Battery Charging Optimization Framework for Proper Trade-offs Between Time and Degradation. J. Automot. Innov. 2023, 6, 204–219. [Google Scholar] [CrossRef]
  52. Li, Y.; Yang, J.; Liu, W.; Wang, L.; Liao, C. Linear parameter-varying modeling and identification of lithium-ion battery for control-oriented applications. J. Power Sources 2021, 507, 230304. [Google Scholar] [CrossRef]
  53. Ning, B.; Cao, B.; Wang, B.; Zou, Z. Adaptive sliding mode observers for lithium-ion battery state estimation based on parameters identified online. Energy 2018, 153, 732–742. [Google Scholar] [CrossRef]
  54. Turker; Gunes; Erden. Equivalent Circuit Based Neural Network Model of Microstrip Discontinuities. In Proceedings of the 2006 IEEE 14th Signal Processing and Communications Applications, Antalya, Turkey, 16–19 April 2006; pp. 1–4. [Google Scholar]
  55. Cui, Z.; Hu, W.; Zhang, G.; Zhang, Z.; Chen, Z. An extended Kalman filter based SOC estimation method for Li-ion battery. Energy Rep. 2022, 8, 81–87. [Google Scholar] [CrossRef]
  56. Zhang, Y.; Cheng, X.; Fang, Y.; Yin, Y. On SOC estimation of lithium-ion battery packs based EKF. In Proceedings of the 32nd Chinese Control Conference, Xi’an, China, 26–28 July 2013; pp. 7668–7673. [Google Scholar]
  57. Zhang, C.; Guo, Y.; Wang, C.; Li, S.; Curnick, O.; Amietszajew, T.; Bhagat, R. A new design of experiment method for model parametrisation of lithium ion battery. J. Energy Storage 2022, 50, 104301. [Google Scholar] [CrossRef]
  58. Zheng, H.; Liu, X.; Wei, M. Adaptive Kalman filter based state of charge estimation algorithm for lithium-ion battery. Chin. Phys. B 2022, 24, 81–87. [Google Scholar] [CrossRef]
  59. Moura, S.J.; Argomedo, F.B.; Klein, R.; Mirtabatabaei, A.; Krstic, M. Battery State Estimation for a Single Particle Model With Electrolyte Dynamics. IEEE Trans. Control Syst. Technol. 2017, 25, 453–468. [Google Scholar] [CrossRef]
  60. Amir, S.; Gulzar, M.; Tarar, M.O.; Naqvi, I.H.; Zaffar, N.A.; Pecht, M.G. Dynamic Equivalent Circuit Model to Estimate State-of-Health of Lithium-Ion Batteries. IEEE Access 2022, 10, 18279–18288. [Google Scholar] [CrossRef]
  61. Valle, B.; Wentz, C.T.; Sarpeshkar, R. An Ultra-compact and Efficient Li-ion Battery Charger Circuit for Biomedical Applications. In Proceedings of the International Symposium on Circuits and Systems (ISCAS) 2010, Paris, France, 30 May–2 June 2010; pp. 1224–1227. [Google Scholar]
  62. Buchmann, I. Batteries in a Portable World; Cadex Electronics, Inc.: Richmond, BC, Canada, 2001. [Google Scholar]
  63. Rodrigues, M.T.F.; Shkrob, I.A.; Colclasure, A.M.; Abraham, D.P. Fast Charging of Li-Ion Cells: Part IV. Temperature Effects and “Safe Lines” to Avoid Lithium Plating. J. Electrochem. Soc. 2020, 167, 130508. [Google Scholar] [CrossRef]
  64. Pistoia, G. Lithium-Ion Batteries Advances and Applications; Chapter 14: Satellite Lithium-Ion Batteries; Elsevier Science and Technology: Amsterdam, The Netherlands, 2014. [Google Scholar]
  65. Grandjean, T.R.B.; McGordon, A.; Jennings, P.A. Structural Identifiability of Equivalent Circuit Models for Li-Ion Batteries. Energies 2017, 10, 90. [Google Scholar] [CrossRef]
  66. Fairweather, A.; Foster, M.; Stone, D. Modelling of VRLA batteries over operational temperature range using Pseudo Random Binary Sequences. J. Power Sources 2012, 207, 56–59. [Google Scholar] [CrossRef]
  67. Samad, N.A.; Wang, B.; Siegel, J.B.; Stefanopoulou, A.G. Parameterization of Battery Electrothermal Models Coupled With Finite Element Flow Models for Cooling. J. Dyn. Syst. Meas. Control 2017, 139, 071003. [Google Scholar] [CrossRef]
  68. Tran, M.K.; Mathew, M.; Janhunen, S.; Panchal, S.; Raahemifar, K.; Fraser, R.; Fowler, M. A comprehensive equivalent circuit model for lithium-ion batteries, incorporating the effects of state of health, state of charge, and temperature on model parameters. J. Energy Storage 2021, 43, 103252. [Google Scholar] [CrossRef]
  69. Choi, E.; Chang, S. A Temperature-Dependent State of Charge Estimation Method Including Hysteresis for Lithium-Ion Batteries in Hybrid Electric Vehicles. IEEE Access 2020, 8, 129857–129868. [Google Scholar] [CrossRef]
  70. Chin, C.S.; Gao, Z.; Chiew, J.H.K.; Zhang, C. Nonlinear Temperature-Dependent State Model of Cylindrical LiFePO4 Battery for Open-Circuit Voltage, Terminal Voltage and State-of-Charge Estimation with Extended Kalman Filter. Energies 2018, 11, 2467. [Google Scholar] [CrossRef]
  71. Nejad, S.; Gladwin, D.; Stone, D. A systematic review of lumped-parameter equivalent circuit models for real-time estimation of lithium-ion battery states. J. Power Sources 2016, 316, 183–196. [Google Scholar] [CrossRef]
  72. Ding, Y.; Castanier, M.; Perez, H.; Sigel, J.; Lin, X. Parameterization and Validation of an Integrated Electro-Thermal LFP Battery Model. In Proceedings of the ASME 2012 5th Annual Dynamic Systems and Control Conference Joint with the JSME 2012 11th Motion and Vibration Conference (DSCC2012-MOVIC2012), Fort Lauderdale, FL, USA, 17–19 October 2012; American Society of Mechanical Engineers: New York, NY, USA, 2012; pp. 386–391. [Google Scholar]
  73. Dodd, N.; Preece, F.J.W.; Williams, G.T. Chapter 2–Electrical system analysis. In Electrical Systems and Equipment, 3rd ed.; Littler, D., Ed.; British Electricity International: Pergamon, Turkey; Oxford, UK, 1992; pp. 84–192. [Google Scholar]
  74. Becerra, V.M. PSOPT Optimal Control Software. Available online: https://www.psopt.net/ (accessed on 28 November 2022).
  75. Lin, X.; Perez, H.E.; Siegel, J.B.; Stefanopoulou, A.G.; Li, Y.; Anderson, R.D.; Ding, Y.; Castanier, M.P. Online Parametrization of Lumped Thermal Dynamics in Cylindrical Lithium Ion Batteries for Core Temperature Estimation and Health Monitoring. IEEE Trans. Contrib. Syst. Techol. 2013, 21, 183–196. [Google Scholar]
  76. Xiong, R.; Yu, Q.; Wang, L.Y. Open circuit voltage and state of charge online estimation for lithium ion batteries. Energy Procedia 2017, 142, 1902–1907. [Google Scholar] [CrossRef]
  77. Betts, J. Survey of Numerical Methods for Trajectory Optimization. J. Guid. Control Dyn. 1998, 21, 193–207. [Google Scholar] [CrossRef]
  78. Rao, A. A Survey of Numerical Methods for Optimal Control. Adv. Astronaut. Sci. 2010, 135, 497–528. [Google Scholar]
  79. Becerra, V.M. Solving complex optimal control problems at no cost with PSOPT. In Proceedings of the 2010 IEEE International Symposium on Computer-Aided Control System Design, Yokohama, Japan, 8–10 September 2010; pp. 1391–1396. [Google Scholar]
  80. Betts, J.T.; Biehn, N.; Campbell, S.L. Convergence of Nonconvergent IRK discretisations of Optimal Control Problems with State Inequality Constraints. Siam J. Sci. Comput. 2002, 23, 1981–2007. [Google Scholar] [CrossRef]
  81. LithiumWerks. 26650 Lithium Ion Power Cell, 2019. Available online: https://power-wings.com/wp/wp-content/uploads/2020/08/26650-Power-Cell.pdf (accessed on 25 February 2024).
Figure 1. Electric circuit model type RC2.
Energies 17 01470 g001
Figure 2. Optimal input current trajectories obtained for different initial charging current profiles. (a) Maximum charging current: 4C. (b) Maximum charging current: 5C. (c) Maximum charging current: 6C. The switching time is shown in Table 6.
Energies 17 01470 g002
Figure 3. Voltages across the terminals during charging for different maximum input charging currents. (a) Maximum charging current: 4C. (b) Maximum charging current: 5C. (c) Maximum charging current: 6C.
Energies 17 01470 g003
Figure 4. Temperatures in the cell when charging at different initial input charging currents. (a) Maximum charging current: 4C. (b) Maximum charging current: 5C. (c) Maximum charging current: 6C.
Energies 17 01470 g004
Figure 5. Comparison of battery degradation for different maximum charging currents, along with the maximum core and surface temperatures. The degradation is for a single charge cycle.
Energies 17 01470 g005
Figure 6. Optimal input current trajectory for different maximum charging currents. (a) Maximum charging current: 4C. (b) Maximum charging current: 5C. (c) Maximum charging current: 6C.
Energies 17 01470 g006
Figure 7. Terminal voltage during charging for different maximum charging currents. (a) Maximum charging current: 4C. (b) Maximum charging current: 5C. (c) Maximum charging current: 6C.
Energies 17 01470 g007
Figure 8. Temperature in the cell during charging for different maximum charging currents. (a) Maximum charging current: 4C. (b) Maximum charging current: 5C. (c) Maximum charging current: 6C.
Energies 17 01470 g008
Figure 9. Optimal input current trajectory for different maximum charging currents. (a) Maximum charging current: 4C. (b) Maximum charging current: 5C. (c) Maximum charging current: 6C.
Energies 17 01470 g009
Figure 10. Terminal voltage during charging with different maximum charging currents (a) Maximum charging current: 4C (b) Maximum charging current: 5C (c) Maximum charging current: 6C.
Energies 17 01470 g010
Figure 11. Temperature at the core and the surface with different maximum charging currents. (a) Maximum charging current: 4C. (b) Maximum charging current: 5C. (c) Maximum charging current: 6C.
Energies 17 01470 g011
Figure 12. Optimal input current trajectories for different values of parameter β with the maximum input charging current set to I m a x = 5C. The temperature path constraint parameter, τ , was set to 1.5 K. (a) β = 0.75 (b) β = 0.50 (c) β = 0.25.
Energies 17 01470 g012
Figure 13. Battery degradation for different values of β for a single charge cycle. Maximum input charging current 5C (11.5 A) and temperature gradient path constraint set to 1.5 K.
Energies 17 01470 g013
Table 1. Effect of temperature on a lithium–ion battery.
Temperature RangeType of Damage
<0 °CLithium plating due to non-uniformities
in the cell caused by manufacturing defects.
0–55 °CNo damage to the battery.
55–160 °CHigher heat dissipation. SEI film starts to decompose.
Lithium reacts in the electrolyte. LiCoO 2 breaks down and produces O 2 .
160–300 °CElectrolyte starts decomposing. Releases flammable gasses.
Fire and thermal runaway
Table 2. Effect of overcharging on a lithium–ion battery.
Voltage RangeType of Damage
≤2.2 V 1In the charge phase, the Cu precipitate is metallic Cu,
which can ultimately cause a short circuit between the electrodes.
2.2–4.2 VNo damage to the battery.
≥4.2 V 2Risk of lithium metal plating.
1 Organic electrolytes are unstable at voltages below 1 V vs. Li/ Li + [5]. 2 Overcharging the battery by only 0.1 V can reduce its life cycle by up to 60% [6].
Table 3. Variables and parameters associated with the battery model.
ParameterValue/UnitsDescription
R 0 Interpolated value a, Ω Internal resistance of the lithium–ion battery
R 1 Interpolated value a, Ω Cell’s no-load self-discharge
R 2 Interpolated value a, Ω Charge-transfer resistance
C 1 Interpolated value a, FBulk charge storage of the cell
C 2 Interpolated value a, FElectrodes’ double-layer effect
R u 3.09 KW 1 Resistance to convective cooling
R c 1.94 KW 1 Thermal resistance
C s 4.5 JK 1 Heat capacity of the cell container
C c 62.7 JK 1 Heat capacity inside the battery
C2.3 A-hNominal capacity of A123 ANR26650M1
R8.314 Jmol 1 K 1 Universal gas constant
V O C Interpolated value aOpen circuit voltage
V T VVoltage at the battery terminals
T a 278.15 KAmbient temperature
x 1 -State of charge
x 2 VDouble layer capacitance & charge transfer voltage (V)
x 3 VDiffusion process modelling voltage
x 4 KTemperature at the core
x 5 KTemperature at the surface
x 6 -State of health
uAInput current
a: Values are interpolated using bilinear interpolation from tabular data as implemented by PSOPT [74].
Table 4. Different optimal control formulations for the fast charging optimal control problem, with each involving two phases.
CaseSub-CaseDescription
1 Minimum time. CC-CV emulation.
2 Minimum time and energy losses with temperature path constraint.
2.aTemperature path constraint above protection.
2.bTemperature path constraint.
3 Minimum time and energy loss with endpoint cost parameterisation.
Table 5. Lithium–ion battery model ANR26650M1B charging specification.
Battery ParameterValueVariable
Nominal capacity @25 °C2.3 AhC
Recommended charge current3 AI
Max continuous charge current10 A I m a x
Recommended charge voltage3.6 V v m a x
Cut-off currentTaper to 125 mA I m i n
Temperature range0 °C to 55 °C T c , T s  1
Life cycle at 1C/1C, 100% DOD>4000 cycles
1  T c is the temperature at the battery core and T s is the temperature at the battery shell.
Table 6. Case 1: Summary of the optimal costs, final state of charge, minimum times, and degradation levels for different maximum input currents.
I 0 (A)Final State of Charge (%)Optimal Cost t s (s) t f (s)Degradation
4C991361.80325.721361.802.68 × 10 5
5C991328.00160.781328.002.96 × 10 5
6C991316.3681.311316.363.22 × 10 5
Table 7. Case 2a: Summary of the final optimal cost, minimum time, and degradation for different maximum charging currents with τ = 5.8 K.
I max (A)Optimal CostEndpoint CostRunning Cost t s (s) t f (s) 1Degradation
4C2777.671564.601213.681153.401564.602.44 × 10 5
5C2777.081563.801213.27934.901563.802.44 × 10 5
6C2777.681677.501214.78814.181562.892.44 × 10 5
1 Final state of charge 99%
Table 8. Case 2b: Summary of the final optimal costs, minimum times, and degradation levels for different maximum input currents with τ = 1.5 K.
I max (A)Optimal CostEndpoint CostRunning Cost t s (s) t f (s) 1Degradation
4C2791.111656.941134.171294.121656.942.45 × 10 5
5C2797.561677.531120.03818.801677.532.46 × 10 5
6C2797.551677.501120.05818.791677.502.46 × 10 5
1 Final state of charge 99%.
Table 9. Case 3 results for different values of β .
β Endpoint CostRunning Cost t f (s) t s (s)Degradation
0.25626.41753.632505.661344.23 2.62 × 10 5
0.50960.51963.211921.021075.91 2.51 × 10 5
0.751297.631076.821730.18951.02 2.46 × 10 5
Disclaimer/Publisher’s Note: The statements, opinions and data contained in all publications are solely those of the individual author(s) and contributor(s) and not of MDPI and/or the editor(s). MDPI and/or the editor(s) disclaim responsibility for any injury to people or property resulting from any ideas, methods, instructions or products referred to in the content.