Article

Study on the Influence of International Economic Law of Carbon Emission Trading on Environmental Sustainable Development

1
Adam Smith Business School, University of Glasgow, Glasgow G128QQ, UK
2
Department of Computer and Information Engineering, Hanseo University, Nam-myeon, Taean-gun, Seosan-si 32158, Republic of Korea
*
Author to whom correspondence should be addressed.
Energies 2024, 17(6), 1453; https://doi.org/10.3390/en17061453
Submission received: 26 December 2023 / Revised: 19 February 2024 / Accepted: 14 March 2024 / Published: 18 March 2024

Abstract

:
With the continuous development of global economic and trade activities, environmental problems have become an important factor restricting the sustainable development of all countries. How to realize the coordinated development of international trade and environmental protection has become a major issue facing the international community. Since China joined the WTO, its share of international trade has been increasing continuously. In order to deeply analyze the influence of international carbon emission trading policy on domestic carbon emissions, we use an input–output model and a GTAP analysis method to theoretically calculate the carbon emissions of the international trade of various departments in Shandong Province. At the same time, the implicit carbon emission index of various industries in 2022 is calculated through the direct energy consumption coefficient. The results show that there are significant differences in the impact of the carbon tariff system on different industries. In terms of the carbon emission index, the food processing industry showed a decrease of 18.99 Mt, while the implied carbon emission of the tobacco, textile and leather manufacturing industry reached 30.56 Mt due to the continuous expansion of trade scale. In contrast, the implied carbon emission level of the metal product processing industry reached 5.3 Mt, while the carbon emission of traditional trading industries such as coal mining was almost unaffected by international trade, and its carbon emission index reached the highest level of 5.89 in 2020. In terms of trade impact, high-trade industries such as the food processing industry are significantly affected by the carbon tariff policy, and their share has dropped from 5.89% to 3.95% in the past decade. The carbon emissions generated by GDP growth established by the GTAP model are more convincing. This model can directly reflect the energy efficiency of a region from the side. Based on the present situation of international trade, this paper analyzes the inequality of the current carbon tariff system, and puts forward some policies to optimize the energy structure to reduce carbon emissions and expand domestic demand to reduce the dependence on international trade. Through the GTAP model, we put forward policy suggestions to optimize the energy structure to reduce carbon emissions and the dependence on international trade by expanding domestic demand.

1. Introduction

With the rapid development of global economic integration, foreign trade between countries is gradually rising to the core position of the global economy. Since China joined the WTO in 2001, its economic development has made remarkable achievements, and it has gradually become the largest exporter and trader of goods in the world. However, economic development depends on a rapid improvement in productivity levels, which along with fossil fuel consumption, resulting in a large number of greenhouse gases, seriously affects the ecological environment and human sustainable development. According to the WIOT (World input–output database) provided by the World Trade Organization, China’s total import and export volume of international trade increased from USD $474.2 billion to USD $2207.5 billion from 2000 to 2009. At the same time, Chinese coal consumption increased from 1.43 billion tons to 38.7 billion tons, and China surpassed the United States to become the world’s first in 2007. The total emissions reached 59.85 mt, accounting for about 20.1% of the global carbon emission [1,2,3]. The phenomenon of environmental degradation caused by economic activities is widespread and the adverse effects of the use of natural resources further affect the optimal allocation of resources.
Faced with a worsening climate, countries have adopted global cooperation to solve environmental problems. In 1992, the United Nations Conference on Environment and Development adopted the United Nations Framework Convention on Climate Change, which sets out a series of provisions for UN member states. The post-Kyoto Protocol, launched in 2005, adopted the Kyoto Protocol resolution and truly opened up the global carbon market [4,5]. The resolution requires developed countries to reduce greenhouse gas emissions by 25 to 40 percent by 2020. Then, at the UN climate change summit, China announced a public commitment to reduce its carbon emissions by 40% by 2020. Based on this, French President Jacques Chirac put forward the concept of the “carbon tariff”, which aims to restrict EU countries implementing the import tax of goods under international economic law and avoid the unfair treatment of steel, coal, energy and other energy-intensive industries under the carbon emission trading mechanism. The appearance of the carbon tariff is bound to affect other energy-intensive countries in the world through international trade, especially vast developing countries [6]. The overall trade structure and form have undergone great changes, the traditional labor cost advantage has been weakened, the advantage of export competition has been increased, the economy and trade are changing from an extensive type to an intensive type, and global trade has entered a new stage of the international division of labor [7,8,9,10]. Therefore, studying the influence of international economic law on carbon emission trade will provide a better reference for our sustainable development strategy. The emergence of carbon tariffs will restrict the development of intensive industries in the short term. The environmental Kuznets curve (EKC) theory points out that in the economic development environment of productivity liberation, the carbon emission in each country needs a process of first rising and then decreasing [11,12]. In the early stage of economic development, carbon emissions show an upward trend, which requires larger production activities and consumes more resources. With an improvement in the economic level, economic development will promote the progress of the industrial technology level, and the structural effect brought by the upgrading and optimization of the industrial structure can in turn reduce carbon emission and environmental damage.
At the same time, carbon tariffs still make sense in the long run. At present, international trade law has conducted extensive research on sustainable development and the carbon tariff system. Abdulsalam et al. [6] took industrial sectors as research objects and applied an input–output method to study energy consumption in Italy’s foreign trade, and proposed the hypothesis of “pollution paradise”. Kurt et al. [7] used the input–output method to analyze the carbon emissions generated in Austria’s foreign trade and pointed out that the carbon emissions caused by Austria’s export products accounted for most of the domestic production process. Liang et al. [8] used the time series model to analyze the emission of various pollutants, including SO2 and CO2, in countries such as China, Germany and the United States, and believed that economic growth had a positive effect on improving the environment. Owusu-Nantwi et al. [9] adopted Pedroni’s co-integration test to test the long-term co-integration relationship between foreign direct investment and economic growth in South America. The results show that foreign direct investment has a significant role in promoting economic growth in the original region.
In terms of the analysis of the factors that influence international trade on carbon emissions, Andrew et al. [10] analyzed 65 countries with a fossil fuel-dominated energy structure, and proposed that the consumption level of OECD countries was generally more than 5% higher than the average level by calculating the CO2 content produced. Finnerty et al. [11] proposed that for countries with an open economy, economic growth is closely related to industrial transfer of participating countries, and it is necessary to focus on the study of high-polluting industries in the countries with industrial transfer. In order to achieve rapid economic development, countries with poor environmental awareness tend to focus on natural resource clusters as the origin of highly pollution-intensive products. Through the establishment of an appropriate input–output table and bilateral trade matrix, the carbon dioxide emissions consumed in the import process of the country’s 21 kinds of industrial products are calculated. The results show that the carbon emissions account for 13% of the total emissions (Figure 1). On the contrary, if the emission reduction policy is limited to the domestic, it will not stimulate domestic consumption and cannot achieve the preset effect of sustainable development. Seymore et al. [11] used the traditional H-O theory to theorize that the implementation of a boundary regulation tax through a carbon tariff system to alleviate environmental damage would worsen local economic environment and show an anti-competitive effect on sustainable development.
According to the GTAP model in this study, the carbon emissions generated by GDP growth are whether the consumed energy is effectively integrated and utilized. This model can directly reflect the energy efficiency of a region from the side. This paper analyzes the inequality of the current carbon tariff system, and puts forward some suggestions on optimizing the energy structure to reduce carbon emissions and expanding domestic demand to reduce the dependence on international trade.
The GTAP framework takes Shandong production as a sub-model, and describes the trade situation with quantitative data after inputting data and converting various parameter coefficients. And each sub-model can be connected into a multi-country and multi-sector equilibrium model. We simulate the changes in the gross domestic product, social welfare, employment rate, import and export in the target area, and plan corresponding measures according to this analysis.

2. Materials and Methods

2.1. Research Object

Since the 1990s, the international division of labor has been deepening, from the division of labor between industries to the division of labor within the industry, and even to the division of labor within products [12,13,14]. In order to seize the development opportunities and better meet the challenges, Shandong Province actively participates in the international production activities and produces a large number of primary parts and components from some developed countries or regions. Shandong Province’s foreign trade has developed rapidly under the incentive of an “export-oriented driving strategy” policy [15,16,17,18]. From 2011 to 2020, the annual growth rate of total imports and exports will reach more than 15 percent, and the total volume will reach 210 billion U.S. dollars in 2020. The foreign trade industry has greatly stimulated the development of the economy, but the excessive energy consumption has destroyed the original harmonious balance between the economy and the environment (Figure 2). In 2010 alone, carbon dioxide emissions reached 870 million tons, a 2.6-times increase from 10 years ago, showing a typical high-carbon economy.

2.2. Methods

(1)
Theoretical analysis. Theoretical analysis plays an important role in the development of human society. It is a summary and extraction of practical experience, which can provide us with scientific thinking tools and guide us to carry out correct practice. Theoretical analysis provides guidance and support for practice. It can help us gain a deeper understanding of the essence and patterns of the problem. Through theoretical analysis, we can develop more scientific and reasonable practical plans to improve practical effectiveness. Theoretical analysis can help us deepen our understanding of the essence of things. By analyzing the internal connections, development patterns, and other aspects of things, we can have a more comprehensive and in-depth understanding of things, thus better responding to practical problems. Theoretical analysis can help us discover new problems. By analyzing and criticizing existing theories, we can identify their shortcomings and contradictions, thereby promoting the development and progress of the theory. With the help of the relevant characteristics and properties of carbon tariff, this paper analyzes the influence of the carbon tariff system on our foreign trade industry. At present, the analysis of the level of environmental pollution usually adopts the dimensionless method of pollution discharge, the weighted calculation method and the calculation method of the indirect regional economic loss caused by environmental damage. In this study, the quantitative analysis model is built by means of the arithmetic average weighted calculation of pollutant discharge based on the standard of the pollutant discharge fee levied in China.
(2)
Literature analysis. The literature is the record and inheritance of research achievements by previous scholars, and through analysis of the literature, a large amount of knowledge and information can be obtained. Researchers can learn about the research achievements, ideological viewpoints, research methods, etc., of their predecessors from the literature, providing reference and inspiration for their own research. Literature analysis helps researchers understand the historical origins, current research status, and development trends of the research field. By analyzing the literature, one can gain a deeper understanding of research hotspots, controversies, theoretical frameworks, etc., in a certain field, providing necessary background knowledge for their own research. The literature contains a large number of research methods and techniques, and through the analysis of the literature, one can learn the methods and techniques adopted by predecessors in their research, providing methodological references and guidance for their own research. Literature analysis facilitates academic exchange and cooperation among scholars. By analyzing the literature, we can gain insights into the research achievements and perspectives of other scholars, promote academic exchange and cooperation, and advance academic research. This study fully investigated the domestic and foreign research on the carbon tariff, summarized the current mainstream carbon tariff models and research orientation, combined with the characteristics of domestic and foreign research models, and put forward a quantitative analysis model.
(3)
Model analysis. A model is a simplification and abstraction of the real world, and the analysis of the model can verify the effectiveness and reliability of a theory. Models are often used in scientific research and engineering design to derive conclusions and make predictions. By analyzing a model, theoretical hypotheses can be verified, thereby improving the credibility of the theory. Model analysis can help us make predictions and decisions. By establishing appropriate mathematical models, we can simulate development trends and outcomes in different scenarios, providing scientific basis for decision-making. For example, in the economic field, economic models can help governments and businesses formulate reasonable policies and strategies. Model analysis can help us solve complex problems. By establishing appropriate models, we can simplify complex problems into easier-to-handle forms, identify key and influencing factors, and propose effective solutions. Model analysis helps us to gain a deeper understanding of the essence and inherent laws of things. By constructing models and analyzing them, we can reveal the relationships and interactions between things, and gain a deeper understanding of their operational mechanisms and evolutionary processes. In this study, an implied carbon calculation model was built to calculate the estimated level of implied carbon in Shandong in 2022. Currently, the input–output model is widely used to calculate the implied carbon generated in the on-production process of products. The model originated from the input–output table theory (I-0 theory) proposed by economist W. Leontief in the 1930s. This theory assumes that the consumption structure and method of a single department for various commodities are the same, that is, the consumption coefficient and distribution mode of resources are consistent. In addition, the theory also proposes that the input and output of each part should be strictly proportional, that is, increasing output should consume corresponding resources. Since there is no technological progress or changes in labor productivity in this theory, different kinds of production factors are unique, and each department cannot combine their functions or break them down into smaller sections, which greatly simplifies the relationship between commodity production and resource consumption between departments.
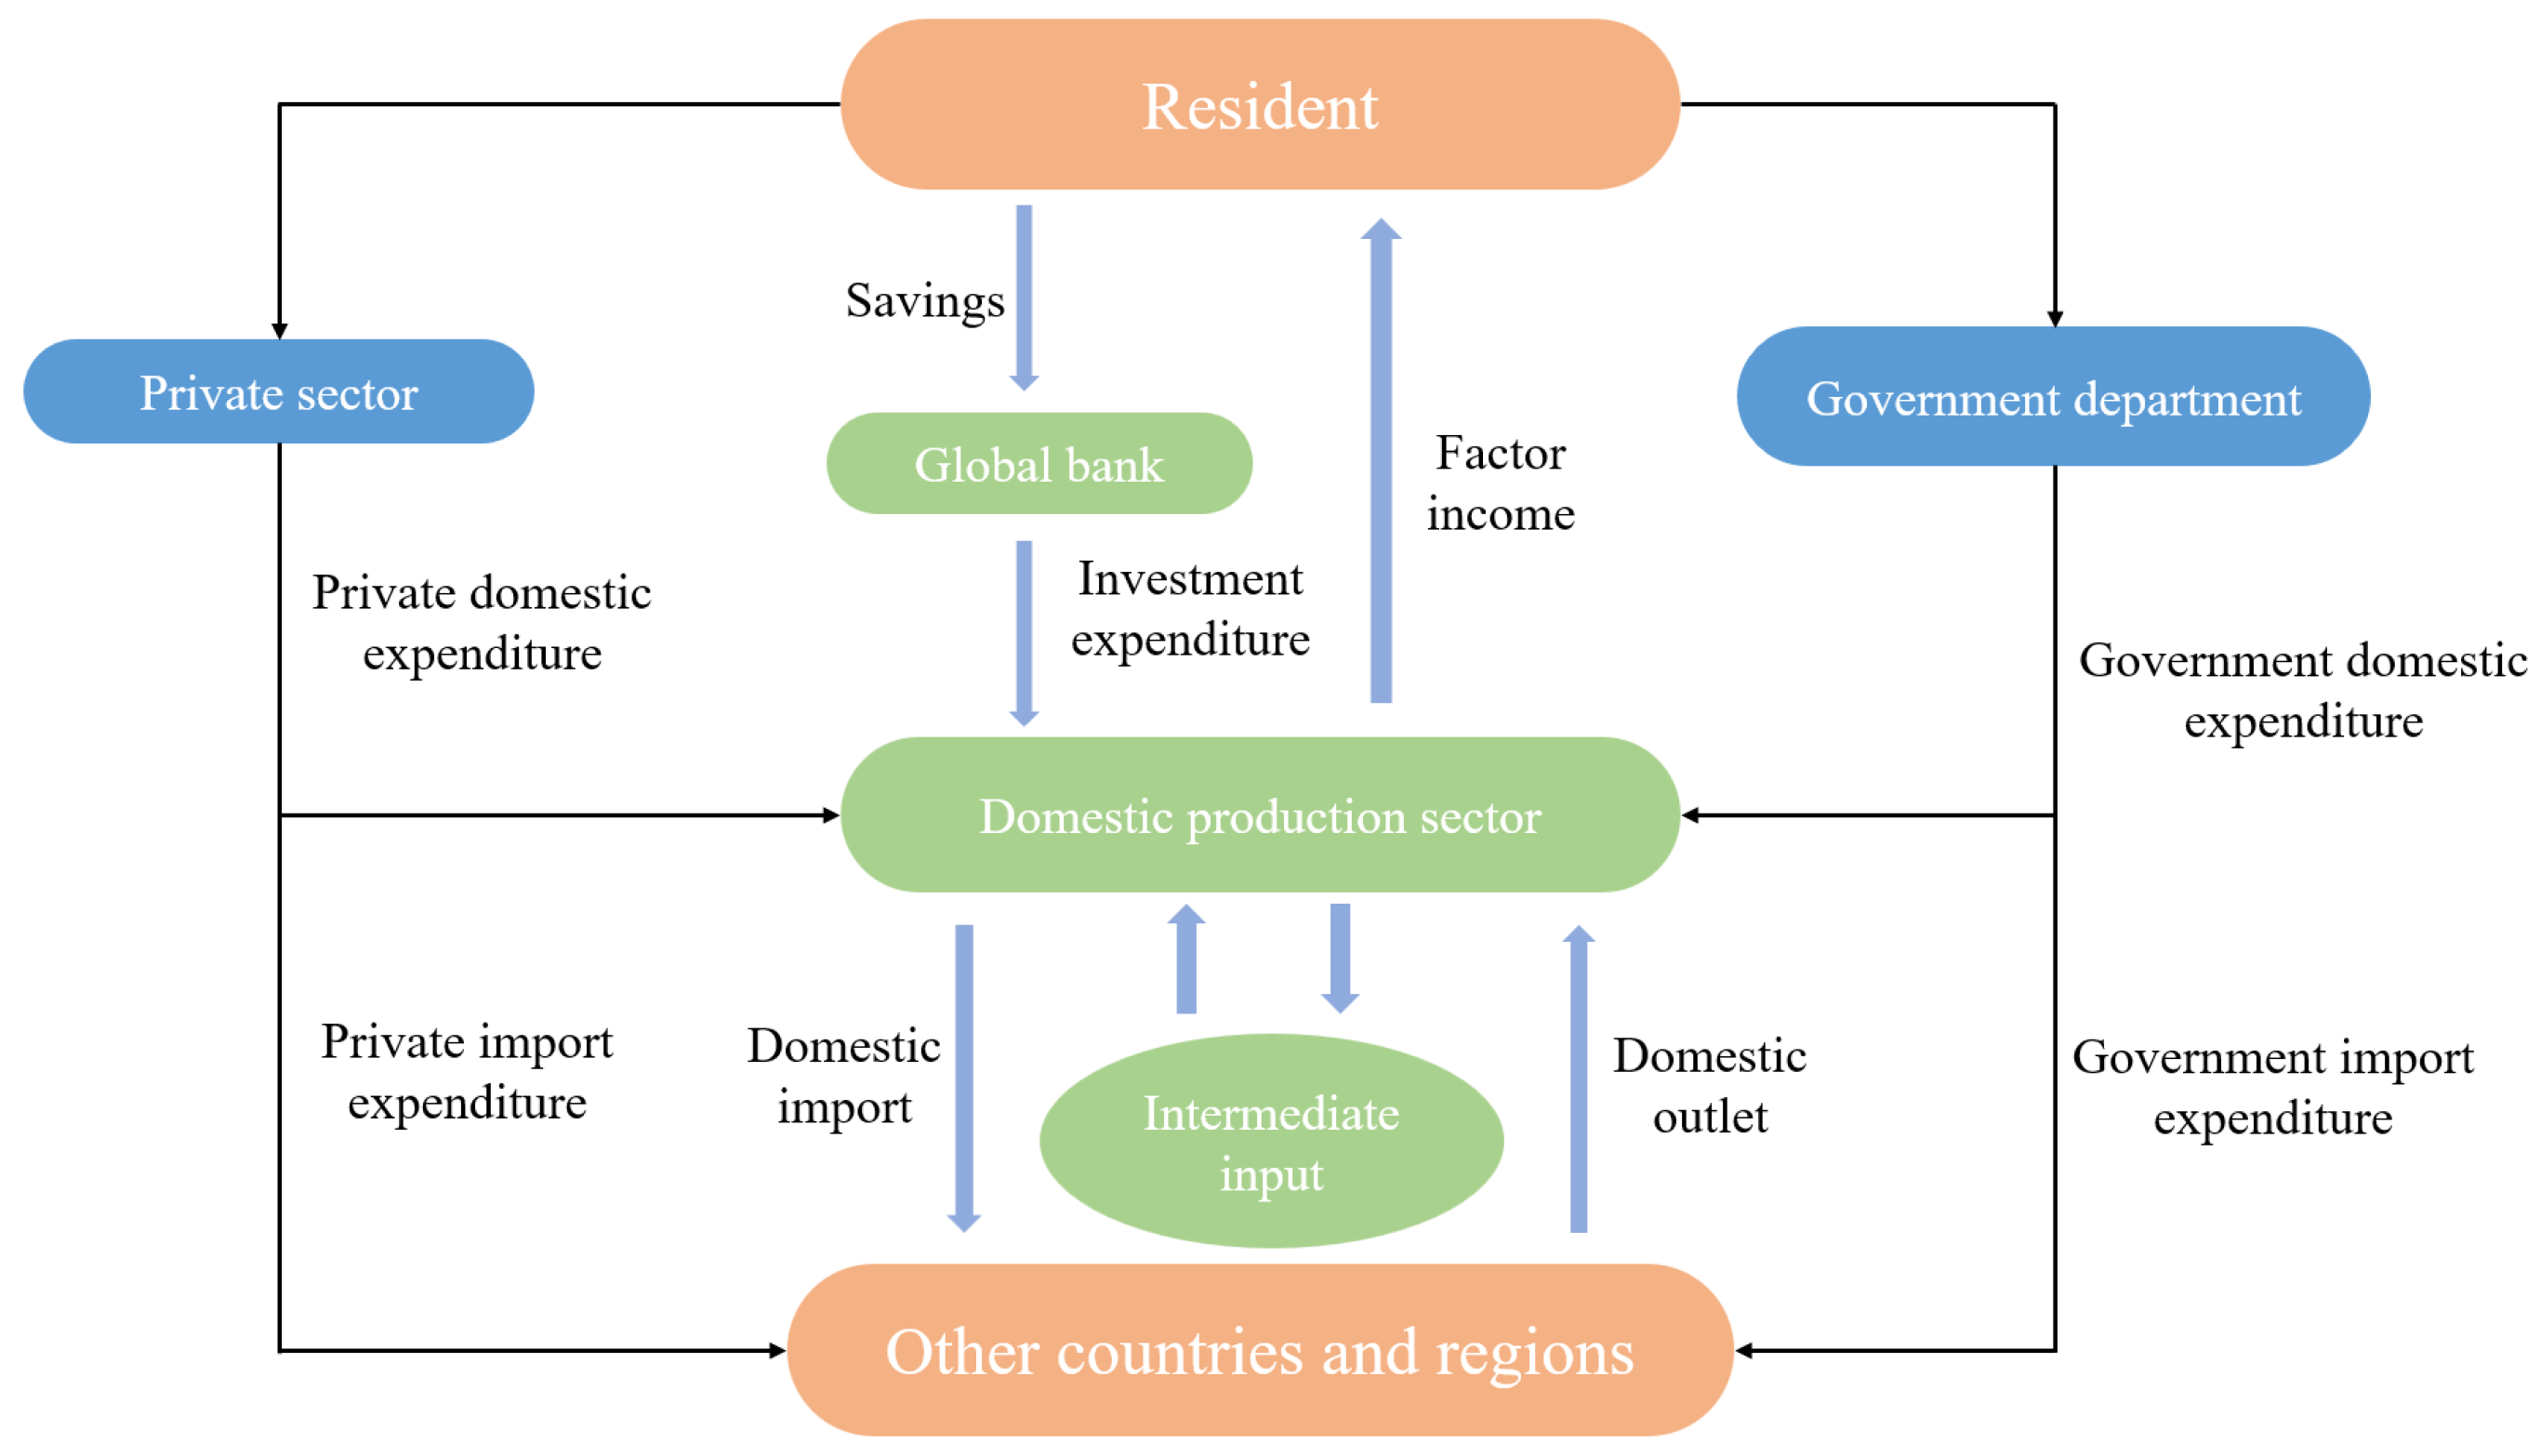
2.3. The GTAP Model

The GTAP model is a computer model developed by the Global Trade Analysis Project, primarily used for international trade and economic policy analysis. This model is a static, econometric, and general equilibrium model that can be used to analyze the impact of economic changes in different countries or regions on the global economy. The GTAP model is based on various countries and regions around the world, dividing economic activities into many sectors, each with two aspects of production and consumption, including the agriculture, industry, and service industries. The model also considers factors such as investment, foreign exchange, and the labor market, and describes the interdependence between departments by establishing input–output tables. This model adopts econometric methods, which can match the model with actual data and improve the prediction accuracy of the model. The GTAP model is a global, generally balanced econometric model mainly used for international trade and economic policy analysis, which can help researchers better understand the interrelationships and impacts between the economies of different countries and provide scientific basis for policy decision-making.
(1) The input–output model selection and construction. The input–output model was built on the basis of balance theory. This paper analyzed the impact of international trade on carbon emission measurement by calculating the input–output in the production process of various departments in Shandong Province [18,19,20,21,22,23]. We calculated the direct blowdown factor Rj as Equation (1):
R j = f j e j
And ej represents the consumption of the unit output value of a department in Equation (2):
e j = E j / X j
where Ej represents the total energy consumption of the sector, and Xj represents the energy carbon emission coefficient of the sector. We calculated the energy carbon emission coefficient of the sector using Equation (3):
f j = k 1 m θ k α kj
in which θ k represents the carbon emission coefficient of k energy, and α kj represents the proportion of k energy consumption in the total energy consumption of the industry. We calculated the direct energy consumption coefficient of the sector using Equation (4):
a ij = x ij / x j ( i , j = 1 , 2 n )
where xj represents the total input of the department in product j, and xij represents the value quantity of type-i products directly consumed by product j in its production activities.
The total amount of consumption calculated for the services or goods of a certain product i is usually shown by the complete consumption coefficient of product department j in production activities. All aij constitute a direct consumption coefficient matrix A, which is denoted as B. The calculation of the energy complete consumption coefficient of this department shall meet Equation (5):
B = ( I A ) 1 I
where ( I A ) 1 is the complete demand coefficient C of the industry, and the matrix satisfies Equation (6):
c ij = b ij ( i j ) 1 + b ij ( i j )
To calculate the complete CO2 emission coefficient for the sector, we used Equation (7):
T j = i 1 n R j b i j
Finally, according to the complete carbon emission coefficient of each sector Tj, the total carbon emission in the import and export process can be calculated by calculating the import and export value of Shandong Province, as shown in Equation (8):
M = T i × Y
Shandong Province is located in the favorable position of the Bohai Economic zone, and the international trade brought by the opening economy has a significant promoting effect on the GDP growth of the province. In order to further analyze the role of foreign trade products in promoting the economy of Shandong Province in a detailed and comprehensive way, the correlation between the law of GDP growth and input–output can be calculated, as shown in Equation (9):
x ij d + x ij m = x ij , c i d + c i m = c i , y i d + y i m = y i
The import department was graded as m i = j = 1 n x ij m + y i m , and all sectors grew to y i m = m i y i j = 1 n x ij + y i and j = 1 n x ij m = m i j = 1 n x ij j = 1 n x ij + y i .
Equation (9) means that in the process of investment, whatever proportion the amount of the final use occupies in the sum of the intermediate input and final use, the corresponding part of import should be disassembled in the same proportion. According to the consistency principle mentioned, assuming that the import and export commodities belong to the same category, and all departments have the same procurement indicators when using domestic and foreign commodities of the same category, then the process flow of imported commodities can be expressed as Equation (10) [3,24]:
x ij m = j = 1 n x ij m x ij j = 1 n x ij
According to the total amount of import and export, the domestic process flow of this commodity can be calculated as Equation (11):
x ij d = x ij x ij m
The gross domestic product increase of an open economy through international trade can theoretically be expressed as Equation (12):
V EX = A ν X EX = A ν I A D 1 E X D
The GDP growth index can be expressed as Equation (13):
η EX = sum V EX sum V
(2) GTAP model processing and data partitioning. The model of the GTAP database (Global Trade Analysis Project) is based on the economic activity data of a certain country or region. With the help of the government, producers, households and other participants involved in the process of international trade, a set of global economy models with closed data is built. This study analyzed the general model of the static region, and could simulate the impact of policy changes on economic shocks under the uniform model with the data provided by the GTAP database. In this model, not only is the output level of various sectors in the region included, but also the regional gross national product and import and export trade indicators.
In order to formulate relevant carbon tariff policies, based on the trade hypothesis of the GTAP model, this study analyzed the market share, tax index and tax rate level of the products of various industries in the context of international trade, and finally affected the carbon emission index of the region. Assuming that products produced domestically and products from other regions can be substituted for each other, the relationship between the share of a certain commodity is represented by Equation (14):
X = a L X m b + a K X d b 1 / b
in which X is the commodity provided in the market, b is the elasticity of substitution of the same commodity at home and abroad, and X m b and X d b represent import and export products, respectively. aL and aK, respectively, represent the market share occupied by import and export commodities.
According to the partial carbon tax policies of each country, the carbon tariff tax standard of most countries is maintained at the level of 20–80 USD/ton. Since the carbon tariff tax method is essentially based on the quantitative index of the carbon emission standard implied by the product, the tariff in the two GTAP model is expressed as a percentage. Therefore, in order to quantitatively calculate the impact of the carbon tariff on carbon emissions, the carbon tariff rate formula of the current year can be calculated as Equation (15):
t i = C i × T E X i
According to the export quota list of Shandong Province in 2022, the carbon tariff rates of various industries are sorted in Table 1.

3. Results and Discussions

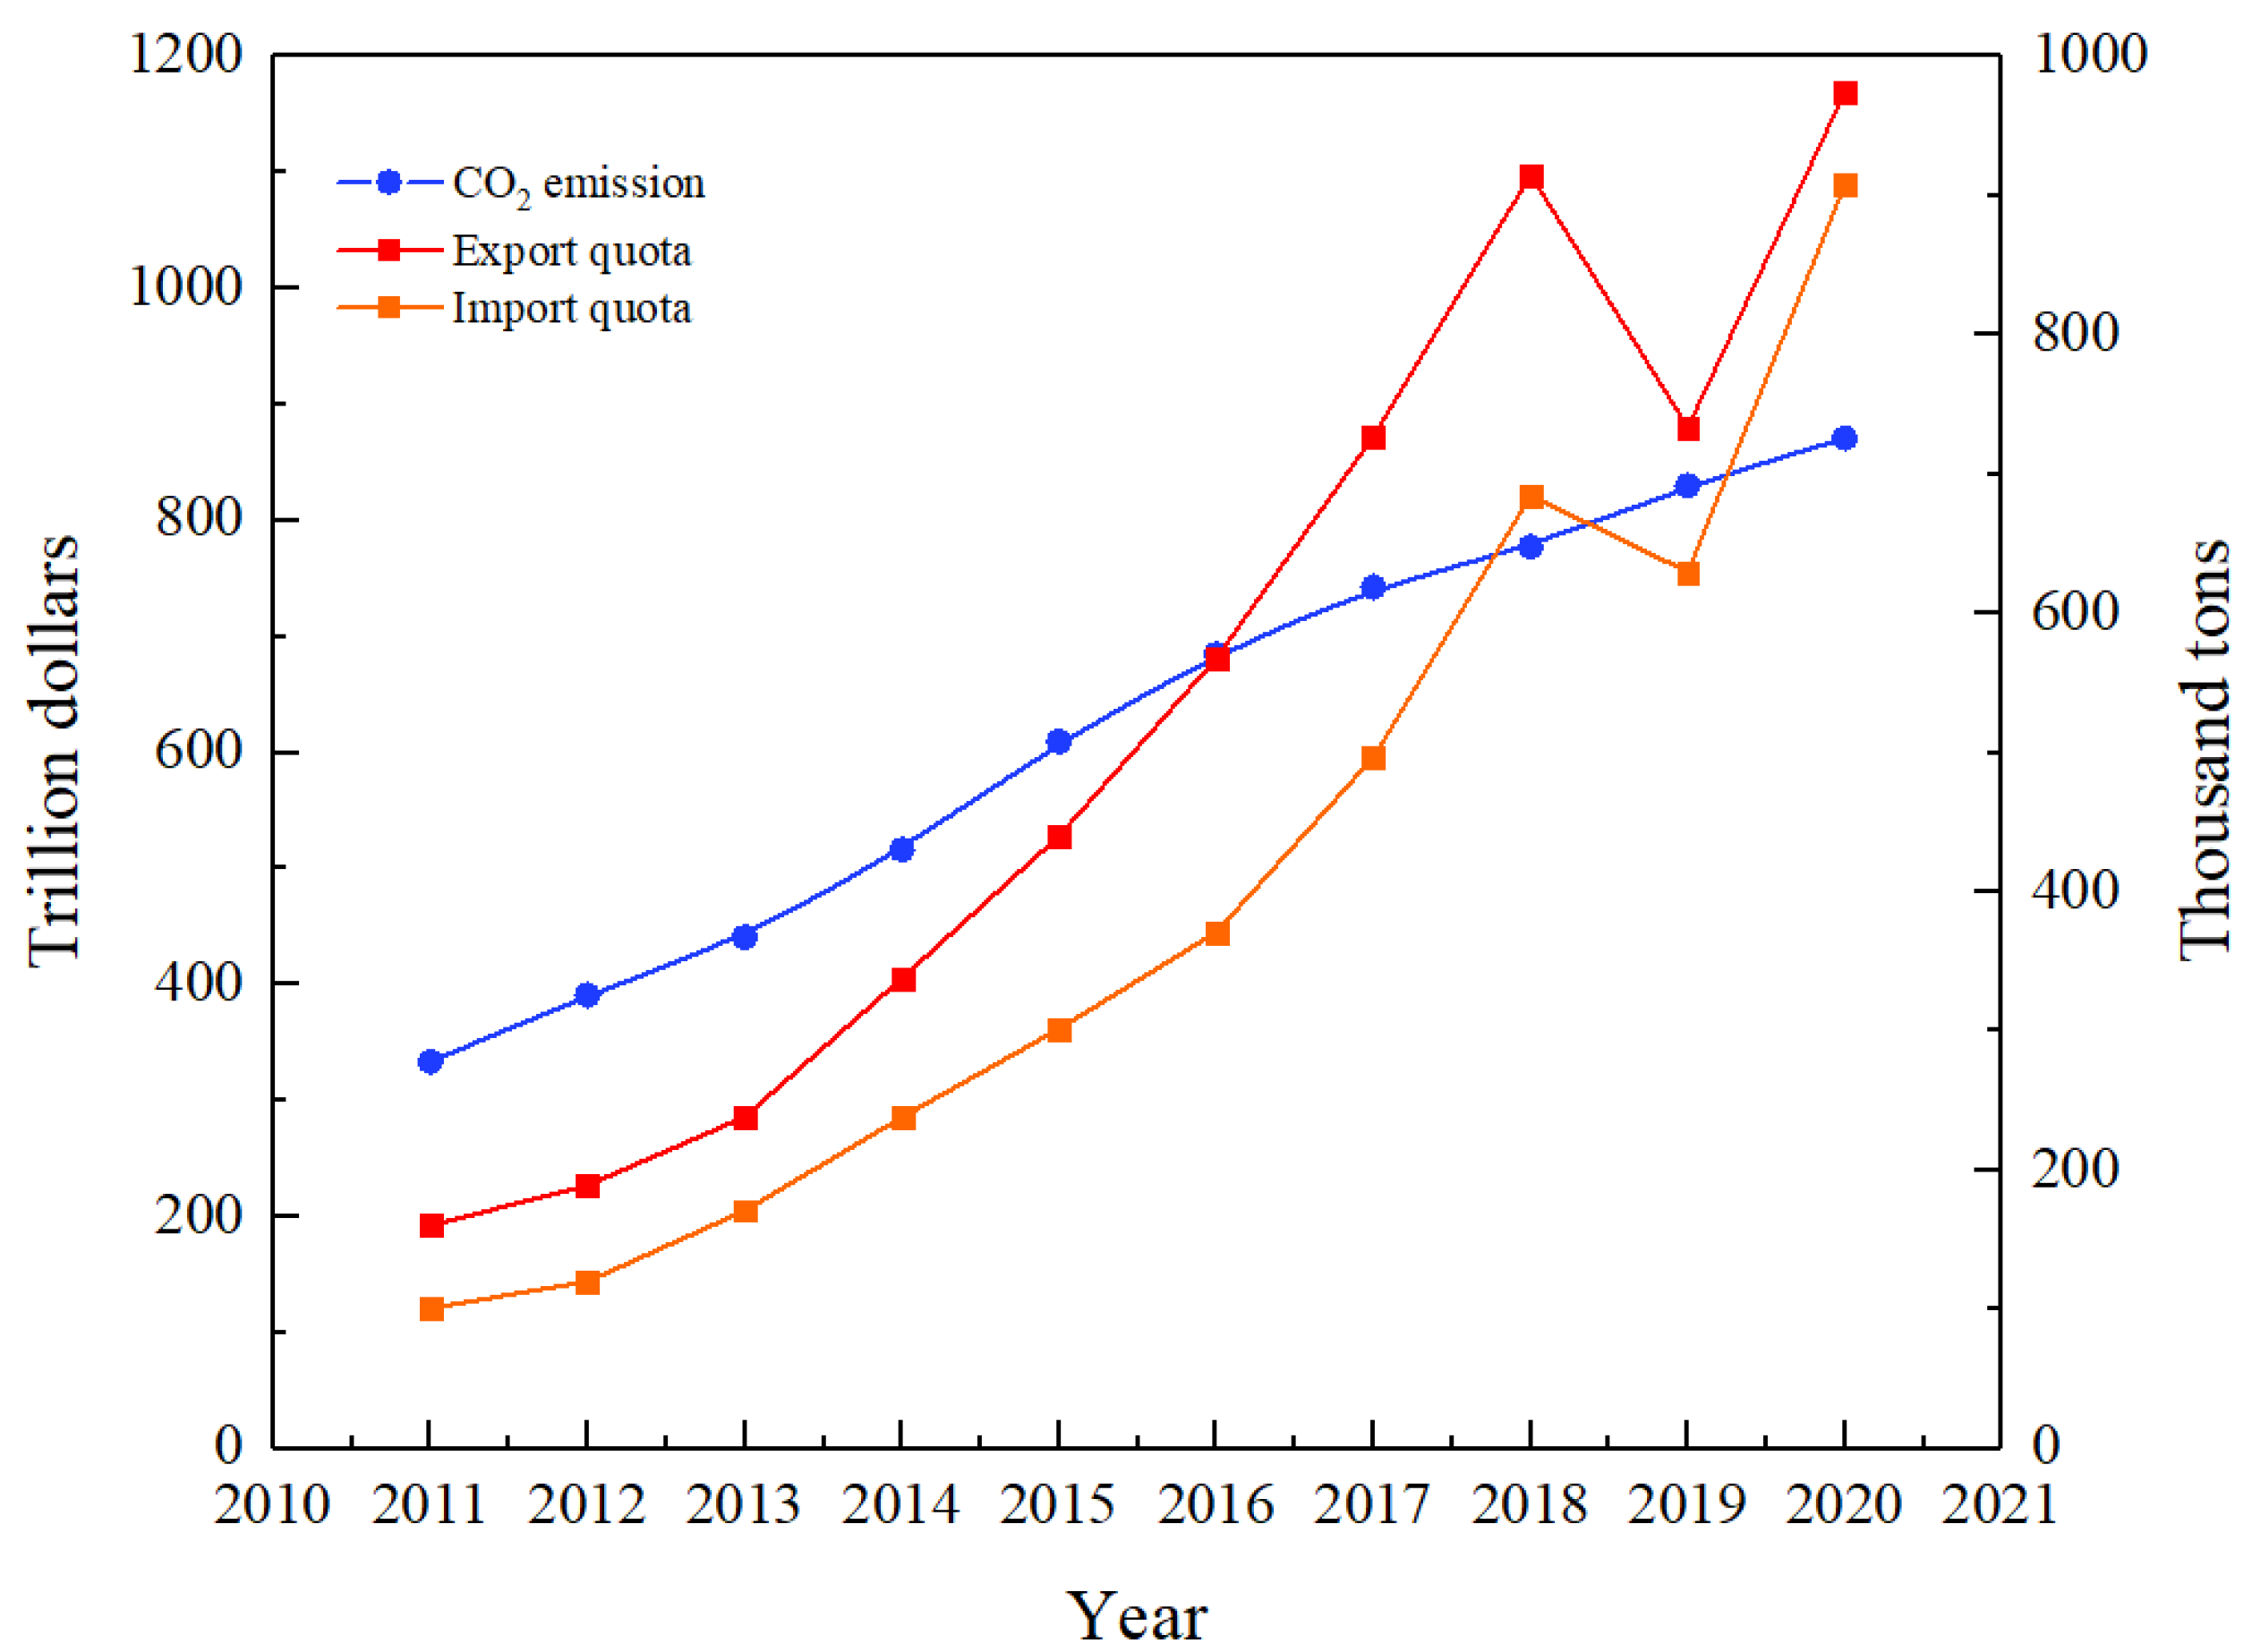
3.1. Implicit Carbon Projections for International Trade

International trade implicit carbon prediction refers to the analysis and estimation of carbon emissions from goods and services involved in international trade activities, in order to predict the carbon footprint of international trade. The implicit carbon prediction in international trade can help governments, businesses, and research institutions evaluate and monitor the impact of international trade on global carbon emissions and climate change, providing a scientific basis for formulating low-carbon policies and sustainable development goals. In addition, it also helps to promote low-carbon economic transformation and promote sustainable trade practices. This prediction is typically based on the following steps:
(1) Classification of goods and services: Firstly, classify goods and services related to international trade. Divide different industries and sectors into different categories based on their nature for better analysis and estimation.
(2) Carbon emission coefficient determination: Determine the carbon emission coefficient for each commodity or service. This requires consideration of the types of energy used in the production process, energy consumption, and related emission factors, which typically rely on various data sources and research results.
(3) Cross-border trade analysis: Based on international trade data, including import and export data, calculate the trade volume of each commodity or service. This can be obtained through statistical data, trade flow databases, and reports from relevant institutions.
(4) Implied carbon calculation: Multiplying trade volume with the carbon emission coefficient to obtain the implicit carbon emissions of each commodity or service. Then, by summing up the implied carbon emissions of all goods and services, the implied carbon footprint of international trade can be predicted.
It should be noted that international trade implicit carbon prediction faces some challenges and uncertainties. This includes factors such as data reliability, differences in measurement methods and standards across different countries and regions, and global supply chain complexity. Therefore, when making predictions and analyses, it is necessary to comprehensively consider various factors and use the latest and most reliable data sources and methods as much as possible.
Based on the input–output theory, the implied carbon emission model of one-way industry was constructed, and the calculated results of implied carbon emissions of different industries in Shandong Province in 2022 could be obtained, as shown in Figure 3.
From the perspective of the technical effect, due to the existence of a carbon tariff trading system, the implied carbon emission index of the food processing, wood and paper industries dropped the fastest, reaching 18.99 Mt. The carbon emission index of the transportation industry, metal products and other industries was 9.65 Mt. The transportation industry, agriculture and power supply industry saw the smallest decrease, with a decrease level of 0.11 Mt. Therefore, the carbon tariff system fully reflects the rule that the national pillar industry of Shandong Province is less affected by international trade, while the decrease in the food processing and equipment transportation industry, which had the biggest change, shows that international trade greatly stimulates the development of related industries, which is manifested by the decrease in energy consumption per unit of output value. From the perspective of scale effect, the industries that play a major role in increasing the export of hidden carbon include food, beverages and tobacco, textile and textile products, and leather and leather product manufacturing [25]. The hidden carbon emissions of the mining industry reached 30.56 Mt, and the scale effect of all industries was positive. It shows that the emergence of the carbon tariff system has not restricted the expansion of the scale of each industry in Shandong Province, and the scale of the industry has a significant positive correlation with the national economy. It has its own technical applications in core process processing, graphics technology, machine learning, NoSQL query and so on [26,27].
From the perspective of the structural effect, agriculture, coal mining, power supply and the light industry showed a downward trend, among which the implied carbon level of the non-metallic mineral manufacturing industry decreased by 2.48 Mt. The implied carbon level of the metal product processing industry reached 5.3 Mt, and the structural effect of the metal industry made a significant contribution to the increase in implied carbon, indicating that the industry in Shandong Province was almost unaffected by international trade and showed an increasing trend with the increase in the national economy.

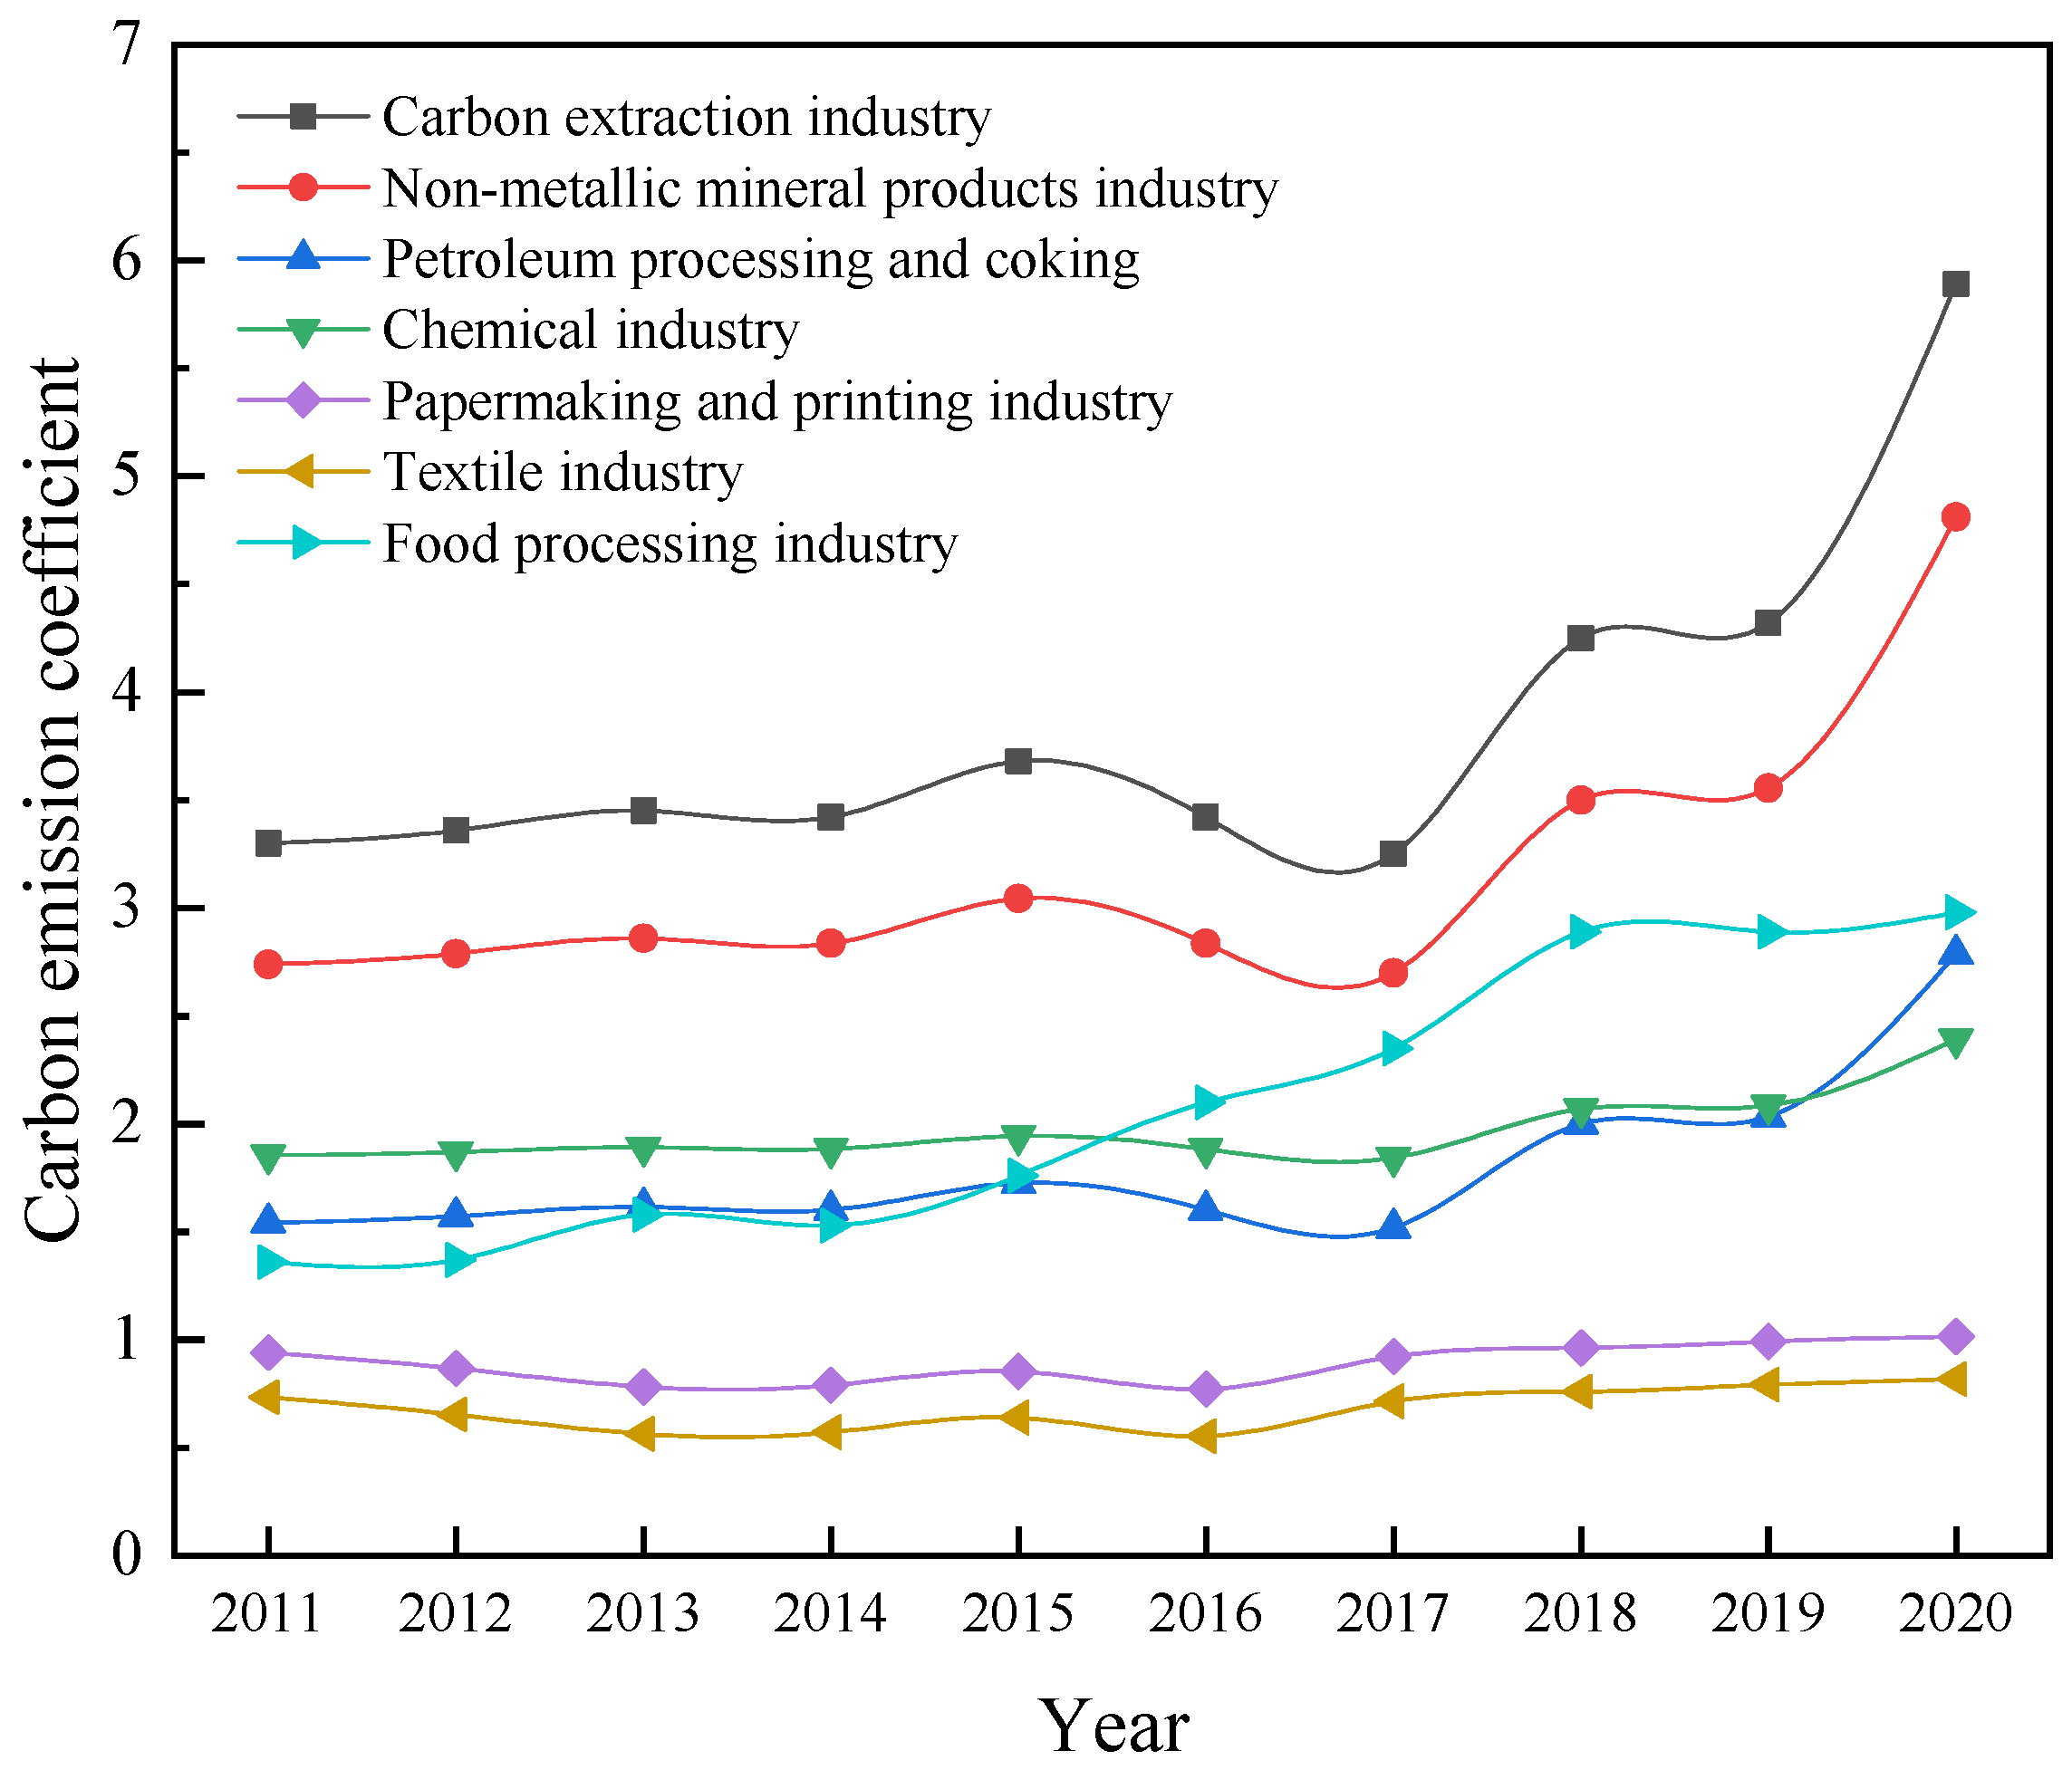
3.2. Carbon Emission Coefficient Calculation

The carbon emission coefficient is an indicator that measures the amount of carbon dioxide emissions generated per unit of product or activity, usually expressed as carbon emissions per unit of output (such as per ton of product, per kilowatt hour of electricity, etc.). The method of calculating carbon emission factors depends on the specific product or activity type, but the following general steps can usually be followed:
(1) Determine the calculation range: First, it is necessary to determine the range for calculating the carbon emission coefficient, including which links and processes to consider for carbon emissions. Usually, it includes the production stage, transportation stage, usage stage, etc.
(2) Collect data: Collect relevant data, including the types and consumption of energy used in the production process, sources of raw materials, process flow, transportation methods, etc. These data can come from internal company records, supply chain information, energy consumption data, etc.
(3) Calculate energy consumption: based on the collected data, calculate the energy consumption used in the production process, including electricity, fuel, etc.
(4) Calculate carbon emissions: Calculate the carbon emissions per unit of product or activity based on energy consumption and corresponding carbon emission factors. The carbon emission factor refers to the amount of carbon emissions generated per unit of energy consumption, usually expressed as carbon emissions per unit of energy.
(5) Calculate the carbon emission coefficient: divide the carbon emissions per unit of product or activity by the unit output to obtain the carbon emission coefficient.
According to the input–output data table of Shandong Province given, the effect of a premium of imported commodities was been considered in the specific calculation in this study, and the complete carbon emission coefficient of each industry could be calculated. In order to further analyze the hidden carbon impact brought by international trade, this study focused on the analysis of seven high-carbon emission sectors, namely the coal mining industry, non-metallic mineral products industry, petroleum processing, coking and nuclear fuel processing industry, chemical industry, paper and printing industry, textile industry and food processing industry, which are listed as groups 1 to 7 in order. Energy consumption parameters were divided according to the period from 2011 to 2020, and the complete carbon emission coefficient of each industrial sector in corresponding years was summarized, as shown in Figure 4.
According to the complete carbon emission coefficient calculated by each industrial sector over the years, the high-carbon characteristics of each sector can be calculated. The mining industry and non-metallic mineral products industry ranked first over the past 10 years. Except for a small decrease in 2017, the carbon emission coefficient of other years increased significantly, reaching 5.89 and 4.81, respectively, in 2020. Therefore, as the prominent industries in the traditional trade pattern in Shandong Province, the carbon emission of the traditional coal industry and non-metallic mining property is almost not affected by international trade, but increases with the growth of the domestic production level. As the value chain of the chemical industry within the whole industry is mainly a single processing and manufacturing link, the supply chain environment is easy optimize through international trade, and the upstream raw materials are easy to be supplemented, so the chemical industry has a more significant growth rate compared with other industries. Its complete carbon emission coefficient increased from 1.54 to 2.79 in the past ten years. The growth rate reached 181%, reaching first place in the high-carbon-emission sector. In addition, the textile industry and food processing industry had the lowest carbon emission coefficient in the high-carbon emission sector, and showed a trend of fluctuation over time, without significant growth. This is because these industries have the characteristics of a high trade share, and occupy a large proportion in the total export trade. The food processing industry, for example, accounted for 5.89 percent of carbon emissions in 2011, but this dropped to 3.95 percent in 2020.

3.3. Implementation Prospect of Carbon Tariff in International Trade

The implementation of a carbon tariff has become the general trend to ensure sustainable development in the context of the global economy. The implementation of carbon tariff and measures to be taken at home show the following characteristics.
(1) Inequality of the carbon tariff system. The current international trade rules have not yet included the content of the carbon tariff, which is often contrary to the principles of fair trade and national treatment in developed countries. The establishment of carbon tariffs needs to be based on a unified global carbon emission measurement standard, which cannot form an internationally recognized system in a short time. This is because the beneficial relationship brought by the carbon tariff is difficult support in most countries, and the impact of greenhouse gas emissions on the environment is often affected by climate change in a certain region, not solely related to human economic production activities.
(2) Expand domestic demand and reduce dependence on international trade. Our country’s present economy structure is mainly based on fixed-assets investment and foreign trade, but the domestic demand has been in the weak condition, and the intensity of domestic economy is far lower than the level of the developed countries. In our country, as a large trade nation, expanding domestic demand can reduce the dependence on foreign trade and improve the autonomy and independence of economic development. By driving economic growth, the technological level of relevant domestic products can be improved, and the hidden carbon emission contribution of technological effects within the industry can be continuously increased, thus weakening the impact of the international economy on the environment for sustainable development.
(3) Gradually implement a carbon tariff system in the international trade environment. The appearance of the carbon tariff will directly promote the rapid development of a low-carbon economy, and then improve the problem of environmental pollution. Since most of the carbon emissions in developing countries come from industrial production, it is of positive significance for the economic transformation of these countries. With the implementation of the carbon tariff trade act, major enterprises will invest in energy-saving and environmental protection technology, guide the upgrading of their domestic industrial structure and improve production processes. Developing countries have a vast domestic market, and the appearance of a carbon tariff will make it difficult for products to enter the foreign market. Developing countries will pay more attention to the development of the domestic consumption market and cope with the deteriorating international trade environment. Therefore, the export regulations of labor-intensive products will be further relaxed. For technology-intensive industries, such as precision-machining industries and other high-tech products, export will be encouraged by the policy. Higher tariffs will be imposed on exports of resource-intensive goods, accelerating the transformation of the domestic economy.

4. Conclusions

(1) Based on the input–output model, this study analyzed the impact of international trade on carbon emission measurement by calculating the input and output in the production process of various departments in Shandong Province, and calculated the implied carbon emission index classified by industry in 2022. The results show that, due to the existence of a carbon tariff trading system, the reduction level of the implied carbon emission index in food processing industry reached 18.99 Mt due to the effect of technology. The trade scale of the food, tobacco, textile and leather manufacturing industry continues to expand, and the implied carbon emission reached 30.56 Mt, showing a significant positive correlation with the national economy. Structural industries such as the paper industry, petroleum industry, coking products and metal smelting are increasing. The implied carbon level of the metal product processing industry only reached 5.3 Mt, showing a trend of increasing with an increase in the national economy.
(2) Based on the GTAP model, in the context of international trade, this study focused on the analysis of the market share, taxation index and tax rate level of the industrial products of seven high-carbon sectors, which ultimately affect the carbon emission index of the region. The results show that the carbon emissions of the traditional trade pattern industries such as coal mining are almost unaffected by international trade, and they reached the highest level of 5.89 in 2020. High-trade industries such as the food processing industry have been significantly affected by the carbon tariff policy. In the past ten years, their proportion has decreased from 5.89% to 3.95%. It is necessary to adjust the industrial structure of such high-trade industries and reduce the carbon dioxide emissions in the production process.
(3) The carbon emissions generated in accordance with a GDP increase, established by the GTAP model in this study, are more convincing. Its essence is not the amount of energy resources used by human beings, but whether the energy consumed is effectively integrated and utilized. Compared with the traditional statistics of per capita emissions in a region or the total amount of cumulative emissions, the model can directly reflect the energy efficiency of a region from the side. Based on the current situation of international trade, the inequality of the current carbon tariff system was analyzed, and the policy of optimizing the energy structure to reduce carbon emissions and expand domestic demand to reduce the dependence of international trade was put forward.

Author Contributions

Software, J.-T.K.; Investigation, Z.C.; Resources, Z.C.; Data curation, Z.C.; Writing—original draft, Z.C. and J.-T.K.; Writing—review & editing, Z.C. and J.-T.K.; Project administration, J.-T.K. All authors have read and agreed to the published version of the manuscript.

Funding

This research received no external funding.

Data Availability Statement

The figures and tables used to support the findings of this study are included in the article.

Acknowledgments

The authors would like to show sincere thanks to those who have contributed to this research.

Conflicts of Interest

The authors declare no conflicts of interest.

References

  1. Caglar, A. The importance of renewable energy consumption and FDI inflows in reducing environmental degradation: Bootstrap ARDL bound test in selected 9 countries. J. Clean. Prod. 2020, 264, 121663. [Google Scholar] [CrossRef]
  2. Soytas, U.; Sari, R.; Ewing, B. Energy consumption, income, and carbon emissions in the United States. Ecol. Econ. 2007, 62, 482–489. [Google Scholar] [CrossRef]
  3. Jiang, W.; Cole, M.; Sun, J.; Wang, S. Innovation, carbon emissions and the pollution haven hypothesis: Climate capitalism and global re-interpretations. J. Environ. Manag. 2022, 307, 114465. [Google Scholar] [CrossRef]
  4. Cai, L. Research on multiple objective planning model of e-commerce logistics distribution center under carbon emissions. Fresenius Environ. Bull. 2022, 31, 9901–9908. [Google Scholar]
  5. Finnerty, N.; Sterling, R.; Contreras, S.; Coakley, D.; Keane, M. Defining corporate energy policy and strategy to achieve carbon emissions reduction targets via energy management in non-energy intensive multi-site manufacturing organisations. Energy 2018, 151, 913–929. [Google Scholar] [CrossRef]
  6. Abdulsalam, A.; Xu, H.; Ameer, W.; Abdo, A.; Xia, J. Exploration of the impact of China’s outward foreign direct investment (FDI) on economic growth in Asia and North Africa along the belt and road (B&R) initiative. Sustainability 2021, 13, 1623. [Google Scholar] [CrossRef]
  7. Kratena, K.; Meyer, I. CO2 Emissions Embodied in Austrian International Trade; FIW-Research Reports No. 009/10-02; FIW—Research Centre International Economics: Vienna, Austria, 2010. [Google Scholar]
  8. Liang, X.; Lin, S.; Bi, X.; Lu, E.; Li, Z. Chinese construction industry energy efficiency analysis with undesirable carbon emissions and construction waste outputs. Environ. Sci. Pollut. Res. 2021, 28, 15838–15852. [Google Scholar] [CrossRef] [PubMed]
  9. Owusu-Nantwi, V.; Erickson, C. Foreign direct investment and economic growth in South America. J. Econ. Stud. 2019, 12, 124–135. [Google Scholar] [CrossRef]
  10. Peters, G.; Andrew, R.; Lennox, J. Constructing an environmentally-extended multi-regional input–output table using the GTAP database. Econ. Syst. Res. 2011, 23, 131–152. [Google Scholar] [CrossRef]
  11. Behera, S.R.; Dash, D.P. The effect of urbanization, energy consumption, and foreign direct investment on the carbon dioxide emission in the ssea (south and southeast asian) region. Renew. Sustain. Energy Rev. 2017, 70, 96–106. [Google Scholar] [CrossRef]
  12. Seymore, R.; Mabugu, M.; van Heerden, J. The Welfare Effects of Reversed Border Tax Adjustments as a Remedy under Unilateral Environmental Taxation. Energy Environ. 2012, 23, 1209–1220. [Google Scholar] [CrossRef]
  13. Flaaen, A.; Hortaçsu, A.; Tintelnot, F. The production relocation and price effects of US trade policy: The case of washing machines. Am. Econ. Rev. 2020, 110, 2103–2127. [Google Scholar] [CrossRef]
  14. Lockwood, B.; Whalley, J. Carbon-motivated border tax adjustments: Old wine in green bottles. World Econ. 2010, 33, 810–819. [Google Scholar] [CrossRef]
  15. Dissou, Y.; Eyland, T. Carbon control policies, competitiveness, and border tax adjustments. Energy Econ. 2011, 33, 556–564. [Google Scholar] [CrossRef]
  16. Rivers, N.; Schaufele, B. The effect of carbon taxes on agricultural trade. Can. J. Agric. Econ./Rev. Can. D’agroeconomie 2015, 63, 235–257. [Google Scholar] [CrossRef]
  17. Sakin, E.; Yanardag, I. Effect of application of sheep manure and its biochar on carbon emissions in salt affected calcareous soil in Sanliurfa Region SE Turkey. Fresenius Environ. Bull. 2019, 28, 2553–2560. [Google Scholar]
  18. Van Calster, G. Topsy-Turvy: The European Court of Justice and Border (Energy) Tax Adjustments–Should the World Trade Organisation Follow Suit? Crit. Issues Environ. Tax. Int. Comp. Perspect. 2003, 1, 311–341. [Google Scholar]
  19. Van Asselt, H.; Brewer, T. Addressing competitiveness and leakage concerns in climate policy: An analysis of border adjustment measures in the US and the EU. Energy Policy 2010, 38, 42–51. [Google Scholar] [CrossRef]
  20. Jakob, M. Climate policy and international trade–A critical appraisal of the literature. Energy Policy 2021, 156, 112399. [Google Scholar] [CrossRef]
  21. Fischer, C.; Fox, A. The role of trade and competitiveness measures in US climate policy. Am. Econ. Rev. 2011, 101, 258–262. [Google Scholar] [CrossRef]
  22. Biermann, F.; Brohm, R. Implementing the Kyoto Protocol without the USA: The strategic role of energy tax adjustments at the border. Clim. Policy 2004, 4, 289–302. [Google Scholar] [CrossRef]
  23. Böhringer, C.; Carbone, J.; Rutherford, T. Unilateral climate policy design: Efficiency and equity implications of alternative instruments to reduce carbon leakage. Energy Econ. 2012, 34, S208–S217. [Google Scholar] [CrossRef]
  24. Holland, M. Fiscal crisis in Brazil: Causes and remedy. Brazil. J. Polit. Econ. 2019, 39, 88–107. [Google Scholar] [CrossRef]
  25. Zhao, D.; Xu, S. Study on couping coordination degree and its economic effects of regional carbon emission-industrial structure-environmental protection. Fresenius Environ. Bull. 2022, 31, 3159–3166. [Google Scholar]
  26. Markevych, K.; Maistro, S.; Koval, V.; Paliukh, V. Mining sustainability and circular economy in the context of economic security in Ukraine. Min. Miner. Depos. 2022, 16, 101–113. [Google Scholar] [CrossRef]
  27. Xavier, L.H.; Giese, E.C.; Ribeiro-Duthie, A.C.; Lins, F.A.F. Sustainability and the circular economy: A theoretical approach focused on e-waste urban mining. Resour. Policy 2021, 74, 101467. [Google Scholar] [CrossRef]
Figure 1. GTAP model structure diagram.
Energies 17 01453 g001
Figure 2. Economic data from 2011 to 2020 and carbon emission statistics of Shandong Province.
Energies 17 01453 g002
Figure 3. Implied carbon emission indicators by industry for Shandong Province in 2022.
Energies 17 01453 g003
Figure 4. Carbon emission coefficient map of high-carbon-emitting sectors in Shandong Province from 2011 to 2020.
Energies 17 01453 g004
Table 1. Shandong province by industry carbon tariff rate level.
Industrial SectorsExport Hidden Carbon
(Million Tons)
Total Output
(Million US Dollars)
Tax Standard
(US Dollars)
2050
Agriculture17.6118,342.01--
Coal mining industry52.141876.83--
Oil and gas extraction industry5.52796.76--
Other mining12.674398.02--
Food processing industry11.2539,086.350.60%1.20%
Textile industry13.91122,346.480.19%0.40%
Clothing and leather manufacturing9.00187,589.690.08%0.16%
Wood processing industry6.3156,700.390.20%0.40%
Paper industry1557.8418,327.370.08%0.16%
Petroleum, coking products and nuclear fuel processing products32.5836,271.131.20%2.40%
Chemical industry112.57170,673.070.24%0.48%
Non-metallic mineral manufacturing industry176.3036,750.270.08%0.16%
Metal smelting and processing manufacturing industry209.4673,711.130.20%0.40%
Manufacturing of metal products9.6871,658.660.20%0.40%
Transport equipment manufacturing industry9.5983,263.500.08%0.16%
Electronic communication equipment manufacturing industry6.26434,293.430.03%0.065
Machinery equipment manufacturing industry2610.29373,198.080.07%0.14%
Other manufacturing3.2193,180.940.14%0.28%
The production and supply of electricity1234.492032.27--
Construction industry7.367113.99--
Transportation industry121.4428,930.96--
Wholesale and retail5.5428,431.24--
Disclaimer/Publisher’s Note: The statements, opinions and data contained in all publications are solely those of the individual author(s) and contributor(s) and not of MDPI and/or the editor(s). MDPI and/or the editor(s) disclaim responsibility for any injury to people or property resulting from any ideas, methods, instructions or products referred to in the content.

