Article

Bi-Layer Planning of Integrated Energy System by Incorporating Power-to-Gas and Ground Source Heat Pump for Curtailed Wind Power and Economic Cost Reduction

School of Electrical Engineering, North China University of Water Resources and Electric Power, Zhengzhou 450045, China
*
Author to whom correspondence should be addressed.
Energies 2024, 17(6), 1447; https://doi.org/10.3390/en17061447
Submission received: 31 January 2024 / Revised: 1 March 2024 / Accepted: 7 March 2024 / Published: 17 March 2024
(This article belongs to the Topic Multi-Energy Systems, 2nd Volume)

Abstract

:
The popularization of renewable energy is limited by wasteful problems such as curtailed wind power and high economic costs. To tackle these problems, we propose a bi-layer optimal planning model with the integration of power to gas and a ground source heat pump for the existing integrated energy system. Firstly, the inner layer optimizes the daily dispatch of the system, with the minimum daily operation cost including the penalty cost of curtailed wind power. Then, the enumeration method of outer-layer optimization determines the device capacity of various schemes. After that, optimal planning can be achieved with the minimum daily comprehensive cost. The result of this example shows that the improved system can reduce curtailed wind power and system costs, thus improving the overall economy. Finally, the influences of algorithms and gas prices on planning optimization are studied.

1. Introduction

In recent years, the environmental problems caused by the pollutant emissions of fossil fuels in traditional energy systems have become increasingly serious [1]. In order to improve this situation, the utilization and development of renewable energy have become hot issues. Meanwhile, several countries are also building a new power system based on renewable energy [2]. And it is expected that China’s carbon emission peak and the carbon neutrality of China will be achieved in 2030 and 2060, respectively [3]. However, especially in areas with abundant wind resources, such as Northern China, the wind curtailment phenomenon is in a dilemma because the electric power system is not flexible enough [4,5].
An integrated energy system has the advantages of high efficiency and economy, which can promote the consumption of local renewable energy [6] and improve the level of large-scale development and utilization [7]. Enhancing flexibility through energy conversion is a key area in energy systems [8]. Compared with traditional energy conversion equipment, the maturity of P2G technology provides a new solution for the consumption of renewable energy [9,10], which makes it possible for the two-way flow of energy between natural gas and electricity. Zhang et al. [11] fully considered the dynamic characteristics of P2G and pipeline, which improves the flexibility of the system and the ability to accommodate wind power. Wang et al. [12] proposed a dispatch model considering the wind power utilization rate, which helps study the influence of P2G cost characteristics in the system. Sun et al. [13] established a probabilistic optimal power flow model of multi-period natural gas and power systems including P2G, which analyzes the effectiveness of P2G in coping with wind power fluctuations. Chen et al. [14] established several detailed models of energy hubs including the fuel cell (FC) and P2G, which enhance the coupling of the system and improve the operation cost. Jiang et al. [15] took the minimum operating cost, minimum wind curtailment rate, and minimum comprehensive cost as the optimization goal, which verifies the effectiveness of applying P2G to improve the wind power accommodation ability. Li et al. [16] established a two-layer economic scheduling model of integrated natural gas and an electric power system, which comprehensively considers wind power and power-to-gas processes. Chen et al. [17] studied the optimal dispatch and market equilibrium in integrated electric power and natural gas networks with P2G embedded, which can contribute to the utilization of renewable energy and carbon emission reductions. Siqin et al. [18] connected the P2G device to the CCHP microgrid, considering the uncertainty of wind power and PV output and the pollutant emission, thus improving the stability and economy of the system’s operation.
Some research is devoted to promoting wind power accommodation from the perspective of adjusting heat supply flexibly. Wang et al. [19] improved the wind curtailment problem by configuring a heat storage device. Ma et al. [20] promoted the conversion of wind power into the heat supply by using electric boilers. Zhou et al. [21] combined the heat storage device and the electric boiler reasonably for wind power accommodation in an optimal dispatch strategy. Similarly, as an electric-to-heat conversion device, a ground source heat pump (GSHP) not only provides a heating supply in winter but also a cold supply in summer [22]. Nowadays, as an ideal tool for clean energy, the GSHP has been widely used in integrated energy systems. Zhang et al. [23] constructed a scheduling model with seasonal differences in ecosystems in integrated energy systems, and the research results are helpful in improving the utilization efficiency of ground source heat pumps and the economy of industrial enterprises. Li et al. [24] proposed a coupling system of cooling, heating, power, and ground source heat pumps to analyze the energy performance of the system and solve the optimization problem of the coupling system by quantum genetic algorithm (QGA) and simple genetic algorithm (SGA). Cui et al. [25] proposed an optimal scheduling method for the source-load coordination of integrated energy systems, which considers introducing ground source heat pumps to the source side, thus promoting wind power to supply heat and reducing the operation cost of the system. Sun et al. [26] proposed a planning method for an integrated community energy system, considering both reliability and economy, which is equipped with three kinds of electric-to-heat equipment, including ground source heat pump, air source heat pump, and electric boiler. Jin et al. [27] proposed a mixed-integer nonlinear programming model in order to improve the economy of an integrated energy system, which is based on the optimal allocation of photovoltaics, fan, ground source heat pump, and power-to-gas equipment.
Therefore, it is also necessary to comprehensively consider the planning optimization of energy systems including dispatch optimization and capacity optimization. Dispatch optimization can provide specific scheduling and operation strategies, and capacity optimization can provide better system structure and device capacity. In the studies of Chen et al. [14], Wang et al. [28], Zeng et al. [29], Li et al. [30], and Luo et al. [31], the energy system dispatch was optimized by considering the algorithm performance, the integrated demand response, the uncertainty of renewable energy output, the uncertainty of the source and load power, and the carbon emission. In the studies of Jin et al. [27], Wang et al. [32], Bhamidi et al. [33], and Yang et al. [34], the capacity was optimized by considering the economy, demand response, and thermal comfort. Therefore, in the actual integrated energy system, optimal dispatch and optimal capacity are complementary.
A review of the existing research shows that only a few studies have examined the planning optimization consisting of various capacity schemes and dispatch in existing integrated energy systems by incorporating P2G and GSHP for reducing curtailed wind power and system costs at the same time. From the point of view of wind power, P2G and GSHP can promote the consumption of wind power and reduce wind curtailment. From the point of view of energy conversion, P2G and GSHP can convert electric into different types of energy, which can reduce the operation cost and bring economic benefits to the system. Therefore, the main contributions of this study are as follows:
  • Establish a bi-layer optimal planning model of an integrated energy system that incorporates P2G and GSHP.
  • Analyze the optimal planning results of the system in five cases, and study the scheduling performance of the system in the best case.
  • Study the impact of optimization with different algorithms.
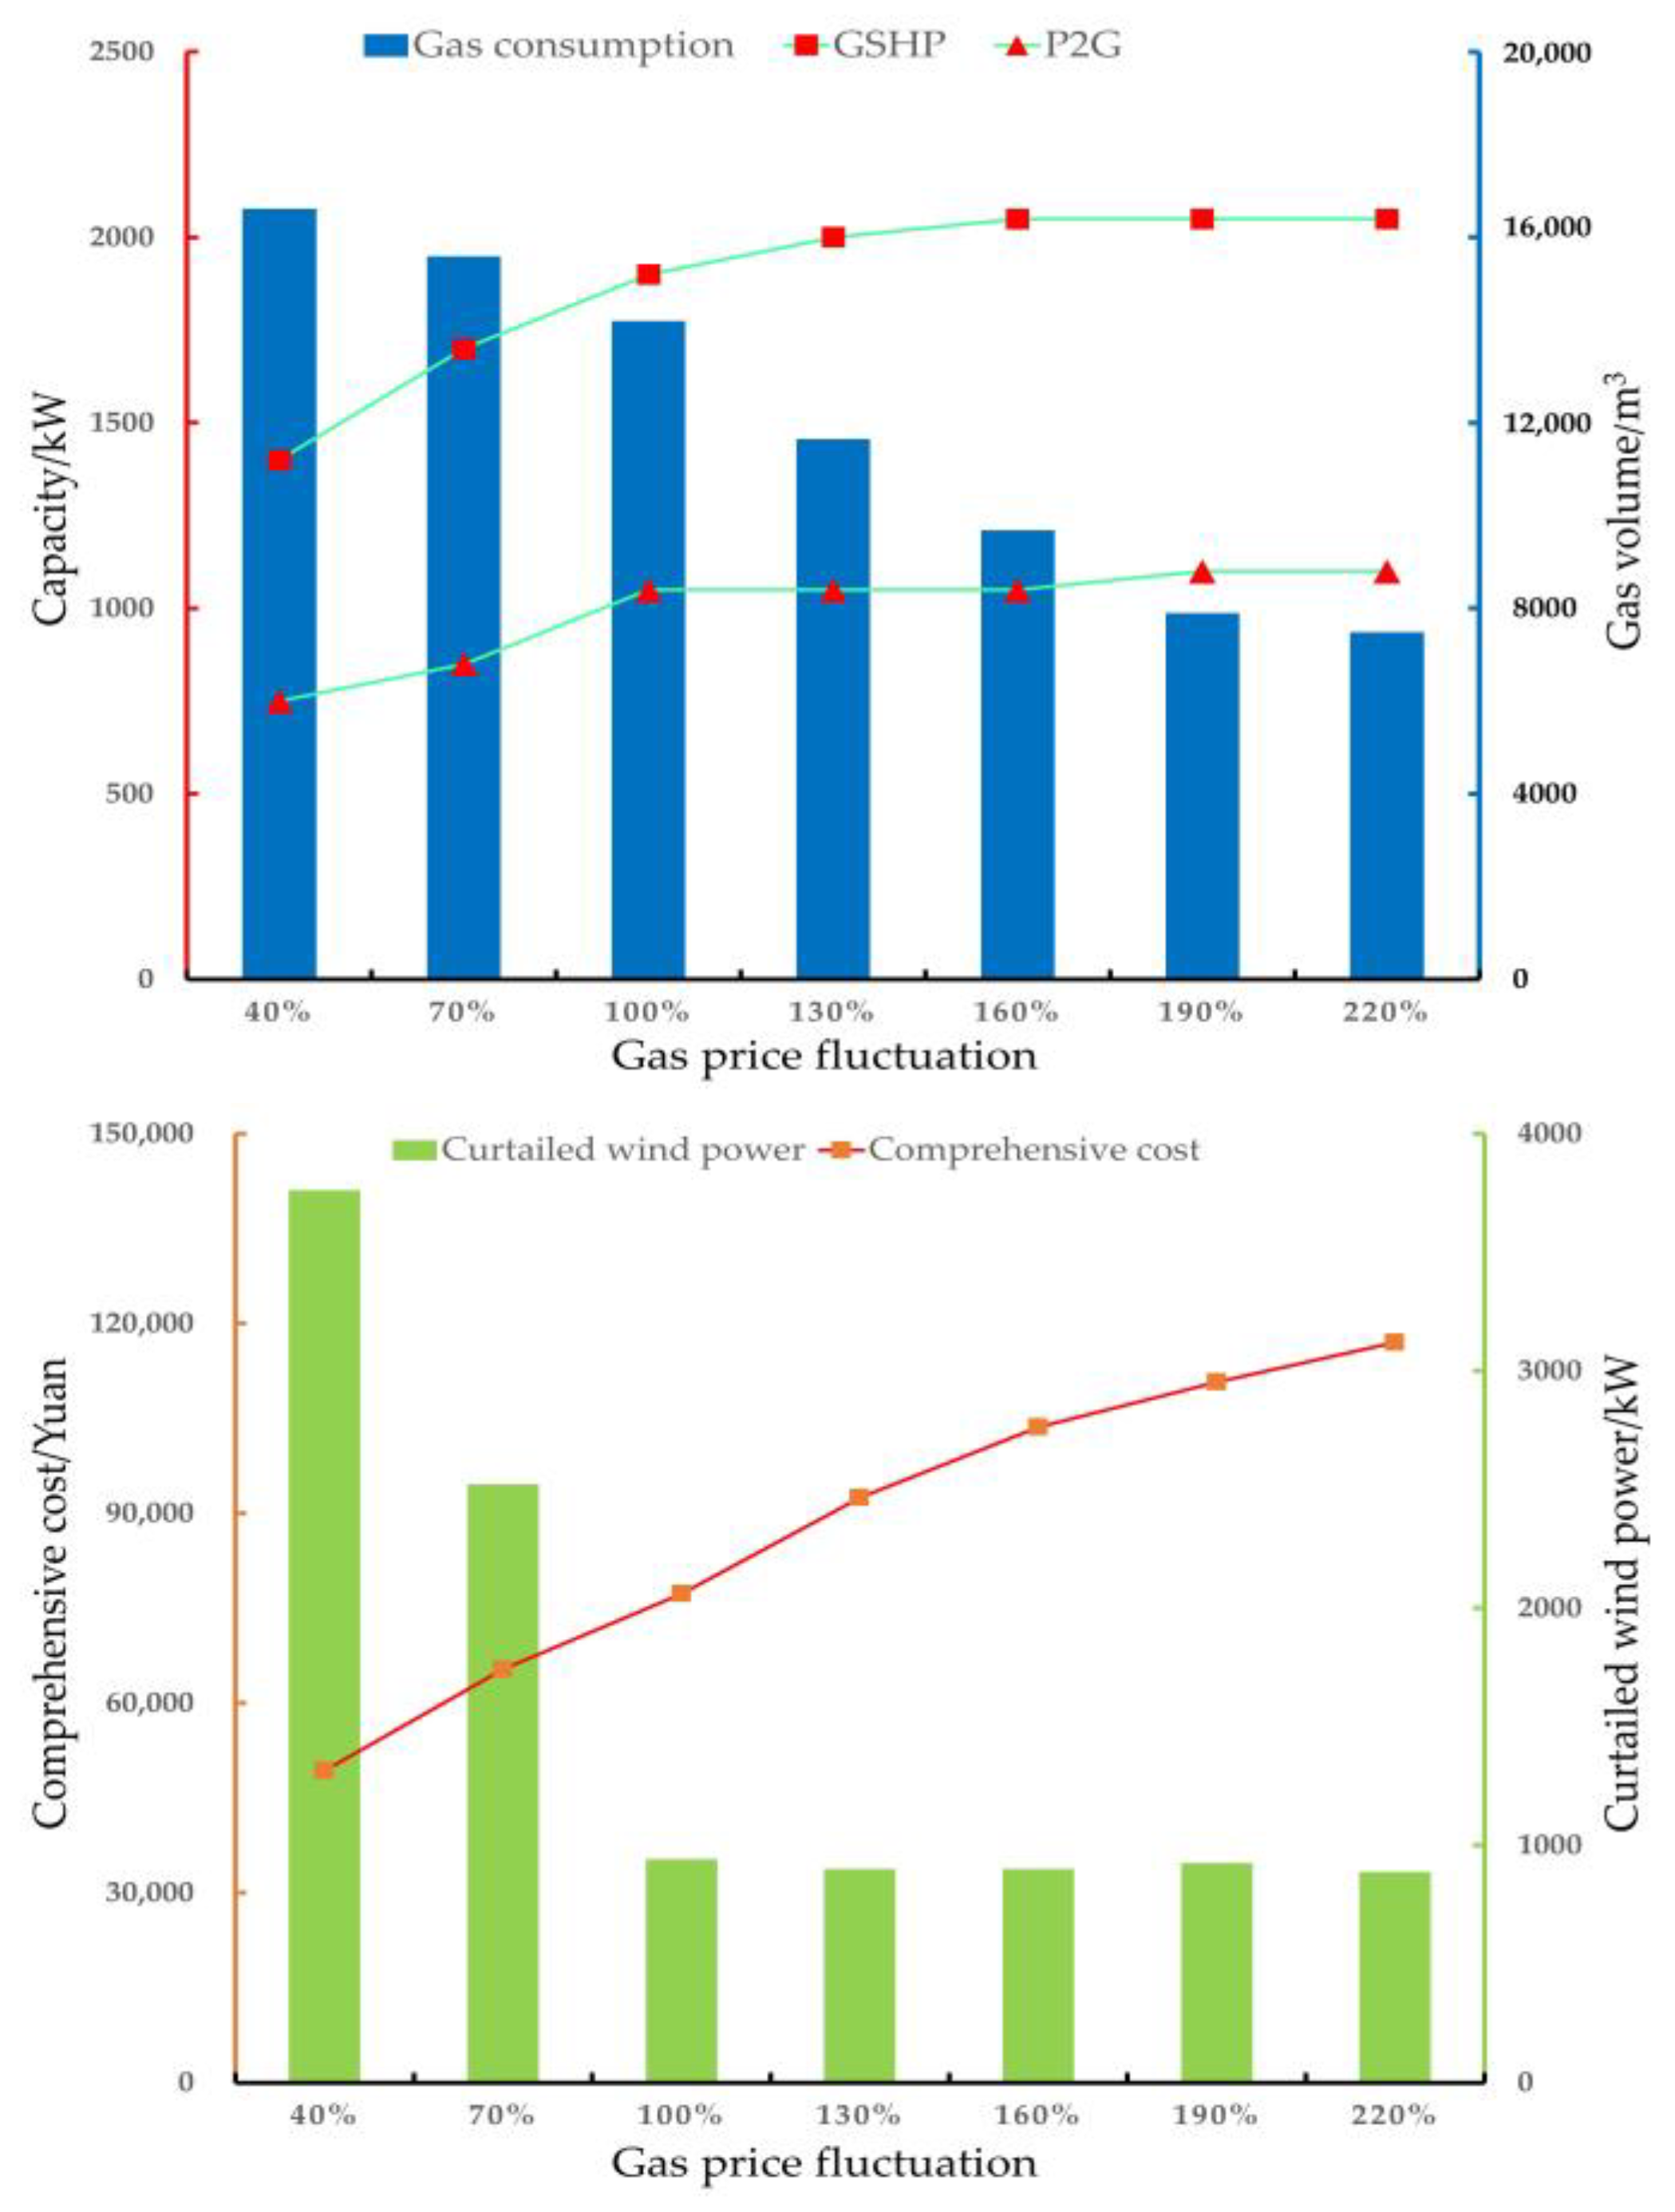
  • Analyze the impact of natural gas price fluctuations on the planning results.
The rest of this paper is organized as follows. In Section 2, the structure and model of the integrated energy system are presented. In Section 3, the objective functions of the inner layer and outer layer are set. In Section 4, the solution process of the bi-layer model is proposed. In Section 5, an example is given to analyze and study. Finally, the conclusions are given in Section 6.

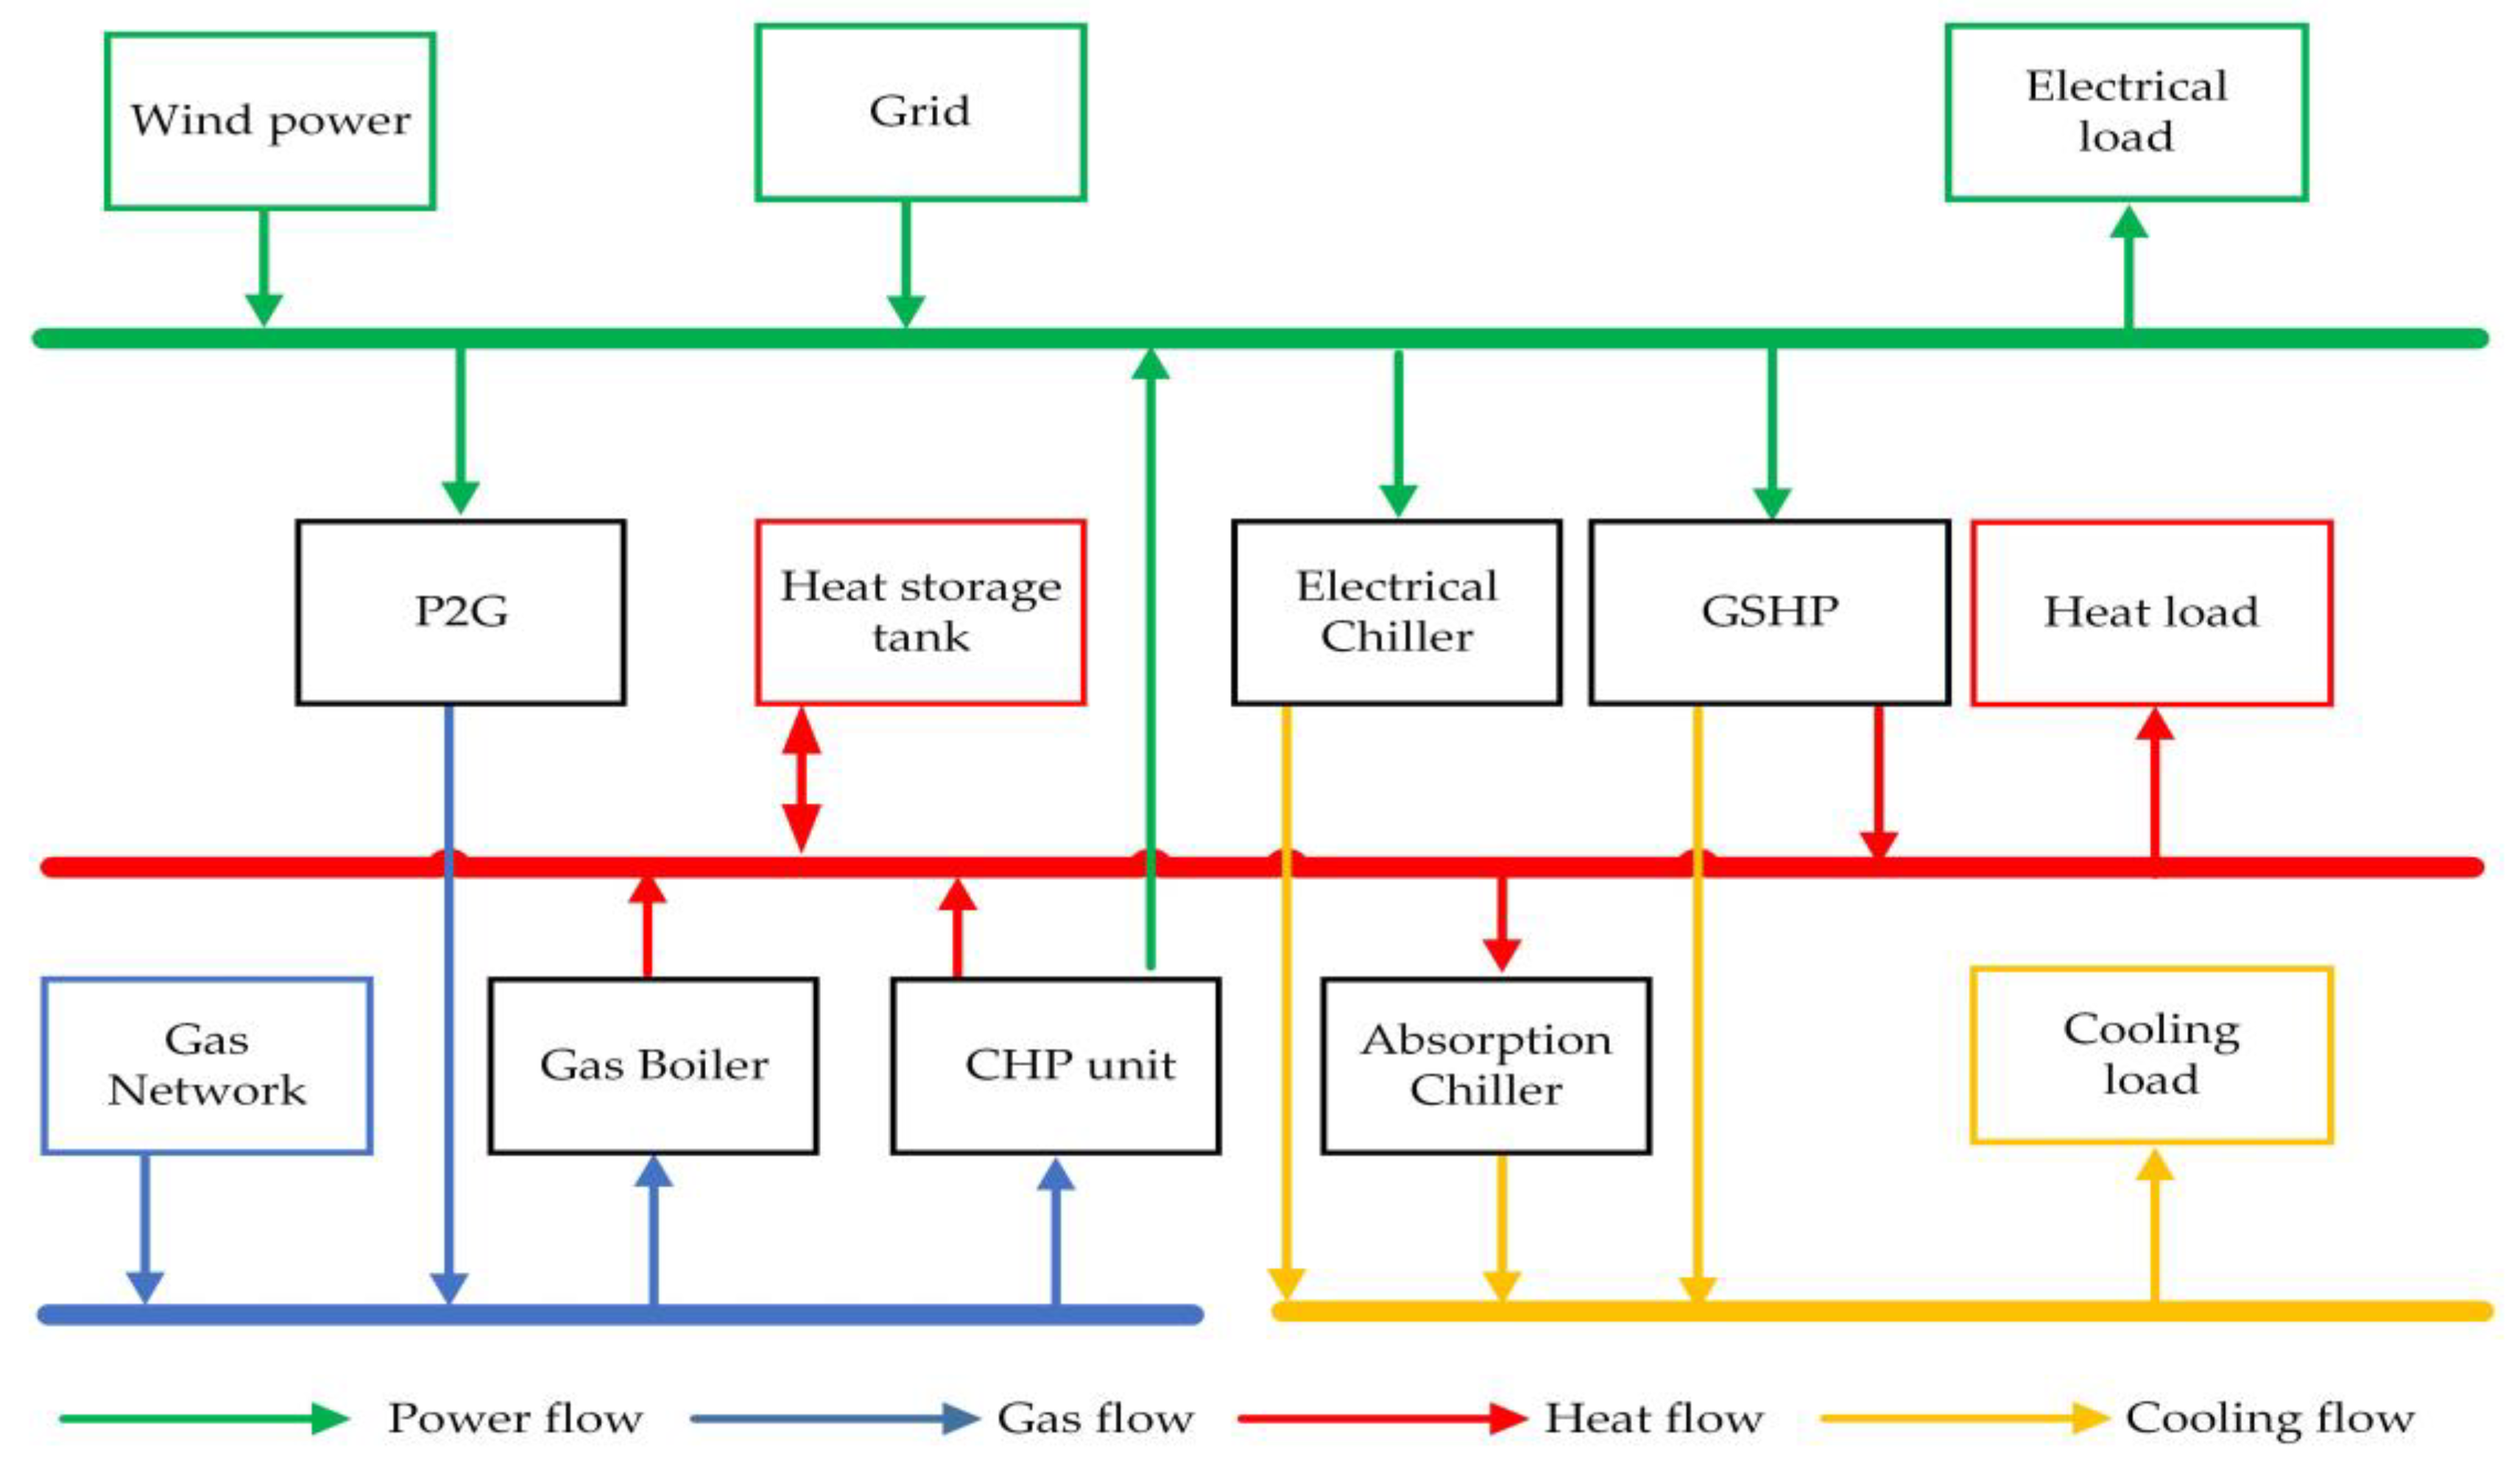
2. Structure and Model of Integrated Energy System

The existing integrated energy system in North China originally contained the following devices: the CHP unit, gas boiler, absorption chiller, electric chiller, and heat storage tank. This study plans to improve the existing system with P2G and GSHP embedded. After that, the improved system can supply electricity, heat, and cooling to the region more flexibly. The energy input into this system is mainly composed of renewable energy and traditional energy, including grid electricity, wind energy, and natural gas. In winter, the CHP unit participates in heating the system by cooperating with the GSHP, gas boiler, and heat storage tank. In summer, the GSHP supplies the system cooling load by cooperating with the absorption chiller and electric chiller. At this time, the GSHP is in its cooling mode, and heating is no longer carried out. In addition, P2G sends surplus natural gas out through the gas network during the period in which the system’s consumption is low. This model of the existing system is similar to the work in Chai et al. [35] and Lu et al. [36]. The structure of the improved system is shown in Figure 1.

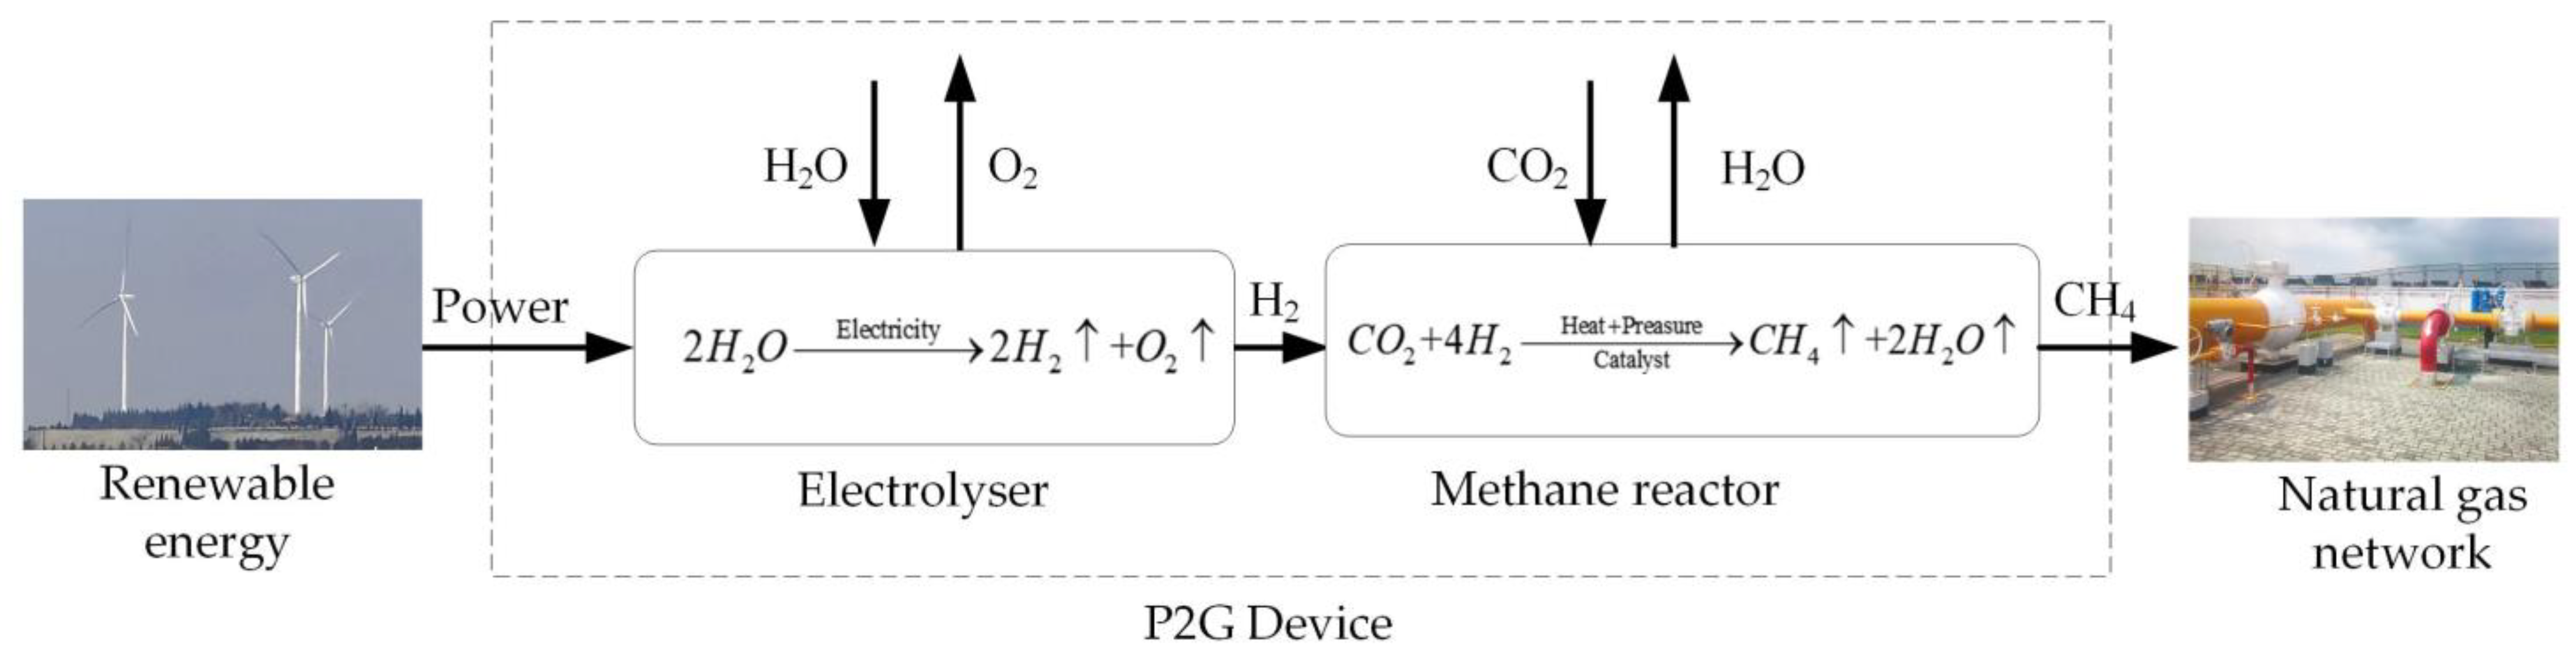
2.1. P2G Model—Electrolyser and Methane Reactor
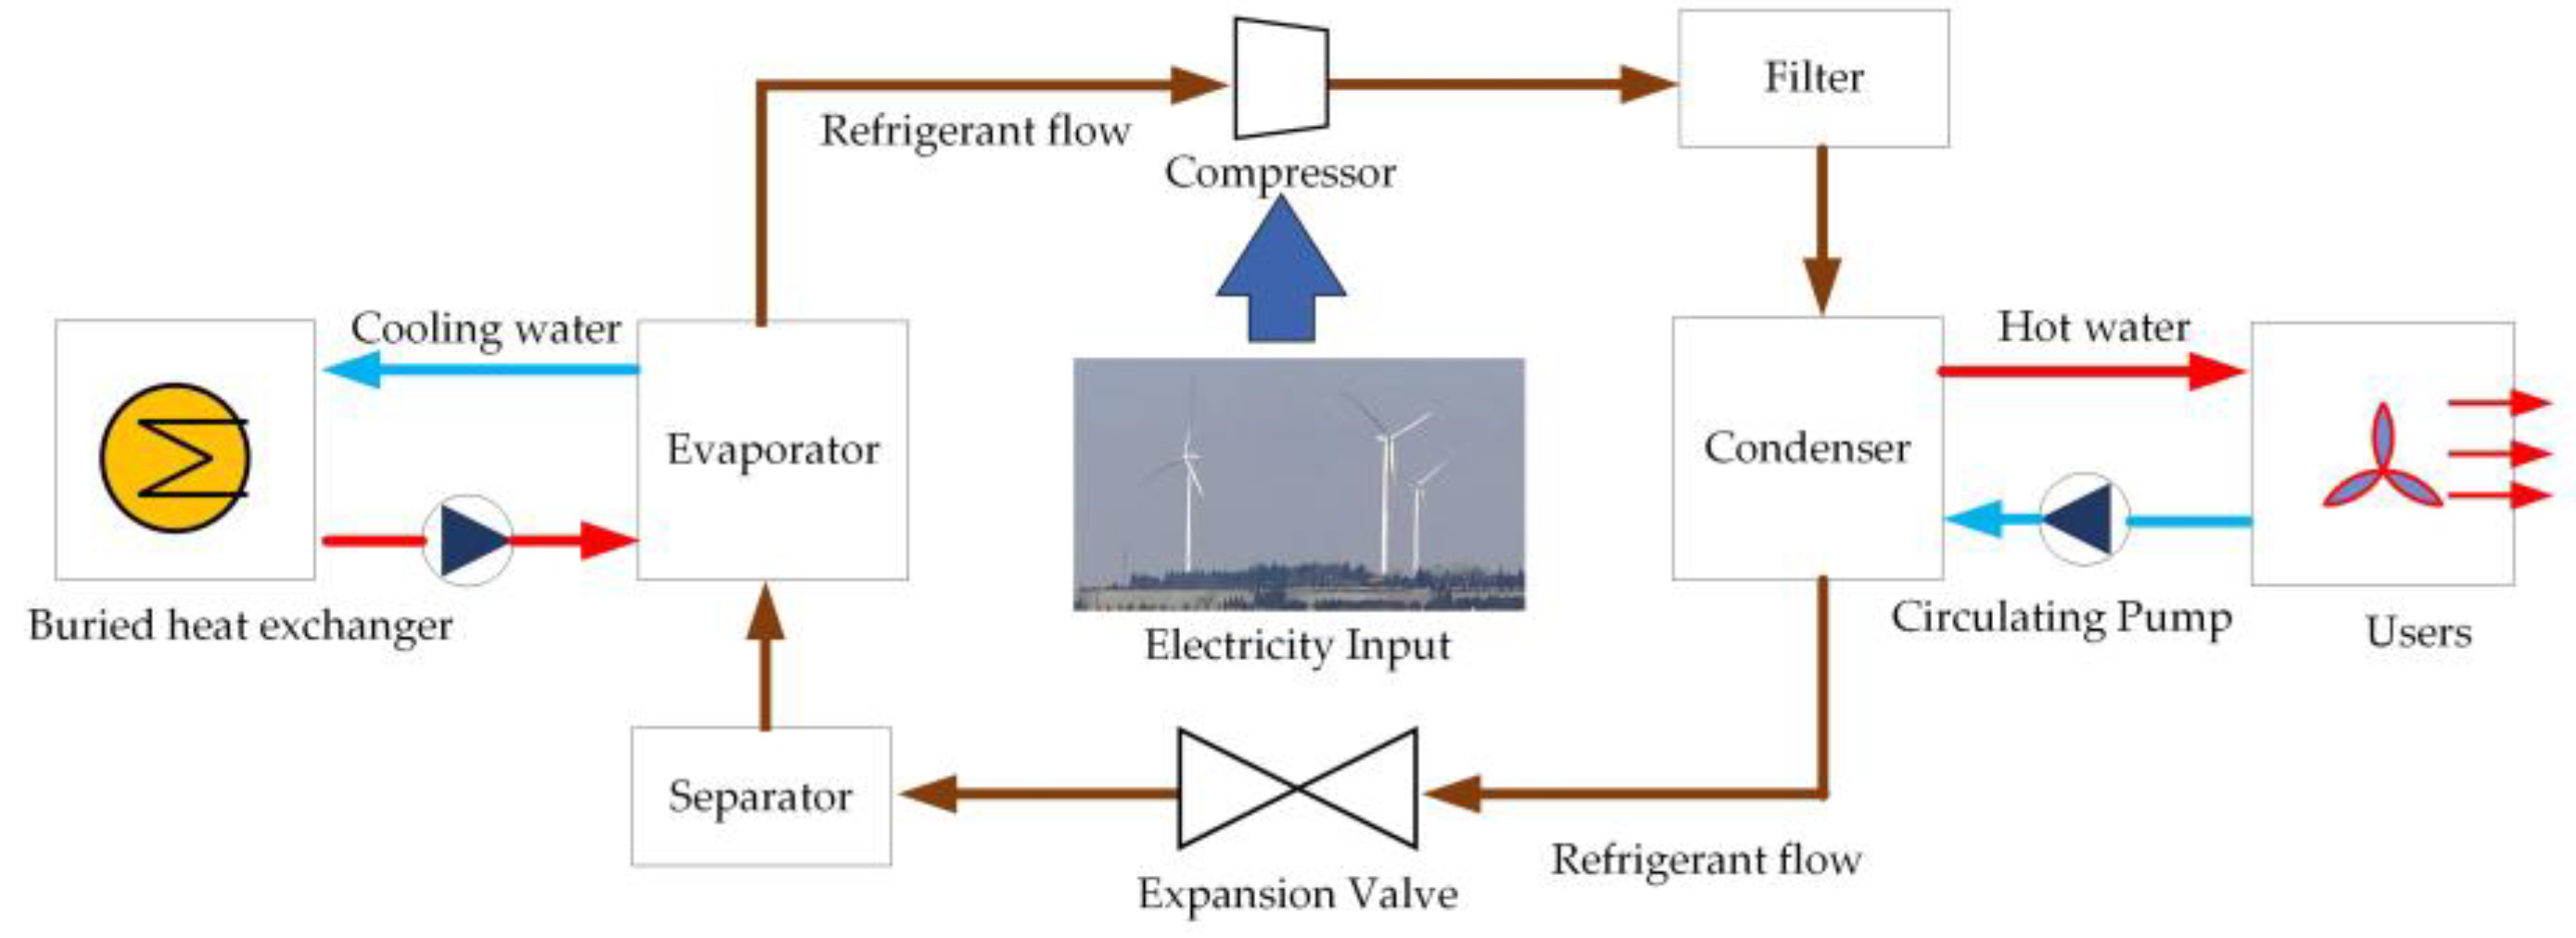
P2G is mainly composed of two parts: an electrolyser and a methane reactor. First, the electrolyser uses the remaining wind energy for electrolysis to obtain hydrogen. Then, the methane reactor generates methane from hydrogen and carbon dioxide via the Sabatier reaction under the action of the catalyst [37,38]. The newly generated methane is supplied to the CHP unit and GB through the natural gas network. The chemical process of P2G is shown in Figure 2.
The generation rates of hydrogen by the electrolyser and methane by the methane reactor in P2G are as follows:
M e b t = η eb M eb , rated
η eb = a 1 τ 2 + b 1 τ + c 1
τ = P eb , input t P eb , rated
where M e b t is the mole mass of hydrogen generated by the electrolyser; M eb , rated is the mole mass of hydrogen generated at the system’s rated efficiency; η eb is the working efficiency of the electrolyser; a 1 ,   b 1 ,   c 1 are the efficiency coefficients of the electrolyser; P eb , input t , P eb , rated are the input power and rated power of electrolyser, respectively; τ is the ratio of input power to rated power.
M mr , CH 4 t = η mol M e b t
P mr , CH 4 t = η mr M mr , CH 4 t
where M mr , CH 4 t is the mole mass of methane generated by the methane reactor; η mol is the conversion coefficient of mole mass between hydrogen and methane; η mr is the equivalent coefficient of the power; P mr , CH 4 t is the equivalent power of the generated methane.

2.2. GSHP Model

GSHP is a device that uses geothermal energy for heating or cooling through the consumption of electric energy. It is mainly composed of a compressor, condenser, expansion valve, evaporator, and buried heat exchanger [22]. The heating process of GSHP is shown in Figure 3.
GSHP has the advantages of a high efficiency ratio, environmental friendliness, wide applicability, and ease of integration with other devices [23,39].
H gshp t = η gshp , h P gshp t
P gshp , c t = η gshp , c P gshp t
where P gshp t is the input power of GSHP; H gshp t is the output thermal power of GSHP; P gshp , c t is the output cooling power of GSHP; η gshp , h , η gshp , c are the heating efficiency and cooling efficiency of GSHP, respectively.

2.3. CHP Model

The CHP unit is composed of a gas turbine and a waste heat boiler (for heat recovery), which consumes natural gas to generate electricity and heat. The CHP unit allows for heat recovery from the process of electricity production. It can improve the utilization of the primary energy and reduce heat losses during production [40].
P gt t = η gt P gt , CH 4 t
H gt t = ( 1 η gt η loss ) P gt , CH 4 t
H whb t = η rec η whb H gt t
where P gt , CH 4 t , P gt t are the gas consumption power and generated power of the gas turbine, respectively; H gt t ,   H whb t are the heating power of the gas turbine and waste heat boiler, respectively; η gt ,   η loss are the power generation efficiency and heat loss coefficient of the gas turbine, respectively; η rec ,   η whb are the heat recovery coefficient and thermal efficiency of the waste heat boiler, respectively.

2.4. Models of Other Devices

Models of other devices in the system: gas boiler (GB), heat storage tank (HT), absorption chiller (AC), and electric chiller (EC) are referred to in Formulas (12)–(15).
H gb t = η gb P gb , CH 4 t
where H gb t ,   P gb , CH 4 t are the heating power and gas consumption power of the gas boiler, respectively; η gb is the thermal efficiency of the gas boiler.
E hs t = ( 1 λ hs ) E hs t 1 + η hs , c E hsc t Δ t E hsd t Δ t η hs , d
where E hs t is the total thermal power of the heat storage tank; λ hs is the energy loss efficiency of the heat storage tank; E hsc t ,   E hsd t are the charging and discharging heat power of the heat storage tank, respectively; η hs , c ,   η hs , d are the charging and discharging efficiency of the heat storage tank, respectively.
P ac t = η ac H ac t
where P ac t ,   H ac t are the cooling power and heat consumption power of the absorption chiller, respectively; η ac is the cooling efficiency of the absorption chiller.
P ec , c t = η ec P ec t
where P ec , c t ,   P ec t are the cooling power and heat consumption power of the electric chiller, respectively; η ec is the cooling efficiency of the electric chiller.

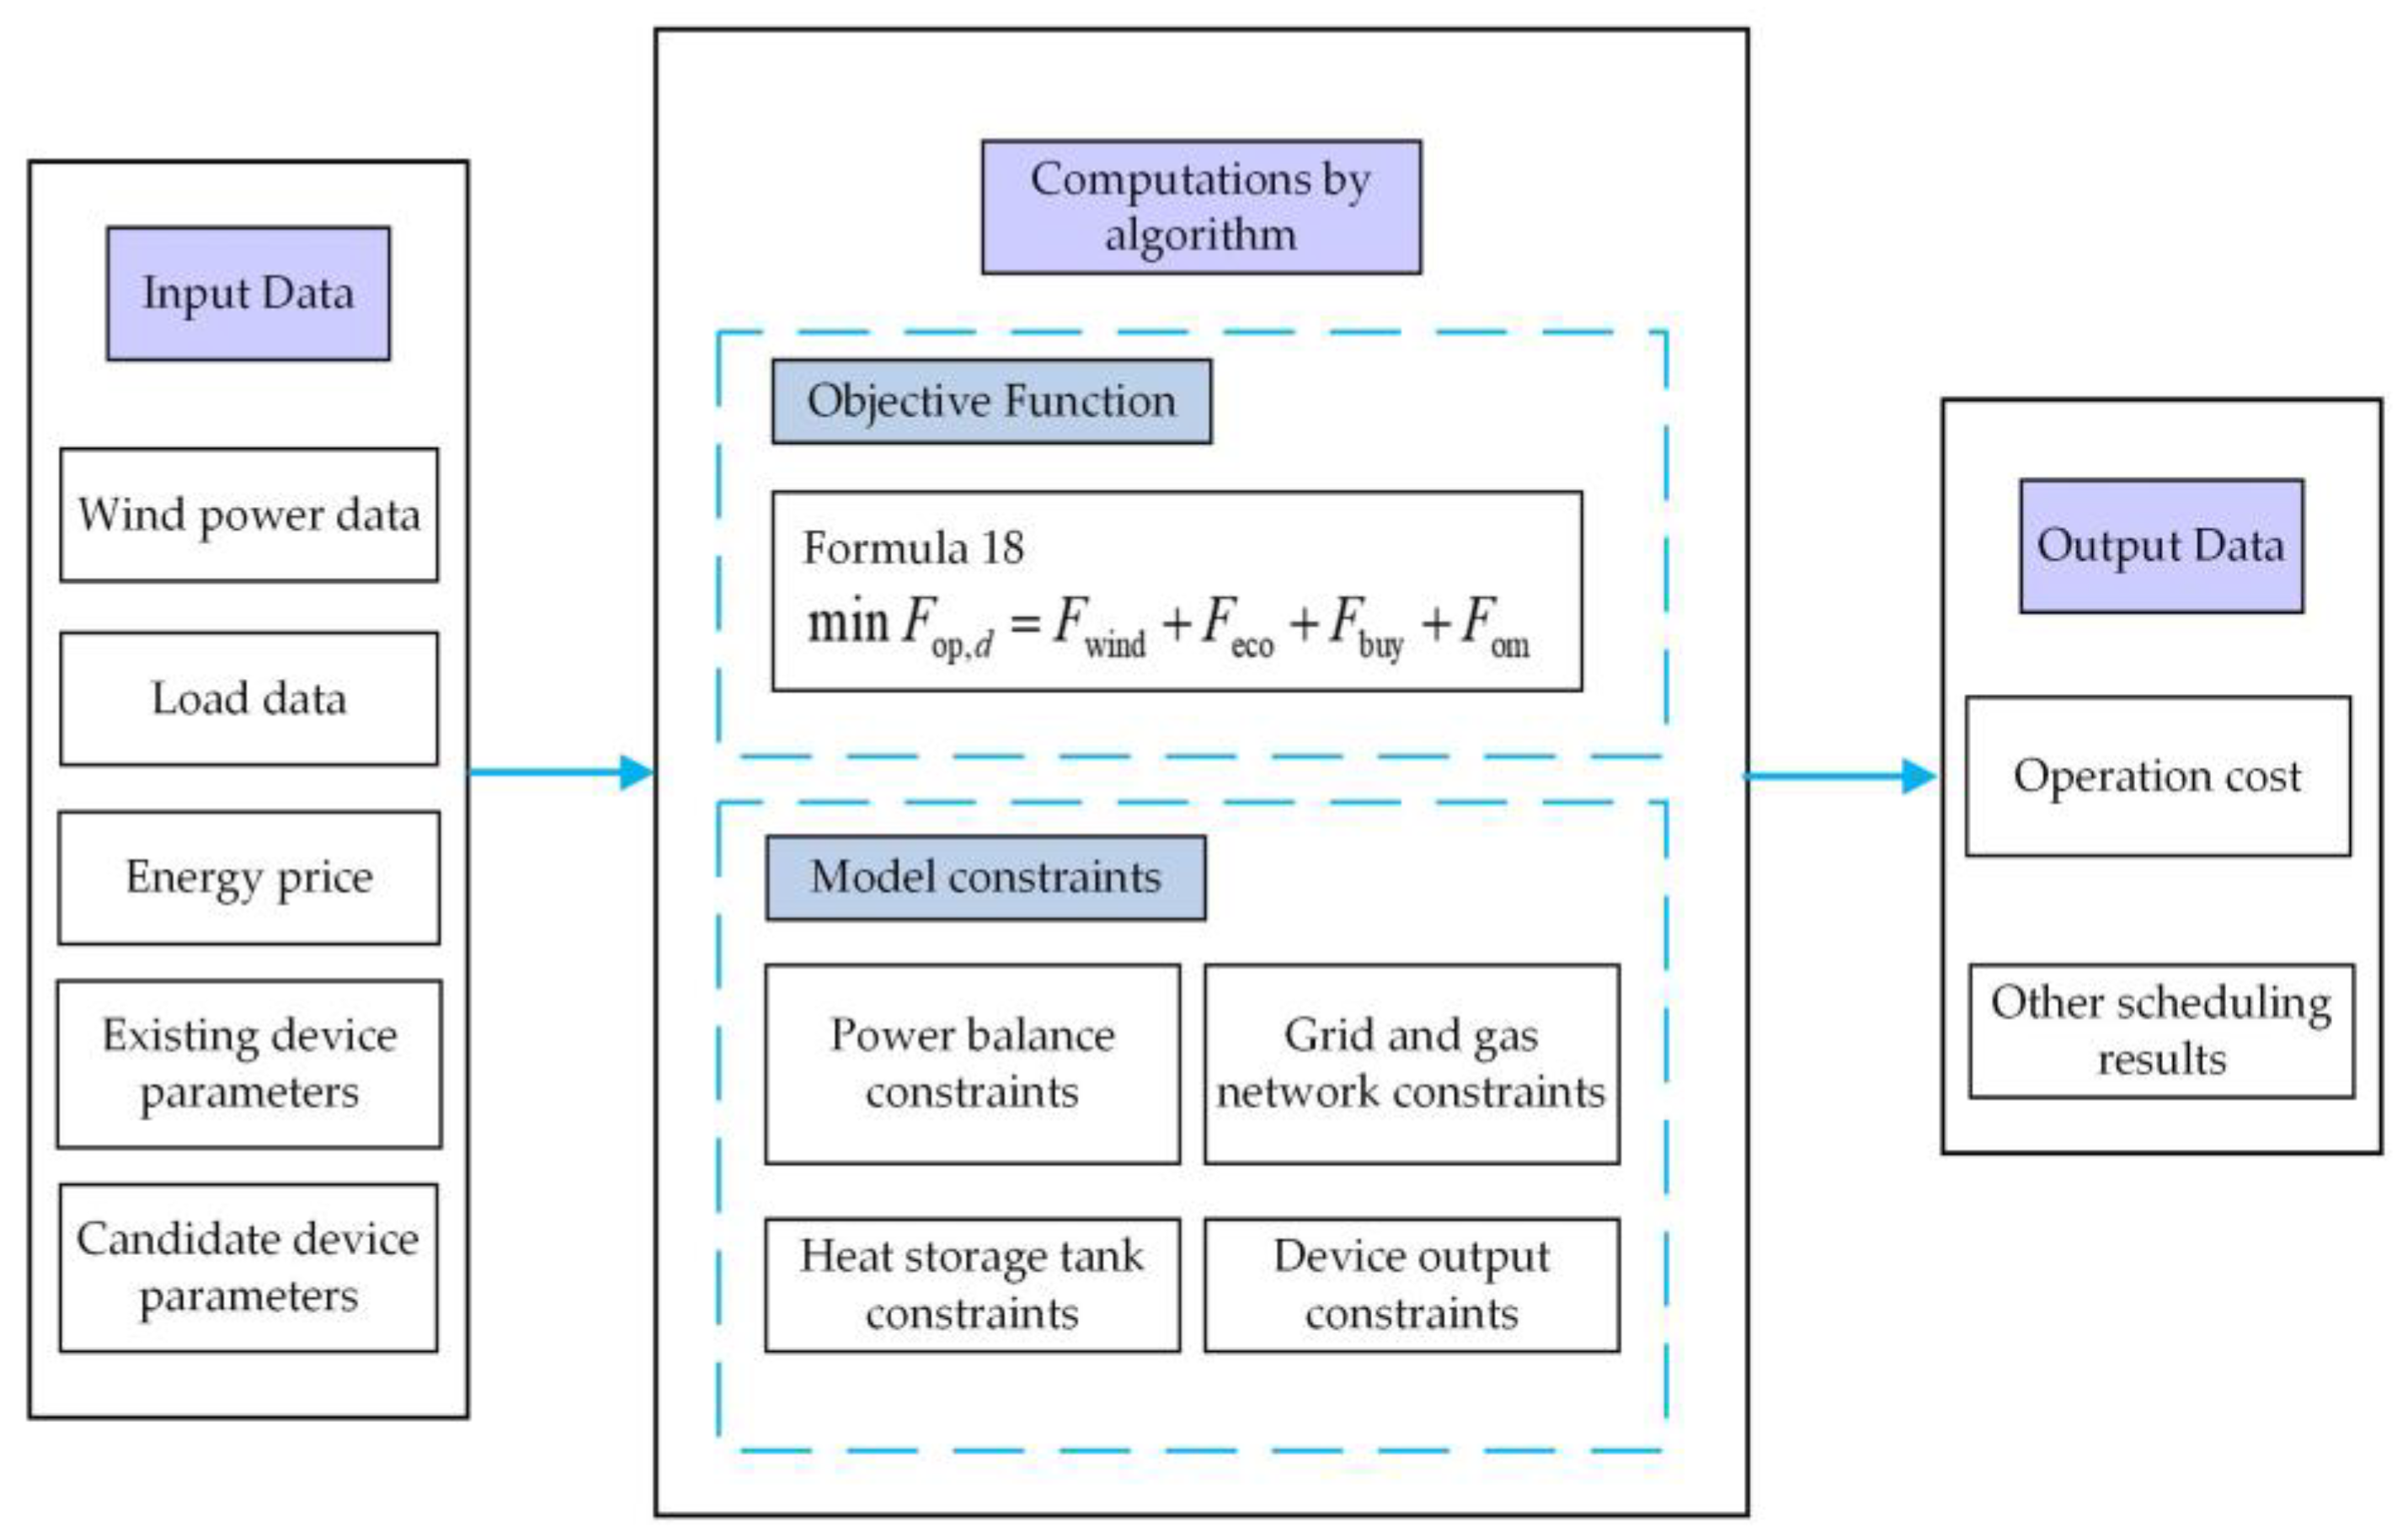
3. Overall Optimization Model

3.1. Objective Function of Outer-Layer Optimization Model

The outer-layer optimization model studied in this paper takes the daily comprehensive cost as the objective function, which is mainly divided into three parts: operation cost of the system, installation, and replacement costs of the devices. The latter two parts together form the cost of investment.
F total = d = 1 D λ d F op , d + i = 1 I F equ , i + i = 1 I F rep , i
where F equ , i ,   F rep , i are the installation and replacement costs of a planning device, respectively; λ d is the proportion of seasonal days in a year (a typical day represents a season); I is the total number of planning devices; D is the total types of typical days.
F equ , i = 1 365 C equ , i P equ , i s ( 1 + s ) N ( 1 + s ) N 1
where C equ , i is the total price of device installation including auxiliary materials; P equ , i is the installation capacity of a device; S is the discount rate; N is the service time of the planning project.
F equ , i = 1 365 C equ , i P equ , i r = 1 R 1 ( 1 + s ) r n i s ( 1 + s ) N ( 1 + s ) N 1
where R is the total amount of replacements under the service time of the planning project; n i is the service time of a device.

3.2. Objective Function of Inner-Layer Optimization Model

The objective function of the inner-layer model is the operation cost of IES. The operation cost includes the energy purchase cost, environmental cost, wind curtailment cost, and maintenance cost within a scheduling period (24 h). The operation cost of energy is as follows:
F op , d = F wind + F eco + F buy + F om
where F wind is the penalty cost of curtailed wind power; F eco is the environmental cost, which considers pollutant emissions; F buy is the energy purchase cost, which includes the electricity purchase cost and gas purchase cost; F om is the device maintenance cost.
F wind = t = 1 24 C w ( P wind t P com t )
F eco = t = 1 24 C pol ( P buy , e t λ e + P g t λ g )
F buy = t = 1 24 C b t P buy , e t + C g V g t C g V t t
F om = t = 1 24 m = 1 M C om , m P m t
where P wind t ,   P com t are wind power and actual accommodated wind power, respectively; C w is the penalty coefficient of curtailed wind power; P buy , e t , P g t are the electricity purchase power and natural gas power, respectively; λ e ,   λ g are the pollutant emission coefficients of purchased electricity and natural gas, respectively; C pol is the tax rate of pollutant emissions; C b t ,   C g are the electricity purchase price and gas purchase price, respectively; V g t ,   V t t are the volumes of gas purchased and exported from the gas network, respectively; M is the total number of devices under maintenance; C om , m is the total price of device maintenance, which considers fixed and variable maintenance prices; P m t is the output power of a device.

3.3. Constraints

3.3.1. System Power Balance Constraints

The system power balance constraints can mainly be divided into four parts: electric power balance, gas power balance, thermal power balance and cooling power balance. Each power balance equation means that the input energy equals the output energy. The above balance constraints are the foundation of stable operation in the system.
The electric power balance is as follows:
P buy , e t + P com t + P gt t = P load t + P eb , input t + P gshp t + P ec t
where P load t is the electrical load of the consumers.
The gas power balance is as follows:
P buy , g t + P ptg , CH 4 t = P gt , CH 4 t + P gb , CH 4 t
where P buy , g t is the gas purchasing power of the system; P ptg , CH 4 t is the gas power delivered to the system from the P2G.
The thermal power balance is as follows:
H gt t + H gb t + H gshp t + E hsd t = H load t + E hsc t
where H load t is the thermal load of the consumers.
The cooling power balance is as follows:
P ac t + P ec t + P gshp , c t = P eload t
where P eload t is the cooling load of the consumers.

3.3.2. Capacity Constraints of Planning Devices

Setting the upper and lower limits according to the needs of the planning project, which is convenient in choosing actual capacity types in the device market, the capacity constraints of planning devices are as follows:
P equ , i min P equ , i P equ , i max
where P equ , i max ,   P equ , i min are the upper and lower limits of equipment installation capacity, respectively.

3.3.3. Heat Storage and Power Constraints of Heat Storage Tank

Setting the heat storage and power constraints is important to ensure the safe operation of the heat storage tank. The heat storage and power constraints of the heat storage tank are as follows:
E hs min E hs t E hs max
0 E hsc t E hsc max
0 E hsd t E hsd max
where E hs max ,   E hs min are the upper and lower limits on the heat storage capacity of the heat storage tank, respectively; E hsc max ,   E hsd max are the upper limits of charging heat and discharging heat, respectively.

3.3.4. Power Grid and Gas Network Constraints

P buy , e min P buy , e t P buy , e max
P buy , g min P buy , g t P buy , g max
where P buy , e max ,   P buy , e min are the upper and lower limits of purchasing power from the power grid, respectively; P buy , g max ,   P buy , g min are the upper and lower limits of gas power purchased from the gas network, respectively.

3.3.5. Output Constraints of the Energy Conversion Devices

The output constraint of the gas boiler (GB) is as follows:
H gb min H gb t H gb max
where H gb max ,   H gb min are the upper and lower output heating power of the gas boiler, respectively. The constraints of other energy conversion devices, such as absorption chiller, electric chiller, P2G, and GSHP, are similar to GB, which can be observed in Formula (33).

4. Solution of the Bi-Layer Optimization Model

The bi-layer planning model is divided into an outer layer and inner layer. The objective function of the outer layer is the minimum daily comprehensive cost of the system by simulating various capacity schemes. The objective function of the inner layer is the minimum daily operation cost of the system by simulating the daily scheduling.

4.1. Outer-Layer Solution: The Enumeration Method, Loops, Feedback

The enumeration method is used to obtain the various capacity schemes in the outer layer. First, consider and set the types of planning devices. Second, set the range of capacity values for each device according to the actual needs of the project. Then, set the device capacity by uniformly and discretely enumerating in the device capacity value space. (For instance, Case 1 intends to plan device A and B by enumerating every 100 kW. Scheme 1: device A 100 kW device B 100 kW. Scheme 2: device A 200 kW device B 100 kW. Scheme 3: device A 300 kW device B 100 kW, and so on). The above process determines E types of capacity schemes. Any capacity scheme obtained by the outer layer serves as the constraint range of device scheduling in the inner layer. Candidate device parameters in different schemes are also the input parameters (optimal device parameters in a certain scheme), which can affect both objective functions in Formulas (18) (inner layer—operation cost) and (15) (outer layer—comprehensive cost). The daily operation cost determined by the inner model is substituted into the outer model to calculate the daily comprehensive cost. In this way, the optimal plan is finally found through the loops and feedback of bi-layer optimization. A flow diagram of the bi-layer model is shown in Figure 4.

4.2. Inner-Layer Solution: The EDIW-CPSO Algorithm

The inner layer is the simulation of system scheduling on typical days (the total types of typical days are S), which is solved by the algorithm. The standard PSO algorithm can easily fall into the local optimum value in solving the inner-layer optimal model. So, it cannot undergo an effective scheduling plan, affecting the results of the outer-layer optimization model. Therefore, in order to achieve better results in the iterative process, this study applies the EDIW-CPSO algorithm, which combines the exponentially decreasing inertia weight strategy and the chaotic strategy for problem solving. And the convergence rate of scheduling optimization is 275 iterations (3.13 s) in winter daytime conditions, 286 iterations (3.47 s) in summer conditions, 279 iterations (3.26 s) in transitional season conditions to optimal values under the parameters in case 5. The following table (Table 1) shows the optimizations of the algorithm with different initial conditions in case 5. As the table shows, the scheduling algorithm can affect the operation cost (inner layer) on each typical day. Further, it can affect the comprehensive cost (outer layer). The comprehensive cost represents the economy in total, which can also represent the economy of candidate schemes (including planning device capacity). Thus, the scheduling algorithm can affect the planning decisions of candidate schemes. The above description demonstrates the invisible connection between the inner layer and outer layer in bi-layer optimization.
The exponentially decreasing inertia weight strategy (EDIW) is a classic strategy based on the deficiency of a single weight. In addition, compared with the linearly decreasing weight strategy, its weight is more in line with the search law involved in the process of nonlinear decreasing changes [41,42]. The exponentially decreasing inertia weight strategy is as follows:
ω = ω 2 ( ω 1 ω 2 ) 1 1 + ε * t T max
where the values of ω 1 ,   ω 2 are set to 0.9 and 0.4, respectively; the value of ε is set to 10; T max is the total iterative time of the algorithm.
The chaotic strategy is realized by logistic mapping to enrich the diversity of particles. Logistic mapping is a simple and efficient chaotic strategy, which is applied to solve the scheduling problems in industrial fields [43] and energy systems [44]. Formula (35) is the mathematic expression of logistic mapping:
x n + 1 = μ x n ( 1 x n )
where the value of the parameter μ is set to 4 in this paper.
The optimal scheduling framework of the inner-layer model is shown in Figure 5. As the figure shows, the input data include wind power data, load data, energy price, existing device parameters, and candidate device parameters. And the model constraints include power balance constraints, grid and gas network constraints, heat storage tank constraints, and device output constraints. The input data and model constraints form the initial conditions. The objective function is solved using an algorithm. Finally, we obtain the scheduling results.

5. Case Study

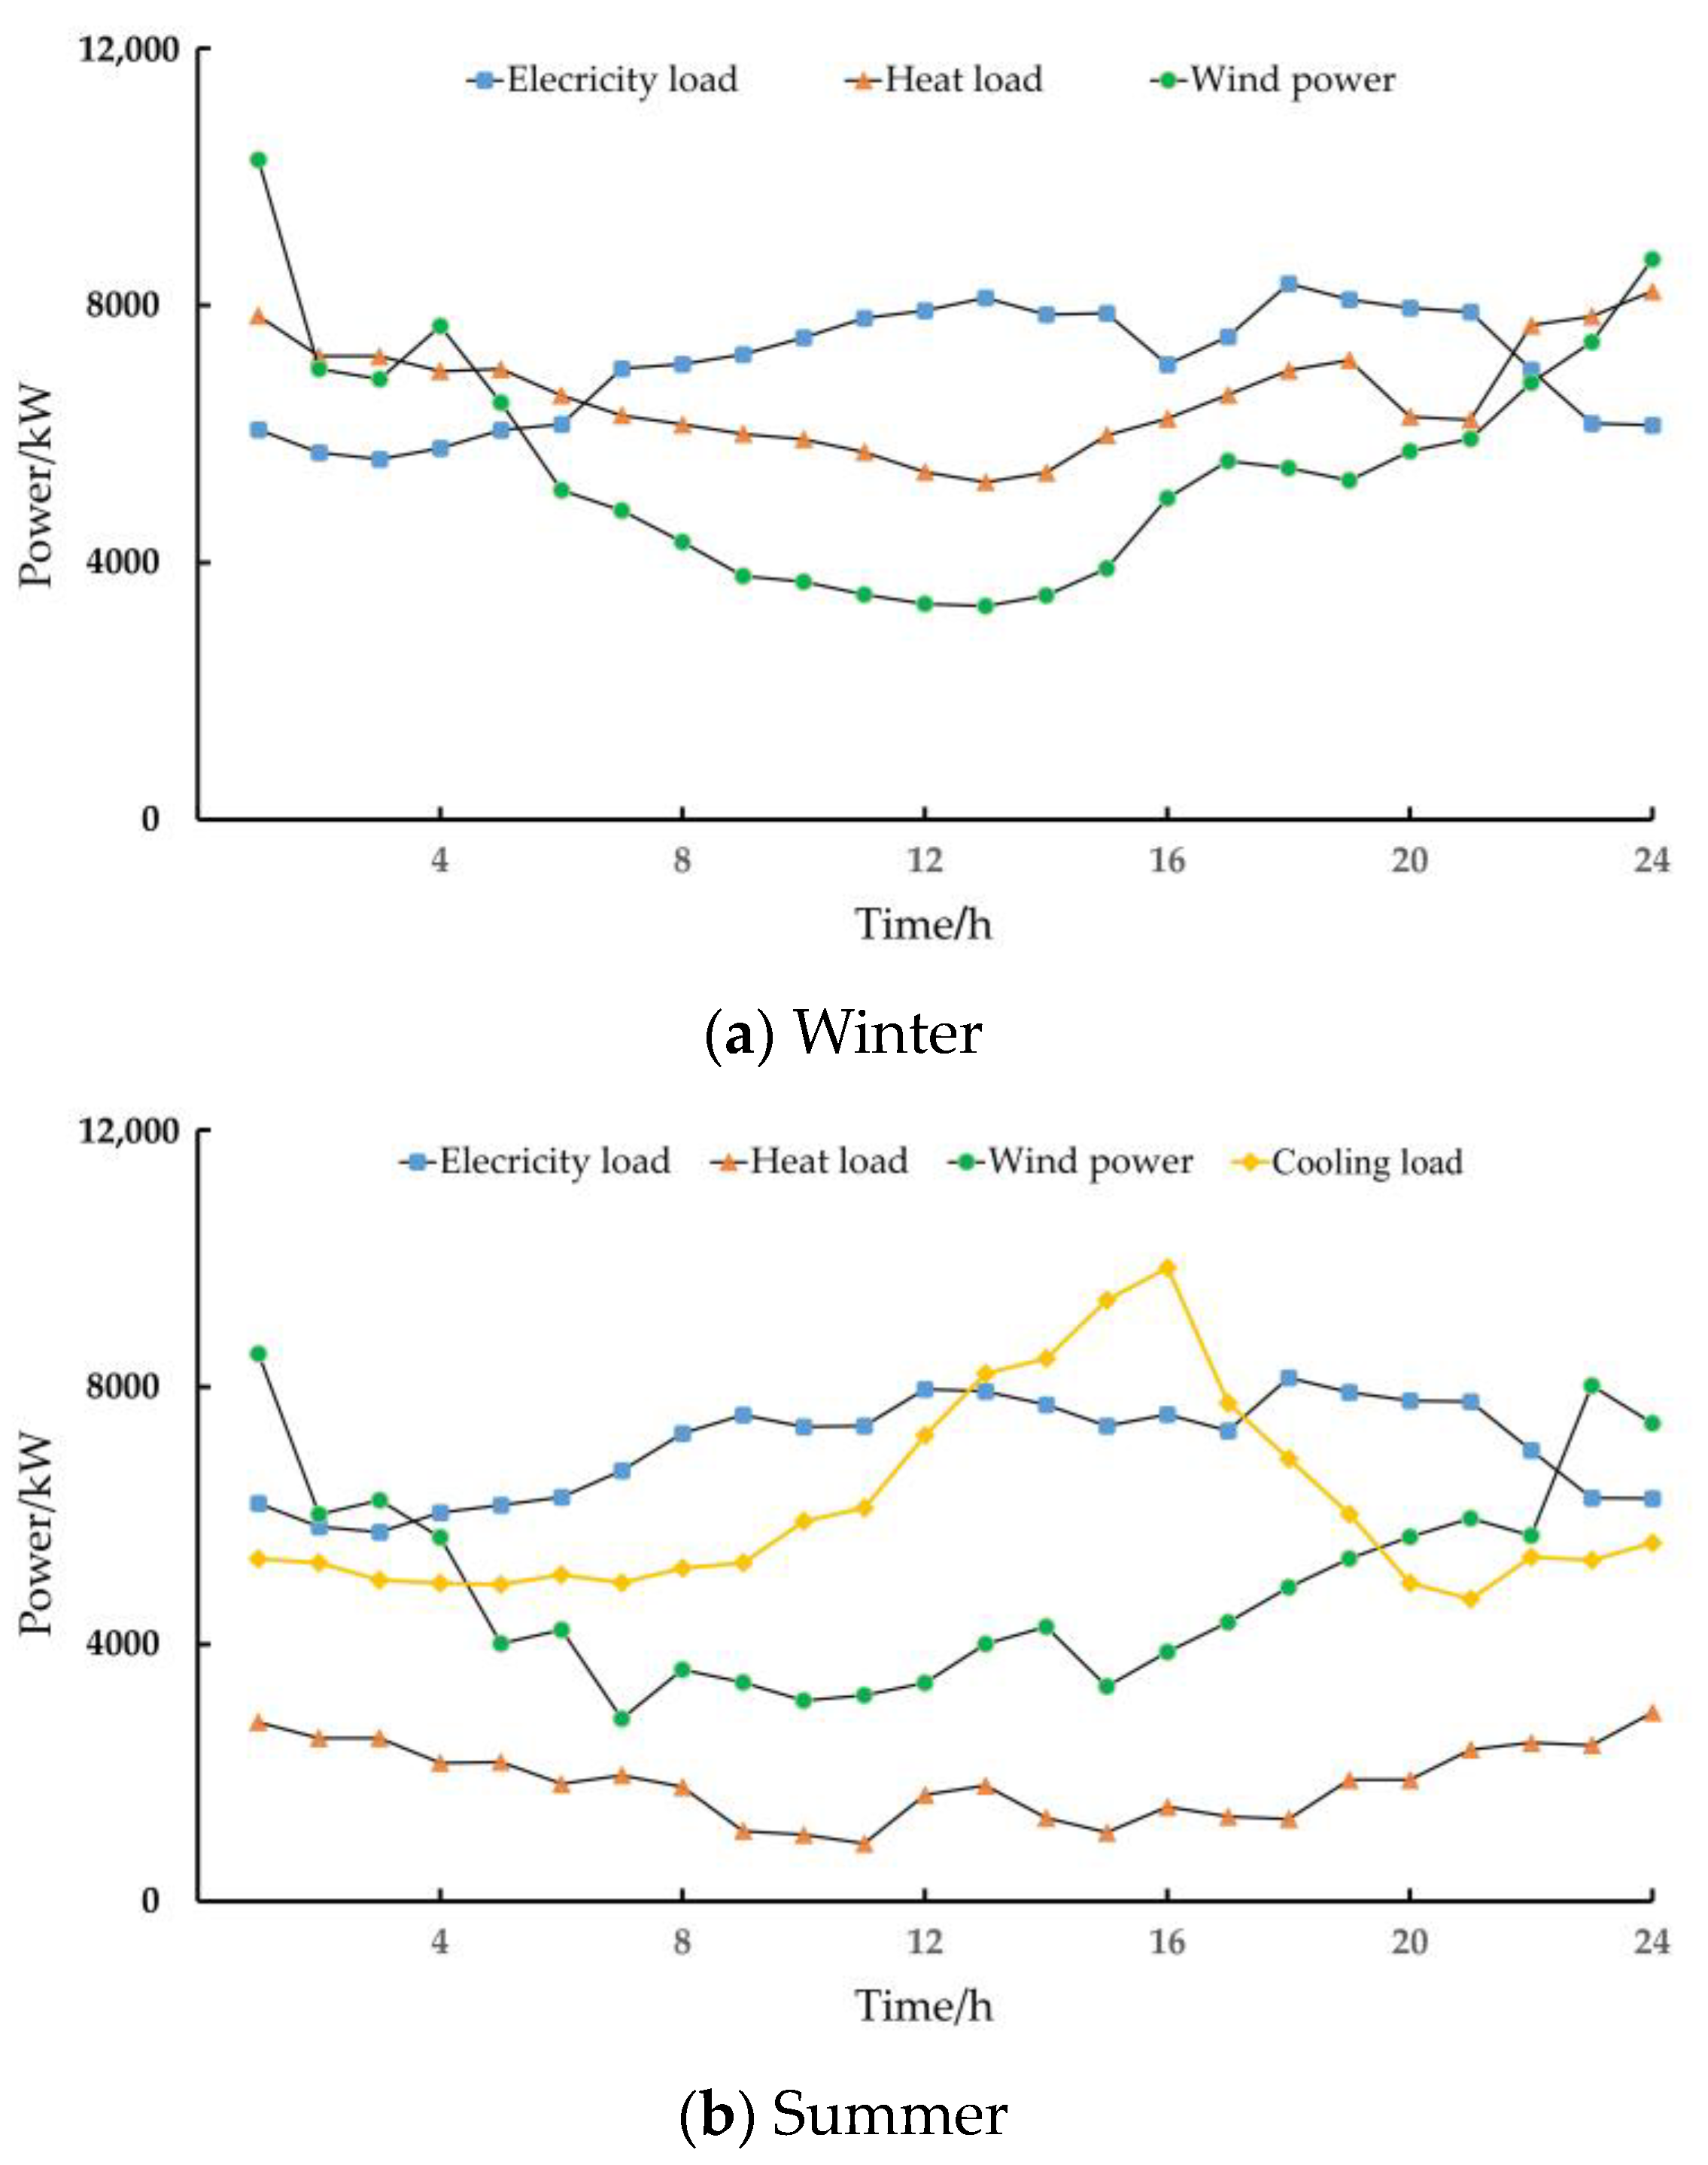
5.1. Case Information

In this section, an existing integrated energy system in North China is taken as the example, which is used for optimal planning through the bi-layer model mentioned above. The time-of-use price of electricity purchased from the power grid is shown in Table 2. The parameters of existing devices in the system are shown in Table 3. The service life of the planning project is 40 years. The candidate planning device parameters of P2G and GSHP are shown in Table 4. The scheduling period of the inner model is 24 h. The natural gas price is 3.5 CNY/m3. Considering the selection of device types in the market, the device capacity is enumerated every 50 kW in the process of solution.
After considering the seasonal differences in regional energy supply, the daily operation of the system can be divided into three typical daily scenarios: typical day of summer, typical day of winter, and typical day of transitional season (S = 3). The number of running days in the transitional season includes spring and autumn days. The curves of cooling, heating, power load, and wind power output on typical days are shown in Figure 6.
In order to study the effectiveness of the planning projects in this study, the planning projects are divided into four cases (cases 2–5). The system in case 1 is the original integrated energy system, which is set up for comparative analysis.
Case 1: the original integrated energy system without any planning devices.
Case 2: the original integrated energy system with planning P2G.
Case 3: the original integrated energy system with planning GSHP, not considering its cooling benefit.
Case 4: the original integrated energy system with planning GSHP, considering its cooling benefit.
Case 5: the original integrated energy system with planning P2G and GSHP.

5.2. Planning Results

The results of planning optimization in five cases are shown in Table 5 and Table 6. And a comparison of results in five cases is shown in Figure 7. As can be seen from the two tables and the figure, the original system in case 1 has the worst economic performance, especially as its wind curtailment cost is several times higher than in other cases. Although the system in case 1 saved the installation and replacement costs required to plan no devices, it is far less than the economic return brought by consuming wind power and reducing system costs. In contrast, the other four cases invested in installation and replacement costs, which can effectively reduce operation costs, including gas purchase and wind curtailment costs, thereby reducing the comprehensive cost. For example, in case 2, P2G not only promotes the accommodation of wind energy but also provides energy for the CHP unit and gas boiler, thus improving the cost effectiveness of the system.
Similarly, in cases 3 and 4, the comprehensive cost of configuring GSHP gained greater benefits. Of the two, case 4 is set to consider the cooling benefit of GSHP, and its optimal capacity is 2350 kW after the solution, which increases the capacity by 150 kW compared with case 3. This is because the cooling effect of GSHP brings greater operation benefits in summer, although increased capacity leads to increased costs. The optimization results of cases 3 and 4 show the necessity of considering the cooling benefit of GSHP.
Compared with case 2, where P2G is planned separately, and case 4, where GSHP is planned separately, the wind curtailment rate of case 5 with planning P2G and GSHP decreased by 3.3% and 2.7%, respectively, which shows that it has a better optimization effect on curtailed wind power. Although the installation and replacement costs are slightly higher than those of the other two cases, the gas purchase cost of case 5 is the lowest. And the comprehensive cost of Case 5 decreased by CNY 21,759 and CNY 2258 compared with cases 2 and 4, indicating that case 5 is the most cost-effective.
Compared with the original system in case 1, case 5 has the most obvious advantages: the wind curtailment rate of the system decreased by 18.8%, the gas purchase cost decreased by CNY 23,655, 32.3%, the operation cost decreased by CNY 36,575, 33.8%, and the comprehensive cost decreased by CNY 30,819, 28.5%. As a result, the installation and replacement costs of case 5 are the highest, but these can greatly improve its operation cost including gas purchase cost and curtailed wind power cost, thus reducing the comprehensive cost and greatly improving the cost effectiveness of the system.

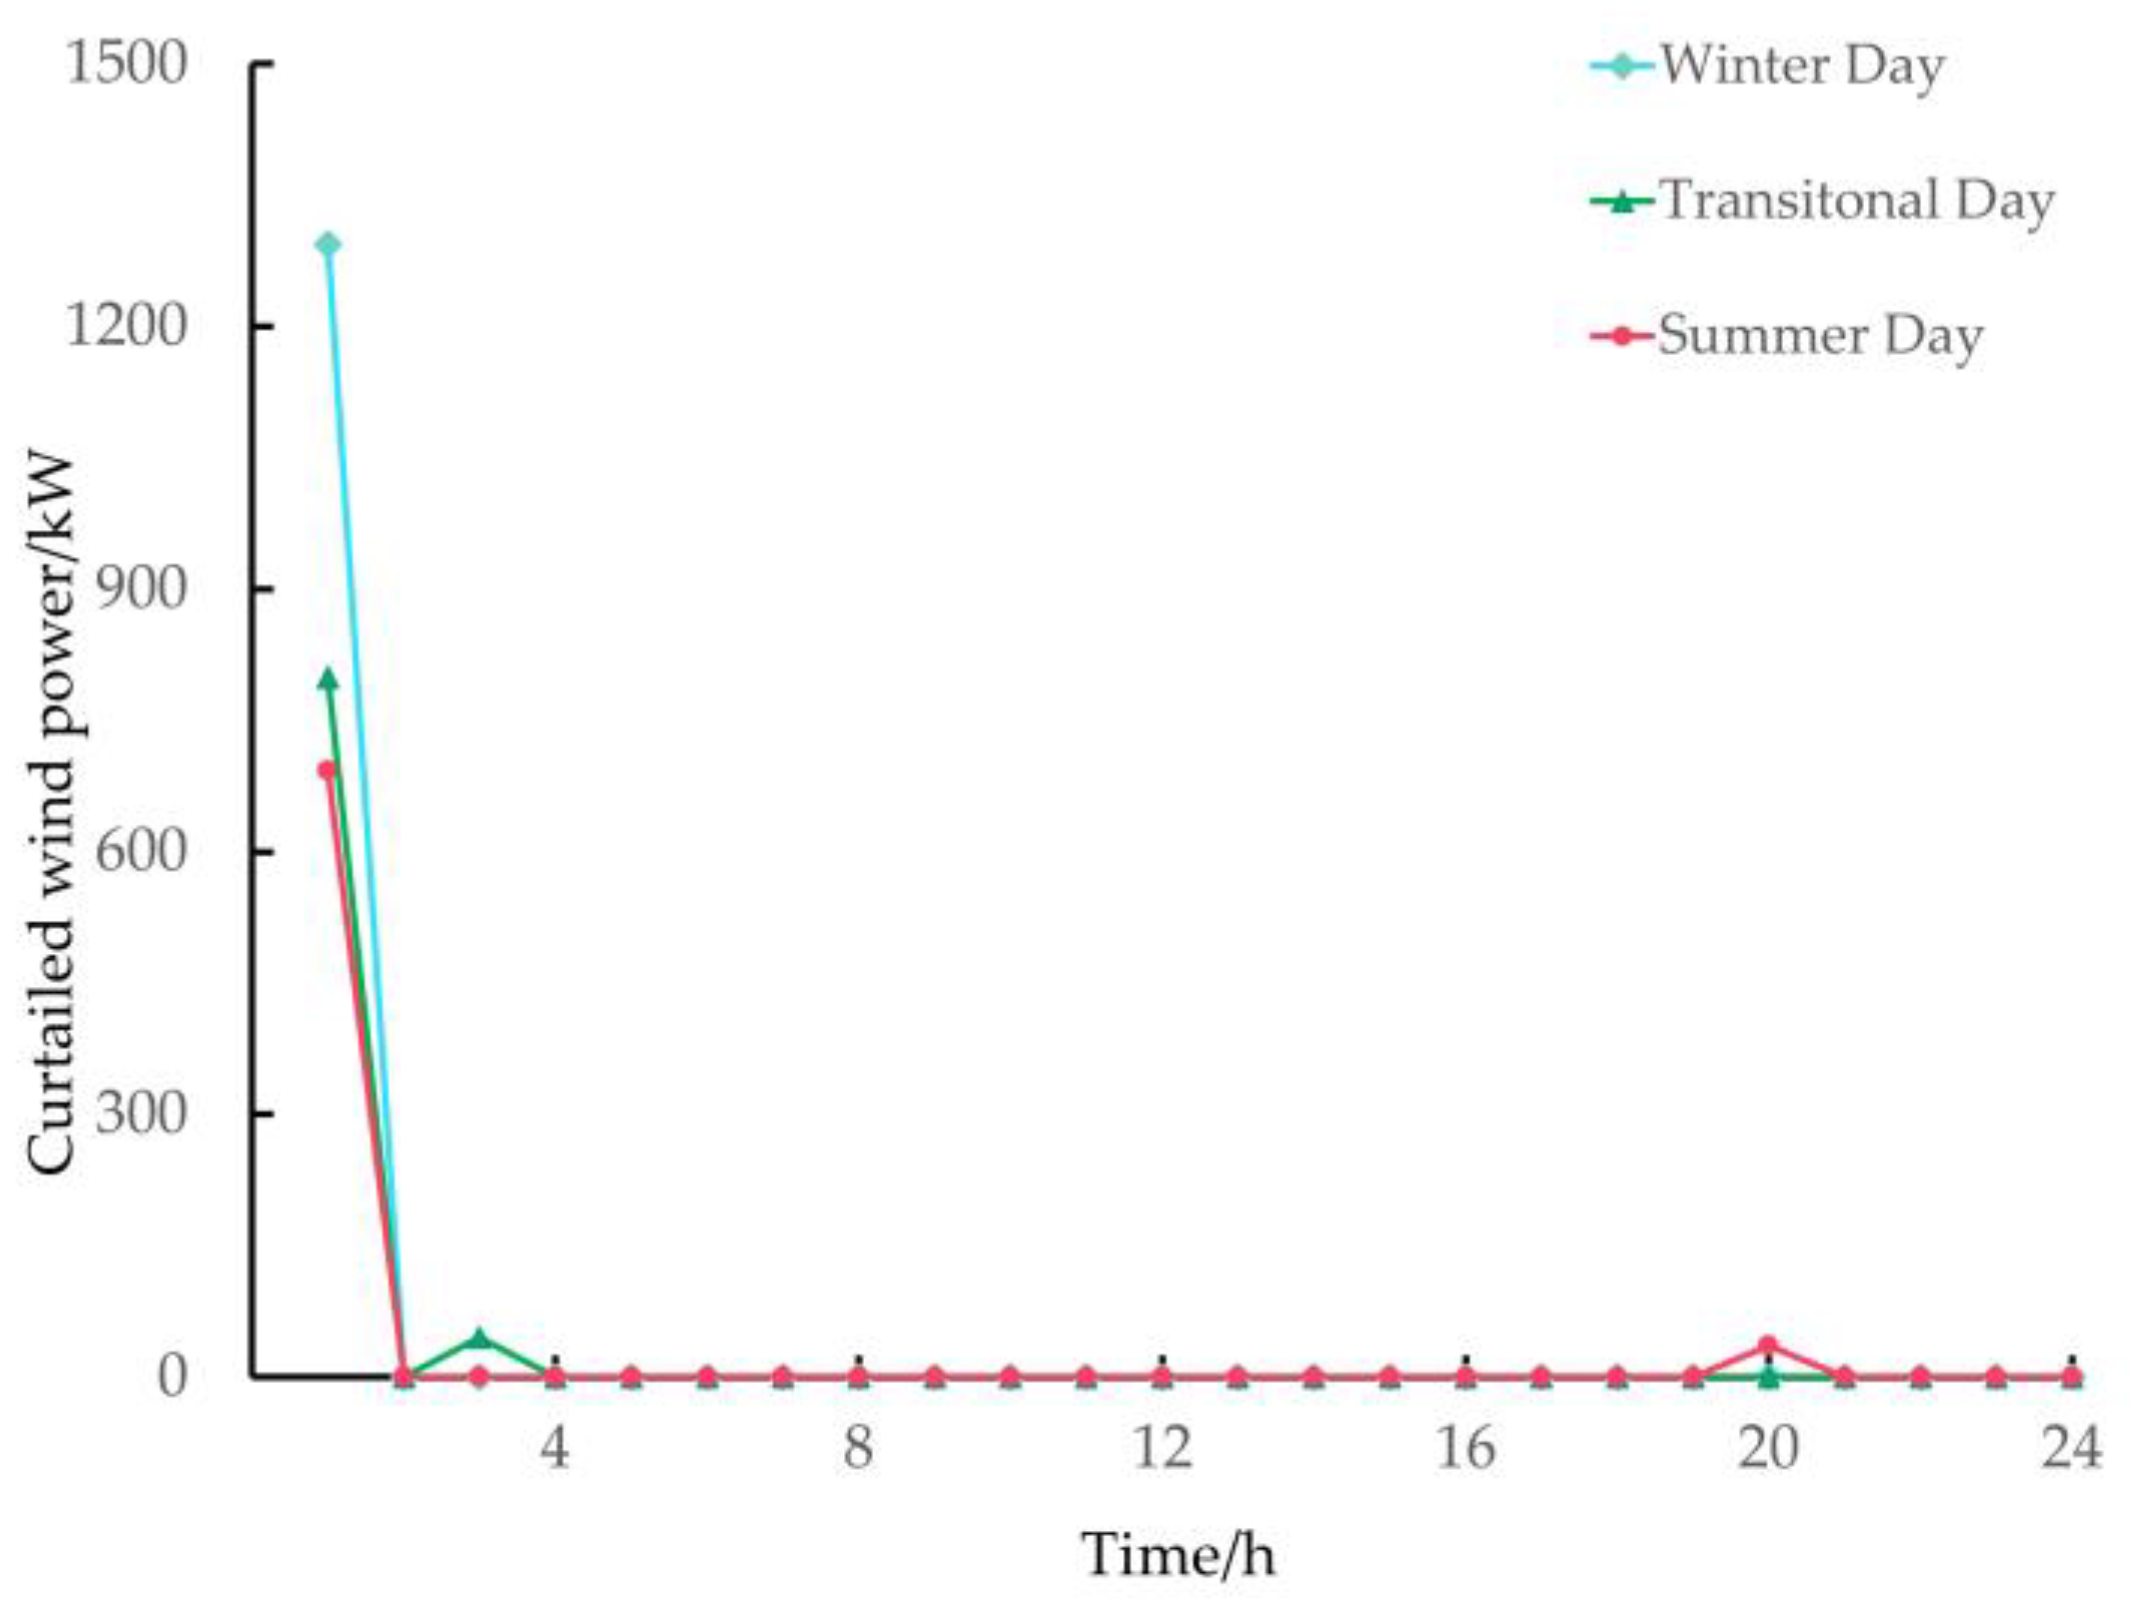
5.3. Analysis of Scheduling Results on Typical Days

Through the optimization results obtained previously, we know that the system in case 5 is the best for improving the operation cost. In order to study the specific performance of the system in case 5, this section focuses on the analysis of the optimal scheduling results on typical days. At this time, the optimal scheduling results are based on the optimal capacity values of P2G and GSHP (1050 Kw and 1900 kW).
Figure 8 shows that the amount of curtailed wind power is extremely small due to the cooperation between P2G and GSHP on each typical day. During the periods of 1–2, the wind power resources are too abundant, the electricity power load is at a low valley, and the power difference between them is the largest. Although P2G and GSHP reached high load operation, they still could not absorb all wind power. And wind power is completely accommodated during most periods of each typical day. During the daytime, the wind power is relatively small, and the demand for the power load is at the peak, so a large amount of wind power can be supplied to the power load.

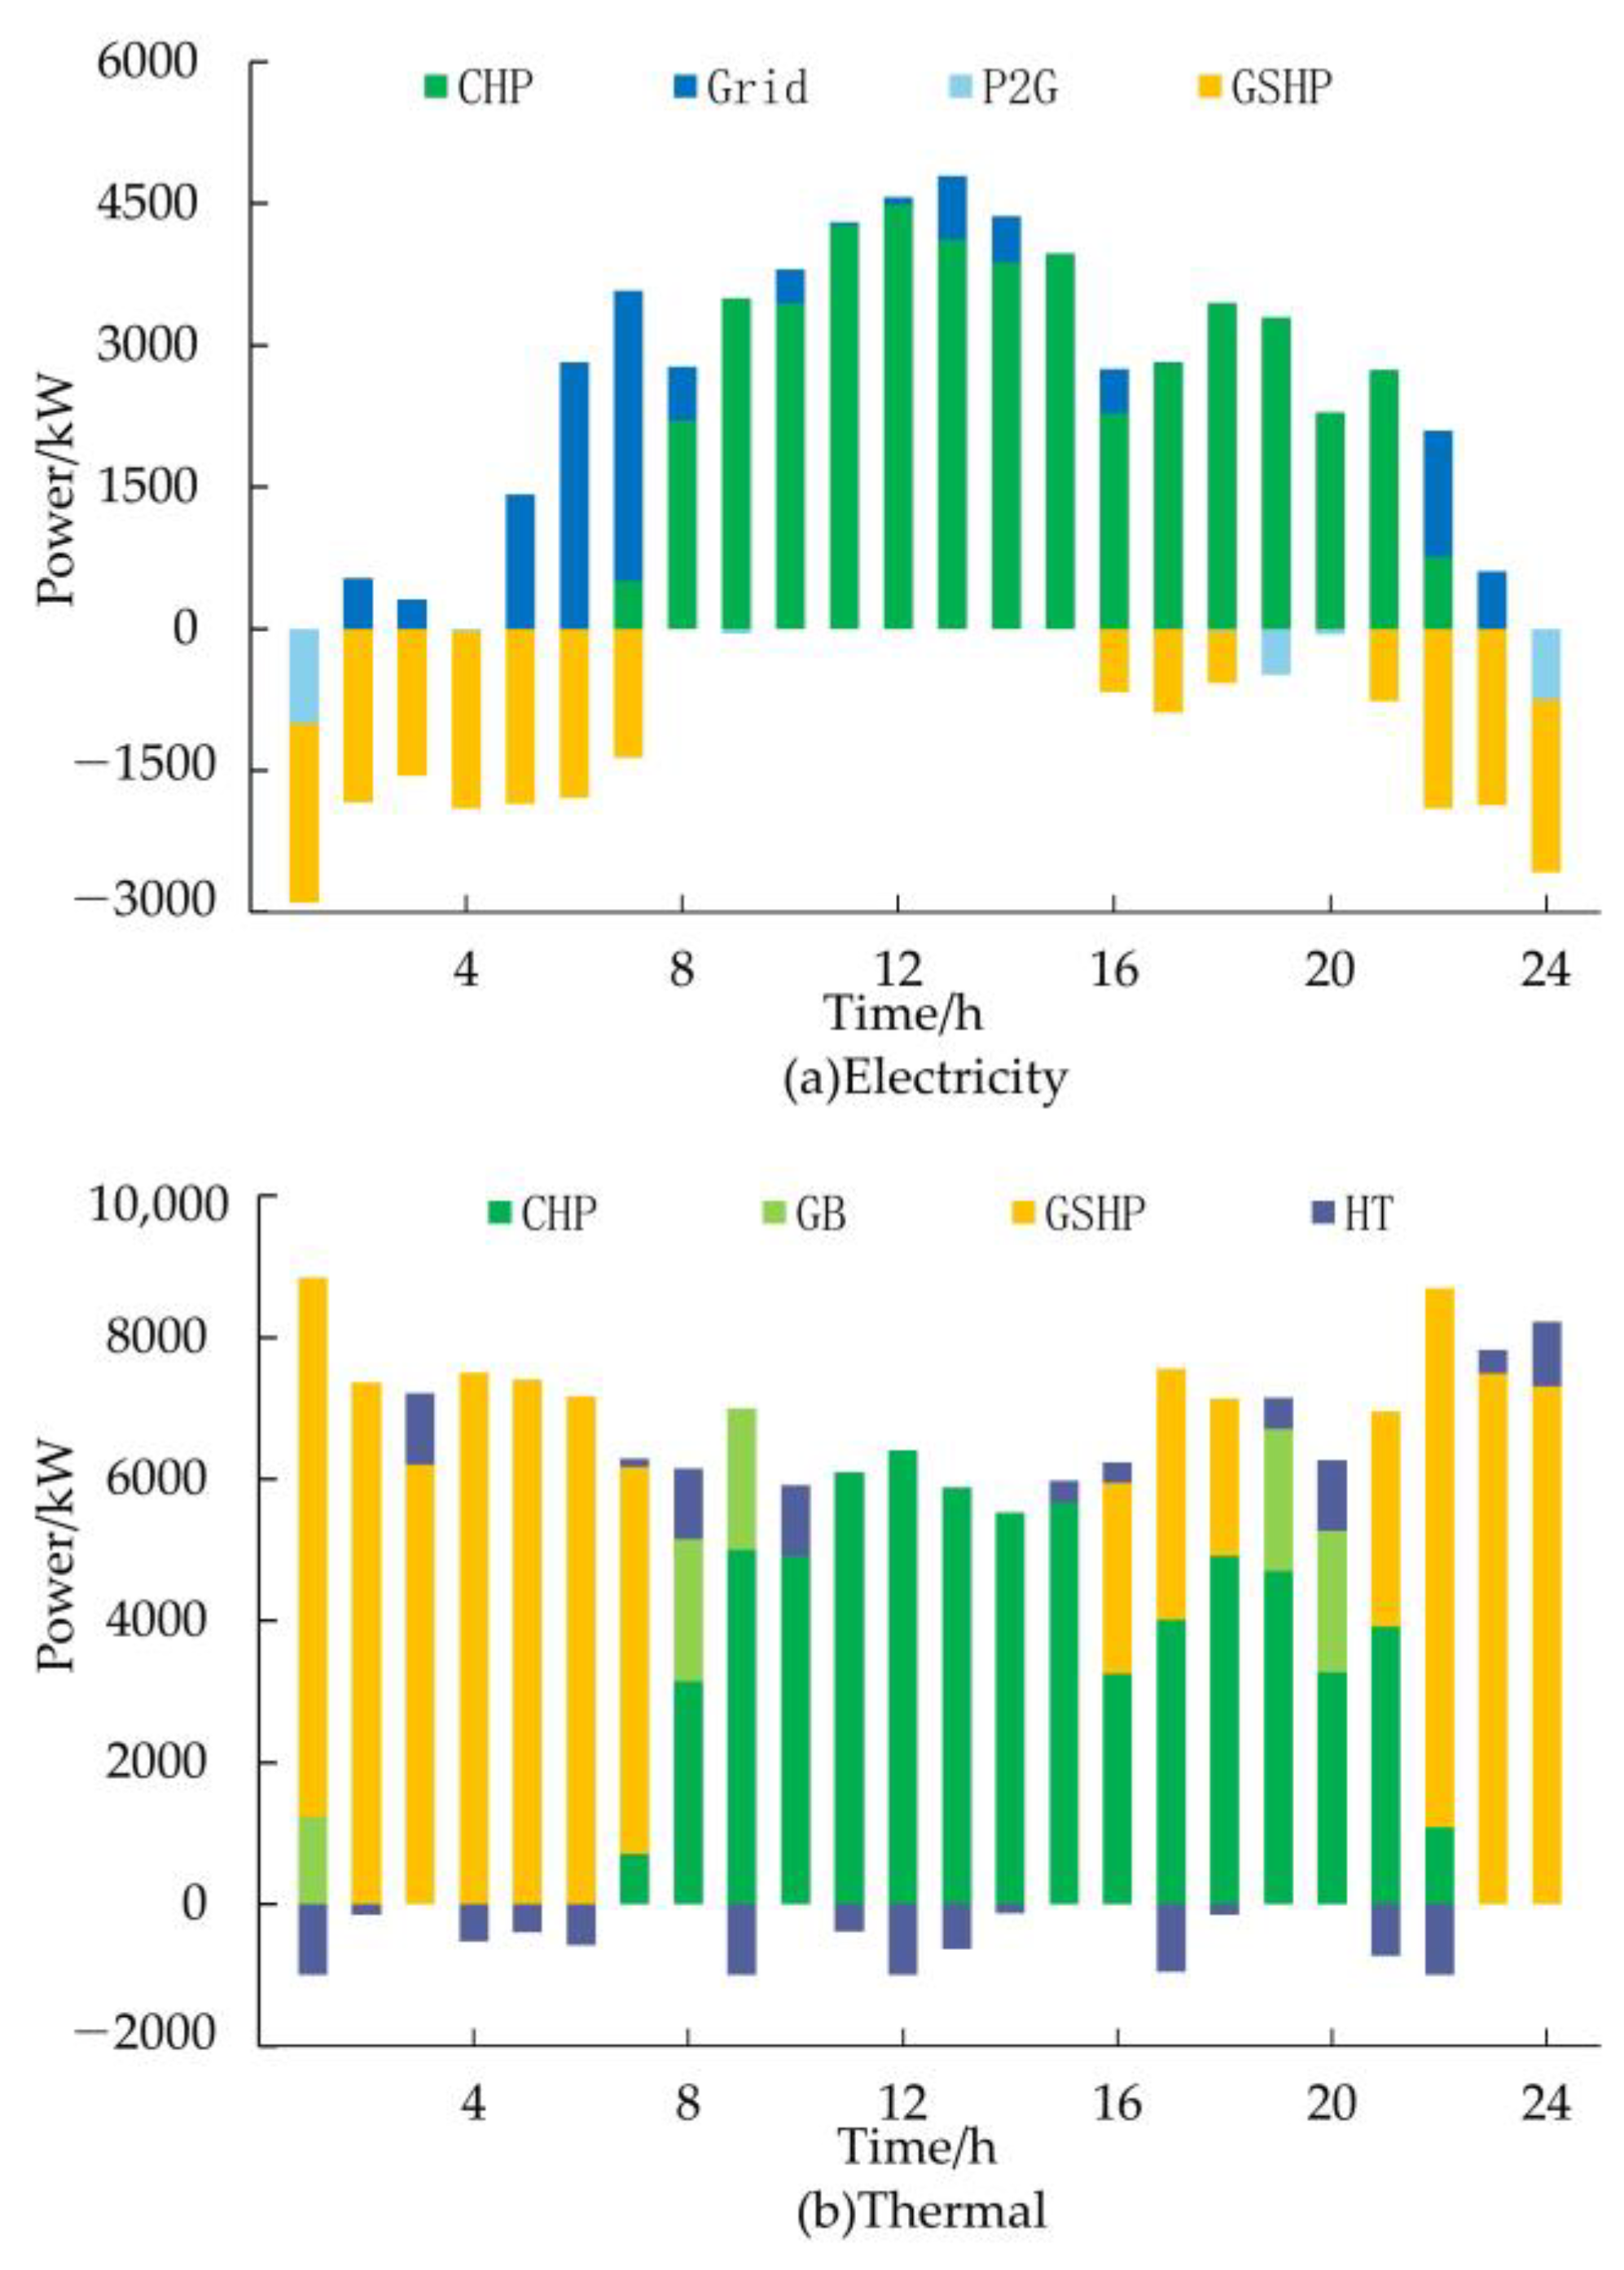
5.3.1. Scheduling on Typical Day of Winter

The electrical and thermal outputs of devices in the integrated energy system on a typical day of winter are shown in Figure 9. During the periods of 8–21, the demand for heat load and electricity load is large, and the heat supply of the CHP unit is at a high level. GSHP and GB are only used as supplements for heating. During the same period, a small amount of electricity is purchased from the power grid because the electricity price is at a peak. In other periods, wind power resources are relatively abundant, which can be used for GSHP (use wind power for heating) or P2G (generate economic benefits through gas production). During the periods of 19–20, P2G separately accommodates the curtailed wind power caused by the constraints of ‘power determined by heat’. In addition, P2G works in conjunction with GSHP during periods 1 and 24 to jointly accommodate the curtailed wind power. During the periods of 2–6, when electricity prices are low, it is necessary to purchase electricity to meet the electricity load and the consumption of GSHP. However, due to the high heating efficiency of GSHP, it can also bring economic benefits compared to the cost of purchasing electricity.

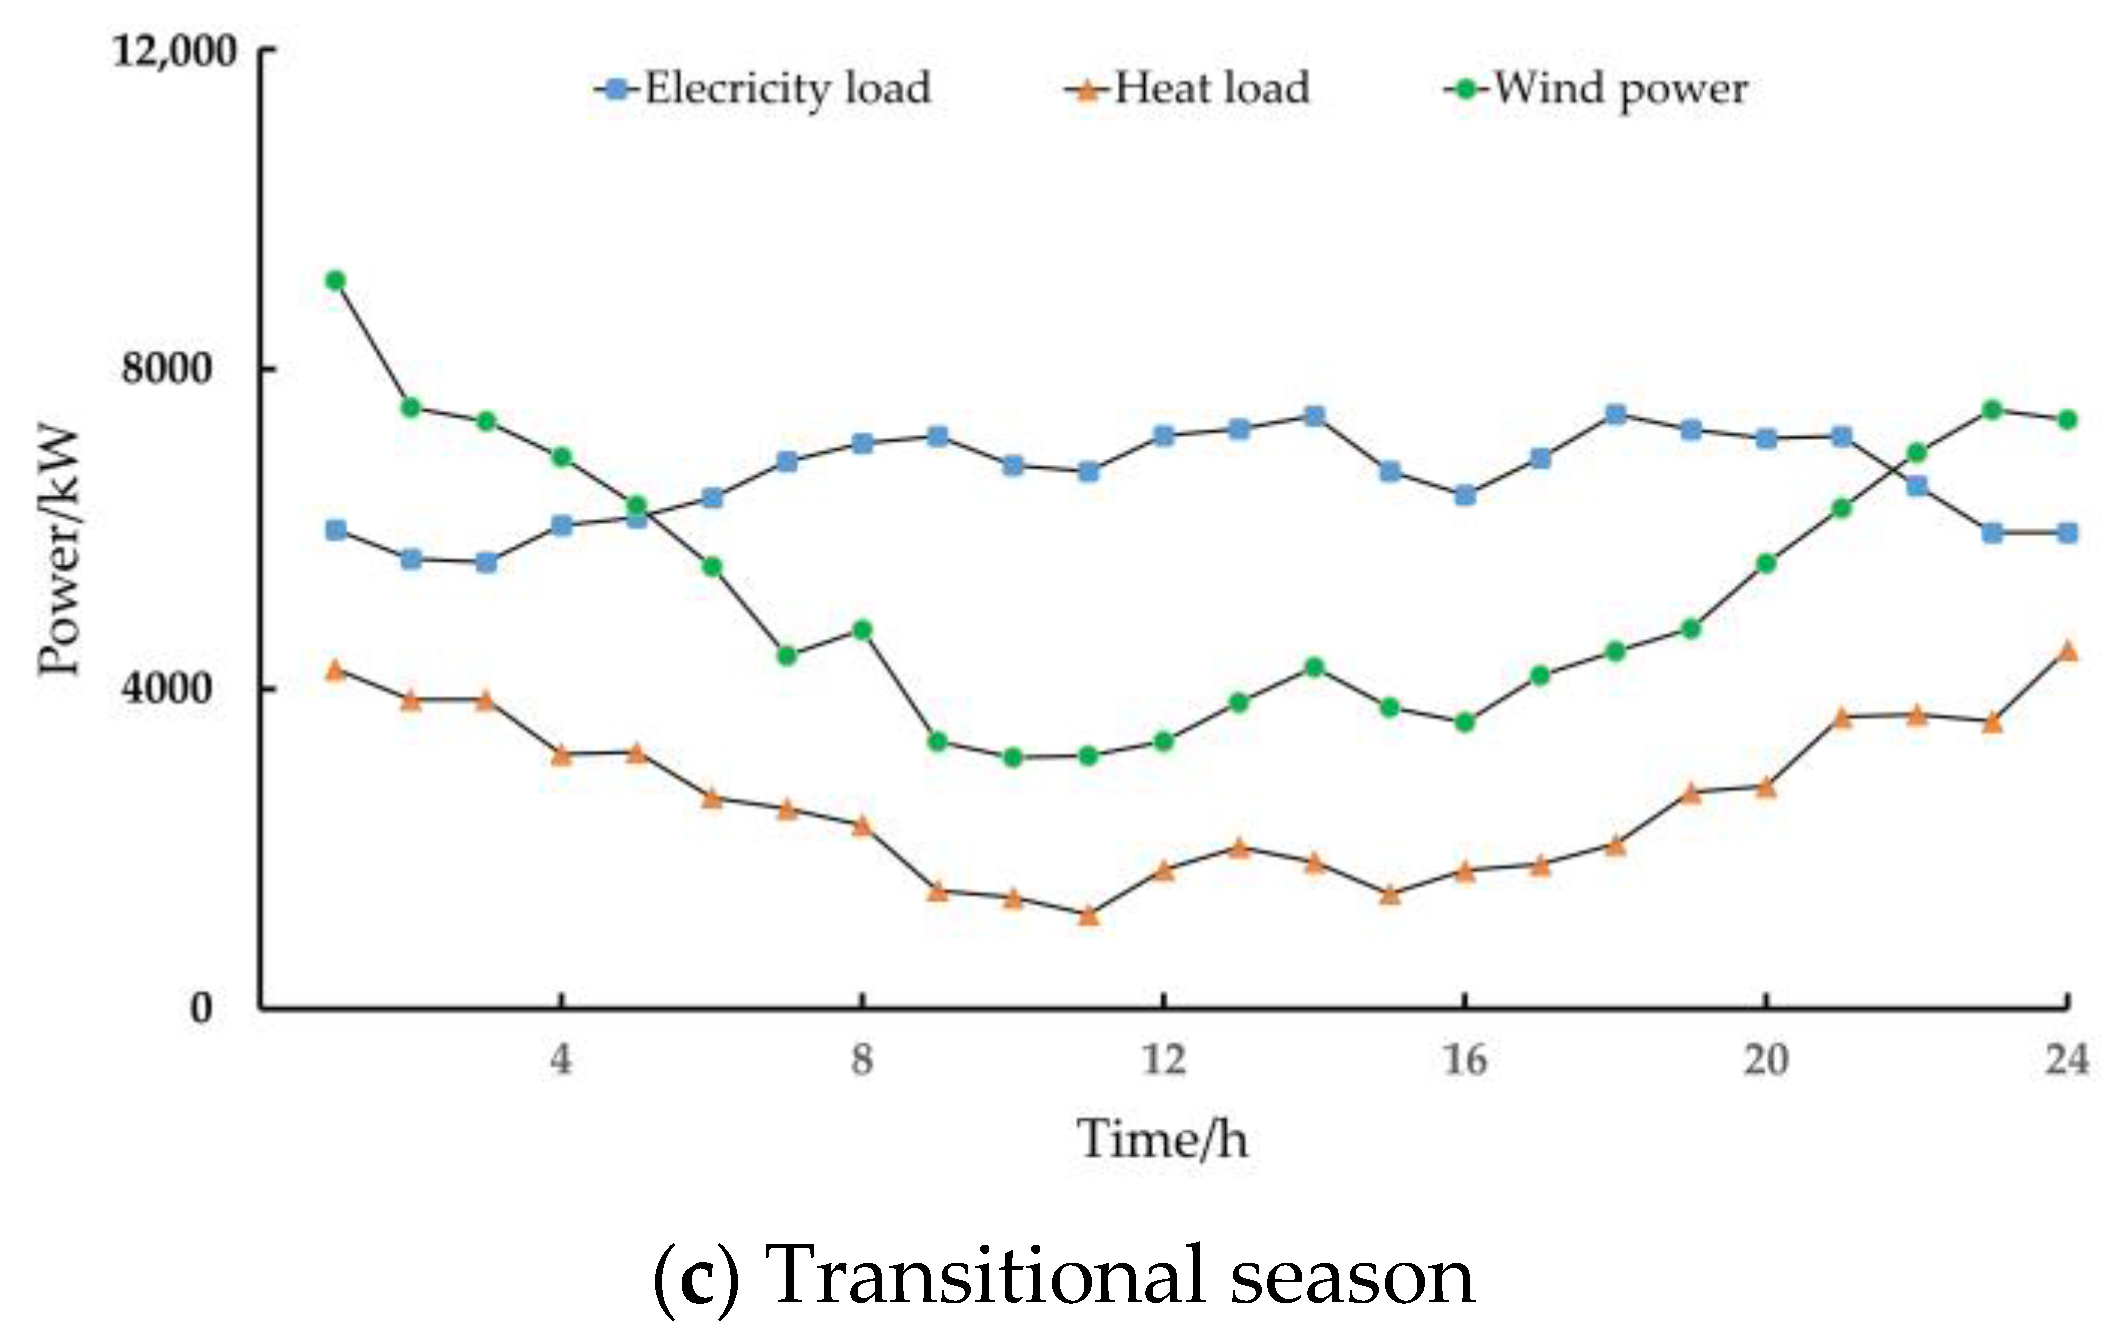
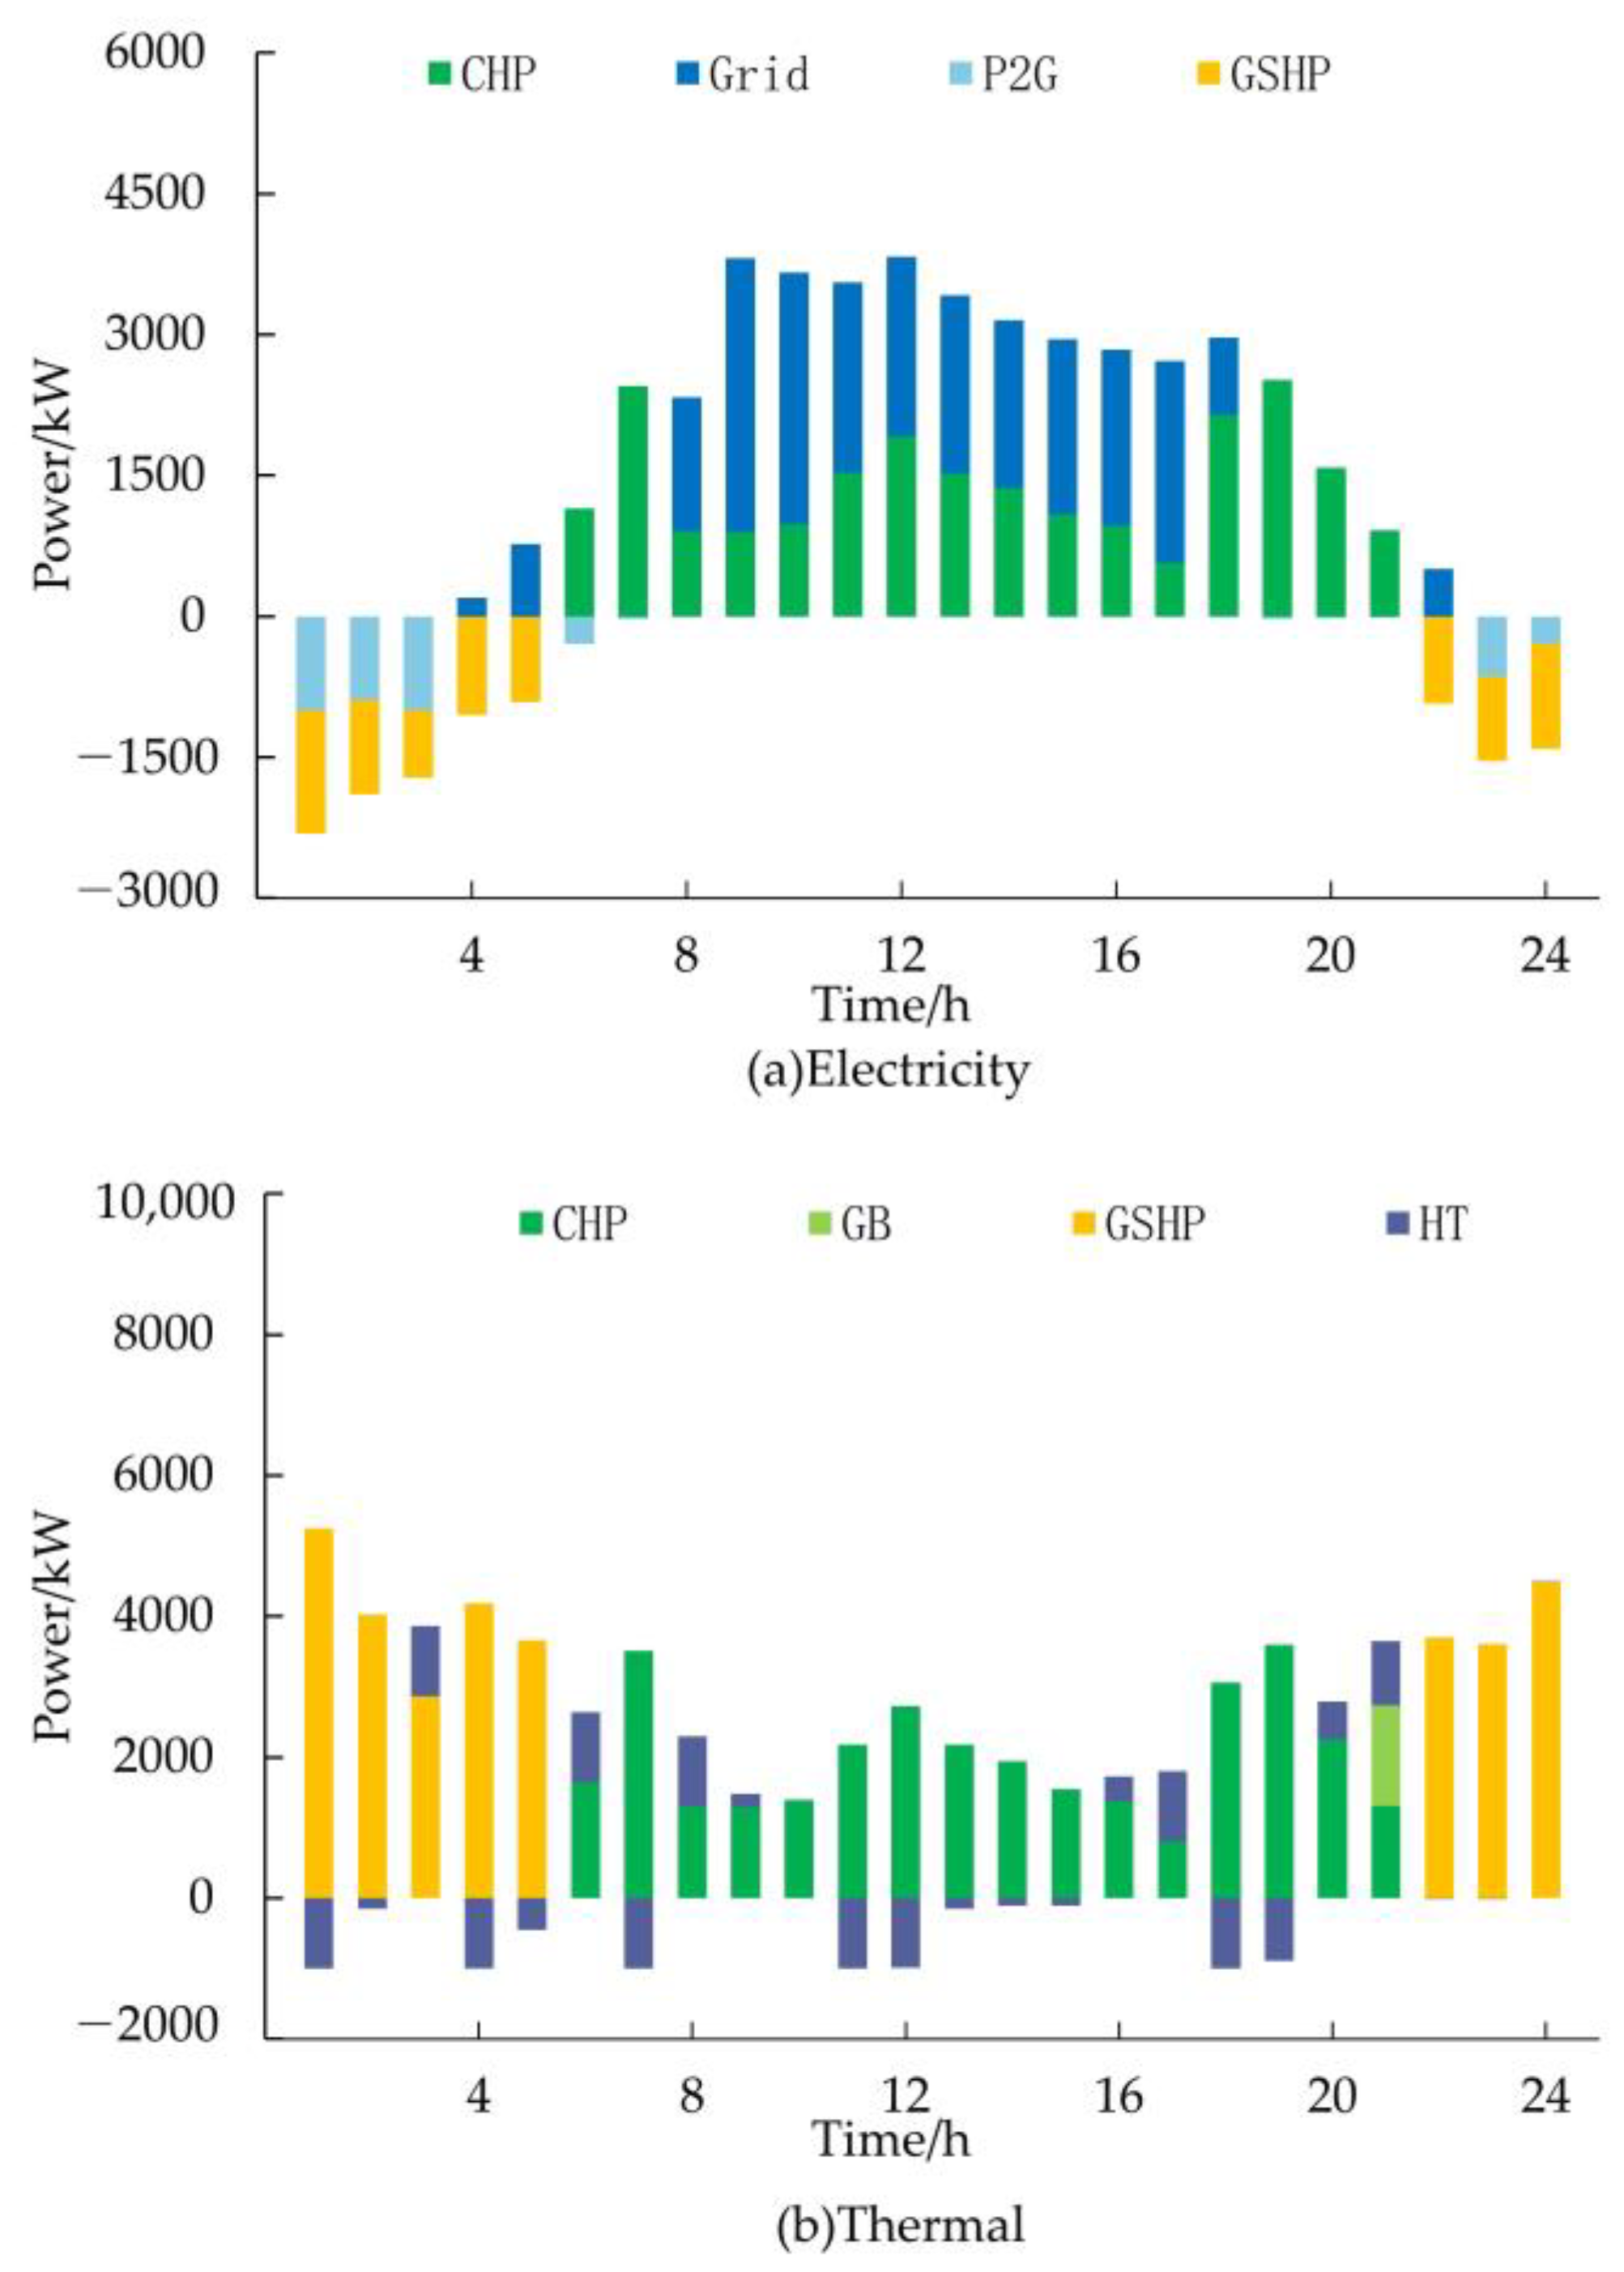
5.3.2. Scheduling on Typical Day of Transitional Season

The electrical and thermal outputs of devices in the integrated energy system on a typical day of the transitional season are shown in Figure 10. During the periods of 1–5 and 22–24, the electrical load in the system is almost completely provided by wind power, and the surplus wind energy is converted into other forms of energy by P2G and GSHP. During these periods, as the main heating device, the GSHP cooperates with the heat storage tank to undertake all the heating tasks. During periods 8–18, the demand for electricity is at its peak, and the thermal load is at a low level. The heat generated by the CHP unit can fully meet the thermal load and charge the heat storage tank multiple times. At the same time, the wind power output is relatively low, and the shortage of the electricity load means that there is a need to purchase power from the grid. In addition, the lack of electricity causes P2G and GSHP to stop working.

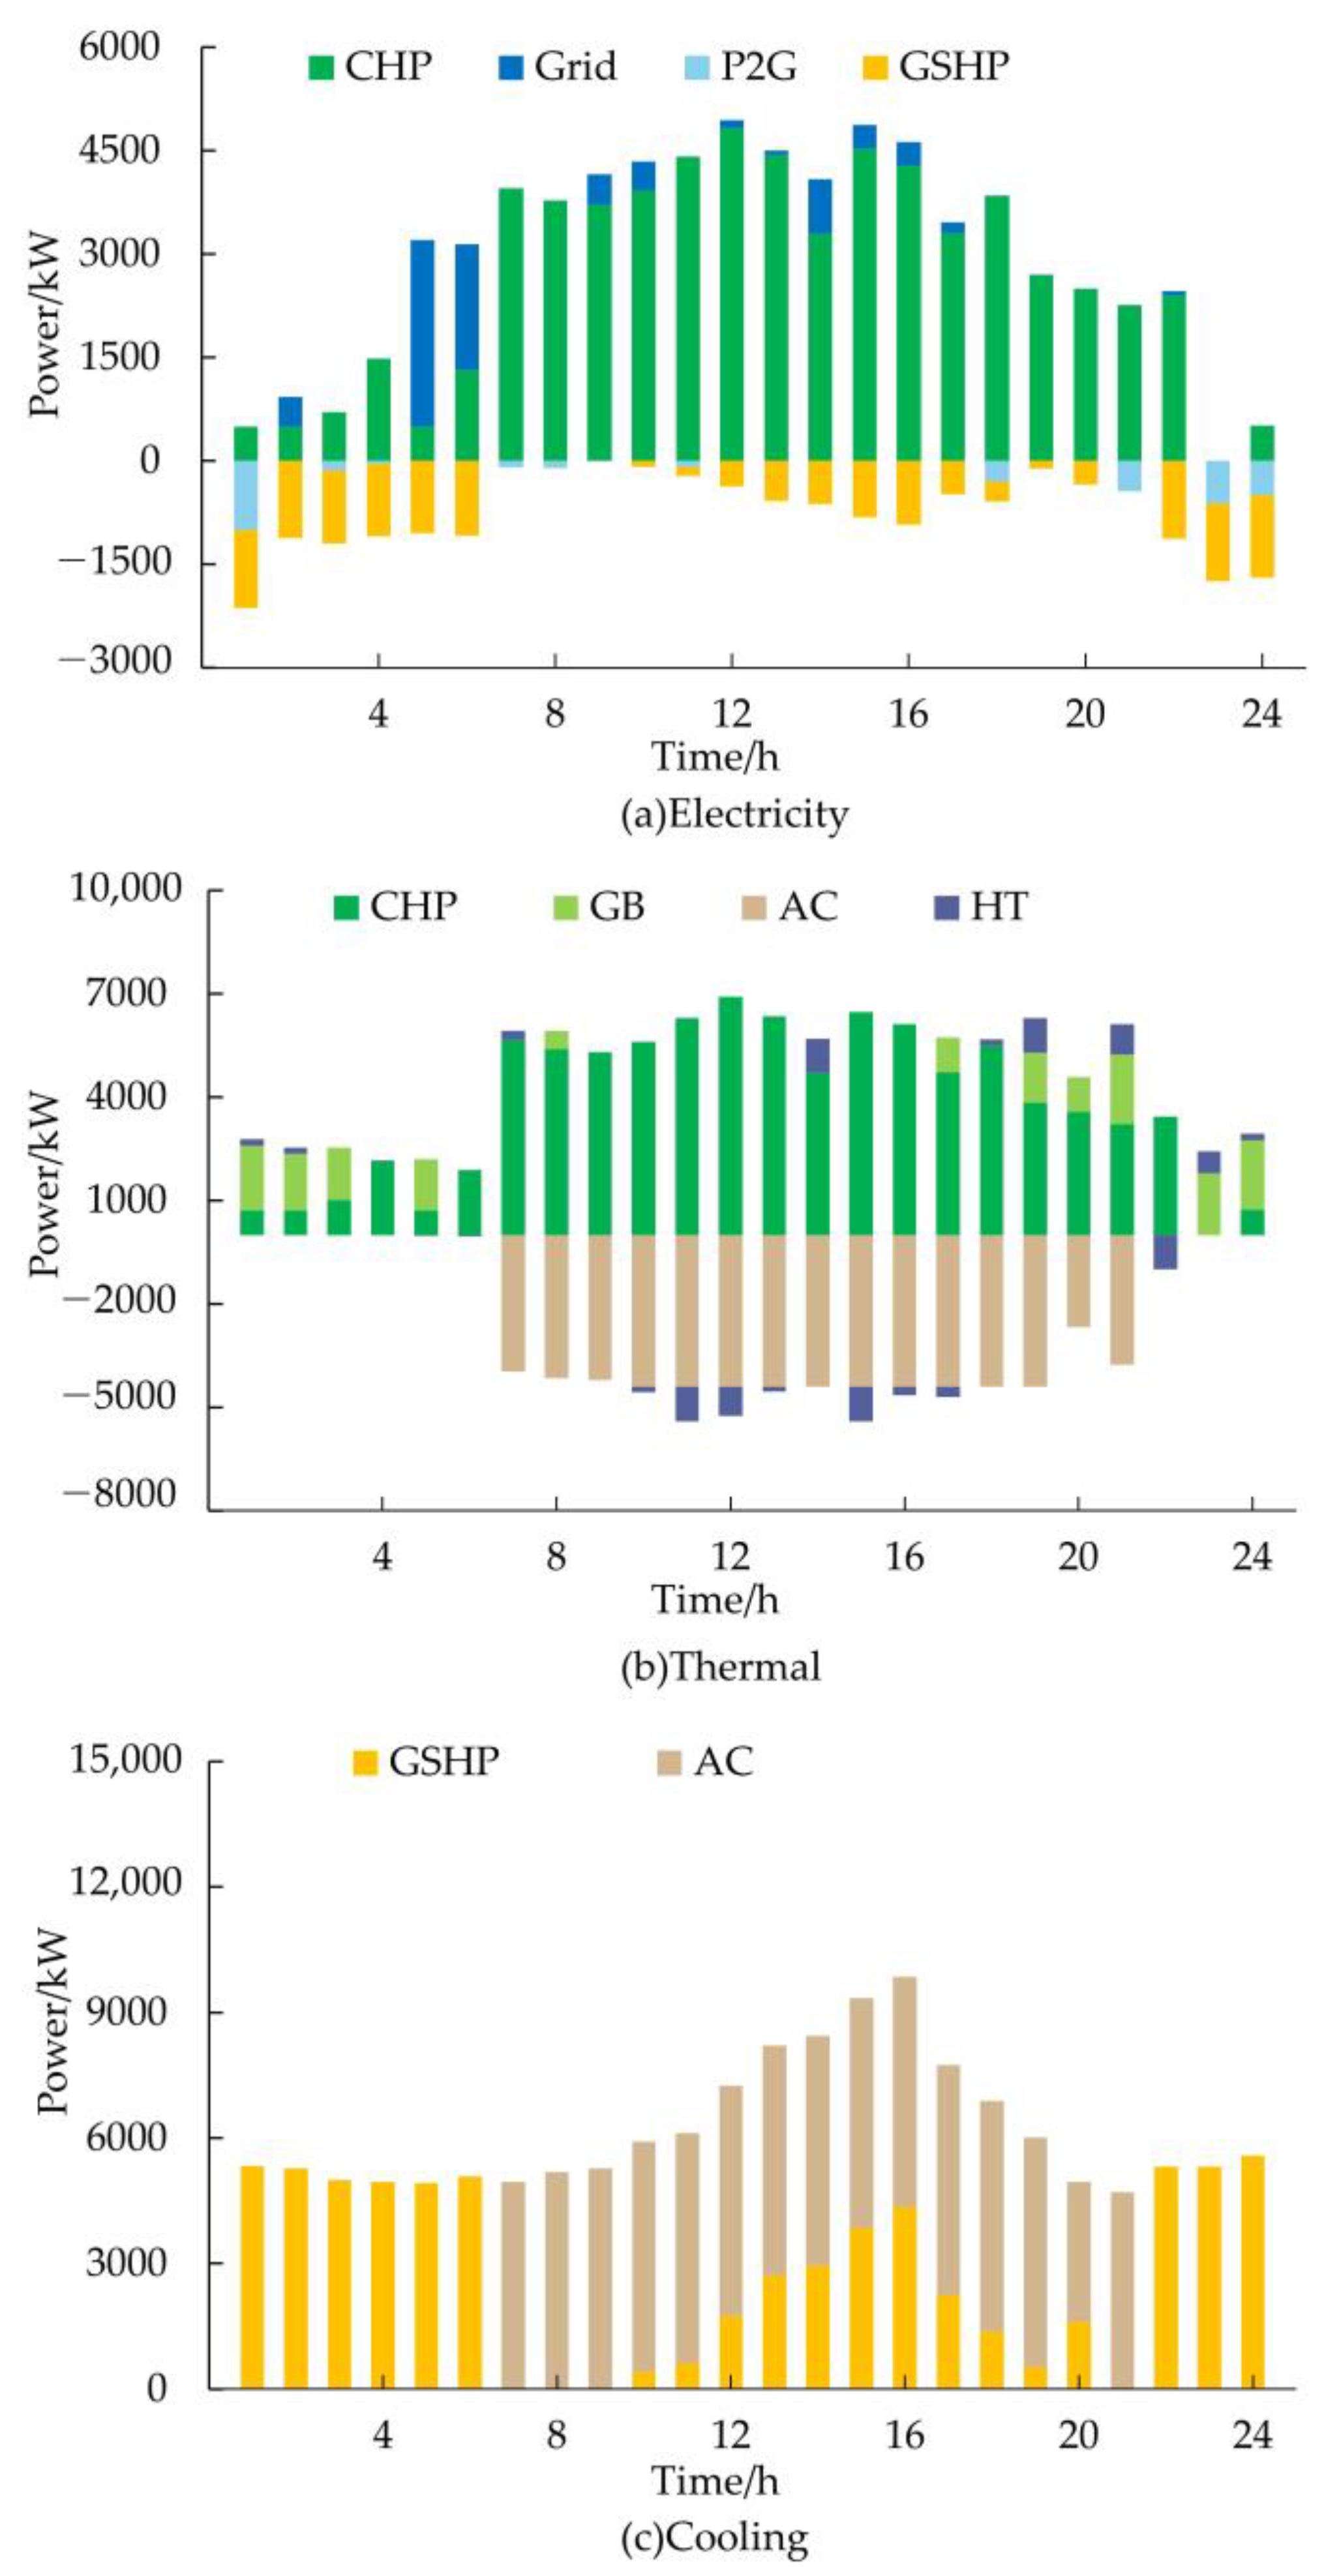
5.3.3. Scheduling on Typical Day of Summer

The electrical, thermal, and cooling outputs of devices in the integrated energy system on a typical day of summer are shown in Figure 11. During the periods of 21–24 and 1, part of the redundant wind power in the system is accommodated by P2G, and the other part is accommodated by GSHP (the main cooling supply source). Both of them can optimize the cost effectiveness of system operation and alleviate the curtailed wind power. Almost during the same period, the output of GB is approaching full power because of the imbalance in thermal and electrical loads, which can alleviate the pressure of the CHP unit. During the periods of 7–16, the high purchase price of electricity and the lack of wind power can lead to an increased cooling cost of GSHP. Therefore, the CHP unit has a higher output to prioritize power supply and provides a large amount of heat for absorption refrigeration. Overall, the wind power resources in summer are not as abundant as in winter, which leads to an increase in the number of periods that require more power supply from the CHP unit throughout the day. In addition, it is necessary to purchase electricity from the power grid to achieve power balance.

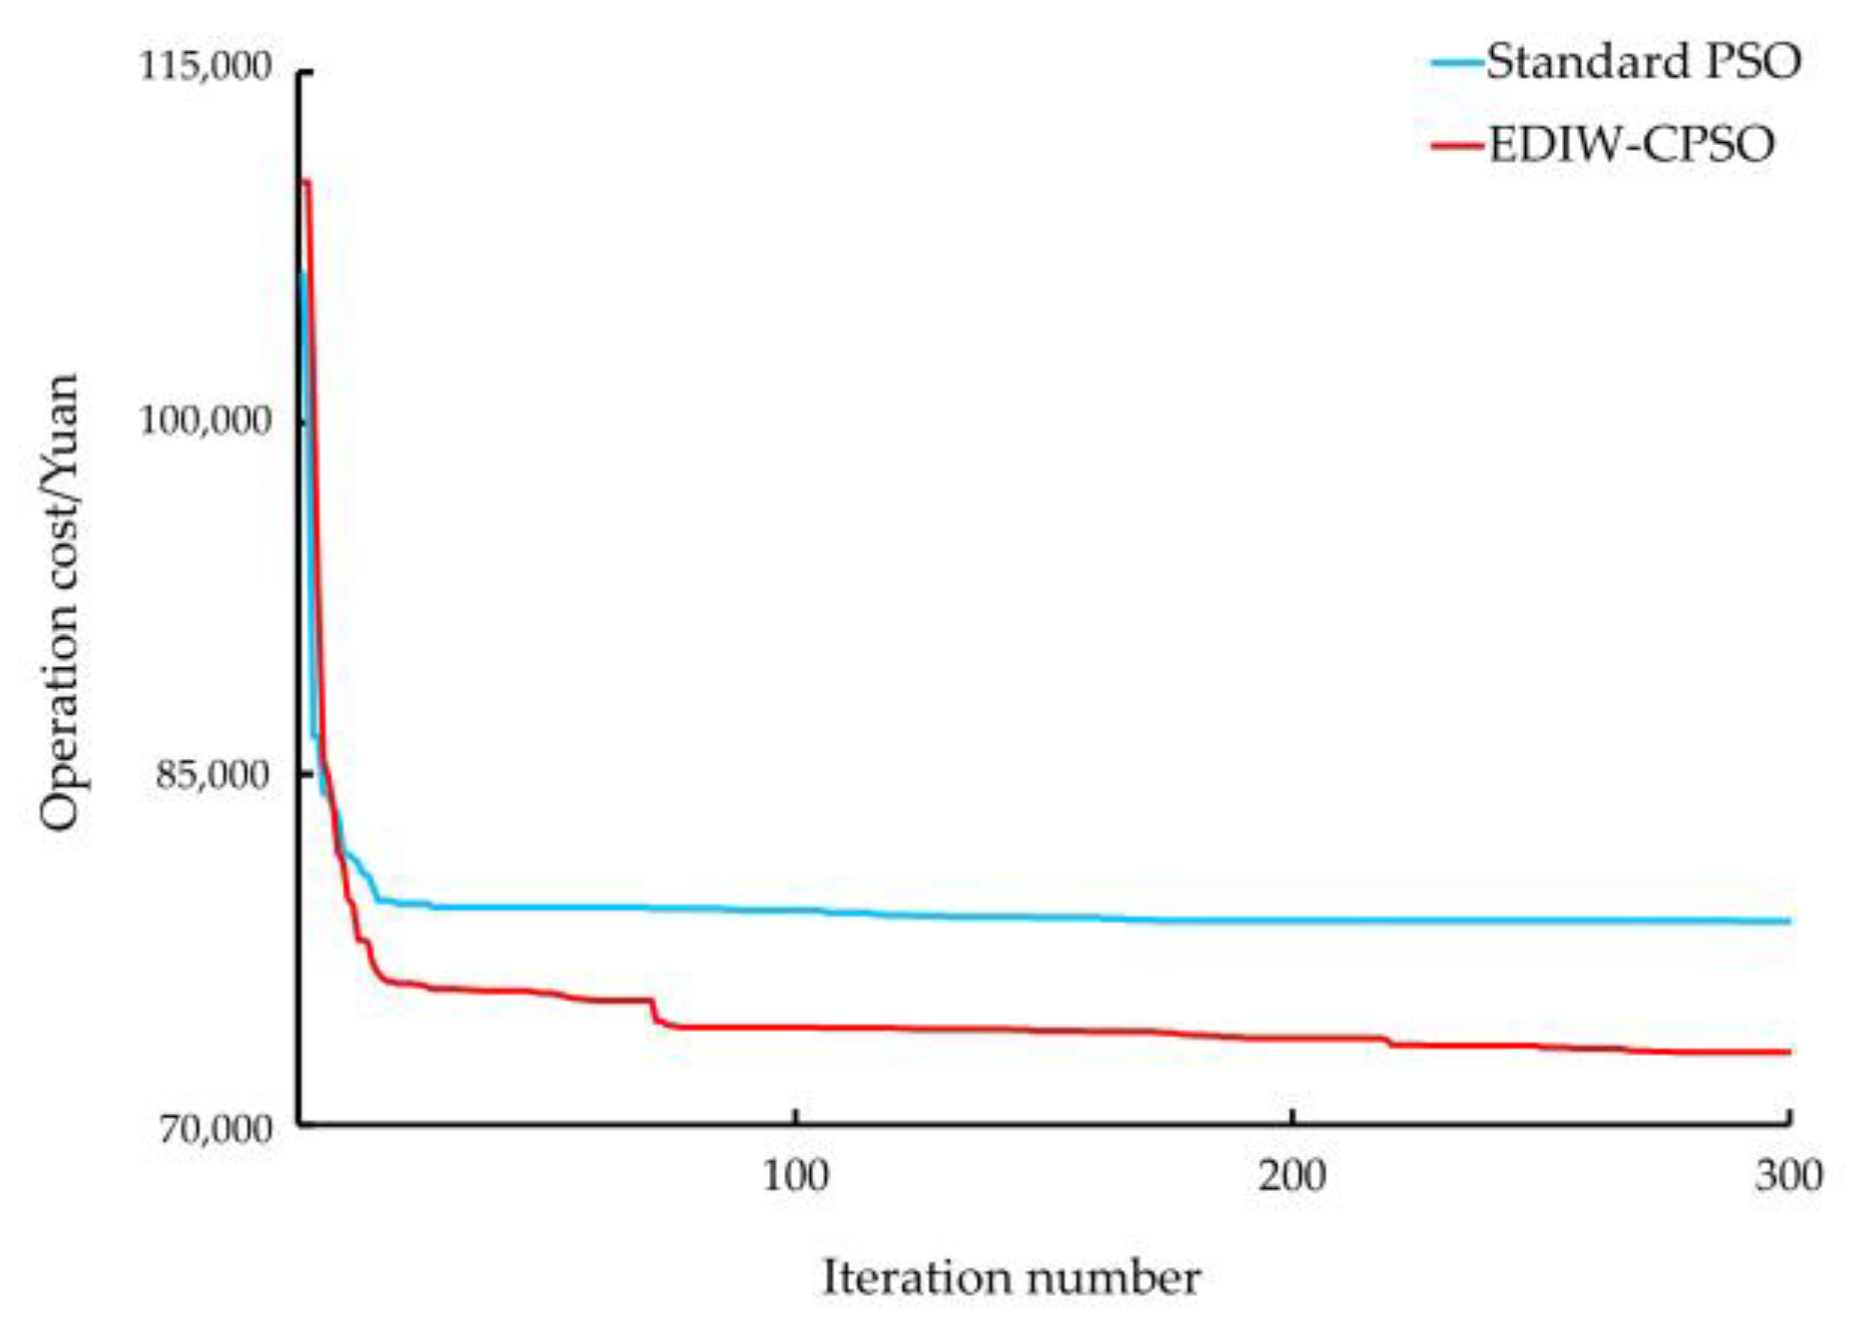
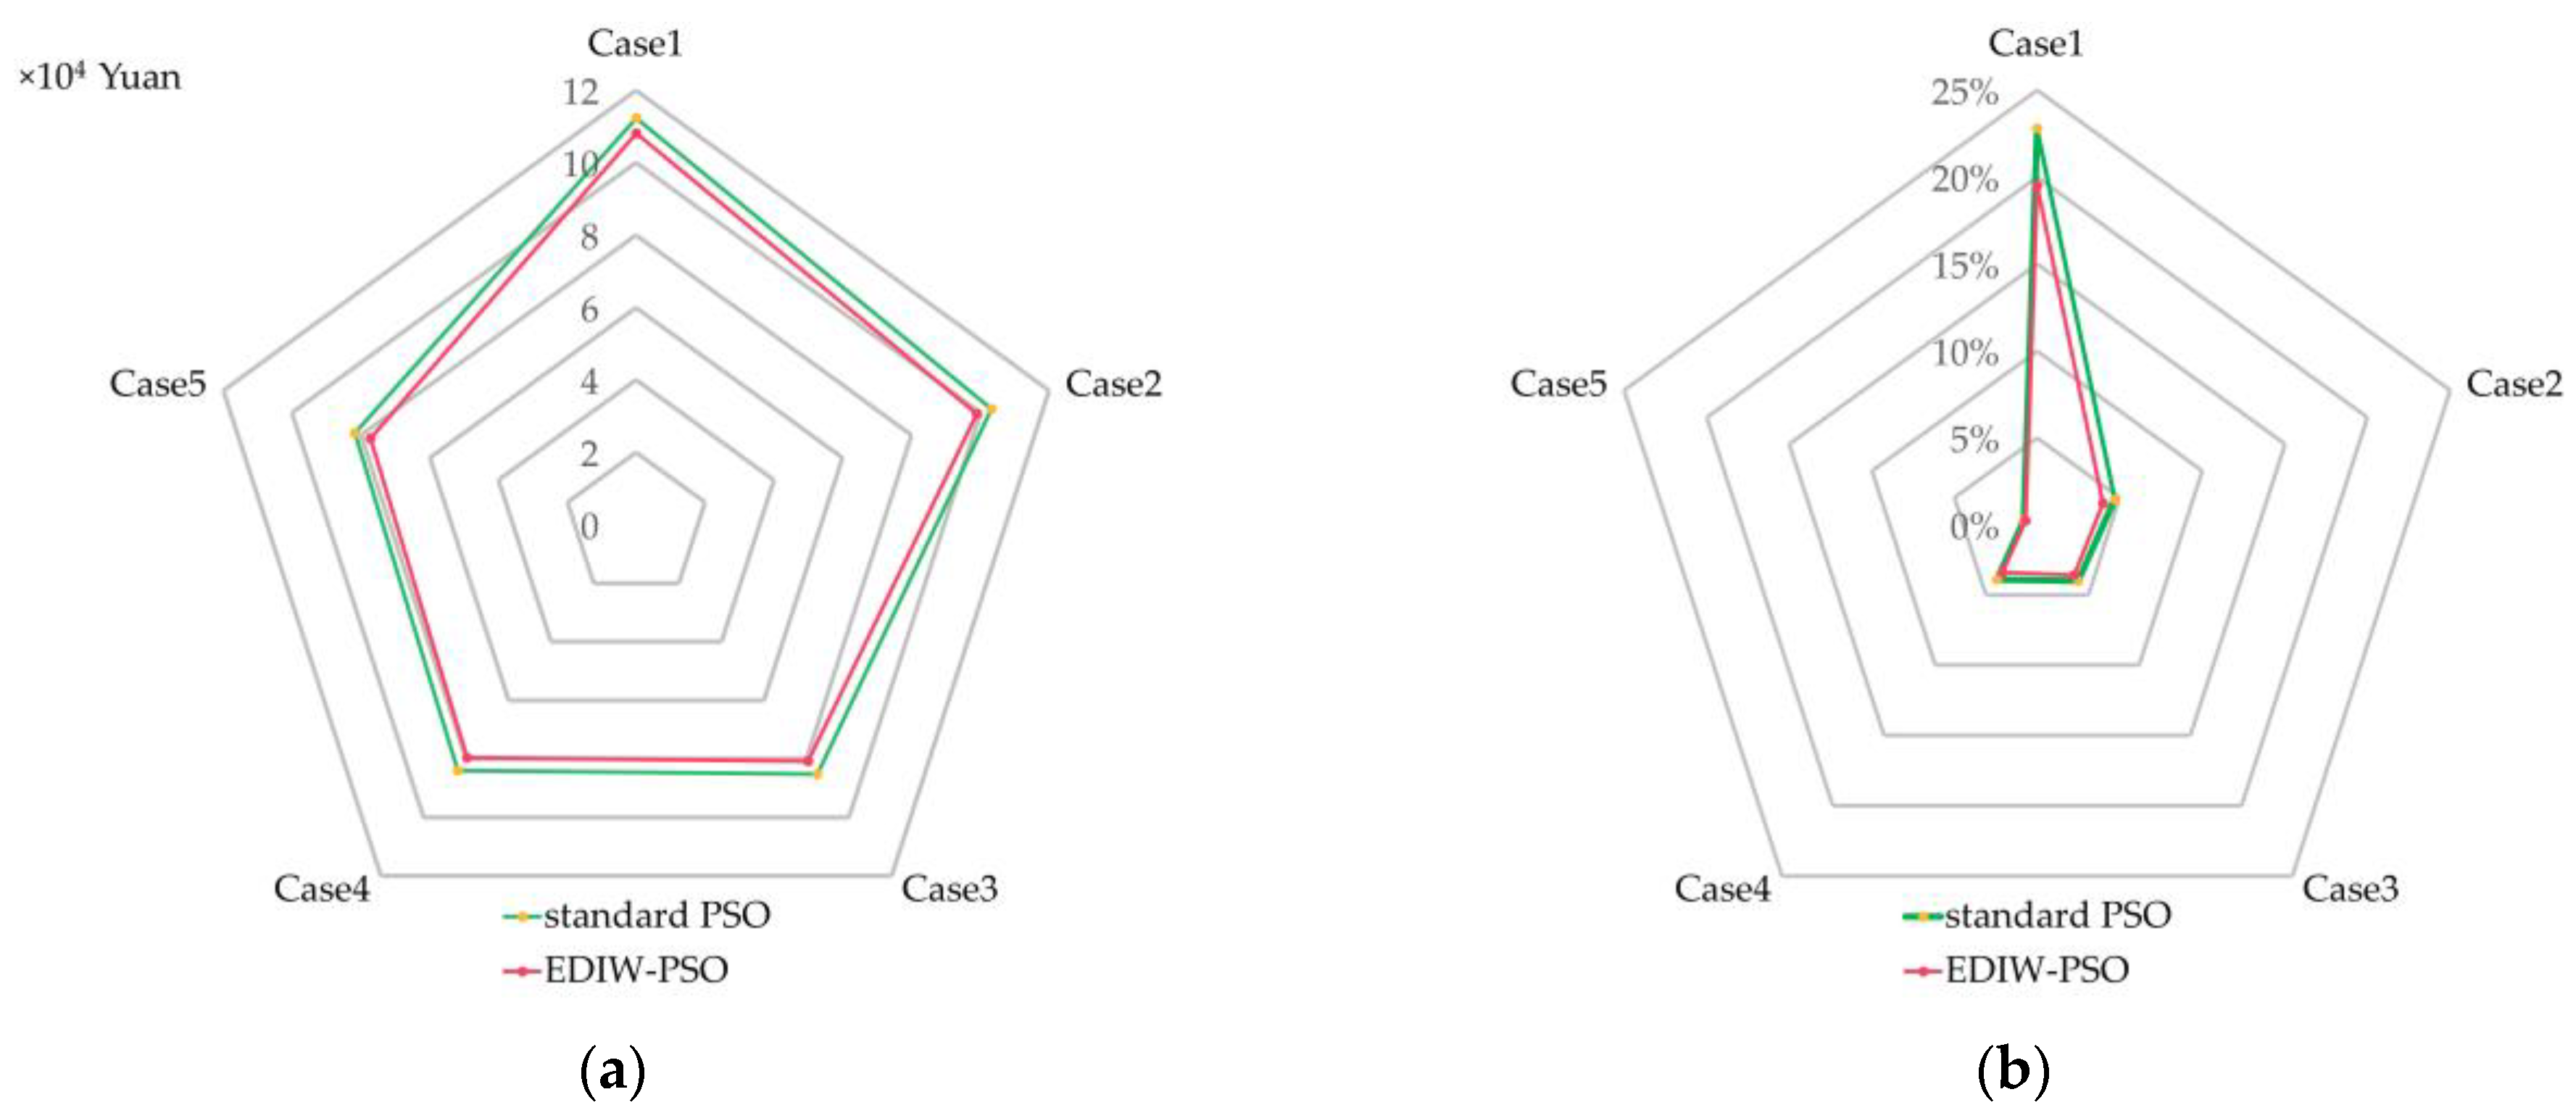
5.4. Influence of the Algorithms on Optimization

The standard PSO and EDIW-CPSO algorithms were used to solve the inner-layer model, respectively, in case 5, and their scheduling results on a typical day of winter are shown in Table 7. In Table 7, the wind curtailment cost under standard PSO scheduling is slightly less than that under EDIW-CPSO. However, it is necessary to purchase a large amount of electricity and gas from the power grid under standard PSO scheduling, which causes a higher energy purchase cost. As a result, the system is not running economically. Therefore, the solution based on the EDIW-CPSO algorithm is better from the perspective of the wind curtailment cost and energy purchase cost, which makes the overall operation cost lower and achieves a better scheduling effect.
The iterative process of the two algorithms is shown in Figure 12. From the comparison in Figure 12, it can be seen that EDIW-CPSO has a faster convergence speed and better iteration effect compared to the standard PSO algorithm. In addition, the standard PSO algorithm prematurely falls into a local optimum value, while the EDIW-CPSO algorithm can still update the optimum value (maintain the ability to explore) in the later stages of iteration.
Naturally, the optimal results of the inner-layer model using the standard PSO algorithm will affect the enumeration of the outer-layer model. Based on standard PSO scheduling, the results obtained through bi-layer optimization are shown in Table 8, and there is a comparison in Figure 13. As can be seen from Table 8 and Figure 13, the capacity of all devices is smaller than in previous optimizations, and the wind curtailment rate and comprehensive cost are larger. The above results show that the cost effectiveness of the system under standard PSO scheduling is not as good as that of the EDIW-CPSO due to the inefficient scheduling of devices.

5.5. Influence of the Natural Gas Price Fluctuation on Optimization

Figure 14 shows the composition of comprehensive cost in case 5. It can be seen from Figure 14 that the gas purchase cost accounts for the largest proportion of the total cost, reaching 64.3%. Therefore, the price of natural gas directly affects the gas purchase cost of the system. In order to analyze the influence of natural gas prices on the comprehensive energy system, this section sets the fluctuation range of natural gas prices as 40%~220%, with a change interval of 30%. The natural gas price in the example is 3.5 CNY/m3, and the other system parameters remain unchanged. The results are shown in Figure 15.
From Figure 15, it can be seen that, in the range of 40% to 130%, as the natural gas price increases, the optimal capacities of P2G and GSHP also gradually increase. In the same range, the gas purchase cost and curtailed wind power decrease. The above results show that the cost effectiveness of the system can be improved by planning the use of these two devices in terms of natural gas price fluctuations. In addition, the configuration capacity of GSHP changes greatly, because it can bring greater benefits by reducing the gas consumption of the CHP unit through decoupling the constraints of ‘power determined by heat’. In the range of 160%~220%, the capacity of P2G changes slowly. This is because P2G can reduce the gas purchase cost, and the amount of the curtailed wind power in the system is already extremely low, so it is no longer economical to continue to expand the capacity of P2G. In the same range, the capacity change in GSHP tends to be stable, because it cannot share the power supply of the CHP unit, which is wasteful in terms of expanding the capacity. Overall, as the natural gas price rises, the amount of gas purchased by the system decreases, the comprehensive cost increases, and the configured capacities and curtailed wind power are gradually stabilized.

6. Conclusions

In this study, optimal planning, including the coupling of P2G and GSHP, is established based on an integrated energy system in North China from the perspective of reducing curtailed wind power and system costs. Through solving the bi-layer simulation model and analyzing the optimization results, the following conclusions can be drawn:
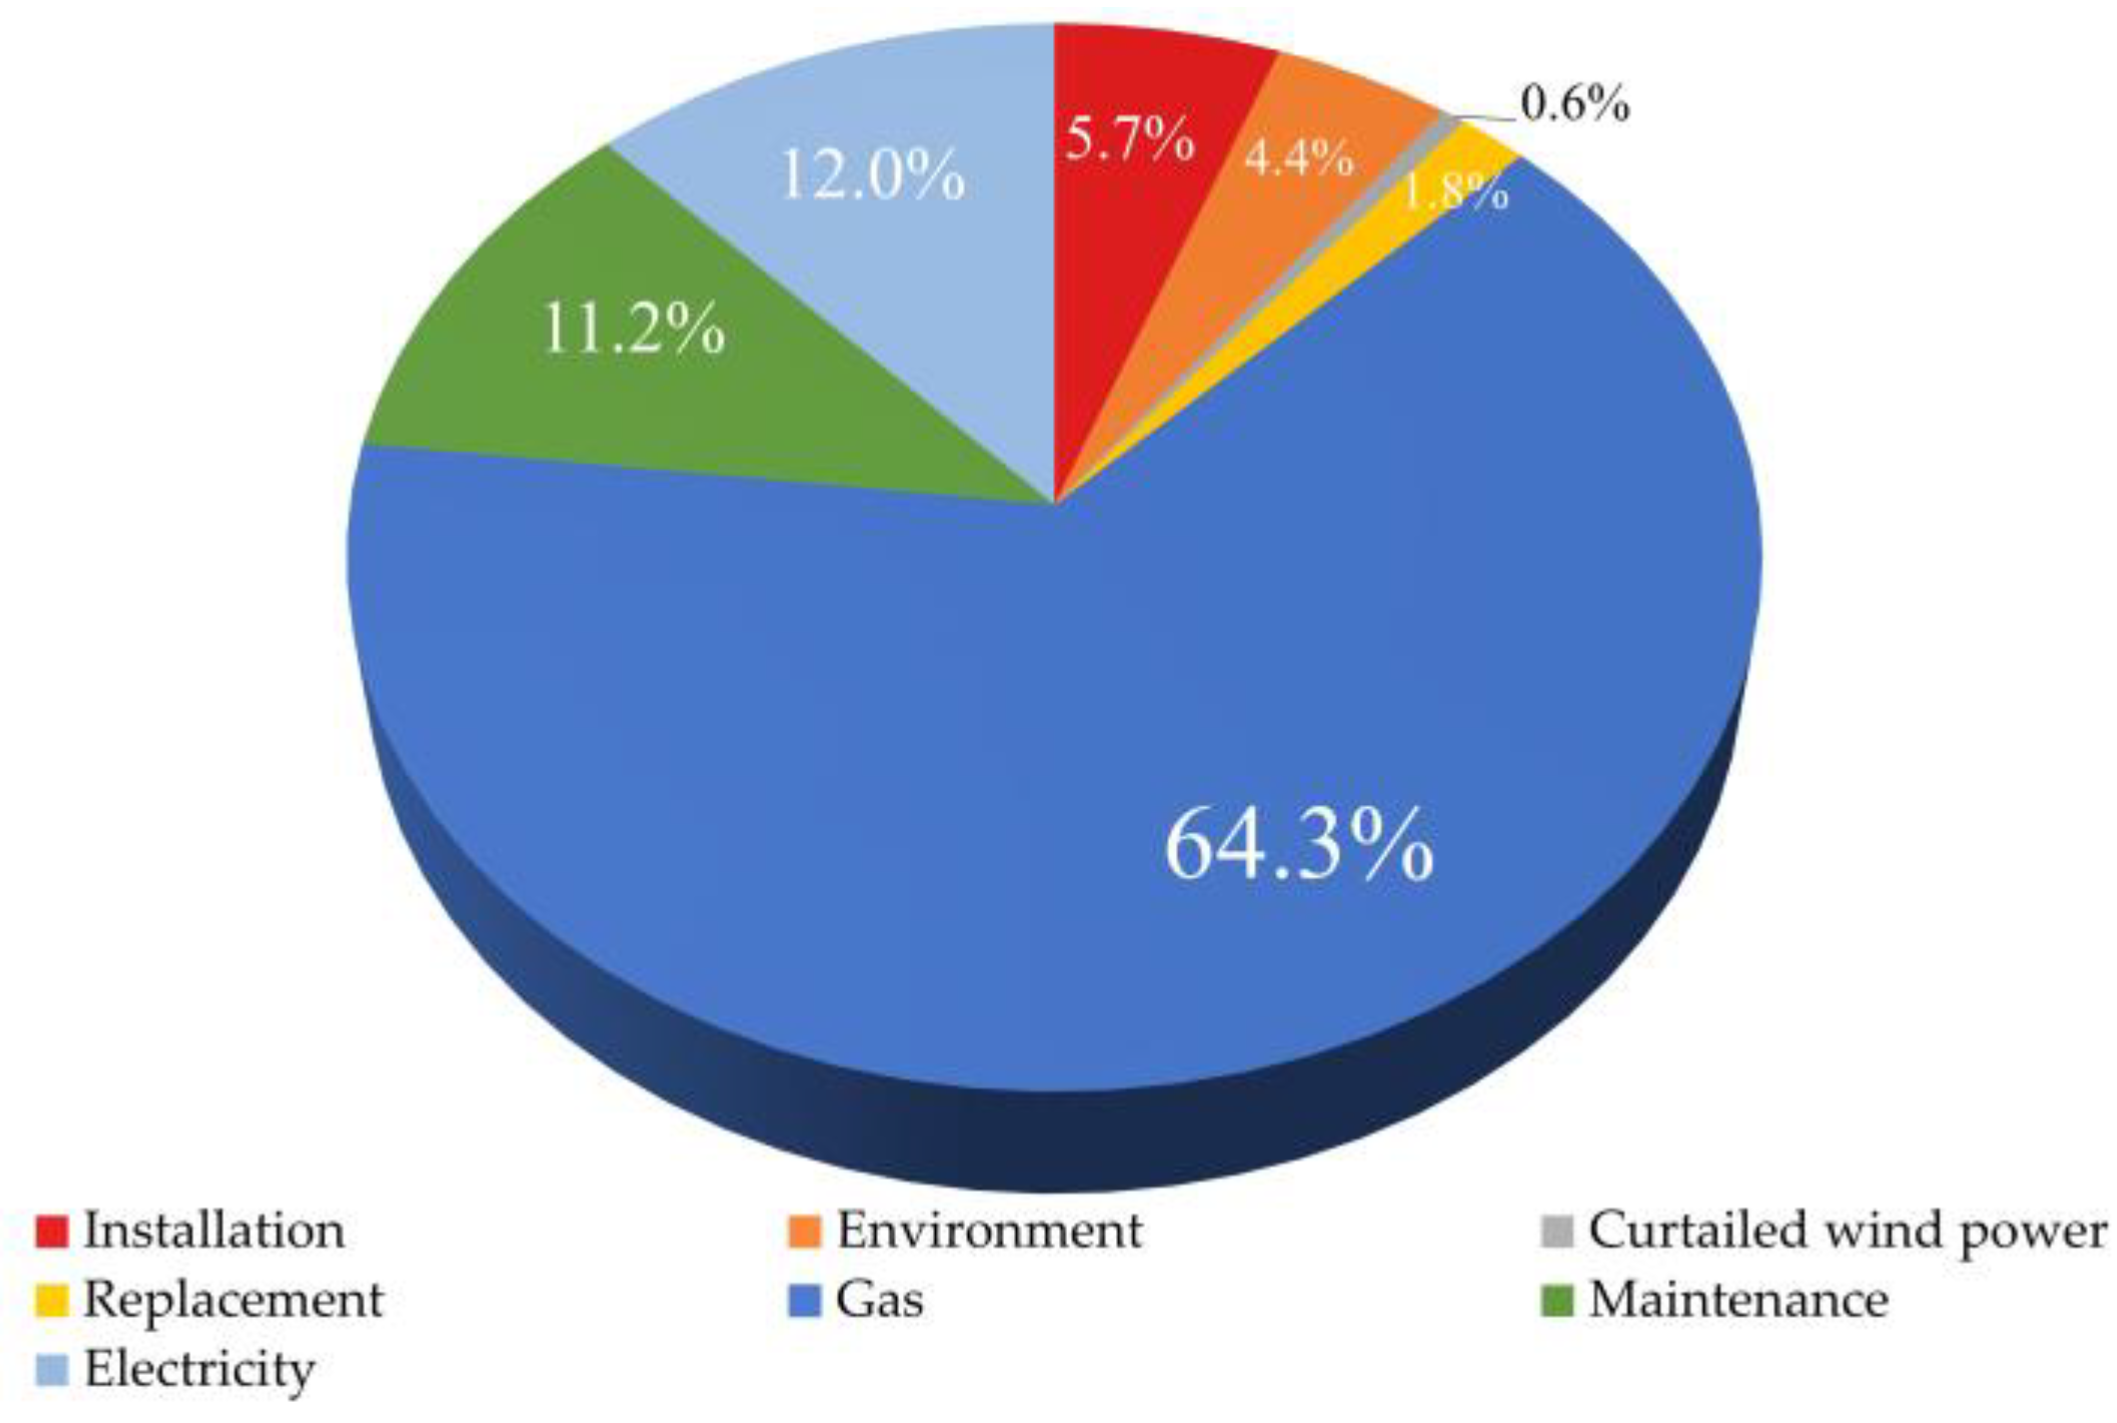
  • Among the planning cases, the improved system in case 5 has the highest installation and replacement costs, but the comprehensive cost and the ability to reduce the curtailed wind power are the best. Compared with the original system, the wind curtailment rate, gas purchase cost, operation cost, and comprehensive cost of the optimized system decreased by 18.8%, 32.3%, 33.8%, and 28.5%, respectively.
  • Through analyzing the scheduling results, it can be observed that P2G and GSHP can promote the consumption of wind power during periods of abundant wind power in the system. In addition, P2G can supply gas during the peak periods of device demand, and GSHP can reduce the pressure of heat supply during the peak periods of heat load.
  • Compared with the standard PSO algorithm, the EDIW-CPSO algorithm not only saves on the scheduling cost, but it also reduces the comprehensive cost and wind curtailment rate in winter. Therefore, the EDIW-CPSO algorithm can obtain better optimal scheduling results, and the corresponding planning scheme is also better.
  • The fluctuation in natural gas prices affects the optimal capacities of P2G and GSHP. In the price range of 40% to 130%, the optimal capacities of two devices gradually increase. In the price range of 160% to 220%, the optimal capacities of the two devices tend to be stable. The upper limit of optimal capacity should be considered in engineering practice, and it is not cost effective to plan for too large a device capacity.

Author Contributions

T.W.: conceptualization, methodology, writing—review and editing; T.H.: writing, software and data curation. H.L.: advising and supervision. All authors have read and agreed to the published version of the manuscript.

Funding

This work was supported by the Henan Provincial Key R&D and Promotion Special Fund (number 222102240072).

Data Availability Statement

Contributions and data are contained within the article.

Acknowledgments

The authors would like to thank the library of North China University of Water Resources and Electric Power for its literature support.

Conflicts of Interest

The authors declare no conflict of interest.

Abbreviations

IESintegrated energy system
P2Gpower to gas
GSHPground source heat pump
CHPcombined heat and power
GBgas boilers
GTgas turbines
ACabsorption chiller
ECelectric chiller

References

  1. He, L.; Lu, Z.; Geng, L.; Zhang, J.; Li, X.; Guo, X. Environmental economic dispatch of integrated regional energy system considering integrated demand response. Int. J. Electr. Power Energy Syst. 2020, 116, 105525. [Google Scholar] [CrossRef]
  2. Yu, B.; Fang, D.; Xiao, K.; Pan, Y. Drivers of renewable energy penetration and its role in power sector’s deep decarbonization towards carbon peak. Renew. Sustain. Energy Rev. 2023, 178, 113247. [Google Scholar] [CrossRef]
  3. Guan, Y.; Shan, Y.; Huang, Q.; Chen, H.; Wang, D.; Hubacek, K. Assessment to China’s recent emission pattern shifts. Earth’s Future 2021, 9, e2021EF002241. [Google Scholar] [CrossRef]
  4. Chen, X.; Kang, C.; O’Malley, M.; Xia, Q.; Bai, J.; Liu, C.; Sun, R.; Wang, W.; Li, H. Increasing the flexibility of combined heat and power for wind power integration in China: Modeling and implications. IEEE Trans. Power Syst. 2014, 30, 1848–1857. [Google Scholar] [CrossRef]
  5. Wu, Y.; Fu, L.; Zhang, S.; Tang, D. Study on a novel co-operated heat and power system for improving energy efficiency and flexibility of cogeneration plants. Appl. Therm. Eng. 2019, 163, 114429. [Google Scholar] [CrossRef]
  6. Tomin, N.; Shakirov, V.; Kozlov, A.; Sidorov, D.; Kurbatsky, V.; Rehtanz, C.; Lora, E.E. Design and optimal energy management of community microgrids with flexible renewable energy sources. Renew. Energy 2022, 183, 903–921. [Google Scholar] [CrossRef]
  7. Gao, C.; Zhang, Z.; Wang, P. Day-Ahead Scheduling Strategy Optimization of Electric–Thermal Integrated Energy System to Improve the Proportion of New Energy. Energies 2023, 16, 3781. [Google Scholar] [CrossRef]
  8. Liu, J.; Sun, W.; Yan, J. Effect of P2G on flexibility in integrated power-natural gas-heating energy systems with gas storage. Energies 2021, 14, 196. [Google Scholar] [CrossRef]
  9. He, C.; Wu, L.; Liu, T.; Shahidehpour, M. Robust co-optimization scheduling of electricity and natural gas systems via ADMM. IEEE Trans. Sustain. Energy 2016, 8, 658–670. [Google Scholar] [CrossRef]
  10. Li, Y.; Zou, Y.; Tan, Y.; Cao, Y.; Liu, X.; Shahidehpour, M.; Tian, S.; Bu, F. Optimal stochastic operation of integrated low-carbon electric power, natural gas, and heat delivery system. IEEE Trans. Sustain. Energy 2017, 9, 273–283. [Google Scholar] [CrossRef]
  11. Zhang, Z.; Wang, C.; Lv, H.; Liu, F.; Sheng, H.; Yang, M. Day-ahead optimal dispatch for integrated energy system considering power-to-gas and dynamic pipeline networks. IEEE Trans. Ind. Appl. 2021, 57, 3317–3328. [Google Scholar] [CrossRef]
  12. Wang, C.; Dong, S.; Xu, S.; Yang, M.; He, S.; Dong, X.; Liang, J. Impact of power-to-gas cost characteristics on power-gas-heating integrated system scheduling. IEEE Access 2019, 7, 17654–17662. [Google Scholar] [CrossRef]
  13. Sun, G.; Chen, S.; Wei, Z.; Chen, S. Multi-period integrated natural gas and electric power system probabilistic optimal power flow incorporating power-to-gas units. J. Mod. Power Syst. Clean Energy 2017, 5, 412–423. [Google Scholar] [CrossRef]
  14. Chen, J.; Ning, K.; Xin, X.; Shi, F.; Zhang, Q.; Li, C. Day-ahead optimal scheduling of an integrated energy system based on a piecewise self-adaptive particle swarm optimization algorithm. Energies 2022, 15, 690. [Google Scholar] [CrossRef]
  15. Jiang, Y.; Guo, L. Research on wind power accommodation for an electricity-heat-gas integrated microgrid system with power-to-gas. IEEE Access 2019, 7, 87118–87126. [Google Scholar] [CrossRef]
  16. Li, G.; Zhang, R.; Jiang, T.; Chen, H.; Bai, L.; Li, X. Security-constrained bi-level economic dispatch model for integrated natural gas and electricity systems considering wind power and power-to-gas process. Appl. Energy 2017, 194, 696–704. [Google Scholar] [CrossRef]
  17. Chen, Z.; Zhang, Y.; Ji, T.; Cai, Z.; Li, L.; Xu, Z. Coordinated optimal dispatch and market equilibrium of integrated electric power and natural gas networks with P2G embedded. J. Mod. Power Syst. Clean Energy 2018, 6, 495–508. [Google Scholar] [CrossRef]
  18. Siqin, Z.; Niu, D.; Wang, X.; Zhen, H.; Li, M.; Wang, J. A two-stage distributionally robust optimization model for P2G-CCHP microgrid considering uncertainty and carbon emission. Energy 2022, 260, 124796. [Google Scholar] [CrossRef]
  19. Wang, X.; Li, H. Multi-objectives combined electric heating dispatch model of wind power accommodation with heat storage device. J. Eng. 2017, 2017, 1539–1545. [Google Scholar] [CrossRef]
  20. Ma, Y.; Yu, Y.; Mi, Z. Accommodation of curtailed wind power by electric boilers equipped in different locations of heat-supply network for power system with CHPs. J. Mod. Power Syst. Clean Energy 2021, 9, 930–939. [Google Scholar] [CrossRef]
  21. Zhou, Y.; Zhao, P.; Xu, F.; Cui, D.; Ge, W.; Chen, X.; Gu, B. Optimal dispatch strategy for a flexible integrated energy storage system for wind power accommodation. Energies 2020, 13, 1073. [Google Scholar] [CrossRef]
  22. Wang, J.; Chen, Y.; Dou, C.; Gao, Y.; Zhao, Z. Adjustable performance analysis of combined cooling heating and power system integrated with ground source heat pump. Energy 2018, 163, 475–489. [Google Scholar] [CrossRef]
  23. Zhang, Z.L.; Zhang, H.J.; Xie, B.; Zhang, X.T. Energy scheduling optimization of the integrated energy system with ground source heat pumps. J. Clean. Prod. 2022, 365, 132758. [Google Scholar] [CrossRef]
  24. Li, B.; Hu, P.; Zhu, N.; Lei, F.; Xing, L. Performance analysis and optimization of a CCHP-GSHP coupling system based on quantum genetic algorithm. Sustain. Cities Soc. 2019, 46, 101408. [Google Scholar] [CrossRef]
  25. Cui, Y.; Jiang, T.; Zhong, W.; Cui, C.; Zhao, Y. Source-load coordination economic dispatch method for regional integrated energy system considering wind power accommodation. Power Syst. Technol. 2020, 44, 2474–2483. [Google Scholar] [CrossRef]
  26. Sun, Q.; Gao, S.; Xie, D.; Chen, J.; Chen, Q. Optimum planning for integrated community energy system with coordination of reliability and economy. Proc. CSU-EPSA 2020, 32, 76–82. [Google Scholar] [CrossRef]
  27. Jin, T.; Li, N.; Qin, J.; Li, T.; Li, Y.; Pan, C. Optimization allocation of integrated energy system based on mixed integer nonlinear programming. Therm. Power Gener. China 2021, 50, 131–140. [Google Scholar] [CrossRef]
  28. Wang, L. Optimal Scheduling Strategy for Multi-Energy Microgrid Considering Integrated Demand Response. Energies 2023, 16, 4694. [Google Scholar] [CrossRef]
  29. Zeng, L.; Xu, J.; Wu, M.; Tang, J.; Wu, Q.; Wang, Q.; Fan, G. Day-ahead interval optimization for CCHP system considering uncertainty of wind power and PV. Int. J. Electr. Power Energy Syst. 2022, 138, 107895. [Google Scholar] [CrossRef]
  30. Li, Z.; Zhang, Z. Day-ahead and intra-day optimal scheduling of integrated energy system considering uncertainty of source & load power forecasting. Energies 2021, 14, 2539. [Google Scholar] [CrossRef]
  31. Luo, Z.; Wang, J.; Xiao, N.; Yang, L.; Zhao, W.; Geng, J.; Lu, T.; Luo, M.; Dong, C. Low Carbon Economic Dispatch Optimization of Regional Integrated Energy Systems Considering Heating Network and P2G. Energies 2022, 15, 5494. [Google Scholar] [CrossRef]
  32. Wang, Y.; Huang, F.; Tao, S.; Ma, Y.; Ma, Y.; Liu, L.; Dong, F. Multi-objective planning of regional integrated energy system aiming at exergy efficiency and economy. Appl. Energy 2022, 306, 118120. [Google Scholar] [CrossRef]
  33. Bhamidi, L.; Sivasubramani, S. Optimal planning and operational strategy of a residential microgrid with demand side management. IEEE Syst. J. 2019, 14, 2624–2632. [Google Scholar] [CrossRef]
  34. Yang, X.; Chen, Z.; Huang, X.; Li, R.; Xu, S.; Yang, C. Robust capacity optimization methods for integrated energy systems considering demand response and thermal comfort. Energy 2021, 221, 119727. [Google Scholar] [CrossRef]
  35. Chai, G.; Wu, J.; Yao, L.; Zhang, Q. Operation optimization of combined cooling, heating and power microgrid based on improved dynamic inertia weighted particle swarm algorithm. Sci. Technol. Eng. 2022, 22, 1472–1479. [Google Scholar] [CrossRef]
  36. Lu, B.; Wei, Z.; Wei, P.; Guo, Y.; Huang, Y.; Ma, X.; Zhou, F. Optimal configuration of PtG and energy storage equipment in regional integrated energy system considering wind power consumption. Smart Power 2021, 49, 7–14+68. [Google Scholar] [CrossRef]
  37. Götz, M.; Lefebvre, J.; Mörs, F.; Koch, A.M.; Graf, F.; Bajohr, S.; Reimert, R.; Kolb, T. Renewable Power-to-Gas: A technological and economic review. Renew. Energy 2016, 85, 1371–1390. [Google Scholar] [CrossRef]
  38. Tschiggerl, K.; Sledz, C.; Topic, M. Considering environmental impacts of energy storage technologies: A life cycle assessment of power-to-gas business models. Energy 2018, 160, 1091–1100. [Google Scholar] [CrossRef]
  39. Ma, Z.; Xia, L.; Gong, X.; Kokogiannakis, G.; Wang, S.; Zhou, X. Recent advances and development in optimal design and control of ground source heat pump systems. Renew. Sustain. Energy Rev. 2020, 131, 110001. [Google Scholar] [CrossRef]
  40. Martinez, S.; Michaux, G.; Salagnac, P.; Bouvier, J.L. Micro-combined heat and power systems (micro-CHP) based on renewable energy sources. Energy Convers. Manag. 2017, 154, 262–285. [Google Scholar] [CrossRef]
  41. Lu, J.; Hu, H.; Bai, Y. Generalized radial basis function neural network based on an improved dynamic particle swarm optimization and AdaBoost algorithm. Neurocomputing 2015, 152, 305–315. [Google Scholar] [CrossRef]
  42. Yang, W.; Zhou, X.; Chen, M. New Chaotic Simplified Particle Swarm Optimization Algorithm Based on Logistic Mapping. Comput. Mod. 2019, 12, 15–20+26. [Google Scholar] [CrossRef]
  43. Bao, X.; Ding, W.; Song, A. Chaotic compression nonlinear particle swarm optimization algorithm for job shop scheduling problem. Mod. Manuf. Eng. 2020, 9, 15–22+52. [Google Scholar] [CrossRef]
  44. Xiong, J.; Jiao, Y.; Wang, M. A Day-Ahead Optimal Scheduling of Regional Integrated Energy System Considering Power to Gas. Mod. Electr. Power 2022, 39, 554–561. [Google Scholar] [CrossRef]
Figure 1. Improved integrated energy system structure.
Energies 17 01447 g001
Figure 2. The chemical process of P2G.
Energies 17 01447 g002
Figure 3. The heating process of GSHP.
Energies 17 01447 g003
Figure 4. Flow diagram of bi-layer model.
Energies 17 01447 g004
Figure 5. Optimal scheduling framework of inner-layer model.
Energies 17 01447 g005
Figure 6. Curves of cooling, heating, power load and wind power on typical days.
Energies 17 01447 g006aEnergies 17 01447 g006b
Figure 7. Comparison of costs in five cases.
Energies 17 01447 g007
Figure 8. Curtailed wind power after scheduling on typical days.
Energies 17 01447 g008
Figure 9. Scheduling results for each device on typical day of winter.
Energies 17 01447 g009
Figure 10. Scheduling results for each device on typical day of transitional season.
Energies 17 01447 g010
Figure 11. Scheduling results for each device on typical day of summer.
Energies 17 01447 g011
Figure 12. Iterative process of the two algorithms.
Energies 17 01447 g012
Figure 13. Comparison of the results under two algorithms. (a) Comprehensive cost; (b) Wind curtailment rate.
Energies 17 01447 g013
Figure 14. Composition of comprehensive cost in Case 5.
Energies 17 01447 g014
Figure 15. Influence of natural gas price fluctuation on IES system.
Energies 17 01447 g015
Table 1. Optimal results of scheduling algorithm with different initial conditions.
Algorithm NameOperation Cost in Winter/CNYOperation Cost in Summer/CNYOperation Cost in Transitional
Season/CNY
Standard PSO78,70990,63455,137
EDIW-CPSO73,12085,47351,713
Table 2. Time-of-use price.
Types of Electricity UsageTimePrice/(CNY/kW)
Demand valley00:00–07:000.43
23:00–24:00
Normal demand07:00–11:000.88
16:00–19:00
22:00–23:00
Demand peak11:00–16:001.12
19:00–22:00
Table 3. Parameters of existing devices.
Device NameSymbolCapacity/kWMaintenance Price/(CNY/kW)Efficiency/%
Combined heating and power unitCHP70000.05electricity 0.35/heat 0.5
Heat storage tankHS20000.015charge 0.9/loss 0.05
Gas boilerGB20000.01heat 0.9
Electric chillerEC15000.01cooling 3.1
Absorption chillerAC44000.005cooling 1.25
Table 4. Parameters of candidate planning devices.
Equipment NameSymbolInstallation Price
/(CNY/kW)
Maintenance Price
/(CNY/kW)
Efficiency/%Service Time/Year
Power to gasP2G70000.0320
Ground source heat pumpGSHP90000.036Heat 4.0
Cooling 4.7
20
Table 5. Results of optimal planning in each case.
Capacity of P2G/kWCapacity of GSHP/kWWind Curtailment RateComprehensive Cost/CNY
Case 10019.5%108,071
Case 2340004.0%99,011
Case 3022003.6%80,763
Case 4023503.4%79,510
Case 5105019000.7%77,252
Table 6. Composition of comprehensive cost in each case.
Case 1Case 2Case 3Case 4Case 5
Operation cost/CNY108,07193,32676,03474,51671,496
Installation cost/CNY04334360538194388
Replacement cost/CNY01351112411751368
Wind curtailment cost/CNY13,121269124222288471
Gas purchase cost/CNY73,34769,52351,74551,09149,682
Comprehensive cost/CNY108,07199,01180,76379,51077,252
Table 7. Optimal scheduling results of each algorithm.
Algorithm NameWind Curtailment Cost
/CNY
Energy Purchase Cost
/CNY
System Operation Cost
/CNY
Standard PSO69670,03778,709
EDIW-CPSO64765,81673,120
Table 8. Results in each case under standard PSO scheduling.
Capacity of P2G/kWCapacity of GSHP/kWWind Curtailment RateComprehensive Cost/CNY
Case 10022.8%112,243
Case 2320004.7%103,251
Case 3021504.0%85,142
Case 4022503.9%83,930
Case 595018500.8%81,797
Disclaimer/Publisher’s Note: The statements, opinions and data contained in all publications are solely those of the individual author(s) and contributor(s) and not of MDPI and/or the editor(s). MDPI and/or the editor(s) disclaim responsibility for any injury to people or property resulting from any ideas, methods, instructions or products referred to in the content.

