1. Introduction
The reliability of power systems relies on the technical condition of all the devices and elements installed in them. One of the most expensive devices, playing a crucial role, is a power transformer. Its significance in power systems, along with the constantly increasing average age of the transformer population, has led to the development of many diagnostic methods, including modern advanced tests, measurements, and analyses [
1,
2]. One major aspect of a transformer’s technical state is its mechanical condition, characterized by good clamping and the absence of deformations in the windings and the core. Two methods are utilized for assessing a transformer’s mechanical condition: frequency response analysis (FRA) and the vibroacoustic method (VM). Each of these methods enables the detection of mechanical problems in the windings and core of a transformer, with each method being based on different physical phenomena. The goal of the paper is to develop an assessment tool that is suitable for interpreting the results obtained from both complementary test methods: FRA and VM.
The fundamental assumptions of the FRA method are based on the relationship between the transfer function and the winding construction. If the winding geometry changes, for instance, due to the displacement of a single turn, coil, or a larger winding fragment, the capacitance and inductance values of the coils change, thus altering the FRA characteristics when measured over a wide frequency range. The assessment of winding deformation is conducted by comparing the measured characteristics to “fingerprint” curves recorded over particular time intervals or on similar units.
A very important element of the diagnostics of the active part of the transformer is vibration tests of the unit structure. In general, the vibroacoustic method involves recording the vibration acceleration signal of the transformer tank, and subsequently numerically analyzing the obtained data. The mathematical tools that are primarily used in vibroacoustic research include Fourier transform (and, less frequently, wavelet transform), with diagnostic conclusions focusing on the mechanical condition of the active part. An assessment of the mechanical condition of the active part using the VM method, similar to FRA, entails a comparison of the recorded frequency spectrum of the vibration signal with a standard spectrum or one measured at specific time intervals.
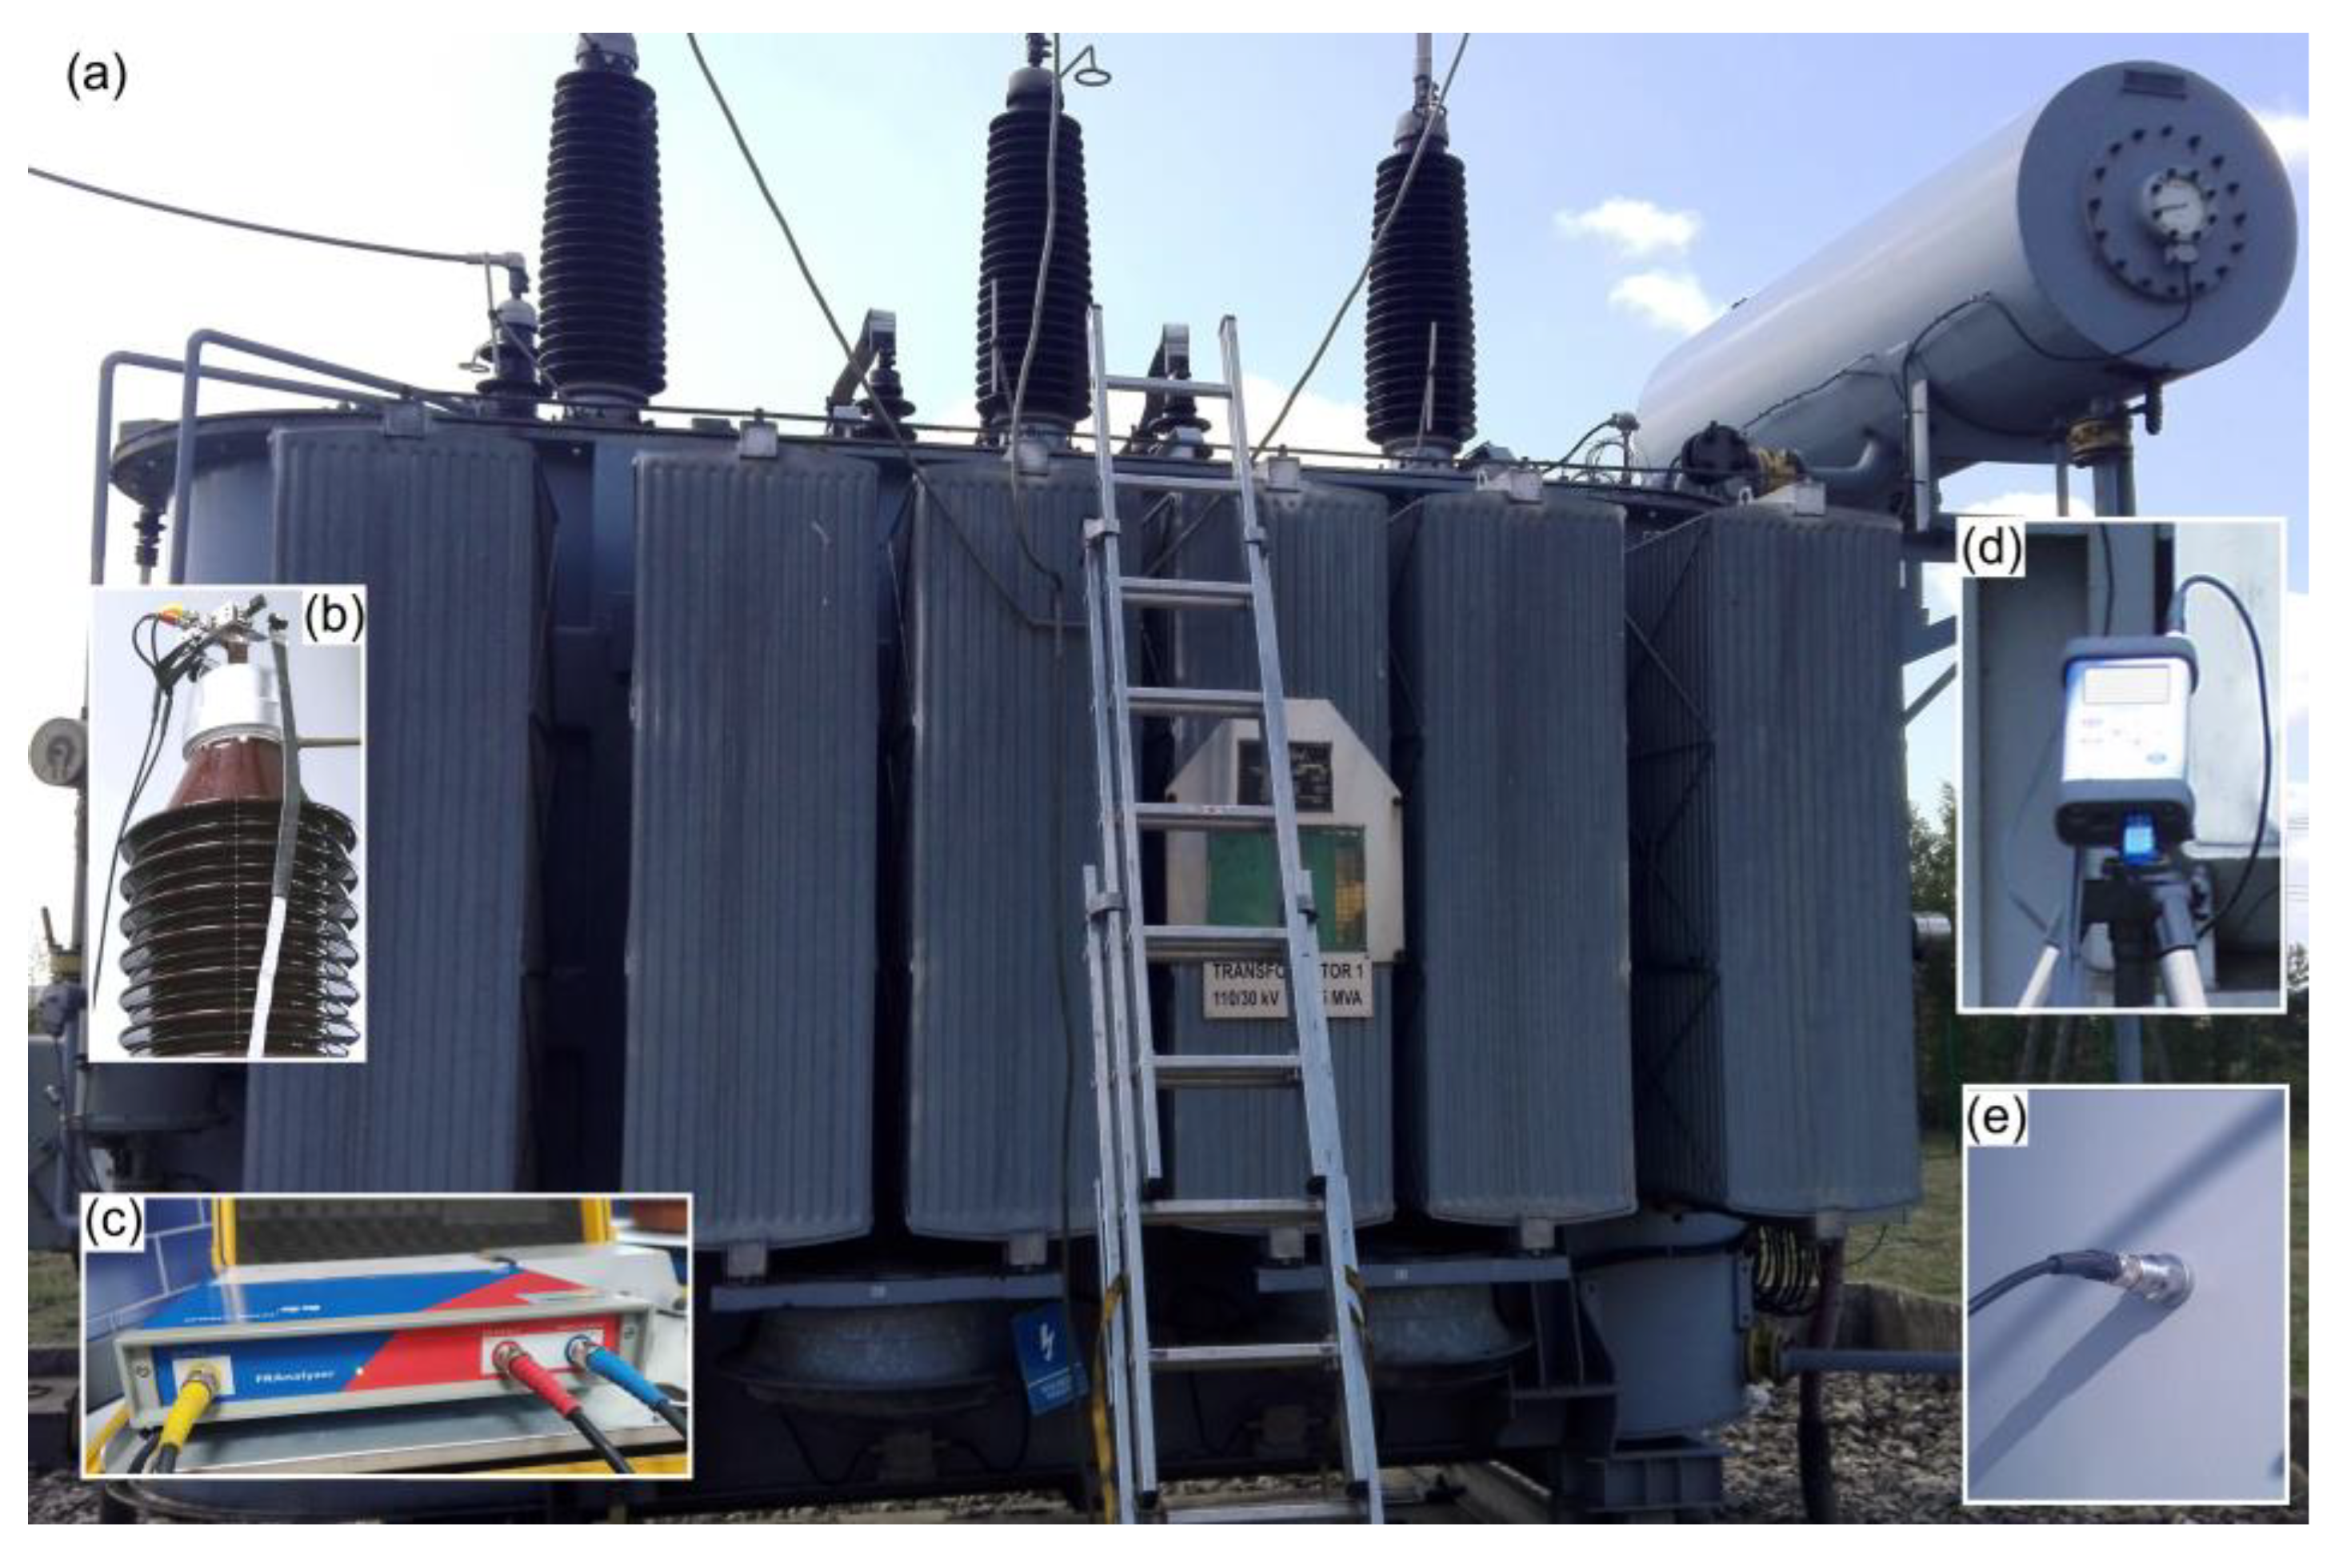
Figure 1 presents one transformer, tested with both methods, for the analysis presented in this paper, and devices connected to the bushing (FRA) and tank (VM) of this transformer.
One method for assessing the technical state of power transformers involves the use of various health indices (HI), which serve as vital indicators of the transformer’s overall condition and performance. HIs offer valuable insights into the operational efficiency, reliability, and potential risks associated with these critical electrical assets [
3]. By evaluating factors such as temperature, oil quality, and insulation, the health index enables maintenance teams to make informed decisions and take proactive measures to ensure the longevity and optimal functioning of power transformers [
4]. The most common application of HIs is in interpreting oil test results [
5], although some also incorporate paper insulation quality [
6], while others are used for analyzing a large population of transformers with multiple diagnostic methods [
7]. Currently, numerous numerical indices have been described in the literature that can be employed for analyzing FRA or VM results separately [
8]. However, none of these indices are perfect, leading to a lack of standards in the field of results’ analysis. Additionally, there are no tools specifically designed for assessing the mechanical condition of the transformer’s active part, comprising both windings and the core. The objective of the presented research is to introduce a quality index (QI), along with guidelines for its application in evaluating complementary FRA and VM test method measurement results. The proposed QI, if applied to both methods, could serve as a highly useful tool in the industrial diagnostics of power transformers.
2. The Analysis of FRA and VM Measurement Results
The FRA and VM methods can be utilized for joint analysis as their results are complementary, as described by the authors in [
9]. The VM method is based on analyzing the vibrations generated by the core and windings separately, which can be recorded both in a transient state (caused by the inrush current in windings) and steady state (caused by the magnetostriction phenomenon in the core). The vibrations of the active part are recorded using an accelerometer sensor attached to the tank of the transformer unit [
10] (see
Figure 1). The process of VM diagnosis is most effective when the transformer is operating without load. Under such conditions, the influence of the load current on the vibration of the active part is eliminated. When estimating the mechanical conditions of the core, the signal of steady vibrations during the operation of the transformer without load is analyzed. The main source of information is the amplitude-frequency spectrum of the vibration signal, specifically the normalized changes in the power spectral density
ar(
f) [
11]. The
ar(
f) curve of the diagnosed transformer is compared to the curve of a perfect unit and to the curves recorded in the group of similar units.
The FRA method compares the reference (so-called fingerprint) and actual response of the active part to a low-voltage sine signal in a wide frequency spectrum, which is typically presented as Bode plots of signal damping and phase angle changes that occur during logarithmic frequency changes. The FRA test setup is directly connected to the bushings of the transformer, allowing for non-invasive testing [
12] (see
Figure 1). The methods of frequency response (FR) measurement are standardized [
13] and repetitive. The shape of the recorded curves depends on the complex RLC system representing the transformer’s construction; changes in the windings’ geometry influence the shape of the recorded frequency curve.
Each diagnostic method requires appropriate tools for analyzing the test results. In the case of FRA and VM methods, the curves used for comparison can be directly assessed by experienced staff, especially those with a large database of test results from other units, including faulty ones. However, introducing mathematical tools for interpretation, such as numerical indices, can simplify the process. Many numerical indices have been described in the literature, but the main challenge lies in defining threshold values for the returned of data analysis [
8,
14]. The test data can be analyzed across the entire recorded frequency range, which, according to the standard [
13], spans from 20 Hz to 2 MHz. This range can be subdivided into subranges, with the medium frequency range containing the most critical information on the mechanical condition of the transformer.
The analysis of the frequency response test results can rely on health indices, which are widely employed in transformer diagnostics to evaluate the results obtained from various test methods and for planning operation and repairs. However, the application of numerical indices in the VM method to determine the mechanical state of the core requires addressing several challenges related to diagnostic technology: selecting the location of the accelerometer sensor, minimizing the impact of vibrations from external tank elements [
9], and, primarily, determining the threshold values of the quality index.
3. Quality Index for Assessment of Complementary FRA and VM Results
Numerical quality indicators (Qis) are frequently employed to identify and classify transformer defects, with definitions based on quantities from mathematical statistics. This diagnostic inference method is increasingly utilized, particularly in FRA diagnostics. Algorithms for calculating quality indicators have been detailed in numerous scientific works, with an overview of their properties provided in [
15].
A similar approach, involving the calculation of a quality index to ascertain the similarity between the curve obtained from measurement and a reference curve, can also be applied in the vibroacoustic diagnosis of the active part, especially the core, using the vibroacoustic method (VM). The quality indicator (indicating similarity to the reference curve) of the analyzed curve should consider features such as the shape similarity, average value, and dynamic range of changes in measured values. The incorporation of multiple factors enhances the reliability of the quality indicator.
The analysis of conclusions in numerous publications, such as [
16] and others cited in this study, indicates that the Pearson linear correlation coefficient (CC) best reflects the similarity of curve shapes, but it lacks sensitivity to changes in the amplitude of the analyzed dataset.
In this study, we propose utilizing the quality indicator (QI), whose definition considers the similarity of shapes, average values, and dynamics of changes between two compared datasets, based on their probabilistic properties [
17].
A
x (
f) = {
X:
xi|
i = 1, 2, …,
N} and B
y (
f) = {
Y:
yi|
i = 1, 2, …,
N} are sets of points representing two compared curves of FR amplitude depending on the frequency dependency from frequency f. In the case of the VM method A
x (
f) and B
y (
f) are sets of points representing two compared curves
ar (
f), which are also included in frequency function
f, assuming
X and
Y are the data from the two compared sets in FRA and VM diagnostics. In order to detect the differences between these two graphs, two quality indices are proposed: the frequency response quality index FRQI and vibroacoustic quality index VQI. For both methods, FRA and VM, these can be defined as follows:
where factor
S represents the shape similarity of both curves,
M represents the similarity of the mean values, and
G represents the similarity of gradients—the dynamics of changes (spread) in the analyzed dataset. All factors from Equation (1) are determined for a finished set of frequencies
f = {
fi|
i = 1, 2, …,
N} in the range
fmin ≤
fi ≤
fmax, where
fmin =
f1 and
fmax =
fN. The
S factor is simply the Pearson CC linear correlation coefficient and is “responsible” for detecting discrepancies in the shapes of the curves illustrating the diagnosed data set A
x and reference set B
y:
where
σXY is a covariance, and
σX and
σY are standard deviations of datasets A
x and B
y (vectors
X and
Y) [
18,
19].
The shape similarity coefficient is calculated using the moving window method, similarly to the calculation of, for example, a moving average. Two sets of data are compared {
X:
xi|
i = 1, 2, …,
N} and {
Y:
yi|
i = 1, 2, …,
N} and, using the definitions of standard deviation and covariance, vector
S is calculated, the subsequent elements of which are defined as follows:
where 2
K + 1 is the number of window elements, and
μXi and
μYi are average values of
xi and
yi for
I ∈ <
K + 1,
N −
K>. Thus, the following holds:
The calculated vector of shape similarity coefficients
S will contain
N − 2
K elements with subsequent indices from
K + 1 to
N −
K. Each of the elements
Si =
S(
fi) because, in the case of both FRA and VM, the domain of the compared data sets is the frequency vector
f = {
fi|
i = 1, 2, …,
N}. The calculation of the values of the
M and
G factors was based on the definition of the harmonic mean. In the general case, the harmonic mean of the set of numbers {
ai|
i = 1, 2, …,
Na} is described by the following formula:
In the case of two numbers:
Formula (6) can be modified to the following form:
from which we can obtain the normalized harmonic mean.
The calculation results are consistent with (7), which, being a dimensionless value, can be treated as a measure of the similarity between two numbers.
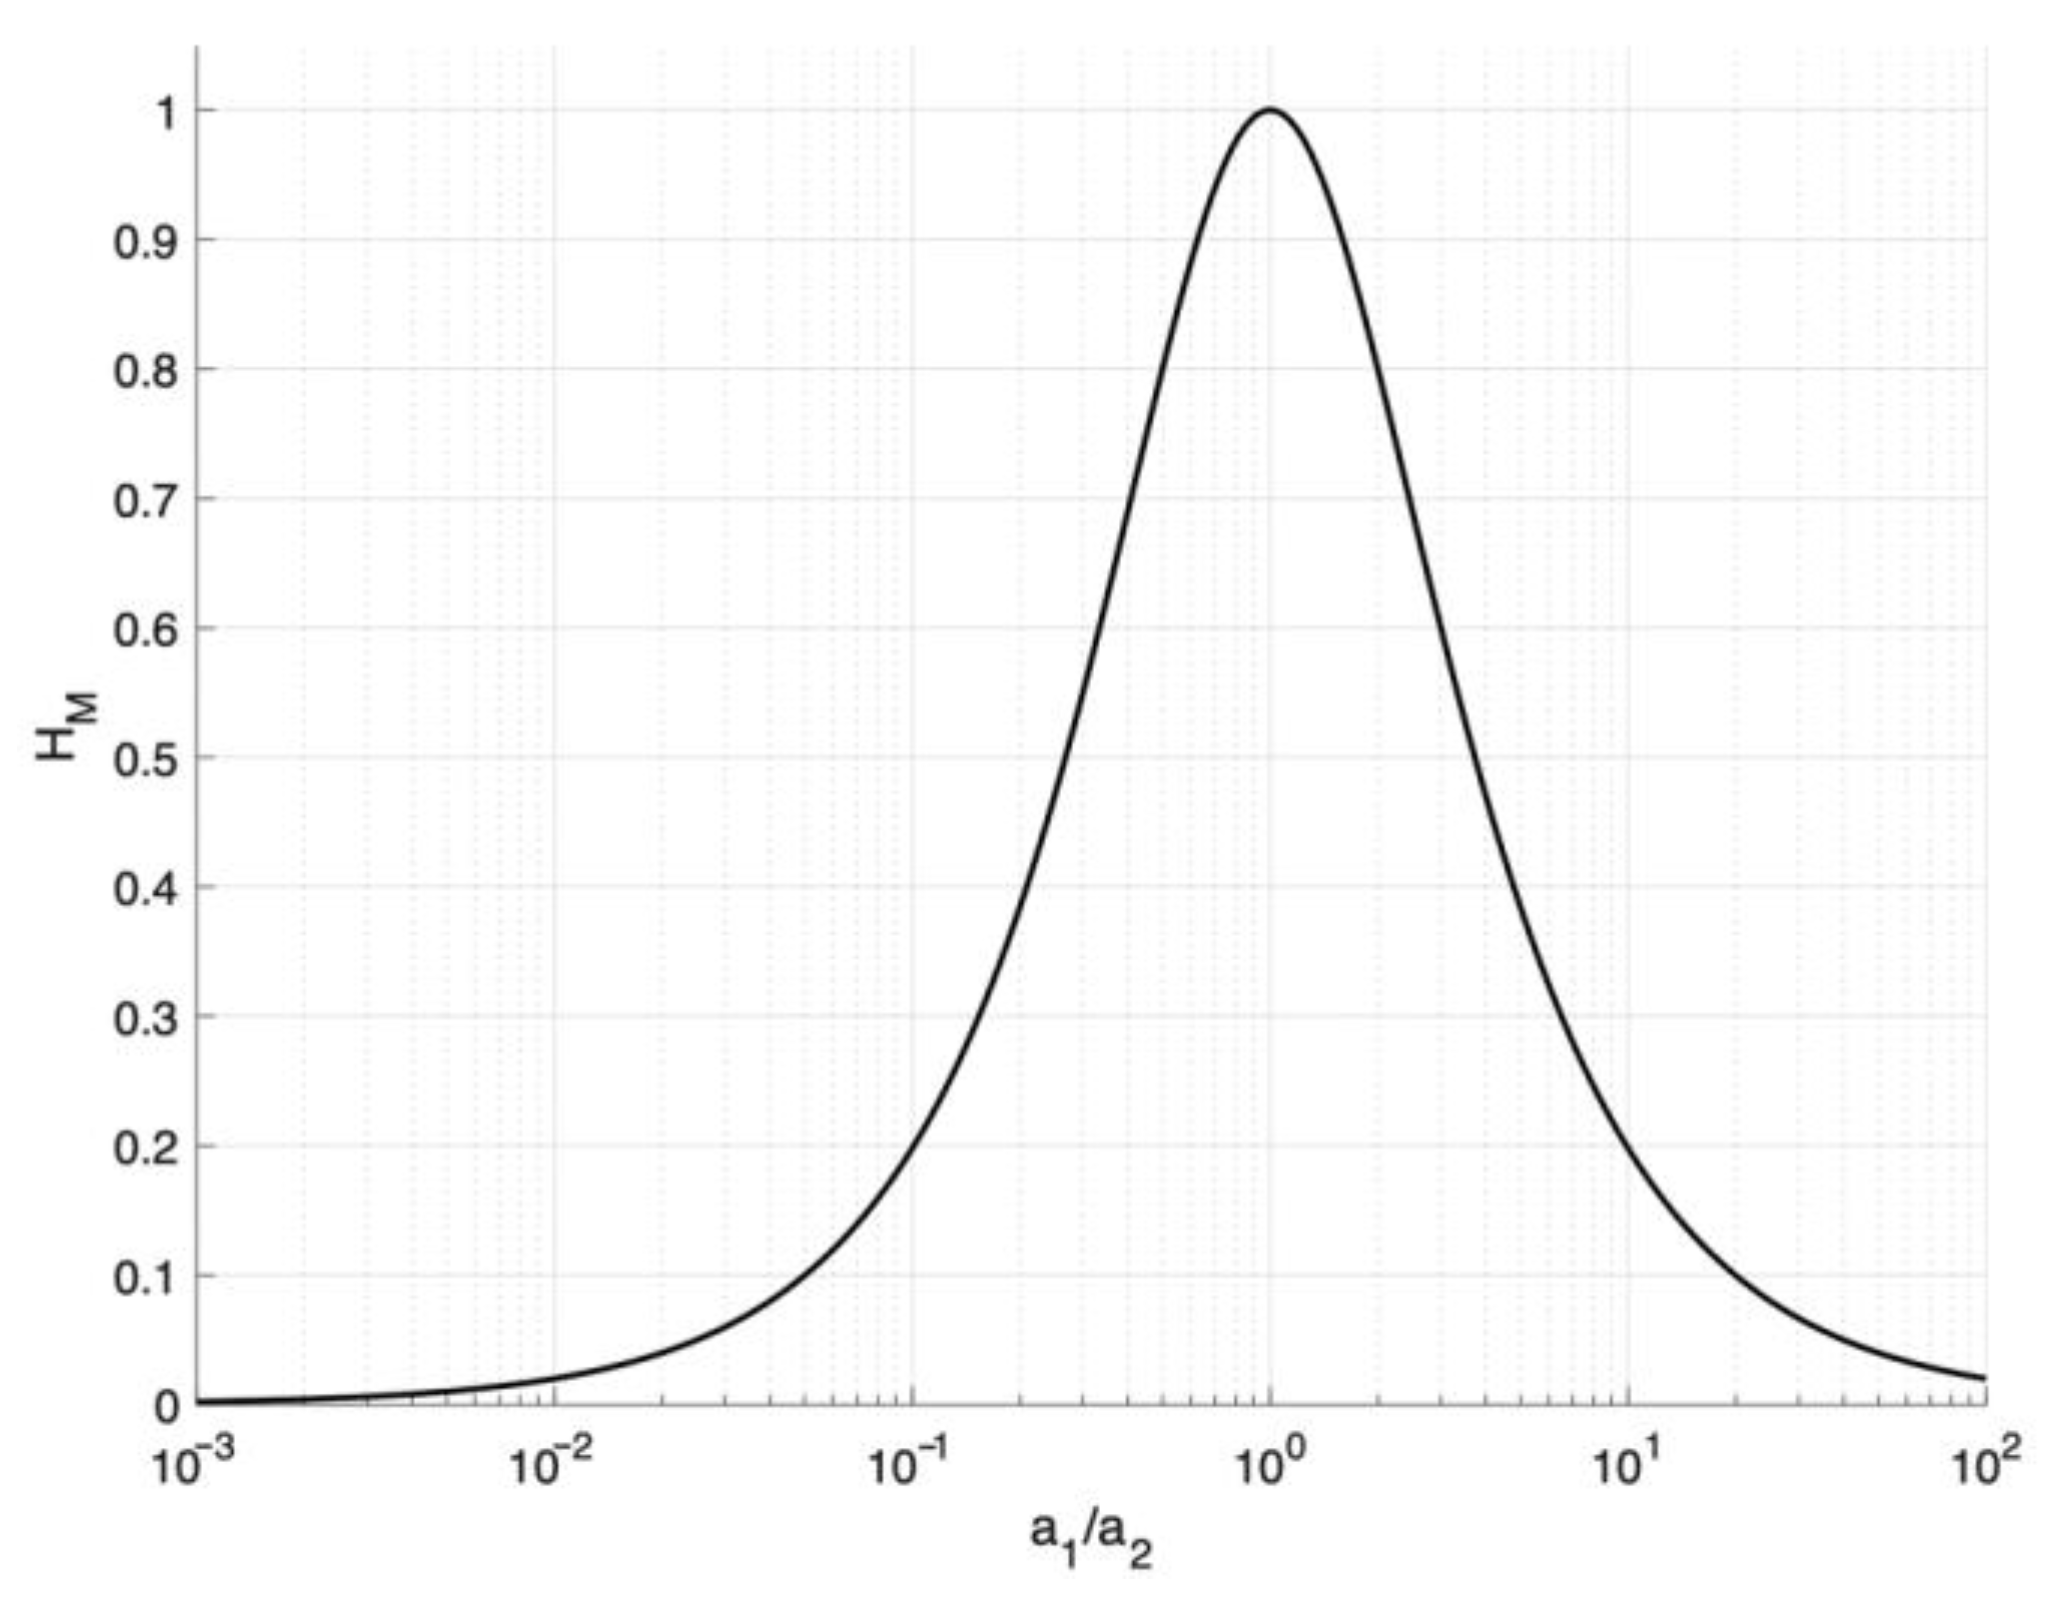
Figure 2 presents the dependence of the
HM value on
a1/
a2.
Figure 2 shows that the values of the normalized harmonic mean (similarity measure) of two numbers range from 0 to 1. In the case of
a1 =
a2, the value of
HM = 1, however, where the compared numbers differ significantly, the value of
HM decreases, reaching zero. Using Formula (7), the following definitions of factors
M and
G are proposed—the similarity of the mean values and gradients, respectively:
For calculations performed using the moving window method, in the next step (next window position), when determining the similarity coefficient of average values, we obtain the following:
where
μXi and
μYi are the mean values, described with (4).
When determining the gradient similarity coefficient, standard deviations are also compared using the sliding window method, and then, for the next
i position of the window, the value of the
Gi coefficient, taking into account the definition of the standard deviation, is described by the following formula:
Similarly to the case when determining the shape similarity coefficient S, the calculated vectors of the similarity coefficients of the mean values M and gradients G will contain N − 2K elements, with subsequent indices ranging from K + 1 to N − K. For each of the elements, Mi = M(fi) and Gi = G(fi), because, in the case of both FRA and VM, the domain of the compared data sets is the frequency vector f = {fi|i = 1, 2, …, N}. Finally, according to relationship (1), a QI vector can be determined for FRA or vibroacoustic VM diagnostics, which will contain N − 2K elements QIi= QI(fi). The values of the M and G similarity coefficients range from 0 to 1. A value of zero means that the average value (M coefficient) and the dynamic range (G coefficient) of the compared data sets differ significantly from each other. The S factor values range from −1 to 1. This factor has value 1 (the best case) for the linear dependency between variables X and Y; thus, when yi = axi + b for all i = 1, 2, …, N, where a and b are constant and a > 0. In such a case (similar curve shape), relative similarity (differences) will be determined by M and G. Finally, the FRQI or VMQI value will range from −1 to 1. For the case when a < 0 (the dependency between X and Y is still linear), the value of the coefficient S = −1. This means that the analyzed curves are mirror images of one another (at 180°).
In diagnostics, one can utilize “momentary” QI values (for individual frequencies) from a specific frequency range or a global value, defined as the arithmetic mean for the entire spectrum of the frequency range under consideration. If necessary, diagnostic analysis in terms of individual S, M, or G factors may also be considered.
In the subsequent sections of the study, the graphs will display the “momentary” values of the QI coefficients. For the comparative analysis of the presented sample diagnostic tests, global values were utilized.
The FRQI method has been tested on numerous transformers to increase its experience and propose criteria for the assessment of analyzed data. In this paper, it will be introduced into industrial analysis, along with vibroacoustic measurement (VM)—a method based on different physical phenomena and complementary to the FRA method.
4. Assessment of FRA Data with Frequency Response Quality Index
For the analysis with FRQI (and with VQI in
Section 5) a group of transformers was chosen, for which both FRA and vibroacoustic data were available and there were several representatives of the same construction: 110 kV/33 kV, 31.5 MVA, and YNd11. This allowed for a comparison of the data, as follows:
Each unit vs. average value for the whole group, which contains the given unit;
Average value vs. transformer of the same type, but not included in the average;
For each transformer in time intervals (the same transformer, with measurements taken a few years later).
All FR measurements were performed in an end-to-end open setup and only data for phase A are presented in this research, to reduce the number of instances. However, in practical diagnostics, all three phases should be analyzed. The frequency range under consideration ranged from approximately 3 kHz to 360 kHz, which represents the medium frequencies of this type of transformer, in which mechanical faults in the windings can be detected. FR measurements were recorded with the commercial devices Omicron FRAnalyser (for older measurements) and FRANEO (newer measurements), according to the standard [
13].
The transformer group contains four units (marked as T1, T2, T3, and T4), all measured in 2015. First, they were compared with the FRQI global value (a single number for the whole frequency range) in pairs, to check the similarities between their FR data. The results are presented in
Table 1.
The value of FRQI varies from 0.81 to 0.97 in this group of transformers, reflecting natural, slight differences in their construction and their different operational histories. At the time of measurement (2015), all units were considered to be in good technical condition, based on several different transformer diagnostic methods. Thus, an analysis based solely on the comparison presented in
Table 1 would not be sufficient to clearly detect a slightly faulty unit, such as the development of deformation at an early stage of winding.
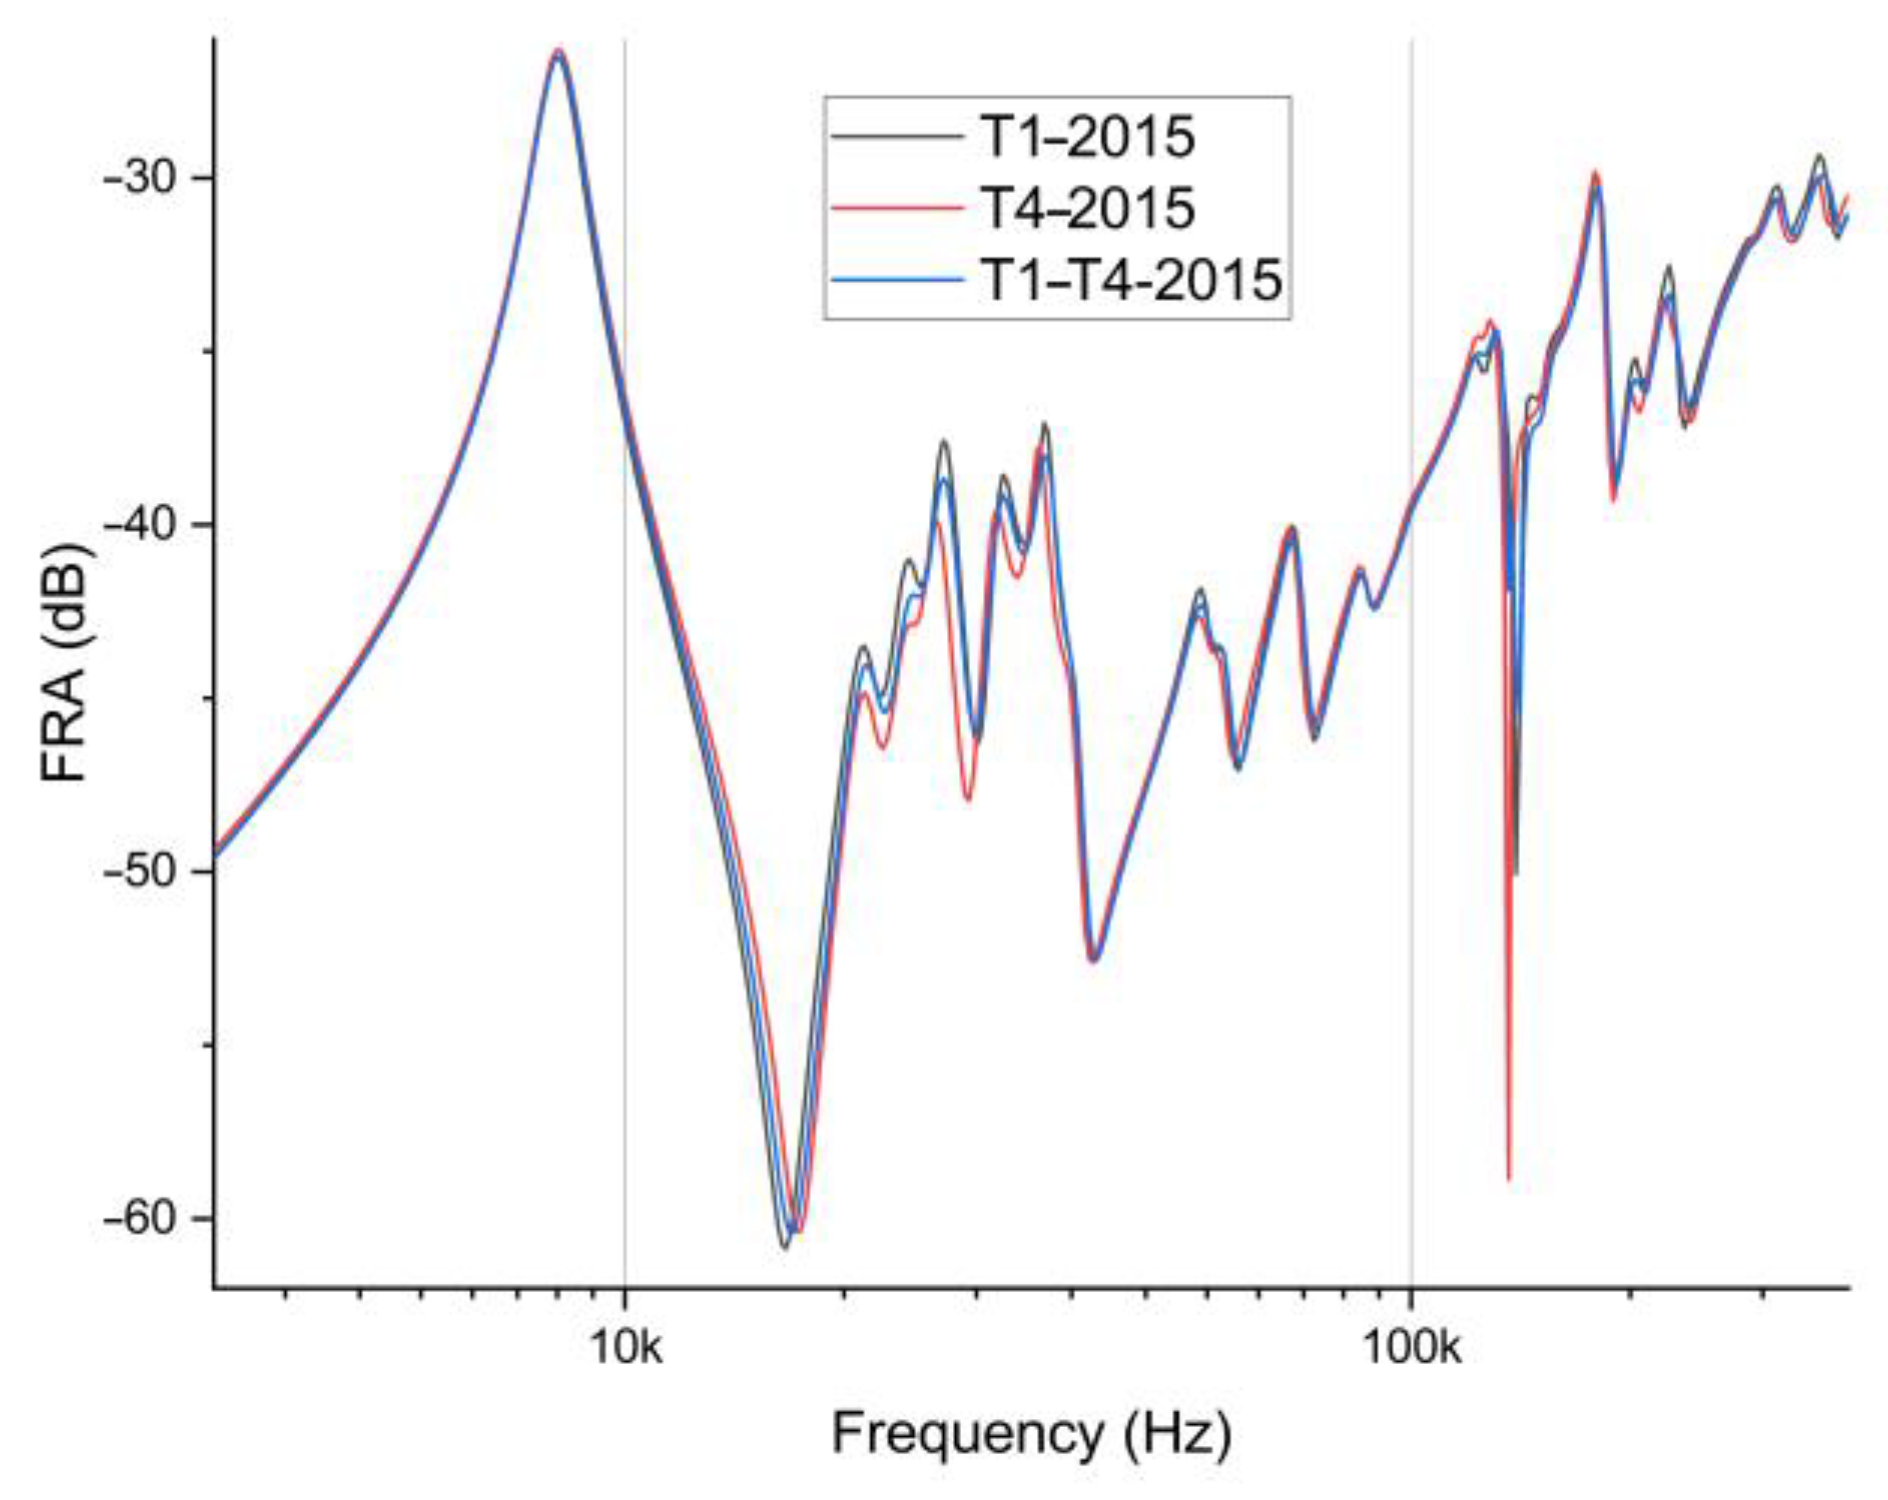
Therefore, in the next step, all four curves were averaged (marked as T1–T4) to provide data for the comparison of individual units. The assessment of each transformer’s curve compared to the average value obtained with FRQI is provided in
Table 2.
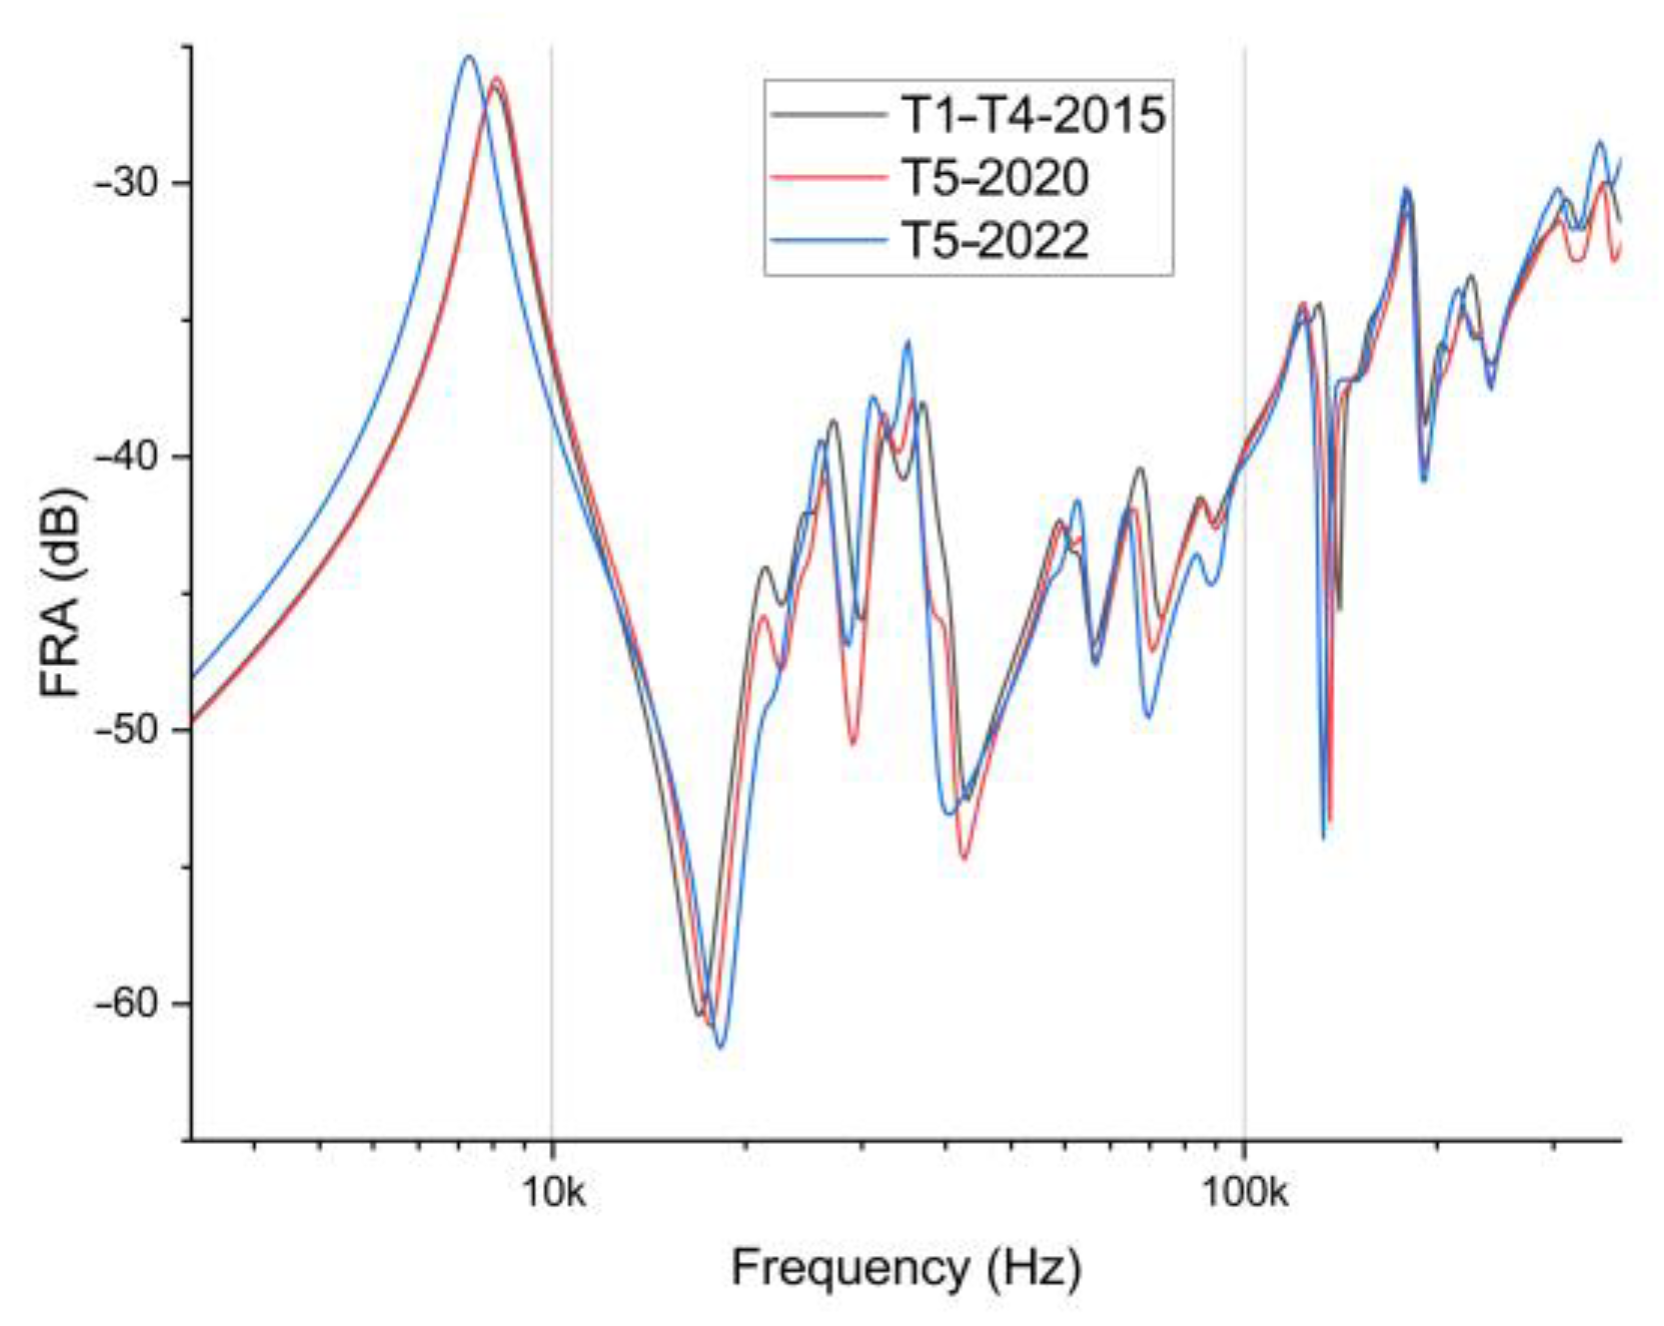
In this approach, all FRQI values are observed to be higher than 0.9; therefore, this value will be regarded as the “warning value” for further analysis. If the results are higher compared to the average group value of healthy units, the transformer should be considered healthy; if lower, there may be some problems with its mechanical integrity within the scope of FRA method detection. A larger population leads to a more reliable assessment. The FRA graph of such an averaged curve, compared to two examples of single pieces of transformer data (T1, the closest to the average, and T4, the farthest from the average), is presented in
Figure 3. The curve for T4-2015 shows some differences between 20–30 kHz and then exhibits deeper resonance above 100 kHz. The latter is likely responsible for the lower value of the global FRQI.
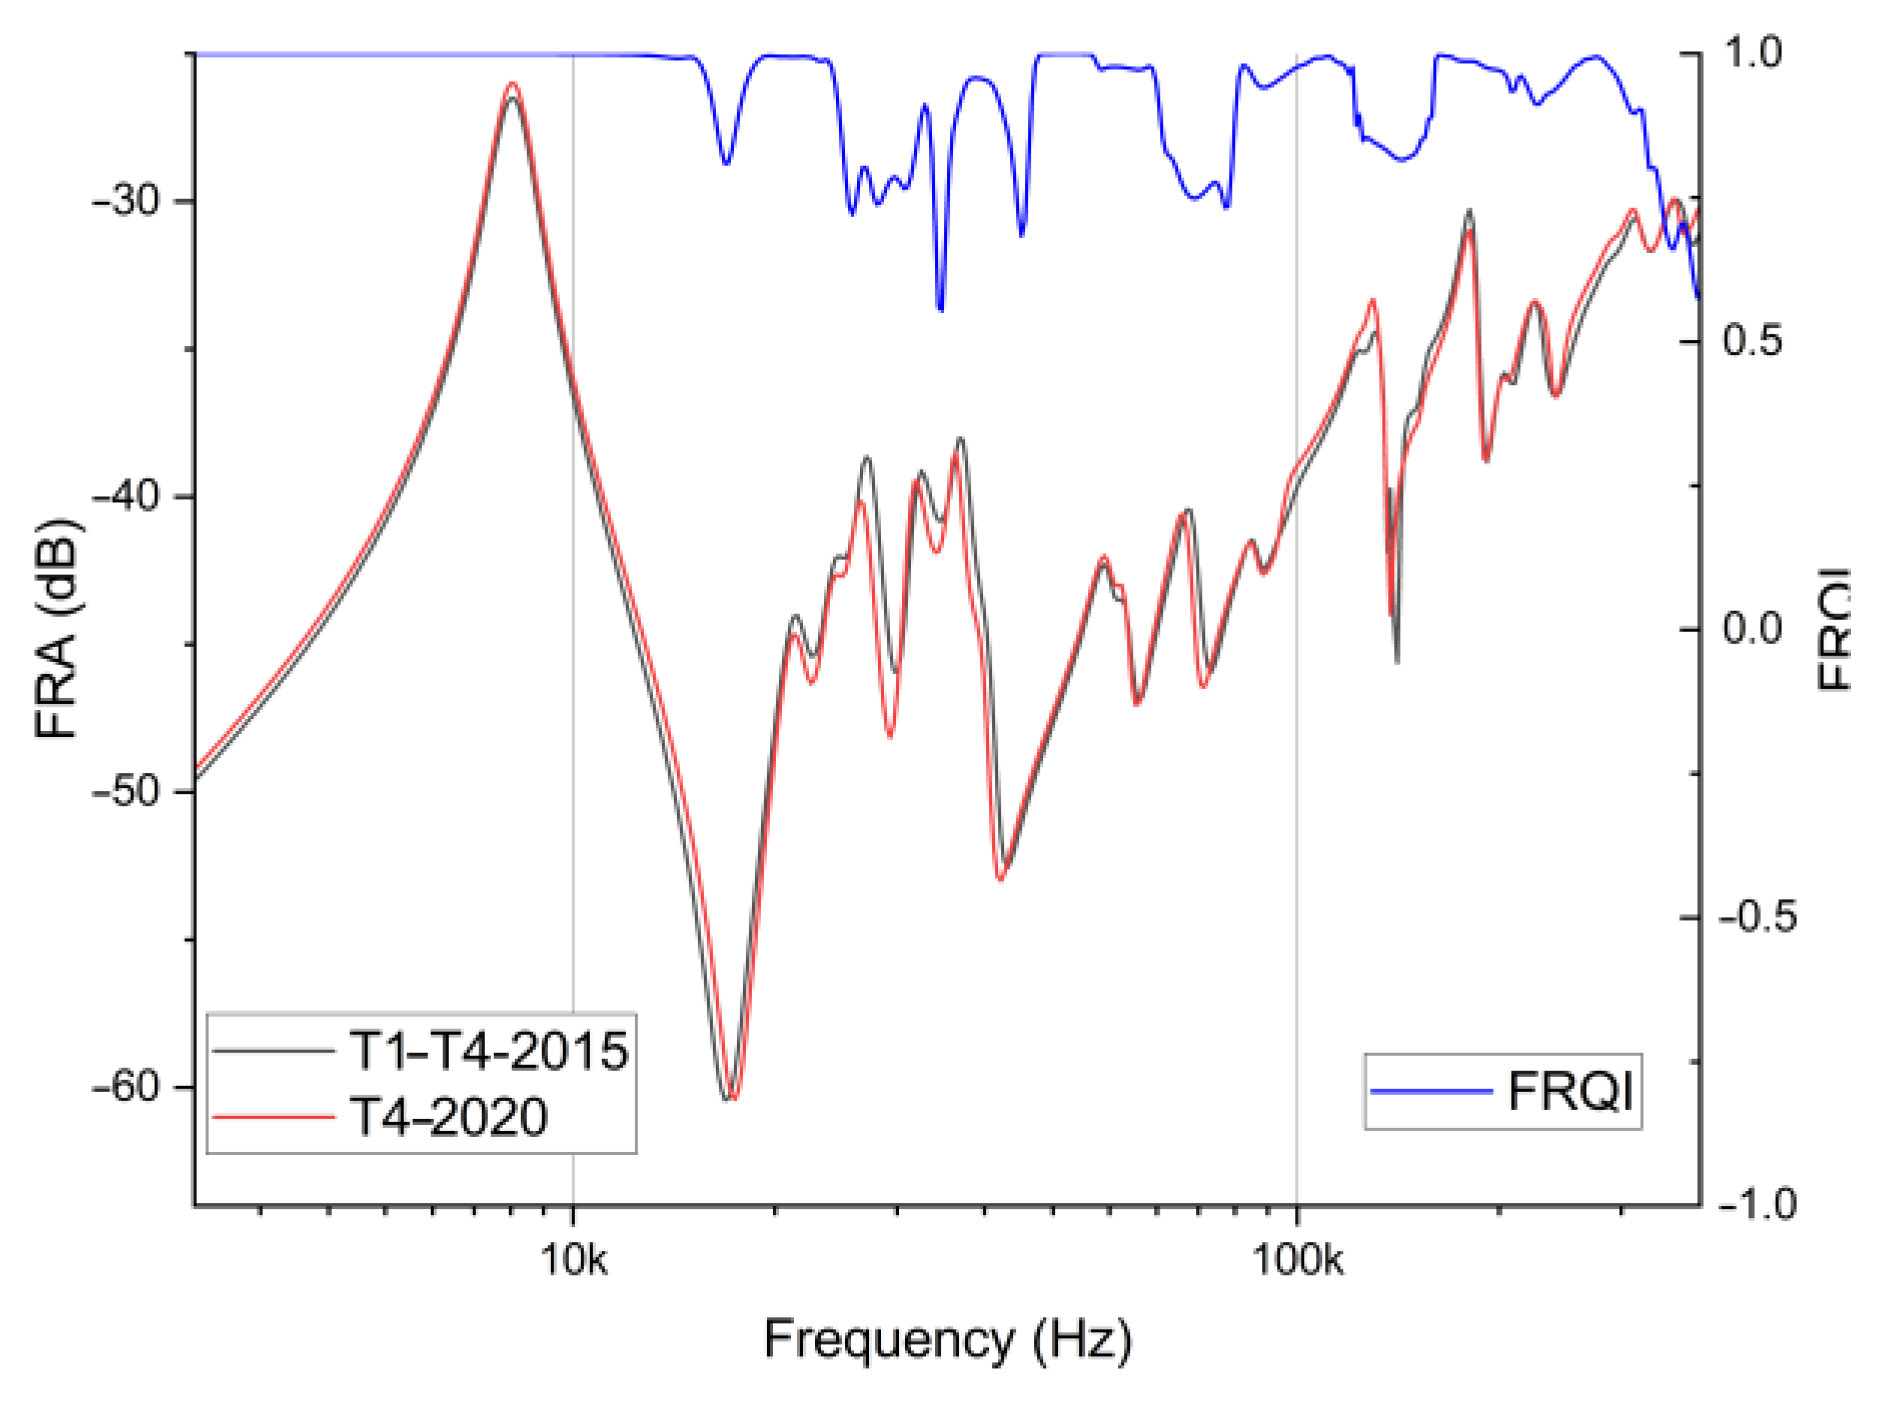
All transformers from this group underwent repeated FR measurements after five years (in 2020), demonstrating good conformity with previously recorded fingerprints. In 2022, transformer T4 was measured again, after being de-energized due to a network event, likely a short-circuit. Its FRA curve exhibited major changes. The FRQI analysis for transformer T4 is presented in
Table 3. It was compared to both earlier measurements (2022 vs. 2015 and 2022 vs. 2020) and also to the average value for T1–T4.
Comparisons to both the previous record and the average curve show a similar drop in the global FRQI value. The comparison between the years 2015 and 2020 demonstrates good conformity, but the measurement from the year 2022 is assessed only at 0.44 and 0.46. This clearly indicates that transformer T4 has some issues with its mechanical condition. This observation is further supported by the raw FRA data presented in
Figure 4 (year 2020) and
Figure 5 (year 2022), which also include curves of FRQI. Changes in FRQI on both graphs illustrate its sensitivity as a tool and how its distribution over the analyzed frequency range influences the single global value presented in
Table 3.
The data presented in
Figure 4 and
Figure 5 show that FRQI detected potential faults in the winding in the case of the transformer used to create a “fingerprint”, which is based on the average value of FR and includes data for the considered unit.
5. The Assessment of Measurement Data with Vibroacoustic Quality Index (VQI)
The use of the FRA method provides valuable information on the technical condition of the windings. Equally significant is the assessment of the condition of the second component of the active part of the transformer—the core. Core health diagnostics will be conducted using the VM method. Within the transformer, electrodynamic and magnetostriction forces act on the windings and core, inducing mechanical vibrations. These vibrations are transmitted to the surface of the tank walls via the two following mechanisms:
- (a)
Through the transformer oil;
- (b)
Through the lid and base, which are in direct mechanical contact with the active part.
The loosening of the windings and the core laminations leads to the generation of harmonic frequencies, as recorded on the surface of the transformer tank. No-load steady-state vibration measurements can provide crucial information about the mounting condition of the transformer core laminations.
The primary cause of core vibration is the phenomenon of magnetostriction, which results in a change in the geometric dimensions of the magnetic material when placed in a magnetic field. The magnitude of the magnetic field within the core, positioned inside the winding, depends on the voltage supplied to the winding. According to Faraday’s law, the change in the length of the core positioned inside the coil can be estimated using the following relationship:
where:
L—core sheets’ length;
εS—magnetostrictive saturation factor;
z—number of turns in a winding;
S—core cross-section area;
BS—saturation magnetic induction; Ω—pulsation (2π
f);
Umax—supply voltage amplitude.
By determining the second derivative with respect to time from ∆
L(
t), it is possible to determine the instantaneous value of the core vibration acceleration caused by the magnetostriction phenomenon:
Analyzing the above relationship, it becomes evident that the fundamental harmonic frequency of the core vibrations is twice as high as the supply voltage frequency, and the vibration amplitude is directly proportional to the square of its amplitude. An essential observation is that core vibrations are independent of the current flowing through the windings, and are thus not contingent upon the size of the transformer load. Consequently, with a constant voltage amplitude, the acceleration amplitude (
ar) should remain constant. The vibrations of the transformer structure, recorded with an accelerometer attached to the tank, represent a combination of the core vibrations described above and the winding vibrations. The latter are influenced by electrodynamic forces, which are proportional to the square of the current flowing through them. Since the force is directly proportional to the acceleration, it can be concluded that the winding vibration acceleration is directly proportional to the square of the current with amplitude
Imax:
Based on the established principles regarding the formation and transmission of vibrations in the transformer’s active part, conducting VM diagnostics of the core itself involves registering the vibrations of the tank without the unit load. With a reasonable approximation, it can be assumed that the core is the source of the vibrations, with magnetostriction being the predominant phenomenon, while the vibrations caused by the interaction of electrodynamic forces in the windings are practically negligible (assuming a load current equal to zero).
In order to estimate the technical condition of the core, the authors of this paper proposed, in [
11], a method based on the analysis of normalized changes in the power spectral density (
ar(
f)) of the no-load transformer tank vibration signal:
where
G(
f) is the power spectral density of vibrations;
fg = 2.5 kHz;
fmin = 0 Hz;
fmax = 25.6 kHz.
The selection of
fg,
fmin,
fmax values, and the parameters related to FFT calculations, are described in detail in [
11,
18].
Following the definition of the core quality analysis basis, its condition can be estimated considering that the case of perfect mechanical conditions and perfect vibration measurement conditions is
ar(
f) = 1 for 0 ≤
f ≤ 100 Hz and
ar(
f) = 0 for 100 Hz <
f ≤
fg, with the assumption that the power frequency is 50 Hz. The progressive degradation of the core will cause a decrease in the value of the function
ar(
f) for
f > 100 Hz.
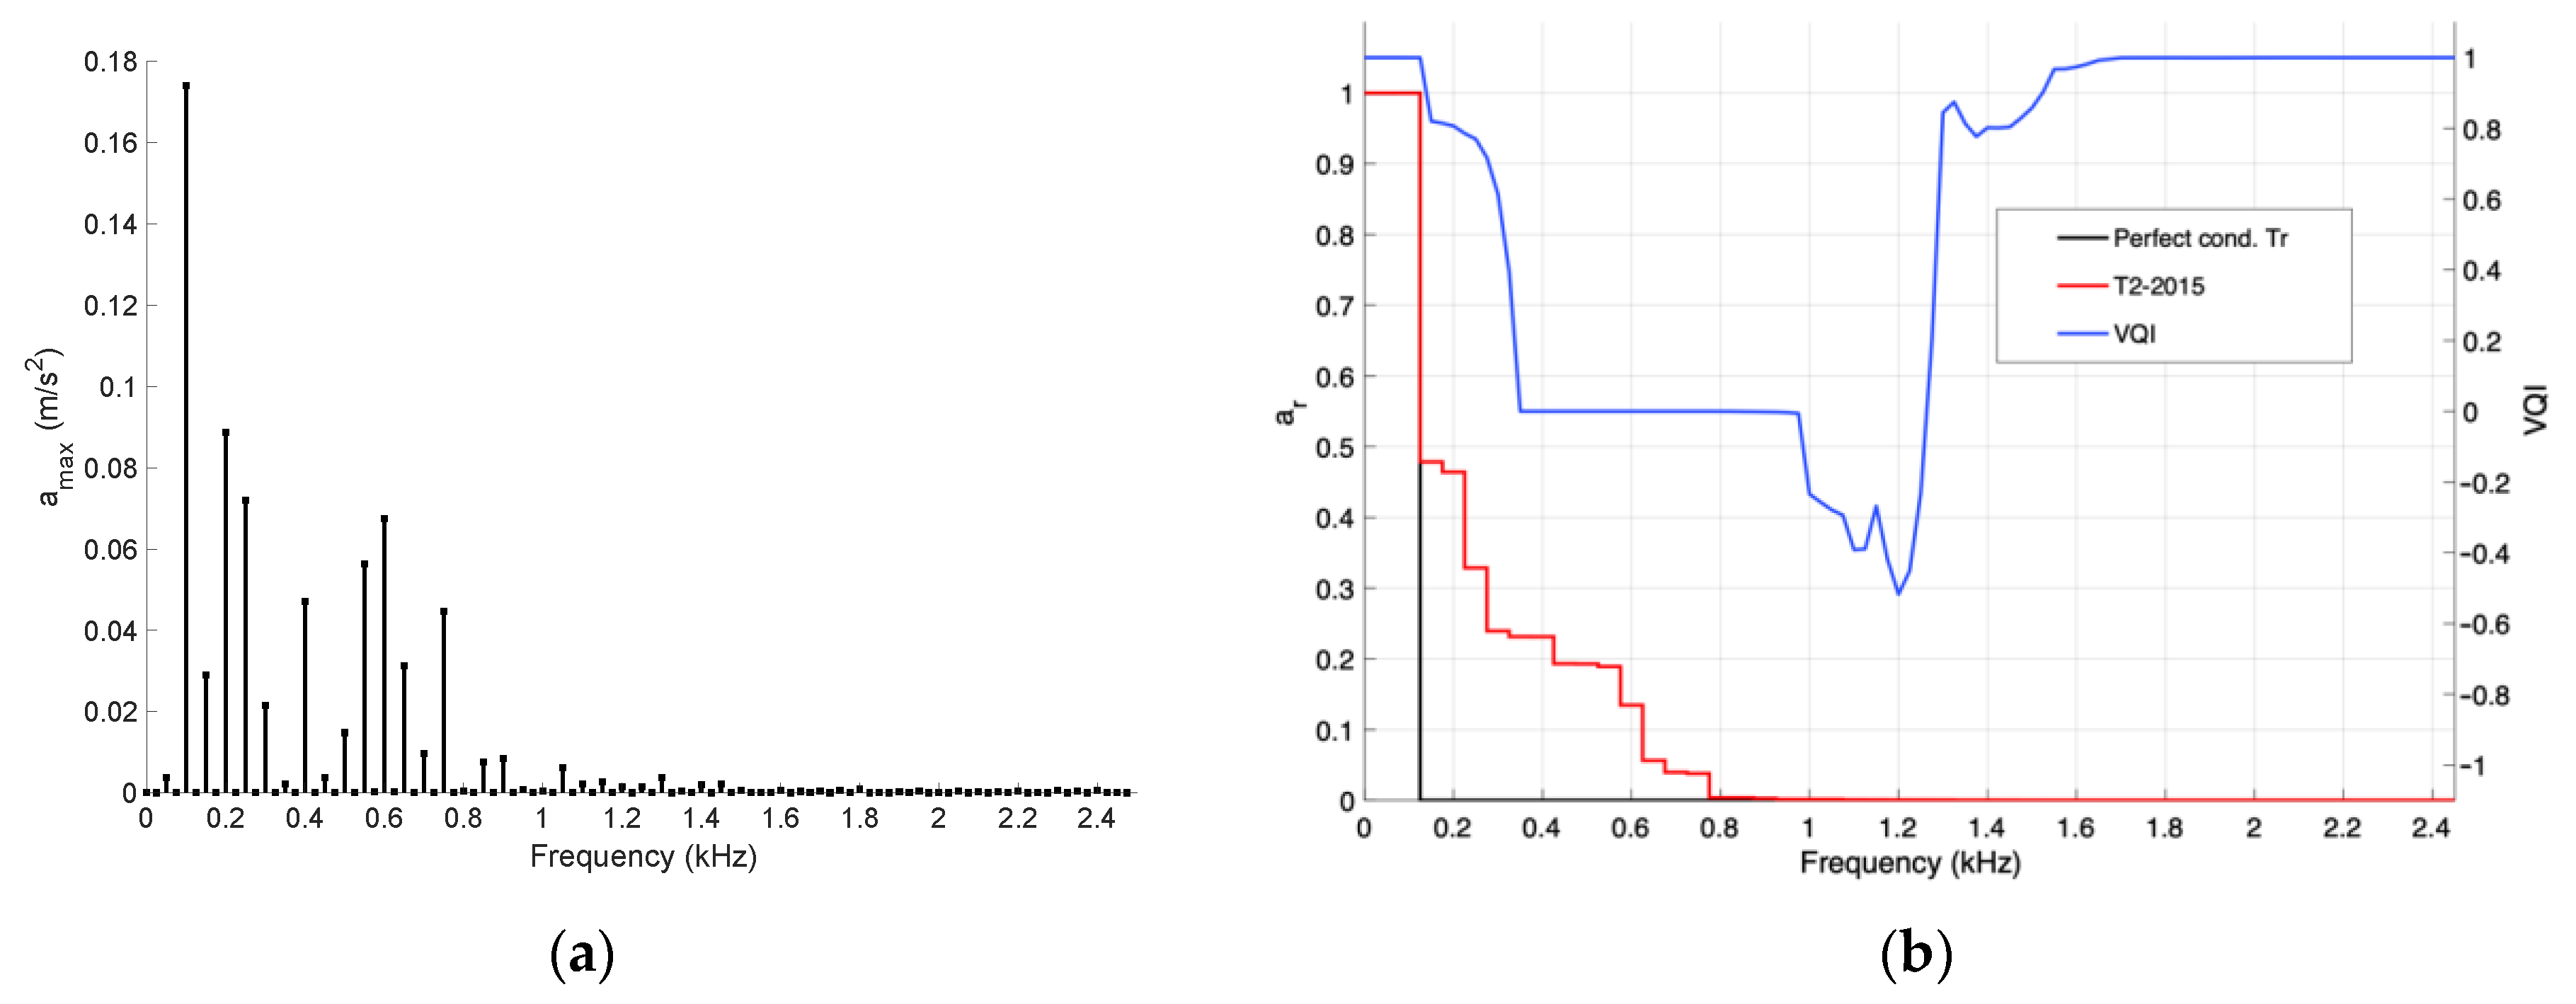
Figure 6 presents the frequency amplitude spectrum and
ar(
f) for the exemplary transformer (T2-2015). All vibroacoustic measurements were performed with commercial vibration analyzer SVAN 958 (resolution 0.1 dB).
The curves
ar(
f) from
Figure 6b were plotted on the basis of the frequency amplitude spectrum of a perfect condition transformer (single harmonic frequency of 100 Hz) and the transformer under analysis (amplitude spectrum presented in
Figure 6a). The second graph provides insight into the technical conditions of the core. The diagnostician should evaluate whether the rate of descent of the
ar(
f) curve is sufficiently steep compared to the ideal case to determine whether the core is developing defects. However, such conclusions may be subjective and ambiguous. The quality of assessment would significantly improve if the VQI quality factor were determined.
Figure 6b also presents a curve depicting changes in the quality factor VQI.
Analyzing its changes as a function of frequency reveals that its values range from about −0.5 to 1.0. For the diagnostician, it is crucial to determine the average VQI value, indicating to what extent the curve describing the normalized changes in the power spectral density
ar(
f) of the diagnosed transformer resemble the analogous curve of the ideal transformer. In the case depicted in
Figure 6, the global VQI value for the frequency range of up to 2.5 kHz is 0.5435. However, basing conclusions solely on this VQI value may lead to erroneous conclusions regarding the core of the diagnosed transformer, indicating potential developing defects. Such a conclusion could be inaccurate because the expected global VQI value of close to 1.0 applies primarily to very low-power transformers (up to tens of VA). For units with MVA power, it is essential to consider the minimum VQI value for a group of transformers with similar power and construction features, which are classified as units in good technical condition.
Table 4 presents the global VQI values for the following group of transformers: T1-2015, T2-2015, T3-2015, and T4-2015.
The calculation results presented in
Table 4 pertain to identical units, based on which the FRA diagnosis was conducted in
Section 4 of this work (
Table 1). The VQI values range from 0.5435 to 0.6612. In 2015, when the diagnostic measurements were conducted, it was determined that none of the units exhibited significant defects in their active part. Therefore, it can be inferred that the VM coefficient ≥0.5435 will be applicable to units with cores free of mechanical defects.
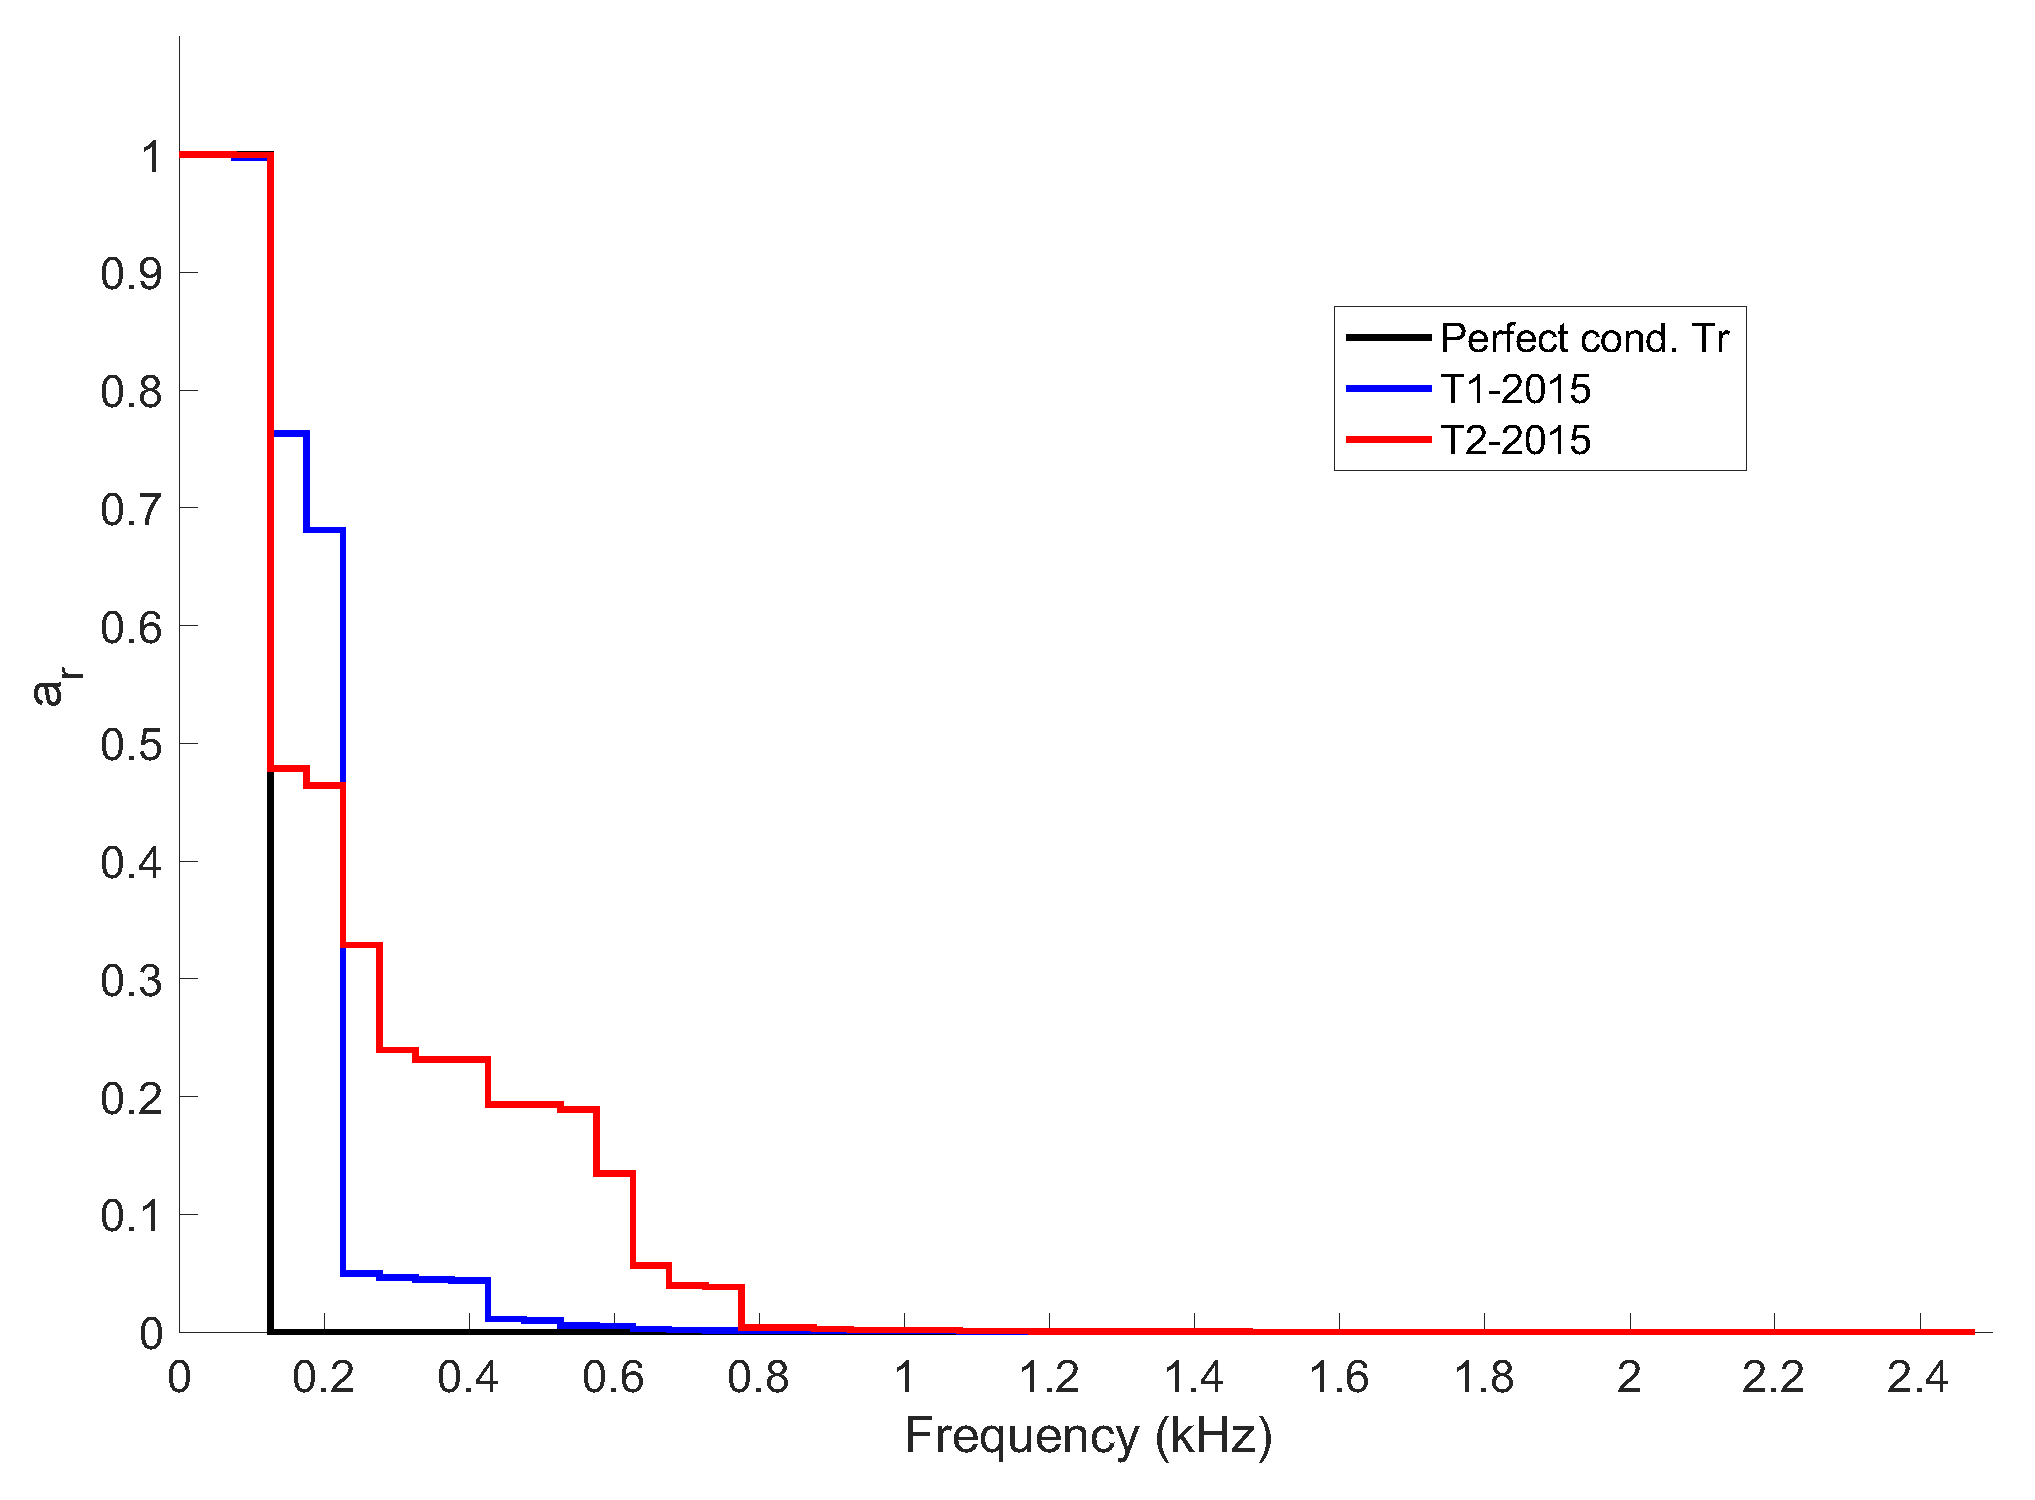
Figure 7 depicts graphs of
ar(
f) for two transformers from the analyzed group of four units: T1, the transformer with the highest VQI, and T2, the transformer with the lowest VQI.
It is worth emphasizing that the diagnosis and analysis of VM using the QI quality index for core condition is simpler than in the case of FRA. In vibroacoustic tests, the reference curve is known, and the similarity
ar(
f) can only be compared with this. Since it is challenging to establish a reference curve a priori in FRA studies,
Section 4 of this paper required not only analyzing the FRQI coefficients for subsequent units but also drawing conclusions based on the similarity of various FRA characteristics, their similarity to averaged characteristics, etc.
As previously mentioned in
Section 4, measurements for this group of transformers were repeated in 2020. The conclusions regarding the vibroacoustic analysis and the VQI coefficient are similar to those obtained in the case of FRA: the technical condition of the cores of the units has not significantly changed.
Section 4 outlines the FRA diagnostic conclusions regarding the T4 transformer and measurements from 2022. Compared to previous years, the windings have degraded significantly: the FRQI coefficient has decreased by approximately two times compared to its state in 2015 and 2020. A similar analysis was conducted for the data from 2022 using the vibroacoustic method. As shown in
Table 4, the global VQI for the T4 unit in 2015 was 0.5623. In 2020, this value did not change significantly: VQI = 0.5563. However, in 2022 (measurement after a network event, likely after a short circuit), its value was only 0.2725.
Figure 8 illustrates the
ar(
f) and VQI graphs for the T2 transformer based on measurements from 2015 and 2022. The results depicted in
Figure 8 illustrate the effects of the changes that occurred in the core after a power grid failure: while the VQI indices are similar up to approximately 0.9 kHz, above this frequency, the differences are significant (
Figure 8a), which affects the global VQI values. The degradation of the core is even more apparent in
Figure 8b. Previous VQI(
f) plots were made considering the
ar(
f) reference curve for an ideal transformer. However,
Figure 8b shows the VQI(
f) waveform where the reference for
ar(
f) from 2022 was the normalized change in the transformer vibration acceleration power
ar(
f) from 2015. As a result of these calculations, the global coefficient VQI = 0.4822 was obtained, indicating that the technical condition of the T4 core in 2022 significantly deteriorated compared to 2015.
7. Comparison to Industrial Numerical Indices
In order to further verify the proposed approach, the FRA curves of transformer T5 were assessed with two algorithms: NCEPRI and DL/T911-2004 [
20]. Both of them can be implemented in the software of a commercial measuring device; therefore, they are commonly used for analysis. The first one calculates the standard deviations of the compared waveforms:
where
TFRef and
TFTest are the transfer functions of the reference and test datasets.
The result was assessed for the high-voltage winding in the range of 10–515 kHz, for the low-voltage winding in the range of 10–600 kHz, and for the tertiary winding in the range of 10–700 kHz. The winding condition was defined as normal if it had a value of E12 < 3.5, minor deformations are diagnosed if a value of 3.5 < E12 < 7.0 is found, and serious deformations are suggested for the value of E12 > 7.0.
The second algorithm assesses the convergence of two compared waveforms by calculating three coefficients: RLF, RMF, and RHF. They correspond to the following frequency ranges: RLF—1–100 kHz, RMF—100–600 kHz, and RHF—600–1000 kHz.
The values of the
RXY coefficients were obtained from the calculation of the correlation coefficients
ρ, as follows:
where
ρ:
where:
The degree of deformation is assessed according to the following criteria, depending on the frequency range [
20]:
- -
Severe deformation: RLF < 0.6;
- -
Obvious deformation: 0.6 ≤ RLF < 1.0 or RMF < 0.6;
- -
Slight deformation: 1.0 ≤ RLF < 2.0 or 0.6 ≤ RMF < 1.0;
- -
No deformation: RLF ≥ 2.0, RMF ≥ 1.0 and RHF ≥ 0.6.
The results are given in
Table 7, with comparison to the FRQI method. The data chosen for the comparison were recorded on transformer T4, which contained three measurements in its history, with the last one indicating deformation (see
Table 3,
Figure 4 and
Figure 5). For DL/T911-2004, the data analyzed in the paper (3 kHz–360 kHz) cover two frequency subranges: LF and MF. As both industrial algorithms operate on a single result value, only a single global value of FRQI will be used.
The comparison shows that FRQI gives the same assessment results as the two other algorithms. The quality indicators described above (Equations (17) and (18)), if considered individually, provide little information. The first one determines only the standard deviation between the compared datasets. The second one is based on the definition of cross-correlation; therefore, it will only indicate the similarity between the shapes of the compared curves, and is not sensitive to the magnitude of the amplitude. The QI criterion (1) proposed in this work takes into account the similarity of shapes, S, average values, M, and the dynamics of changes, G, in the analyzed data sets (M and G refer to the amplitude). All the most important similarity attributes of the two curves (data sets) are included in one quality indicator. This is very important, especially in the case where there are small differences between the two analyzed datasets. The high sensitivity of the quality indicator is required in such cases. In addition, this allows for the separate analysis of each component, S, M, or G, and for analyses in the desired frequency range.
VQI could not be compared to industrial algorithms, because none have been introduced into the practice of data assessment.
8. Conclusions
The article describes the application of the numerical tool “Quality Index” (QI) for the objective evaluation of the results obtained from testing the active part of transformers using the FRA (winding condition) and VM vibroacoustic (core mechanical quality) methods. Typically, in both of these methods, diagnostic conclusions are formulated based on the analysis of appropriate graphs, relying on the diagnostician’s experience. However, with the introduction of the QI index (the FRQI for the FRA method and the VQI for vibroacoustic tests), the assessment is not reliant on subjective interpretation. The proposed QI indicator, unlike other numerical indices, considers three attributes: shape similarity, mean value similarity, and gradient similarity. Additionally, each of these attributes can be analyzed separately, either as a single global value (S, M, or G) or in requested frequency ranges.
The use of the QI indicator is based on a numerical comparison of the curve obtained from measurements with a reference curve. In the case of the FRA method, the reference curve is not predefined. Therefore, it is necessary to initially calculate the average shape of the FRA curve for a population of similar transformers or to obtain a fingerprint of the tested unit. All these cases are elaborated in the paper and supported by exemplary results from the experimental research.
In vibroacoustic tests, however, the use of an ideal transformer ar(f) curve was proposed as a reference for normalized changes in the spectral power density of tank vibrations in the no-load transformer operating state. The shape of this curve is predictable, stemming from the analysis of the causes of transformer core vibrations. The calculated VQI value for the diagnosed unit serves as a source of information about the mechanical condition of the core after comparison with the quality coefficients of a population of similar healthy units or with the fingerprint of the diagnosed unit.
It is important to highlight that, in the vibroacoustic method, not only does the curve describing the normalized changes in the power spectral density of the tank vibration signal indicate the condition of the core, but other parameters, such as the amplitude and RMS value of the vibration acceleration, the amplitude of the vibration at the dominant frequency, and the width of the vibration frequency band, are also significant. However, for clarity, these other parameters characterizing tank vibration were deliberately not considered in this paper. In the presented examples of experimental studies, diagnostic inferences were made based on the analysis of the VQI coefficient.
The current diagnostic technique for transformers relies on the independent use of FRA and VM methods, each with its own approach to interpreting diagnostic results. With the VM method, the frequency amplitude spectrum of the recorded tank vibration signal is evaluated by comparing it with the results obtained for similar units. In the case of FRA, the frequency response of the active part is assessed, also through comparison with similar units. In both cases, the diagnostic process necessitates significant experience and knowledge from the staff.
However, the assessment of the mechanical condition of a transformer’s active part using complementary FRA and VM methods can be made much easier with the proposed quality indices, as demonstrated with industrial examples.


