Abstract
There is a need to find methods to intensify the anaerobic digestion process. One possibility is the use of pretreatment techniques. Many laboratory tests confirm their effectiveness, but in most cases, there is no verification work carried out on industrial plants. A reliable and complete evaluation of new solutions can only be carried out in plants that reflect operating conditions at a higher readiness technological level. This has a direct impact on the scientific value and, above all, on the high application value of innovative technologies. The aim of our research carried out under laboratory conditions and on a large scale was to determine the technological and energy efficiency of the use of hydrodynamic cavitation in the pretreatment of a waste mixture from dairy farms. It has been shown that hydrodynamic cavitation significantly increases the concentration of organic compounds in the dissolved phase. In the most effective variants, the increase in the content of these indicators was over 90% for both COD and TOC. The degree of solubilisation achieved was 49 ± 2.6% for COD and almost 52 ± 4.4% for TOC. Under laboratory conditions, the highest effects of anaerobic digestion were achieved after 10 min of pretreatment. The amount of biogas was, on average, 367 ± 18 mL/gCOD, and the amount of methane was 233 ± 13 mL/gCOD. Further large-scale optimisation trials showed that after 8 min of hydrodynamic cavitation, the biogas yield was 327 ± 8 L/kgCOD with a CH4 content of 62.9 ± 1.9%. With this variant, the net energy yield was 66.4 ± 2.6 kWh/day, a value that was 13.9% higher than the original variant with 10 min of disintegration and 3.1% higher than the variant without pretreatment.
1. Introduction
Technologies based on the use of anaerobic digestion (AD) are popular and widely used solutions in many countries to produce renewable energy from substrates of different origins and characteristics []. In this multi-stage process, biogas containing energy-rich methane and/or hydrogen is produced as a result of the biological decomposition of organic material by specialised groups of anaerobic microorganisms []. Around 19,000 biogas plants are in operation in the European Union (EU) []. Germany is the leader in the implementation of this technology with over 10,000 plants, followed by Italy with over 2000 biogas plants and France with around 1.6 thousand facilities []. The creation of new AD systems is currently very dynamic. This is dictated by many factors, including the unstable geopolitical situation, which affects the unpredictable and highly variable costs of buying coal, natural gas or crude oil, as well as the need to ensure energy security and stabilise energy prices []. Another important aspect is the endeavour to reduce greenhouse gas emissions into the atmosphere via the use of environmentally friendly technologies based on renewable energy sources. This is in line with the principles of sustainable development and corresponds to the assumptions of the circular economy and the European Green Deal [,].
There are several factors contributing to the slowdown in the development of the biogas market. These include the very frequent changes in laws, required authorisations and environmental standards in this area, as well as the fear and lack of acceptance of this type of installation by the local community []. However, the most important aspect that significantly limits the intentions of potential investors is the profitability and viability of this type of plant. Currently, the viability of building AD bioreactor systems in most EU countries depends on the granting of subsidies, different types of financing, non-repayable loans or preferential credits []. It is therefore necessary to look for solutions, especially technological ones, that increase the economic efficiency and competitiveness of the methane fermentation process on the market.
One of the directions that makes it possible to increase the return on investment and operation of AD plants is the utilisation of organic waste []. Heavily polluted wastewater from the food industry [], sewage sludge [,], waste from agriculture [], the fruit and vegetable sector [] and the meat industry [], as well as the organic fraction of municipal waste [] and many others [,,,] are excellent substrates in this process. Another way to increase economic efficiency is to use technologies and process units that increase the biodegradability of the substrates used, which has a positive effect on the quantity and qualitative composition of the biogas produced []. The search for this type of improvement primarily relates to the development, testing and final implementation of different pretreatment methods []. To date, many techniques have been analysed to improve the susceptibility of organic substrates to degradation under anaerobic conditions. These include comminution and mechanical destruction [], treatment with acids and bases [], advanced oxidation [], enzymatic hydrolysis [], disintegration with ultrasound [,], hydrothermal depolymerisation by conventional [] and microwave heating [], the use of low temperatures in the freezing processes [] and the injection of solidified carbon dioxide [,], as well as the use of high-voltage disintegration []. Unfortunately, in many cases, the optimistic results of the preliminary investigations, which were achieved under laboratory conditions, were negatively confirmed in pilot studies on a technical scale [].
One of the promising directions for the pretreatment of substrates prior to the AD process is the use of hydrodynamic cavitation (HC) []. Until recently, the prevailing opinion was that HC is a violent and negative phenomenon that causes problems and operational difficulties in technical plants related to fluid flows []. It has been widely pointed out that HC increases the noise level, amplifies vibrations, disturbs the continuity of the flow and intensifies cavitation erosion processes, which directly reduces the efficiency of the equipment and shortens its service life []. Localised sudden pressure changes due to cavitation can exceed typical values by a factor of hundreds, and the resulting shocks are so strong that they can destroy almost any material [].
Recently, attention has been paid to the possibility of building and using HC generators to intensify biological processes, including the treatment of toxic [] and biodegradable [] wastewater, the stabilisation of sewage sludge [], including granulated sludge [], or to increase the efficiency of bioenergy technologies, including methane [] or hydrogen fermentation [] as well as the production of bioethanol [] and biodiesel []. The results of the experimental work carried out so far indicate efficient destruction of complex organic structures present in the pretreated medium, which increases the efficiency of their further conversion, transformation and biodegradation by specialised groups of microorganisms []. The undeniable advantages of HC include the absence of secondary contamination of the treated medium due to the non-chemical nature of HC [], as well as easy implementation into existing technological systems [] and relatively simple construction and operation []. HC generators make it easier and more precise to achieve the required cavitation conditions and intensities []. The effectiveness of this solution has been repeatedly confirmed, mainly on a laboratory scale, but also, albeit rarely, in pilot plants and under near-operational conditions in large-scale installations []. Another advantage of HC is its economic aspects in terms of competitive operating and maintenance costs [].
Cavitation is the process of formation, growth and subsequent implosive collapse of vapour bubbles, which is a consequence of a phase change caused by a significant pressure drop at constant temperature []. This dynamic transition from the liquid to the gaseous state, measured in milliseconds, can occur when the initial liquid temperature is between the triple point temperature and the critical temperature, and the pressure at this temperature is greater than the vapourisation pressure []. When the walls of a cavitation bubble burst, which happens during a collision, large amounts of energy are released. Previous studies on thermodynamic effects have emphasised the significant influence on cavitation bubble growth. It has been shown that cavitation dynamics and thermodynamic effects at elevated temperatures in a small Venturi channel, dynamic decomposition of cavitation by thermodynamic effects and hydrodynamic cavitation considering temperature effects and the influence of temperature on cavitating flows for optimal reaction conditions and to increase the intensity of cavitation treatment [,].
Shock waves of high intensity and force are generated in the processed medium, which propagates at the supersonic speed of water (~6000 km/h) []. The local pressure exerted on the particles can exceed values of 1 GPa, and the local temperatures can reach several thousand Kelvin []. As a result, the vapour trapped in the budding vesicles dissociates and generates free radicals of the •OH and •H types []. Reactions with free radicals can take place in a collapsing cavitation bubble at the interface between the bubble and the cavitated medium. The effective generation of radicals plays a key role in the process of oxidation of pollutant molecules and pretreatment of substrates prior to the AD process [].
The phenomenon of cavitation thus comprises physical, thermal and chemical effects []. Physical effects contribute to the disintegration of particles and the lysis of organic substrates due to the shock waves, shear forces and microjets generated. The thermal effect is the result of the formation of hot spots with a heat transfer rate of 1010 K/s []. In the pretreatment process, thermal effects also enhance the decomposition of complex organic structures via thermal depolymerisation []. Chemical effects are related to the production of highly reactive •OH radicals and other reactive compounds responsible for the oxidation and lysis of organic substrates []. This synergistic effect makes the HC process a promising and competitive solution whose implementation can improve the technological and economic effect of the AD process.
The effectiveness of the use of HC in the intensification of biogas production has been repeatedly confirmed in the pretreatment of sewage sludge [], biomass from energy crops [] and waste from the agricultural [] and food sectors []. However, it should be emphasised that reports on laboratory-scale research predominate [], the results of which are often not confirmed on a larger scale as the technological readiness level (TRL) increases. There is therefore a justified need to verify the results of experimental work, and even a requirement to confirm them each time in installations whose operation corresponds to actual operating conditions. There is not yet enough large-scale work to confirm the effectiveness of HC.
The aim of the research was to determine the effectiveness of the HC process in the disintegration of an organic substrate consisting of wastewater from a milking station and cattle manure. The work involved optimising the process during laboratory-scale experiments and then verifying the results in a full-scale agricultural biogas plant. The research focussed on the selection of a technological variant that would allow the highest efficiency of biogas and methane production to be achieved while at the same time achieving a positive energy balance via the use of HC.
2. Materials and Methods
2.1. Organisation of the Experiment
The study was carried out in two stages (S1 and S2). In the first stage (S1), the work was carried out on a laboratory scale. S1 was divided into 8 variants (V0–V7), whose separation criterion was the HC time used and thus the unit of energy introduced into the substrate. The second stage (S2) was carried out on a technical scale in an existing agricultural microbiogas plant. The basic HC operating parameters for S2 were selected based on the results obtained in the laboratory tests in S1. The research work focused on the further optimisation of the HC and AD processes. Finally, three variants (V1–V3) were differentiated in S2, depending on the duration of the HC used, as well as a control variant without pretreatment (V0). The numerical values characteristic of the subsequent parts of the research are included in Table 1, and the organisational scheme of the experiments is shown in Figure 1.

Table 1.
Characteristics of the experimental work in the following stages and variants.
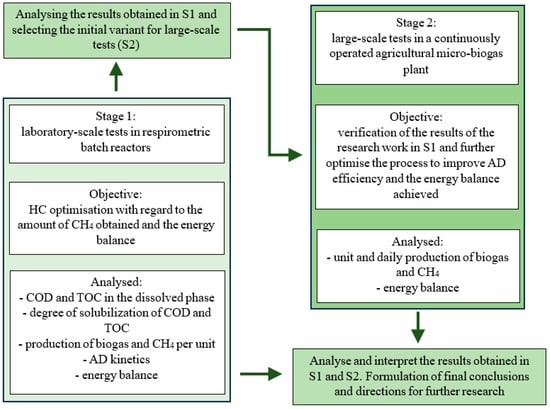
Figure 1.
Organisational scheme of research work.
2.2. Location of Research
The laboratory-scale experiments (S1) were carried out at the Centre for Aquaculture and Ecoengineering of the University of Warmia and Mazury in Olsztyn (UWM in Olsztyn) (53°45′14.03851″ N, 020°27′43.33475″ E). However, the research in S2 was carried out at the agricultural biogas plant in Bałdy (53°36′03.31427″ N, 020°36′12.86527″ E) at the Education and Research Station (ER-S). The ER-S in Bałdy is a university-wide unit of the UWM in Olsztyn. It is located 20 km south of Olsztyn. The station conducts research, agriculture and leisure activities. The station cultivates 482 hectares of very-well-cut land, of which 422 hectares are planted with cereals, maise and grasses. It breeds 360 dairy cows (Holstein Friesian and Jersey) and 40 horses (cold-blooded, Silesian and Greater Poland), as well as the horses entrusted to us (horse boarding). The farm derives its income mainly from the sale of milk, grain and livestock. The location of the most important facilities for the planned research work is shown in Figure 2.

Figure 2.
Location of the sites where the laboratory-scale experiments (S1) and the work in the agricultural biogas plant (S2) were carried out on the map of Poland.
2.3. Materials
The organic substrate subjected to the pretreatment process with HC was a mixture of cattle slurry (CS) from barns and sewage from milking stations (MSS) of dairy cows. The substrate mixture from the ER-S facilities in Bałdy was collected and then channelled by means of collectors from the stables and milking station into an underground retention tank with an active volume of 50 m3, equipped with a jet pump that ensured regular mixing of the contents. Agricultural waste was stored in this tank before being fed into the technical system of the agricultural biogas plant. The anaerobic sludge (AS) inoculum used in the laboratory tests came directly from the bioreactor of the ER-S agricultural biogas plant in Bałdy. The inoculum was therefore prepared and fully adapted to the organic substrate tested. The values of the basic pollution indicators contained in the MSS and CS mixture and the properties of the AS are presented in Table 2.
Table 2.
Properties of the substrate (mixture of CS and MSS) and AS used during the research.
2.4. Hydrodynamic Cavitators
In S1, the HC procedure was performed using a hydrosonic pump (Contex, Poland) with a power of 1.2 kW and a maximum motor speed of 2800 rpm. The working volume of the device was 5 L. The hydrosonic pump consisted of a steel cylinder, inside which were blades and cavitation holes arranged coaxially on the drive shaft. The HC time of the tested organic substrate ranged from 0 to 14 min, depending on the test variant (Table 1). The device used for the HC in S1 is shown in Figure 3.
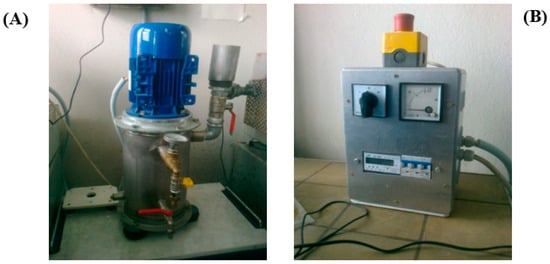
Figure 3.
HC system used in laboratory tests conducted in S1 ((A)—hydrodynamic cavitator and (B)—control and control and measurement module).
In S2, where HC was performed on the site of an operating agricultural biogas plant, the multifunctional rotor rotated at a speed of 2800 rpm in a 16 kW cavitator (Figure 4). The device was designed on the basis of patent PL 214335 B1 entitled “Multifunctional rotor for the cavitation treatment of liquid media and method of using this rotor” [].

Figure 4.
HC system used in research on an agricultural biogas plant in S2 ((A)—hydrodynamic cavitator, (B)—control and measurement module, (C)—main components, and (D)—main dimensions).
The active volume of the cavitator was 100 litres. The HC inlet was located in the base and the outlet in the container lid. In an HC cycle, the container was filled with substrate and crushed by repeatedly flowing through the rotor under the influence of centrifugal force. Via contact with the blades and cavitation holes, the substrate was subjected to a variable pressure that enabled the formation and disappearance of cavitation bubbles that break down the substrate particles. After the assumed HC duration, the comminution motor was stopped, and the substrate was replaced. The substrate was introduced into the fermenter, and the HC cycle started again. Depending on the variant, the HC time was between 0 and 10 min.
2.5. Stations for Anaerobic Digestion (AD)
AD in S1 was carried out in reactors with a total volume of 1.0 L and an active volume of 0.5 L (AMPTS II, BPC Instruments AB, Lund, Sweden), in which the amount of biogas and CH4 produced was monitored once a day. The model fermentation chambers were mixed by mechanical stirrers with a vertical axis and a capacity of 100 rpm. Stirring was started 24 times per day on the hour for 15 min. First, AS was introduced into the respirometers and then an amount of the MSS and CS mixture was introduced to ensure the assumed organic load rate (OLR) of the chambers at a level of ≈5.0 gCOD/L. The AD was performed at 38 °C. Nitrogen gas with a capacity of 100 L/h was injected for 2 min to remove oxygen from the atmosphere of the chambers. The yield of biogas and CH4 under normal conditions (p = 101,300 hPa, T = 273 K) was measured once a day using dedicated software for the AMPTS II device. The measurement was carried out until complete anaerobic decomposition of the organic substrates, which was determined by three consecutive readings that did not differ by more than 1%. The biogas and CH4 volume units obtained were corrected for the endogenous biogas produced by the AS not fed with organic matter. A diagram of the test stand and procedures used in the respirometric measurements is shown in Figure 5.
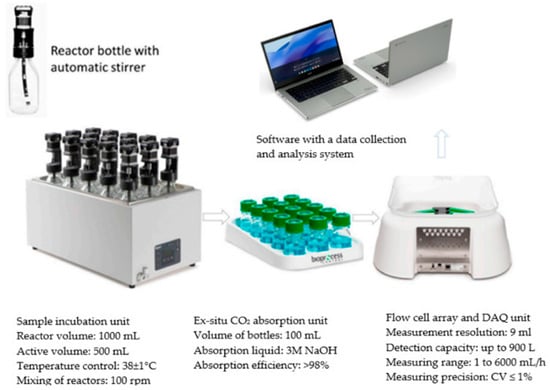
Figure 5.
Schematic of the test stand used in S1.
In S2, the methane fermentation process was carried out in an agricultural biogas plant with an active volume of the AD reactor of 20 m3. The diagram of the entire technological process is shown in Figure 6.

Figure 6.
Technological diagram of the agricultural biogas plant as the research object in stage 2.
The plant was operated at an OLR value of ≈3.0 kg COD/m3, a hydraulic retention time HRT ≈ of 10 days and under mesophilic fermentation conditions of 39 ± 1 °C. The substrate was initially pumped from the retention tank into the intermediate tank with an active volume of 3.0 m3 at a rate of ≈2.2 m3/day. The intermediate tank was equipped with a mixer with a vertical axis. The HRT of the substrate in the intermediate tank was approximately 1 day. The substrate was then fed into the actual fermentation tank with an active volume of 20.0 m3 via a displacement pump integrated into the macerator. The chamber was equipped with an agitator with six paddles and a vertical axis. In the variants in which HC was used, the substrate was cavitated before entering the fermentation chamber in accordance with the assumptions of the research process. The digested sludge then flowed through an overflow into a second fermentation tank with an active volume of 20 m3.
The digested sludge was channelled into the digested sludge thickener, where it was separated into a solid phase with a dry matter content of up to 20% and a liquid phase. The solid phase was recirculated into the fermentation chamber to ensure an appropriate concentration of fermenting microorganisms in the AD process at an average level of ≈30.0 gTS/L. The liquid phase and the unused thickened phase of the digestate were discharged into an underground storage tank, from which they were then transported to agricultural fields and used as a natural fertiliser. The biogas produced in the AD process was fed via glycol safety devices to the desulphurisation process on a column of peat ore and then burned in a furnace with two outlets to form heat exchangers. One of the heat exchangers provides heat for the technological system of the biogas plant; the other heats a boiler with hot water that is used for the needs of SD-B in Bałdy. The technological scheme of the agricultural biogas plant is shown in Figure 6.
2.6. Analytical Methods
The amount of biogas and CH4 in S1 was determined using respirometric measurements. The efficiency of biogas production was determined in a system in which no ex situ CO2 absorption unit was used and in which the absorption liquid was a 3 M NaOH solution. To determine the amount of CH4 produced in the AMPTS II technology line, an ex situ CO2 absorption unit was used, whose CO2 binding efficiency was estimated by the manufacturer to be over 98%. To verify the results obtained, chromatographic analyses were also carried out using an Agilent 7890 A gas chromatograph (Agilent, Santa Clara, CA, USA) equipped with a TCD detector. The biogas produced was collected directly from the respirometric bioreactor with a gas-tight syringe (20 mL). In the chromatograph used, the carrier gases were argon and helium at a flow rate of 15 mL/min. The device had columns operating at 70 °C: Hayesep Q (80/100 mesh), Porapak Q (80/100) and a module with molecular sieves (60/80 mesh). Injection and detection were carried out at temperatures of 150 °C and 250 °C. In S2, the amount of biogas produced was determined using a G2.5 METRIX gas analyser (MagGaz Ltd., Poznań, Poland), the composition with a portable GMF 430 m biogas analyser (GasData, UK) and periodically with a gas chromatograph (GC, 7890 A Agilent, Santa Clara, CA, USA) to verify the results. The chemical oxygen demand (COD), total nitrogen (TN) and total phosphorus (TP) in the dissolved phase of the medium were analysed using a spectrophotometer (Hach DR 6000, Düsseldorf, Germany) after prior mineralisation in an HT200S high-temperature thermostat with HSD (High-Speed Digestion) technology. TC, TOC, IC and TN in the dissolved phase were determined by oxidative combustion–chemiluminescence with the Total Organic Carbon Analyser TOC-L CPH/CPN with TNM-L device (Shimadzu Corporation, Japan). To determine the transition of organic matter to the dissolved phase and the degree of solubilisation, the samples for COD and TOC determinations were pre-centrifuged in a ROTINA 380 laboratory centrifuge for 3 min at a rotation speed of 9000 rpm. The samples were then filtered through a 1.2 µm membrane philtre. In the samples dried at 105 °C, the contents of total carbon (TC), total organic carbon (TOC) and total nitrogen (TN) were also determined using a Flash 2000 analyser (Thermo Scientific, Delft, Netherlands). The pH value was measured with a pH metre (1000 L, VWR International, Radnor, PA, USA). The content of solids (TS), minerals (MS) and organic compounds (VS) was determined gravimetrically.
2.7. Calculations and Statistical Methods
The energy demand (Ed) of the HC process in Wh in S1 was calculated as the product of the cavitation energy introduced into a given substrate volume and the total volume of the pretreated substrate (1):
where EHC is the amount of hydrodynamic cavitation energy introduced into a unit volume [Wh/L], and Vs is the volume of substrate introduced into the fermentation bioreactor [L].
Ed = EHC·Vs
The energy demand (Ed) of the HC process in kWh/day in S2 was calculated as the product of the HC power and the operating time of the cavitator per day (2):
where PHC is the power of the hydrodynamic cavitation generator [kW/h], and THC is the operating time of the HC per day [h/day].
Ed = PHC·THC
The gross energy (Egross) in Wh generated by CH4 production in S1 was calculated as follows (3):
where YCH4 is the CH4 production [L/gCOD], CCH4 is the calorific value of methane [Wh/L] and COD is the number of organic substances introduced into the digester [gCOD].
Egross = (YCH4 · CCH4)/COD
The gross energy (Egross) generated by the methane production in S2 in kWh/day was calculated as follows (4):
where VCH4 is the CH4 production [m3/day], and CCH4 is the calorific value of methane [kWh/m3].
Egross = VCH4 · CCH4
The net energy output (Enet) in Wh was calculated as (5):
Enet = Egross − Ed
Equation (6) present organic matter solubilisation degree [%] calculations [,]. sCODS0/sTOCS0 is the soluble COD/TOC before the HC [mg/L], sCODS1/sTOCS1 is the soluble COD/TOC after the HC and CODT0/TOCT0 is the total COD/TOC [mg/L] before the HC.
COD or TOC solubilization degree =
[(sCODS1 or sTOCS1 − sCODS0 or sTOCS0)/(CODT0 or TOCT0 − sCODS0 or sTOCS0)] × 100
The rate of the AD process (r), which is characterised by the daily increase in biogas and CH4, and the rate constants (k), which correspond to the estimated r values, were determined using the iterative method with linear regression.
where Y—biogas/CH4 yield (mLN/gCODintroduced·day), Ymax—maximum production of biogas/CH4 (mLN/gCODintroduced), k—kinetic constant (1/day), t—time (day). Biogas/CH4 r was calculated by multiplying k by the maximum efficiency of gaseous metabolite production of the AD process per unit mass (gramme) of COD fed to the respirometers, which results from first-order kinetics.
Y(t) = −Ymax (e−kt − 1)
The research in S1 was carried out in four replicates; in S2, each measurement performed during the operation of the agricultural biogas plant according to the assumptions of the tested technological variant was considered one replicate. In S2, a single test cycle must include the full hydraulic exchange of the volume of the operated anaerobic chambers at least three times. The significance of the differences between the analysed variables was determined at the significance level of α = 0.05 (Statistica 13.3, Statsoft, Inc., Tulsa, OK, USA). The normality of the distribution was determined using the Shapiro–Wilk test. One-way analysis of variance was used to assess the significance of the differences between the variables. This method is usually used to test whether a single factor (HC) has an influence on the measured dependent variables (e.g., dissolved TOC and COD, biogas production or CH4 content). It is assumed that the analysed factor (HC) as an independent variable takes the form of groups that differ in terms of the factor value (HC duration). Statistically significant results of the one-way analysis of variance show that a certain factor (HC) has an influence on the dependent variable (e.g., dissolved TOC and COD, biogas production, CH4 content), which means that different values of the factor (HC duration) change the values of the dependent variable—they influence the change in the value of this variable. In addition, one-way analysis of variance is often treated as an “extension” of Student’s t-tests, as these tests are limited to examining differences between only two groups. Analysis of variance has no such limitations. If we want to compare more than two groups, we use a one-way analysis of variance instead of performing Student’s t-test three times. However, the significant result of the F-test (analysis of variance) does not tell us which of the analysed groups are different. It provides us with the information that certain groups differ from each other (or that an influence of a certain factor on the dependent variable was observed). In order to determine between which groups there are statistically significant differences (it can happen that out of 4 analysed groups there is a statistically significant difference only between groups 1 and 2), multiple comparisons, so-called “post hoc” tests, should be performed. Tukey’s HSD test was used in this study. It is one of the most frequently used tests for comparing mean values from experiments. It can be used for equal or different sample sizes. It is based on a distribution called the “studentised range statistic”. The experimental error level for all comparisons remains at the error level for the set, which means that if the statistical significance level of α = 0.05 is assumed for the ANOVA test, the same statistical significance level is used in all comparisons between variables. This procedure is used in a situation where the assumption of equality of variances in the samples is fulfilled, which was checked using the Levene test.
Measurement errors that may have occurred during the experiments are not a measure of measurement accuracy, as a similar measurement with a different instrument, at a different time and in a different place may give a different value. For this reason, the methods used and the analysers used are described in detail in the research methodology. In addition, the actual values of the measured variables are not known in practise, so the measurement uncertainties resulting from the statistical dispersion of the results are estimated. The uncertainty in the qualitative sense is related to the accuracy of the measurement. The more precise the measurement, the lower the uncertainty. The most commonly used method is the standard uncertainty, in which the standard deviation is estimated. This means that the measurement result is a random variable whose dispersion around the mean is characterised by a parameter called the standard deviation. This uncertainty is a deterministic measure because it is assumed that the true value is definitely within this interval.
3. Results and Discussion
3.1. Stage 1—Laboratory-Scale Research
According to the available literature data, it is possible to monitor the effectiveness of the pretreatment of organic substrates prior to the AD process by evaluating the changes in the concentration of organic matter in the dissolved phase []. It has been shown that the concentrations of dissolved COD and TOC often correlate strongly with the final technological effects of AD, namely the efficiency of biogas and CH4 production []. Based on these indicators, optimisation procedures and empirical equations have also been developed that allow for the reliable estimation of AD energy efficiency after the initial pretreatment of substrates with different properties and origins []. An example of this type of research is the use of solidified CO2 in the disintegration process of aerobic granular sludge (AGS) prior to AD, where a successive increase in COD in the supernatant was observed with increasing doses of solidified CO2 from 0.1 to 0.5 in the supernatant from 334 ± 15 to 450 ± 13 mgO2/L. For raw sludge, the COD concentration in the overlying liquid was 152 ± 14 mgO2/L []. Other studies focused on the use of ultrasonic disintegration for the pretreatment of excessive sewage sludge []. They showed that the COD concentration in the supernatant reached 4537.5 mg/L after 30 min of ultrasonic exposure. In the raw sludge, the COD content in the overlying liquid was 227.5 ± 27.5 mg/L []. Park et al. (2013) [], on the other hand, used ultrasonic disintegration to process microalgal biomass. The concentration of dissolved COD increased with the amount of energy applied. Energy doses of 50, 100 and 200 J/mL were used, resulting in COD concentrations of around 1250, 1350 and 1500 mg/L, respectively. With non-disintegrated biomass, the concentration of dissolved COD was around 750 mg/L [].
Laboratory-scale experiments (S1) also documented the effects of the HC process on the changes in organic matter content characterised by COD and TOC in the dissolved phase. This process was evaluated by monitoring the concentrations of these indicators and by assessing the degree of solubilisation, i.e., the efficiency of the transfer of organic matter from the solid phase to the solution, expressed as a percentage (Figure 7). For the raw substrate that was not subjected to the HC process (V0), the COD and TOC contents were 9.31 ± 1.02 gO2/L and 2.91 ± 0.18 g/L, respectively. In the variants V1–V3, where the pretreatment time was between 2 and 6 min, there was no significant effect of HC on the changes in the concentration of dissolved COD. The COD concentrations ranged from 9.97 ± 0.94 gO2/L (V1) to 11.98 ± 1.02 gO2/L (V3), with the degree of solubilisation increasing significantly from 3.7 ± 0.4% (V1) to 15.2 ± 1.2% (V3). Monitoring of the TOC content showed that the use of 6 and 8 min HC ensured a comparable, significant increase in this indicator in the dissolved phase to values of 4.08 ± 0.21 g/L (V3) and 4.37 ± 0.20 g/L (V3). L (V4) and the degree of solubilisation 19.0 ± 1.2% and 23.7 ± 1.7%.

Figure 7.
Changes in the concentrations of dissolved COD and TOC (A) and the degree of solubilisation of these indicators (B) as a function of the experimental variant in S1.
In V5, a significant increase in the concentration and solubility of both COD and TOC was observed after 10 min of HC. The COD content was 16.36 ± 1.34 gO2/L at a solubility level of 40.0 ± 2.3%, while the TOC content was 5.13 ± 0.29 g/L with 36.0 ± 2.1% solubilisation. The increase in HC time had no significant effect on the observed concentrations of organic compounds in the dissolved phase. For COD, the range was between 17.02 ± 2.07 gO2/L and 17.93 ± 1.74 gO2/L and for TOC between 5.52 ± 0.14 g/L and 6.11 ± 0.48 g/L. The degree of solubilisation in V7 for COD increased to 48.9 ± 2.6%, while for TOC, it was 51.9 ± 4.4%. Lower results were obtained by Mancuso et al. (2021) [], who investigated the influence of the HC time of the sewage sludge on the concentration of dissolved COD and the degree of solubilisation. The applied HC times of 0, 1, 2, 4 and 8 h resulted in dissolved COD concentrations of 244, 992, 1719, 2693 and 4578 mg/L and corresponding degrees of solubilisation of 0%, 1.7%, 6.5%, 10.8%, 19.2% []. An increase in the degree of solubilisation as a result of pretreatment was also achieved by Lee and Han (2013) [] by disintegrating activated sewage sludge with HC. After 1 min, a degree of solubilisation of 11.52% was achieved. After 5 min, it was about 14%; after 10 min, about 16.5%; and after 15 min, about 21%. After 20 min, however, it reached a value of 23.67% []. Other trends were found in other studies by Mancuso et al. (2019) [], in which the use of 1 h of HC WAS at a pressure of 2 bar resulted in a degree of dissolution of only 1.4% and an increase in dissolved COD from 228 to 617 mg/L. However, higher decay values can easily be achieved by changing the HC operating conditions, such as the inlet pressure and the HC treatment time []. This was confirmed in the study by Langone et al. (2018) [], in which one hour of HC treatment of cattle slurry led to an increase in COD in the liquid by 2040 mg/L at an inlet pressure of 6.0. A further increase in inlet pressure led to a further increase in COD values of 3340 and 5500 mg/L at inlet pressures of 7.0 and 8.0 bar, respectively. The degree of disintegration increased by 5.8, 8.9 and 15.8% after HC treatment at pressures of 6.0, 7.0 and 8.0 bar, respectively [].
In HC, cavitation bubbles grow on a solid surface (cavitation scoops) and then collapse under the influence of shear flows []. Low energy input and a short pretreatment time only promote the deagglomeration of flocs and not the release of soluble material. Increasing the energy input promotes the disruption of the cell wall and high solubilisation of the organic material. However, low energy levels lead to smaller particles, while higher energy input produces larger particles due to re-flocculation, resulting in structures that are resistant to anaerobic degradation []. HC is mainly used to disrupt and destroy the structures of cell walls and membranes, e.g., in bacteria [] and microalgae [], and less frequently to destroy complex structures of ligocellulosic biomass []. The substrate used in the study, consisting of milking plant effluent and cattle slurry, was unusual and had not been treated with HC before. According to Szaja et al. (2022) [], the results of HC treatment can be influenced by many factors, such as the type of cavitation reactor, operating inlet pressures, cavitation number, temperature, pH and initial pollutant concentration. In addition, the physico-chemical properties of the liquid used, including its vapour pressure, viscosity and surface tension, play an important role [].
In the further part of the experimental work carried out in S1, respirometric tests were performed to evaluate the direct effects of pretreatment with HC on the effectiveness of the AD process. The focus was on determining the possible total yield of biogas and CH4 and estimating the kinetics of the methane fermentation process. Respirometric testing is a common method of evaluating the effectiveness of the AD process. This is due to many advantages, including stable and repeatable conditions, thanks to which it is possible to reliably compare and evaluate the results obtained, the ability to simulate different process conditions, which allows easy optimisation of technological parameters, reliability as a measurement tool, ease of use and the possibility of evaluating the influence of inhibiting factors on biogas production []. They are also frequently used to evaluate the efficiency of the pretreatment process. An example of this is the work of Cydzik-Kwiatkowska et al. (2022) [], in which the effect of ultrasound on the AD of aerobic granulated sludge in 1 L glass bioreactors (OxiTop system) was investigated. After 0.5, 4.0 and 8.0 min of digestion, the biogas yield was 400 mL/gVS, 420 mL/gVS and 455 mL/gVS, respectively. In the case of raw sludge, 375 mL/gVS of biogas was obtained []. Another example is the work of Kim et al. (2023) [], which investigated the effects of alkaline thermal hydrolysis of cattle slurry on AD carried out in 250 mL serum bottles. The highest CH4 production of 227.0 ± 11.0 mL/gVS was measured at 160 °C with 2% (dry weight) NaOH addition, compared to AD of cattle manure without disintegration, where 182.2 ± 2.5 mL/gVS was observed []. In other studies [], the influence of ultrasonic disintegration of granulated microalgae-bacteria sediment on AD performed in respirometric batch reactors (AMPTS II, BPC Instruments AB, Lund, Sweden) was determined. Studies have shown a positive effect of sonication on the kinetics of the anaerobic process and CH4 production. The highest production was achieved in the variants where sonication lasted 150 to 200 s and was between 534 ± 16 and 561 ± 17 mL/gVS. CH4 production from the non-disintegrated substrate was 329 ± 20 mL/gVS [].
In the control experiment (V0), the biogas yield was 140 ± 20 mL/gCOD with an observed AD rate (r) of 42.6 ± 2.9 mL/day on average and a rate constant (k) of 0.30 1/day. The CH4 content was 62.4 ± 1.4%, resulting in 87 ± 10 mLCH4/gCOD. Similar AD efficiencies were observed in V1 and V2, with the HC time used ranging from 2 to 4 min. The production of biogas and CH4 in V1 was 142 ± 23 mL/gCOD and 88 ± 11 mLCH4/gCOD, while in V2 it was 161 ± 16 mL/gCOD and 100 ± 9 mLCH4/gCOD. A significant increase in the efficiency of the AD process and an increase in the values characterising the reaction kinetics were observed in V3. The amount of biogas obtained after 6 min of HC was 209 ± 31 mL/gCOD, and the amount of methane was 130 ± 13 mLCH4/gCOD. The indicators characterising the kinetics of the biogas production process were r—84.0 ± 9.1 mL/day and k—0.40 1/day.
The expansion of the pretreatment process with HC led to a successive increase in AD efficiency. The highest technological effects in terms of biogas and CH4 production were found in V5, where the tested HC time was 10 min. In this variant, 376 ± 14 mL/gCOD biogas (r—183.5 ± 4.3 mL/day, k—0.50 1/day) and 233 ± 5 mLCH4/gCOD (r—111.8 ± 2.7 mL/day, k—0.48 1/day) were achieved. Increasing the HC time in V6 and V7 had no significant effect on AD efficiency, which is characterised by the production of biogas, CH4 and the observed process kinetics. The biogas quantities obtained were in a narrow range from 369 ± 12 mL/gCOD to 362 ± 21 mL/gCOD and CH4 from 233 ± 6 mLCH4/gCOD to 228 ± 9 mLCH4/gCOD. The study confirmed the significant influence of the HC used on the increase in biogas production and the values of the indicators characterising the kinetics of the process; the pretreatment process used had no significant influence on the CH4 content in the biogas. The CH4 concentration was within narrow limits from 62.0 ± 1.9% in V3 to 63.6 ± 3.2% in V4. Detailed data on the efficiency and kinetics of the AD process in the subsequently implemented variants of S1 are shown in Table 3 and Figure 8.
Table 3.
Characteristic indicators of biogas and CH4 production depending on the HC time in S1.

Figure 8.
Kinetics of the AD process characterised by biogas and methane production as a function of the experimental variant S1.
The research results of Lee and Han (2013) [] on the effects of the disintegration of activated sewage sludge using HC on AD also show the dependence of the cumulative biogas yield on the degree of sludge disintegration. By using HC, a biogas production of 51.28 mL/gCOD was achieved, with a CH4 content of 56.99%. The sludge that did not undergo any pretreatment had a biogas production of 45.52 mL/gCOD and a CH4 content of 54.07% []. Fardinpoor et al. (2022) [] investigated the effect of HC on the AD of the cyanobacteria D. tharense. It was shown that it is possible to obtain 290.6 mLCH4/gVS, which meant an increase in CH4 production of up to 20.3%, as the CH4 production of untreated D. tharense was 241.5 mLCH4/gVS [].
In the study by Langone et al. (2018) [], HC was used to disintegrate cattle slurry prior to AD. At an inlet pressure of 6.0, the biogas production was 476 mL/gVS, and the CH4 concentration was 62.6%. A further increase in inlet pressure led to an increase in biogas yield to 486 mL/gVS and 491 mL/gVS mg/L at inlet pressures of 7.0 and 8.0 bar, respectively. Conversely, the CH4 concentration at a pressure of 7.0 was 62.7%. However, at a pressure of 8.0, a decrease in CH4 content to 61.4% was observed []. The reduced CH4 production after pretreatment, which was also observed in this study at V7, could be related to the high concentration of bioavailable substances that can negatively affect the methanisation process []. This phenomenon may also be related to the removal of organic material, leading to a net decrease in organic material available for CH4 production [] and the formation of resistant/toxic compounds []. In particular, inhibitors can be formed either by the pretreatment of biomass, which produces soluble phenolic compounds and soluble hemicellulose compounds such as furfural and hydroxymethylfurfural (HMF) [] or by the degradation of carbohydrates and amino acids into melanoidins that are difficult or impossible to degradation, the so-called Maillard reaction [].
The estimated energy balance based on the laboratory test results, presented in Table 4, showed that the highest similar value of gross energy obtained from biogas was found in V5 and V6, 5.33 Wh and 5.34 Wh, respectively. For the control variant V0 without pretreatment, the value was only 2.00 Wh. After taking into account the energy requirement for the HC process, it was found that none of the technological variants tested had a higher net energy gain than V0, which was 2.0 Wh. The highest net energy value among the variants with HC was found in V5, where the pretreatment process lasted 10 min. It was 1.65 Wh. In the other cases, the net energy yield ranged from 0.07 Wh (V7) to 1.28 (V1). Considering that the energy balance for AD research conducted in lab-scale batch reactors provides very estimated and approximate data. In the next stage (S2), further optimisation work was planned on a technical scale, with the initial pretreatment time being that which was used in S1V5.
Table 4.
Energy balance based on the results obtained in S1 on a laboratory scale.
Fardinpoor et al. (2022) [] also determined the energy efficiency of the HC process in combination with AD. The energy production (CH4) from raw D. tharense via AD was 9 MJ/kgTS, and the energy recovery was 41.4%. The use of HC increased the energy production to 10.8 MJ/kgTS. This shows that an energy recovery of 49.8% can be achieved under the conditions of maximum CH4 production []. However, it may not be possible to produce a large amount of CH4 from all strains because their internal properties, such as composition and cell wall, are completely different []. The energy consumption of the HC pretreatment process was measured to be 7.24 KWh/kg D. tharense for maximum CH4 production. The sum of the energy consumption for microalgae, AD and HC production was 8.5 KWh/kg cyanobacteria. The energy assessment showed that the energy gain did not compensate for the energy input required for HC pretreatment []. The energy efficiency of the HC process was also the subject of research by Langone et al. (2018) [], who disintegrated cattle slurry prior to AD. When the inlet pressure was increased from 6.0 to 8.0 bar, the energy consumption in the HC system increased from 1905 to 2872 kJ/kgVS, corresponding to 0.53 and 0.80 kWh/kgVS, respectively. All experiments with HC treatment showed a positive net energy content. However, at pressures of 6.0, 7.0 and 8.0 bar, the net energy content of HC decreased by 17, 20 and 25% compared to the untreated sample, reaching values of 2.43, 2.36 and 2.20 kWh/kgVS, respectively. This is due to the fact that the energy consumed for HC treatment was greater than the energy generated by the additional CH4 volume due to slurry dissolution. Nevertheless, the energy balance of this study did not take into account the benefits of HC treatment, which could lead to a more favourable energy balance []. HC treatment improves the rheological properties of the substrate, reducing the energy consumption for mixing and pumping in the AD process and allowing preheating of the substrates entering the digester. In addition, many factors, including the low environmental impact of the HC process, the efficiency of nitrogen removal and the reduction in pumping problems and mixer failures, have led to the HC system being recognised as a valuable pretreatment system [].
The experimental work carried out in S1 confirmed the fact, repeatedly confirmed in the literature, that there are relationships between the concentration of dissolved organic matter in the substrate and AD efficiency [,]. This is confirmed by the work of Lu et al. (2018) [], who used alkaline–ultrasound pretreatment of WAS in AD. Linear Pearson correlations confirmed the relationship between the absorbed dose and the concentration of dissolved organic matter []. Other studies by the authors concerned the use of ultrasonic disintegration for the pretreatment of acid whey []. The results of the correlation analysis of the duration of the UD with the concentration of dissolved organic compounds showed strong, statistically significant correlations for all tested technological variants, which differed in the absorbed dose applied to the substrate. The coefficients of determination calculated for the correlations UD/COD and UD/TOC reached R2 = 0.8908 and R2 = 0.7851, respectively [].
In our own investigations, which we carried out in S1, both the increase in the COD and TOC concentration in the dissolved phase and the degree of solubilisation were strongly positively correlated with the absorbed dose of HC introduced into the pretreated substrate (Figure 9). The coefficient of determination R2 was 0.9723 for the COD concentration and 0.9824 for the TOC. An even stronger correlation was found for the relationship between the degree of COD and TOC dissolution and the absorbed dose of HC introduced. The R2 values were 0.9855 and 0.9909, respectively.

Figure 9.
Linear relationships between the absorbed dose of HC introduced into the substrate and the concentration of organic compounds in the dissolved phase (A) and the degree of COD and TOC solubilisation achieved (B).
High values of the coefficient of determination R2 were also characteristic of the correlations between the tested HC variant and the efficiency of biogas and CH4 production and amounted to 0.9109 and 0.9054, respectively (Figure 10A). Strong positive correlations regarding the effect of HC on the production of gaseous metabolites of anaerobic bacteria had a direct influence on the gross energy obtained (Figure 10B). In this case, the strong relationship between HC time and gross energy value was characterised by the R2 coefficient of 0.9054. However, no strong relationship was found between the absorbed energy dose introduced into the substrate and the percentage of CH4 in the biogas (Figure 10A). Therefore, the R2 value of the indicator was 0.4056. When investigating the effects of the HC variants used on the net energy obtained, a weak negative coefficient was found in the laboratory tests, for which the R2 value was 0.3801 (Figure 10B).

Figure 10.
Linear relationships between the absorbed dose of HC introduced into the substrate and the production of biogas and CH4 (A) and the gross/net energy obtained (B).
Other researchers have also observed relationships between similar parameters. Park et al. (2013) [], who used ultrasonic disintegration for the treatment of C. vulgaris biomass, found that cumulative CH4 production showed a strong relationship with ultrasound dose. Ultrasound doses below 50 J/mL did not improve CH4 production. However, at doses higher than 50 J/mL, gas production was proportional to energy input []. In the study by Lu et al. (2018) [] on the influence of alkali–ultrasonic-based WAS pretreatment on AD, Pearson’s linear correlations confirmed the relationships between dissolved organic matter and biogas production [].
In other studies [], very strong positive correlations were found between COD concentrations and the amount of biogas and CH4 with increasing doses of solidified CO2 in the range of 0.1 to 0.3 used for the conditioning of AGS. The coefficients of determination were R2 = 0.8755 and R2 = 0.8881, respectively. Very strong positive correlations were also found between the mass ratio of solidified CO2 to AGS and the net energy gain, with a coefficient of determination R2 of 0.9643 []. In the study by Zupanc et al. (2023) [], which aimed to increase CH4 production from WAS as a result of HC disintegration, Pearson correlations also confirmed positive or negative relationships between physicochemical changes and CH4 production []. In the authors’ study [] on the use of ultrasonic disintegration for the pretreatment of acid whey, very strong positive correlations were found between COD and TOC concentrations and CH4 production efficiency, as shown by the coefficient of determination R2 = 0.9995 and R2 = 0.9746, respectively. A strong positive correlation was also observed between the duration of UD and gross energy gain (R2 = 0.8986). However, a negative correlation was found between the duration of the UD and the increase in net energy with a coefficient of determination of R2 = 0.6629, although this was not statistically significant [].
3.2. Stage 2—Full-Scale Research
In the control variant, in which the agricultural biogas plant was operated without pretreatment of the substrate used, the amount of biogas produced was 191 ± 8 L/kgCOD on average. The CH4 content of the biogas was 61.3 ± 1.8%. Taking into account the value of the OLR used, the biogas plant produced 11.5 ± 1.2 m3/day of biogas and 7.0 ± 1.0 m3CH4/day. The net energy production achieved was 64.5 ± 5.9 kWh/day. In the initial variant (V1) for further optimisation, in which the HC time was 10 min, a significantly higher unit production of biogas and CH4 was achieved, namely 332 ± 10 L/kgCOD and 211 ± 6 LCH4/kgCOD (63.5 ± 1.7%). With this HC variant, it was not possible to achieve a positive energy balance, as the net energy quantity was 57.2 ± 3.2 kWh/day on average, which was below the value achieved in V0. For this reason, the HC time of the tested substrate was shortened to 8 min in the next step (V2), which reduced the energy requirement to 46.9 kWh/day. It was found that shortening the pretreatment time had no significant effect on AD performance. The specific biogas yield was 327 ± 8 L/kgCOD with a CH4 content of 62.9 ± 1.9%, producing 6 ± 1.1 m3/day of biogas and 12.3 ± 1.2 m3CH4/day. In this variant, the net energy obtained was 66.4 ± 2.6 kWh/day, a value that was 13.9% higher than in V1 and 3.1% higher than in V0. Due to the improvement in the final energy effect, the HC time of the substrate was again limited to 6 min in the next variant (V3). In this case, the AD efficiency decreased significantly, which had a direct effect on the amount of energy produced. The biogas yield was 292.2 ± 6 L/kgCOD, and the observed CH4 content was 62.2 ± 2.1%. During the day, 10.9 m3CH4/day was produced with an energy value of 99.9 ± 3.0 kWh/day. Finally, the net energy value obtained in this variant was 64.6 ± 3.0 kWh/day, which was 2.5 kWh/day lower than in V2 and similar to V0. Detailed data on unit biogas production are presented in Figure 11; daily biogas production is shown in Figure 12. Table 5 presents the CH4 production and energy balance of the agricultural biogas plant.

Figure 11.
Biogas production per unit over the entire operating period of the agricultural biogas plant (A) and average values (B) in the following S2 variants.

Figure 12.
Daily biogas production over the entire operating period of the agricultural biogas plant (A) and average values (B) in the following S2 variants.
Table 5.
CH4 production and energy balance based on the results obtained in S2, realised in an agricultural biogas plant.
In other studies [] on the use of HC as a pretreatment method prior to AD on an industrial scale, the substrate consisted of cattle manure and wheat straw. The hydrodynamic disintegrator operated in batch mode. The number of cycles per day was 48 (1 min. loading/10 min. working/1 min. unloading). The AD was carried out in an agricultural biogas plant. The HC pretreatment increased the biogas production from 369 to 430 mL/gVS. However, the CH4 concentration in the biogas, which was 54.1%, did not increase significantly compared to the AD without pretreatment, where the CH4 concentration was 52.3%. The net energy yield was 61.05 kWh/day during disintegration. In contrast, it was 56.15 kWh/day for the variant without pretreatment []. Garuti et al. [] used HC for the first time on a large scale in an agricultural biogas plant. The composition of the mixture was quite different; it was mainly a mixture of 75.5% pig slurry, 22.4% maise silage and 1.8% triticale silage. The HC pretreatment improved the AD process and therefore maximised the specific CH4 production (4095 ± 176 LCH4/day) by about 10%. The HC pretreatment affected the viscosity and particle size of the digestate, which contributed to lower energy requirements for mixing, heating and pumping. As a result, after the installation of the HC reactor, the organic load factor (OLR) of the biogas plant was reduced from 3.17 to 2.92 kgVS/m3·day, which led to an increase in specific electricity production from 1.31 to 1.44 kW/kgVS. The average value of electricity consumption for the operation of the biogas plant was 1789 ± 71 kWh/day. The electricity consumption of the HC process (20 kW), which is to be expected in continuous operation, was calculated at 480 kWh/day. Therefore, the total electricity consumption for the operation of the biogas plant after the introduction of the HC process was estimated at around 2269 kWh/day. However, after the installation of the HC reactor, the electricity consumption for the operation of the biogas plant only increased by about 100 kWh/day and reached a measured value of 1889 ± 43 kWh/day. Since the total energy production was almost constant during the entire test period, the lower electricity consumption was associated with energy savings in the biogas plant of about 17% []. According to Tian et al. (2014) [], this difference in energy consumption can be justified by the electricity savings due to better mixing and pumping as a result of the lower viscosity of the digestate.
Previous research has shown that in addition to the direct technological effects associated with increasing the quantity and quality of the biogas produced, the use of HC also has other positive side effects. These include the possibility of using a shorter hydraulic retention time (HRT) in anaerobic digesters. This fact reduces the investment and operating costs directly related to the construction of plants with a smaller active volume and the expenses for their complete mixing. HC helps to improve dewaterability, which can reduce the cost of transporting digestate to agricultural fields [].
4. Conclusions
This completed work presents optimisation studies aimed at determining the technological and economic effectiveness of HC waste from dairy farming prior to the AD process. The advantage of the research is the fact that some of it was conducted on a large scale, which significantly increases its realisation and application value. Work carried out under real operating conditions takes into account many variables and factors that are constantly present in industrial plants. The results of laboratory tests come from trials carried out under optimised conditions, and therefore, the results obtained are not always confirmed in industrial practise. For this reason, long-term implementation work using equipment with a higher level of technological readiness and in a real environment is necessary in order to collect reliable data on the basis of which decisions can be made about the further development of the technology.
Laboratory scale tests have shown that the use of HC to pretreat an organic substrate based on a mixture of cattle slurry and wastewater from a milking station significantly increases the concentration of organic compounds in the dissolved phase. For the most effective variants, an increase of over 90% in the content of these indicators was observed for both COD and TOC. This resulted in a degree of solubilisation of 49 ± 2.6% for COD and almost 52 ± 4.4% for TOC. Strong positive correlations were found between the amount of HC energy introduced into the substrate and the transfer of organic material into the dissolved phase.
The highest technological effect in terms of biogas and methane yield was found in the variant in which the HC time was 10 min. The amount of these gaseous metabolic products of the fermentation process was 367 ± 14 mL/gCOD and 233 ± 4.1 mLCH4/gCOD. Extending the substrate residence time in the HC range no longer had a significant effect on the increase in AD efficiency. It was found that despite a more than 2.5-fold increase in CH4 production due to power consumption in the HC process, the amount of net energy recovered was lower for all pretreatment variants compared to the control sample.
The optimisation research was continued in the existing agricultural biogas plant. It turned out that although the variant selected after the laboratory-scale trials enabled a significant increase in the efficiency of the AD, it did not produce a positive net energy effect. For this reason, the HC time was shortened to 8 min, which increased the net energy gain by 13.9% compared to the initial variant and by 3.1% compared to the option without pretreatment.
Considering the results of our own research and the reports of other authors, there is a strong case for further increasing technological efficiency and improving the energy balance when HC is used for the disintegration of biomass prior to AD. A valid direction for further research is to evaluate the impact of increasing the proportion of dry matter and thus, organic compounds in the medium intended for disintegration on the course and efficiency of the process. The boundary between increasing the efficiency of the process and the degree of hydration at which the HC process is significantly disturbed should be determined.
Author Contributions
Conceptualization, M.D. (Marcin Dębowski) and M.Z.; Methodology, M.D. (Marcin Dębowski); Validation, M.D. (Marcin Dębowski); Formal analysis, M.D. (Marcin Dębowski) and J.K.; Investigation, M.D. (Marcin Dębowski), J.K., A.N., M.D. (Magda Dudek) and M.Z.; Resources, M.D. (Marcin Dębowski), J.K., A.N., M.D. (Magda Dudek) and M.Z.; Data curation, M.D. (Marcin Dębowski), J.K., A.N., M.D. (Magda Dudek) and M.Z.; Supervision, M.D. (Marcin Dębowski); Writing—original draft preparation, M.D. (Marcin Dębowski) and J.K.; Writing—review and editing, M.D. (Marcin Dębowski), J.K., A.N., M.D. (Magda Dudek) and M.Z.; Visualization, M.D. (Marcin Dębowski) and J.K.; Funding acquisition, M.D. (Marcin Dębowski). All authors have read and agreed to the published version of the manuscript.
Funding
This research was financially supported by works no. 29.610.023-110 of the University of Warmia and Mazury in Olsztyn and WZ/WB-IIŚ/3/2022 of the Bialystok University of Technology, funded by the Ministry of Science and Higher Education.
Data Availability Statement
Data are contained within the article.
Conflicts of Interest
The authors declare no conflicts of interest.
References
- Teleszewski, T.; Żukowski, M. The Influence of Sludge on Thermal Performance of Heat Exchanger Tubes Inside in an Anaerobic Digester. Annu. Set Environ. Prot. 2018, 20, 763–779. [Google Scholar]
- Karolinczak, B.; Walczak, J.; Bogacka, M.; Zubrowska-Sudol, M. Life Cycle Assessment of Sewage Sludge Mono-Digestion and Co-Digestion with the Organic Fraction of Municipal Solid Waste at a Wastewater Treatment Plant. Sci. Total Environ. 2024, 907, 167801. [Google Scholar] [CrossRef]
- Eggemann, L.; Rau, F.; Stolten, D. The Ecological Potential of Manure Utilisation in Small-Scale Biogas Plants. Appl. Energy 2023, 331, 120445. [Google Scholar] [CrossRef]
- Gadirli, G.; Pilarska, A.A.; Dach, J.; Pilarski, K.; Kolasa-Więcek, A.; Borowiak, K. Fundamentals, Operation and Global Prospects for the Development of Biogas Plants—A Review. Energies 2024, 17, 568. [Google Scholar] [CrossRef]
- Hafner, M.; Raimondi, P.P.; Bonometti, B. The Energy Sector and Energy Geopolitics in the MENA Region at a Crossroad. In Perspectives on Development in the Middle East and North Africa (MENA) Region; Springer Nature: Cham, Switzerland, 2023. [Google Scholar] [CrossRef]
- Walczak, J.; Karolinczak, B.; Zubrowska-Sudol, M. Effect of Co-Digestion and Hydrodynamic Disintegration on the Methane Potential of Sewage Sludge and Organic Fraction of Municipal Solid Waste with Consideration of the Carbon Footprint. Energy 2023, 282, 128949. [Google Scholar] [CrossRef]
- Teleszewski, T.J.; Żukowski, M. Analysis of Heat Loss of a Biogas Anaerobic Digester in Weather Conditions in Poland. J. Ecol. Eng. 2018, 19, 242–250. [Google Scholar] [CrossRef] [PubMed]
- Gajdzik, B.; Wolniak, R.; Nagaj, R.; Grebski, W.W.; Romanyshyn, T. Barriers to Renewable Energy Source (RES) Installations as Determinants of Energy Consumption in EU Countries. Energies 2023, 16, 7364. [Google Scholar] [CrossRef]
- Bumharter, C.; Bolonio, D.; Amez, I.; García Martínez, M.J.; Ortega, M.F. New Opportunities for the European Biogas Industry: A Review on Current Installation Development, Production Potentials and Yield Improvements for Manure and Agricultural Waste Mixtures. J. Clean. Prod. 2023, 388, 135867. [Google Scholar] [CrossRef]
- Banaszuk, P.; Kamocki, A.K.; Wysocka-Czubaszek, A.; Czubaszek, R.; Roj-Rojewski, S. Closing the Loop—Recovery of Nutrients and Energy from Wetland Biomass. Ecol. Eng. 2020, 143, 105643. [Google Scholar] [CrossRef]
- Dębowski, M.; Zieliński, M. Technological Effectiveness of Sugar-Industry Effluent Methane Fermentation in a Fluidized Active Filling Reactor (FAF-R). Energies 2020, 13, 6626. [Google Scholar] [CrossRef]
- Lafratta, M.; Thorpe, R.B.; Ouki, S.K.; Shana, A.; Germain, E.; Willcocks, M.; Lee, J. Dynamic Biogas Production from Anaerobic Digestion of Sewage Sludge for On-Demand Electricity Generation. Bioresour. Technol. 2020, 310, 123415. [Google Scholar] [CrossRef] [PubMed]
- Markowski, M.; Białobrzewski, I.; Zieliński, M.; Debowski, M.; Krzemieniewski, M. Optimizing Low-Temperature Biogas Production from Biomass by Anaerobic Digestion. Renew. Energy 2014, 69, 219–225. [Google Scholar] [CrossRef]
- Li, Y.; Qi, C.; Zhang, Y.; Li, Y.; Wang, Y.; Li, G.; Luo, W. Anaerobic Digestion of Agricultural Wastes from Liquid to Solid State: Performance and Environ-Economic Comparison. Bioresour. Technol. 2021, 332, 125080. [Google Scholar] [CrossRef] [PubMed]
- Czubaszek, R.; Wysocka-Czubaszek, A.; Tyborowski, R. Methane Production Potential from Apple Pomace, Cabbage Leaves, Pumpkin Residue and Walnut Husks. Appl. Sci. 2022, 12, 6128. [Google Scholar] [CrossRef]
- Sarrion, A.; Ipiales, R.P.; de la Rubia, M.A.; Mohedano, A.F.; Diaz, E. Chicken Meat and Bone Meal Valorization by Hydrothermal Treatment and Anaerobic Digestion: Biofuel Production and Nutrient Recovery. Renew. Energy 2023, 204, 652–660. [Google Scholar] [CrossRef]
- Kasinski, S. Mesophilic and Thermophilic Anaerobic Digestion of Organic Fraction Separated during Mechanical Heat Treatment of Municipal Waste. Appl. Sci. 2020, 10, 2412. [Google Scholar] [CrossRef]
- Czubaszek, R.; Wysocka-Czubaszek, A.; Wichtmann, W.; Banaszuk, P. Specific Methane Yield of Wetland Biomass in Dry and Wet Fermentation Technologies. Energies 2021, 14, 8373. [Google Scholar] [CrossRef]
- Czubaszek, R.; Wysocka-Czubaszek, A.; Banaszuk, P. GHG Emissions and Efficiency of Energy Generation through Anaerobic Fermentation of Wetland Biomass. Energies 2020, 13, 6497. [Google Scholar] [CrossRef]
- Kazimierowicz, J.; Dzienis, L. Giant Miscanthus as a Substrate for Biogas Production. J. Ecol. Eng. 2015, 16, 139–142. [Google Scholar] [CrossRef]
- Zieliński, M.; Dębowski, M.; Kisielewska, M.; Nowicka, A.; Rokicka, M.; Szwarc, K. Comparison of Ultrasonic and Hydrothermal Cavitation Pretreatments of Cattle Manure Mixed with Straw Wheat on Fermentative Biogas Production. Waste Biomass Valorization 2019, 10, 747–754. [Google Scholar] [CrossRef]
- Bhatt, A.H.; Tao, L. Economic Perspectives of Biogas Production via Anaerobic Digestion. Bioengineering 2020, 7, 74. [Google Scholar] [CrossRef]
- Park, J.; Cayetano, R.D.A.; Kim, G.B.; Jo, Y.; Kwon, Y.; Lei, Z.; Kim, S.H. Sludge Disintegration and Anaerobic Digestion Enhancement by Alkaline-Thermal Pretreatment: Economic Evaluation and Microbial Population Analysis. Bioresour. Technol. 2022, 346, 126594. [Google Scholar] [CrossRef]
- Coarita Fernandez, H.; Teixeira Franco, R.; Bayard, R.; Buffiere, P. Mechanical Pre-Treatments Evaluation of Cattle Manure Before Anaerobic Digestion. Waste Biomass Valorization 2020, 11, 5175–5184. [Google Scholar] [CrossRef]
- Wang, S.; Yu, S.; Lu, Q.; Liao, Y.; Li, H.; Sun, L.; Wang, H.; Zhang, Y. Development of an Alkaline/Acid Pre-Treatment and Anaerobic Digestion (APAD) Process for Methane Generation from Waste Activated Sludge. Sci. Total Environ. 2020, 708, 134564. [Google Scholar] [CrossRef]
- Malik, S.N.; Madhu, K.; Mhaisalkar, V.A.; Vaidya, A.N.; Mudliar, S.N. Pretreatment of Yard Waste Using Advanced Oxidation Processes for Enhanced Biogas Production. Biomass Bioenergy 2020, 142, 105780. [Google Scholar] [CrossRef]
- Preethi; Rajesh, B.J.; Sunita, V.; Sivashanmugam, P.; Vinay, K.T.; Gunasekaran, M. Breakthrough in Hydrolysis of Waste Biomass by Physico-Chemical Pretreatment Processes for Efficient Anaerobic Digestion. Chemosphere 2022, 294, 133617. [Google Scholar] [CrossRef]
- Kazimierowicz, J.; Dębowski, M.; Zieliński, M. The Synergistic Effect of Simultaneous Ultrasound Heating and Disintegration on the Technological Efficiency and Energetic Balance of Anaerobic Digestion of High-Load Slaughter Poultry Sewage. Appl. Sci. 2023, 13, 2420. [Google Scholar] [CrossRef]
- Szaja, A.; Szulżyk-Cieplak, J.; Łagód, S.; Kuzioła, E. Recent Developments in the Application of Ultrasonication in Pre-Treatment of Municipal Sewage Sludge. J. Ecol. Eng. 2023, 24, 223–234. [Google Scholar] [CrossRef] [PubMed]
- Hidaka, T.; Nakamura, M.; Oritate, F.; Nishimura, F. Comparative Anaerobic Digestion of Sewage Sludge at Different Temperatures with and without Heat Pre-Treatment. Chemosphere 2022, 307, 135808. [Google Scholar] [CrossRef] [PubMed]
- Zieliński, M.; Dębowski, M.; Rusanowska, P.; Kazimierowicz, J. Influence of Microwave Radiation on Pollutant Removal and Biomethane Production Efficiency in Anaerobic Treatment of High-Load Poultry Wastewater. Appl. Sci. 2023, 13, 3553. [Google Scholar] [CrossRef]
- Zhang, Q.; Yao, Y.; Xi, X. Effects of Freezing–Thawing Pretreatment on Anaerobic Digestion of Wheat Straw and Its Kinetics Analysis. Clean Technol. Environ. Policy 2022, 24, 125–141. [Google Scholar] [CrossRef]
- Kazimierowicz, J.; Dębowski, M.; Zieliński, M. Technological, Ecological, and Energy-Economic Aspects of Using Solidified Carbon Dioxide for Aerobic Granular Sludge Pre-Treatment Prior to Anaerobic Digestion. Int. J. Environ. Res. Public Health 2023, 20, 4234. [Google Scholar] [CrossRef]
- Kazimierowicz, J.; Dębowski, M.; Zieliński, M. Long-Term Pre-Treatment of Municipal Sewage Sludge with Solidified Carbon Dioxide (SCO2)—Effect on Anaerobic Digestion Efficiency. Appl. Sci. 2023, 13, 3075. [Google Scholar] [CrossRef]
- Dauknys, R.; Mažeikienė, A.; Paliulis, D. Effect of Ultrasound and High Voltage Disintegration on Sludge Digestion Process. J. Environ. Manage. 2020, 270, 110833. [Google Scholar] [CrossRef]
- Kovačič, A.; Škufca, D.; Zupanc, M.; Gostiša, J.; Bizjan, B.; Krištofelc, N.; Dolenc, M.S.; Heath, E. The Removal of Bisphenols and Other Contaminants of Emerging Concern by Hydrodynamic Cavitation: From Lab-Scale to Pilot-Scale. Sci. Total Environ. 2020, 743, 140724. [Google Scholar] [CrossRef]
- Lanfranchi, A.; Tassinato, G.; Valentino, F.; Martinez, G.A.; Jones, E.; Gioia, C.; Bertin, L.; Cavinato, C. Hydrodynamic Cavitation Pre-Treatment of Urban Waste: Integration with Acidogenic Fermentation, PHAs Synthesis and Anaerobic Digestion Processes. Chemosphere 2022, 301, 134624. [Google Scholar] [CrossRef] [PubMed]
- Zheng, H.; Zheng, Y.; Zhu, J. Recent Developments in Hydrodynamic Cavitation Reactors: Cavitation Mechanism, Reactor Design, and Applications. Engineering 2022, 19, 180–198. [Google Scholar] [CrossRef]
- Zhang, X.; Lin, R.; Zhang, L.; Chen, J.; Li, M.; Wang, Y. Numerical Investigation of Effect of Geometric Parameters on Performance of Rotational Hydrodynamic Cavitation Reactor. Ultrason. Sonochem. 2024, 103, 106790. [Google Scholar] [CrossRef] [PubMed]
- Carpenter, J.; Badve, M.; Rajoriya, S.; George, S.; Saharan, V.K.; Pandit, A.B. Hydrodynamic Cavitation: An Emerging Technology for the Intensification of Various Chemical and Physical Processes in a Chemical Process Industry. Rev. Chem. Eng. 2017, 33, 433–468. [Google Scholar] [CrossRef]
- Tao, Y.; Cai, J.; Huai, X.; Liu, B.; Guo, Z. Application of Hydrodynamic Cavitation to Wastewater Treatment. Chem. Eng. Technol. 2016, 39, 1363–1376. [Google Scholar] [CrossRef]
- Montusiewicz, A.; Pasieczna-Patkowska, S.; Lebiocka, M.; Szaja, A.; Szymańska-Chargot, M. Hydrodynamic Cavitation of Brewery Spent Grain Diluted by Wastewater. Chem. Eng. J. 2017, 313, 946–956. [Google Scholar] [CrossRef]
- Mancuso, G.; Langone, M.; Di Maggio, R.; Toscano, A.; Andreottola, G. Effect of Hydrodynamic Cavitation on Flocs Structure in Sewage Sludge to Increase Stabilization for Efficient and Safe Reuse in Agriculture. Bioremediat. J. 2022, 26, 41–52. [Google Scholar] [CrossRef]
- Zieliński, M.; Dębowski, M.; Kazimierowicz, J.; Nowicka, A.; Dudek, M. Application of Hydrodynamic Cavitation in the Disintegration of Aerobic Granular Sludge—Evaluation of Pretreatment Time on Biomass Properties, Anaerobic Digestion Efficiency and Energy Balance. Energies 2024, 17, 335. [Google Scholar] [CrossRef]
- Garlicka, A.; Zubrowska-Sudol, M.; Umiejewska, K.; Roubinek, O.; Palige, J.; Chmielewski, A. Effects of Thickened Excess Sludge Pre-Treatment Using Hydrodynamic Cavitation for Anaerobic Digestion. Energies 2020, 13, 2483. [Google Scholar] [CrossRef]
- Seo, Y.H.; Yun, Y.M.; Lee, H.; Han, J.I. Pretreatment of Cheese Whey for Hydrogen Production Using a Simple Hydrodynamic Cavitation System under Alkaline Condition. Fuel 2015, 150, 202–207. [Google Scholar] [CrossRef]
- Prado, C.A.; Cunha, M.L.S.; Arruda, G.L.; Cruz-Santos, M.M.; Antunes, F.A.F.; Shibukawa, V.P.; Terán-Hilares, R.; da Silva, S.S.; Santos, J.C. Hydrodynamic Cavitation-Assisted Acid Pretreatment and Fed-Batch Simultaneous Saccharification and Co-Fermentation for Ethanol Production from Sugarcane Bagasse Using Immobilized Cells of Scheffersomyces Parashehatae. Bioresour. Technol. 2024, 394, 130234. [Google Scholar] [CrossRef]
- Samani, B.H.; Behruzian, M.; Najafi, G.; Fayyazi, E.; Ghobadian, B.; Behruzian, A.; Mofijur, M.; Mazlan, M.; Yue, J. The Rotor-Stator Type Hydrodynamic Cavitation Reactor Approach for Enhanced Biodiesel Fuel Production. Fuel 2021, 283, 118821. [Google Scholar] [CrossRef]
- Islam, S.; Ranade, V.V. Enhancement of Biomethane Potential of Brown Sludge by Pre-Treatment Using Vortex Based Hydrodynamic Cavitation. Heliyon 2023, 9, e18345. [Google Scholar] [CrossRef] [PubMed]
- Ranade, V.V.; Bhandari, V.M.; Nagarajan, S.; Sarvothaman, V.P.; Simpson, A.A. Hydrodynamic Cavitation: Devices, Design, and Applications; John Wiley & Sons, Ltd.: Hoboken, NJ, USA, 2022. [Google Scholar]
- Wang, B.; Su, H.; Zhang, B. Hydrodynamic Cavitation as a Promising Route for Wastewater Treatment—A Review. Chem. Eng. J. 2021, 412, 128685. [Google Scholar] [CrossRef]
- Zaresharif, M.; Ravelet, F.; Kinahan, D.J.; Delaure, Y.M.C. Cavitation Control Using Passive Flow Control Techniques. Phys. Fluids 2021, 33, 121301. [Google Scholar] [CrossRef]
- Zampeta, C.; Bertaki, K.; Triantaphyllidou, I.E.; Frontistis, Z.; Vayenas, D.V. Treatment of Real Industrial-Grade Dye Solutions and Printing Ink Wastewater Using a Novel Pilot-Scale Hydrodynamic Cavitation Reactor. J. Environ. Manage. 2021, 297, 113301. [Google Scholar] [CrossRef]
- Gholami, A.; Pourfayaz, F.; Saifoddin, A. Techno-Economic Assessment and Sensitivity Analysis of Biodiesel Production Intensified through Hydrodynamic Cavitation. Energy Sci. Eng. 2021, 9, 1997–2018. [Google Scholar] [CrossRef]
- Skorb, E.V.; Möhwald, H.; Andreeva, D.V. Effect of Cavitation Bubble Collapse on the Modification of Solids: Crystallization Aspects. Langmuir 2016, 32, 11072–11085. [Google Scholar] [CrossRef]
- Blagojevič, M.; Rak, G.; Bizjan, B.; Kolbl Repinc, S. A Review on Rotary Generators of Hydrodynamic Cavitation for Wastewater Treatment and Enhancement of Anaerobic Digestion Process. Processes 2023, 11, 514. [Google Scholar] [CrossRef]
- Ge, M.; Sun, C.; Zhang, G.; Coutier-Delgosha, O.; Fan, D. Combined Suppression Effects on Hydrodynamic Cavitation Performance in Venturi-Type Reactor for Process Intensification. Ultrason. Sonochem. 2022, 86, 106035. [Google Scholar] [CrossRef] [PubMed]
- Ge, M.; Manikkam, P.; Ghossein, J.; Kumar Subramanian, R.; Coutier-Delgosha, O.; Zhang, G. Dynamic Mode Decomposition to Classify Cavitating Flow Regimes Induced by Thermodynamic Effects. Energy 2022, 254, 124426. [Google Scholar] [CrossRef]
- Zevnik, J.; Dular, M. Cavitation Bubble Interaction with a Rigid Spherical Particle on a Microscale. Ultrason. Sonochem. 2020, 69, 105252. [Google Scholar] [CrossRef] [PubMed]
- Gogate, P.R.; Patil, P.N. Combined Treatment Technology Based on Synergism between Hydrodynamic Cavitation and Advanced Oxidation Processes. Ultrason. Sonochem. 2015, 25, 60–69. [Google Scholar] [CrossRef] [PubMed]
- Save, S.S.; Pandit, A.B.; Joshi, J.B. Use of Hydrodynamic Cavitation for Large Scale Microbial Cell Disruption. Food Bioprod. Process. 1997, 75, 41–49. [Google Scholar] [CrossRef]
- Kim, H.; Sun, X.; Koo, B.; Yoon, J.Y. Experimental Investigation of Sludge Treatment Using a Rotor-Stator Type Hydrodynamic Cavitation Reactor and an Ultrasonic Bath. Processes 2019, 7, 790. [Google Scholar] [CrossRef]
- Holkar, C.R.; Jadhav, A.J.; Pinjari, D.V.; Pandit, A.B. Cavitationally Driven Transformations: A Technique of Process Intensification. Ind. Eng. Chem. Res. 2019, 58, 5797–5819. [Google Scholar] [CrossRef]
- Bhat, A.P.; Gogate, P.R. Cavitation-Based Pre-Treatment of Wastewater and Waste Sludge for Improvement in the Performance of Biological Processes: A Review. J. Environ. Chem. Eng. 2021, 9, 104743. [Google Scholar] [CrossRef]
- Garuti, M.; Langone, M.; Fabbri, C.; Piccinini, S. Monitoring of Full-Scale Hydrodynamic Cavitation Pretreatment in Agricultural Biogas Plant. Bioresour. Technol. 2018, 247, 599–609. [Google Scholar] [CrossRef]
- Langone, M.; Soldano, M.; Fabbri, C.; Pirozzi, F.; Andreottola, G. Anaerobic Digestion of Cattle Manure Influenced by Swirling Jet Induced Hydrodynamic Cavitation. Appl. Biochem. Biotechnol. 2018, 184, 1200–1218. [Google Scholar] [CrossRef]
- Meneguzzo, F.; Brunetti, C.; Fidalgo, A.; Ciriminna, R.; Delisi, R.; Albanese, L.; Zabini, F.; Gori, A.; dos Santos Nascimento, L.B.; De Carlo, A.; et al. Real-Scale Integral Valorization of Waste Orange Peel via Hydrodynamic Cavitation. Processes 2019, 7, 581. [Google Scholar] [CrossRef]
- Zupanc, M.; Humar, B.B.; Dular, M.; Gostiša, J.; Hočevar, M.; Repinc, S.K.; Krzyk, M.; Novak, L.; Ortar, J.; Pandur, Ž.; et al. The Use of Hydrodynamic Cavitation for Waste-to-Energy Approach to Enhance Methane Production from Waste Activated Sludge. J. Environ. Manage. 2023, 347, 119074. [Google Scholar] [CrossRef]
- Ogonowski, W. Multifunctional Rotor for the Cavitation Treatment of Liquid Media and Method of Using This Rotor. PL Patent 214335, 21 December 2012. [Google Scholar]
- Zou, X.; Yang, R.; Zhou, X.; Cao, G.; Zhu, R.; Ouyang, F. Effects of Mixed Alkali-Thermal Pretreatment on Anaerobic Digestion Performance of Waste Activated Sludge. J. Clean. Prod. 2020, 259, 120940. [Google Scholar] [CrossRef]
- Dębowski, M.; Kisielewska, M.; Zieliński, M.; Kazimierowicz, J. The Influence of the Ultrasound Disintegration of Microalgal–Bacterial Granular Sludge on Anaerobic Digestion Efficiency. Appl. Sci. 2023, 13, 7387. [Google Scholar] [CrossRef]
- Zawieja, I. Effect of Dry Ice Modification of Excess Sludge on the Methane Fermentation Process. Annu. Set Environ. Prot. 2018, 20, 558–573. [Google Scholar]
- Hu, K.; Jiang, J.Q.; Zhao, Q.L.; Lee, D.J.; Wang, K.; Qiu, W. Conditioning of Wastewater Sludge Using Freezing and Thawing: Role of Curing. Water Res. 2011, 45, 5969–5976. [Google Scholar] [CrossRef] [PubMed]
- Kazimierowicz, J.; Dębowski, M.; Zieliński, M. Biohythane Production in Hydrogen-Oriented Dark Fermentation of Aerobic Granular Sludge (AGS) Pretreated with Solidified Carbon Dioxide (SCO2). Int. J. Mol. Sci. 2023, 24, 4442. [Google Scholar] [CrossRef]
- Li, X.; Zhu, T.; Zhang, K.; Lv, L.; Chai, T.; Shen, Y.; Wang, Y.; You, M.; Xie, Y. Effect of the Sequence Ultrasonic Operation on Anaerobic Degradation of Sewage Sludge. Int. Biodeterior. Biodegrad. 2016, 112, 66–71. [Google Scholar] [CrossRef]
- Park, K.Y.; Kweon, J.; Chantrasakdakul, P.; Lee, K.; Cha, H.Y. Anaerobic Digestion of Microalgal Biomass with Ultrasonic Disintegration. Int. Biodeterior. Biodegrad. 2013, 85, 598–602. [Google Scholar] [CrossRef]
- Lee, I.; Han, J.I. The Effects of Waste-Activated Sludge Pretreatment Using Hydrodynamic Cavitation for Methane Production. Ultrason. Sonochem. 2013, 20, 1450–1455. [Google Scholar] [CrossRef]
- Mancuso, G.; Langone, M.; Andreottola, G.; Bruni, L. Effects of Hydrodynamic Cavitation, Low-Level Thermal and Low-Level Alkaline Pre-Treatments on Sludge Solubilisation. Ultrason. Sonochem. 2019, 59, 104750. [Google Scholar] [CrossRef]
- Petkovšek, M.; Mlakar, M.; Levstek, M.; Stražar, M.; Širok, B.; Dular, M. A Novel Rotation Generator of Hydrodynamic Cavitation for Waste-Activated Sludge Disintegration. Ultrason. Sonochem. 2015, 26, 408–414. [Google Scholar] [CrossRef] [PubMed]
- Luste, S.; Heinonen-Tanski, H.; Luostarinen, S. Co-Digestion of Dairy Cattle Slurry and Industrial Meat-Processing by-Products—Effect of Ultrasound and Hygienization Pre-Treatments. Bioresour. Technol. 2012, 104, 195–201. [Google Scholar] [CrossRef]
- Mittal, R.; Ranade, V.V. Intensifying Extraction of Biomolecules from Macroalgae Using Vortex Based Hydrodynamic Cavitation Device. Ultrason. Sonochem. 2023, 94, 106347. [Google Scholar] [CrossRef]
- Terán Hilares, R.; dos Santos, J.C.; Ahmed, M.A.; Jeon, S.H.; da Silva, S.S.; Han, J.I. Hydrodynamic Cavitation-Assisted Alkaline Pretreatment as a New Approach for Sugarcane Bagasse Biorefineries. Bioresour. Technol. 2016, 214, 609–614. [Google Scholar] [CrossRef] [PubMed]
- Szaja, A.; Montusiewicz, A.; Lebiocka, M. Challenges of Hydrodynamic Cavitation of Organic Wastes. Appl. Sci. 2022, 12, 7936. [Google Scholar] [CrossRef]
- Cimochowicz-Rybicka, M.; Rybicki, S. Application of Respirometric Tests for Assessment of Methanogenic Bacteria Activity in Wastewater Sludge Processing. Inżynieria Ekol. 2011, 14, 30–42. [Google Scholar] [CrossRef]
- Cydzik-Kwiatkowska, A.; Bernat, K.; Zielińska, M.; Gusiatin, M.Z.; Wojnowska-Baryła, I.; Kulikowska, D. Valorization of Full-Scale Waste Aerobic Granular Sludge for Biogas Production and the Characteristics of the Digestate. Chemosphere 2022, 303, 135167. [Google Scholar] [CrossRef]
- Kim, S.; Lee, C.; Young Kim, J. Effects of Alkaline Thermal Hydrolysis on the Formation of Refractory Compounds and Energy Balance of Anaerobic Digestion of Cattle Manure. Appl. Energy 2023, 342, 121097. [Google Scholar] [CrossRef]
- Fardinpoor, M.; Perendeci, N.A.; Yılmaz, V.; Taştan, B.E.; Yılmaz, F. Effects of Hydrodynamic Cavitation-Assisted NaOH Pretreatment on Biofuel Production from Cyanobacteria: Promising Approach. Bioenergy Res. 2022, 15, 289–302. [Google Scholar] [CrossRef]
- Braeutigam, P.; Franke, M.; Ondruschka, B. Effect of Ultrasound Amplitude and Reaction Time on the Anaerobic Fermentation of Chicken Manure for Biogas Production. Biomass Bioenergy 2014, 63, 109–113. [Google Scholar] [CrossRef]
- Hendriks, A.T.W.M.; Zeeman, G. Pretreatments to Enhance the Digestibility of Lignocellulosic Biomass. Bioresour. Technol. 2009, 100, 10–18. [Google Scholar] [CrossRef]
- Galbe, M.; Zacchi, G. Pretreatment: The Key to Efficient Utilization of Lignocellulosic Materials. Biomass Bioenergy 2012, 46, 70–78. [Google Scholar] [CrossRef]
- Zabed, H.M.; Akter, S.; Yun, J.; Zhang, G.; Zhang, Y.; Qi, X. Biogas from Microalgae: Technologies, Challenges and Opportunities. Renew. Sustain. Energy Rev. 2020, 117, 109503. [Google Scholar] [CrossRef]
- Tian, L.; Shen, F.; Yuan, H.; Zou, D.; Liu, Y.; Zhu, B.; Li, X. Reducing Agitation Energy-Consumption by Improving Rheological Properties of Corn Stover Substrate in Anaerobic Digestion. Bioresour. Technol. 2014, 168, 86–91. [Google Scholar] [CrossRef]
- Lu, D.; Xiao, K.; Chen, Y.; Soh, Y.N.A.; Zhou, Y. Transformation of Dissolved Organic Matters Produced from Alkaline-Ultrasonic Sludge Pretreatment in Anaerobic Digestion: From Macro to Micro. Water Res. 2018, 142, 138–146. [Google Scholar] [CrossRef]
- Kazimierowicz, J.; Zieliński, M.; Bartkowska, I.; Dębowski, M. Effect of Acid Whey Pretreatment Using Ultrasonic Disintegration on the Removal of Organic Compounds and Anaerobic Digestion Efficiency. Int. J. Environ. Res. Public Health 2022, 19, 11362. [Google Scholar] [CrossRef] [PubMed]
- Zieliński, M.; Dębowski, M.; Kisielewska, M.; Nowicka, A.; Rokicka, M.; Szwarc, K. Cavitation-Based Pretreatment Strategies to Enhance Biogas Production in a Small-Scale Agricultural Biogas Plant. Energy Sustain. Dev. 2019, 49, 21–26. [Google Scholar] [CrossRef]
Disclaimer/Publisher’s Note: The statements, opinions and data contained in all publications are solely those of the individual author(s) and contributor(s) and not of MDPI and/or the editor(s). MDPI and/or the editor(s) disclaim responsibility for any injury to people or property resulting from any ideas, methods, instructions or products referred to in the content. |
© 2024 by the authors. Licensee MDPI, Basel, Switzerland. This article is an open access article distributed under the terms and conditions of the Creative Commons Attribution (CC BY) license (https://creativecommons.org/licenses/by/4.0/).