Article

Circular Economy for the Energy System as a Leverage for Low-Carbon Transition: Long-Term Analysis of the Case of the South-East Region of France

Centre for Applied Mathematics, MINES Paris—PSL, 06904 Sophia Antipolis, France
*
Authors to whom correspondence should be addressed.
Energies 2024, 17(6), 1407; https://doi.org/10.3390/en17061407
Submission received: 9 February 2024 / Revised: 3 March 2024 / Accepted: 11 March 2024 / Published: 14 March 2024

Abstract

:
The circular economy is a decisive strategy for reconciling economic development and the environment. In France, the CE was introduced into the law in 2015 with the objective of closing the loop. The legislation also delegates energy policy towards the French regions by granting them the jurisdiction to directly plan the energy–climate issues on their territory and to develop local energy resources. Thereby, the SUD PACA region has redefined its objectives and targeted carbon neutrality and the transition to a CE by 2050. To study this transition, we developed a TIMESPACA optimization model. The results show that following a CE perspective to develop a local energy system could contribute to reducing CO2 emissions by 50% in final energy consumption and reaching almost free electricity production. To obtain greater reductions, the development of the regional energy systems should follow a careful policy design favoring the transition to low energy-consuming behavior and the strategical allocation of resources across the different sectors. Biomethane should be allocated to the buildings and industrial sector, while hydrogen should be deployed for buses and freight transport vehicles.

1. Introduction

The circular economy (CE) concept is still under theoretical construct, but it can be defined as “An economic system whose main objective is to contribute to sustainable development (meeting current needs without compromising those of tomorrow), dissociating economic growth from environmental impact and social inequality. This involves redesigning how society consumes and produces and how it interacts with the environment and with society itself via innovative business models and a sustained public policy. The deployment of a CE implies the optimal implementation of the 4 Rs, namely “reduce, reuse, recycle, and recover”. This approach aims to minimize resource consumption, applying a systemic strategy at the micro (businesses and households), meso (industrial collaborations, regional initiatives), macro (national and global contexts), and supply chain levels (interactions between previous levels) [1]”. A CE approach seeks to minimize resource consumption and extend the lifespan of materials, promoting efficiency and innovation while considering a systemic perspective [2,3,4,5]. A CE endeavors to shift the perception of waste to that of a resource that can be reintegrated into the production cycle or returned to the environment in a way that aligns with natural systems, thereby contributing to sustainability [6,7]. Consequently, a CE emerges as a promising solution to address resource scarcity and climate change by prioritizing sustainable practices.
The implementation of a circular economy perspective can be a valuable strategy to address climate issues [2,3]. In fact, the low-carbon energy transition aims to reduce the environmental impact of energy production and consumption by increasing resource efficiency, reducing energy consumption, and shifting to the use of renewable resources [8]. This perfectly aligns with the CE philosophy [9]. Moreover, a CE can ensure the supply of energy in a sustainable way by maximizing the use of local resources, for example, via energy recovery [10]. This can contribute to energy security and reduce risks related to geopolitical issues and resource depletion, which is also an objective of the low-carbon energy transition. Consequently, CE and energy transition are inherently intertwined [11].
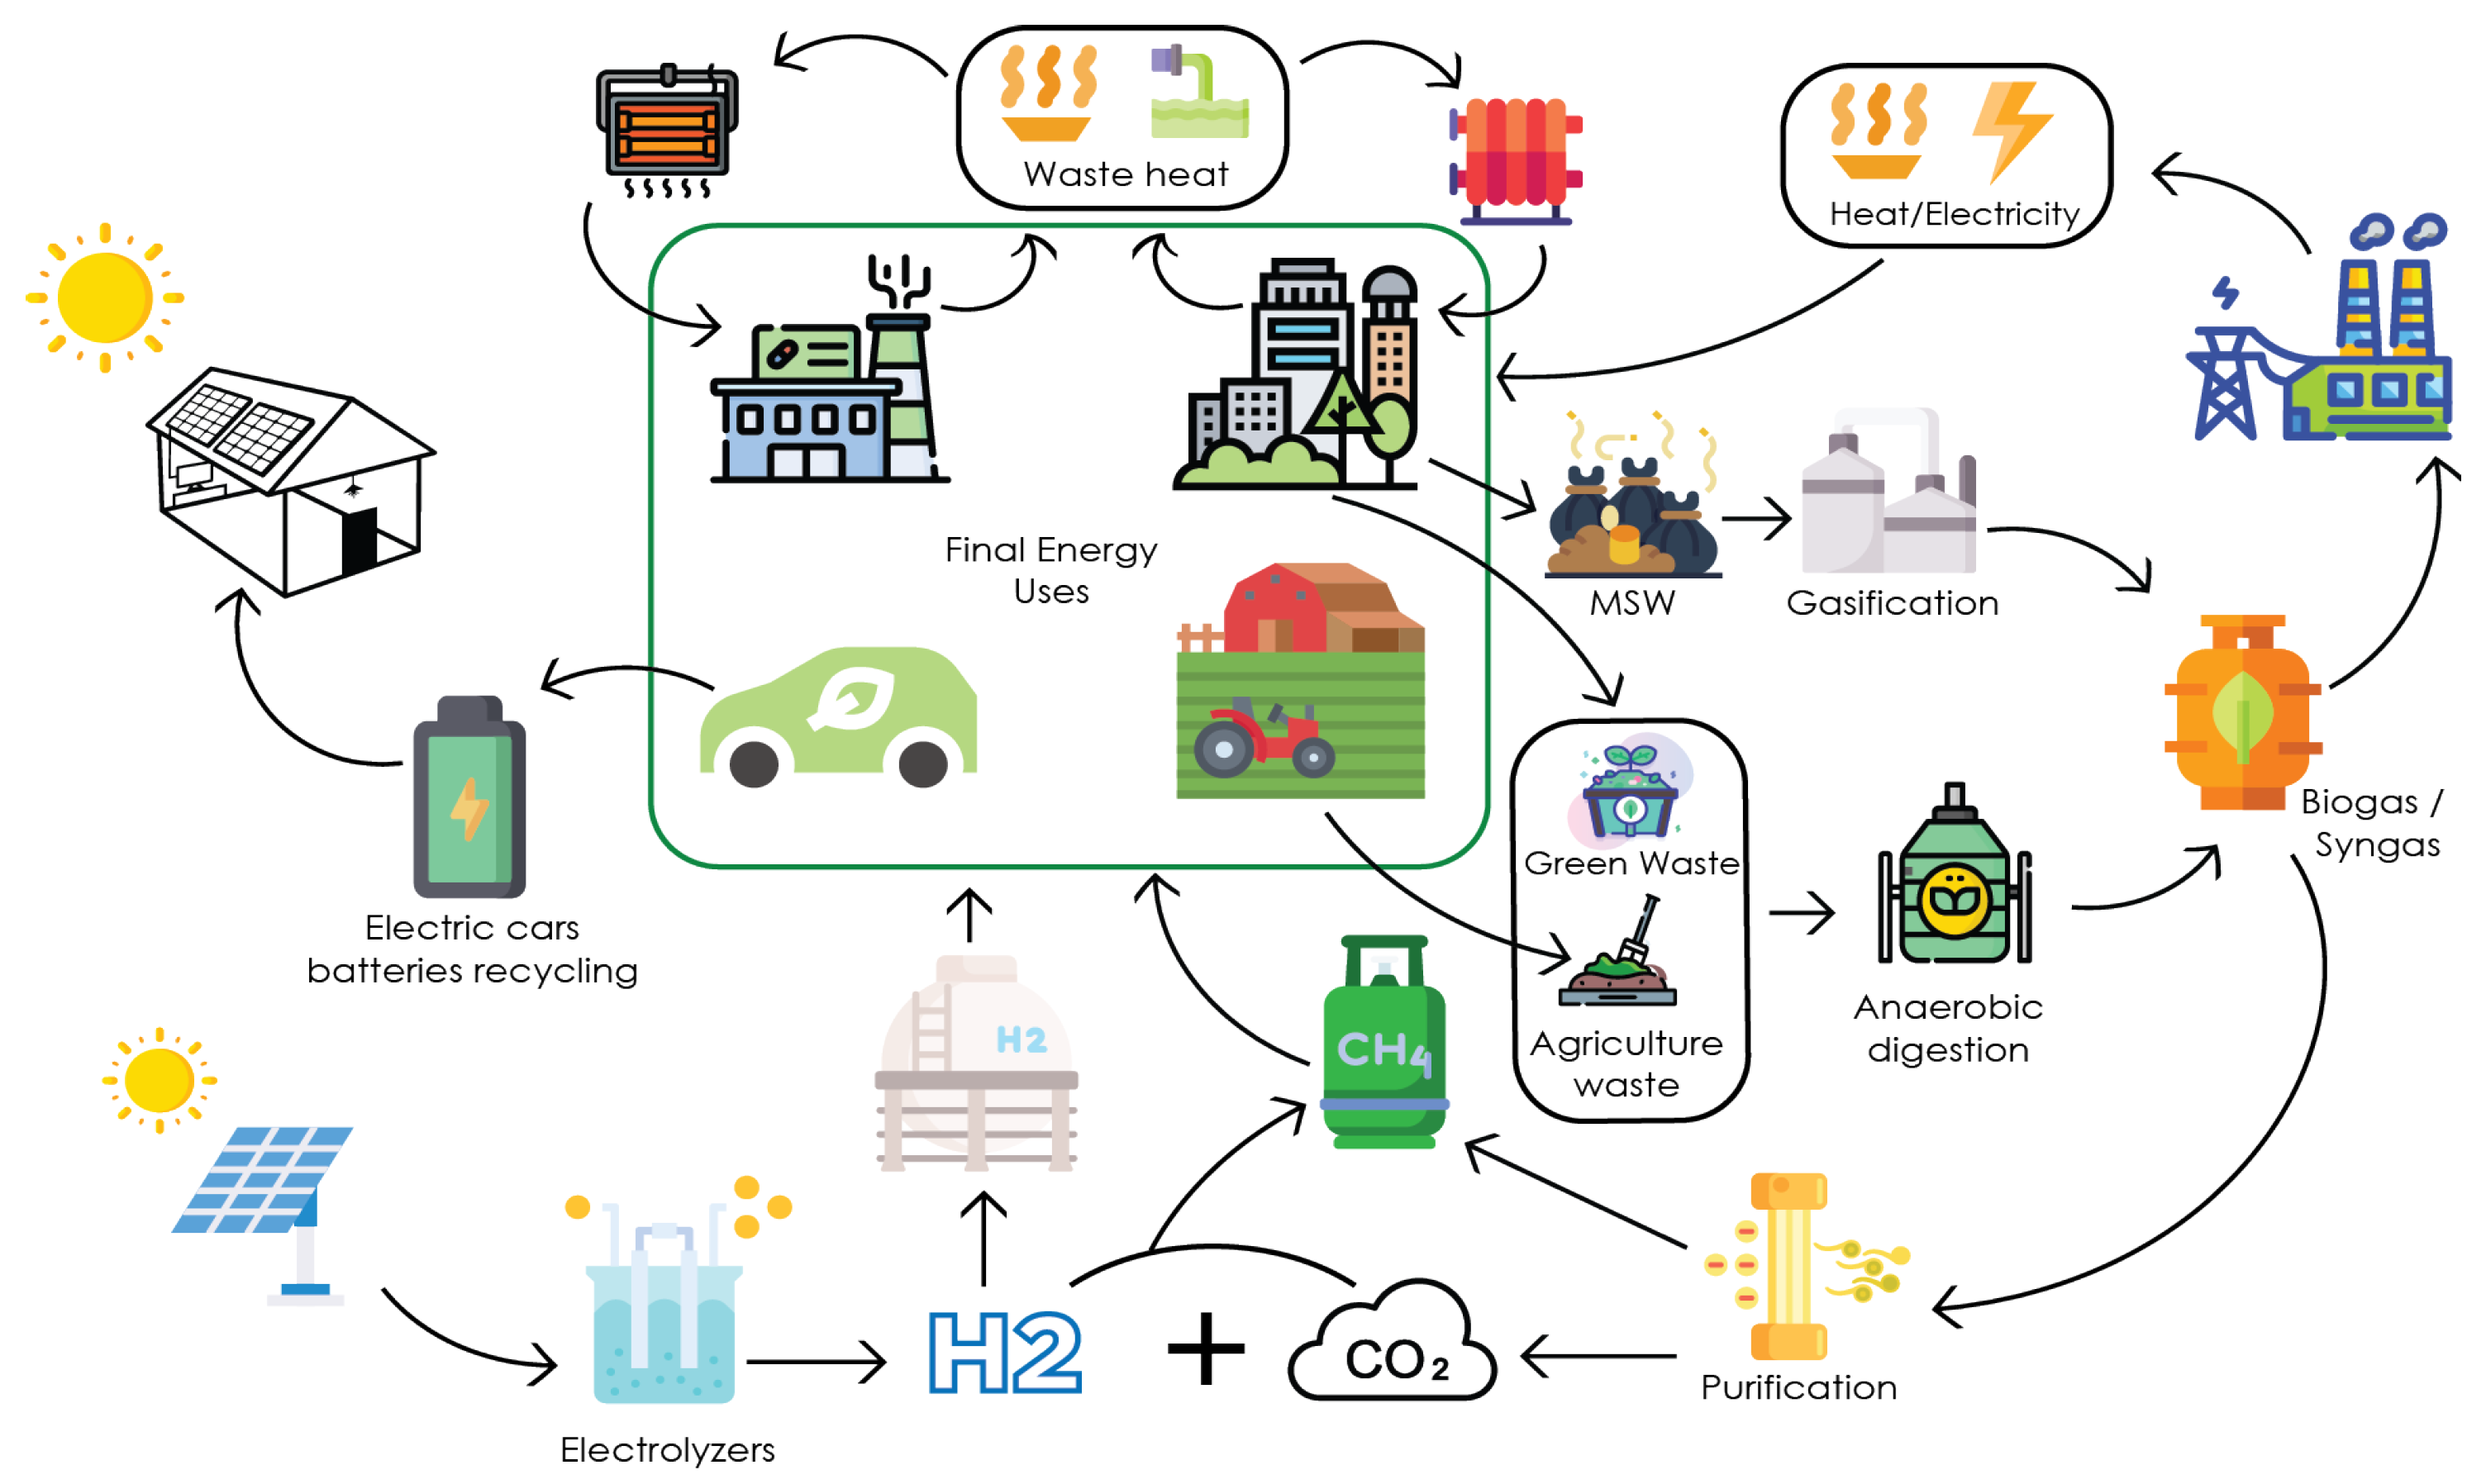
Different initiatives have been explored from a CE perspective to recover energy from resources that would have otherwise been buried or disposed of. One of the most researched options is the recovery of energy from municipal solid waste (MSW), given the increasing production of waste in urban areas [12]. Burning MSW allows for the recovery of heat and electricity, which helps manage waste and meet rising energy demand [3,13]. However, waste incineration should ideally be the last resort, as it produces atmospheric pollutants and destroys materials, requiring new resources [13,14]. Gasification of MSW or wastewater sludge (WWS) is another method of energy recovery that can produce synthetic gas (syngas) [15]. Syngas typically contains carbon monoxide (20–30%), hydrogen (30–45%), carbon dioxide (15–25%), nitrogen (3–5%), and methane (8–12%) [16]. This syngas can be used directly to produce energy or can be purified (CO2 extraction) to be injected into gas transport and distribution networks [10,17]. Anaerobic digestion is another process that can be used to recover energy from waste [18,19]. This applies to organic waste such as WWS, food waste, and biowaste from agricultural activities. In this case, biogas can be recovered and follow a similar path to syngas.
Another option for implementing a CE in the context of a low-carbon energy transition is to use CO2 to produce other products. Methanation is one such process that enables the utilization of CO2; when CO2 is mixed with hydrogen, methane is produced and can be injected into the gas grid [20]. Unused resources can be recovered from a CE perspective to achieve a low-carbon energy transition. For instance, waste heat from industrial activities or wastewater can be used to increase system efficiency by recovering unused heat via district heating networks [21,22,23]. This unused heat can be transported to consumers demanding heating or used to produce electricity [24]. Batteries from end-of-life electric vehicles can also be reused to store electricity during periods of high photovoltaic production, extending the life cycle of the batteries and allowing for greater benefits from solar production [25,26,27].
As a CE presents several solutions to current environmental challenges, many policy planners have increasingly integrated it as a strategy to reach their environmental goals. In many European countries, the CE has been part of environmental policies since the end of the twentieth century [28], and recently, it has gained further momentum with the adoption of the CE action plan by the European Commission in 2015, updated in 2020 [29]. In France, the CE was introduced in 2015 via the LTCEV (Law for the energy transition and green growth). The objective of this law was to reduce resource wastage and to “close the loop” [30]. At the same time, via the LTECV, France redefined its decarbonization objectives and achieved a new milestone in extending the management of its energy policy to its territories. This allows for a more shared definition of policies and objectives while granting local authorities the necessary jurisdiction to implement an energy transition for their own local energy systems [31]. The interest in the territorialization of energy policy lies in finding complementary solutions across different sectors, such as urban planning, transport, and housing, which can lead to more dynamic actions for a rapid energy transition [32]. Additionally, territories can adopt more precise policies based on their respective energy realities, responding to their unique challenges, mobilizing local decentralized renewable resources, and building synergies between urban and rural areas [33]. As a result, most French territories have established new objectives for the clean development of their energy systems. The SUD PACA region in the southeast of France has, for example, set a target to achieve a circular territory and carbon-neutral energy system by 2050 via the significant development of renewable resources [34].
Research into how the CE can help the energy transition has mainly focused on individual applications and mostly on waste to energy, including waste heat recovery, municipal solid waste to energy, biowaste to energy, etc. Recently, a few studies have started to tackle the subject of energy systems and the circular economy in an integrated manner. For example, [35] studied the implementation of a CE for a city in China, and [36] studied the application of a CE for the decarbonization of the residential sector. Fostering the analysis of CE in all aspects of society is crucial, first to understand the effects of its application and second to foster its implementation [37]. Moreover, the CE should be further studied at the local level, as resource recovery potential is generally located close to high-population areas.
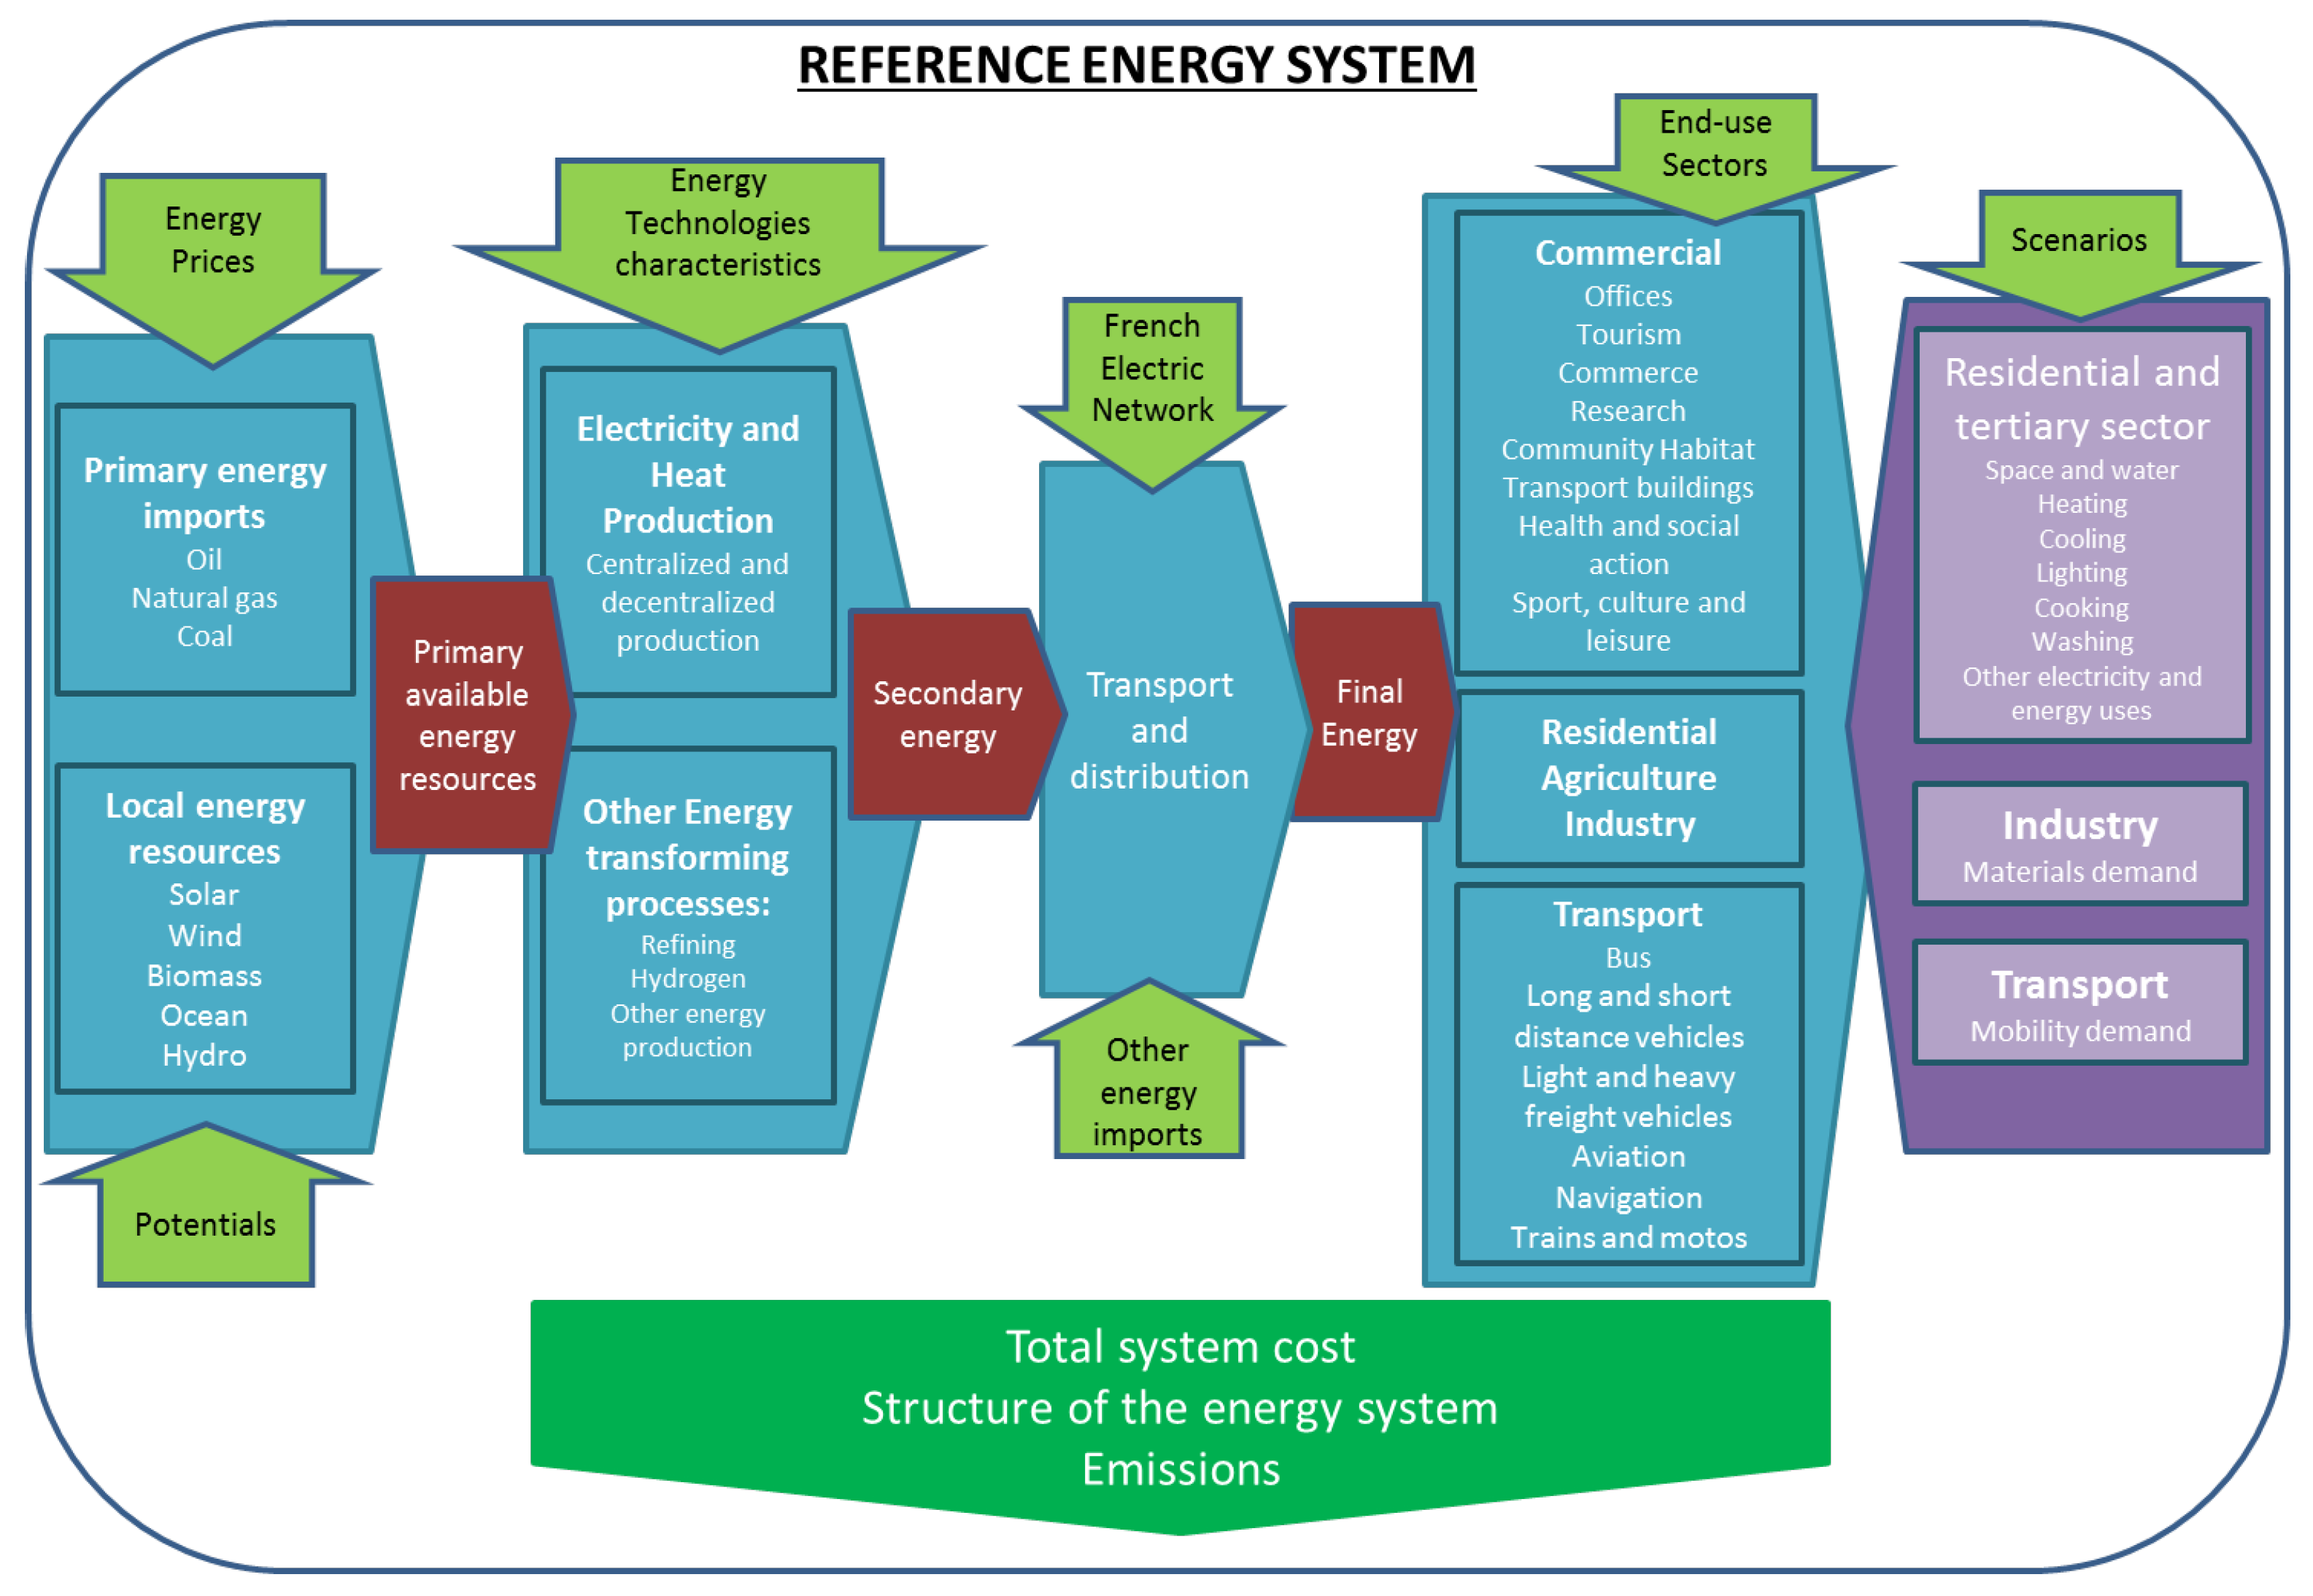
In this context, the objective of this research is first to study how CE can be integrated into a prospective modeling tool and, second, to observe how such a strategy can help a local area to reach its climate objectives. This analysis will therefore show how integrating a CE perspective can impact strategy for the sustainable transition of a regional energy system. Additionally, this study will demonstrate the importance of deploying sustainable energy solutions at the local scale to reach ambitious national and global decarbonization objectives. Moreover, the analysis of the energy system in the SUD PACA region could provide a basis for studying the development of sustainable energy solutions in other regions of the world with similar climate conditions and energy system configurations.

2. Materials and Methods

2.1. The Area of Study: The SUD PACA Region

The SUD PACA region had 5 million inhabitants in 2017. As a region, it is the fourth-largest consumer of final energy in France (509 PJ in 2017, 8% of national final energy consumption). This energy demand is mainly covered by fossil fuels. Petroleum products account for more than 50% of the region’s final energy demand. This high fossil fuel demand is explained by the presence of a large industrial sector (bigger than in the rest of France), which consumes 32% of the regional energy, coupled with high energy consumption from the transport sector (which remains comparable at the national level) representing 37% of total regional energy consumption. The residential sector represents one-third of the region’s energy consumption, with heating being the largest energy use, covered mostly by natural gas. The SUD PACA region comprises six départements (local authorities): Alpes-de-Haute-Provence, Hautes-Alpes, Alpes-Maritimes, Var, Vaucluse, and Bouches-du-Rhône. The energy requirements of these departments are subject to notable differences. Bouches-du-Rhône stands out as the largest energy consumer, accounting for over 50% of the final energy consumed in the region. This difference can be attributed to the presence of high energy-intensive industries, such as steel, cement, and refineries, coupled with a dense population. In addition, most of the energy consumption is located in littoral areas due to their high population concentration [38].
Considering energy supply, the SUD PACA region is a net importer. The region only produces around 50% of the electricity that it consumes [39], most of it from renewable resources. More than 40% of electricity production comes from hydro resources, and around 35% is based on fossil products, mainly natural gas. However, electricity generated from hydro resources can be susceptible to prolonged periods of drought. For example, despite 1% more installed capacity in 2017 compared to 2007, hydroelectric production was 1% lower [40]. The final energy production across departments exhibits significant disparities, with Bouches-du-Rhône emerging as the primary contributor, representing 58% of the total energy output. This dominance is predominantly fueled by the combustion of fossil fuels, which accounts for over 80% of its energy generation [39]. The second-greatest producer in the region is Alpes-de-Haute-Provence, with an electrical output of 10 PJ, more than 80% of which is derived from the use of hydro resources [39].

2.2. The TIMESPACA Model

The analysis of the implementation of a circular economy strategy for the decarbonization of an energy system is based on the TIMESPACA model.
The TIMESPACA energy prospective modeling tool was developed to evaluate the development of the energy system of the SUD PACA region in France. This model is based on the TIMES framework. TIMES is a prospective modeling tool developed as part of the International Energy Agency’s (IEA) Energy Technology Systems Analysis Program (ETSAP) and built on the basis of the Market Allocation Model (MarkAl) combined with the Energy Flow Optimization Model (EFOM) [41]. TIMES is not a model per se but rather a bottom-up model generator, i.e., a set of generic equations (described in the GAMS language) that define the relationships by which user-supplied data will be linked, creating a coherent mathematical model. Today, the TIMES generator is widely used in foresight studies at different spatial scales: global [42,43], regional [44], national [45,46,47], and sub-national [48,49]. TIMES models are being developed by over 150 research teams in 50 different countries. The generator and its applications enjoy strong support from the ETSAP modeling community, which meets several times a year to discuss the results of different foresight studies and possible evolutions of approaches and models. TIMES is based on a partial equilibrium linear optimization paradigm and seeks to minimize the total discounted cost of the entire energy system studied while satisfying exogenous demand and complying with the various constraints set by the user (economic, technical, and environmental). In addition, TIMES provides a fine-tuned representation of the energy system under study in terms of its detailed technical and economic characteristics and the interaction of the various commodities with the extraction, transformation, transport, and distribution processes, particularly by signaling the flow of commodities between transformation and consumption technologies. The objective remains to find a supply demand equilibrium, i.e., to maximize the surplus over the entire time horizon at the lowest discounted cost. The mathematical problem thus constructed is solved with the CPLEX optimizer, which uses the SIMPLEX algorithm, and users most often employ VEDA 2.0 (Versatile Data Analyst) software [50] to interact with the mathematical code and export the trajectory calculated by the solver. The main outputs of the model are the new structure of the energy system over the years of the period under consideration and, for each geographical area implemented, commodity flows, greenhouse gas emissions for each technology concerned, installed capacities and technology activity levels, marginal costs of certain commodities and investments made. TIMES can therefore be used to explore the various pathways that an energy system can follow under contrasting scenarios in order to discuss whether an objective is achievable or not depending on the actions envisaged and ultimately propose actions guiding towards the achievement of a specific ambition. A complete description of the mathematical structure of the model is given in [51].
TIMES is particularly useful for answering the research question in this research as it allows the creation of the necessary links between different energy commodities involved in a CE strategy and their different potential utilization processes. By representing the current energy situation of the SUD PACA region (energy consumption and energy production based on [39]) into the TIMES framework we obtain the TIMESPACA model. The reference energy system of the PACA region is given in Figure 1. Moreover, a complete description of the TIMESPACA model is given in [52]. As outlined in [52], the regional energy system has been divided into nine zones or sub-systems, representing the six departments of the region: Vaucluse (VAUC), Alpes-de-Haute-Provence (AHP), Hautes-Alpes (HA), Bouches-du-Rhône (BDR), Alpes-Maritimes (AM), and Var (VAR). Notably, the latter three are subdivided into high-energy demand zones (AM1, VAR1, and BDR1) and low-energy demand zones (AM2, VAR2, and BDR2). Moreover, an energy system called “PACA” has been integrated to represent the French electric and gas networks. Therefore, the PACA region can access electricity and gas from the national grid and distribute it among the regional zones as needed, which is potentially more cost-effective than producing energy locally. Furthermore, the region serves as a pivotal trading center for electricity and gas commodities, enabling territories to inject and withdraw these resources as required. To analyze the application of a circular economy strategy for the development of the SUD PACA region’s energy system, further developments have been integrated into the TIMESPACA model. These developments are detailed in the following section.

2.3. Representation of Circular Economy into the TIMESPACA Model

The vision of a circular energy system (CES) followed in this study implies dissociating environmental degradation from energy system activity by redesigning the way we consume and produce via the application of the 4 Rs, namely “reduce, reuse, recycle, and recover”. The goal is to minimize energy resource consumption and move towards producing zero waste and pollution with a systemic approach during implementation.
Within the context of reaching CES, the reduce principle involves actions aiming to increase the efficiency of the system via the integration of more efficient technologies [53] and behavioral changes like carpooling, which reduces the use of energy [54,55]. In this study, the analysis of a change in terms of how energy is consumed will concern the integration of hypotheses such as a modal shift, which means changing from one mode of transport to another, like from using a car to using a bicycle, and modal share, which relates to the number of passengers per vehicle. The integration of these hypotheses is exogenous, and they will be detailed in the next section (scenarios). The techno-economic characteristics of personal mobility vehicles are detailed in Table 1.
The reuse principle would involve re-introducing a product into the energy system, either by reusing CO2 emissions [56] or reusing other energy products like electric vehicle batteries [57]. To recover CO2 from industrial activities, carbon capture technologies can be developed in steel and cement industries [55], and in oil, gas, or biomass-based power plants.
The recycle principle would involve the use of biomass, as it captures carbon from the atmosphere as it grows, releases it again when decomposed or combusted, and captures carbon again when the same amount of biomass is grown, and in this way recycles carbon emissions [58].
The recovery principle would mean extracting value from resources that are considered to be waste as they cannot be introduced into the economic system again by any other uses [59]. In this sense, waste heat can be recovered and used to cover heating and water heating demands in the residential sector and/or to cater to the heating requirements of industrial activities. The development of new heating networks requires an investment of EUR 39.18/GJ (EUR 141/MWh) with fixed costs amounting to EUR 16.94/GJ for high energy consumption areas and EUR 16.11/GJ for low energy consumption areas [60]. Waste hydrogen can be used in methanation processes, using CO2 from biogas or syngas purification processes, as well as CO2 from industrial activities, to produce biomethane that can be injected into the gas transport or distribution network. When CO2 originates from biogenic sources such as anaerobic digestion, biomass gasification, or biomass-based power plants, the level of emissions during the consumption of biomethane will be zero, making it carbon neutral in the TIMESPACA model. If the CO2 comes from non-renewable sources like industrial CO2 or MSW gasification, emissions will still be produced [61]. Accurately identifying the origin of CO2 will help better understand the decarbonization potential of different technologies. Another option for methanation is to produce biomethane by mixing hydrogen generated from electrolyzers with CO2, following the same process as described previously. The techno-economic characteristics of hydrogen, biogas, and methane production are based on [62,63,64], respectively. Agriculture, green waste, and wastewater sludge can be used for biogas production via anaerobic digestion processes [65]. Biogas can be used directly to produce electricity or for heat, or it can be purified to obtain biomethane that can be injected into the gas transport network. The purification stage can be followed by CO2 capture techniques, and the CO2 can be used in methanation processes, as mentioned earlier. Hydrogen can be injected into the French gas network up to 6% (in volume) in 2030 and 20% in 2050, according to [66]. MSW can be used to produce syngas via gasification, which can be used as in the previous cases. Figure 2 presents a simplified version of the CES envisioned in this paper, and the economic characteristics of the different technologies allowing the use of the different potential are detailed in Table A1.
Hence, this paper envisions that a circular energy system is capable of producing energy from materials that could not be integrated into other producing processes. This system is more efficient, as it recovers materials and energy from waste resources (like waste energy), and resources are used in cascade, which also promotes more environmentally friendly consumption. A CES promotes the development of renewable and sustainable solutions targeting the reduction in polluting emissions.
The SUD PACA region has access to significant energy resource potential, and their development aligns with a circular economy perspective. This potential has been estimated by different studies developed for the SUD PACA region by different institutions [52] and is detailed in Table 2. The combined potential of these resources could cover approximately 80% of the SUD PACA region’s 2017 energy consumption.

2.4. Scenarios

2.4.1. Energy Services Demand

In all the different scenarios, the demand was projected using various drivers. In the building sector, the heating demand was calculated based on the heat required per square meter of existing and new buildings. To project the number of new buildings, we used data from [75], which estimate the requirements of buildings in the region for 2030. To determine the requirements of new buildings in 2050, the observed trend to 2030 was employed. The heat consumption of existing buildings will be around 50 kWh/m2 and 12 kWh/m2 for new buildings [76].
The cooling demand was modeled based on the assumptions detailed in [77], which suggests that the need for cooling may increase up to four times. This is particularly relevant for the SUD PACA region which experiences higher temperatures throughout the year compared to the rest of France. As for the rest of the energy services demand in the residential sector, population growth was employed as a driving factor, based on the data from [78]. Analysis of the past 10-year trend of kilometers traveled by each vehicle type was used to project the mobility demand. Within the industrial sector, it was assumed that there would be a yearly growth rate of 0.5%, resulting in an 18% increase in industrial activity by 2050 compared to the levels recorded in 2017.

2.4.2. Reference Scenario (REF)

This scenario aims to incorporate the measures implemented by the region up to 2017 that directly impact the regional energy sector. It incorporates historical trends over the past decade for various energy sectors and services in each studied area, including the deployment of the region’s Climate Air Energy Territorial Plan in 2017. This plan supports the development of current power-to-gas (PtG) projects that have been established in the region (Table 3).
These projects will be implemented in all of the examined scenarios. We acknowledge that the impact of the region’s energy policies since 2005 is visible in the consumption data of the past decade. However, we do not incorporate the more recent objectives outlined in the SRADDET (Regional Plan for Territorial and Sustainable Development/Schéma Régional d’Aménagement et de Développement Durable du Territoire). The 2018 assessment of regional objectives highlighted that the region falls significantly short of achieving most of these targets. Any objectives that have been attained are attributed not to the region’s actions but to external factors, such as the closure of high-consuming industrial sites. This scenario also seeks to portray the limited awareness among politicians and economic stakeholders in the SUD PACA region regarding the appropriation of climate issues. As stated by the High Council for the Climate, “political and economic actors do not appear to be sufficiently aware yet of the subject [of appropriation of climate issues]”, and the ambitious objectives outlined in the SRADDET seem “to be a declaration of intent arising from a desire to show concern, but without real concrete commitments” [79].

2.4.3. Circular Economy Scenario (SCE)

The main objective of this scenario is to evaluate how integrating an ambitious circular economy perspective can shift the development of the energy system of the SUD PACA region. Our aims are to maximize the reuse of resources that would otherwise have been thrown away, prioritize the recovery principle to increase the efficiency of the system, and reuse products by giving them a second life, always looking to reduce CO2 emissions. The main hypotheses integrated in this scenario are detailed in Table 4. Moreover, SCE implements the objectives established in the regional hydrogen plan of the SUD PACA region (Table 5) [80].

2.4.4. Neutral Carbon Scenario (NCS)

This scenario proposes following some of the guidelines established by the French Low Carbon Strategy (Strategie Nationale Bas Carbone SNBC), mainly by adopting the carbon budget (Table 6) and increasing the electrification of industrial activities up to 70% in 2050. The carbon budget establishes emission thresholds, expressed per period of 5 years until 2050 [81]. They are broken down by the economic sector and by greenhouse gas. The objectives established in the regional hydrogen plan will also be implemented. The main purpose of this scenario is to compare the changes in the SUD PACA region energy system by implementing a carbon budget and compare it to the behavior featured in a CES. A summary of all of the assumptions implemented in all of the scenarios is given in Table A2 and Table A3.

3. Results

3.1. Final Energy Demand

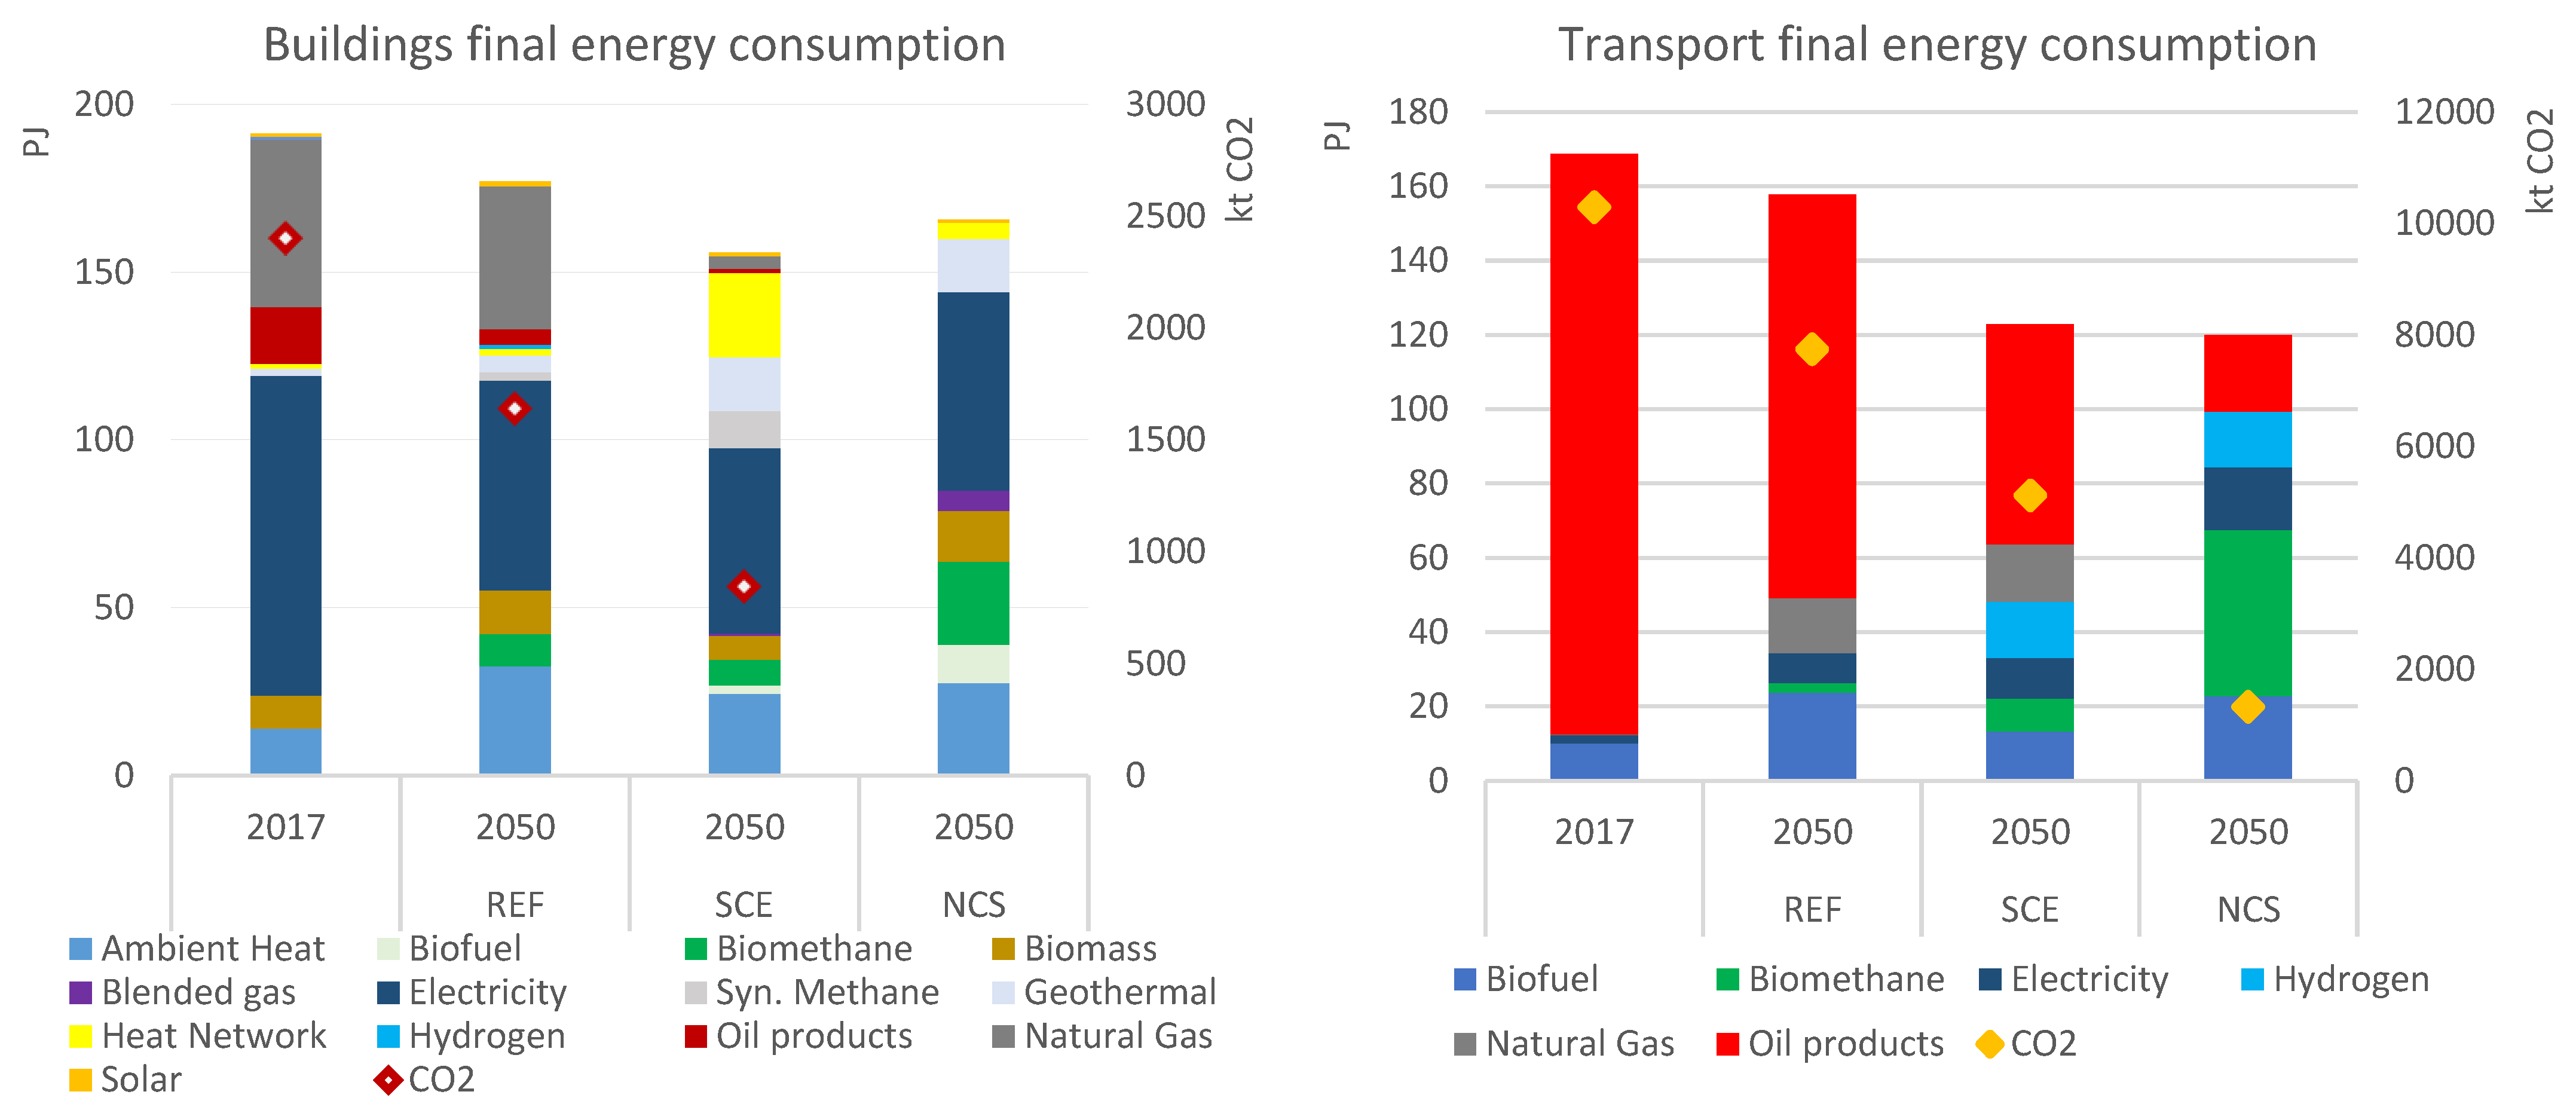
Final energy demand decreases in all the scenarios: −13% in the SCE scenario, −16% in the NCS scenario, and just −2% in the REF scenario. Concerning CO2 emissions, the application of a CE contributes to a reduction of more than −50% compared to 2017 in comparison to −83% in the NCS scenario. However, the SCE scenario attains a higher reduction in CO2 emissions (and energy consumption) in the building sector (Figure 3) of −18% with respect to 2017, compared to −13% in the NCS scenario. This is mainly due to the increased application of building renovation (25% higher in the SCE scenario than in the NCS scenario) and the development of heat networks. The latter account for 16% of the energy used by the building sector and 60% of the region’s heating demand. This increased use of heat from the network reduces the use of biomass and ambient heat, which is the lowest use among all scenarios. The remaining use of fossil fuels in the SCE scenario corresponds to the use of gas for cooking and heating demand. These uses have been decarbonized by biomethane and blended gas in the NCS scenario. In this scenario, the heat delivered via networks has doubled compared to 2017, but this only represents almost 20% of the developments reached in the SCE scenario. Geothermal energy significantly contributes to decarbonizing the building sector in the NCS scenario and the SCE scenario, where its development has reached the upper limit of the established constraints. Heat-recovering technologies (ambient heat, geothermal, and waste heat recovery) in the SCE scenario represent around 42% of the energy consumed in the building sector (28% in the NCS scenario), covering heating, water heating, and cooling demand, which shows the important role that these energies can play in the decarbonization of this sector.
In the transport sector, hydrogen has been used for 15 PJ in both the NCS and SCE scenarios, which follows the established constraint. In the SCE scenario, hydrogen is used mostly for utility vehicles (at 41%), for freight transport (at 31%), and for buses (at 27%). In the NCS scenario, hydrogen is used for utility vehicles at 59%, for freight vehicles at 2%, for buses at 30%, and for private vehicles at 10%. The remaining emissions in the NCS scenario are generated by vehicles coming from outside the region and from aviation. In the SCE scenario, fossil fuels are still used, accounting for approximately 38% of the sector’s energy consumption (excluding fossil fuel use from vehicles originating from the rest of Europe or France). Moreover, the model does not include a direct link between the use of end-of-life electric vehicle batteries and private vehicle sales, which limits its true potential in the present study. However, it is observed that the electrification of private and utility vehicles plays a significant role in decarbonizing the sector, with electricity covering 17% of the NCS scenario’s final energy demand in 2050 and 12% in the SCE scenario. This suggests that developing and supporting a secondary market for electric vehicle batteries could enable greater utilization of these cars, thereby positively impacting the implementation of a circular economy strategy for the transport sector. Furthermore, to complement the sector’s decarbonization, it may be possible to further incentivize the use of hydrogen for buses and freight transport, which would also drive the development of additional solar electricity production.
Regarding individual electric mobility vehicles (bicycles and scooters), their use contributes to reducing energy demand. In the NCS scenario, they account for 9% of passenger mobility demand, while in the SCE scenario, they account for 7%. This shows that policies targeting the shift towards low energy-consuming behavior can play a vital role in decarbonizing the energy system. Another energy source utilized to facilitate the transport sector’s decarbonization in the NCS scenario is biomethane, which covers 37% of the sector’s final energy demand. It has been employed to meet 57% of freight transport and 25% of private vehicle energy demand in 2050. The increased use of biomethane in the transport sector in the NCS scenario is covered by biomethane coming from the French gas network. Therefore, achieving carbon neutrality for the region’s transport sector requires promoting the use of clean fuel-based vehicles, particularly by encouraging the adoption of hydrogen for transportation, increasing the electrification of private and utility vehicles, and motivating a modal shift towards the use of electric individual mobility vehicles.
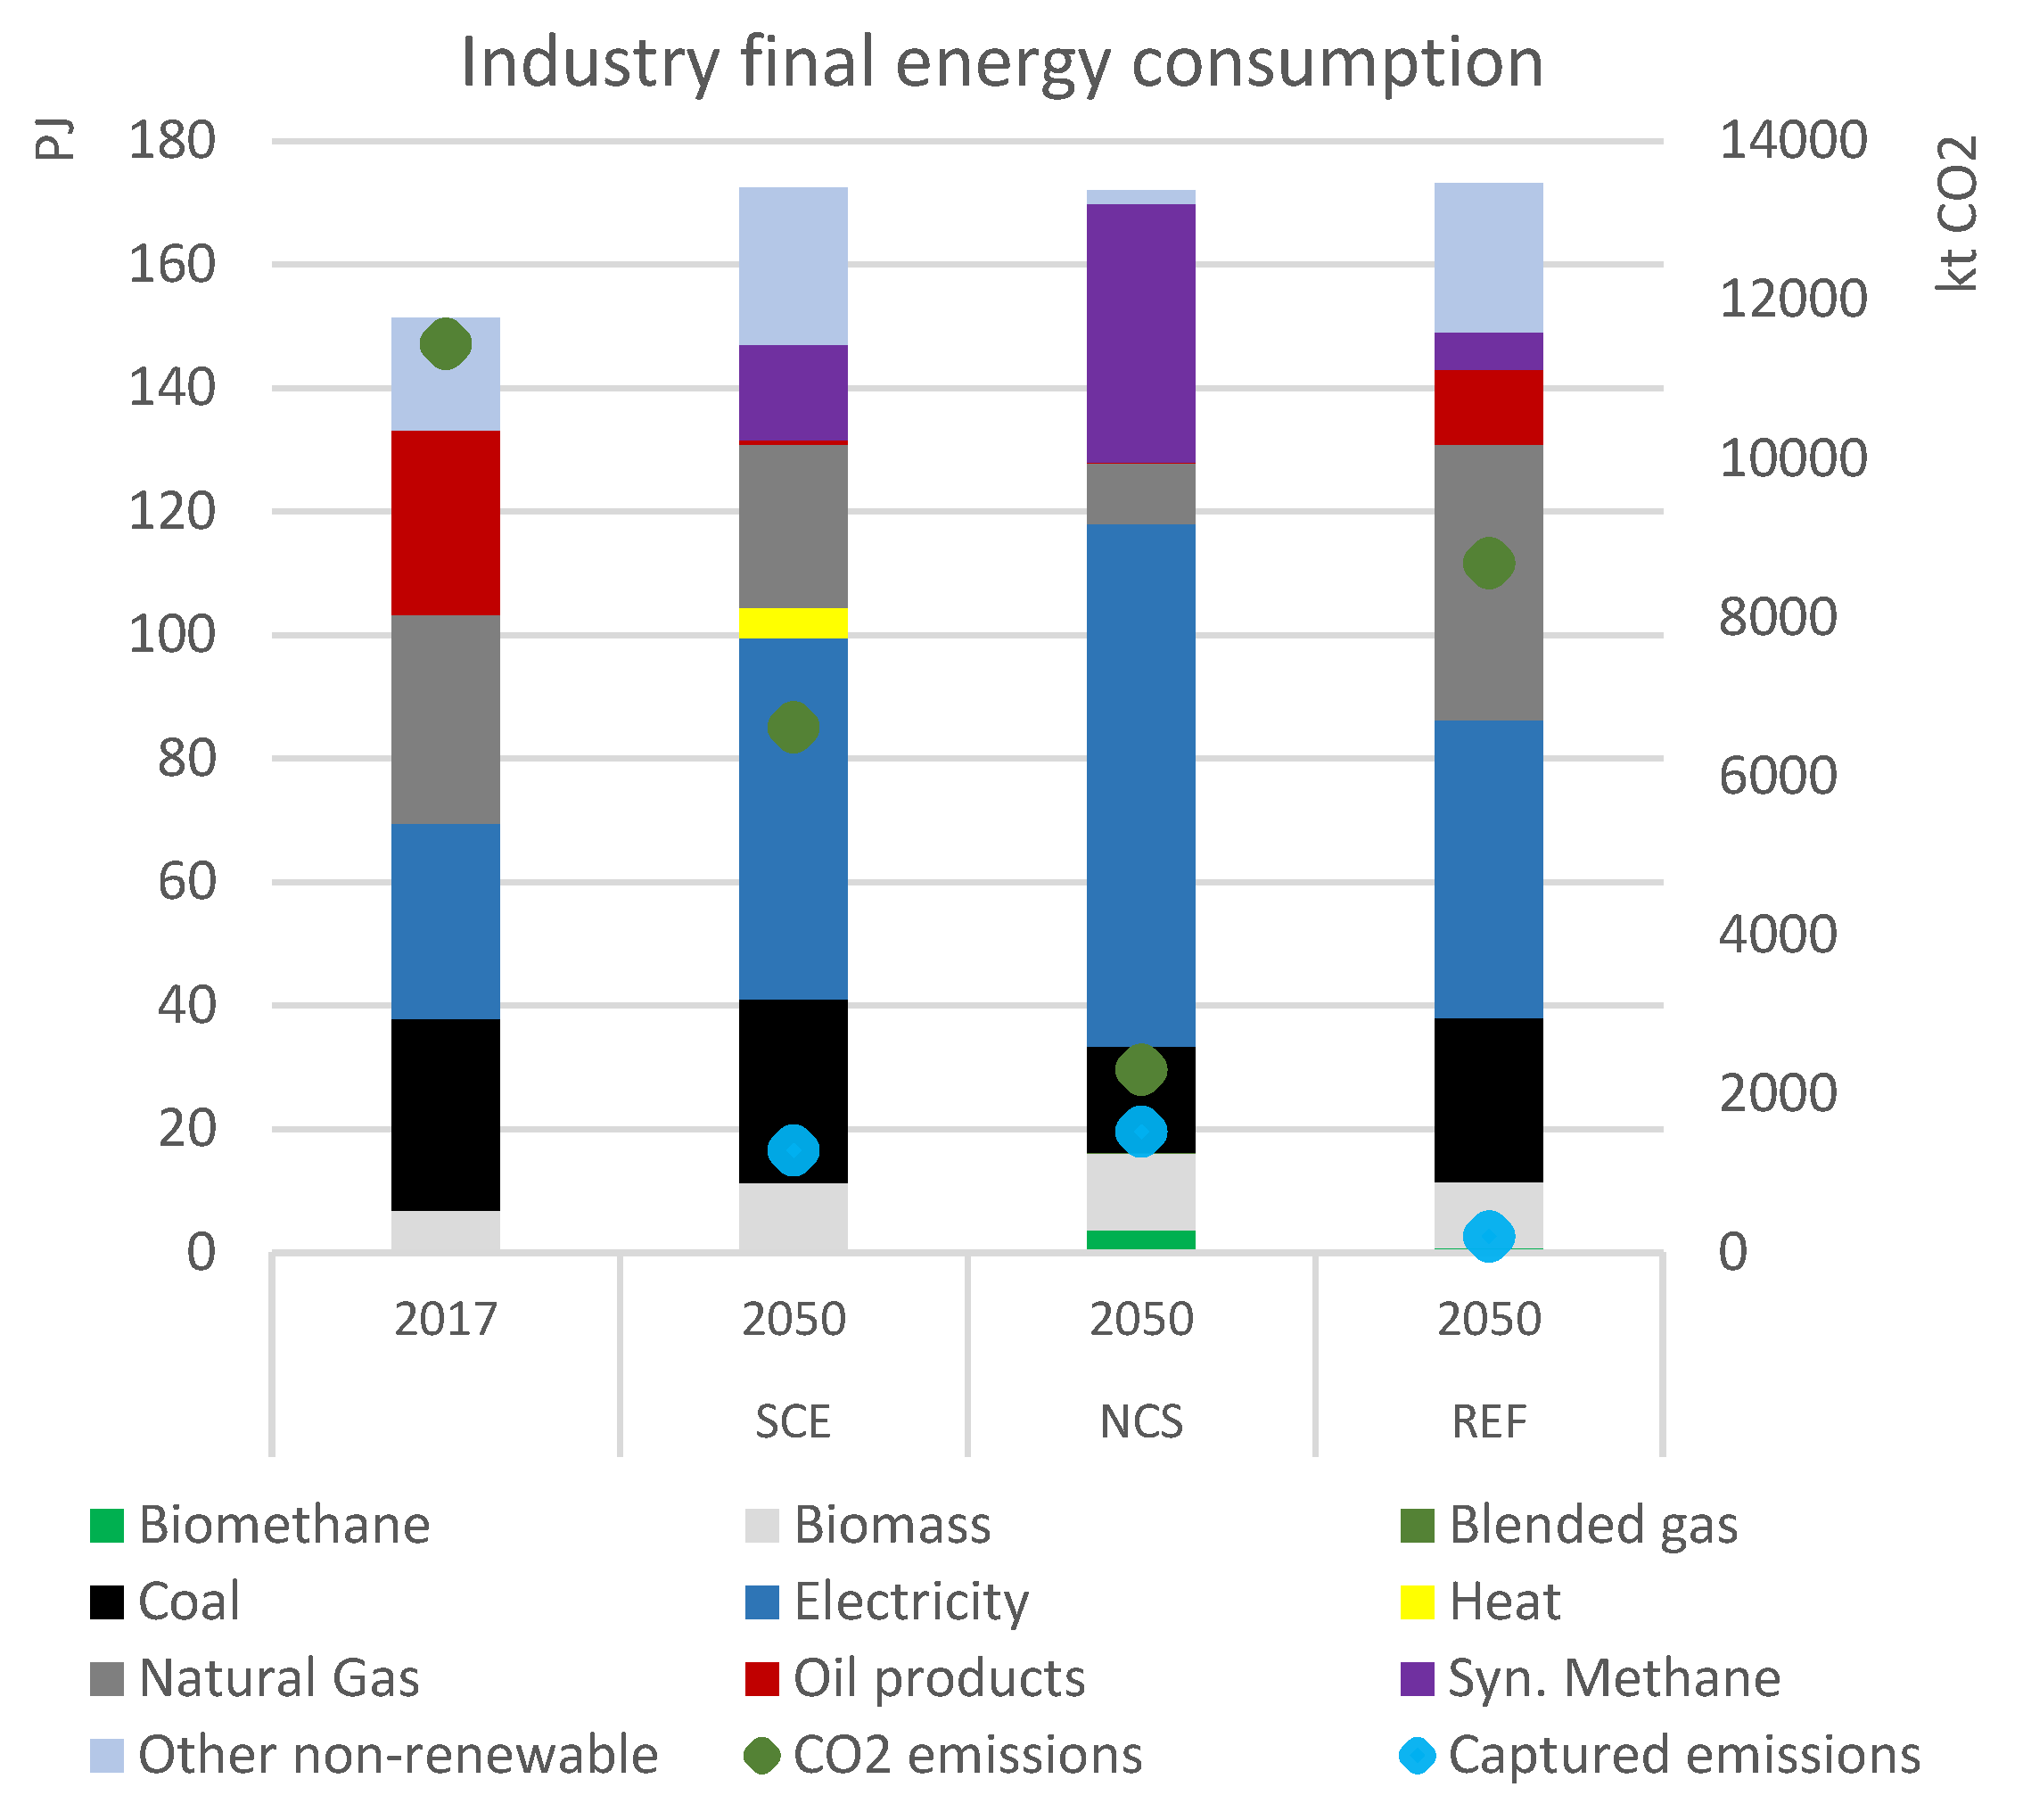
For the industry sector (Figure 4), greenhouse gas emissions have been reduced by 42% in the SCE scenario and 24% in the REF scenario. In addition, in compliance with the established guidelines, the NCS scenario has achieved 80% decarbonization compared to 2017. Oil products have almost disappeared from the NCS and SCE scenarios. The decline in the use of oil products in the SCE scenario is accompanied by an increased reliance on electricity, natural gas, and synthetic methane. Heat recovery technologies have also contributed to decreasing the emissions of the sector by meeting some of the heat demand in the paper industry. The decarbonization of the NCS scenario can be attributed to the increased utilization of electricity, which covers 49% of the final energy demand, as well as the greater use of synthetic methane, which accounts for 24% of the sector’s final energy demand.

3.2. Energy Supply

In the SCE and the NCS scenario, the CO2 to produce synthetic methane originates from a cement plant in the AM1 zone, and from the steel plant in the BDR1 zone. In the NCS, the additional CO2 comes from a natural gas-based electric power plant. All the CO2 captured from natural gas power plants and industrial activities has been used to produce synthetic methane via methanation. It is important to remember that this gas still originates from fossil sources, resulting in emissions at final consumption. In consequence, in the NCS scenario, its use is limited in the building and transport sectors, and it is mostly used in the industry sector as it helps to reduce emissions by replacing some oil products. On the other hand, in the SCE scenario, synthetic methane has been used at more than 40% in the building sector, which explains the remaining emissions of this sector.
The modeling of the gas network allows the model to freely choose the composition of the different types of gas that can be used to produce the blended gas, only limiting the amount of hydrogen that can be injected into the gas network to 20% (in volume) in 2050. In 2050, for the NCS scenario, blended gas is composed of 48% biomethane coming from the French network and 3% hydrogen, while synthetic methane accounts for the rest. For the SCE scenario, the biomethane coming from the rest of France has been replaced by biomethane produced locally. The production of biomethane is not accompanied by CO2 capture techniques during the purification stage in any of the scenarios. However, this presents an opportunity to further reduce emissions in the region. The captured CO2 could be combined with hydrogen to produce additional biomethane, which could then be used to replace the remaining natural gas.
In the SCE scenario, hydrogen is produced from biomass reforming at around 13%, waste gasification at 31%, and electrolyzers at 56%. In the NCS scenario, hydrogen production mainly relies on electrolyzers, accounting for 86% of the total production. In all scenarios, the utilization of wood for hydrogen production is limited to 20% of the entire wood potential, which is twice the estimations made by [82]. They considered a reasonable mobilization of 10% of the total potential based on current practices and legislation. Therefore, this study considers the possibility of integrating better practices in the region to capture a greater potential. Both in the SCE scenario and the NCS scenario, wood is utilized to its maximum for hydrogen production, indicating that promoting the use of waste wood could drive better practices and enable the exploitation of a larger portion of the potential. A similar approach is adopted for municipal solid waste (MSW), with a mobilization rate of 20% of the potential established in the NCS scenario. In the SCE scenario, MSW is utilized to its maximum extent for hydrogen production in both scenarios. However, it is important to carefully analyze the use of waste, as actions should be implemented to prevent waste generation and recover materials for other productive activities. Relying solely on this resource for a low-carbon energy transition may not be reliable. Finally, in the NCS scenario, gas from the French network has decreased by 33%. Within this gas, 62% is biogas, accounting for 28% of the biogas consumed in this scenario, while the remaining portion corresponds to natural gas. On the other hand, in the SCE scenario, the use of gas sourced from the French network is reduced by nearly 70%, and it consists solely of natural gas.

3.3. Electricity Production

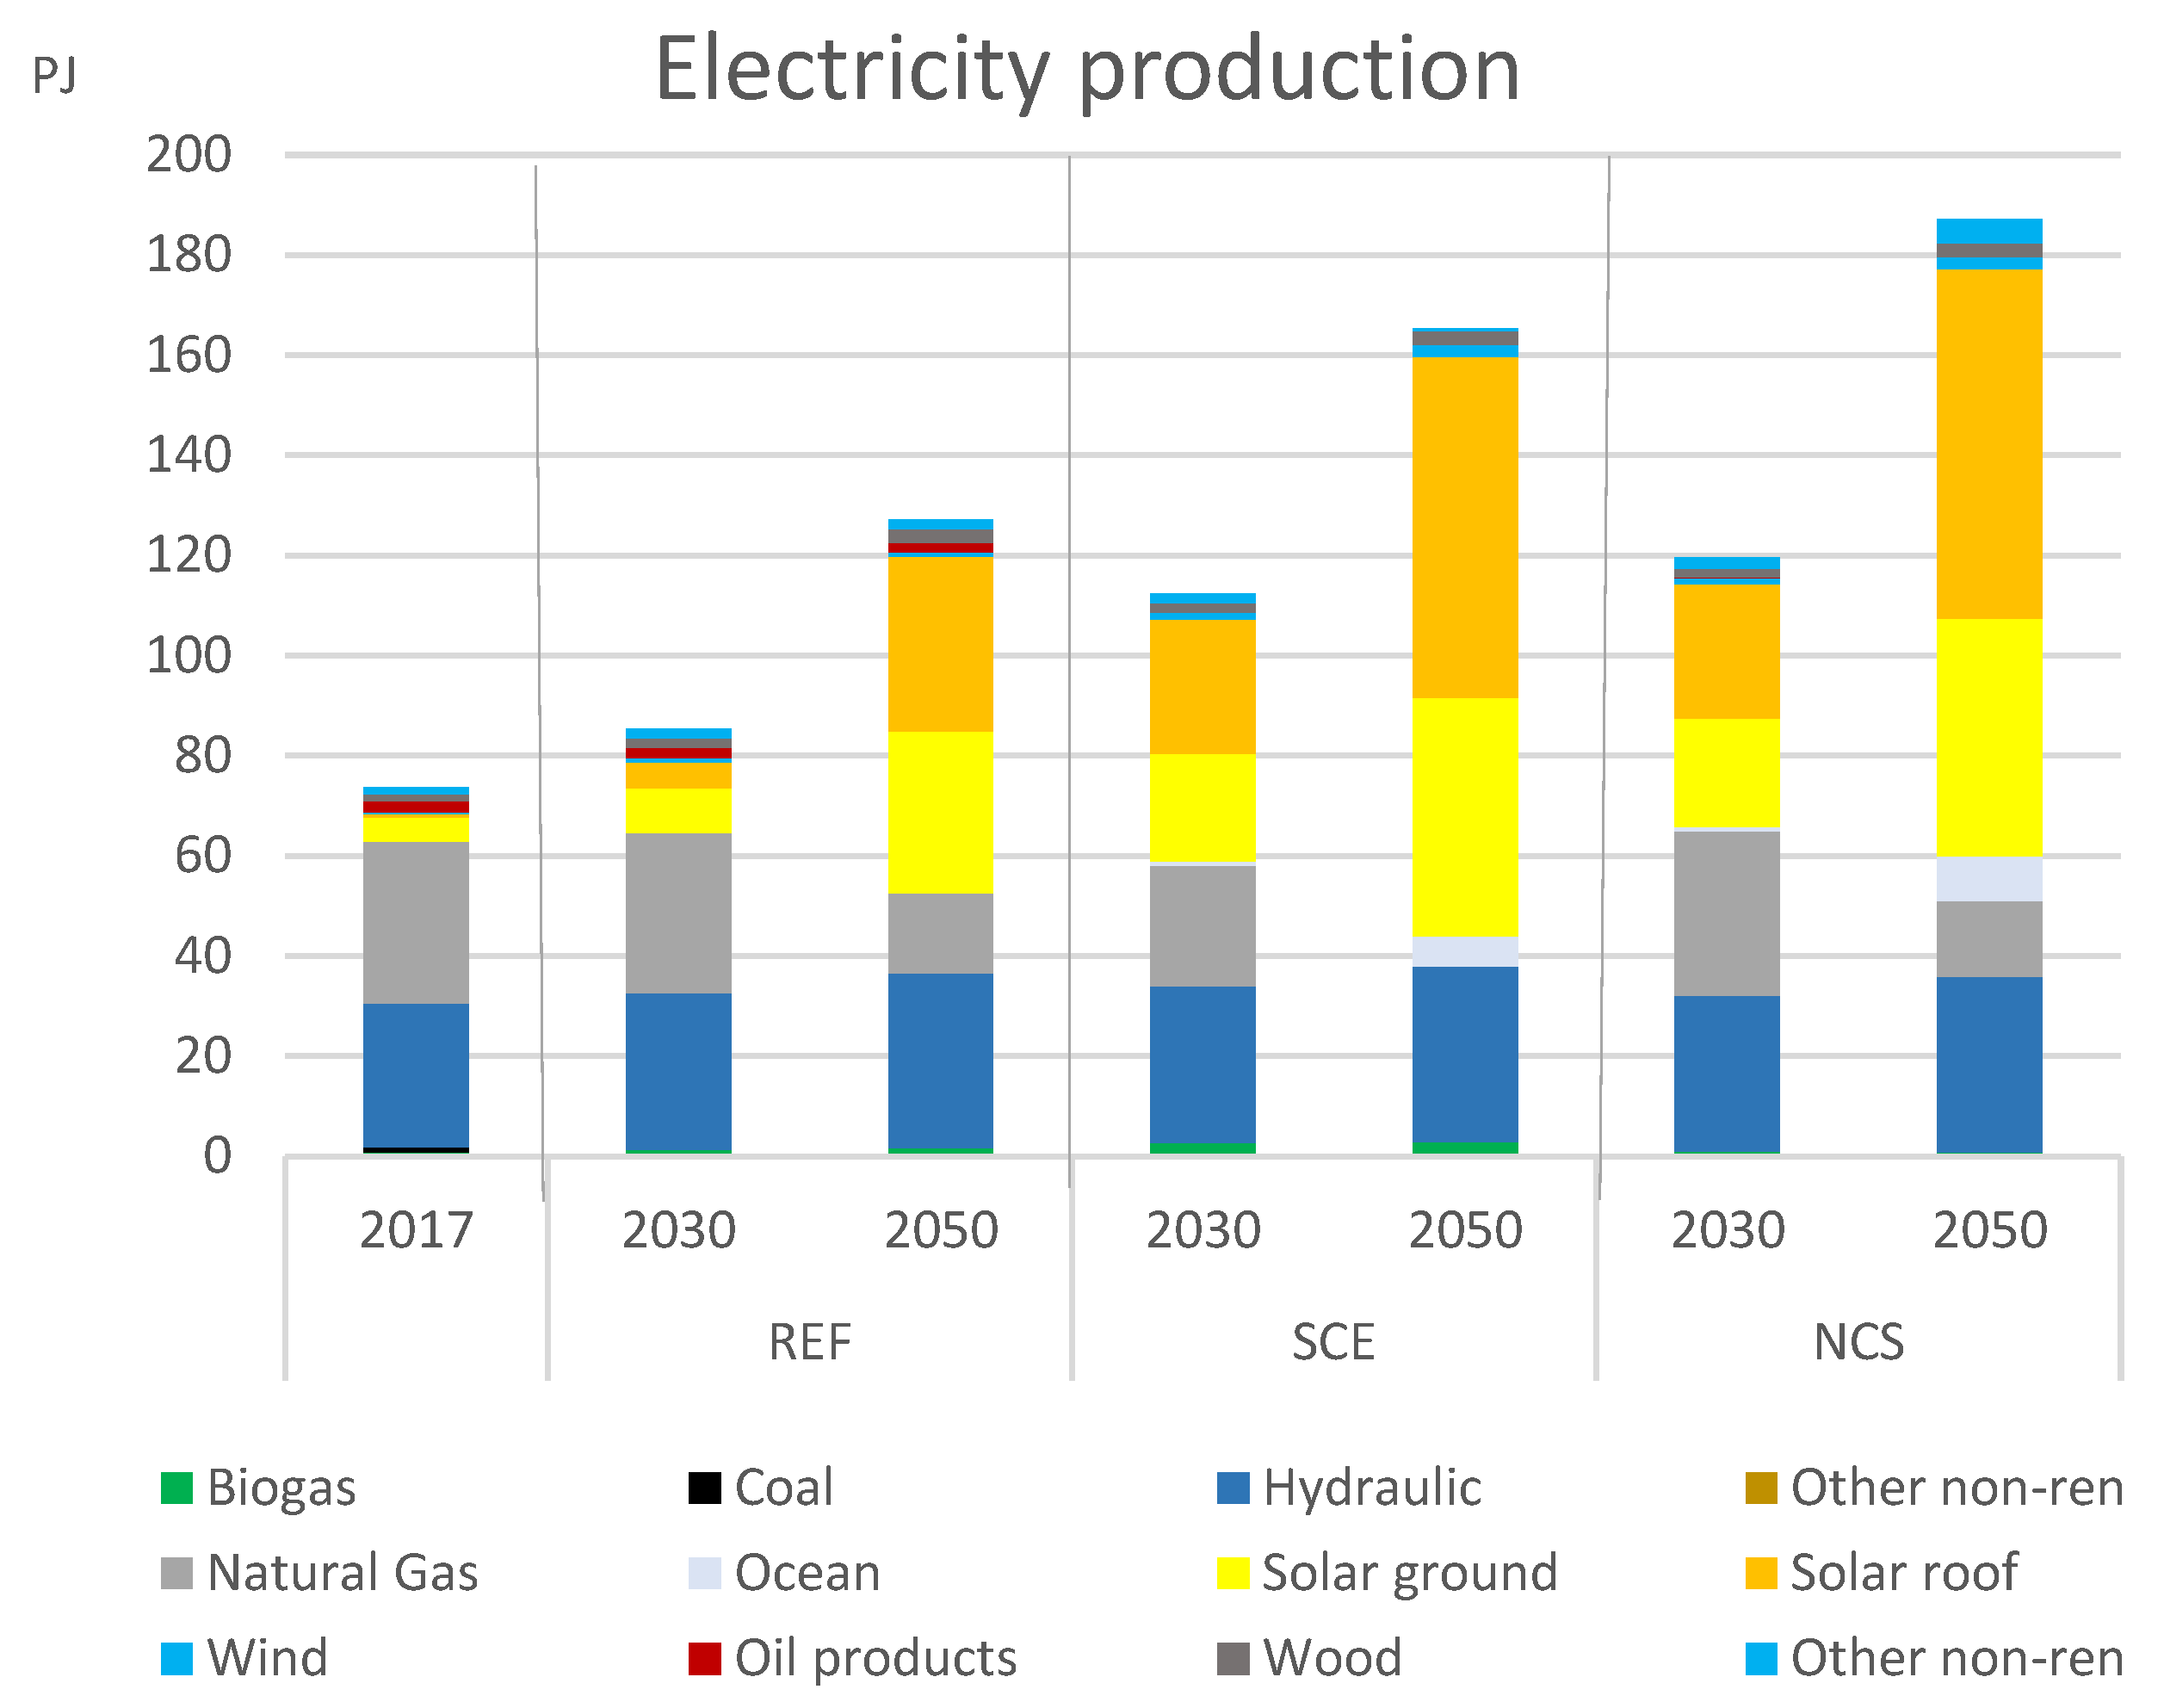
Total electricity production reaches its highest level in the NCS scenario, with 187 PJ compared to 127 PJ in the REF scenario and 165 PJ in the SCE scenario (Figure 5). Oil products for electricity production are completely excluded in the SCE scenario and are only minimally utilized in the NCS scenario. Natural gas plays a more prominent role in the energy mix in the NCS. Its use in electricity production has reached the upper limit set as a constraint (a maximum of half the production observed in 2017, but with carbon capture techniques). This hypothesis has been established to assess the feasibility of the region reducing its dependence on fossil fuels and to examine the role of carbon capture techniques in its low-carbon energy transition. The utilization of natural gas for electricity generation in the NCS scenario is driven by the increasing electricity demand from the industrial sector, aligned with the objectives outlined in the SNBC to achieve a 70% electrification rate of industrial activities by 2050 (excluding the steel and cement industries, which present electrification challenges). In contrast, in the SCE scenario, the use of natural gas has been reduced by 99%. Natural gas-based power plants in the NCS scenario incorporate carbon capture technologies, capturing 1.4 Mt of CO2 by 2050. In general, the SCE scenario exhibits the lowest remaining CO2 emissions, with only 8 kt of CO2 compared to 119 kt of CO2 in the NCS scenario. The SCE scenario is thus approaching a nearly carbon-free electricity production.
The development of renewable resources plays a significant role in all scenarios. Solar-based technologies have experienced the most significant developments, with a slightly higher utilization (+1%) in the NCS scenario compared to the SCE scenario. In the NCS scenario, solar production reaches approximately 90% of the upper threshold for this resource. Notably, the progress in solar technologies is primarily observed in roof photovoltaic installations. Ocean technologies, on the other hand, have seen substantial development in the NCS scenario, reaching an installed capacity of almost 1 GW in 2050, whereas the SCE scenario only achieves 300 MW. Furthermore, onshore wind technologies have been maximally developed in both the NCS and SCE scenarios, emphasizing the need for policymakers to address existing barriers that hinder their deployment in the region [83]. In terms of biogas-based power plants, the SCE scenario demonstrates higher activity in 2050, with a production of almost 3 PJ compared to nearly 1 PJ in the NCS scenario. The reliance on electricity from the French electric network has been significantly reduced across all three scenarios. By 2040, the SCE scenario and the REF scenario have nearly eliminated their dependency on this external electricity supply, while the NCS scenario shows a relatively modest reduction of 4% in 2050 despite having the potential for greater capacity development in solar roof photovoltaic technologies. This highlights the region’s crucial opportunity to leverage its locally available resources to meet its electricity demand.
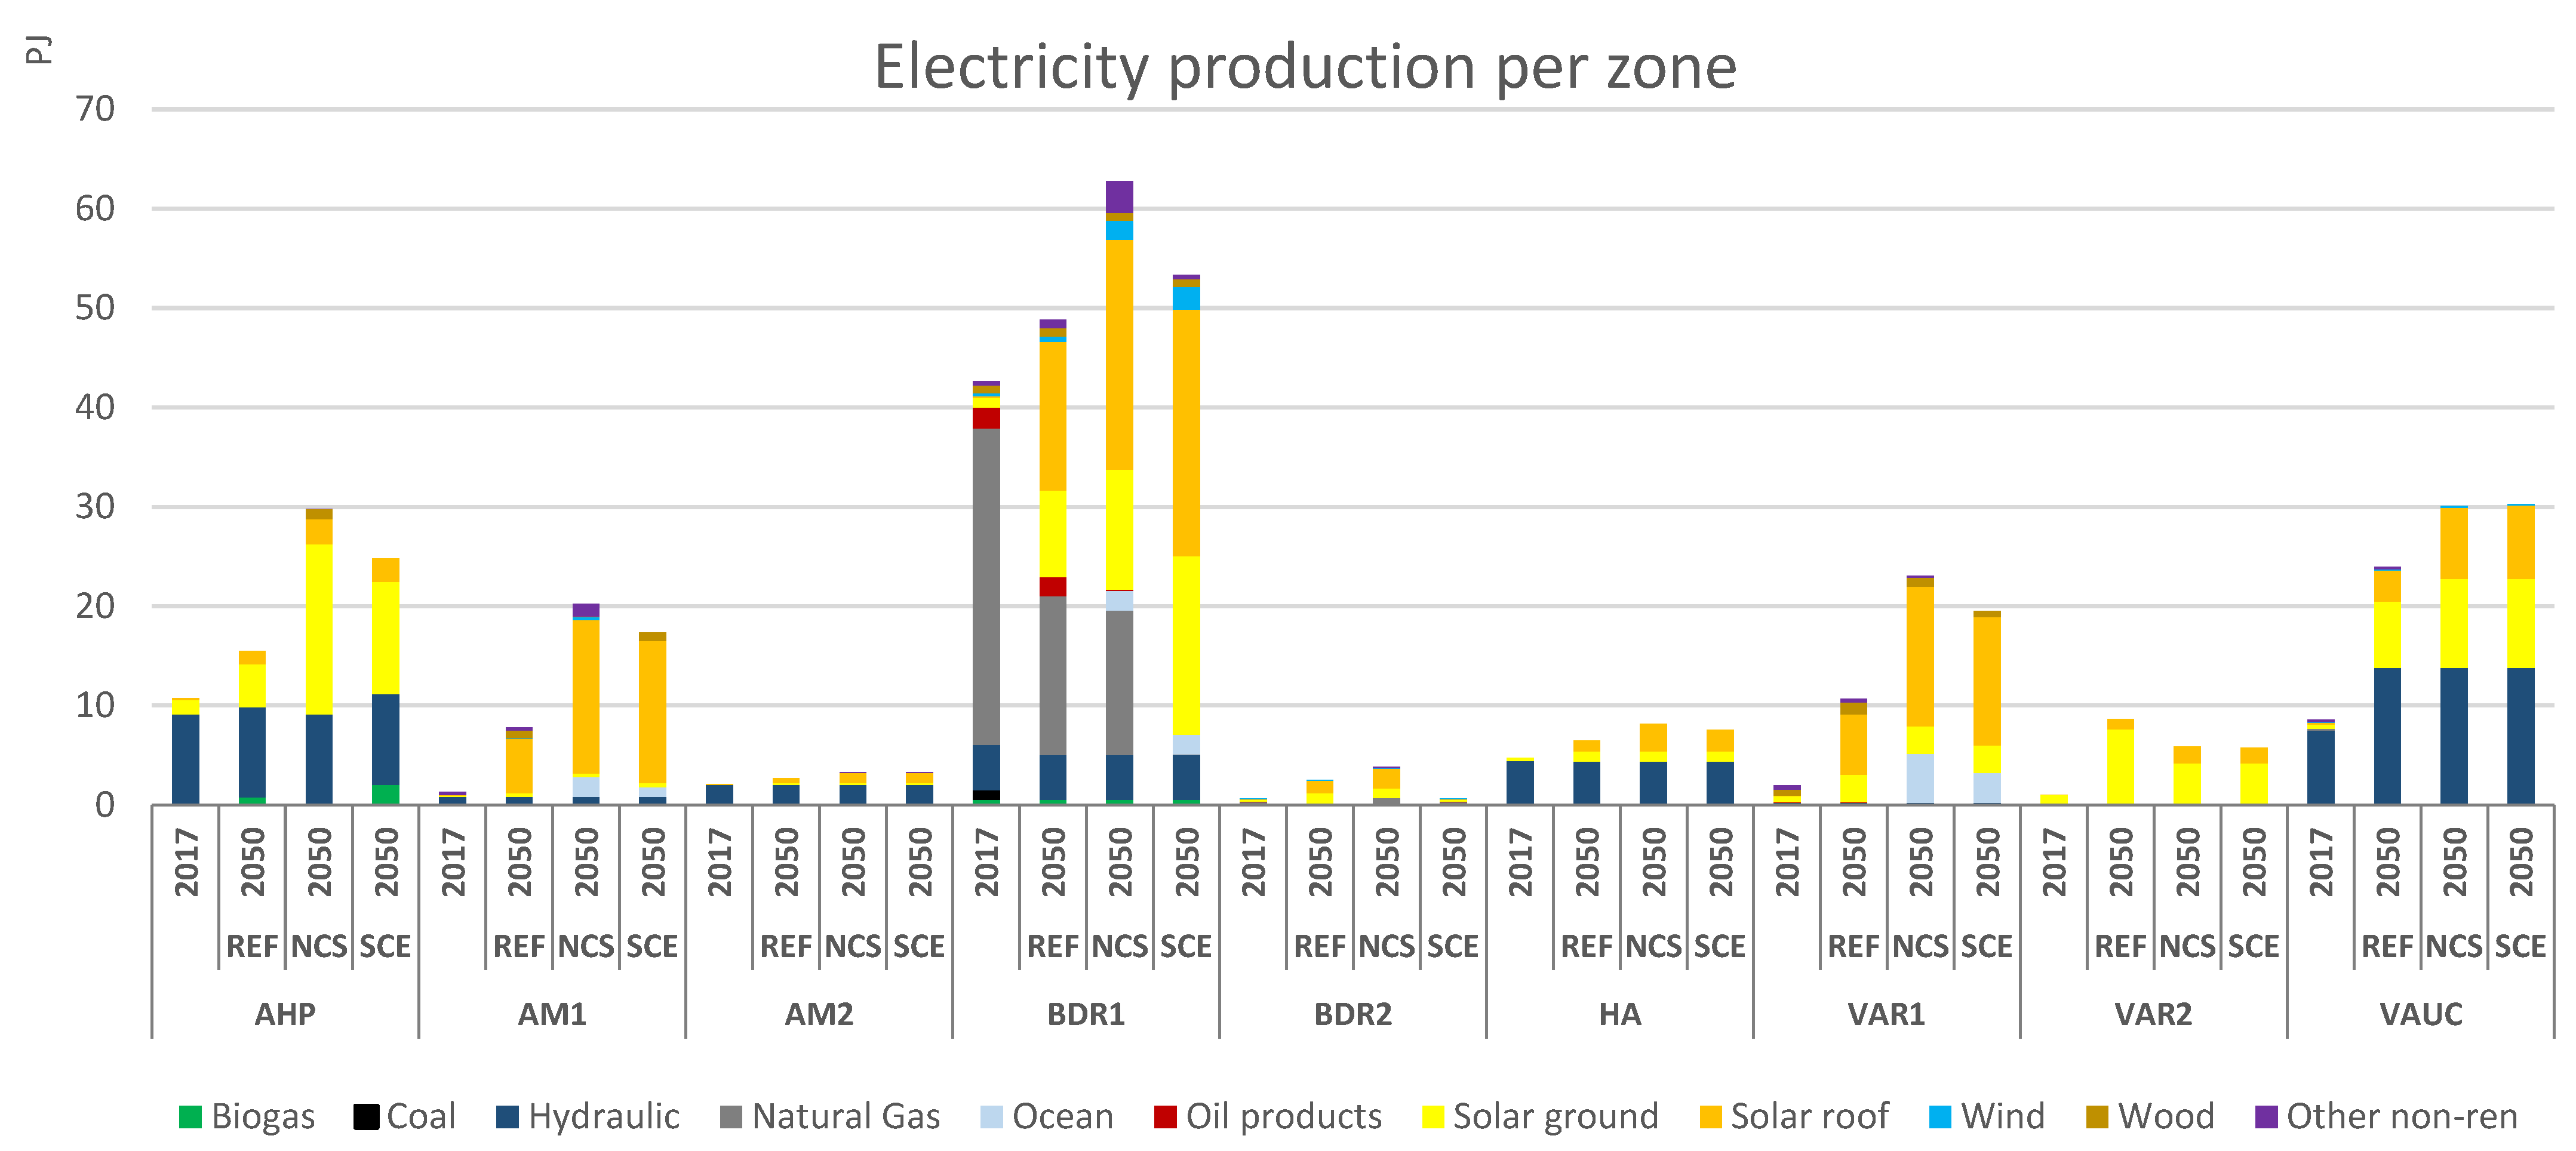
Regarding the developments in each of the territories of the SUD PACA region, electricity production remains concentrated in the BDR1 zone across all three scenarios (Figure 6). This concentration is particularly pronounced in the NCS scenario as natural gas-based power plants can mainly be developed in this zone. The limitation in developing high capacities of these technologies in other regions, especially in the eastern part of the region, is attributed to challenges in gas transportation and the lack of cooling water [84]. Hydro resources are utilized at maximum levels in all three scenarios, underscoring their significance for the region’s electricity supply. However, their development should be approached cautiously due to the potential impact of climate change on resource availability. Interestingly, despite a 1% increase in installed capacity in 2017 compared to 2007, the region has generated 1% less electricity using this resource [40]. Moreover, in the SCE scenario, the additional biogas-based power production originates from the AHP zone, while the increased electricity production from ocean technologies is attributed to the VAR1 and AM1 zones.
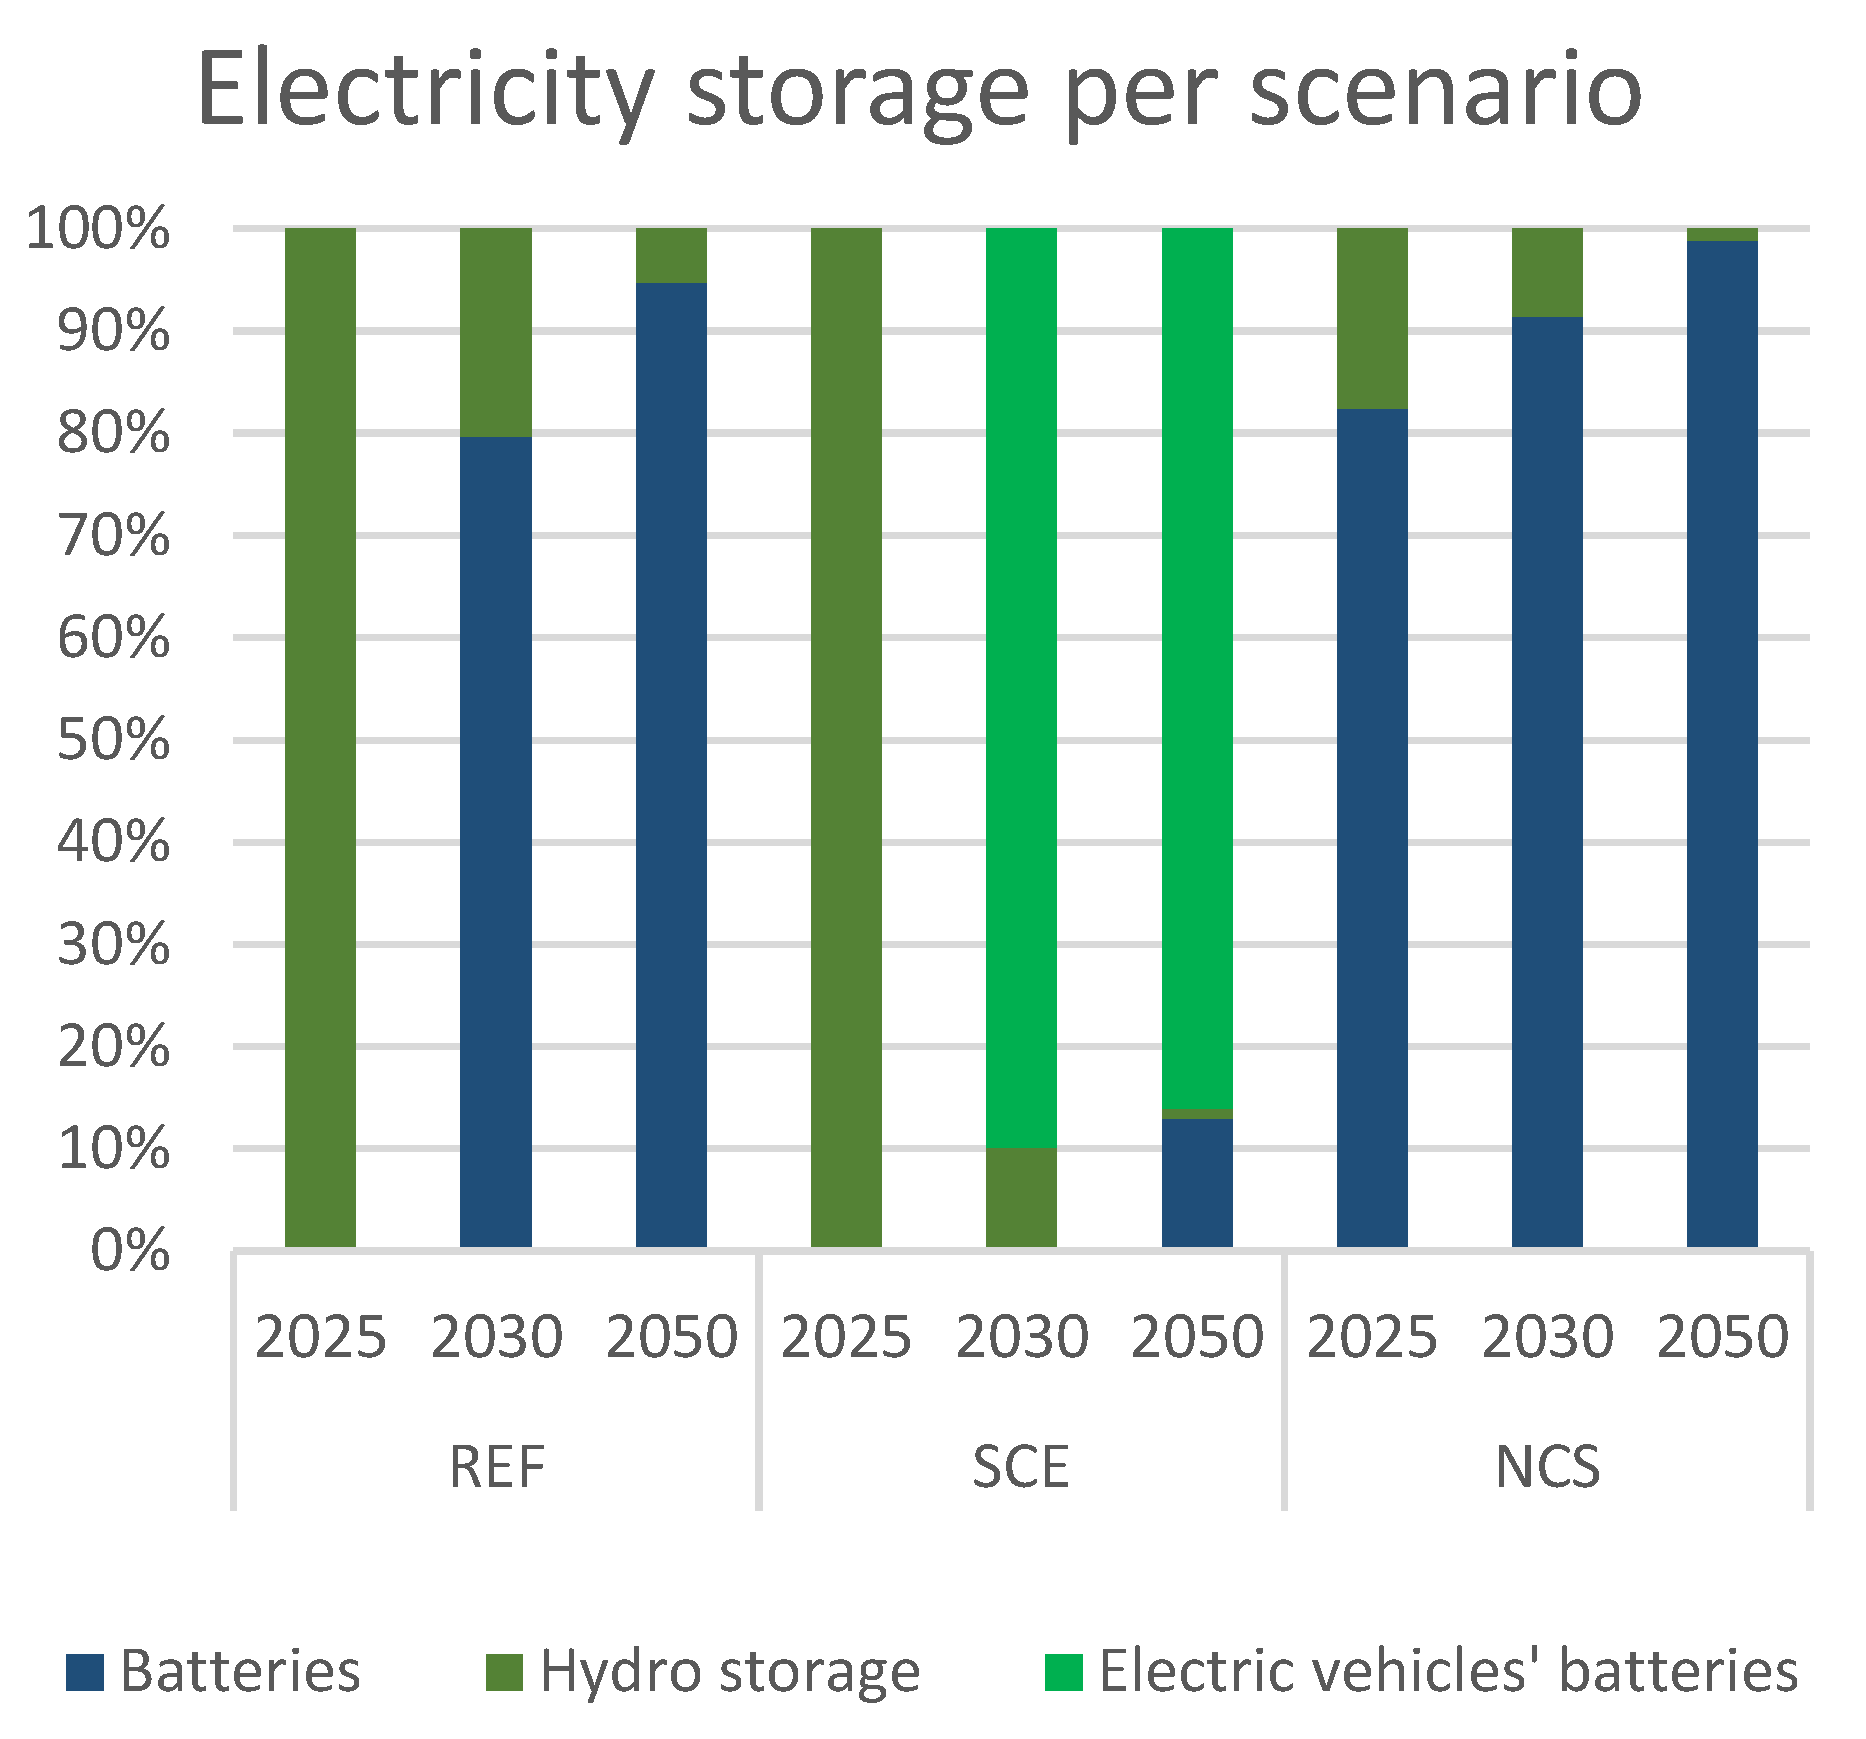
Due to the high electricity demand in the NCS scenario, the deployment of batteries is necessary to support solar roof photovoltaic production starting from 2025 (Figure 7). In contrast, the utilization of batteries starts in 2030 in other scenarios. Notably, the SCE scenario takes a more sustainable approach by utilizing electric vehicle batteries instead of dedicated batteries, thereby reducing the overall material requirement for battery construction.

4. Discussion

The implementation of a circular economy strategy can largely contribute to the energy transition of local energy systems. In fact, among all scenarios, the application of a CE reaches the highest reduction in energy consumption. This is mainly attained by the development of heat networks and building renovations in the building sector. These results are congruent with several other studies in the literature that show that this sector presents the largest potential for emissions reduction due to the many different options available for the decarbonization of energy consumption [36,85,86]. Alternatives include using ambient heat or geothermal energy, increased electrification, reduced consumption via behavioral change, etc. Behavioral change is also one of the most beneficial options to reduce the environmental impact of the transport sector. In the CE scenario, individual mobility vehicles have been used to cover 7% of the final mobility demand in the region. As stated by [85], the highest potential for reducing emissions in the sector is via a shift in use patterns. Finally, the application of a CE strategy in the industry sector increases the use of heat waste, and electricity production is mainly based on renewable sources.
In general, adopting a CE perspective results in a more sustainable electric system for the region. It significantly reduces the reliance on fossil fuels, thereby enhancing the security of supply and achieving nearly carbon-free electricity production and consumption. Indeed, a circular economy would rely on renewable energy [87]. However, it is important to note that the substantial increase in electricity usage in the industrial sector may potentially perpetuate the use of fossil fuels, particularly by maintaining dependence on natural gas imports. This reliance exposes the regional energy system (as well as the French system) to geopolitical risks in the event of a disruption in the natural gas supply. The reliance on renewable energies will reduce the territories’ reliance on imported fossil products, which might strengthen their financial situation [88,89]. Furthermore, the widespread adoption of electric vehicle batteries effectively replaces the need for dedicated batteries for electricity storage in the SCE scenario. This highlights the significant potential of the electric vehicle market in the region, further contributing to the transition towards a more sustainable energy landscape.
The application of a CE strategy to develop the local energy system proves to be a useful strategy to decrease the use of energy and materials in general. However, in order to ensure a more efficient application of such a strategy, a careful policy design is needed, as stated by [90]. Biomethane should be preferred to natural gas in industrial applications and in the residential sector while recognizing the significant potential of hydrogen in facilitating the decarbonization of the transport sector. As stated by ([91]), hydrogen should be prioritized for uses where electricity is not feasible. Greater adoption of hydrogen would also drive the advancement of solar energy production and the utilization of other waste materials. Furthermore, the focus should be on developing carbon capture technologies for industrial activities rather than fossil fuel-based power plants, as the region has ample opportunities to promote renewable energy sources for electricity generation. Additionally, the region exhibits substantial potential for carbon capture, particularly in the steel industry, which represents 55% of the overall CC potential. Nonetheless, there is a need for enhanced storage options in the region [92,93]. Thus, it is crucial to explore alternative approaches that could leverage this potential, particularly via the adoption of carbon capture and utilization techniques aligned with CE principles. In this regard, methanation emerges as a promising option for carbon emission reduction. This technique involves capturing CO2 and combining it with hydrogen to produce synthetic methane, which serves as a substitute for fossil fuels. It is important to restrict the use of fossil CO2-based synthetic methane in the industrial sector as its combustion still generates emissions that contribute to climate change. Moreover, carbon capture should be applied exclusively to the industrial sector, as its development in the power sector can hinder the deployment of other renewable energy potential. Therefore, reducing the use of natural gas for electricity production has many benefits. First a reduction in emissions, second, the development of further energy potential, and finally, increased security of supply. Additionally, there is significant potential in capturing CO2 from biogas purification to produce biomethane, which can contribute to decarbonizing the energy system in the SUD PACA region. Lastly, energy policies in a CE perspective should encourage low energy-consuming strategies, such as building renovation, and the use of bicycles/scooters, as they reduce the need for energy and other resources. As shown in the NC scenario, to reach complete decarbonization, greater use of personal mobility vehicles (bicycles and/or scooters) is needed.
In summary, it appears pertinent to follow a CE strategy for the development of regional energy systems. These benefits can be maximized if other aspects of circularity are taken into consideration (not studied in this paper). For instance, increasing the life cycle of appliances in the residential sector might have a large impact on the reduction in energy consumption and material requirements. Moreover, the application of a CE strategy could contribute to other aspects of local development and further promote the sustainable economic development of the territory. For example, developing a second-life battery market and battery recycling could have other benefits for the territory, like job creation. It could also contribute further to sustainability by reducing the need for materials to manufacture new batteries. Finally, the total cost of the system in the NC scenario appears to be around 6% more expensive than that of the CE scenario. However, a deeper analysis of the economic performance of a CE should be performed.

5. Conclusions

The present research aimed to identify how to integrate a CE strategy into the TIMESPACA prospective modeling tool, and how such a strategy can help the SUD PACA region reach its environmental objectives. To answer the first question, different local energy potential comprised in a CE strategy were first identified, and then integrated and associated with different technologies in the TIMESPACA model. Furthermore, different scenarios were constructed to analyze different decarbonization pathways. The reference scenario mainly considers past trends for the evolution of the energy system; the circular economy scenario (SCE) consists of mobilizing resources that would otherwise have been thrown away in order to recover energy and reach a low-carbon energy transition; and the neutral carbon scenario (NCS) implements a carbon budget for CO2 emissions at final energy consumption. These scenarios aim to shed light on the potential pathways and implications of different strategies for achieving a sustainable, decarbonized energy system in the SUD PACA region.
The results indicate that adopting a CE perspective in the development of the energy system of the region can significantly contribute to its decarbonization efforts, resulting in a remarkable reduction in CO2 emissions of more than 50% by 2050. However, to achieve further emissions reductions, the CE approach needs to be supplemented by specific policies aiming at the strategic allocation of resources and favoring low-energy consuming behavior. Firstly, the priority should be building renovation and the development of heat networks, which can massively contribute to meeting space and water heating demands. Carbon capture should be used for industrial activities rather than at fossil fuel-based power plants, as the region still has renewable potential to exploit. Additionally, the region exhibits interesting possibilities for carbon capture, and the captured CO2 can be employed to produce synthetic methane. In terms of usage, biomethane should be prioritized for the building sector and industrial activities. The purification of biogas should be accompanied by CO2 capture, which should subsequently be combined with hydrogen to produce biomethane. The integration of biomethane into the energy mix contributes to the decarbonization of the region, as its combustion emissions are carbon neutral.
For the transport sector, fostering the use of electric vehicles not only helps reduce emissions but also favors the recovery of electric vehicles’ batteries, which are used to store excess solar production. The electrification of the sector should be accompanied by a modal shift with a focus on encouraging the use of electric bicycles and scooters. Furthermore, it is advisable to prioritize the use of hydrogen for vehicles instead of biomethane, as biomethane can be allocated to cover natural gas demand in the industrial and building sectors. Fostering the use of hydrogen can help to stimulate the development of solar production, and also motivate better practices that can increase the mobilization of waste biomass then used to produce hydrogen. In addition, hydrogen can also motivate the use of CO2 to produce other gases and contribute to the decarbonization of the region.
Bearing the above in mind, the implementation of a CE perspective for the development of the energy system in the region shows great potential to reduce the territory’s environmental impact, secure its energy supply, and enhance resource efficiency. By doing so, the region will contribute to the decarbonization of the French energy system as well. This also constitutes an example of how other regions with similar climate conditions, in particular with high solar irradiation, such as in Italy and Spain [94,95], can exploit their solar resources in order to produce other energy vectors like hydrogen, which can contribute to the decarbonization of their energy system, in particular the transport sector.

Author Contributions

Writing—original draft, C.A.; Supervision, S.S.; Funding acquisition, S.S. All authors have read and agreed to the published version of the manuscript.

Funding

This research is primarily funded by ADEME and Région SUD and supported by SCHNEIDER ELECTRIC as part of a doctoral program. The work is also supported by the Modeling for Sustainable Development Chair, driven by MINES ParisTech and Ecole des Ponts ParisTech, supported by ADEME, EDF, GRTgaz, RTE, SCHNEIDER ELECTRIC, TOTAL, and the general directorate for energy and climate of the Ministry of Ecological Transition and Territorial Cohesion. The Modeling for Sustainable Development Chair gratefully acknowledges the support received for this study. The views expressed in the reports or any public documents linked to the research program are attributable only to the authors in their personal capacity and not to the funders.

Data Availability Statement

Data are contained within the article.

Conflicts of Interest

The authors declare no conflicts of interest.

Appendix A

Table A1. Economic data for different technologies associated with a CE.
Technology DataInvestment CostsVariable CostsFix CostsSource
20172030205020252025
Electrolyzers (EUR/kW)Proton Exchange membrane1500950750 45 (EUR M/GW)[64]
Alkaline6253773770.0641.5 (EUR M/GW)
Hydrogen injection963933467 [63]
Gasification—Prod. H2 (EUR/kW)Centralized wood/MSW2453 0.86122.5182[64]
Reforming (EUR/kW)Wood reforming519519 0.1820.77 (MEUR/GW)
Biogas (EUR/kW)Methanisation EUR/MWh 60 [63]
Purification500450405
Biogas purification (EUR/t) 9
Pyrogaseification-MSW (EUR/MWh) 40
Methaner3267447263
Biomethane injection354267193
Energy storage (EUR/kWh)Battery (Lead–acid)176 [64]
Battery (Li-ion)660
Battery (NaNiCl ZEBRA)157
2nd life-RSD—Battery (Li-ion) ELC Storage: DayNite84.89375 [26]
Table A2. Main hypotheses implemented concerning the electricity production for each scenario studied.
2050Growth Rate by YearReferenceCircular EconomyNeutral Carbon
Electricity productionBiogasmaximum possible development (PJ)6%0.844.9Max 30 PJCan substitute the share of natural gasMax 30 PJCan substitute the share of natural gas
minimum development (PJ)1%1.162.32Doubled with respect the reference scenario2.32Doubled with respect the reference scenario
Biomassmaximum possible development (PJ)2%1.432.752.75 2.75
minimum development (PJ)0%1.431.43 1.43
Windmaximum possible development (PJ)2%0.420.811.62Doubled with respect the reference scenario1.62Doubled with respect the reference scenario
minimum development (PJ)1%0.590.59 0.59
Hydromaximum possible development (PJ)1%28.653535 35
minimum development (PJ)0%29.1329.13 29.13
MSWmaximum possible development (PJ)1%1.532.32.3 2.3
minimum development (PJ)0%1.531.53 0
SolarGroundMax 10%1.4747.5247.52 47.52
Min 5%30.2630.26 30.26
RoofMax 10%0.7780.4680.46 80.46
Min 5%3.853.85 3.85
Tidal energyGW 3 3
FossilMax0%35.5435.54Maximum half of the electricity production of natural gas-based power plants present in 2017, but with carbon capture
Electricity storageBatteries max 10% of the upper capacity of the electricity production of the proposed objectivesmax 5 PJmax 10% of the upper capacity of the electricity production of the proposed objectives
Vehicles’ batteries 10% of available electrique batteries in 2050
Table A3. Main hypotheses implemented for each sector of the scenarios studied.
2050ReferenceCircular EconomyNeutral Carbon
Building sectorBuildings renovationMobilisation of potentials~50%100%80%
Electricity At least keeps its share in cooking, heating and water heating demand (~30%)
Biomass Max 13 PJMax 15 PJMax 15 PJ
GasTotal gas available for consumption in the sector10% more gas (with respect to 2017) available for consumption in the sector (sum of different type of gas : natural gas, biogas, blended gas, synthetic gas)
Biogasmax 20 PJCan replace the part of natural gas in the sector
Blended gasmax 60% of available gasCan replace the part of natural gas in the sector
Geothermal max 4 PJmax 16 PJmin 8 PJ
Aerothermal heat pumps max 53,000 units per yearmax 60,950 units per yearmax 53,000 units per year
SolarResidentialmin +10% per year with respect to 2017min +20% per year with respect to 2017min +20% per year with respect to 2017
Commercialmax 1.25 PJmax 2.5 PJmax 2.5 PJ
Oil productsEnergy available for consumptionequal to 2017−80% with respect to 2017
Heat NetworkMax energy delivered through the network20 PJ25 PJ20 PJ
TransportGas max 15% of energy consumption of the sectormax 30% of energy consumption of the sectormax 30% of energy consumption of the sector
Biogas min 10% of the gas available for consumptionmin 15% of the gas available for consumptionmin 15% of the gas available for consumption
Particular vehiclesElectricity~30% of vehiclesmax 80% of private vehicles in 2050max 80% of private vehicles in 2050
Oil products−40% of the energy consumed in 2017No new oil products consuming particular vehicles from 2040
Gasmin 10% of the energy consumed by particular vehiclesmin 15% of the energy consumed by particular vehicles
Modal shift/modal sharePeople by vehicles1.21.7
Bicycles/scooteringcan cover up to ~6% of private vehicles mobility demand in 2050can cover up to ~15% of private vehicles mobility demand in 2050
Buscan cover ~10% of private vehicles mobility demand in 2050can cover up to ~20% of private vehicles mobility demand in 2050
Buses/Freight TransportGasmin 20% of buses consumptionmin 15% of buses consumption
Biofuel max 20 PJ
Hydrogen Min 15 PJ of consumption
Industry At least maintain the share of electricity in the sectorIncrease the share of electricity up to 70% of the energy consumed in the sector
Heat recovery Max 15 PJ
NetworkElectricity −15% with respect to 2017−50% with respect to 2017
Gas max +10% with respect to 2017max +10% with respect to 2017max +10% with respect to 2017
CO2 TAX 100 €/t in 2050

References

  1. Andrade, C. PROSPECTIVE ÉNERGÉTIQUE PACA Quelles Transformations Futures du Territoire Pour Assurer une Transition Energétique et D’économie Circulaire? Optimisation et Contrôle [math.OC]. Ph.D. Thesis, Université Paris Sciences et Lettres, Paris, France, 2021. NNT : 2021UPSLM047. tel03608657. 2021. [Google Scholar]
  2. Kiviranta, K.; Thomasson, T.; Hirvonen, J.; Tähtinen, M. Connecting circular economy and energy industry: A techno-economic study for the Åland Islands. Appl. Energy 2020, 279, 115883. [Google Scholar] [CrossRef]
  3. Tomić, T.; Schneider, D.R. Municipal solid waste system analysis through energy consumption and return approach. J. Environ. Manag. 2017, 203, 973–987. [Google Scholar] [CrossRef] [PubMed]
  4. Korhonen, J.; Honkasalo, A.; Seppälä, J. Circular Economy: The Concept and its Limitations. Ecol. Econ. 2018, 143, 37–46. [Google Scholar] [CrossRef]
  5. Masi, D.; Day, S.; Godsell, J. Supply Chain Configurations in the Circular Economy: A Systematic Literature Review. Sustainability 2017, 9, 1602. [Google Scholar] [CrossRef]
  6. Haupt, M.; Vadenbo, C.; Hellweg, S. Do We Have the Right Performance Indicators for the Circular Economy?: Insight into the Swiss Waste Management System. J. Ind. Ecol. 2017, 21, 615–627. [Google Scholar] [CrossRef]
  7. Geissdoerfer, M.; Savaget, P.; Bocken, N.M.P.; Hultink, E.J. The Circular Economy—A new sustainability paradigm? J. Clean. Prod. 2017, 143, 757–768. [Google Scholar] [CrossRef]
  8. Mutezo, G.; Mulopo, J. A review of Africa’s transition from fossil fuels to renewable energy using circular economy principles. Renew. Sustain. Energy Rev. 2020, 137, 110609. [Google Scholar] [CrossRef]
  9. Millot, A.; Maïzi, N. From open-loop energy revolutions to closed-loop transition: What drives carbon neutrality? Technol. Forecast. Soc. Change 2021, 172, 121003. [Google Scholar] [CrossRef]
  10. Pan, S.-Y.; Du, M.A.; Huang, I.-T.; Liu, I.-H.; Chang, E.-E.; Chiang, P.-C. Strategies on implementation of waste-to-energy (WTE) supply chain for circular economy system: A review. J. Clean. Prod. 2015, 108, 409–421. [Google Scholar] [CrossRef]
  11. Yan, J.; Xu, M. Energy and circular economy in sustainability transitions. Resour. Conserv. Recycl. 2021, 169, 105471. [Google Scholar] [CrossRef]
  12. Kaza, S.; Yao, L.C.; Bhada-Tata, P.; Van Woerden, F. What a Waste 2.0: A Global Snapshot of Solid Waste Management to 2050; Urban Development Series; World Bank: Washington, DC, USA, 2018. [Google Scholar] [CrossRef]
  13. Luttenberger, L.R. Waste management challenges in transition to circular economy—Case of Croatia. J. Clean. Prod. 2020, 256, 120495. [Google Scholar] [CrossRef]
  14. Lee, R.P.; Tschoepe, M.; Voss, R. Perception of chemical recycling and its role in the transition towards a circular carbon economy: A case study in Germany. Waste Manag. 2021, 125, 280–292. [Google Scholar] [CrossRef] [PubMed]
  15. Gherghel, A.; Teodosiu, C.; De Gisi, S. A review on wastewater sludge valorisation and its challenges in the context of circular economy. J. Clean. Prod. 2019, 228, 244–263. [Google Scholar] [CrossRef]
  16. Sia Partners and France Biométhane, Observatoire du Biométhane. 2017. Available online: http://france-biomethane.fr/ (accessed on 10 May 2021).
  17. van der Roest, E.; van der Spek, M.; Ramirez, A.; van der Zwaan, B.; Rothenberg, G. Converting Waste Toilet Paper into Electricity: A First-Stage Technoeconomic Feasibility Study. Energy Technol. 2017, 5, 2189–2197. [Google Scholar] [CrossRef]
  18. Kapoor, R.; Ghosh, P.; Kumar, M.; Sengupta, S.; Gupta, A.; Kumar, S.S.; Vijay, V.; Kumar, V.; Vijay, V.K.; Pant, D. Valorization of agricultural waste for biogas based circular economy in India: A research outlook. Bioresour. Technol. 2020, 304, 123036. [Google Scholar] [CrossRef] [PubMed]
  19. Wainaina, S.; Awasthi, M.K.; Sarsaiya, S.; Chen, H.; Singh, E.; Kumar, A.; Ravindran, B.; Awasthi, S.K.; Liu, T.; Duan, Y.; et al. Resource recovery and circular economy from organic solid waste using aerobic and anaerobic digestion technologies. Bioresour. Technol. 2020, 301, 122778. [Google Scholar] [CrossRef] [PubMed]
  20. Materazzi, M.; Taylor, R. The GoGreenGas Case in the UK; Elsevier Inc.: Amsterdam, The Netherlands, 2019. [Google Scholar] [CrossRef]
  21. ADEME. La Chaleur Fatale; ADEME: Angers, France, 2017. [Google Scholar]
  22. Hampikian, Z. «Distribuer la chaleur fatale des entreprises: La construction dynamique d’un réseau d’énergie décarbonée, entre flux et infrastructure», Développement durable et territoires [En ligne], Volume 8, 2017. Available online: https://journals.openedition.org/developpementdurable/11736 (accessed on 17 September 2021).
  23. Xu, Z.; Wang, R.; Yang, C. Perspectives for low-temperature waste heat recovery. Energy 2019, 176, 1037–1043. [Google Scholar] [CrossRef]
  24. Atienza-Márquez, A.; Bruno, J.C.; Coronas, A. Recovery and transport of industrialwaste heat for their use in urban district heating and cooling networks using absorption systems. Appl. Sci. 2019, 10, 291. [Google Scholar] [CrossRef]
  25. Cusenza, M.A.; Guarino, F.; Longo, S.; Mistretta, M.; Cellura, M. Reuse of electric vehicle batteries in buildings: An integrated load match analysis and life cycle assessment approach. Energy Build. 2019, 186, 339–354. [Google Scholar] [CrossRef]
  26. Martinez-Laserna, E.; Gandiaga, I.; Sarasketa-Zabala, E.; Badeda, J.; Stroe, D.I.; Swierczynski, M.; Goikoetxea, A. Battery second life: Hype, hope or reality? A critical review of the state of the art. Renew. Sustain. Energy Rev. 2018, 93, 701–718. [Google Scholar] [CrossRef]
  27. Pagliaro, M.; Meneguzzo, F. Lithium battery reusing and recycling: A circular economy insight. Heliyon 2019, 5, e01866. [Google Scholar] [CrossRef] [PubMed]
  28. McDowall, W.; Geng, Y.; Huang, B.; Barteková, E.; Bleischwitz, R.; Türkeli, S.; Kemp, R.; Doménech, T. Circular Economy Policies in China an Europe. J. Ind. Ecol. 2017, 21, 651–661. [Google Scholar] [CrossRef]
  29. European Commission. Boucler la Boucle—Un Plan D’action de l’Union Européenne en Faveur de L’économie Circulaire; European Commission: Brussels, Belgium, 2015. [Google Scholar]
  30. Legifrance, LOI n° 2015-992 du 17 août 2015 Relative à la Transition Energétique pour la Croissance Verte (1). Available online: https://www.legifrance.gouv.fr/jorf/id/JORFTEXT000031044385 (accessed on 14 April 2021).
  31. Pointereau, R.; Mouiller, P. Les Dispositions Applicables aux Collectivités Territoriales du Projet de loi Relatif à la Transition Energétique Pour la Croissance Verte; RAPPORT D´INFORMATION au nom de la délégation aux collectivités territoriales et à la décentralisation; Sénat: Paris, France, 2015. [Google Scholar]
  32. Poupeau, F.-M. Everything must change in order to stay as it is. The impossible decentralization of the electricity sector in France. Renew. Sustain. Energy Rev. 2019, 120, 109597. [Google Scholar] [CrossRef]
  33. Dreyfus, M.; Allemand, R. Three years after the French energy transition for green growth law: Has the ‘energy transition’ actually started at the local level? J. Environ. Law 2018, 30, 109–133. [Google Scholar] [CrossRef]
  34. Région SUD. Schéma Régional D’aménagement, de Développement Durable et D’égalité des Territoires (Sraddet); Région SUD: Marseille, France, 2019. [Google Scholar]
  35. Su, C.; Urban, F. Circular economy for clean energy transitions: A new opportunity under the COVID-19 pandemic. Appl. Energy 2021, 289, 116666. [Google Scholar] [CrossRef] [PubMed]
  36. Businge, C.N.; Mazzoleni, M. Impact of circular economy on the decarbonization of the Italian residential sector. J. Clean. Prod. 2023, 408, 136949. [Google Scholar] [CrossRef]
  37. Schöggl, J.-P.; Stumpf, L.; Baumgartner, R.J. The narrative of sustainability and circular economy—A longitudinal review of two decades of research. Resour. Conserv. Recycl. 2020, 163, 105073. [Google Scholar] [CrossRef]
  38. Observatoire Régional de l’Energie du Climat et de l’Air de Provence-Alpes-Côte d’Azur, Bilan 2018; ORECA: Marseille, France, 2018.
  39. AtmoSud, Consultation d’Inventaires Géolocalisées Air-cLimat-Energie. Available online: https://cigale.atmosud.org/documentation.php (accessed on 27 February 2024).
  40. Région SUD. Annexe, Bilan du Scéhma Régionale Climat Air Energie SRCAE de Provence-Alpes-Côte d’ Azur; Région SUD: Marseille, France, 2018. [Google Scholar]
  41. Loulou, R.; Labriet, M. ETSAP-TIAM: The TIMES integrated assessment model Part I: Model structure. Comput. Manag. Sci. 2007, 5, 7–40. [Google Scholar] [CrossRef]
  42. Didelot, A.; Maïzi, N.; Mazauric, V.; Assoumou, E.; Selosse, S. Balancing Energy Efficiency and Fossil Fuel: The Role of Carbon Pricing. Energy Procedia 2017, 105, 3545–3550. [Google Scholar] [CrossRef]
  43. Kang, S. La Place de la Bioénergie dans un Monde Sobre en Carbone: Analyse Prospective et Développement de la Filière Biomasse dans le Modèle TIAM-FR. Ingénierie de L’environnement. Ph.D. Thesis, PSL Research University, Paris, France, 2017. NNT: 2017PSLEM081. tel-02096031. 2017. [Google Scholar]
  44. Postic, S.; Selosse, S.; Maïzi, N. Energy contribution to Latin American INDCs: Analyzing sub-regional trends with a TIMES model. Energy Policy 2017, 101, 170–184. [Google Scholar] [CrossRef]
  45. Assoumou, E. Modélisation MARKAL Pour la Planification Energétique Long Terme dans le Contexte Français. 2006. Available online: https://pastel.hal.science/pastel-00002752/document (accessed on 8 February 2024).
  46. Millot, A. Faire la Transition Energétique bas-Carbone ou Comment Réaliser L’avènement d’un Mythe? Mathématiques générales [math.GM]; Université Paris sciences et lettres: Paris, France, 2019; ffNNT : 2019PSLEM074ff. fftel-02897919. [Google Scholar]
  47. Selosse, S.; Garabedian, S.; Ricci, O.; Maïzi, N. The renewable energy revolution of reunion island. Renew. Sustain. Energy Rev. 2018, 89, 99–105. [Google Scholar] [CrossRef]
  48. Bouckaert, S. Contribution des Smart Grids à la Transition Energétique: Évaluation dans des Scénarios Long Terme. 2014. Available online: https://pastel.hal.science/pastel-00959266/document (accessed on 8 February 2024).
  49. Drouineau, M. Modélisation Prospective et Analyse Spatio-Temporelle: Intégration de la Dynamique du Réseau Electrique. Energie Électrique; École Nationale Supérieure des Mines de Paris: Paris, France, 2011; Français. ffNNT : 2011ENMP0104ff. ffpastel-00731894. [Google Scholar]
  50. KanORS, VEDA. Available online: https://www.kanors-emr.org/home (accessed on 7 August 2021).
  51. IEA-ETSAP|Optimization Modeling Documentation. Available online: https://iea-etsap.org/index.php/documentation (accessed on 24 May 2021).
  52. Andrade, C.; Selosse, S.; Maïzi, N. The role of power-to-gas in the integration of variable renewables. Appl. Energy 2022, 313, 118730. [Google Scholar] [CrossRef]
  53. IEA. Reduce: Energy Efficiency; IEA: Paris, France, 2020. [Google Scholar]
  54. Taranic, I.; Behrens, A.; Topi, C. Understanding the Circular Economy in Europe, from Resource Efficiency to Sharing Platforms: The CEPS Framework; no. 143. 2016. Available online: https://www.researchgate.net/publication/306263292_Understanding_the_Circular_Economy_in_Europe_from_Resource_Efficiency_to_Sharing_Platforms_The_CEPS_Framework?channel=doi&linkId=57b57d8208aeaab2a1044803&showFulltext=true (accessed on 8 February 2024).
  55. Prieto-Sandoval, V.; Jaca, C.; Ormazabal, M. Towards a consensus on the circular economy. J. Clean. Prod. 2018, 179, 605–615. [Google Scholar] [CrossRef]
  56. IEA. Reuse: Carbon Reuse; IEA: Paris, France, 2020. [Google Scholar]
  57. Bonsu, N.O. Towards a circular and low-carbon economy: Insights from the transitioning to electric vehicles and net zero economy. J. Clean. Prod. 2020, 256, 120659. [Google Scholar] [CrossRef]
  58. IRENA. Recycle: Bioenergy; IRENA: Masdar City, United Arab Emirates, 2020. [Google Scholar]
  59. Morseletto, P. Targets for a circular economy. Resour. Conserv. Recycl. 2020, 153, 104553. [Google Scholar] [CrossRef]
  60. ADEME. Les Réseaux de Chaleur et de Froid, Etat des Lieux de la Filière—Marchés, Emplois, Coûts; ADEME: Paris, France, 2019. [Google Scholar]
  61. Meylan, F.D.; Piguet, F.-P.; Erkman, S. Power-to-gas through CO2 methanation: Assessment of the carbon balance regarding EU directives. J. Energy Storage 2017, 11, 16–24. [Google Scholar] [CrossRef]
  62. Blanco, H.; Nijs, W.; Ruf, J.; Faaij, A. Potential of Power-to-Methane in the EU energy transition to a low carbon system using cost optimization. Appl. Energy 2018, 232, 323–340. [Google Scholar] [CrossRef]
  63. Doudard, R. Flexibilité et Interactions de Long Terme dans les Systèmes Multi-Énergies : Analyse Technico-Économique des Nouvelles Filières Gazières et Électriques en France. Energie Électrique; Université Paris sciences et lettres: Paris, France, 2018; ffNNT : 2018PSLEM067ff. fftel-02352009. [Google Scholar]
  64. Sgobbi, A.; Nijs, W.; De Miglio, R.; Chiodi, A.; Gargiulo, M.; Thiel, C. How far away is hydrogen? Its role in the medium and long-term decarbonisation of the European energy system. Int. J. Hydrogen Energy 2016, 41, 19–35. [Google Scholar] [CrossRef]
  65. ENEA. Consulting, État des Lieux du Biométhane en France; ENEA: Poznań, Poland, 2017. [Google Scholar]
  66. GRTgaz. Conditions techniques et économiques d’injection d’hydrogène dans les réseaux de gaz naturel. Présence Afr. 2019, 46. [Google Scholar] [CrossRef]
  67. Antea Group. Evaluation du Potentiel de Récupération d’ Energie Thermique dans les Réseaux d’ Assainissement de la Région Provence-Alpes-Côte d’ Azur; Antea Group: Heerenveen, The Netherlands, 2011. [Google Scholar]
  68. ADEME. Un Mix de Gaz 100% Renouvelable en 2050? Etude de Faisabilité Technico-Economique. 2018, p. 22. Available online: http://www.ademe.fr/synthese-etude (accessed on 8 February 2024).
  69. Cerema Méditerranée. Évaluation Macroscopique du Potentiel Photovoltaïque Mobilisable au Sol en région Provence-Alpes-Cote d’Azur; Cerema: Bron, France, 2019. [Google Scholar]
  70. ADEME and Armines PERSEE. Un Mix Electrique 100% Renouvelable? Analyses et Optimisations Simulation de la Production Renouvelable et Evaluation des Gisements Le cas des Filières Eoliennes Terrestre et en mer, PV au sol, PV sur Toitures et Solaire Thermodynamique. Ademe. 2015, pp. 1–51. Available online: www.ademe.fr (accessed on 8 February 2024).
  71. Valorem-Conexia Energy. Etude du Potentiel de Production d Électricité d’origine Eolienne Terrestre en Provence-Alpes-Côte d’Azur; Valorem: Begles, France, 2010. [Google Scholar]
  72. Moulin, M.; de Bauer-Cauneille, H.; Faure, M.; Percheval, J.; Lyant, V. Etude des Potentialités Géothermiques en Région Provence-Alpes-Côte d’Azur. Atlas Géothermique et Évaluation du Potentiel Géothermique Mobilisable; Rapport final. BRGM/RP- 62255 -FR, 96 p., 43 ill., 5 ann., 1 CD.; BRGM: Orleans, France, 2013. [Google Scholar]
  73. CEREMA. Mise à Jour 2015 du Potentiel Hydroélectrique en Région PACA; CEREMA: Bron, France, 2015. [Google Scholar]
  74. Hélianthe, Evaluation du Potentiel Énergétique des Sources de Méthanisation de Provence-Alpes-Côte d’Azur; ORECA: Marseille, France, 2015.
  75. INSEE. Entre 29,000 et 35,000 Résidences Principales à Produire Chaque Année d’ici 2030. 2019. Available online: https://www.insee.fr/fr/statistiques/4185973 (accessed on 8 February 2024).
  76. Marcheteau, G. Tout Savoir sur la Réglementation Thermique. 2020. Available online: https://www.lenergietoutcompris.fr/actualites-conseils/tout-savoir-sur-la-reglementation-thermique-2020-48152 (accessed on 8 February 2024).
  77. ADEME. L’exercice de Prospective de l’ADEME « Vision 2030–2050 »; ADEME: Angers, France, 2015; p. 297. [Google Scholar]
  78. INSEE. Projections de Population 2013–2050 Pour les Départements et les Régions. 2017. Available online: https://www.insee.fr/fr/statistiques/2859843 (accessed on 8 February 2024).
  79. Haut Conseil Pour le Climat. Etude Qualitative sur la Prise en Compte des Politiques Climat par les Régions; Haut Conseil Pour le Climat: Paris, France, 2020; pp. 1–70. [Google Scholar]
  80. Région SUD. Plan Régional Hydrogène; Région SUD: Marseille, France, 2020; pp. 1–59. [Google Scholar]
  81. Ministère de la Transition Écologique et Solidaire. Stratégie Nationale Bas-Carbone; Ministère de la Transition Ecologique et Solidaire: Paris, France, 2020. [Google Scholar]
  82. S3D. Etude du Potentiel de Production de Biométhane de 2nd Génération en Région Provence Alpes Côte d’ Azur; S3D: Paris, France, 2018; pp. 1–67. [Google Scholar]
  83. International Energy Agency. France 2016 Review. In Energy Policies of IEA Countries; International Energy Agency: Paris, France, 2017; p. 207. [Google Scholar]
  84. Mirakyan, A.; De Guio, R. Integrated energy planning in cities and territories: A review of methods and tools. Renew. Sustain. Energy Rev. 2013, 22, 289–297. [Google Scholar] [CrossRef]
  85. Wang, K.; Costanza-van den Belt, M.; Heath, G.; Walzberg, J.; Curtis, T.; Berrie, J.; Schröder, P.; Lazer, L.; Altamirano, J.C. Circular Economy as a Climate Strategy: Current Knowledge and Calls-to-Action; World Resources Institute: Washington, DC, USA, 2022. [Google Scholar]
  86. Mercader-Moyano, P.; Esquivias, P.M. Decarbonization and circular economy in the sustainable development and renovation of buildings and neighbourhoods. Sustainability 2020, 12, 7914. [Google Scholar] [CrossRef]
  87. Almulhim, T.; Barahona, I. Renewable energies and circular economies: A systematic literature review before the ChatGPT boom. Energy Rep. 2024, 11, 2656–2669. [Google Scholar] [CrossRef]
  88. Kongkuah, M. Impact of Belt and Road countries’ renewable and non-renewable energy consumption on ecological footprint. Environ. Dev. Sustain. 2023, 2023, 1–26. [Google Scholar] [CrossRef]
  89. Kongkuah, M. Impact of economic variables on CO2 emissions in belt and road and OECD countries. Environ. Monit. Assess. 2023, 195, 1–16. [Google Scholar] [CrossRef] [PubMed]
  90. Sen, A.; Meini, L.; Napoli, E.; Napoli, C. Beyond Energy: Incentivizing Decarbonization through the Circular Economy; Oxford Institute for Energy Studies: Oxford, UK, 2021; ISBN 978-1-78467-174-7. [Google Scholar]
  91. Ajanovic, A.; Sayer, M.; Haas, R. On the future relevance of green hydrogen in Europe. Appl. Energy 2024, 358, 122586. [Google Scholar] [CrossRef]
  92. ADEME. Le Captage et Stockage Géologique du CO2 (CSC) en France. Avis technique; ADEME: Paris, France, 2020; Volume 2. [Google Scholar]
  93. ADEME. Le Captage et Stockage Géologique de CO2 (CSC) en France: Un Potentiel Limité Pour Réduire les Emissions Industrielles; ADEME: Paris, France, 2020. [Google Scholar]
  94. IEA. National Hydrogen Strategy Preliminary Guidelines. Available online: https://www.iea.org/policies/13087-national-hydrogen-strategy-preliminary-guidelines (accessed on 25 August 2021).
  95. Spanish Government. Hydrogen Roadmap: A Commitment to Renewable Hydrogen. Available online: https://www.miteco.gob.es/es/ministerio/hoja-de-ruta-del-hidrogeno-renovable.aspx (accessed on 25 August 2021). (In Spanish).
Figure 1. SUD PACA’s reference energy system.
Energies 17 01407 g001
Figure 2. Vision of the circular energy system for the SUD PACA region.
Energies 17 01407 g002
Figure 3. Final energy consumption and CO2 emissions in the building and transport sectors.
Energies 17 01407 g003
Figure 4. Final energy consumption and CO2 emissions from the industry.
Energies 17 01407 g004
Figure 5. Electricity production in the three different scenarios.
Energies 17 01407 g005
Figure 6. Electric production per zone.
Energies 17 01407 g006
Figure 7. Electricity storage.
Energies 17 01407 g007
Table 1. Techno-economic characteristics of individual mobility vehicles.
Electric BicyclesElectric ScootersHydrogen Scooters
ModelVog OD7Vog D8CSWAN D8ISwan A8 Di2Xiaomi M365Razor EcosmartMicro MerlinDualtron UltraHydrogen Fuel Cell
Price (EUR)119915991999319931530085037004000
Autonomie (km)7080110125303020120150
Power (Wh)5765046005405005005002100748
Table 2. Energy potential of the SUD PACA region.
Type of EnergyEnergy Potential (PJ)Source
Heat recovery from wastewater2.36[67]
Waste heat from industry33.10[21]
Waste hydrogen1.28[68]
Ground photovoltaic54.81[69]
Roof photovoltaic92.80[70]
Wind21.48[71]
Geothermal136.79[72]
Hydraulic14.73[73]
Agricultural waste9.71[74]
Green waste1.36
Municipal solid waste13.52
Wastewater sludge1.52
Wood27.73[68]
Total411.19
Table 3. Power-to-gas projects programmed in the SUD PACA region.
P2G Projects
Name of the ProjectProduction CapacityYear of DevelopmentType of Project
Jupiter 10001 GW2020Electrolyzers
HYGREEN12 MW2025Electrolyzers
435 MW2030
Valhydate7500 t/an2025Waste hydrogen valorization
HynoVAR72030Hydrogen buses
404 kg/j2030Hydrogen production
HyAMMED82025Freight cars
Table 4. Main assumptions for the CE scenario.
Proposed Objectives in a CES in 2050
ObjectiveAction
100%Industrial waste heat
100%Wastewater heat
100%Sludge
100%Municipal, agriculture, and green waste
100%Buildings renovation
15%CCU
People by personal vehicle1.70people by car
Modal shift Personal mobility vehicles can cover up to 17% of car mobility demand, and buses can cover up to 7% in 2050
Air heat pumps15% more than the reference scenario
Tidal energy1 GW
Wind3 times the reference scenario
No new fossil power plants
Table 5. Objectives established in the regional hydrogen plan.
Objectives of the Regional Hydrogen Plan20272032
Freightunits100630
Utility vehiclesunits5402280
Busesunits85260
H2 productiontH2/year16,00028,800
Injection into the gas networktH2/year30005400
Table 6. Carbon budget targeted in the SNBC.
CO2 Reduction Objectives by Sector20302050
Buildings−49%−100%
Transport−28%−100%
Industry−35%−81%
Disclaimer/Publisher’s Note: The statements, opinions and data contained in all publications are solely those of the individual author(s) and contributor(s) and not of MDPI and/or the editor(s). MDPI and/or the editor(s) disclaim responsibility for any injury to people or property resulting from any ideas, methods, instructions or products referred to in the content.

