Article

Modelling Public Intentions to Use Innovative EV Chargers Employing Hybrid Energy Storage Systems: A UK Case Study Based upon the Technology Acceptance Model

1
Department of Psychology, University of Portsmouth, Portsmouth PO1 2DY, UK
2
Department of Psychology, Universidad de Magallanes, Punta Arenas 6210427, Chile
3
Marwell Wildlife, Winchester SO21 1JH, UK
4
Department of Mechanical Engineering, University of Southampton, Southampton SO17 1BJ, UK
*
Author to whom correspondence should be addressed.
Energies 2024, 17(6), 1405; https://doi.org/10.3390/en17061405
Submission received: 31 January 2024 / Revised: 28 February 2024 / Accepted: 8 March 2024 / Published: 14 March 2024
(This article belongs to the Section D: Energy Storage and Application)

Abstract

:
The current study investigates public intentions to use an innovative, off-grid renewably powered EV charging technology called FEVER (Future Electric Vehicle Energy networks supporting Renewables). We report the findings of a questionnaire-based survey (QBS) conducted at a zoo in the south of England, exploring the prospect of demonstrating FEVER. The QBS was designed around a context-specific technology acceptance model (TAM) and administered both face-to-face (n = 63) and online (n = 158) from April to May 2023. The results indicate that most participants were willing to pay to use FEVER, particularly where revenue would benefit the zoo. The participants agreed they intended to use the chargers, and that they would be useful and easy to use. The participants agreed that there would be normative pressure to use the chargers, but that their use would be enjoyable. Of greatest concern was that the chargers would be blocked by others. The participants were ambivalent about concerns over charging duration and charge sufficiency. Structural equation modelling confirmed that the context-specific TAM explained 58% of people’s use intentions. The core relationships of the TAM were confirmed, with ‘perceived usefulness’ additionally predicted by subjective norms and ‘perceived ease of use’ additionally predicted by anticipated enjoyment. Of the other variables, only concern that the chargers would be blocked was retained as a marginal predictor of ‘perceived ease of use’. The implications of these findings for the co-design and demonstration of FEVER are discussed.

1. Introduction

Electric vehicle (EV) ownership and use in the United Kingdom (UK) is increasing rapidly. As of December 2023, there were around 1,560,000 plug-in cars registered in the UK, comprising around 975,000 full electric and 590,000 plug-in hybrids. This equates to a 41% growth in registrations compared with 2022 [1]. While internal combustion engine vehicles and mild hybrids still account for the majority of new car registrations in the UK, a growing proportion of vehicles are electrified, with 28.3% of all new cars sold in December 2023 being either fully electric or plug-in hybrids [2].
The trend towards the electrification of domestic and commercial vehicles in the UK, in line with the UK government policies around net zero [3], is raising important technical, social, and socio-technical questions. For example, (a) where should EV charging infrastructure be located, given pre-existing or anticipated grid-constraints and accessibility considerations [4,5,6,7]; (b) what do end-users expect from charging infrastructure and how will they respond to demand side management interventions [8,9]; and (c) how do the actions of end-users directly or remotely (e.g., through apps) interact with provisioned infrastructure [10,11]?
The current study aimed to shed light on public intentions to use an innovative, off-grid renewably powered EV charging technology called ‘FEVER’ (fever-ev.ac.uk). This charging concept links wind and solar generation to different hybrid forms of long- and shorter-term energy storage (e.g., flow batteries, Li-ion batteries, H2 fuel cells, etc.) to create an EV charging solution that is not reliant on the national electricity grid. Hybrid energy storage systems (HESS) are being studied and developed, as such systems enable the creation of energy stores with the required power/energy/temporal performance characteristics at the lowest capital cost, and with the highest recyclability [12]. Being entirely ‘off-grid’, FEVER has the flexibility to be deployed in grid-constrained areas or in situations where accessing the grid would be challenging and/or costly. The hardware is also accompanied by a user interface and back-office management and control system, designed to forecast demand and communicate with end-users about the availability and cost of charging. See Figure 1 for a schematic diagram of the FEVER charging concept.
A crucial aspect of the research, development, and demonstration of FEVER is the inclusion of social scientific studies designed to assess end-user expectations and intentions to use the chargers. The purpose of these studies is to learn more about the nature and antecedents of public sentiment towards the technology, providing opportunities to integrate these perspectives into the design of the infrastructure, its placement, and the associated end-user interface. This paper reports upon the findings of a study designed to elucidate the emerging ‘public face’ of the FEVER charging stations, when considered as a destination charging option in a context where there is no extant charging infrastructure (i.e., Marwell Zoo). As part of an active research programme, this article will consider not only the implications of the findings for destination charging infrastructure in principle, but also for the ongoing evolution and co-design of the FEVER charging infrastructure. In the remainder of the introduction, we outline more about the growing need for EV charging in the UK before summarising the key literature into public perceptions of EVs and EV charging. In doing so, we introduce and appraise the technology acceptance model (TAM [13]), which provides the theoretical framework for our study. We end by outlining the aims and objectives of the current study.

1.1. The ‘Public Face’ of Charging Infrastructure in the UK

Efforts to stimulate growth in EV ownership and use in the UK have been accompanied by policy and fiscal initiatives designed to incentivise the provision of charging infrastructure [1]. For example, ‘plugged-in-places’ was a government-backed scheme designed to provide match-funding for private companies and consortia wishing to install plug-in vehicle charge points [14]. While such schemes have been successful in encouraging the roll-out of some charging infrastructure, significant challenges remain.
The predicted energy demand resulting from the growth in EVs in the UK is anticipated to reach around 30 TWh by 2030 and around 65–100 TWh by 2050 [3]. This will necessitate significant financial investment in new charging infrastructure and will present further challenges, which, according to Chen et al. [15], can be consolidated into six key areas:
  • The expansion of power generation, transmission, and distribution capacity due to increasing demand for charging and to account for fluctuations in demand.
  • The need for faster charging technologies to contend with growing battery sizes and the need to provide adequate charge within a reasonable charging time.
  • The siting of charging infrastructure (and related planning challenges) to ensure convenient and sufficient availability of charge points to meet consumer demand.
  • Advancing wireless charging technologies to increase the simplicity, user friendliness, and convenience of charging.
  • Innovation in smart charging to foster real-time flexibility in charging in order to cope with fluctuations in generation and demand.
  • Investigating vehicle-to-grid (V2G) applications as a means of using EVs as a form of distributed energy storage to release power back to the grid when necessary.
Alongside the clear need for technological innovation to address these challenges, the frequent references to factors such as the reasonableness of charge times and the simplicity and user-friendliness of charging technology recognise the integral importance that end-users will play in the evolution and deployment of charging infrastructure. The importance of considering the ‘public face’ [16] of energy technologies is well-established [17,18,19]. This is particularly the case in Westernised democracies like the UK, where the public is empowered to affect decision making about technological research and development at different scales (e.g., at the socio-political level as voting citizens and at more local levels as recipients and/or users of technology) [20].
While active engagement with the public around technological R&D can be challenging and costly, it can hold significant value for developers, e.g., in helping to better understand the market for a certain type of technology and by fostering trust among the recipients of the technology [21,22]. As such, calls for engaging the public earlier in the innovation cycle for new technologies are growing [23,24]. This ethos is reflected in concepts such as user-centred design and responsible research and innovation, which place the recipients or end-users of technology closer to the heart of decision-making about key aspects of technological design and deployment [25,26].

1.2. Modelling Public Acceptance of EVs and Charging Infrastructure

While several outstanding questions remain [27], the social scientific literature on the public acceptability and acceptance of electric vehicles (EVs) is maturing [28,29,30,31]. For example, studies have identified issues such as the perceived affordability of EVs and range anxiety as key barriers to their uptake, while common facilitators are things like the anticipated environmental benefits of EVs and the image/status boost that comes from driving an EV. While less developed, there is also growing literature pertaining to the nature and determinants of public attitudes and intentions to use EV chargers and/or charging initiatives (e.g., smart charging) [8,32,33]. For instance, the provision (or lack thereof) of public charging infrastructure, alongside the anticipated speed and cost of charging, are commonly cited concerns among prospective end-users [34,35,36]. We drew upon this literature in developing the survey for use in the current study.
A psychological model that is often used to understand people’s technology use intentions (and actual use behaviours) is the technology acceptance model (TAM). Originally devised in the 1980s as a means of explaining people’s use of workplace information technologies [13], the TAM has been applied to many different technologies [37,38,39], including EVs [40,41]. The TAM is a utilitarian model that posits that a person’s intentions to use a specific type of technology are predicted by their attitude towards the use of a technology. In turn, attitudes are predicted by (1) the perceived usefulness (PU) and (2) perceived ease of use (PEOU) of the technology (see Figure 2). PU refers to a person’s beliefs about whether the technology will be useful (or not) for its intended purpose (also called ‘job performance’) and PEOU is the person’s assessment about how effortless or effortful it would be to use the technology. PU and PEOU are thought to be shaped by ‘external variables’. These variables are expressed in extensions and adaptations of the core TAM (e.g., TAM2 [42], TAM3 [43]) and include variables relating to social influence processes (e.g., subjective norms) and beliefs about the instrumental value of the technology (e.g., output quality, result demonstrability). These external variables are typically modelled as direct predictors of PU and/or PEOU, although some are thought to moderate the strength of relationships within the model (e.g., experience with the technology).
In studies using the TAM, it has now become common to omit a direct assessment of people’s attitudes towards the technology [44,45]. This stems from findings that particularly within volitional settings (i.e., where people have the freedom to choose whether or not to use technology), PU is often better as a direct predictor of intentions [46,47]. Attitudes towards the use of a technology are, however, important in some contexts, e.g., where technology is imposed upon someone or where its use is considered mandatory. In such circumstances, whether or not a person is favourable towards the technology can affect whether they seek to support or resist its introduction [45].
Figure 2. The original technology acceptance model (TAM); authors’ own elaboration based on [48].
Energies 17 01405 g002
In the context of EVs, and in the past decade alone, versions of the TAM have proven useful in modelling such things as (a) the predictors of EV purchase intentions [40]; (b) the value of road-testing and experience in shaping use intentions [47]; (c) the role of marketing and promotion in shaping purchase intentions [49]; and (d) the relative acceptability of EVs compared with autonomous vehicles and car-sharing [50]. TAM-based research has also been extended to consider not only the purchase and use of EVs, but also intentions to use charging infrastructure and associated innovations in demand side management [51,52,53]. For example, Wang et al. [51] successfully used an extended version of the TAM to model the acceptance of two forms of EV charging scheduling (EVCS) in China. They found a preference for temporal-based (when people should charge) versus location-based (where people should charge) messaging among their sample. Deumlich et al. [52] developed a ‘context-specific’ version of the TAM to investigate perceptions of private electric vehicle charging infrastructure (PEVCI) among a sample of the German public. They found support for the core TAM constructs in predicting behavioural intentions; however, while some of the additional variables in their model (perceived convenience, environmental awareness, and experience) were predictive of PU or PEOU, others (visual design, perceived costs, and output quality) were not.
Interestingly, there are also now some examples of studies utilising the TAM in relation to understanding public acceptance of innovations in EV charging, such as wireless charging [54] and battery swapping [55,56]. With this in mind, the current study sought to use an adapted version of the TAM to investigate public intentions to use the FEVER charging concept (henceforth ‘intention’).

1.3. Current Study and Hypotheses

The primary goal of the current study was to learn more about the acceptability and intentions to use the FEVER chargers among a sample of the UK public. The findings also, however, hold wider relevance for understanding public perceptions of destination charging infrastructure in principle. This study formed part of the active FEVER technical R&D programme (fever-ev.ac.uk), providing a timely opportunity to feed the findings into the ongoing design decisions pertaining to the technology. The study was conducted in collaboration with Marwell Zoo, a 140-acre zoo that is situated near Winchester in Hampshire, England. It was founded in 1972 and is home to around 150 species of animals. It welcomes over 500,000 visitors each year, the majority of whom use privately owned or leased vehicles to travel. At the time of the study, there were no public-facing EV charge points, so the operators of the zoo were investigating the prospect of introducing some, including the prospect of demonstrating FEVER.
To achieve our research goal, we engaged visitors to Marwell Zoo (as prospective end-users of FEVER) in a questionnaire-based survey (QBS) structured around a context-specific version of the TAM. This was performed to evaluate their intentions to use the FEVER chargers, should it be installed on-site.
Two primary research questions (RQs) were addressed in this study:
  • What is the nature of public opinion towards the FEVER charging concept?
  • What factors determine (future) intentions to use the FEVER EV charging infrastructure?
Consistent with the TAM and TAM2, our context-specific model used PEOU, PU, and subjective norms as the direct, positive determinants of intention (see Figure 3). Drawing upon concepts from the TAM3 [43], we also modelled items assessing (a) the perceived enjoyment of using the chargers and (b) eight ‘charging concerns’ as indirect predictors of intention. In the TAM3, concepts such as enjoyment and playfulness are modeled as predictors of the PEOU of information technology. Moreover, affect and related constructs (e.g., perceived enjoyment) have been previously modeled as antecedents of PEOU in the context of intentions to use autonomous and electric vehicles [50] and innovative EV charging [54]. The concern items selected for inclusion related to the concepts of ‘output quality’ and the self-efficacy, control, and objective usability beliefs about FEVER (henceforth ‘control beliefs/facilitating conditions’). The three output quality concerns related to the charge time, sufficiency of charge, and the limited availability of charge. The charging time and charge sufficiency are noted concerns with EV charging [34,35,36], while the limited availability of charge is something that could affect an off-grid system like FEVER. The control beliefs/facilitating conditions concerns are related to the cost of charging, availability of chargers, whether the chargers would be working, whether technical support would be on hand, and whether there would be a need to reserve the chargers in advance. These are not only recognised concerns that EV users have with charging infrastructure [34,35,36], but are also pertinent to FEVER, being that it presents a novel EV charging solution. Consistent with the TAM3, the ‘output quality’ concerns were modelled as negative predictors of PU, while the control beliefs/facilitating conditions were modelled as negative predictors of PEOU. In accordance with the TAM, we also modelled PEOU and subjective norms as positive mediated predictors of intention via PU. For reasons of parsimony, we did not assess job relevance, image, or voluntariness in this study. We also excluded attitude from the model, as use of the chargers would not be mandated.
Hypotheses regarding RQ2 were derived from the relationships outlined in our context-specific version of the TAM (Figure 3). In short, it was predicted that (a) the control belief/facilitating condition concerns would negatively relate to PEOU; (b) the output quality concerns would negatively relate to PU; (c) perceived enjoyment would positively relate to PEOU; (d) PEOU would positively relate to PU and intentions; (e) subjective norms would positively relate to PU and use intentions; and (f) PU would positively relate to intentions.

2. Materials and Methods

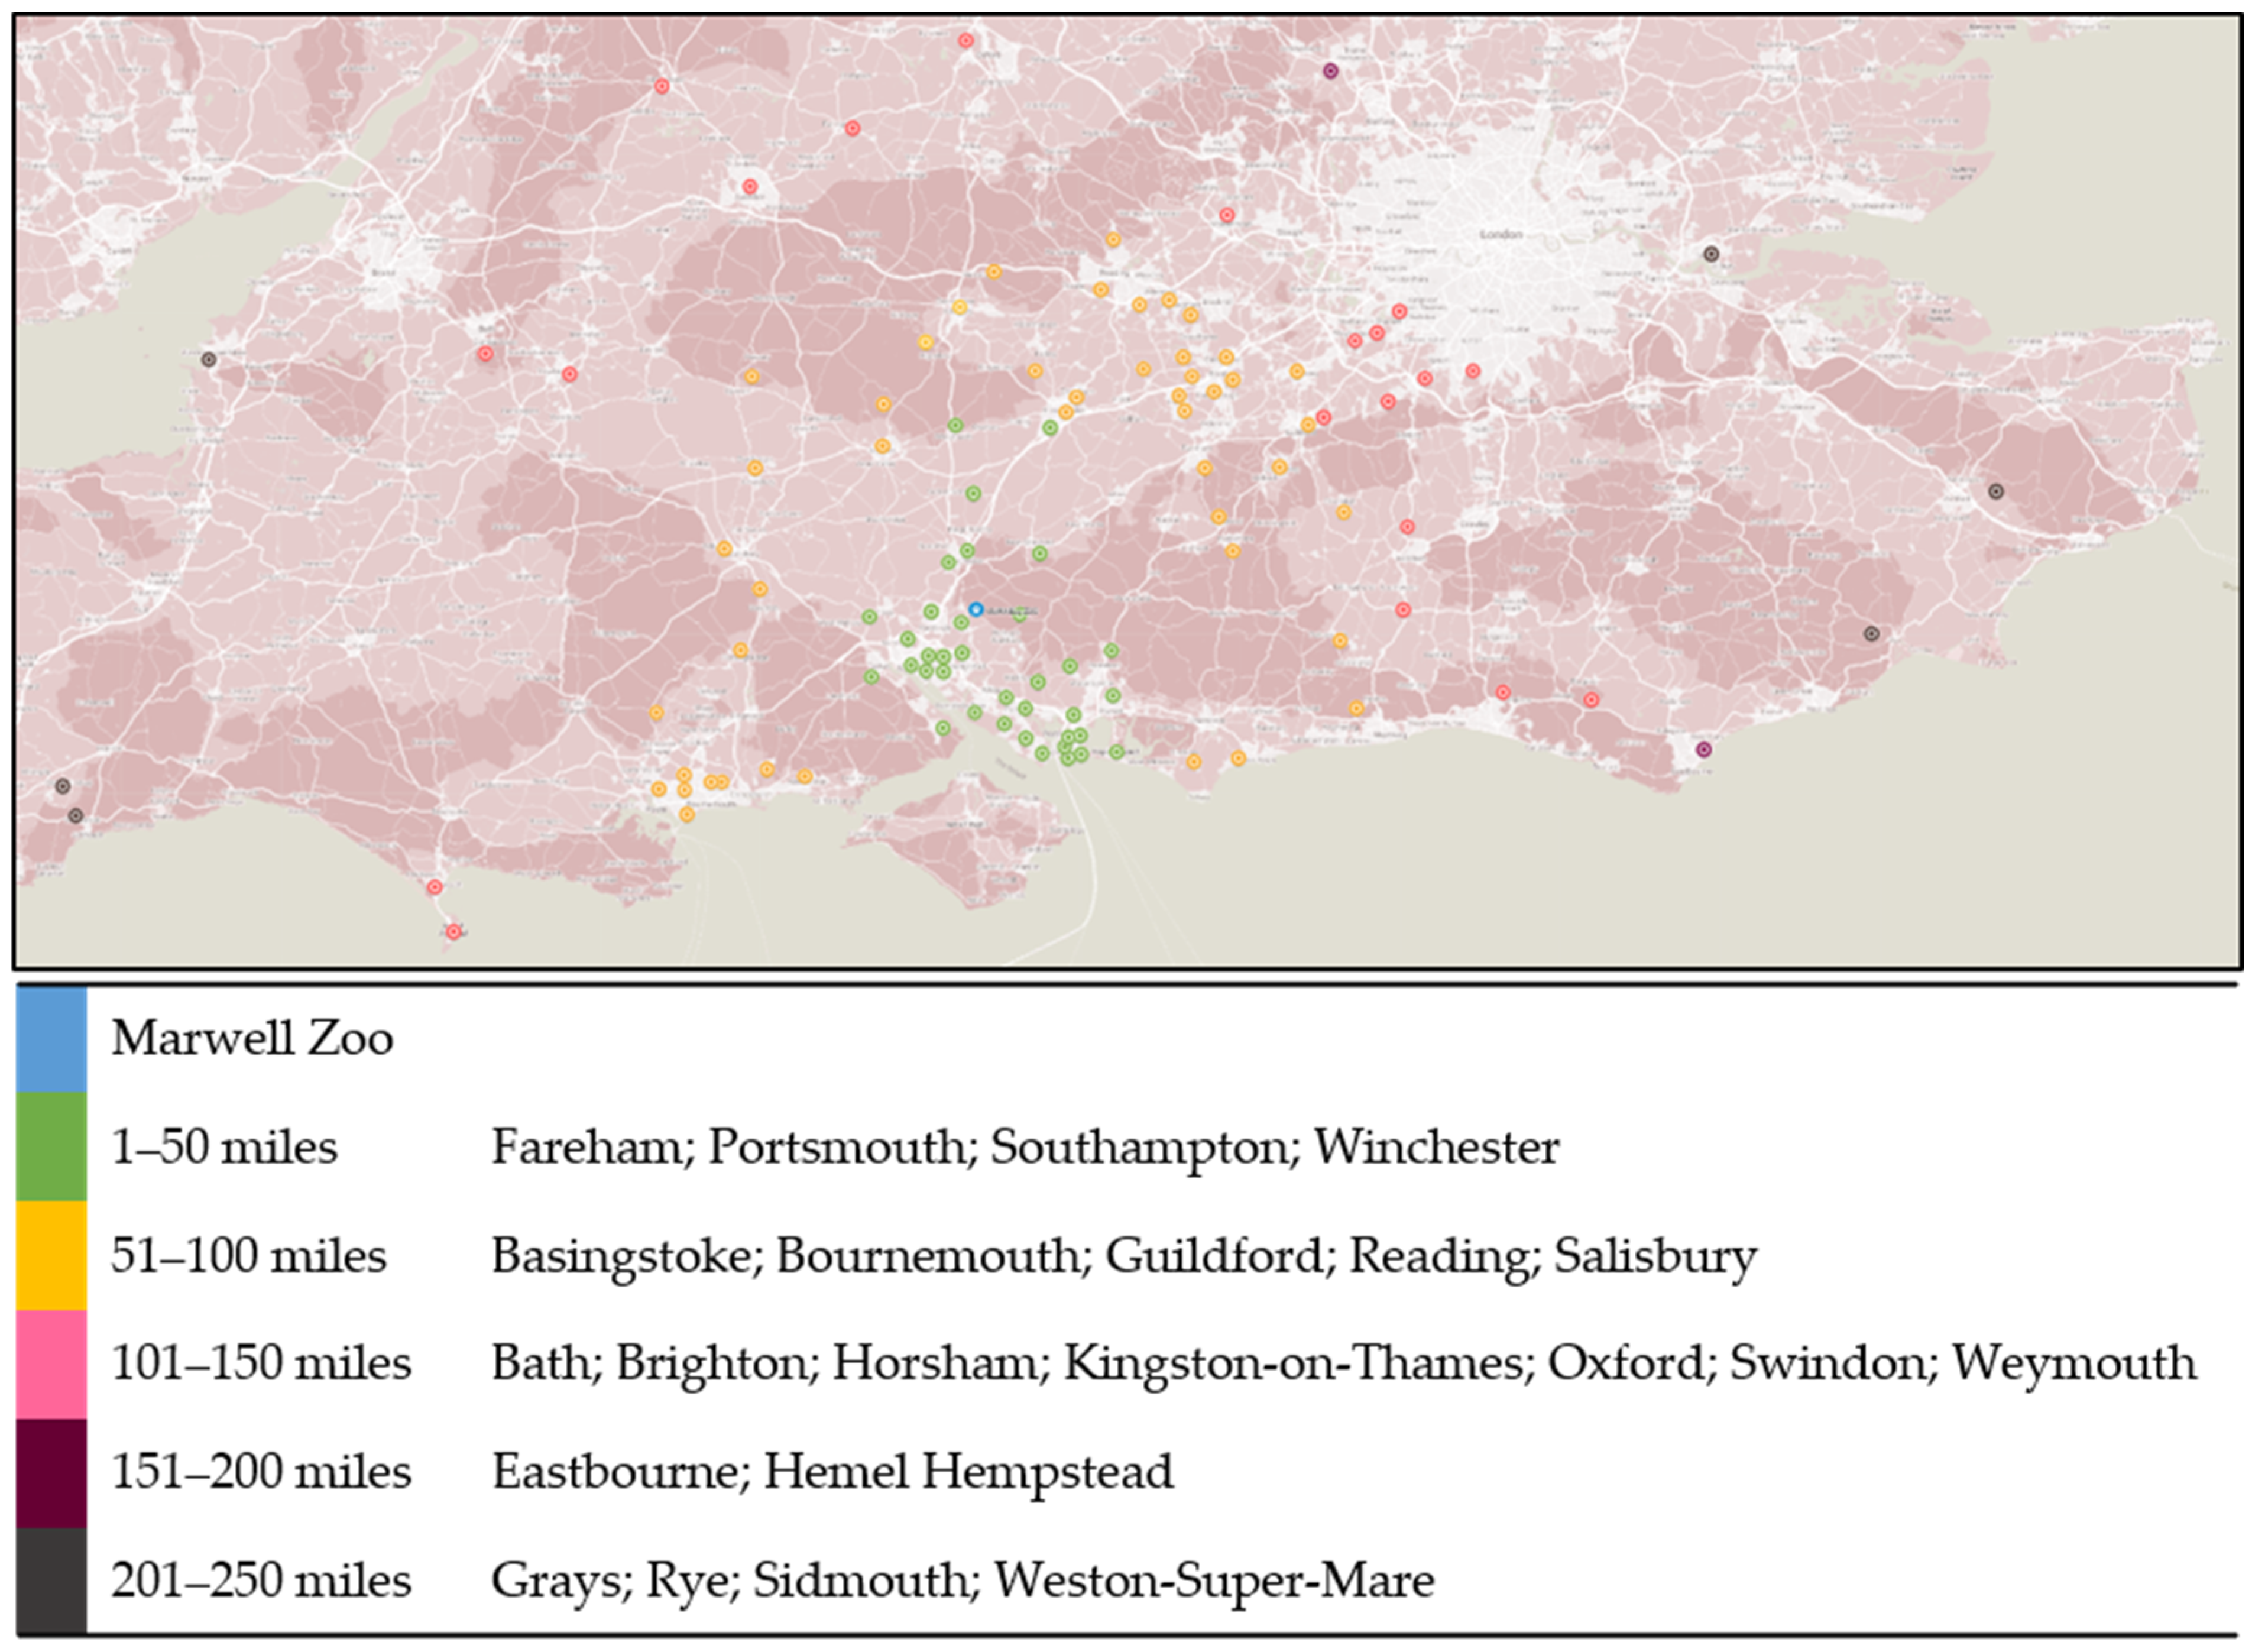
2.1. Participants and Recruitment

Favourable ethical opinion for conducting the study was gained from the University of Portsmouth, Science and Health Faculty Ethics Committee (SHFEC 2023-037). The QBS was administered face-to-face by one of the authors (N.C.) to a convenience sample of people visiting Marwell Zoo across a 3-day period in late April 2023. An online version of the same QBS was completed by a self-selected sample who responded to an invitation received via an online mailing list curated by Marwell Zoo. Online data collection occurred in May 2023. The participants were required to be aged 18+ years and needed to have visited Marwell Zoo in the past 12 months and/or intend to visit the zoo in the next couple of months. There was no requirement for people to own or lease a full or hybrid EV in order to participate. Other than this, there were no further inclusion or exclusion criteria. The key demographics, EV ownership, and travel distance characteristics for the onsite (n = 63) and online (n = 158) participants, as well as the total sample (n = 221) are available in Table 1 and Figure 4.

2.2. Onsite Data Collection

A researcher was located onsite at Marwell Zoo during the park’s opening hours (10 am–5 pm) for 3 days at the end of April (Friday–Sunday). Visitors were asked if they wished to participate in a short survey to assess their opinions about the possibility of EV chargers being installed at Marwell Zoo. Those showing an interest were taken through the ethics and data-management statement and notified of the optional prize draw incentive. The prize was a chance to win one of three sets of vouchers for future entry to Marwell Zoo worth around GBP 50 (c. USD 65). Prospective participants had to verbally consent before the QBS was administered. Visitors were also made aware of the option to do an online version of the survey (see Appendix A for survey introduction and FEVER details).

2.3. Online Data Collection

An advertisement with a link to an online version of the QBS (hosted on Qualtrics) was distributed via email newsletter to a contact list held by Marwell Zoo. Distribution occurred at the end of May 2023. The QBS remained open for around one week. Informed consent was gained from all the participants after they read brief details about the purpose of the QBS, an ethics and data-management statement, and the prize draw incentive.

2.4. Questionnaire-Based Survey (QBS)

The QBS was designed to be administered during a short (2–5 min) face-to-face interaction. The online version of the QBS was identical to the face-to-face version, other than the participants received an additional question to gauge when they had visited Marwell Zoo and/or when they intended to visit the zoo. As some online participants were yet to visit the zoo, the wording of items in this version of the QBS were also revised to reflect both past and future travel intentions. Outlined below are details of the core dependent and independent measures from the QBS used in the analysis. The full wording of the questions and the response options available to the participants can be found in Appendix A. The dataset associated with the QBS can be made available to readers upon reasonable request to the corresponding author.

2.4.1. Demographics and EV Ownership

The participants provided their age and gender. They were also asked to provide the first few digits of the postcode that they had travelled from (or would likely travel from) to the zoo. This information was acquired to estimate the approximate distance travelled while maintaining participant anonymity. Electric vehicle ownership was assessed by asking if the participants owned or leased an EV. Participants answering ‘No’ to the question of EV ownership were then asked whether they had considered purchasing or leasing an EV. The participants were also invited to register how they had travelled (or intended to travel) to the zoo.

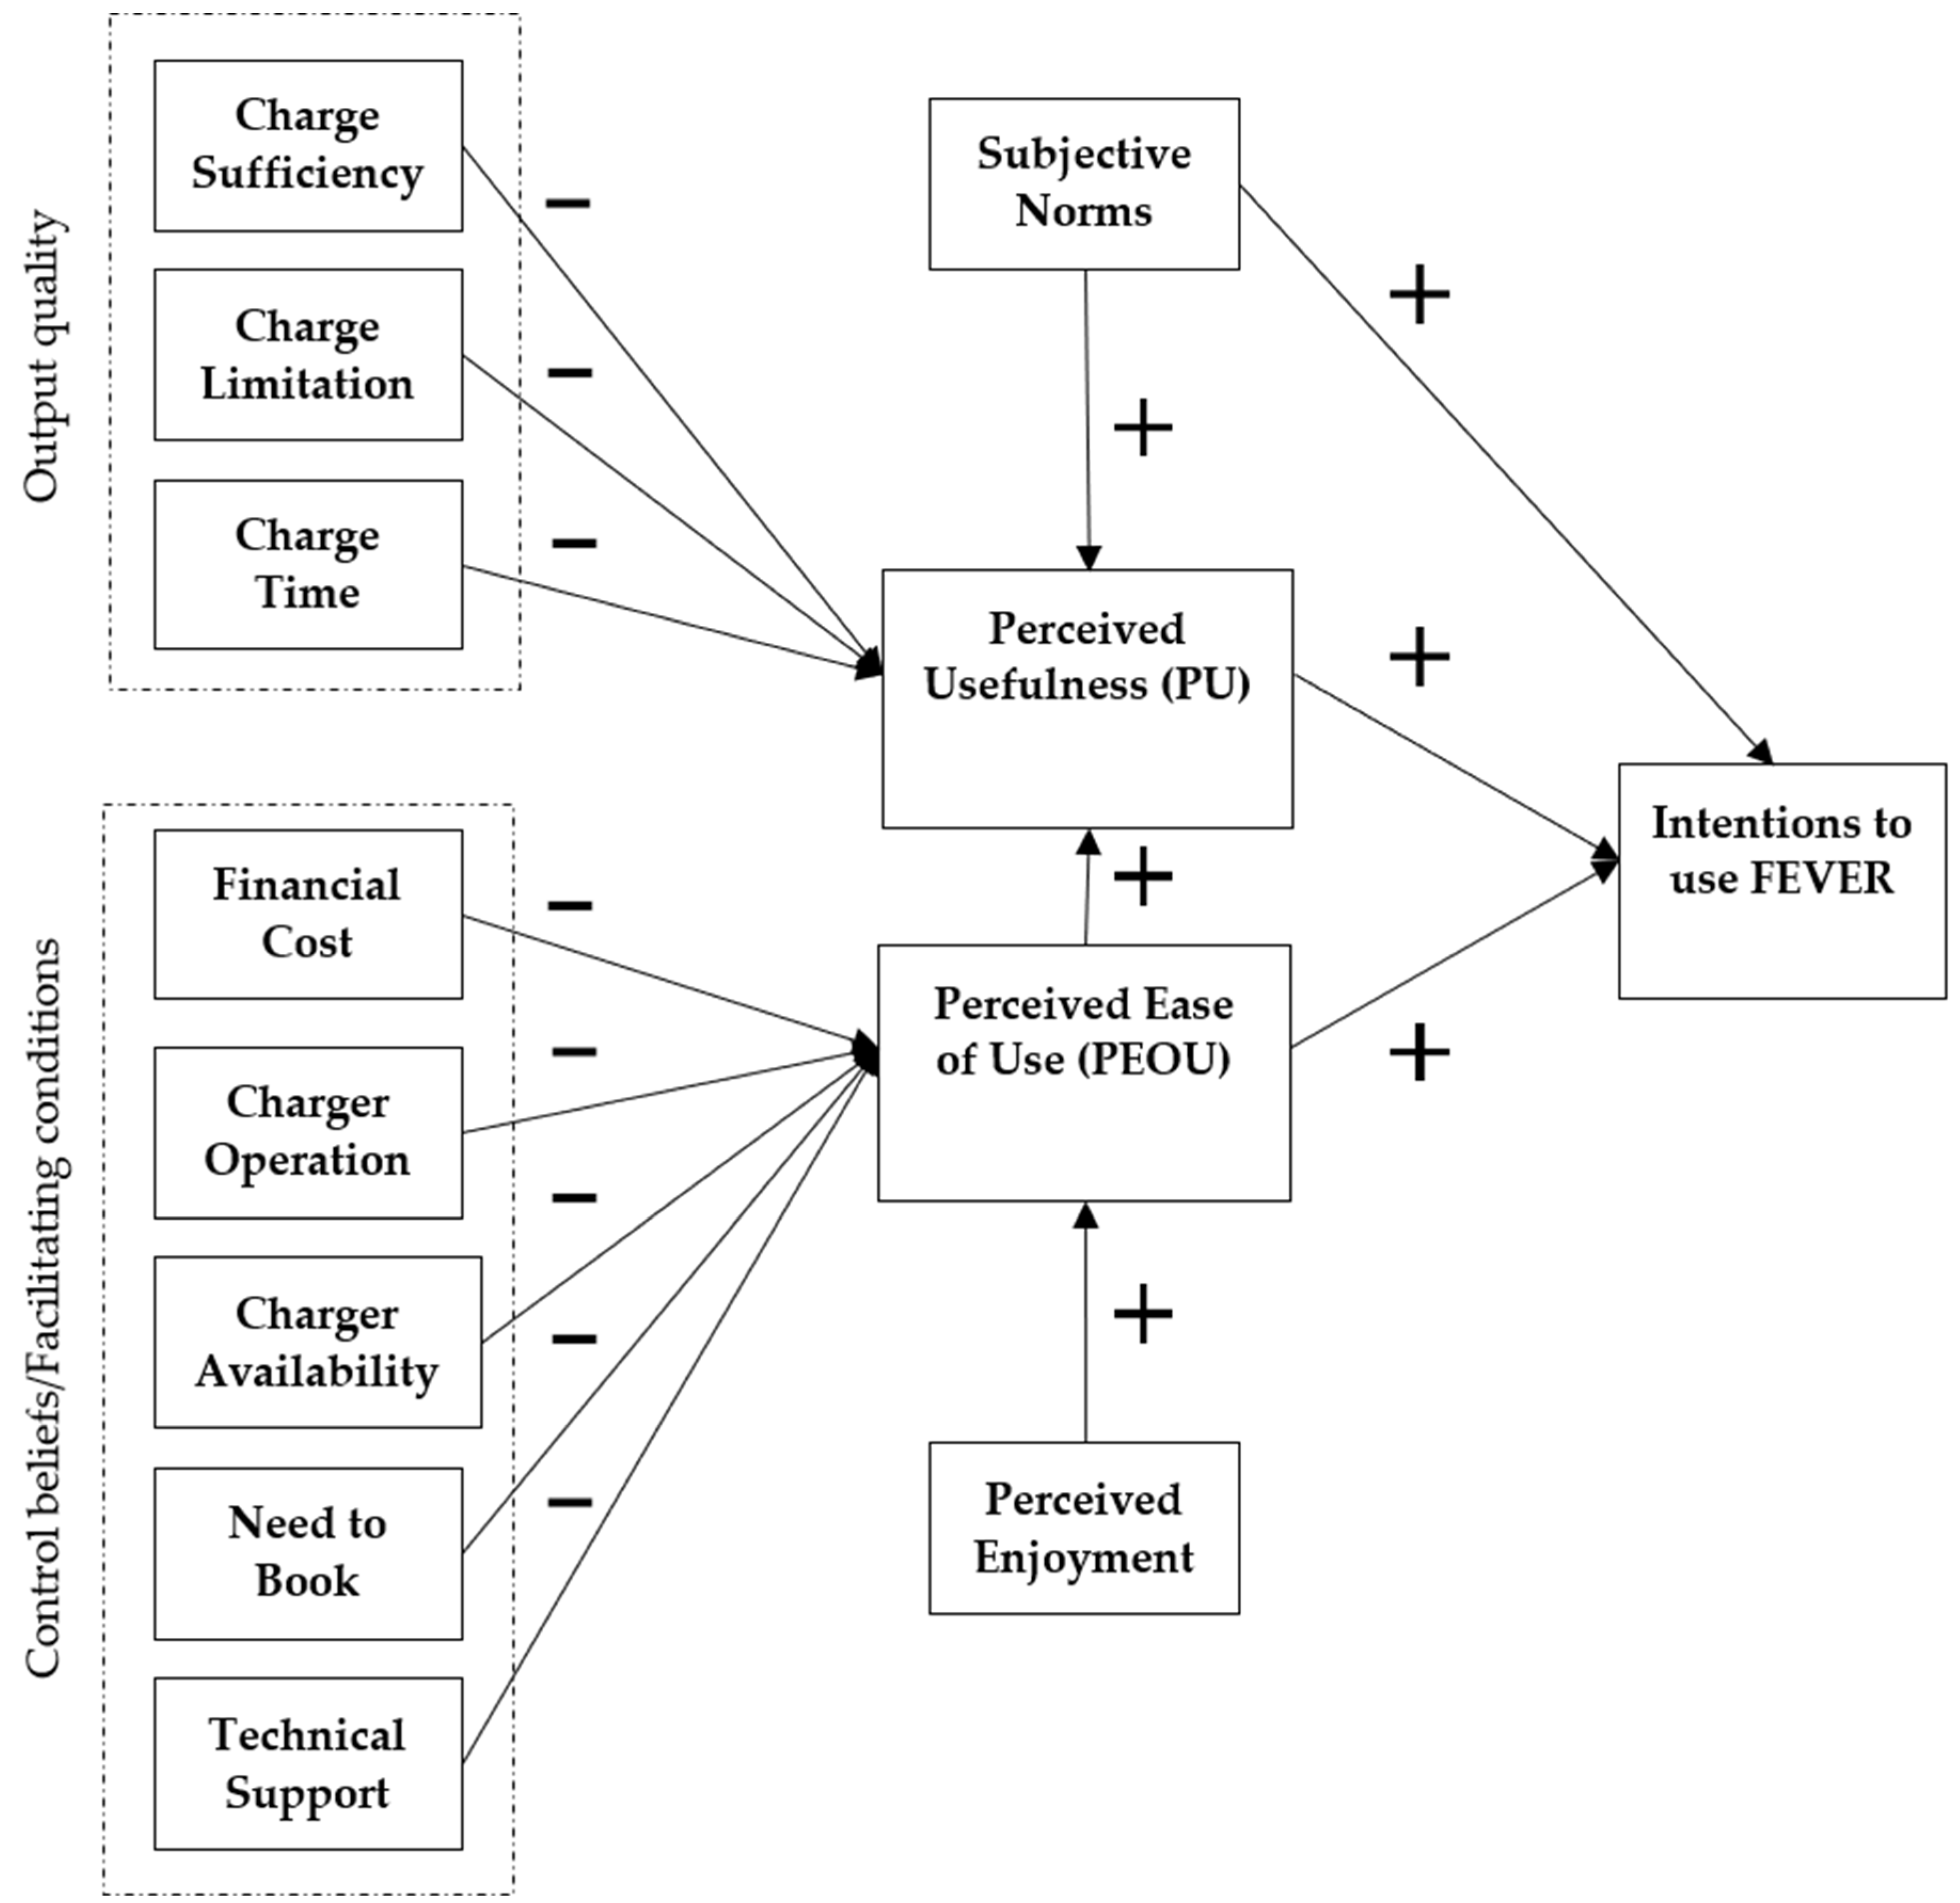
2.4.2. Context-Specific Technology Acceptance Model (TAM)

The participants were asked to consider their opinions about using the proposed FEVER EV chargers (‘For me, using the EV chargers would be…’) by responding to 3 items designed to assess the core attributes of the TAM: intention (‘I would intend to use them’); perceived usefulness (‘useful’); and perceived ease of use (‘easy’). Two items designed to measure the perceived subjective norms (‘expected of me by others’) and the hedonic associations (‘enjoyable/fun’) associated with use of the chargers were also included.
Eight items were included to assess concerns with EV charging (‘I would be concerned that the EV chargers…’) relating to anticipated control beliefs/facilitating conditions and perceptions of output quality: financial cost (‘would be costly to use’); charger availability (‘would be blocked by other users’); charger operation (‘would be broken/out of order’); lack of technical support (‘would be no technical support if something went wrong’); need to book (‘might need to be booked/reserved’); charge time (‘charging would take a long time’); charge sufficiency (‘would not deliver sufficient charge for my onward journey); and charge limitation (‘could run out of charge’).

2.4.3. Willingness to Pay

Two questions assessed the participants’ willingness to pay for charging at the zoo. The participants first indicated whether they felt they should pay and, if so, who should benefit from the revenue. The second question asked people how much they would be willing to pay (per kWh) if there was a cost associated with charging. To aid the understandability of this question, the participants were informed the approximate cost of public charging in the UK was 65p per kWh. The decision to ask the questions in this way relates to the specifics of the study context. While public charging infrastructure often has a specified pricing tariff (reflecting installation, operation, and maintenance costs), the cost of the FEVER chargers would be met (at least initially) by the project and thus charging could be offered for free. This allowed us the freedom to explore whether people would be happy to be charged for using FEVER and, if so, what people would be willing to pay.

2.4.4. Willingness to Vacate

The participants were asked how (un)willing they would be to return to their car after it had charged to free up the charger for others to use. There was an option to provide a written explanation for the decision.

2.5. Procedure

Upon agreeing to participate, the respondents first answered the demographics and EV ownership questions. The participants were then provided with a brief outline of the FEVER concept (see Appendix A). This noted that (a) the FEVER project was developing a new, grid-independent, EV charging technology; (b) that the chargers could be deployed in places with a poor grid connection and/or where creating a connection would be financial costly (e.g., rural settings); and (c) that the chargers would be renewably powered via a mix of wind and solar, most likely backed up with large batteries. It was also noted that a mobile app would be used to communicate with EV owners about the availability of chargers, the cost of charging, and when their car battery was sufficiently charged.
Following this, people who currently own or lease an EV were asked to imagine they were driving their vehicle to Marwell Zoo and had the option to use the FEVER charge points. People who did not own/lease an EV were invited to imagine that they were driving to Marwell Zoo in an EV and had the option to use the FEVER charge point. Vignettes are a common and widely used means of eliciting stated preferences within social scientific studies and have been shown to have a high predictive validity in different settings (e.g., [57,58]). Following exposure to this information, the participants completed the TAM-related questions and the willingness-to-pay and willingness-to-vacate questions. The QBS ended with a short thank you statement and details about how to enter the optional prize draw.

3. Results

3.1. EV Ownership and Use

Just under half the participants either owned an EV or had provisionally or seriously planned to purchase or lease an EV in the next 1–2 years. This attests to the clear relevance of the study for Marwell Zoo and for many of their current and prospective visitors (see Table 1). The remaining participants either stated not having the intention to purchase an EV or stated holding ‘other’ intentions. Participants responding ‘other’ mostly listed the high costs of purchasing an EV (n = 13), and range anxiety or concerns over the availability of charging infrastructure (n = 5). Other reasons mentioned included the impracticalities of owning an EV, the fact the respondent did not drive, and that it was not the right time.
Most participants who owned an EV had used/intended to use the EV to travel to Marwell Zoo (18.1%). A total of n = 217 participants entered a viable origin postcode. All but 6 of these participants (n = 211) had travelled/intended to travel from within a 250-mile roundtrip radius of the site. Of these, 85.8% (n = 181) travelled from distances equating to a sub-100-mile roundtrip, which falls well within the battery range of modern EVs (see Table 1 and Figure 4).
Taken together, these findings indicate three things: (1) our study sample had an overrepresentation of EV users (c. 21%) relative to the current UK average (c. 2–3%). This is to be expected given the self-selected nature of the sample and should be considered when drawing inferences from these data. (2) There is a significant and growing number of visitors that could benefit from the provision of charging infrastructure. (3) Use of the chargers would likely be optional for most EV users given the short roundtrip distances that most visitors make.

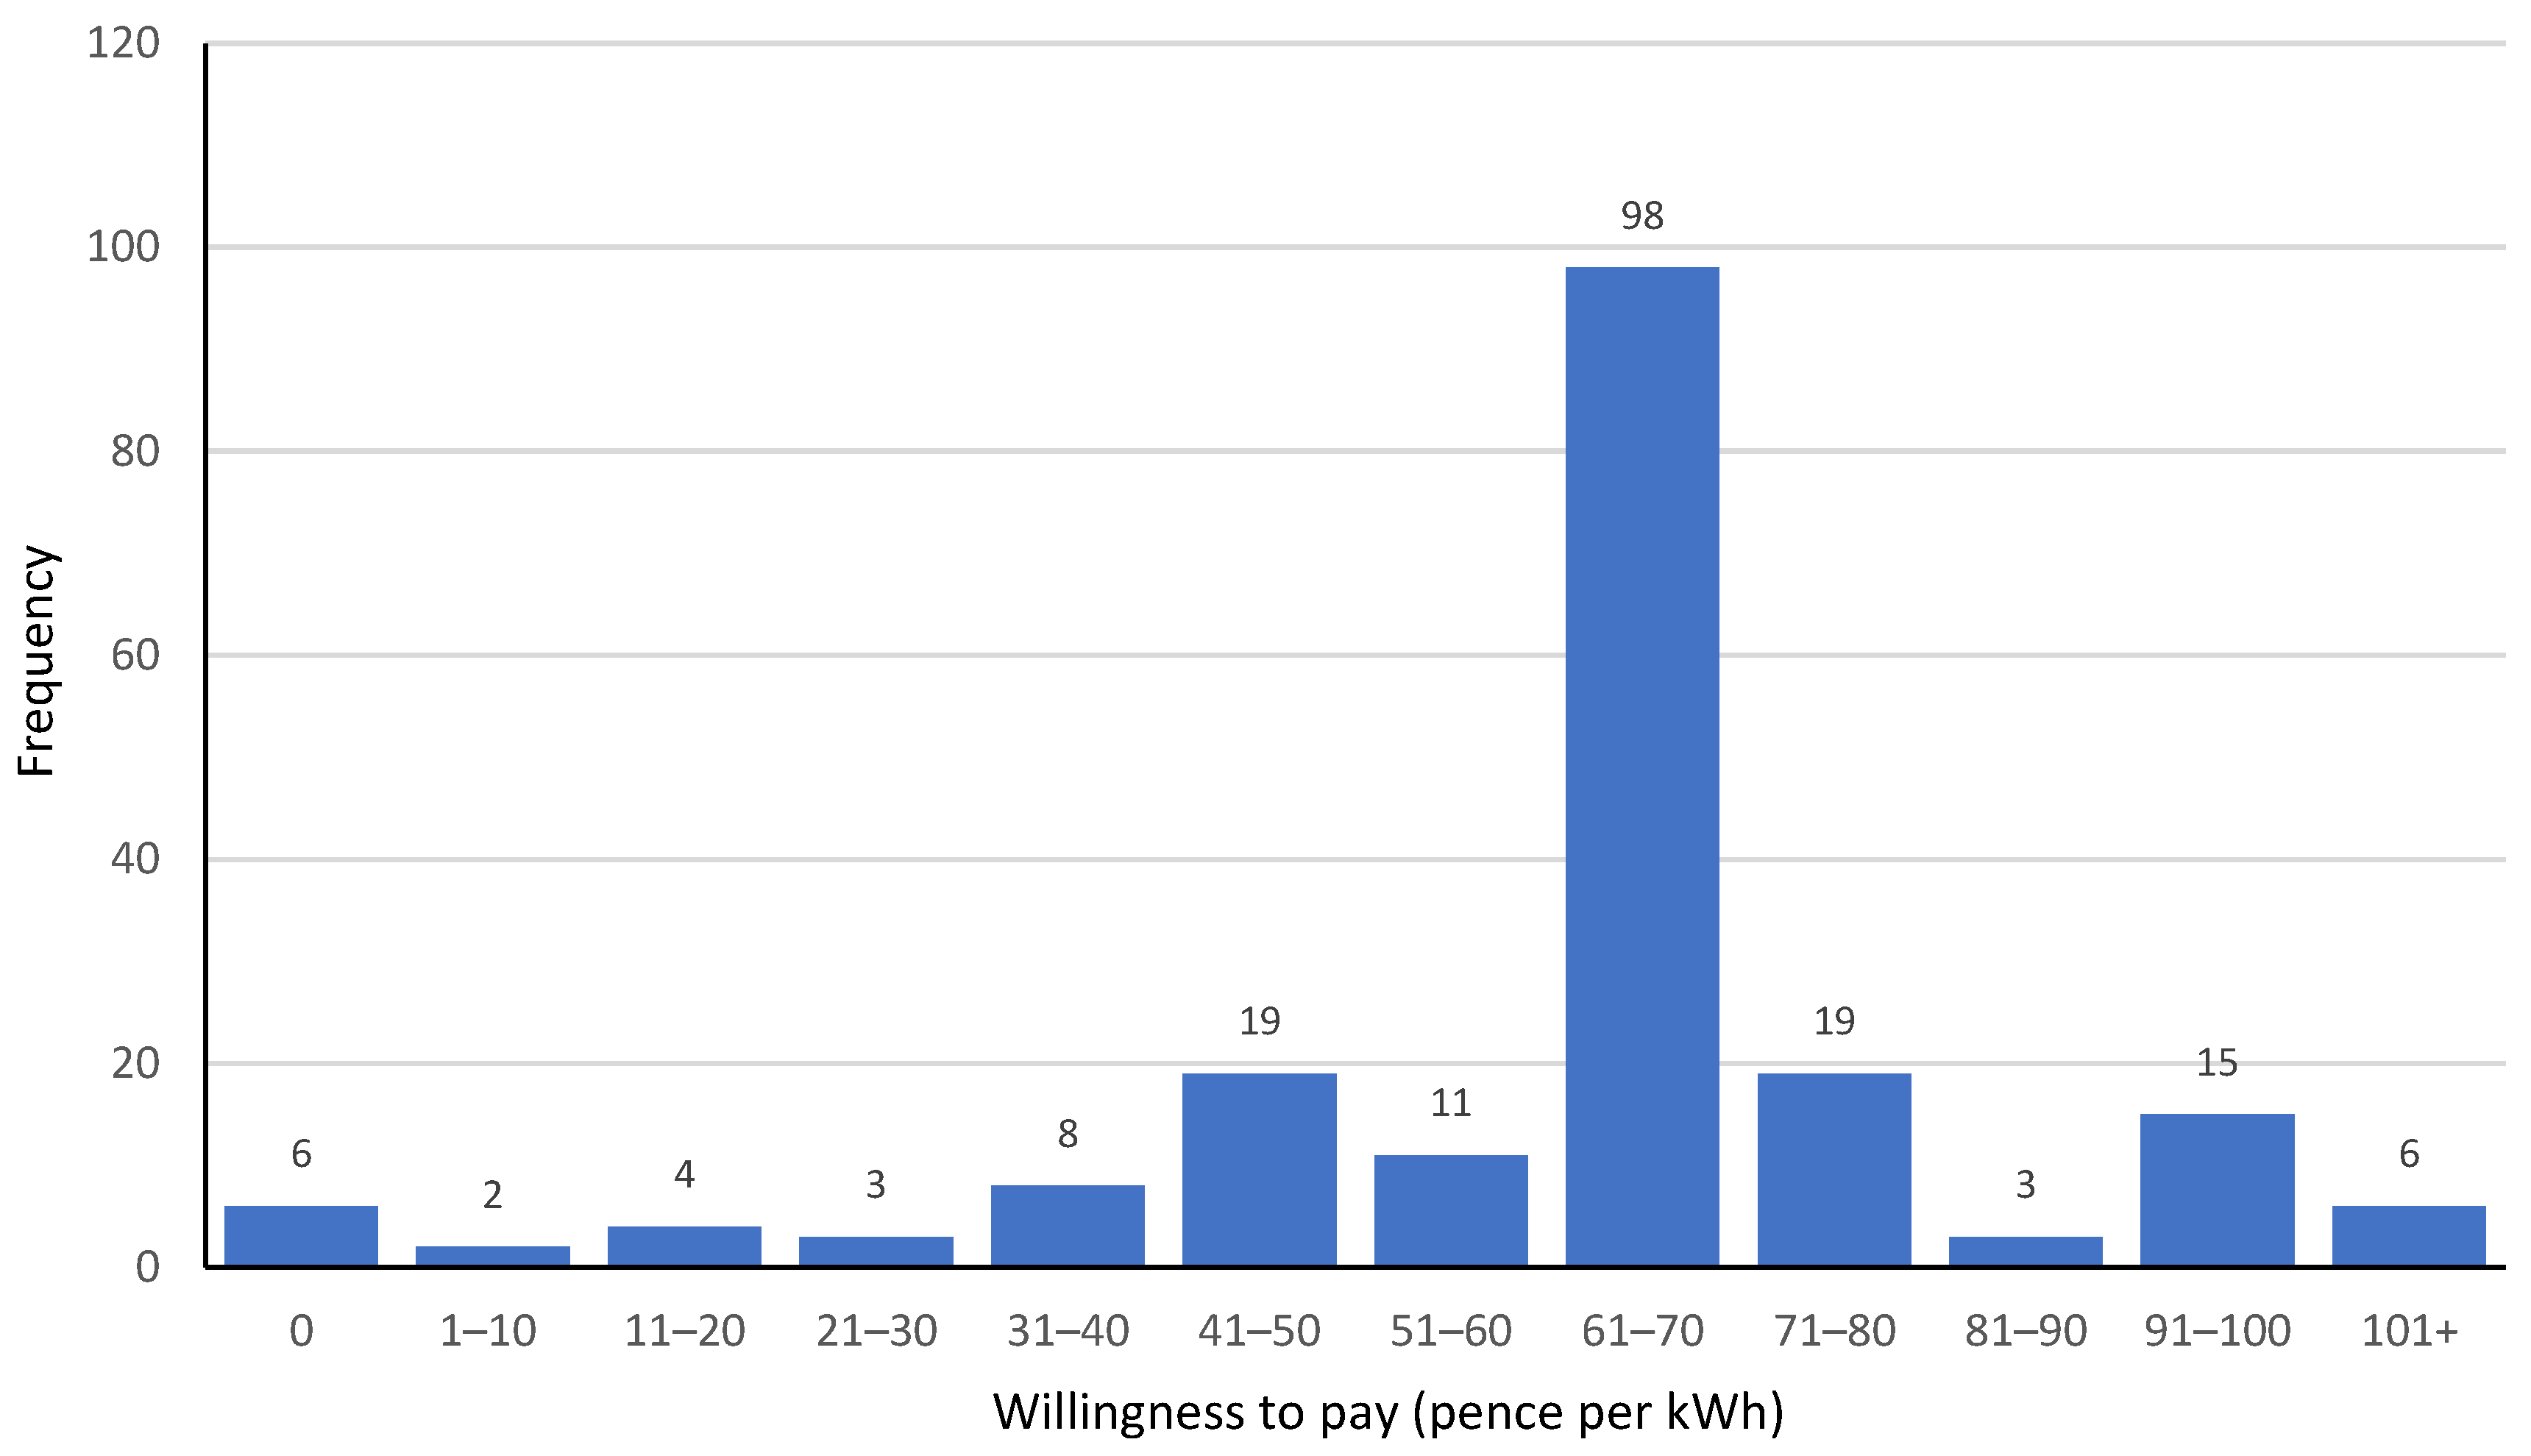
3.2. Willingness to Pay

Most participants believed that there should be some cost associated with charging. Only n = 27 responding to the general willingness-to-pay question suggested that charging should be free. The preference was for revenue to benefit the zoo (n = 187) rather than the suppliers of the technology (n = 38). Four participants did not respond to this question.
In terms of the free-response question regarding the participants’ willingness-to-pay per kWh of charging, the modal price per kWh was between 61 and 70 pence (n = 98), which is inclusive of the 65p anchor point provided to the participants (see Figure 5). There were other smaller peaks around categories including logical price points, i.e., 50p, 75p, 100p. The 101+ (n = 6) category included some very large values (e.g., 500–600p). Six participants answering this question indicated they did not wish to pay and n = 27 did not respond to this question.

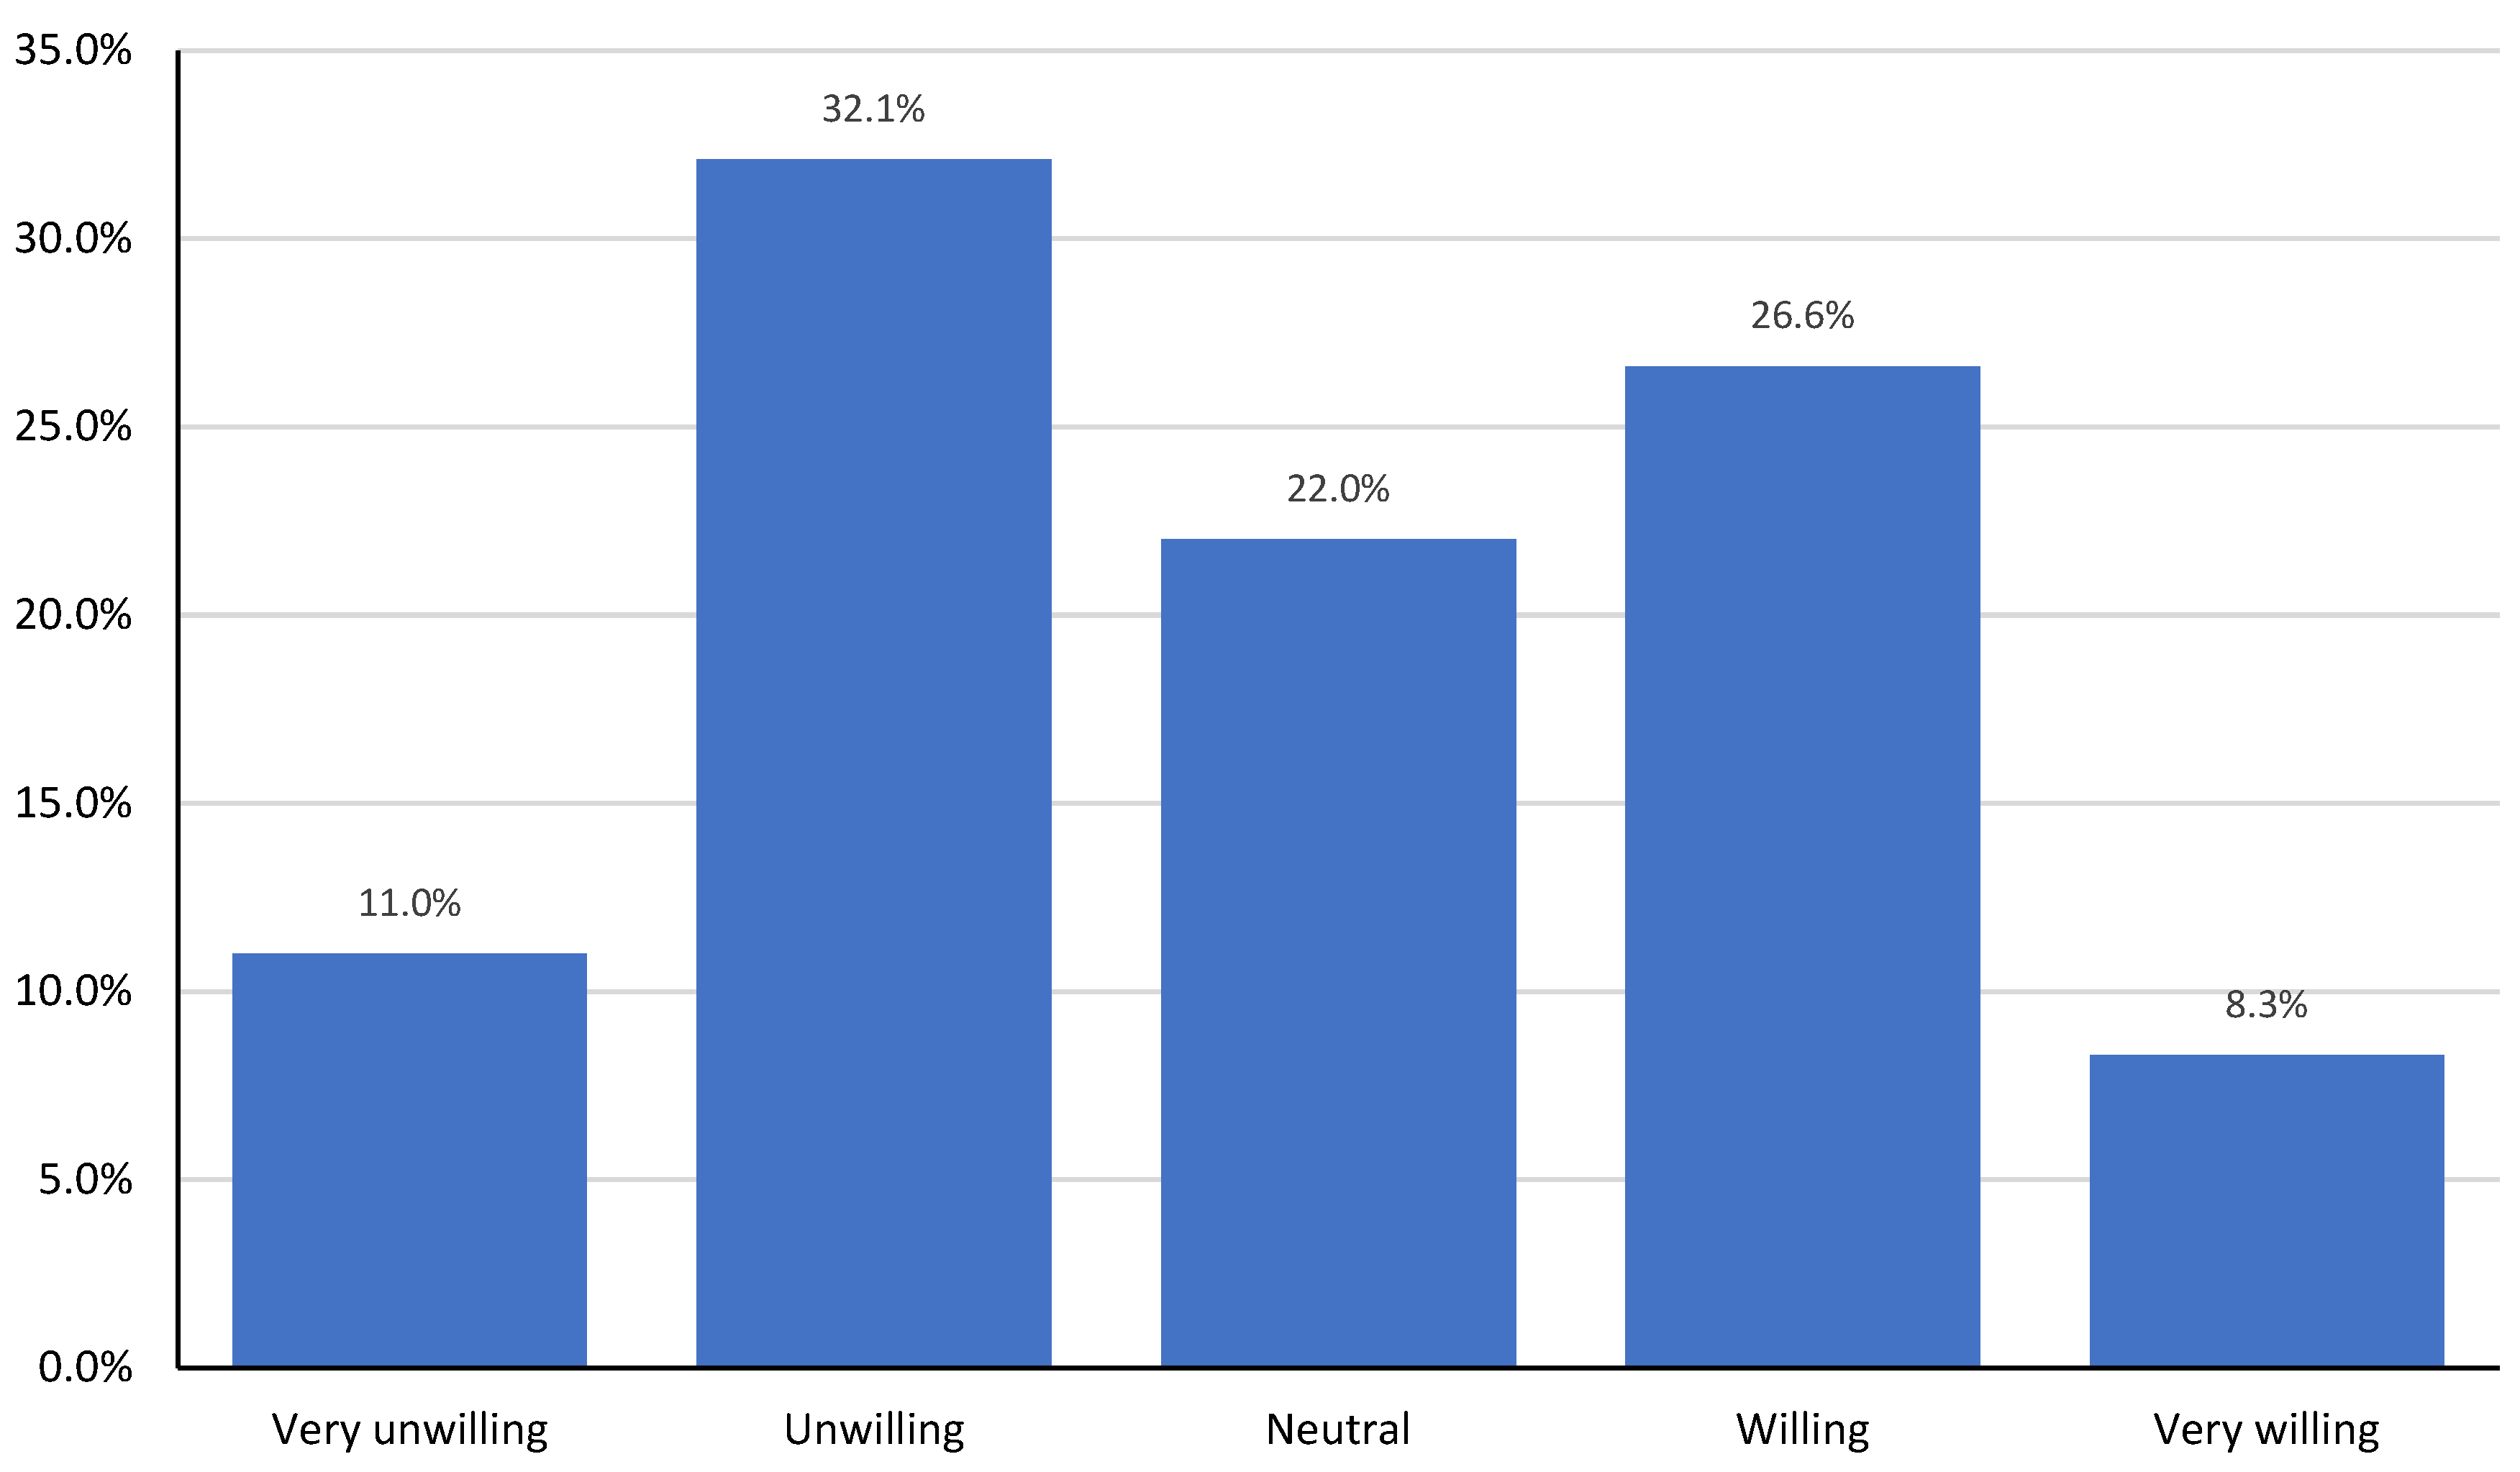
3.3. Willingness to Vacate

The participants were split in terms of their willingness to return to their car to vacate the chargers once their car had been sufficiently charged (see Figure 6). The biggest proportion (43.1%) were negatively disposed to doing so, although a significant minority were more positive about this prospect (34.9%). Around one-fifth of participants (22%) were neutral on the issue of vacating the chargers.
A total of n = 62 participants provided an explanation for their response to this question. Among those who were unwilling, the primary stated reasons were (1) a reluctance to leave the zoo, as they were paying for their visit and wished to maximise their time on-site; and (2) the hassle, disruption, or inconvenience that vacating the charger could cause, particularly among those visiting with young children or where people had mobility issues (e.g., wheelchair users). This second point was compounded by the anticipated distances that would need to be negotiated to exit and re-enter the park. More minor reasons included general laziness, difficulties in identifying subsequent parking, and a willingness to vacate only in the event of an emergency.
For those with a neutral position, the reasons provided were mostly indicative of a caveated willingness to vacate the chargers. The participants suggested that it would ‘depend’ on the level of anticipated disruption, how long it would take, where they were in the park at the time, and who they were with. The presence and demands of having young children were again perceived as a barrier to exiting the park.
Those expressing a willingness to vacate the chargers mostly identified principles of fairness or the expectations of others as the rationale for their response. Some stated that it would be helpful and/or fair to others to vacate the chargers after use. Others indicated that it was a ‘reasonable ask’ or something that might be expected of them. It was noteworthy that these participants also tended to have a greater sense of agency, seeing the walk to and from the chargers to be fairly easy or unproblematic. This was not exclusively the case though, with one participant noting that the task would be disruptive but that they did not mind making the effort. Some of those expressing a general willingness to vacate still noted that this would be weather- and/or family-dependent.

3.4. Perceptions of the FEVER Charging Concept

One-sample t-tests were run on the TAM variables to gauge whether the mean responses deviated significantly from the scale mid-point (3.0) (see Table 2). The participants agreed (large effect size) that they would intend to use the chargers, and that the chargers would be useful (PU) and easy to use (PEOU). The participants also agreed (medium effect size) that there would be normative pressure to use the chargers. There was also a tendency towards believing that use of the chargers would be fun/enjoyable (small effect size).
The mean responses to the items assessing the facilitating conditions/control beliefs were also significant. Of greatest concern was that the chargers would be blocked by other users (large effect size). There was moderate concern about the need to reserve the chargers, the lack of technical support for using the chargers, the chargers not working, and the cost of using the chargers (small–medium effect sizes).
The mean responses to the three output quality items did not deviate significantly from the scale mid-point. This suggested that the participants were ‘ambivalent’ or ‘undecided’ about their concerns over the length of time needed to charge, whether the chargers would deliver sufficient charge for their onward journey, or whether the system would run out of charge. Care should be taken when making inferences from these findings, as use of the mid-point of the scale could be taken as a genuine position of ambivalence (i.e., the participants were actually ambivalent toward these issues) or as an indication that people did not know how to respond and so opted for the mid-point of the scale.

3.5. Modelling of Context-Specific TAM

To examine the context-specific TAM, a path analysis was conducted using Jamovi 2.3.28.0 with the Pathj 0.9.0 package, using the unweighted least squares (ULS) robust estimator, given the ordinal variables in our dataset. The model overall showed a good fit (CFI = 0.967, TLI = 0.943, SRMR = 0.042, RMSEA = 0.048, χ2(19) = 28.40), allowing us to study the structural regressions within the model. For tables detailing the direct and indirect effects, see Appendix B.
The model accounted for 58% of the variance in the participants’ intentions to use the FEVER chargers (see Figure 7). Consistent with the predictions of the core TAM [13], perceived usefulness (PU) was a direct positive predictor of intention. Perceived ease of use (PEOU) was also a direct positive predictor of intention, although PEOU shared a stronger positive relationship with PU. These findings confirm that (a) the easier people perceived use of the chargers to be and (b) the more useful people saw the chargers to be, the greater their use intentions were. In addition, the easier people saw use of the chargers to be, the more useful they perceived the chargers to be.
The model accounted for 47% of the variance in PU. In addition to PEOU, subjective norms were a positive predictor of PU; however, the anticipated relationship between subjective norms and intentions was not significant. None of the output quality concerns within the model were retained as significant predictors of PU.
The model accounted for 29% of the variance in PEOU. As predicted, the perceived fun/enjoyment associated with using the chargers was a positive predictor of PEOU. However, other than concerns over the availability of the chargers, which showed a marginally significant positive relationship with PEOU (p = 0.050), none of the facilitating condition/control beliefs were retained as predictors of PEOU.

4. Discussion

The aims of this study were to (1) investigate the public acceptability of the FEVER electric vehicle charging concept, and (2) test a context-specific version of the TAM as a model of people’s future intentions to use the technology. In the discussion, we explore each of these aspects in turn, before considering some of the limitations and future directions for research in this field.

4.1. Public Acceptability of the FEVER Charging Concept

Overall, perceptions of the FEVER charging concept were favourable, with people tending to agree that they would use the chargers, and that they would be useful, easy, and fun to use. There was also general agreement that there would be normative pressures to utilise the chargers. The anticipated unavailability and need to book the chargers were a primary concern, with the lack of technical support, the cost of using the chargers, and the prospect that the chargers would be out of order being secondary concerns.
The fact that charger availability was the main concern registered by the participants is consistent with other research highlighting the importance of the availability of charging infrastructure to the uptake of EVs [35]. Charger availability has also been identified as a growing concern for EV users, particularly given the expansion in EV ownership and use [59,60]. This concern may have been amplified in the current study due the ‘destination charging’ nature of Marwell Zoo and the (realistic) belief that chargers might be blocked by other EV users visiting the park.
The participants tended to be ambivalent or neutral in terms of their concerns about ‘output quality’. The relative lack of concern over charge duration, while deviating from the findings of some other studies [29,36], can perhaps be explained by the ‘destination charging’ nature of Marwell Zoo and the fact that participants anticipated being ‘parked-up’ for some time. The participants’ ambivalence over the other two concerns (i.e., that chargers could run out of charge or not provide sufficient charge) is noteworthy, particularly given that they are more specific to the FEVER concept.
There are two interpretations for these findings: (1) that participants were genuinely ambivalent about these issues, and (2) that the concept of the chargers running out of charge and/or failing to supply sufficient charge was deemed to be so unusual that people opted for the scale mid-point to indicate their uncertainty. While the first explanation cannot be ruled out, we argue that the latter explanation holds credibility, given that the output quality issues assessed in this QBS are not concerns that are typically associated with grid-connected charging infrastructure. Moreover, while the participants were not required to respond to every item in the QBS, the fact we did not include a ‘don’t know’ response option might have led people to favour use of the mid-point (see limitations and future directions). We argue that a fuller investigation as to the authenticity and strength of this ambivalence should be a focus of future research.
The majority of the participants were willing to pay for the charging and showed a preference for revenue to be shared with Marwell Zoo. This makes sense, given the likely belief that any income would be used to support or develop the zoo, its staff, or animals. Most people were willing to pay the stated national average cost for use of the chargers (around 65p per kWh). This preference likely relates to the anchoring provided within the study and was arguably strengthened by the number of participants who were not EV-users (and thus likely to be less familiar with EV charging costs).
One might hypothesise that the upper limit that could be charged (per kWh) for the use of FEVER could be higher than that for regular grid-connect charging infrastructure. There is evidence that some EV users, particularly those more environmentally aware, are willing to pay a small surcharge for charging derived from a greater proportion of renewables [35]. This might be further augmented in the current context by the host of the chargers being a zoo with clear ties to wildlife and environmental conservation.
Taken together, these findings can tentatively be taken to illustrate that a majority of people are willing to pay the advertised ‘going rate’ for the use of FEVER. Crucially, however, there are residual questions about where the ceiling for such willingness might lie, particularly in the context of different price–tariff anchoring and/or where the stated beneficiary of any revenue is not an attraction like a zoo.

4.2. Context-Specific TAM and Implications for FEVER

To this point, we have considered the participants’ general perceptions of the FEVER technology and their willingness to pay to use it. Our application of a context-specific version of the TAM, however, provides additional insight into factors likely to shape people’s intentions to use the chargers once in situ. In turn, this provides guidance on how use of the chargers might be promoted or encouraged when they are constructed.
The significant positive relationships between perceived usefulness (PU) and perceived ease of use (PEOU) and intentions were anticipated as core aspects of the TAM [13]. They confirm that (a) the more useful people anticipate the use of the FEVER chargers to be and (b) the easier to use they are believed to be, the greater people’s intentions will be to use them. As evaluations of PU and PEOU and use intentions were favourable, this bodes well for the likelihood that people would actually seek to use the chargers if installed at Marwell Zoo. The results also speak to the need to maximise the actual utility and ease of use of the chargers if and when they are constructed. Considering the interoperability of chargers, the user-friendliness of payment mechanisms and other factors known to affect user attitudes towards charging will be important in this regard [36].
Comparable to the work of Deumlich et al. [52], our context-specific TAM, while confirming the core assumptions of the original model, was only partially supported. For example, seven out of the eight ‘concern’ items were not retained within the model, the exception being the availability of chargers. We sense that this could, again, be a product of the participants’ ambivalence or uncertainty over these issues. This could stem from many sources, including (a) the relative novelty of these concerns (e.g., the unusual prospect the chargers might run out of electricity); (b) the relative proximity of Marwell Zoo to where visitors are travelling from, which might lessen control or output quality concerns, as charging would be an optional convenience rather than necessity; or (c) the hypotheticality of the scenario. Regarding concerns over the costs of charging, it could also be that our choice of wording around the willingness to pay questions (‘Would you be willing to pay…’; ‘If you had to pay…’) communicated that payment could be optional and thus charging costs were not a barrier to use. Testing these explanations would be a fruitful avenue for future research.
Importantly, our model does provide insight into some of the ‘external variables’ likely to shape beliefs about FEVER. These could provide routes to further increase people’s intentions to use FEVER (or other destination charging infrastructure) in the event it is constructed at Marwell Zoo.

4.2.1. Social Norms and Perceived Usefulness

The more favourable the social norms around use of FEVER were deemed to be, the more useful FEVER was seen as being. The impact of normative influence on PU is well-established and is a feature of later versions of the TAM (e.g., TAM2 [43]). It is possible that the impact of normative influence was inflated in the current study due to the majority of participants within our sample not being EV users. This might have introduced more ambiguity to the study for these participants, increasing their responsiveness to perceived social norms [61].
In one respect, our findings simply indicate that promoting the visible use of FEVER by others (e.g., via obvious siting and/or the sharing of data on use metrics) could be effective in stimulating engagement and use by others by communicating favourable descriptive social norms. There are, however, caveats to this suggestion. Firstly, the question we used in our QBS related more to perceived ‘injunctive norms’ (what is expected of us by others) as opposed to descriptive norms (what we observe others doing). Thus, injunctive messaging might be expected to be more effective based upon the data from the current study [62]. Further, to the extent that concerns about charger availability were negatively related to PEOU, there is a chance that the popularity of the charging infrastructure could put some users off. This might be anticipated particularly in a context where many people would be reluctant to vacate the chargers once charged.

4.2.2. Fun/Enjoyment and Perceived Ease of Use

Overall, the participants felt that use of the chargers would be fun and enjoyable. This sentiment shared a positive relationship with how easy people believed the chargers would be to use. Again, it is possible that these findings could be a product of our sample, for which charging an EV per se would be a fun and novel experience. Equally, it could relate to the attributes of FEVER as described within the study (e.g., off-grid, renewable, innovative), which for some could have been exciting. While these assumptions require further investigation, the findings do align with many studies that identify the importance of affect and emotion in shaping perceptions of technologies [63]. Concepts such as the affect heuristic [64] clearly illustrate how ‘gut-reaction’ shapes the balance of perceived risks and benefits associated with technologies.
In the case of FEVER, this argues in favour of attempts to make actual use of the chargers enjoyable. This could be achieved through consideration of the system’s aesthetic [65] or through gamification of the charging experience [66]. Our study found that willingness to pay for charging was generally more favourable where revenue was used to support the zoo, so tying revenue from charging to the direct (charitable) support of particular animals might be a means of encouraging use.
Associating the chargers with additional amenities could also increase end-user enjoyment [35]. While Marwell Zoo provides many amenities for visitors (e.g., toilets, cafes and restaurants, free Wi-Fi), the zoo-based context provides further opportunities. For instance, as a renewable EV-charging solution, FEVER is closely aligned with the Marwell Zoo’s educational programmes around environmental conservation and could be used as an outreach tool to involve visitors in discussions about mobility transitions [67] and energy-system decarbonisation [68].

4.2.3. Charger Availability and Perceived Ease of Use

The belief that chargers might be blocked by other users was a primary concern for the participants. This concern also shared a positive relationship with beliefs about the ease with which chargers might be used. This finding is particularly pertinent in the current context, as many participants communicated a reticence to exit the zoo in order to vacate the chargers once parked.
While practically, this finding argues in favour of FEVER being constructed to ensure realistic availability and sufficient charge to meet anticipated demand, it also raises social questions around how best to communicate with end-users about the current and anticipated availability of chargers on a given day, and how to engender norms around end-user etiquette to lessen the problem of blocking.
Effective communication about the availability of the infrastructure is an important consideration and one that resonates with the noted importance of the provision of ‘station information’ in affecting people’s decisions about the use of public charging [66]. This will be particularly important in the case of FEVER due to the associated risk that overuse of the chargers could affect charge sufficiency (affecting output quality).
The concept of EV-charger etiquette is something that is gaining interest among social scientists, who have found that (a) a lack of rules around the social etiquette of public charging can serve to inhibit use of such infrastructure [69], and (b) that the use of dynamic pricing policies and the establishment of group norms around charging can help to reduce congestion issues [70]. In the current context, among those who expressed a willingness to vacate the chargers, comments about equity and fairness predominated. This might argue in favour of messaging that is designed to activate a person’s environmental values or moral norms (i.e., their sense of moral obligation) [71]. Paired with efforts to realistically increase a person’s agency in exiting and re-entering the park (e.g., provision of transport), it might be possible to lessen problematic blocking behaviour should the FEVER chargers be constructed. Importantly, most visitors to the zoo who responded to our QBS travelled (or intended to travel) only a short round-trip distance to site. This means that accessing FEVER would likely be an optional convenience for most EV-users, which could also help to reduce the potential for problems associated with blocking behaviour.

4.3. Limitations and Future Directions

There are some limitations to the study that provide avenues for future enquiry. First, in order to keep the QBS brief to encourage participation, we restricted the number of constructs assessed and favoured single-item measures. While the use of single-item measures is not uncommon (and while our items had face-validity), there are limitations to their use. For example, errors in item completion (e.g., misreading or misunderstanding the item) or missing data resulting from the accidental omission of responses (e.g., forgetting to answer a particular question item) cannot be resolved or mitigated via triangulation with other scale items measuring the same construct. Future studies should seek to employ multi-item measures of the constructs investigated in this study in order to more robustly assess and confirm our findings.
We succeeded in recruiting a diverse sample of participants; however, the self-selected nature of the sample is limiting to the representativeness and generalizability of the findings. For instance, around a fifth of our sample (21.3%) owned or leased an EV, which is higher than the UK national average (c. 2–3%). While there are strengths to this bias in the current context, in that our findings are more likely to reflect the attitudes of people likely to use FEVER when in situ, they also mean that caution should be exercised when generalising to other populations. Future research in this area would benefit from the use of purposive sampling to guarantee the representativeness of the sample for the UK public at large, or for specified target groups (e.g., existing EV users, Marwell Zoo visitors). Purposive sampling was not available within the current study due to time and budgetary constraints, hence our reliance on convenience sampling.
Relatedly, while our results do provide valuable insight into the acceptance of FEVER in the destination charging context of Marwell Zoo, additional research would need to be conducted to confirm end-user perceptions of FEVER in other deployment situations (e.g., roadside or service-station charging). For example, it is possible that in more time-limited charging environments, like service stations, where users desire rapid charging in order facilitate their onward journey, some of the control (e.g., reliability and availability of chargers) and output quality (e.g., speed and sufficiency of charging) concerns might be more significantly related to perceptions of utility and ease of use.
Finally, the hypotheticality of the scenario that the participants reflected upon, as well as our focus on use intentions rather than actual use are limitations. Put simply, it is possible that people’s evaluations and use of FEVER might deviate from what can be inferred from the current study once the technology is deployed. As the physical demonstration of the technology advances, further social scientific studies will thus be required to assess and validate the findings of the current study. Studies using vignettes and other scenario-based methods (e.g., role-play, [72]) have, though, been found to be a good analogue of actual behaviour, and while there can often be a ‘gap’ between intent and action, intentions are a key antecedent of behaviour [73]. Our focus on assessing intentions was necessary due to the absence of a functioning prototype of FEVER. We contend that our decision to assess public perceptions in advance of final prototyping is a strength of the study. Not only is this consistent with trends towards more responsible, inclusive, and user-led design practices [25,26], but it also presents opportunities to now integrate the responses from this QBS into the ongoing engineering, design, and deployment decisions pertaining to FEVER.

5. Conclusions

Our study indicates that the respondents’ perceptions of the FEVER technology were broadly positive and that they would intend to use the chargers. Consistent with the TAM, the results confirm that these positive perceptions related to a belief that FEVER would be both useful and easy to use. We also confirmed that the core TAM was augmented by the perceived social norms, anticipated fun/enjoyment, and availability concerns relating to the FEVER chargers in this context.
While care must be exercised when applying or generalising the findings from this study, due to the identified limitations, our findings do hold implications for the ongoing development of FEVER and for ‘destination charging’ providers more generally. For instance, they highlight the valid concerns that people hold about the potential for long-term blocking of charge points in situations where there might be a reticence to return to their vehicles after charging. In turn, this confirms that alongside any technical innovation, there is a need for more work to both understand and predict end-user behaviour regarding EV chargers and to promote the cooperative use of this shared but limited resource.

Author Contributions

Conceptualization, C.R.J. and N.C.; methodology, C.R.J. and N.C.; formal analysis, C.R.J. and H.E.; investigation, C.R.J., N.C. and D.E.; data curation, C.R.J. and N.C.; writing—original draft preparation, C.R.J., H.E. and A.J.C.; writing—review and editing, D.K. and D.E.; visualization, C.R.J., A.J.C. and H.E.; supervision, C.R.J.; project administration, C.R.J.; funding acquisition, A.J.C. and C.R.J. All authors have read and agreed to the published version of the manuscript.

Funding

This research was funded by the UK Engineering and Physical Sciences Research Council (EPSRC), through the ‘Future Electric Vehicle Energy networks supporting Renewables (FEVER)’ grant number EP/W005883/1.

Data Availability Statement

The raw data supporting the conclusions of this article will be made available by the authors on request.

Acknowledgments

The authors wish to thank Marwell Wildlife (UK registered charity, number 275433) for their support in providing access to Marwell Zoo and in distributing the questionnaire-based survey.

Conflicts of Interest

The authors declare no conflicts of interest. The funders had no role in the design of the study; in the collection, analyses, or interpretation of data; in the writing of the manuscript; or in the decision to publish the results.

Appendix A

Key details of the questionnaire-based survey (QBS) used within the current study.
A.
The question wording and response options provided to participants. Adjustments were made to the wording of the online version of the survey such that it was applicable to both those who had recently visited Marwell Zoo and those who were intending to visit (e.g., Q6 ‘How did you travel/do you intend to travel to Marwell Zoo?’).
  • Age: How old are you? (Years) (Categorical: 18–25; 26–35; 36–45; 56–65; 66–75; 76+)
  • Gender: What gender do you identify as? (Free response, but coded 1 = male; 2 = female; 3 = other; 4 prefer not to say)
  • Origin postcode: What are the first few letters of the postcode you have travelled from today? (e.g., PO5 1 or SO40 2) (Free response)
  • EV Ownership: Do you own or lease an electric vehicle? (1 = Yes, plug-in EV; 2 = Yes, plug-in hybrid EV; 3 = Yes, self-charging hybrid EV; 4 = No)
  • Purchase/Lease Intention: Have you considered purchasing or leasing an EV for everyday use in the future? (1 = No; 2 = Yes, but only recently; 3 = Yes, intend to purchase/lease in the next 12–24 months; 4 = Other [please state])
  • Travel to Marwell Zoo: How have you travelled to Marwell Zoo today? (1 = full or hybrid EV car or van; 2 = non-EV car or van; 3 = public transport; 4 = motorbike; 5 = bicycle; 6 = taxi; 7 = other [please state])
  • TAM—Core questions: For me, using the EV chargers would be useful, easy to use, expected of me by others, enjoyable/fun, a good thing to do, I would intend to use them. (1 = Strongly disagree; 5 = Strongly agree)
  • TAM—Charging concern: I would be concerned that the EV chargers would be costly to use, be blocked by other users, be broken/out of order, no technical support if something went wrong, charging would take a long time, not deliver sufficient charge for my onward journey, could run out of charge, might need to be booked/reserved. (5-point scale: 1 = Strongly disagree; 5 = Strongly agree)
  • Willingness-to-pay 1: Would you be willing to pay to use the EV chargers at Marwell Zoo? (No, they should be free to use; Yes, if the money is used to support the Zoo; Yes, if the money is used to support the suppliers)
  • Willingness-to-pay 2: If you had to pay to use the EV chargers, how much would you be willing to pay per kWh? (Note: The cost for public charge points in the UK is approx. 65p per kWh. A kWh is a bit like the electrical equivalent of a gallon of petrol in a normal car) (Free response)
  • Willingness-to-vacate: How (un)willing would you be to exit the zoo for a short time to move your car after it has charged so others can use the chargers? (5-point scale: 1 = very unwilling; 5 = very willing)
B.
The following details about FEVER were provided to participants in both the onsite and online version of the QBS. These details were delivered after the participants had completed the initial demographic and EV ownership questions (Q1–Q6) and before they completed the questions pertaining to our context specific TAM (Q7).
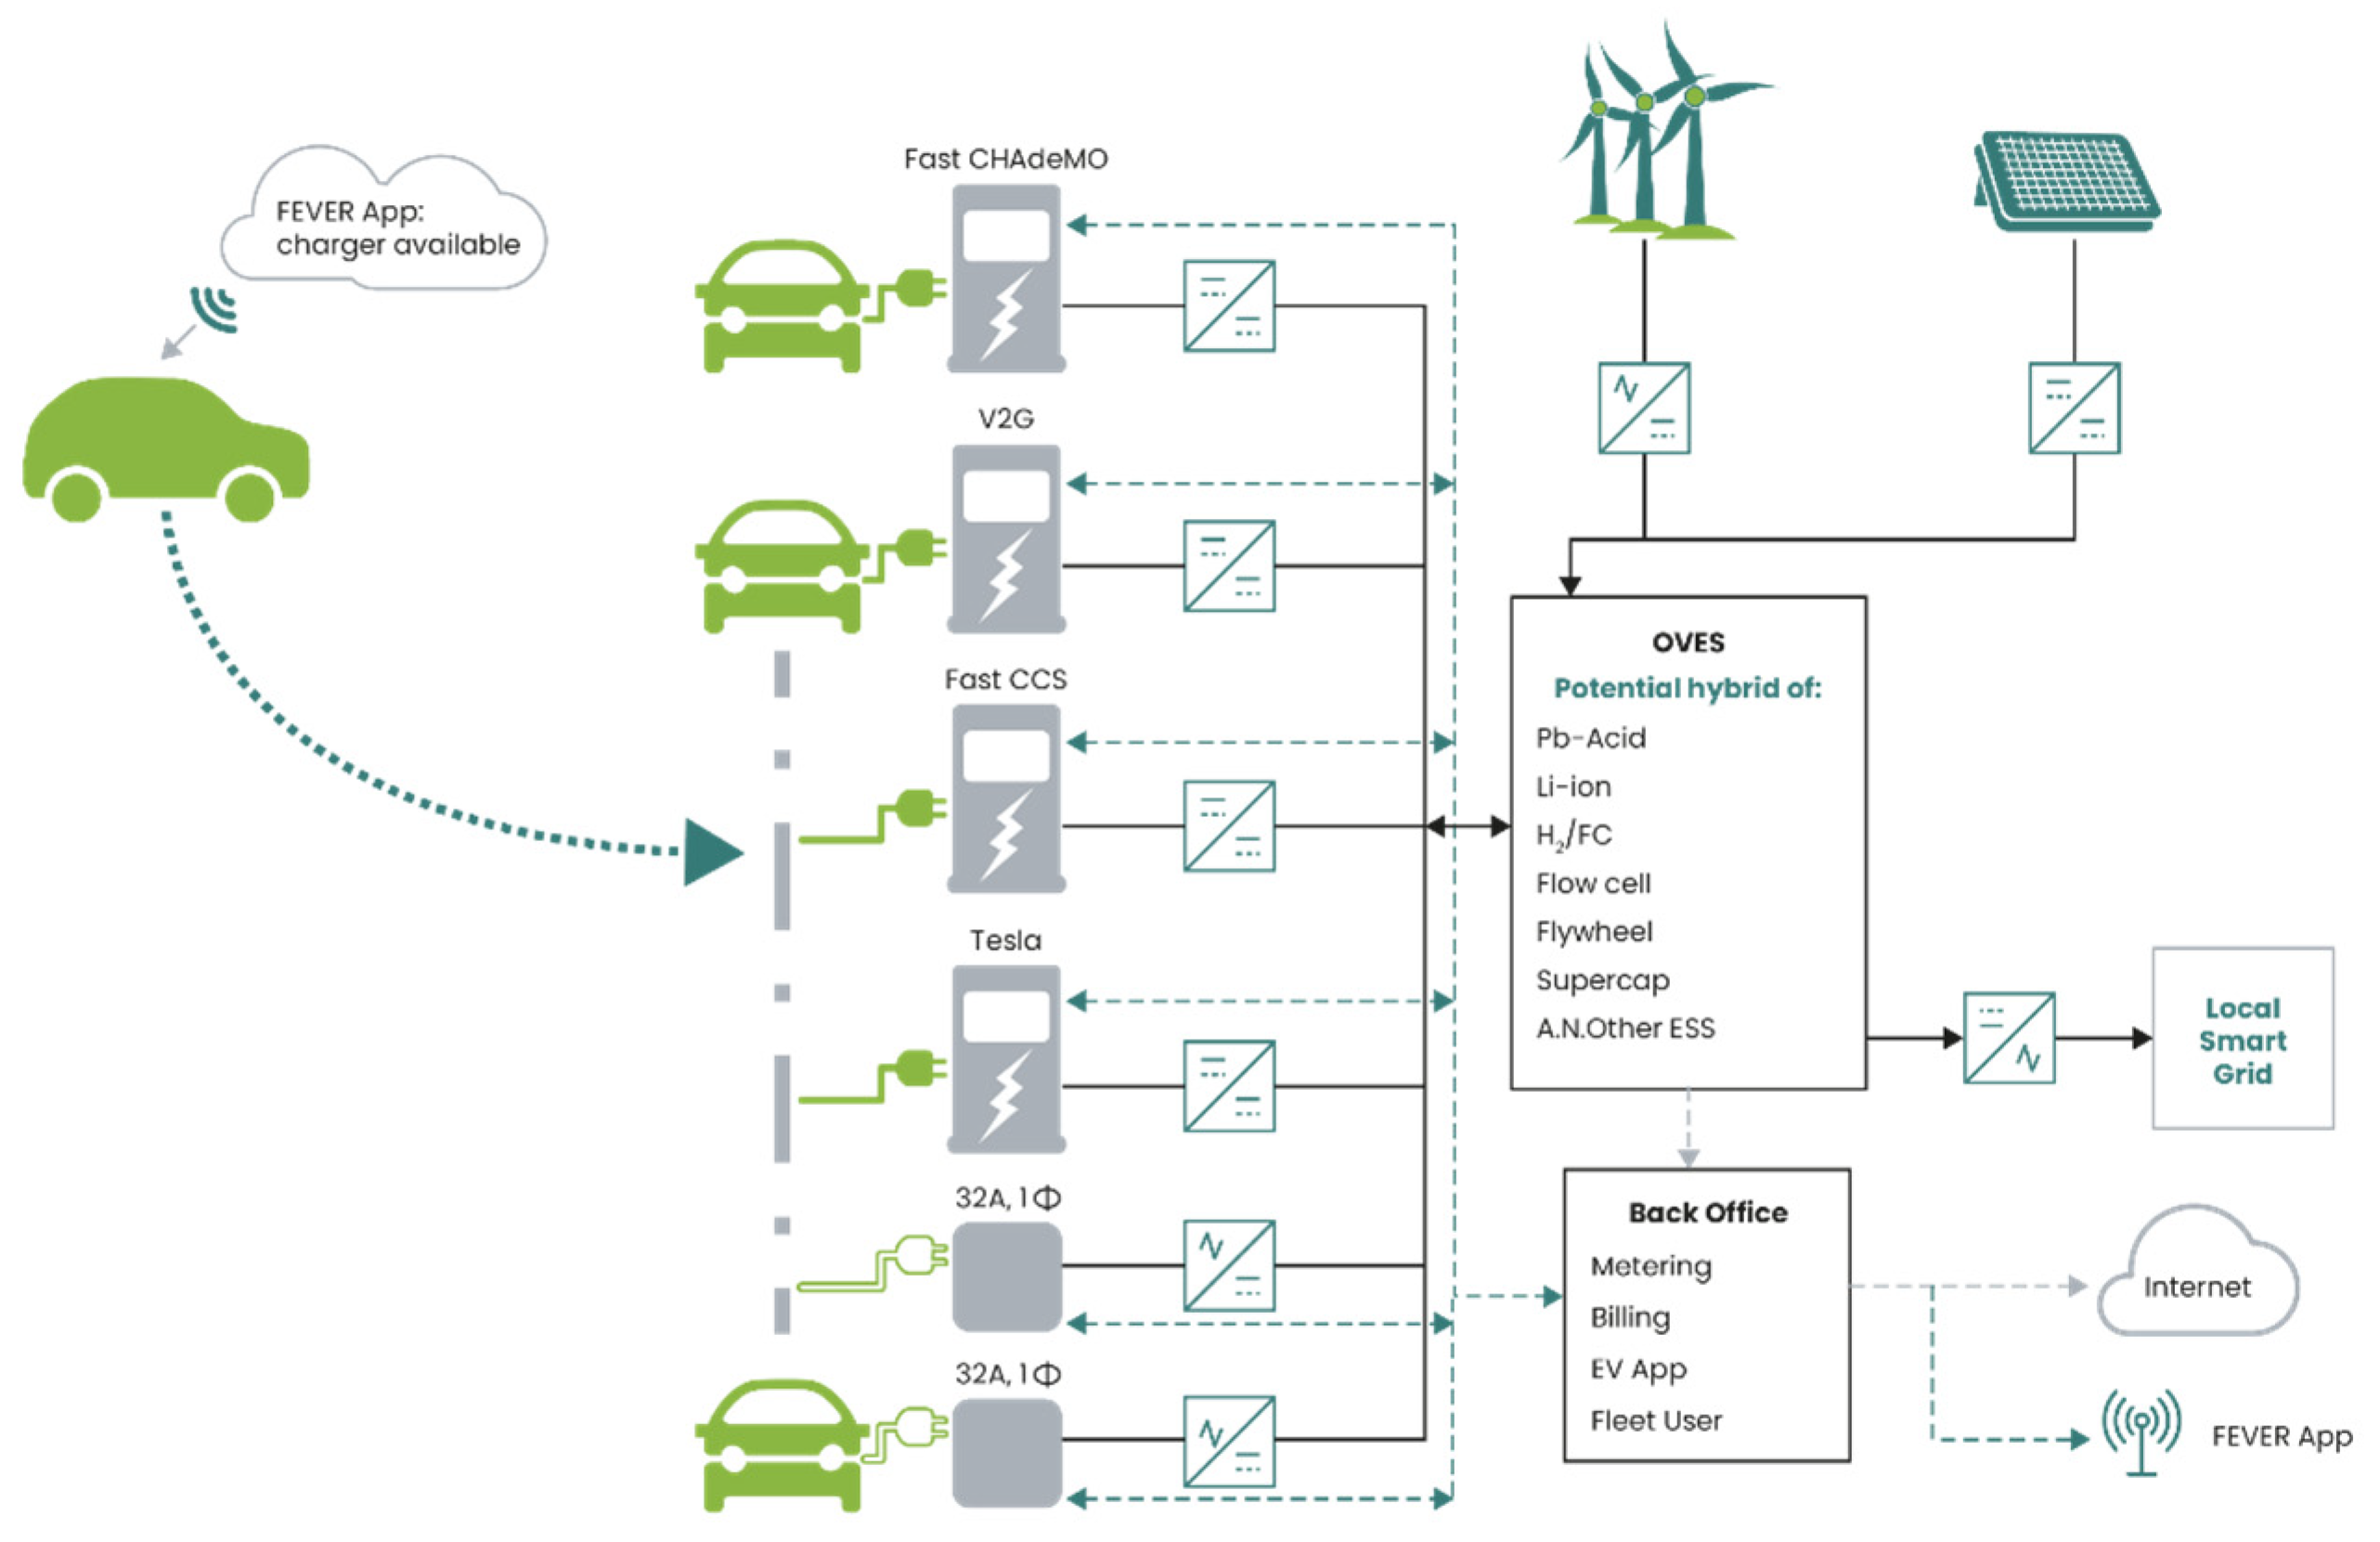
  • The FEVER research project is looking to develop a new type of EV charging option. This charging technology will be entirely ‘off-grid’, which means that it will not be connected to the national electricity grid, like most current EV chargers that you might have seen.
  • Being off-grid, the EV chargers can be placed in locations where there is poor grid connection or where obtaining a connection to the national electricity grid would cost a lot of money, for example, in some remote rural locations.
  • The EV chargers that FEVER is developing will be powered entirely by renewable technologies. This will most likely include a mix of wind power and solar power, backed up by large batteries.
  • The exact mix of technologies is still being worked out and any development will be subject to normal planning approval processes.
  • When the wind is blowing and the sun is shining, the electricity that is generated will charge the large batteries. When people arrive and plug in their electric vehicle, the batteries will release some of their charge in order to power-up the batteries in the EVs.
  • The FEVER charging technology will be associated with a mobile phone app, which can be used to communicate with EV owners about the availability of the chargers, the cost of charging, and when their car battery is sufficiently charged.
  • With this in mind, I would now like to ask you a few questions. For each question, please answer with the FEVER charge points in mind.
  • If you currently own/lease a plug-in EV, please imagine that you are driving your EV to Marwell Zoo and have the option to use the new FEVER charge points.
  • If you do not own/lease a plug-in EV, please imagine that you are driving an EV to Marwell Zoo and have the option to use the new FEVER charge points.

Appendix B

The R-squared (Table A1), direct effects (Table A2), and indirect effects (Table A3) associated with the structural equation modelling performed on the context-specific TAM.
Table A1. R-squared for dependent variables in the context-specific TAM.
95% Confidence Intervals
VariableLowerUpperWald X²dfp
TAM_Intention0.5820.4910.662362.13<0.001
TAM_Useful0.4720.3710.565147.45<0.001
TAM_PEOU0.2890.1900.39240.76<0.001
Note. TAM_Intention = Intention to use; TAM_Useful = Perceived usefulness; TAM_PEOU = Perceived ease of use.
Table A2. Direct effects in the context-specific TAM.
95% Confidence Intervals
Dependent VariablePredictor VariableEstimateSELowerUpperβzp
TAM_IntentionTAM_Norm0.08880.0748−0.05770.23530.08871.1880.235
TAM_IntentionTAM_Useful0.63230.12400.38930.87530.58245.100<0.001
TAM_IntentionTAM_PEOU0.21430.08380.05000.37870.20522.5560.011
TAM_UsefulTAM_Norm0.24060.06710.10920.37200.26093.588<0.001
TAM_UsefulTAM_PEOU0.53670.07110.39730.67610.55787.545<0.001
TAM_UsefulCON_Sufficient−0.10570.0956−0.29300.0816−0.1271−1.1060.269
TAM_UsefulCON_Time0.01730.0743−0.12830.16300.02120.2330.816
TAM_UsefulCON_RunOut−0.04090.0626−0.16350.0817−0.0504−0.6540.513
TAM_PEOUTAM_Fun0.52030.09470.33470.70580.49185.496<0.001
TAM_PEOUCON_Cost−0.08320.0893−0.25830.0919−0.0919−0.9310.352
TAM_PEOUCON_Broken0.02670.0830−0.13600.18940.02900.3210.748
TAM_PEOUCON_Support−0.10790.0794−0.26360.0477−0.1215−1.3590.174
TAM_PEOUCON_Booked−0.03760.0830−0.20020.1250−0.0407−0.4530.651
TAM_PEOUCON_Blocked0.20050.1024−1.01e−40.40110.21061.9590.050
Note. TAM_Intention = Intention to use; TAM_Useful = Perceived usefulness; TAM_PEOU = Perceived ease of use; TAM_Norm = Subjective norms; TAM_Fun = Perceived fun/enjoyment; CON_Sufficient = Charge sufficiency concern; CON_Time = Charging time concern; CON_RunOut = Charge limitation concern; CON_Cost = Cost of charging concern; CON_Broken = Concern that charger will be broken; CON_Support = Concern over lack of technical support; CON_Booked = Concern over need to reserve chargers; CON_Blocked = Concern that chargers will be booked.
Table A3. Indirect effects in the context-specific TAM.
95% Confidence
Intervals
LabelDescriptionParameterEstimateSELowerUpperβzp
IE1TAM_Norm ⇒ TAM_Useful ⇒ TAM_Intentionp4 × p20.1520.0510.0520.2520.1522.9800.003
IE2TAM_PEOU ⇒ TAM_Useful ⇒ TAM_Intentionp5 × p20.3390.0830.1760.5030.3254.074<0.001
IE3CON_Suffcient ⇒ TAM_Useful ⇒ TAM_Intentionp6 × p2−0.0670.064−0.1920.058−0.074−1.0460.295
IE4CON_Time ⇒ TAM_Useful ⇒ TAM_Intentionp7 × p20.0110.047−0.0820.1040.0120.2320.817
IE5CON_RunOut ⇒ TAM_Useful ⇒ TAM_Intentionp8 × p2−0.0260.040−0.1040.052−0.029−0.6500.516
IE6TAM_Fun ⇒ TAM_PEOU ⇒ TAM_Intentionp9 × p30.1120.0470.0190.2040.1012.3540.019
IE7TAM_Fun ⇒ TAM_PEOU ⇒ TAM_Useful ⇒ TAM_Intentionp9 × p5 × p20.1770.0610.0570.2960.1602.8860.004
IE8CON_Cost ⇒ TAM_PEOU ⇒ TAM_Intentionp10 × p3−0.0180.020−0.0570.021−0.019−0.8950.371
IE9CON_Cost ⇒ TAM_PEOU ⇒ TAM_Useful ⇒ TAM_Intentionp10 × p5 × p2−0.0280.031−0.0900.033−0.030−0.9020.367
IE10CON_Broken ⇒ TAM_PEOU ⇒ TAM_Intentionp11 × p30.0060.018−0.0290.0410.0060.3190.750
IE11CON_Broken ⇒ TAM_PEOU ⇒ TAM_Useful ⇒ TAM_Intentionp11 × p5 × p20.0090.028−0.0470.0650.0090.3190.750
IE12CON_Support ⇒ TAM_PEOU ⇒ TAM_Intentionp12 × p3−0.0230.019−0.0600.013−0.025−1.2430.214
IE13CON_Support ⇒ TAM_PEOU ⇒ TAM_Useful ⇒ TAM_Intentionp12 × p5 × p2−0.0370.029−0.0940.021−0.039−1.2510.211
IE14CON_Booked ⇒ TAM_PEOU ⇒ TAM_Intentionp13 × p3−0.0080.018−0.0430.027−0.008−0.4460.656
IE15CON_Booked ⇒ TAM_PEOU ⇒ TAM_Useful ⇒ TAM_Intentionp13 × p5 × p2−0.0130.028−0.0680.042−0.013−0.4530.651
IE16CON_Blocked ⇒ TAM_PEOU ⇒ TAM_Intentionp14 × p30.0430.027−0.0090.0950.0431.6060.108
IE17CON_Blocked ⇒ TAM_PEOU ⇒ TAM_Useful ⇒ TAM_Intentionp14 × p5 × p20.0680.038−0.0060.1420.0681.7990.072
Note. TAM_Intention = Intention to use; TAM_Useful = Perceived usefulness; TAM_PEOU = Perceived ease of use; TAM_Norm = Subjective norms; TAM_Fun = Perceived fun/enjoyment; CON_Sufficient = Charge sufficiency concern; CON_Time = Charging time concern; CON_RunOut = Charge limitation concern; CON_Cost = Cost of charging concern; CON_Broken = Concern that charger will be broken; CON_Support = Concern over lack of technical support; CON_Booked = Concern over need to reserve chargers; CON_Blocked = Concern that chargers will be booked.

References

  1. Edwards, J. EV Market Stats 2023: Tracking the Growth in EV Sales in the UK over Time. Available online: https://www.zap-map.com/ev-stats/ev-market (accessed on 31 January 2023).
  2. Society of Motor Manufacturers and Traders (SMMT) SMMT Vehicle Data. Available online: https://media.smmt.co.uk/data/#579-957-wpfd-december-2023-1708363389 (accessed on 31 January 2023).
  3. Edwards, H.; Stewart, I.; Mawhood, B.; Bolton, P. Electric Vehicles and Infrastructure; House of Commons Library: London, UK, 2023. [Google Scholar]
  4. LaMonaca, S.; Ryan, L. The State of Play in Electric Vehicle Charging Services—A Review of Infrastructure Provision, Players, and Policies. Renew. Sustain. Energy Rev. 2022, 154, 111733. [Google Scholar] [CrossRef]
  5. Dixon, J.; Andersen, P.B.; Bell, K.; Træholt, C. On the Ease of Being Green: An Investigation of the Inconvenience of Electric Vehicle Charging. Appl. Energy 2020, 258, 114090. [Google Scholar] [CrossRef]
  6. Mahmud, I.; Medha, M.B.; Hasanuzzaman, M. Global Challenges of Electric Vehicle Charging Systems and Its Future Prospects: A Review. Res. Transp. Bus. Manag. 2023, 49, 101011. [Google Scholar] [CrossRef]
  7. Deb, S.; Tammi, K.; Kalita, K.; Mahanta, P. Review of Recent Trends in Charging Infrastructure Planning for Electric Vehicles. WIREs Energy Environ. 2018, 7, e306. [Google Scholar] [CrossRef]
  8. Delmonte, E.; Kinnear, N.; Jenkins, B.; Skippon, S. What Do Consumers Think of Smart Charging? Perceptions among Actual and Potential Plug-in Electric Vehicle Adopters in the United Kingdom. Energy Res. Soc. Sci. 2020, 60, 101318. [Google Scholar] [CrossRef]
  9. Hopkins, E.; Potoglou, D.; Orford, S.; Cipcigan, L. Can the Equitable Roll out of Electric Vehicle Charging Infrastructure Be Achieved? Renew. Sustain. Energy Rev. 2023, 182, 113398. [Google Scholar] [CrossRef]
  10. Flocea, R.; Hîncu, A.; Robu, A.; Senocico, S.; Traciu, A.; Remus, B.M.; Răboacă, M.S.; Filote, C. Electric Vehicle Smart Charging Reservation Algorithm. Sensors 2022, 22, 2834. [Google Scholar] [CrossRef]
  11. Kavianipour, M.; Fakhrmoosavi, F.; Singh, H.; Ghamami, M.; Zockaie, A.; Ouyang, Y.; Jackson, R. Electric Vehicle Fast Charging Infrastructure Planning in Urban Networks Considering Daily Travel and Charging Behavior. Transp. Res. D Transp. Environ. 2021, 93, 102769. [Google Scholar] [CrossRef]
  12. Dascalu, A.; Sharkh, S.; Cruden, A.; Stevenson, P. Performance of a Hybrid Battery Energy Storage System. Energy Rep. 2022, 8, 1–7. [Google Scholar] [CrossRef]
  13. Davis, F.D. Perceived Usefulness, Perceived Ease of Use, and User Acceptance of Information Technology. MIS Q. 1989, 13, 319. [Google Scholar] [CrossRef]
  14. Office for Low Emission Vehicles. Lessons Learnt from the Plugged-In Places Projects; Office for Low Emission Vehicles: London, UK, 2013. [Google Scholar]
  15. Chen, T.; Zhang, X.-P.; Wang, J.; Li, J.; Wu, C.; Hu, M.; Bian, H. A Review on Electric Vehicle Charging Infrastructure Development in the UK. J. Mod. Power Syst. Clean Energy 2020, 8, 193–205. [Google Scholar] [CrossRef]
  16. Apt, J.; Fischhoff, B. Power and People. Electr. J. 2006, 19, 17–25. [Google Scholar] [CrossRef]
  17. Wüstenhagen, R.; Wolsink, M.; Bürer, M.J. Social Acceptance of Renewable Energy Innovation: An Introduction to the Concept. Energy Policy 2007, 35, 2683–2691. [Google Scholar] [CrossRef]
  18. Devine-Wright, P.; Batel, S.; Aas, O.; Sovacool, B.; Labelle, M.C.; Ruud, A. A Conceptual Framework for Understanding the Social Acceptance of Energy Infrastructure: Insights from Energy Storage. Energy Policy 2017, 107, 27–31. [Google Scholar] [CrossRef]
  19. Jones, C.R.; Olfe-Kräutlein, B.; Naims, H.; Armstrong, K. The Social Acceptance of Carbon Dioxide Utilisation: A Review and Research Agenda. Front. Energy Res. 2017, 5, 11. [Google Scholar] [CrossRef]
  20. Upham, P.; Oltra, C.; Boso, À. Towards a Cross-Paradigmatic Framework of the Social Acceptance of Energy Systems. Energy Res. Soc. Sci. 2015, 8, 100–112. [Google Scholar] [CrossRef]
  21. Weinberger, N.; Woll, S.; Kyba, C.C.M.; Schulte-Römer, N. The Value of Citizen Participation in Technology Assessment, Responsible Research and Innovation, and Sustainable Development. Sustainability 2021, 13, 11613. [Google Scholar] [CrossRef]
  22. Yorulmaz, M.; Bührer-Topçu, S. The Impact of Responsible Research and Innovation (RRI). A Co-Created Template with a Compilation of the Scientific, Societal and Economic Impacts of RRI. J. Res. Technol. Policy Eval. 2022, 53, 118–125. [Google Scholar] [CrossRef]
  23. Tait, J. Upstream Engagement and the Governance of Science. EMBO Rep. 2009, 10, S18–S22. [Google Scholar] [CrossRef]
  24. Kurath, M.; Gisler, P. Informing, Involving or Engaging? Science Communication, in the Ages of Atom-, Bio- and Nanotechnology. Public Underst. Sci. 2009, 18, 559–573. [Google Scholar] [CrossRef]
  25. Bauer, A.; Bogner, A.; Fuchs, D. Rethinking Societal Engagement under the Heading of Responsible Research and Innovation: (Novel) Requirements and Challenges. J. Responsible Innov. 2021, 8, 342–363. [Google Scholar] [CrossRef]
  26. Jankowski, N.; Schönijahn, L.; Salchow, C.; Ivanova, E.; Wahl, M. User-Centred Design as an Important Component of Technological Development. Curr. Dir. Biomed. Eng. 2017, 3, 69–73. [Google Scholar] [CrossRef]
  27. Wicki, M.; Brückmann, G.; Quoss, F.; Bernauer, T. What Do We Really Know about the Acceptance of Battery Electric Vehicles?—Turns out, Not Much. Transp. Rev. 2023, 43, 62–87. [Google Scholar] [CrossRef]
  28. Coffman, M.; Bernstein, P.; Wee, S. Electric Vehicles Revisited: A Review of Factors That Affect Adoption. Transp. Rev. 2017, 37, 79–93. [Google Scholar] [CrossRef]
  29. Li, W.; Long, R.; Chen, H.; Geng, J. A Review of Factors Influencing Consumer Intentions to Adopt Battery Electric Vehicles. Renew. Sustain. Energy Rev. 2017, 78, 318–328. [Google Scholar] [CrossRef]
  30. Corradi, C.; Sica, E.; Morone, P. What Drives Electric Vehicle Adoption? Insights from a Systematic Review on European Transport Actors and Behaviours. Energy Res. Soc. Sci. 2023, 95, 102908. [Google Scholar] [CrossRef]
  31. Broadbent, G.H.; Drozdzewski, D.; Metternicht, G. Electric Vehicle Adoption: An Analysis of Best Practice and Pitfalls for Policy Making from Experiences of Europe and the US. Geogr. Compass 2018, 12, e12358. [Google Scholar] [CrossRef]
  32. Kubli, M. EV Drivers’ Willingness to Accept Smart Charging: Measuring Preferences of Potential Adopters. Transp. Res. D Transp. Environ. 2022, 109, 103396. [Google Scholar] [CrossRef]
  33. Baumgartner, N.; Weyer, K.; Eckmann, L.; Fichtner, W. How to Integrate Users into Smart Charging—A Critical and Systematic Review. Energy Res. Soc. Sci. 2023, 100, 103113. [Google Scholar] [CrossRef]
  34. Gebauer, F.; Vilimek, R.; Keinath, A.; Carbon, C.-C. Changing Attitudes towards E-Mobility by Actively Elaborating Fast-Charging Technology. Technol. Forecast. Soc. Chang. 2016, 106, 31–36. [Google Scholar] [CrossRef]
  35. Visaria, A.A.; Jensen, A.F.; Thorhauge, M.; Mabit, S.E. User Preferences for EV Charging, Pricing Schemes, and Charging Infrastructure. Transp. Res. Part A Policy Pract. 2022, 165, 120–143. [Google Scholar] [CrossRef]
  36. Potoglou, D.; Song, R.; Santos, G. Public Charging Choices of Electric Vehicle Users: A Review and Conceptual Framework. Transp. Res. D Transp. Environ. 2023, 121, 103824. [Google Scholar] [CrossRef]
  37. Legris, P.; Ingham, J.; Collerette, P. Why Do People Use Information Technology? A Critical Review of the Technology Acceptance Model. Inf. Manag. 2003, 40, 191–204. [Google Scholar] [CrossRef]
  38. Marangunić, N.; Granić, A. Technology Acceptance Model: A Literature Review from 1986 to 2013. Univers. Access Inf. Soc. 2015, 14, 81–95. [Google Scholar] [CrossRef]
  39. Whittle, C.; Jones, C.R.; While, A. Empowering Householders: Identifying Predictors of Intentions to Use a Home Energy Management System in the United Kingdom. Energy Policy 2020, 139, 111343. [Google Scholar] [CrossRef]
  40. Thilina, D.K.; Gunawardane, N. The Effect of Perceived Risk on the Purchase Intention of Electric Vehicles: An Extension to the Technology Acceptance Model. Int. J. Electr. Hybrid Veh. 2019, 11, 73. [Google Scholar] [CrossRef]
  41. Shanmugavel, N.; Alagappan, C.; Balakrishnan, J. Acceptance of Electric Vehicles: A Dual-Factor Approach Using Social Comparison Theory and Technology Acceptance Model. Res. Transp. Bus. Manag. 2022, 45, 100842. [Google Scholar] [CrossRef]
  42. Venkatesh, V.; Davis, F.D. A Theoretical Extension of the Technology Acceptance Model: Four Longitudinal Field Studies. Manag. Sci. 2000, 46, 186–204. [Google Scholar] [CrossRef]
  43. Venkatesh, V.; Bala, H. Technology Acceptance Model 3 and a Research Agenda on Interventions. Decis. Sci. 2008, 39, 273–315. [Google Scholar] [CrossRef]
  44. Yousafzai, S.Y.; Foxall, G.R.; Pallister, J.G. Technology Acceptance: A Meta-analysis of the TAM: Part 2. J. Model. Manag. 2007, 2, 281–304. [Google Scholar] [CrossRef]
  45. Yousafzai, S.Y.; Foxall, G.R.; Pallister, J.G. Technology Acceptance: A Meta-analysis of the TAM: Part 1. J. Model. Manag. 2007, 2, 251–280. [Google Scholar] [CrossRef]
  46. Davis, F.D.; Venkatesh, V. A Critical Assessment of Potential Measurement Biases in the Technology Acceptance Model: Three Experiments. Int. J. Hum. Comput. Stud. 1996, 45, 19–45. [Google Scholar] [CrossRef]
  47. Dudenhöffer, K. Why Electric Vehicles Failed. J. Manag. Control 2013, 24, 95–124. [Google Scholar] [CrossRef]
  48. Davis, F.D.; Bagozzi, R.P.; Warshaw, P.R. User acceptance of computer technology: A comparison of two theoretical models. Manag. Sci. 1989, 35, 982–1003. [Google Scholar] [CrossRef]
  49. Shanmugavel, N.; Micheal, M. Exploring the Marketing Related Stimuli and Personal Innovativeness on the Purchase Intention of Electric Vehicles through Technology Acceptance Model. Clean. Logist. Supply Chain 2022, 3, 100029. [Google Scholar] [CrossRef]
  50. Müller, J.M. Comparing Technology Acceptance for Autonomous Vehicles, Battery Electric Vehicles, and Car Sharing—A Study across Europe, China, and North America. Sustainability 2019, 11, 4333. [Google Scholar] [CrossRef]
  51. Wang, N.; Tian, H.; Zhu, S.; Li, Y. Analysis of Public Acceptance of Electric Vehicle Charging Scheduling Based on the Technology Acceptance Model. Energy 2022, 258, 124804. [Google Scholar] [CrossRef]
  52. Deumlich, T.; Amberger, M.; Tafreschi, O. Empirical Analysis of Technology Acceptance of Private Electric Vehicle Charging Infrastructure in Germany. In Advanced Information Systems Engineering Workshops; Springer: Berlin/Heidelberg, Germany, 2022; pp. 61–72. [Google Scholar]
  53. Kushwah, P.; Tomer, N. Role of Battery Charging Infrastructure in Electric Vehicle Adoption in India: An Application of Technology Acceptance Model; SAE Technical Paper; SAE International: Warrendale, PA, USA, 2021. [Google Scholar] [CrossRef]
  54. Fett, D.; Ensslen, A.; Jochem, P.; Fichtner, W. A Survey on User Acceptance of Wireless Electric Vehicle Charging. World Electr. Veh. J. 2018, 9, 36. [Google Scholar] [CrossRef]
  55. Schelte, N.; Severengiz, S.; Finke, S.; Stommel, J. Analysis on User Acceptance for Light Electric Vehicles and Novel Charging Infrastructure. In Proceedings of the 2022 IEEE European Technology and Engineering Management Summit (E-TEMS), Bilbao, Spain, 9–11 March 2022; pp. 103–108. [Google Scholar]
  56. Adu-Gyamfi, G.; Song, H.; Obuobi, B.; Nketiah, E.; Wang, H.; Cudjoe, D. Who Will Adopt? Investigating the Adoption Intention for Battery Swap Technology for Electric Vehicles. Renew. Sustain. Energy Rev. 2022, 156, 111979. [Google Scholar] [CrossRef]
  57. Hainmueller, J.; Hangartner, D.; Yamamoto, T. Validating Vignette and Conjoint Survey Experiments against Real-World Behavior. Proc. Natl. Acad. Sci. USA 2015, 112, 2395–2400. [Google Scholar] [CrossRef] [PubMed]
  58. Dresselhaus, T.R.; Peabody, J.W.; Luck, J.; Bertenthal, D. An Evaluation of Vignettes for Predicting Variation in the Quality of Preventive Care. J. Gen. Intern. Med. 2004, 19, 1013–1018. [Google Scholar] [CrossRef]
  59. de Brey, B.; Gardien, L.; Hiep, E. Smart Charging Needs, Wants and Demands, Charging Experiences and Opinions of EV Drivers. World Electr. Veh. J. 2021, 12, 168. [Google Scholar] [CrossRef]
  60. Hink, C. Improving Drivers’ Confidence in Public EV Charging: Research Report on the Consumer Experience at Public Electric Vehicle Chargepoints in England; EVA England: Winchester, UK, 2021. [Google Scholar]
  61. Deutsch, M.; Gerard, H.B. A Study of Normative and Informational Social Influences upon Individual Judgment. J. Abnorm. Soc. Psychol. 1955, 51, 629–636. [Google Scholar] [CrossRef] [PubMed]
  62. Chen, J.; Xia, S.; Lin, T. A Framework of Moderators in Social Norm-Based Message Persuasiveness Based on a Systematic Review. Hum. Commun. Res. 2023, hqad043. [Google Scholar] [CrossRef]
  63. Huijts, N.M.A.; Molin, E.J.E.; Steg, L. Psychological Factors Influencing Sustainable Energy Technology Acceptance: A Review-Based Comprehensive Framework. Renew. Sustain. Energy Rev. 2012, 16, 525–531. [Google Scholar] [CrossRef]
  64. Slovic, P.; Finucane, M.L.; Peters, E.; MacGregor, D.G. The Affect Heuristic. Eur. J. Oper. Res. 2007, 177, 1333–1352. [Google Scholar] [CrossRef]
  65. Yim, H.; Kim, S.; Kim, S. Design Guidelines for Future Electric Vehicle Charging Stations. In Information Systems and Design; Springer: Berlin/Heidelberg, Germany, 2023; pp. 113–121. ISBN 978-3-031-32092-7. [Google Scholar]
  66. Wang, W.; Gan, H.; Wang, X.; Lu, H.; Huang, Y. Initiatives and Challenges in Using Gamification in Transportation: A Systematic Mapping. Eur. Transp. Res. Rev. 2022, 14, 41. [Google Scholar] [CrossRef]
  67. Axsen, J.; Sovacool, B.K. The Roles of Users in Electric, Shared and Automated Mobility Transitions. Transp. Res. D Transp. Environ. 2019, 71, 1–21. [Google Scholar] [CrossRef]
  68. Groves, C.; Henwood, K.; Pidgeon, N.; Cherry, C.; Roberts, E.; Shirani, F.; Thomas, G. Putting Visions in Their Place: Responsible Research and Innovation for Energy System Decarbonization. J. Responsible Innov. 2023, 10, 1. [Google Scholar] [CrossRef]
  69. Caperello, N.; Kurani, K.S.; TyreeHageman, J. Do You Mind If I Plug-in My Car? How Etiquette Shapes PEV Drivers’ Vehicle Charging Behavior. Transp. Res. Part A Policy Pract. 2013, 54, 155–163. [Google Scholar] [CrossRef]
  70. Asensio, O.I.; Apablaza, C.Z.; Lawson, M.C.; Walsh, S.E. A Field Experiment on Workplace Norms and Electric Vehicle Charging Etiquette. J. Ind. Ecol. 2022, 26, 183–196. [Google Scholar] [CrossRef]
  71. Lee, S.S.; Kim, Y.; Roh, T. Pro-Environmental Behavior on Electric Vehicle Use Intention: Integrating Value-Belief-Norm Theory and Theory of Planned Behavior. J. Clean. Prod. 2023, 418, 138211. [Google Scholar] [CrossRef]
  72. Meeus, W.H.J.; Raaijmakers, Q.A.W. Obedience in Modern Society: The Utrecht Studies. J. Soc. Issues 1995, 51, 155–175. [Google Scholar] [CrossRef]
  73. Ajzen, I. The Theory of Planned Behavior. Organ Behav. Hum. Decis. Processes 1991, 50, 179–211. [Google Scholar] [CrossRef]
Figure 1. Schematic depiction of FEVER charging concept. EV users communicate with the charging infrastructure (via app) to determine availability and book charge points. Electricity generated by mix of solar and wind (or other renewable) sources and stored in off-vehicle energy storage system (OVES). OVES linked to charger array. System infrastructure and user-interface managed by back-office system. Source: authors.
Energies 17 01405 g001
Figure 3. Context-specific TAM used in the current study, depicting the direct and mediated predictors of intention to use the FEVER chargers. Positive (+) and negative (−) icons illustrate the anticipated nature of the relationships between the variables.
Energies 17 01405 g003
Figure 4. Origin postcodes of participants completing the questionnaire-based survey (QBS) and their roundtrip distance to Marwell Zoo. Notes. 251+ miles roundtrips not pictured (Guernsey, Brough, Leeds, Preston, Sheffield). Four participants failed to provide a postcode or provided a response that could not be verified. Map data ©2023 Google.
Energies 17 01405 g004
Figure 5. Willingness to pay for use of FEVER chargers. Participants were provided with an anchor of 65p per kWh, which, at the time of the survey, was the average cost of UK public EV charging.
Energies 17 01405 g005
Figure 6. Willingness to vacate chargers once vehicle is charged (based on n = 218 respondents).
Energies 17 01405 g006
Figure 7. Results of structural equation modelling of the context-specific TAM (** p < 0.001, * p < 0.05, p = 0.05).
Energies 17 01405 g007
Table 1. Key characteristics of recruited participants.
Onsite
(n = 63)
Online
(n = 158)
Total
(n = 221)
Freq.%Freq.%Freq.%
Age (Years)18–25914.374.4167.2
26–351930.22213.94118.6
36–451422.25132.36529.4
46–5557.92314.62812.7
56–65914.33421.54319.5
66–7546.31912.02310.4
76+34.821.352.3
GenderMale2844.42918.45725.8
Female3555.611170.314666.1
Other0-10.610.5
Prefer not to say0-1710.8177.7
EV ownershipPlug-in EV34.82415.22712.2
Plug-in hybrid46.385.1125.4
Self-charge hybrid23.263.883.6
None5485.712075.917478.7
EV purchase intentionNo2946.05836.78739.4
Yes (provisional)34.84327.24620.8
Yes (planned)57.974.4125.4
Other1727.0127.62913.1
Already have EV914.33824.14721.3
Travel to siteEV812.73220.34018.1
Non-EV5282.511774.116976.5
Public transport23.253.273.2
Other (incl. taxi)11.642.552.4
Approx. Round-trip (Miles) 11–504165.18050.612154.8
51–1001219.04830.46027.1
101–15046.31710.8219.5
151–2000021.320.9
201–25011.663.873.2
251+23.242.562.7
Unspecified34.810.641.8
1 Calculated based upon the distance from the postcode registered by participant as the origin of their journey to Marwell Zoo using Google Maps. Where three distance options were presented, the middle option was selected, unless this was greatly different from the shortest route option, in which case the shortest route was selected.
Table 2. Mean responses to the context-specific TAM items.
nMean (SD)tEffect Size (d)
Intention2203.99 (0.92)16.04 *1.08
Perceived ease of use (PEOU)2204.00 (0.88)16.71 *1.13
Perceived utility (PU)2214.26 (0.87)21.56 *1.45
Subjective norms2213.46 (0.91)7.45 *0.50
Perceived enjoyment2193.20 (0.83)3.50 *0.24
Facilitating conditions/control beliefs
Blocked by other users2203.73 (0.91)11.89 *0.80
Need to reserve/book2203.56 (0.95)8.84 *0.60
No technical support2203.45 (0.98)6.78 *0.46
Costly to use2203.39 (0.98)5.92 *0.40
Would be broken/out of order2193.32 (0.95)4.90 *0.33
Output quality
Charging will take a long time2203.13 (1.03)1.900.13
Would not deliver sufficient charge2202.93 (1.01)−1.000.07
Could run out of charge2182.99 (1.04)−0.130.01
Note. * p < 0.001.
Disclaimer/Publisher’s Note: The statements, opinions and data contained in all publications are solely those of the individual author(s) and contributor(s) and not of MDPI and/or the editor(s). MDPI and/or the editor(s) disclaim responsibility for any injury to people or property resulting from any ideas, methods, instructions or products referred to in the content.

