Article

Numerical Simulation Study on the Influence of Cracks in a Full-Size Core on the Resistivity Measurement Response

1
College of Geophysics and Petroleum Resources, Yangtze University, Wuhan 430100, China
2
Key Laboratory of Exploration Technologies for Oil and Gas Resources, Ministry of Education, Yangtze University, Wuhan 430100, China
3
Hydrogeology and Engineering Geology Institute of Hubei Geological Bureau, Jingzhou 434007, China
*
Author to whom correspondence should be addressed.
Energies 2024, 17(6), 1386; https://doi.org/10.3390/en17061386
Submission received: 24 February 2024 / Revised: 10 March 2024 / Accepted: 11 March 2024 / Published: 13 March 2024

Abstract

:
The development of fractured oil fields poses a formidable challenge due to the intricate nature of fracture development and distribution. Fractures profoundly impact core resistivity, making it crucial to investigate the mechanism behind the resistivity response change in fracture cores. In this study, we employed the theory of a stable current field to perform a numerical simulation of the resistivity response of single-fracture and complex-fracture granite cores, using a full-size granite core with cracks as the model. We considered multiple parameters of the fracture itself and the formation to explore the resistivity response change mechanism of the fracture core. Our findings indicate that, in the case of a core with a single fracture, the angle, width, and length of the fracture (fracture occurrence) significantly affect core resistivity. When two fractures run parallel for a core with complex fractures, the change law of core resistivity is similar to that of a single fracture. However, if two fractures intersect, the relative position of the two fractures becomes a significant factor in addition to the width and length of the fracture. Interestingly, a 90° difference exists between the change law of core resistivity and the change law of the resistivity logging response. Furthermore, the core resistivity is affected by matrix resistivity and the resistivity of the mud filtrate, which emphasizes the need to calibrate the fracture dip angle calculated using dual laterolog resistivity with actual core data or special logging data in reservoirs with different geological backgrounds. In the face of multiple fractures, the dual laterolog method has multiple solutions. Our work provides a reference and theoretical basis for interpreting oil and gas in fractured reservoirs based on logging data and holds significant engineering guiding significance.

1. Introduction

As traditional oil and gas resources continue to dwindle, reservoir exploration and development technology is reaching new heights of sophistication [1,2]. The focus has shifted towards exploiting complex, unconventional reservoirs like volcanic oil and gas, shale oil and gas, and tight oil and gas on a global scale [3,4]. Among these reservoir types, fractures play a pivotal role as reservoir spaces and permeable pathways for oil and gas in igneous rock reservoirs, tight reservoirs, and shale reservoirs. The development of fractures stands out as a key characteristic influencing reservoir storage capacity [5]. In China’s major oil and gas fields, low-permeability fractured reservoirs are prevalent and are poised to serve as a crucial resource base for bolstering reserves and production in the country’s oil industry moving forward [6]. The increase in rock density in low-permeability fractured reservoirs leads to heightened rock strength and brittleness [7]. When subjected to tectonic stress, rocks exhibit varying degrees of fracturing, giving rise to fractured low-permeability reservoirs. The intricate development and distribution of fractures in these reservoirs pose challenges in terms of logging response and physical property evaluation, presenting significant technical hurdles in reservoir exploration and development endeavors [8]. Consequently, investigating how logging technology can be leveraged to economically and efficiently develop such reservoirs holds immense engineering importance.
For fractured reservoirs, core resistivity experiments play a critical role in evaluating hydrocarbon properties from logging data. However, due to laboratory constraints, these experiments often provide a limited perspective, making it challenging to fully characterize the resistivity response of cores with various fracture patterns [9]. As a result, an increasing number of scholars have turned to numerical simulation as a viable alternative. Presently, the most common approach involves characterization using imaging logging data. Consequently, scholars have undertaken successive numerical simulation studies on the computational model of electric imaging logging for fracture width, primarily employing the three-dimensional finite element method [10]. Factors examined include fracture inclination, formation resistivity, mud resistivity, distance between the instrument and the well wall, length of lateral extension of the fracture, and fracture spacing [11]. In 1990, Luthi et al. [12] pioneered the use of electric imaging instruments to study the relationship between electrical signals and fracture parameters. Their 3D finite element modeling simulated the current emitted from a single-button electrode in front of the fracture, solving Laplace differential equations for the electric field in and around the borehole on an adaptive 3D mesh. Their findings established a link between fracture width and anomalous current area, formation resistivity in the flushing zone, mud filtrate resistivity, and instrumentation-related coefficients. Subsequently, in 2001, Wang Dali [13] developed a simplified model of the electrode system structure for real micro-resistivity imaging logging and established a finite element numerical simulation method. His research revealed that mud resistivity significantly impacts the additional current relative to formation resistivity. However, the study’s limitations were acknowledged, particularly regarding the finite element mesh node division of the orthotropic model, which was constrained by computer hardware conditions. In 2002, Ke et al. [14] advanced the field by developing a full-space numerical simulation program using the three-dimensional finite element method to investigate the relationship between logging response and fracture characteristics. They proposed a new formula for calculating fracture opening, showcasing the potential for innovation in this area of study. Continuing this trajectory, Aixin Chen’s 2006 work involved numerical simulations of micro-resistivity imagers in non-uniform media [15], presenting further advancements in the 3D finite element method. This was followed by Yu Cao’s [16] exploration of the response of micro-resistivity scanning imaging logging instruments to fractures, which delved into the instrument’s resolution for different fracture scenarios. In 2015, Ponziani et al. [17] conducted a comprehensive investigation using a full borehole formation micro-resistivity imaging logging instrument through numerical simulation. Their findings demonstrated a linear relationship between fracture width and measured additional current, offering valuable insights into the measurement of fracture width and associated parameters. Ammar [18] utilized Comsol software (Comsol Multiphysics model, CMM, version 4.4, 2014) to construct a numerical simulation model for studying the resistivity of fracture-containing rock saturated with water. The study explored resistivity orthotropy and investigated the relationship between porosity and fracture parameters. Epov et al. [19] employed the finite element method to analyze the impact of tilted uniaxial anisotropy on electric logging, offering a new approach to studying the physical and electrical properties of carbonate reservoirs. He et al. [20] proposed a non-destructive method for testing the radial resistivity of cylindrical core samples, comparing different methods and using numerical simulations to highlight the variations in measurement results based on testing approaches, thereby enhancing the foundation for field interpretation. Tan et al. [21] utilized a three-dimensional finite element method to identify cracks in shale reservoirs and introduced a novel calculation method for crack porosity. Their conclusions, supported by comparisons with actual data, yielded significant results. Deng et al. [22] numerically simulated the lateral response of high-resolution azimuthal resistivity in fractured strata, linking azimuthal resistivity to fracture tilt and orientation and providing essential insights for logging interpretation in fractured reservoirs. With advancements in logging technologies, follow-drill logging has gained traction. Liu et al. [23] applied an adaptive hp-FEM algorithm to simulate the resistivity response of fractured reservoir cavities during follow-drill operations, offering advantages over traditional methods and establishing a theoretical basis for a quantitative evaluation in interpreting seam–hole type reservoirs. Kang et al. [24] used a three-dimensional finite element method to interpret the logging response of a drill-following resistivity imaging tool. By integrating a new borehole calculation model, they revealed relationships between the borehole diameter, current contrast, and formation-resistivity contrast, particularly influenced by fracture dip angles. Zhao et al. [25] conducted simulations using the finite element method on digital cores, highlighting the significant impact of fractures on partially saturated rock formations. They emphasized directional variations in resistivity within fractured samples and concluded that conventional methods may not accurately determine the saturation index in fractured reservoirs, necessitating the consideration of fracture characteristics. Wang et al. [26] established a stratigraphic fracture model for shale reservoirs using the finite element method and digital core analysis. Their study evaluated the effect of different fracture characteristics on bi-lateral logging responses, providing insights into the relationship between fracture parameters and resistivity for evaluating shale fractures. Kim et al. [27] proposed a new theoretical evaluation method for determining cylindrical core samples, including a theoretical framework for perimeter electrode setup and verification through finite element numerical simulations. Despite these notable advancements, the resistivity response measured using the instrument is influenced by numerous factors (for example, instrument type, surrounding rock pressure, mud filtrate, temperature, etc.), both in numerical simulations and actual field logging data [28]. For the core with cracks, the current research is mostly aimed at a single crack, and it is considered that the crack’s length, width, and angle significantly affect the core resistivity. For the core of two complex fractures, there is little literature to conduct separate research and exploration, especially to discuss the influence of core resistivity when the angle of the two fractures changes. Such a comprehensive investigation would greatly enhance our understanding of fractured reservoirs and inform future exploration and development endeavors.
Therefore, considering the obvious influence of fractures on core resistivity, this study is guided by the theory of a stable current field and uses the full-diameter granite core with fractures as a model through the finite element method. Numerical simulations of the resistivity response of the single-fractured and complex-fractured granite core are carried out, respectively. Considering the multiple parameters of the fracture itself and the formation, these parameters include the matrix resistivity of the reservoir lithology, the resistivity of the mud filtrate, and the angle, length, and width of the fracture. Moreover, we explored the mechanism of the change in the resistivity response of the fracture core and summarized its change law. These mechanisms and conclusions can provide a reference and theoretical basis for the oil and gas interpretation of fractured reservoirs based on logging data. Especially for complex fractured reservoirs, the model can calculate fracture parameters more accurately and judge the physical changes in the formation corresponding to the change in resistivity, which has engineering guiding significance.

2. Methods and Principles

2.1. Fundamentals of Finite Element Theory

The finite element method (FEM) can be used to solve the approximate solution of the boundary value problem of partial differential equations. The basic idea of the finite element principle is to divide a continuous structure into a finite number of small elements and use a set of simple functions within each small element to approximately describe the behavior of the structure. The analytical results of the whole structure are finally obtained by decomposing the whole structure into a finite number of small elements and then analyzing each small element.
In the finite element boundary value problem, it is defined that there are control differential equations and boundary conditions in the solution region [29]:
L Φ = f
where  L  is the differential operator,  Φ  is the variable to be solved, and  f  is the source of excitation.
The Ritz and Galerkin methods are mainly used to solve boundary value problems [30,31,32]. The basic principle of the Ritz method is that the boundary value problem is expressed using a function. The minimum value of the function corresponds to the governing differential equation of the given boundary condition, and the solution of the equation is approximately obtained by solving the minimum value of the function. The Galerkin method is a weak-form solution, which transforms the partial differential equation into a weak form and then uses the weighted residual method to obtain an approximate solution. In this study, the Ritz method is used to solve the problem.
The finite element analysis process entails several key steps, beginning with establishing a geometric model and subdivision of the structure or region into a finite number of small elements, known as finite elements. Subsequently, the constraints of each node are determined based on the boundary conditions of the actual problem, encompassing aspects such as displacement and force constraints. This forms the foundation of the finite element model, where a suitable mathematical model and equation are selected to accurately describe the problem at hand, taking into account material parameters and loading conditions. Once the model is established, the equations representing the problem are systematically solved, yielding crucial information such as displacement, stress, and temperature at the nodes. This enables the derivation of analytical results for the problem under consideration. It is imperative to subject the calculation results to thorough verification and optimization, ensuring that the model and parameters are fine-tuned and resolved to uphold the accuracy and reliability of the obtained results. This iterative process serves to validate the analytical outcomes, ultimately enhancing their robustness and applicability.

2.2. The Basic Equation of a Stable Current Field

The stable current field refers to the electric field in which the strength and distribution of the current do not change with time. The current intensity is defined as the amount of electricity flowing through a certain section in a unit of time. The current intensity is also called current, expressed by  I  (Equation (2)):
I = d q d t
Current density: The current density is a vector used to describe the physical quantity of the current intensity and flow direction at a certain point in the circuit. Its size is the amount of charge that vertically passes through the unit area in unit time. The direction is the direction of movement of the positive charge, represented by  J , and the international unit is ampere per square meter (A/m2). The current density can be approximately proportional to the electric field, that is
J = σ E = E / R
where  σ  is the conductivity reciprocal of the resistivity,  E  is the electric field, and  R  is the resistivity.
Therefore, the current intensity  d I  passing through any directed area element  d S  can be expressed as:
d I = J × d S
The current  I  through any section  S  is the integral of  d I  on the section  S :
I = S J × d S
The stable current field is similar to the electrostatic field, and its electric field strength  E  and potential  u  satisfy the following relationship:
E = g r a d ( u )

2.3. Simulation Principle and Model Construction of Core Resistivity Response

In conjunction with the density and occurrence characteristics of fractures within the formation, our study delved into numerical simulations of single and complex fractures (namely double fractures). A three-dimensional model of a full-diameter core replete with cracks was employed for the former. In contrast, the simulation of complex joints encompassed both parallel and cross-joint cases. It is worth noting that due to the substantial computational power required for simulating complex fractures, it is often difficult to meet such demands using conventional computer technology. As an alternative, a two-dimensional model may be constructed to substantially reduce the computational load without compromising the reliability of our findings.
Conventionally, core resistivity measurement involves the usage of a cylindrical core, whereby power supply and receiving electrodes are attached at both ends of the core. By measuring the total current intensity flowing through the core as well as the potential difference (voltage) at both ends, the resistance can be calculated and, subsequently, the resistivity of the core is derived using Equation (7):
ρ = K × U I
where  ρ  is the core resistivity;  K = S L  is the conversion coefficient;  S  is the core cross-sectional area, cm2 L  is the core length, cm;  U  is the voltage applied at both ends of the core; and  I  is the total current flowing through the core.
The measurement of core resistivity uses the electrode method. This method is the same as the conventional rock electrical experiment method. The core size is larger and larger, and it is generally a full-diameter core. This study simulates the full-diameter core resistivity measurement of the electrode method. According to the principle of core resistivity measurement and quasi-static electric field theory, the definite solution problem of the scalar potential field in the core area can be obtained:
x ( σ u x ) + y ( σ u y ) + z ( σ u z ) = 0 u x = 0 = θ u x = L = V 0
where  V 0  is the voltage of the power supply electrode, V σ  is the core conductivity, and its spatial distribution is  σ = σ 1 , C o n d u c t i v i t y   o f   f r a c t u r e   f i l l i n g   m e d i u m σ 2 , R o c k   r e s i s t i v i t y .
For the basic model, the model length of the given core is 10 cm, and the diameter of the core is 7.5 cm. Combined with the characteristics of granite, the matrix resistivity is set to 1000 Ωm, and the initial mud filtrate resistivity is set to 0.1 Ωm. The basic model uses the tetrahedral element, the solution space is meshed, and the corresponding potential distribution map is given. The schematic diagram of the single-fracture core model is shown in Figure 1.
The complex fracture model under investigation presents an intriguing scenario involving the consideration of two cracks. Moreover, we explore two distinct cases based on the relative position of these cracks, each offering unique insights into fracture behavior. The first case involves parallel cracks, as visually depicted in Figure 2, while the second case features intersecting cracks, as illustrated in Figure 3. To further delve into the simulation of intersecting cracks, this study explores two additional scenarios: one focuses on fixing one crack at a specific level, altering only the angle between the other crack and the central one, while the other scenario initiates with an initial dip angle for one crack, subsequently modifying the angle between the two cracks.
With careful attention to detail, numerical simulations were diligently performed for both the single-slit and complex-slit models. By meticulously analyzing the outcomes of these simulations, we aim to unravel the intricate dynamics of fractured formations and gain profound insights into their behavior.
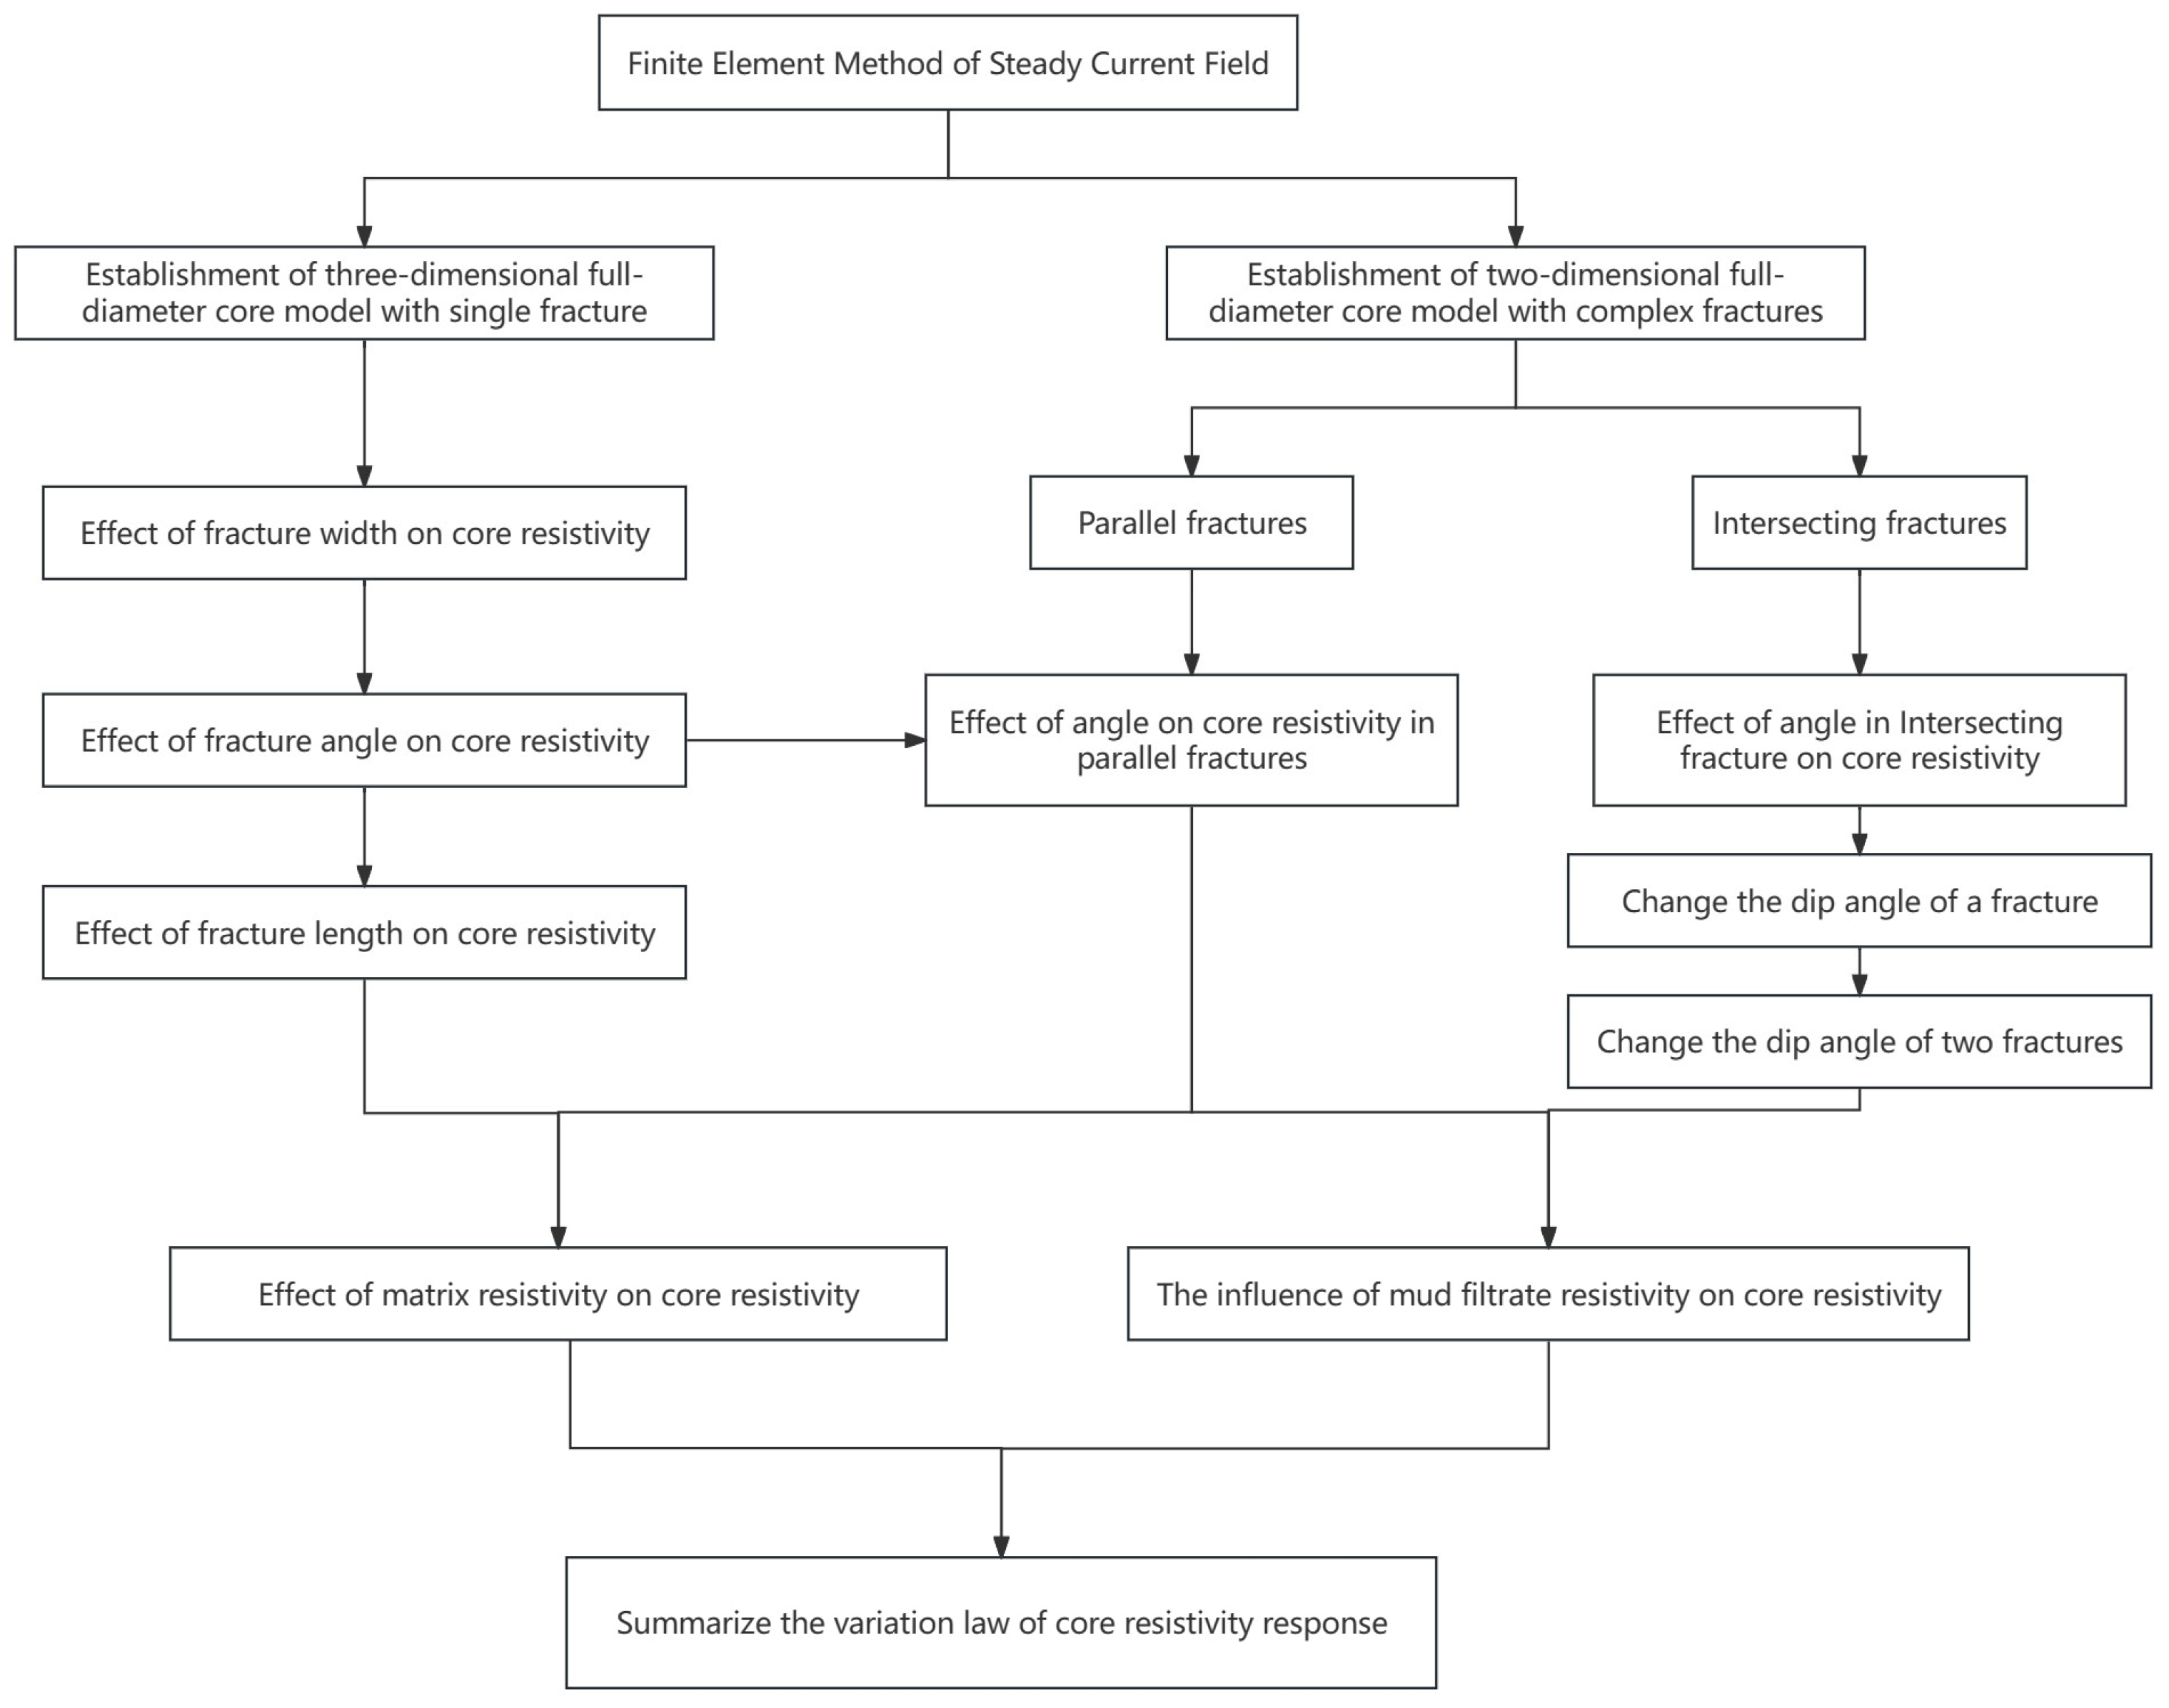
The flow chart of this study is shown in Figure 4. Firstly, based on the finite element method of the stabilized current field, the single-fracture full-diameter core model and the double-fracture full-diameter core model were established, respectively.
In the second step, the effects of the fracture angle, width, and length on the core resistivity were investigated for the core with a single fracture.
In the third step, for the core with a double fracture, the effects of the core resistivity were investigated for the two cases: for the parallel fracture with different fracture angles and the intersecting fractures and the effect of two fractures with different angular relationships on core resistivity.
Finally, the effects of matrix resistivity and mud filtrate resistivity on core resistivity were investigated to summarize the laws of the above research contents and clarify the research’s practical significance.

3. Results

3.1. The Resistivity Response Mechanism of a Single-Fracture Model

3.1.1. Core Resistivity Response Characteristics of Different Fracture Widths and Angles

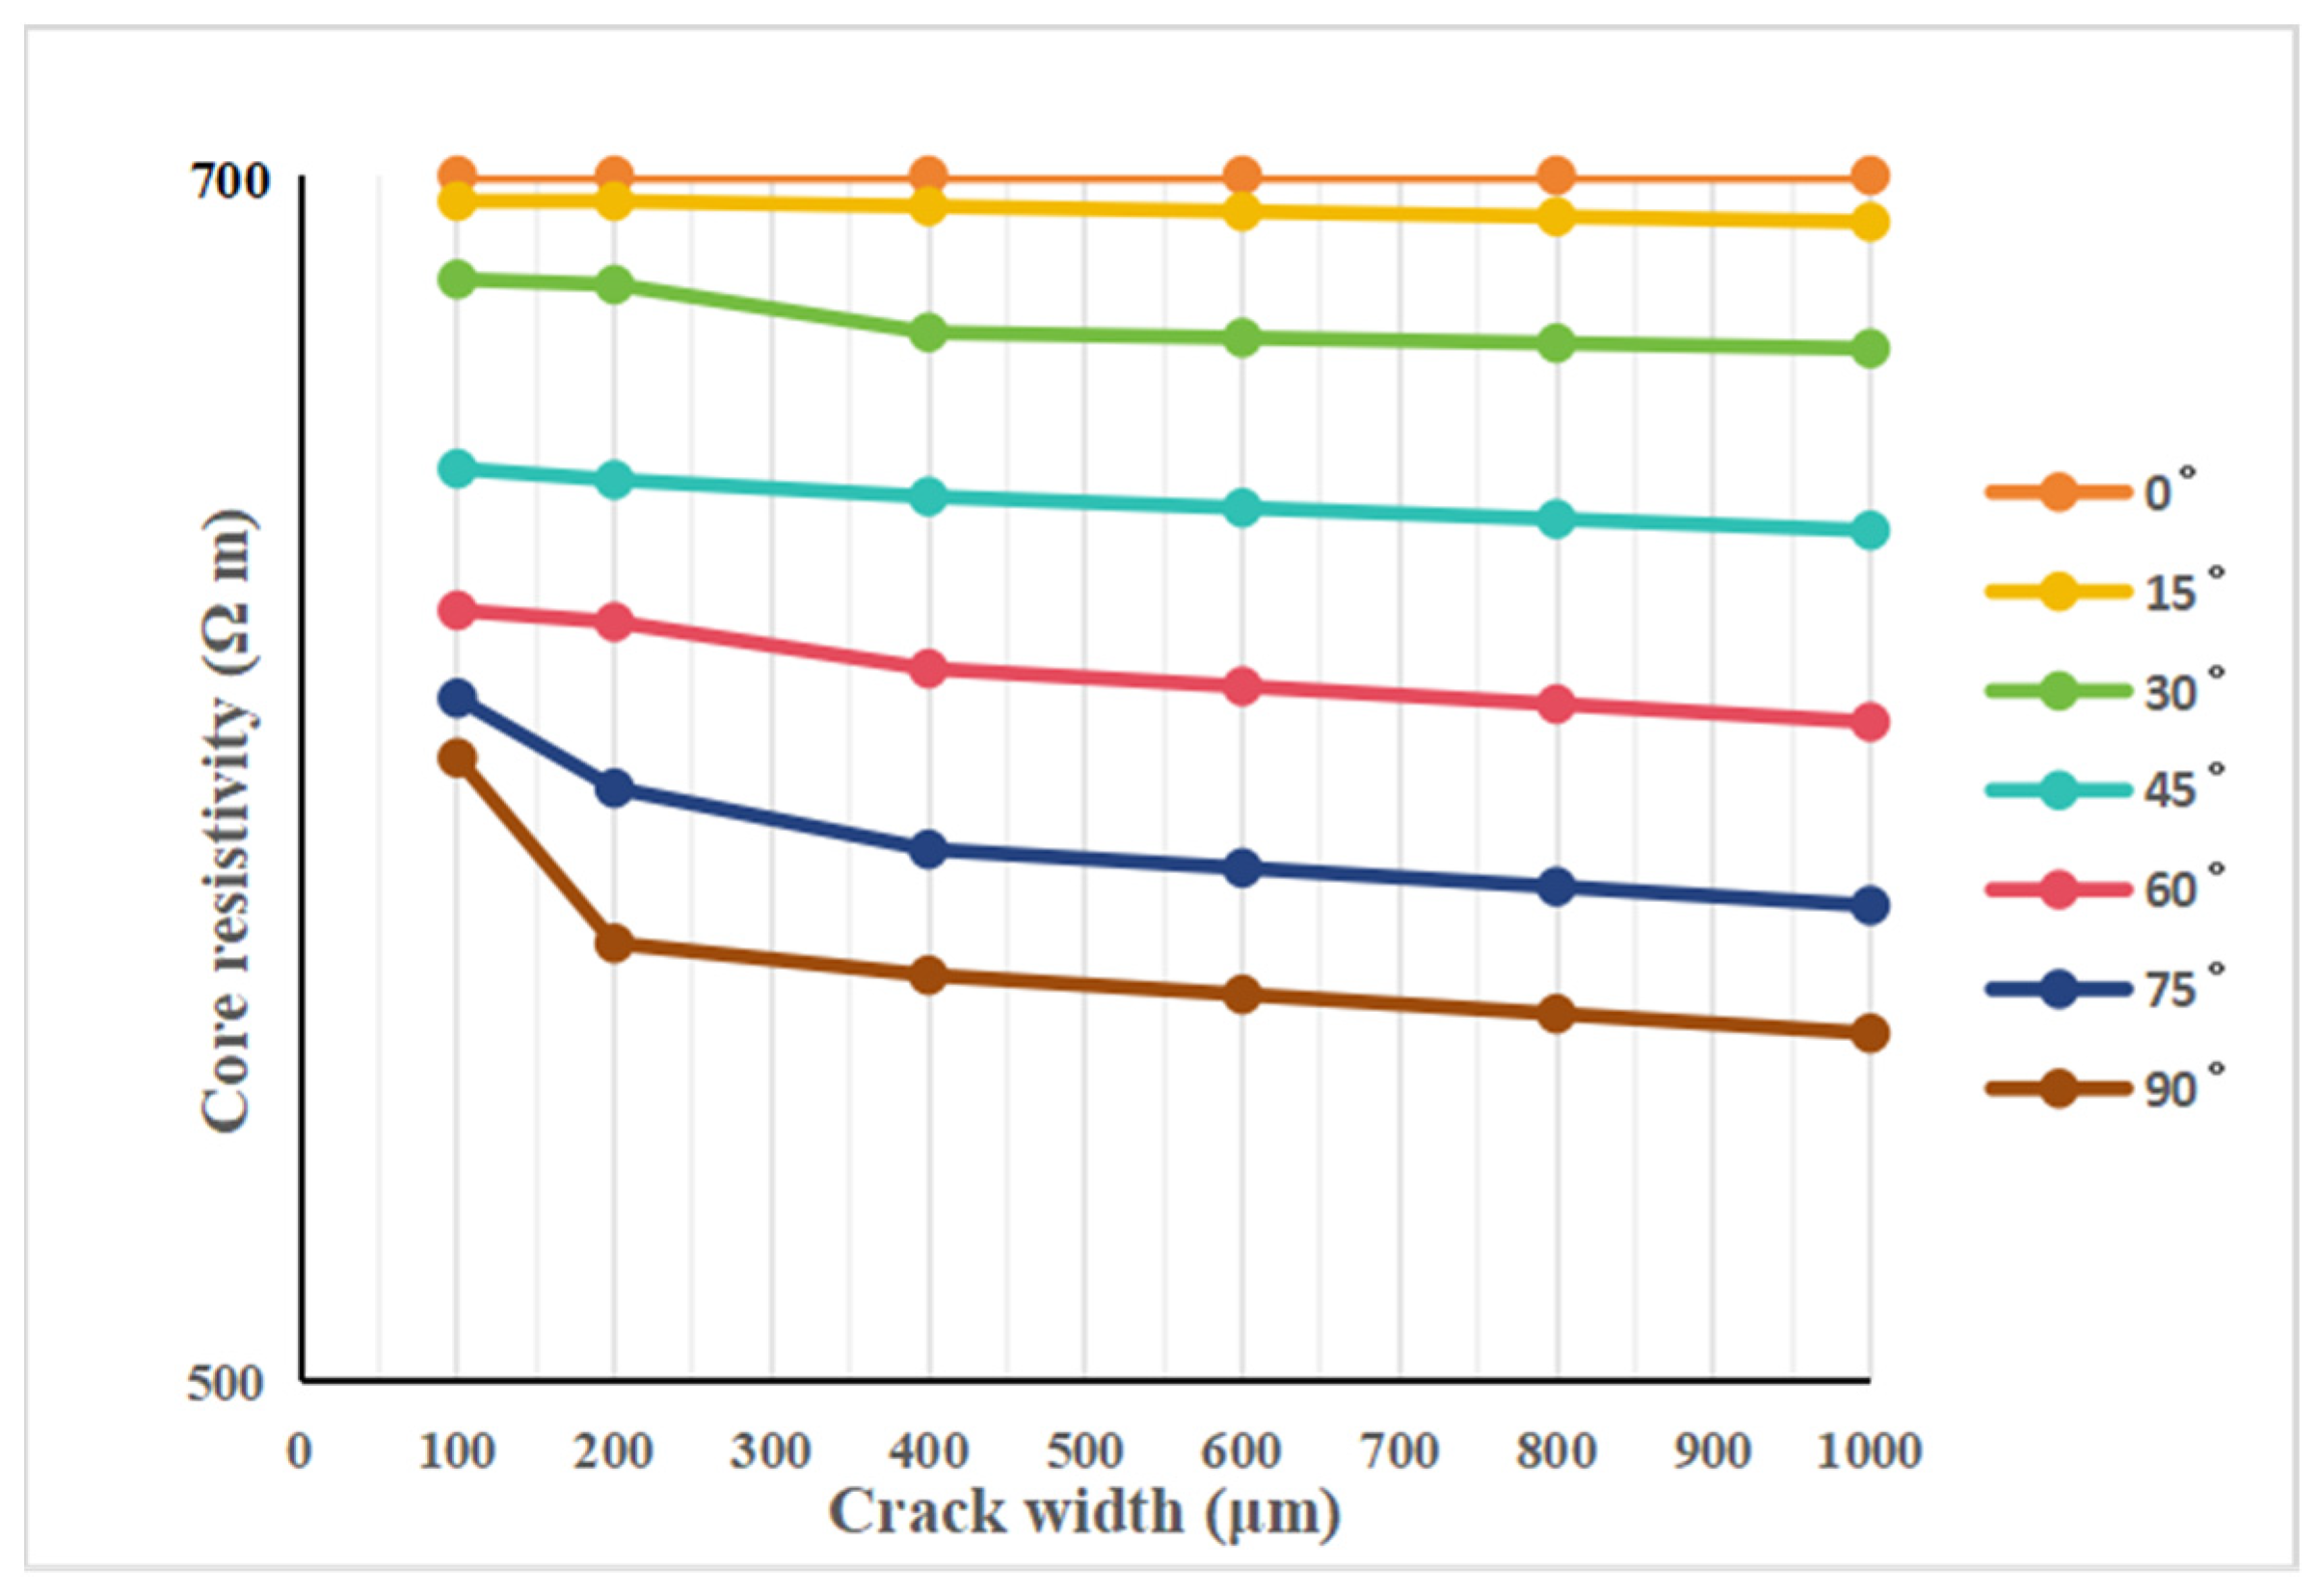
For the influence of fracture width, the response of core resistivity is simulated when the fracture of different angles is close to the source and the fracture width is changed. The process is as follows: add 1A current source to the upper end of the core model, and the lower end is grounded (0 V). The voltage difference of the source surface is measured for each set of fracture parameters, and the core resistivity is calculated using Ohm’s law. Considering different fracture dip angles, the corresponding core resistivity changes when the fracture width changes from 100 μm to 1000 μm are simulated. The results are shown in Figure 5. With the increase in the fracture dip angle, the resistivity of the core decreases. Compared with the low-angle fracture, the influence of changing the fracture width on the resistivity of the core is relatively large. When the high-angle fracture and the fracture width are within 400 μm, the response of the core resistivity changes the most.
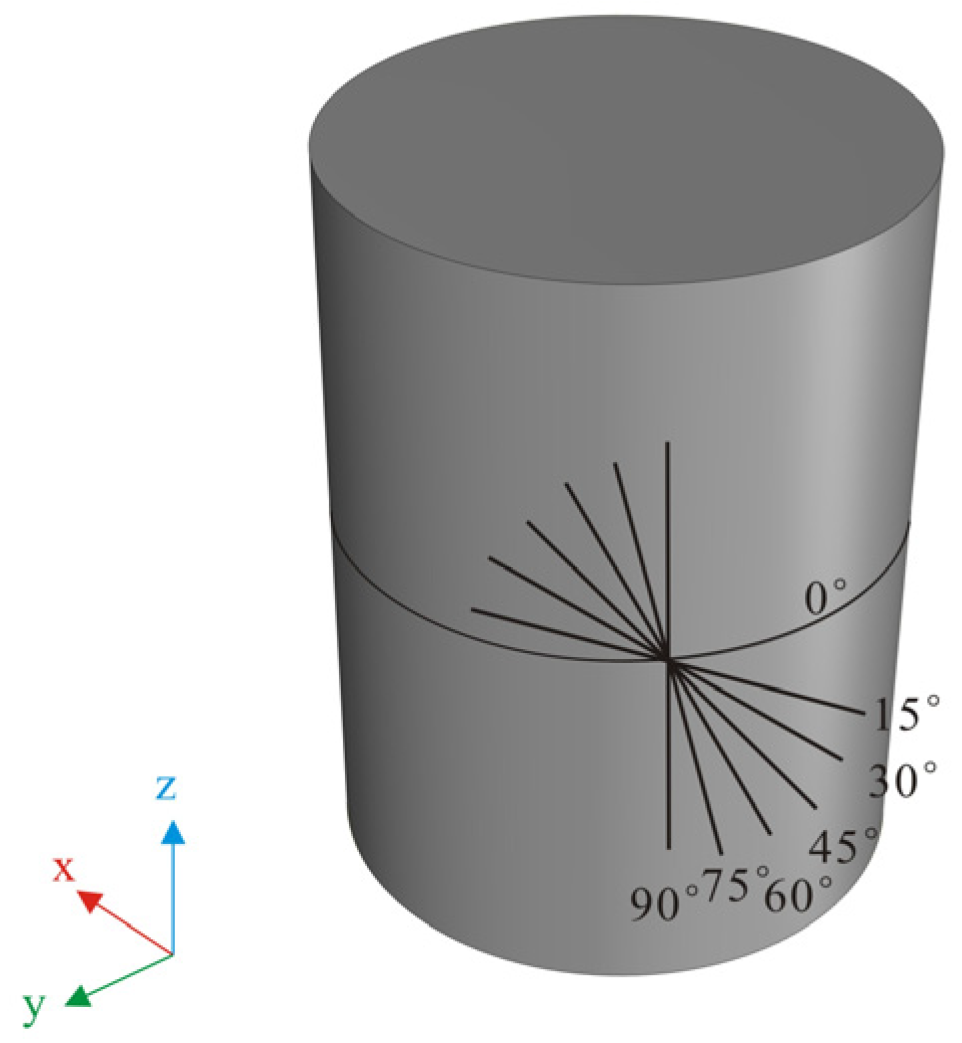
In exploring the impact of fracture angles on core resistivity response, a series of calculations were conducted by varying the fracture angle across different fracture widths. The dynamic shift in fracture angle is meticulously illustrated in Figure 6, offering a visual representation of the evolving characteristics. Accompanying this analysis, Figure 7 provides the potential distribution diagrams corresponding to various fracture angles, shedding light on the intricate relationship between geometry and resistivity response. Figure 8 showcases the calculated outcomes of core resistivity in response to changes in fracture angle, unveiling compelling insights into this phenomenon. Our analysis reveals a clear trend: as the fracture dip angle increases, core resistivity demonstrates a decreasing trend. Furthermore, as the fracture width expands, there is a corresponding decrease in core resistivity, albeit with a relatively modest range of change, aligning closely with the patterns observed in Figure 5. Delving deeper into the nuances of fracture angles, our findings unveil intriguing patterns. In fractures characterized by low angles (0–30°), variations in core resistivity remain minimal across different fracture widths, with decreases of less than 10%. Conversely, high-angle fractures (60–90°) exhibit a gradual stabilization in core resistivity reduction. Notably, the transition from low to high angles (30–60°) elicits the most substantial decrease in core resistivity, indicating heightened sensitivity of resistivity to changes in angle orientation. These findings underscore the intricate interplay between fracture characteristics and core resistivity dynamics, enriching our understanding of subsurface formations.

3.1.2. Core Resistivity Response Characteristics of Fracture Length

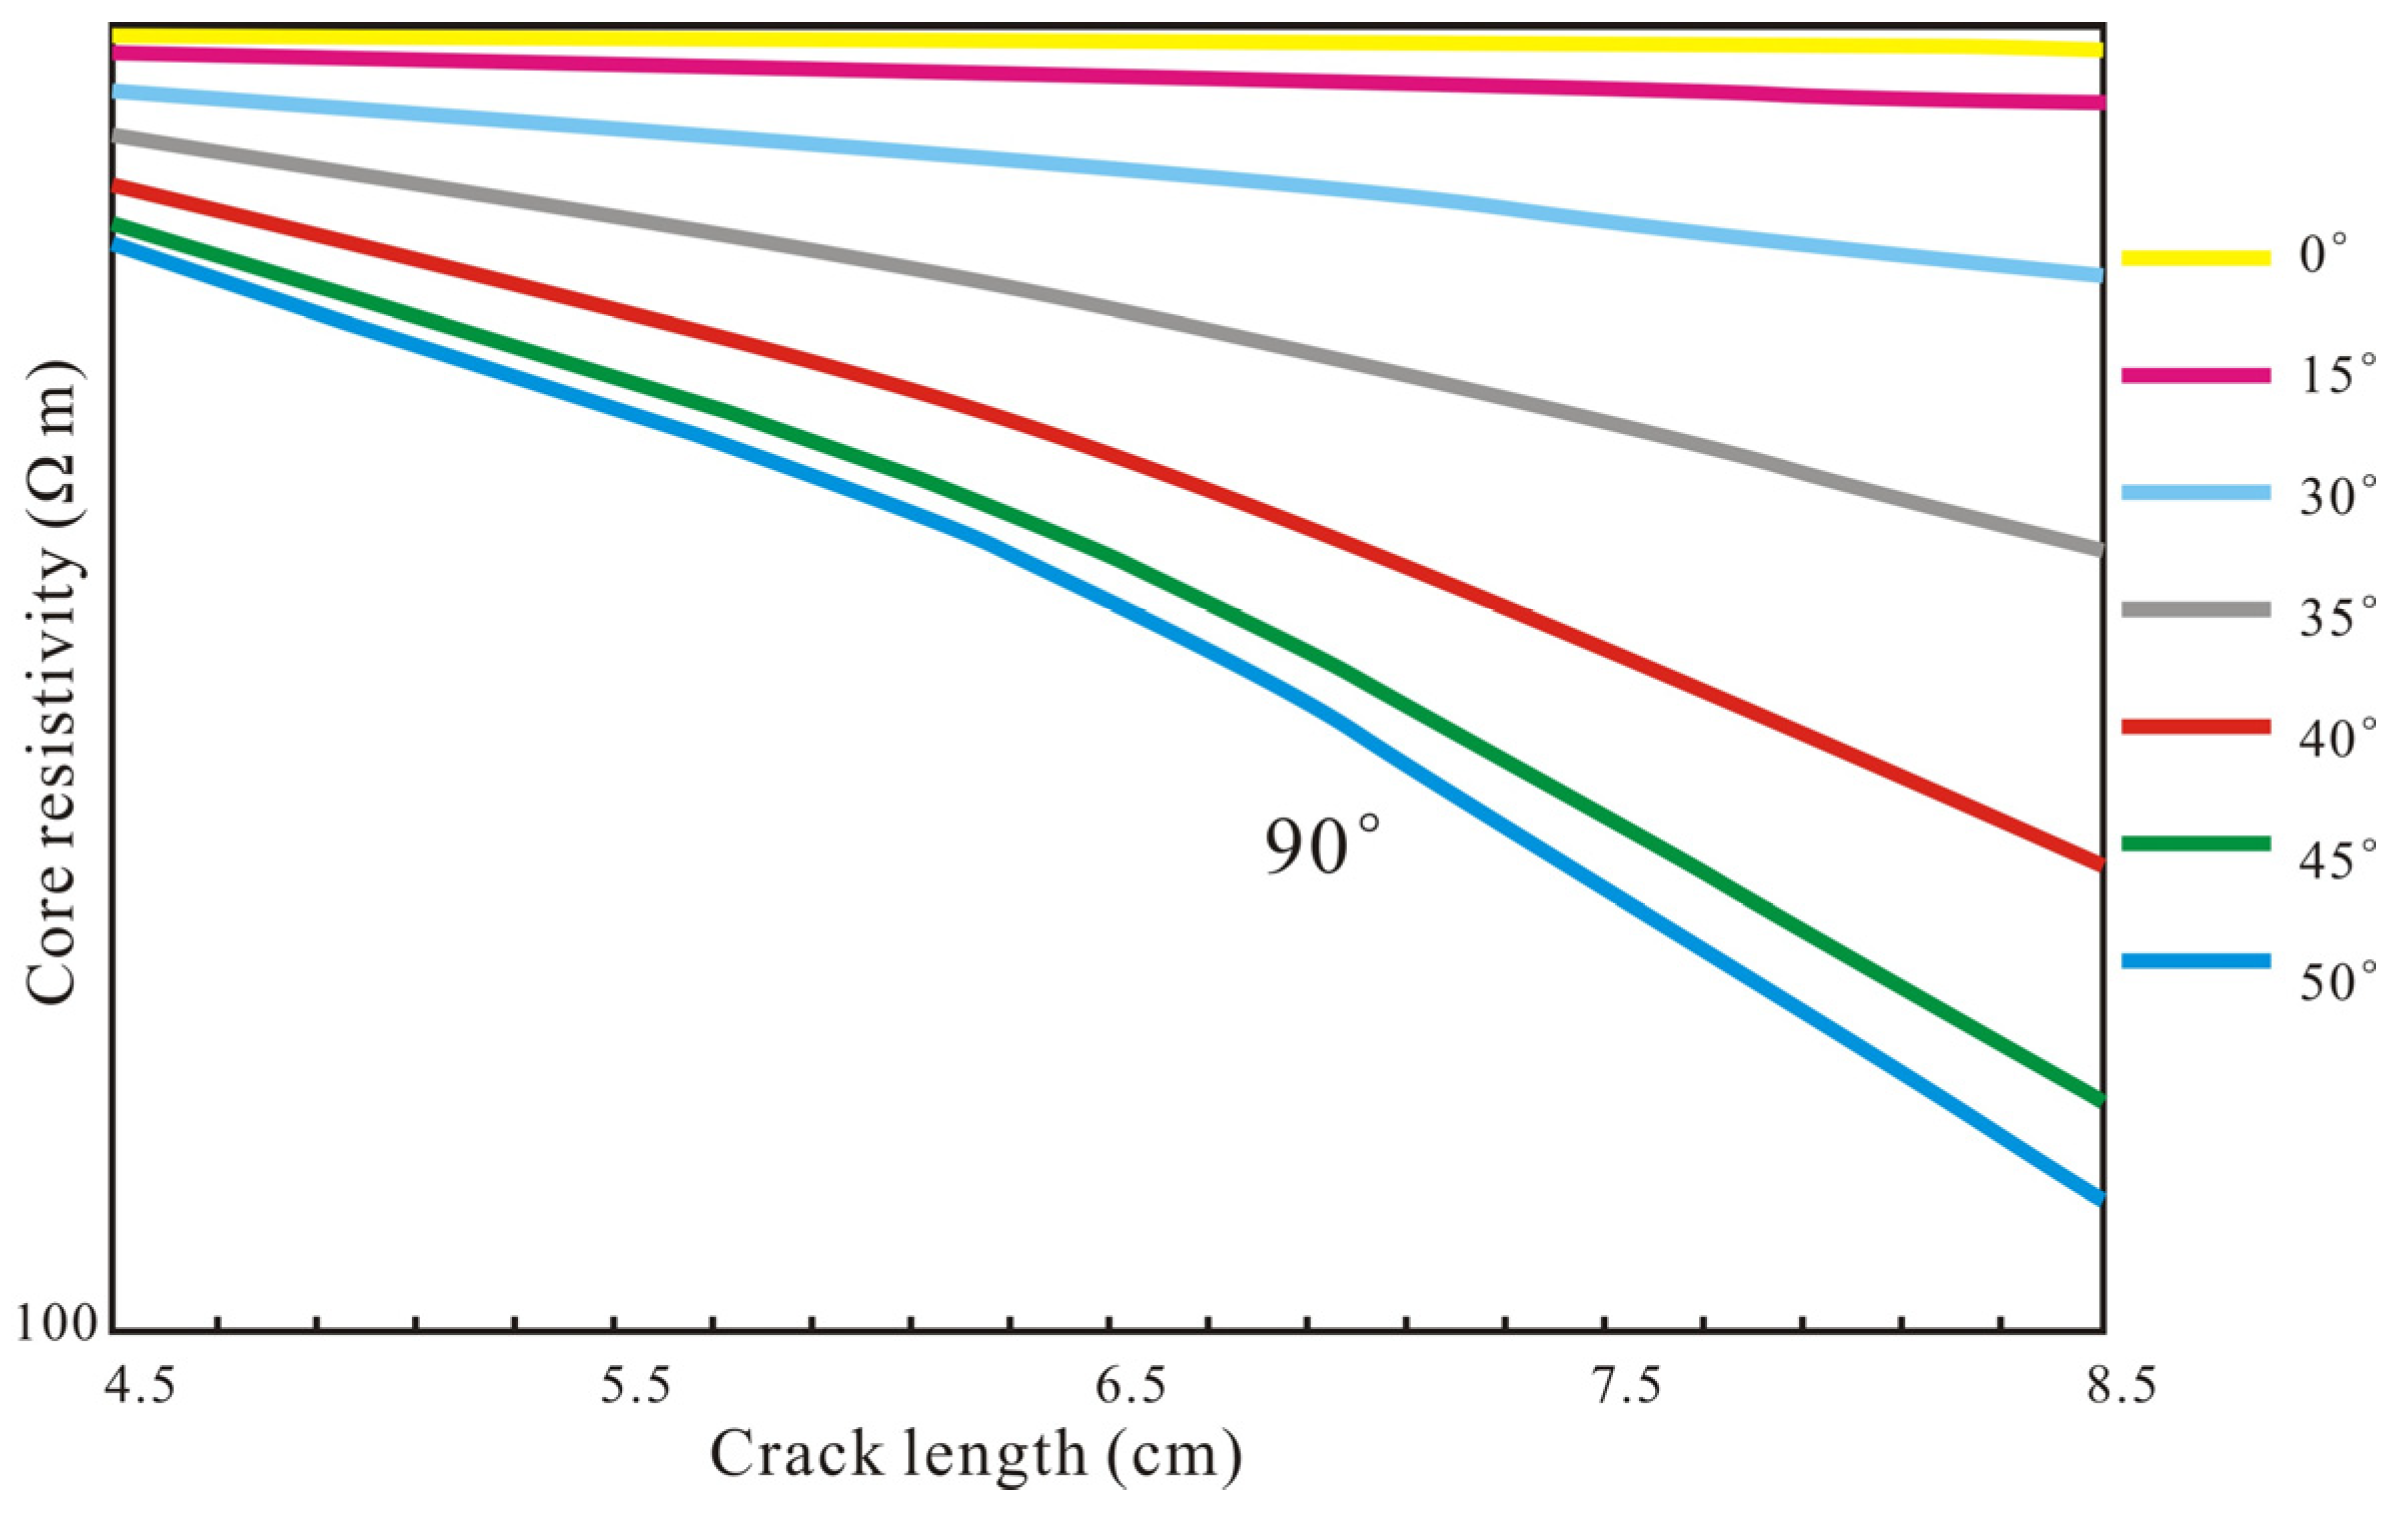
In addition to considering the width and angle of the fracture, it is also necessary to consider the influence of the length of the fracture on the core resistivity. In the basic model, the models with fracture lengths of 4.5 cm, 5.5 cm, 6.5 cm, 7.5 cm, and 8.5 cm are constructed, respectively. The results for resistivity changes are shown in Figure 9. The analysis shows that, with an increase in fracture length, the core resistivity decreases, but when the fracture angle is 0°, that is, when the horizontal fracture is changed, the length of the fracture has the least influence on the core resistivity. When the fracture angle is vertical (the fracture angle is 90°), the length of the fracture has the greatest influence on the core resistivity. With the increase in the fracture angle, the influence of the fracture length on the core resistivity gradually increases.

3.1.3. Core Resistivity Response Characteristics of Mud Resistivity

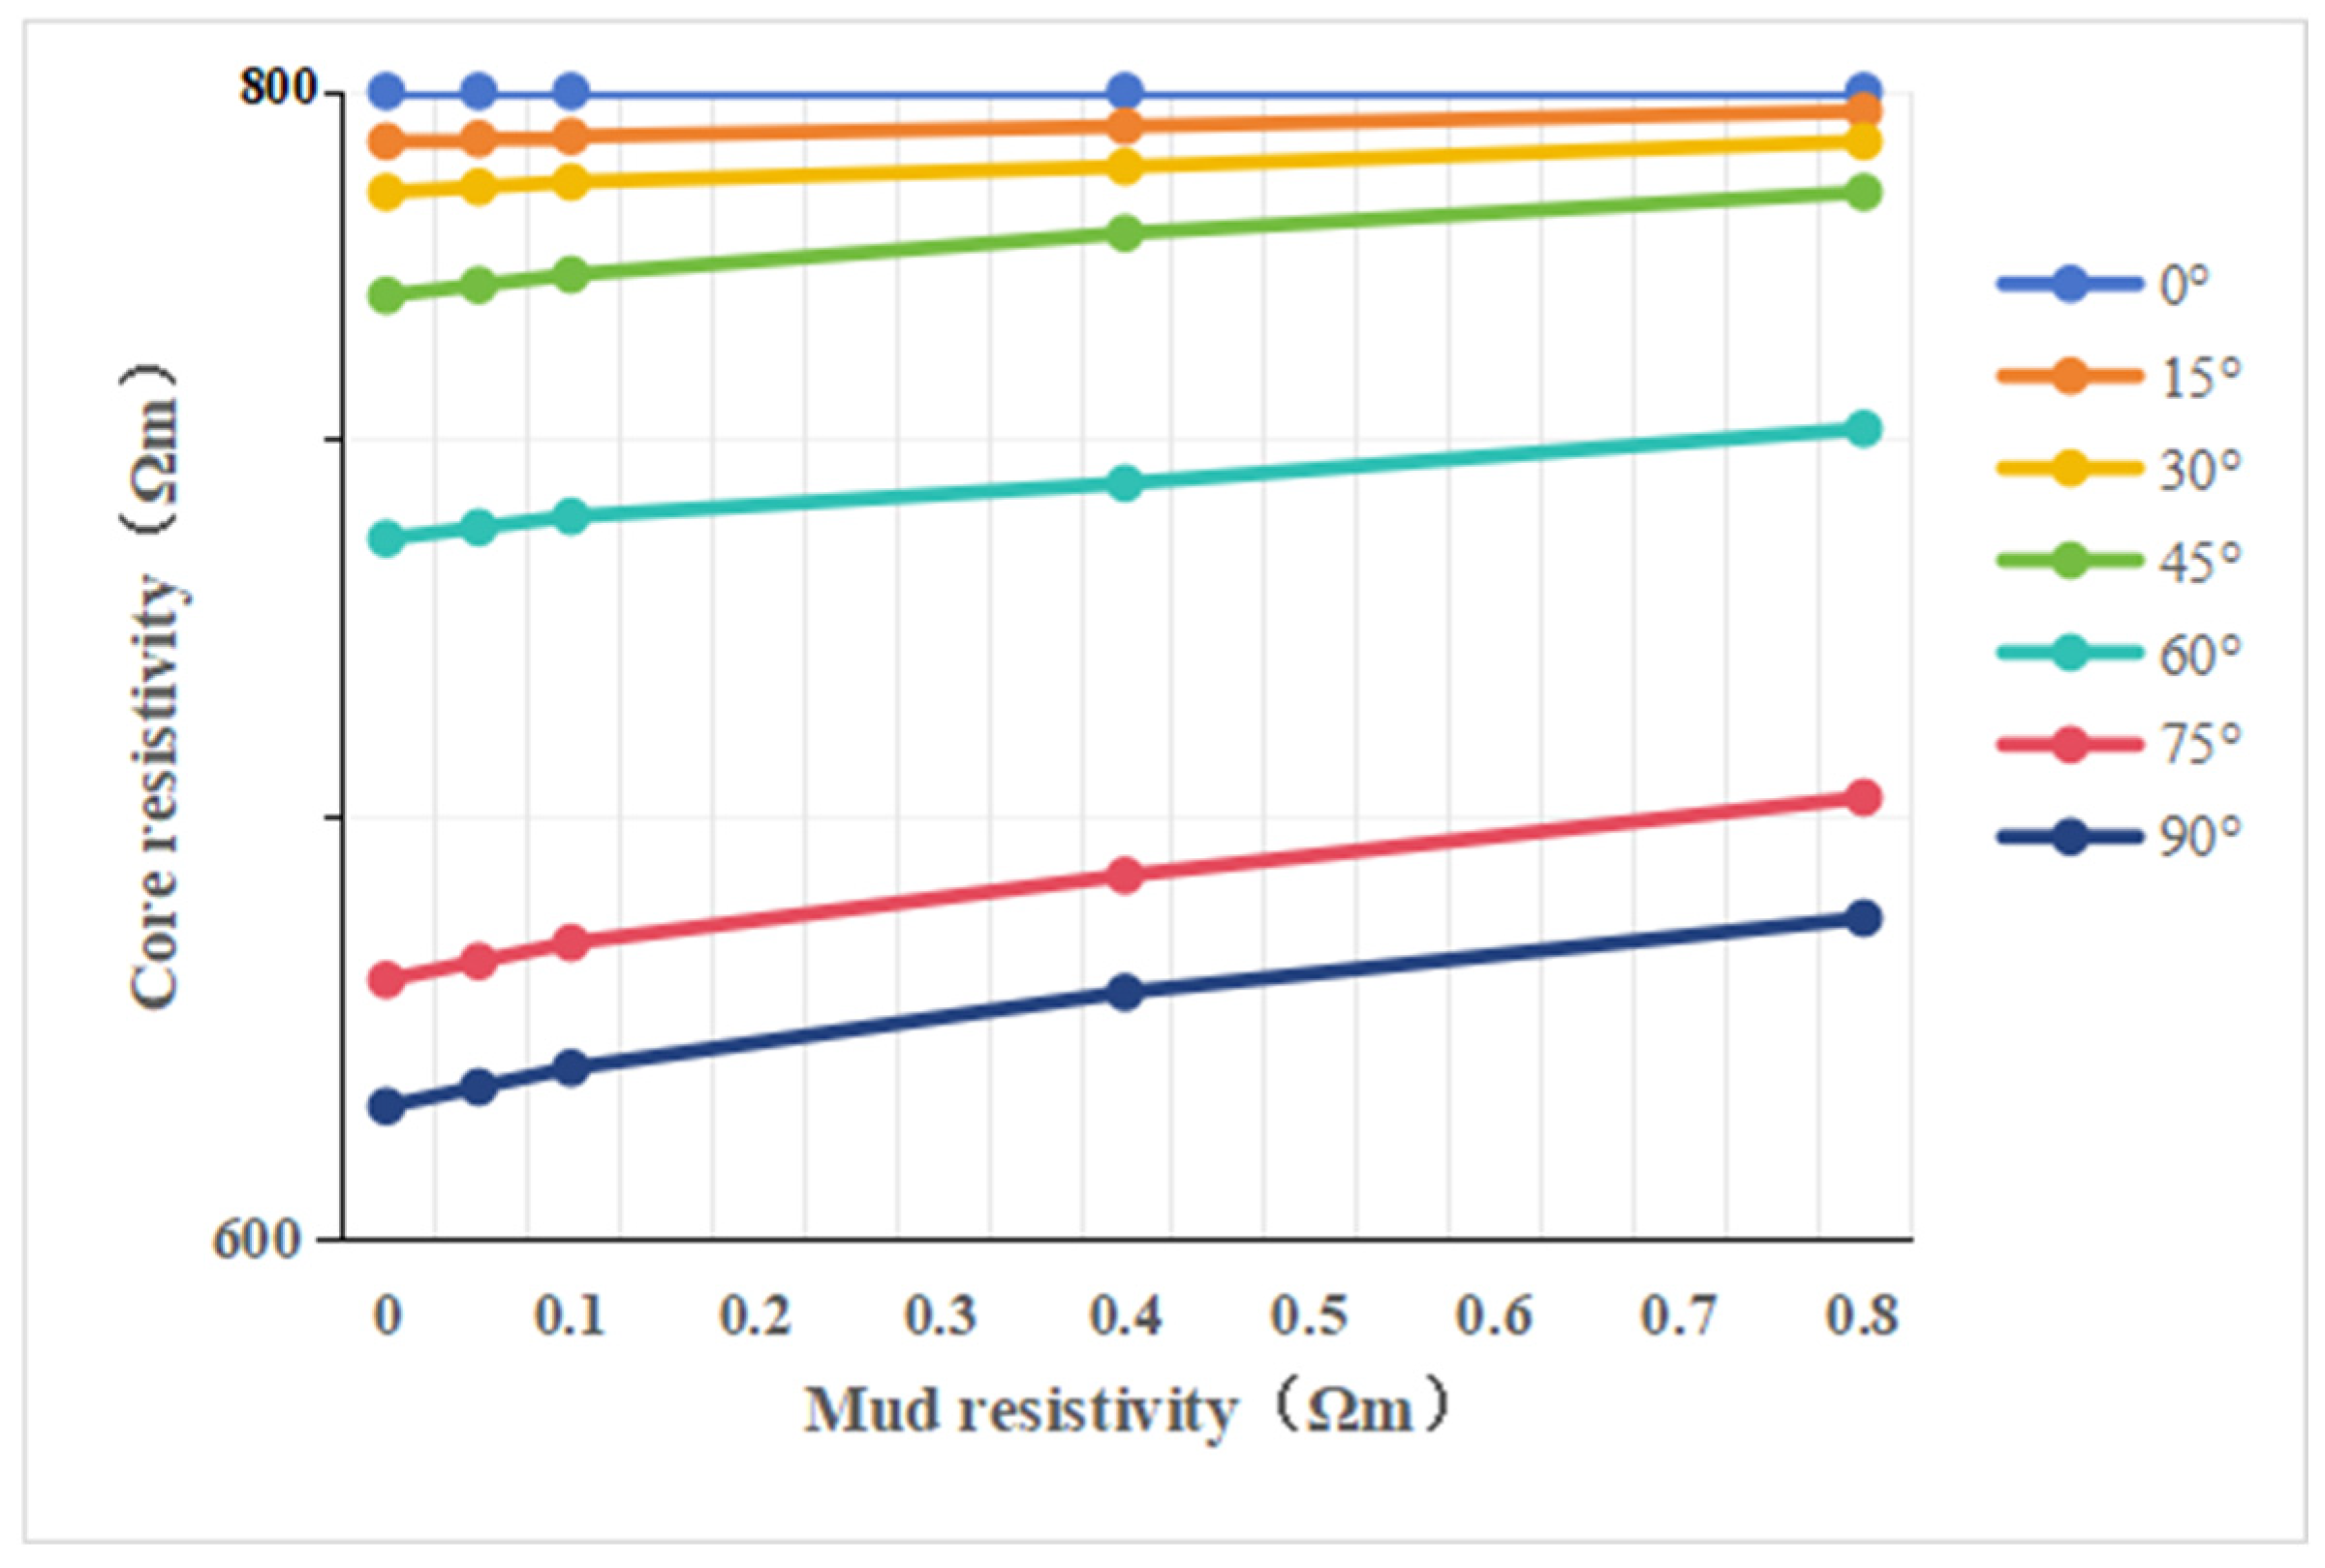
The influence of different mud types on core resistivity was also analyzed for mud types with different salinity. For fractures with different angles, the core resistivity response characteristics of mud resistivity are simulated by changing the mud resistivity at the fracture position, as shown in Figure 10. The results show that the resistivity of low-angle fractured cores is not sensitive to the change in mud resistivity. The increased fracture angle makes the core resistivity more sensitive to the mud resistivity. The resistivity of high-angle fractured cores increases significantly with the increase in mud resistivity. In the non-logarithmic scale diagram, it can be found that, the higher the fracture angle, the greater the degree of influence. The change in mud resistivity is not a simple linear change for the same angle of fracture.

3.2. Resistivity Response Mechanism of Complex Fracture Model

3.2.1. Core Resistivity Response Characteristics of Parallel Fractures

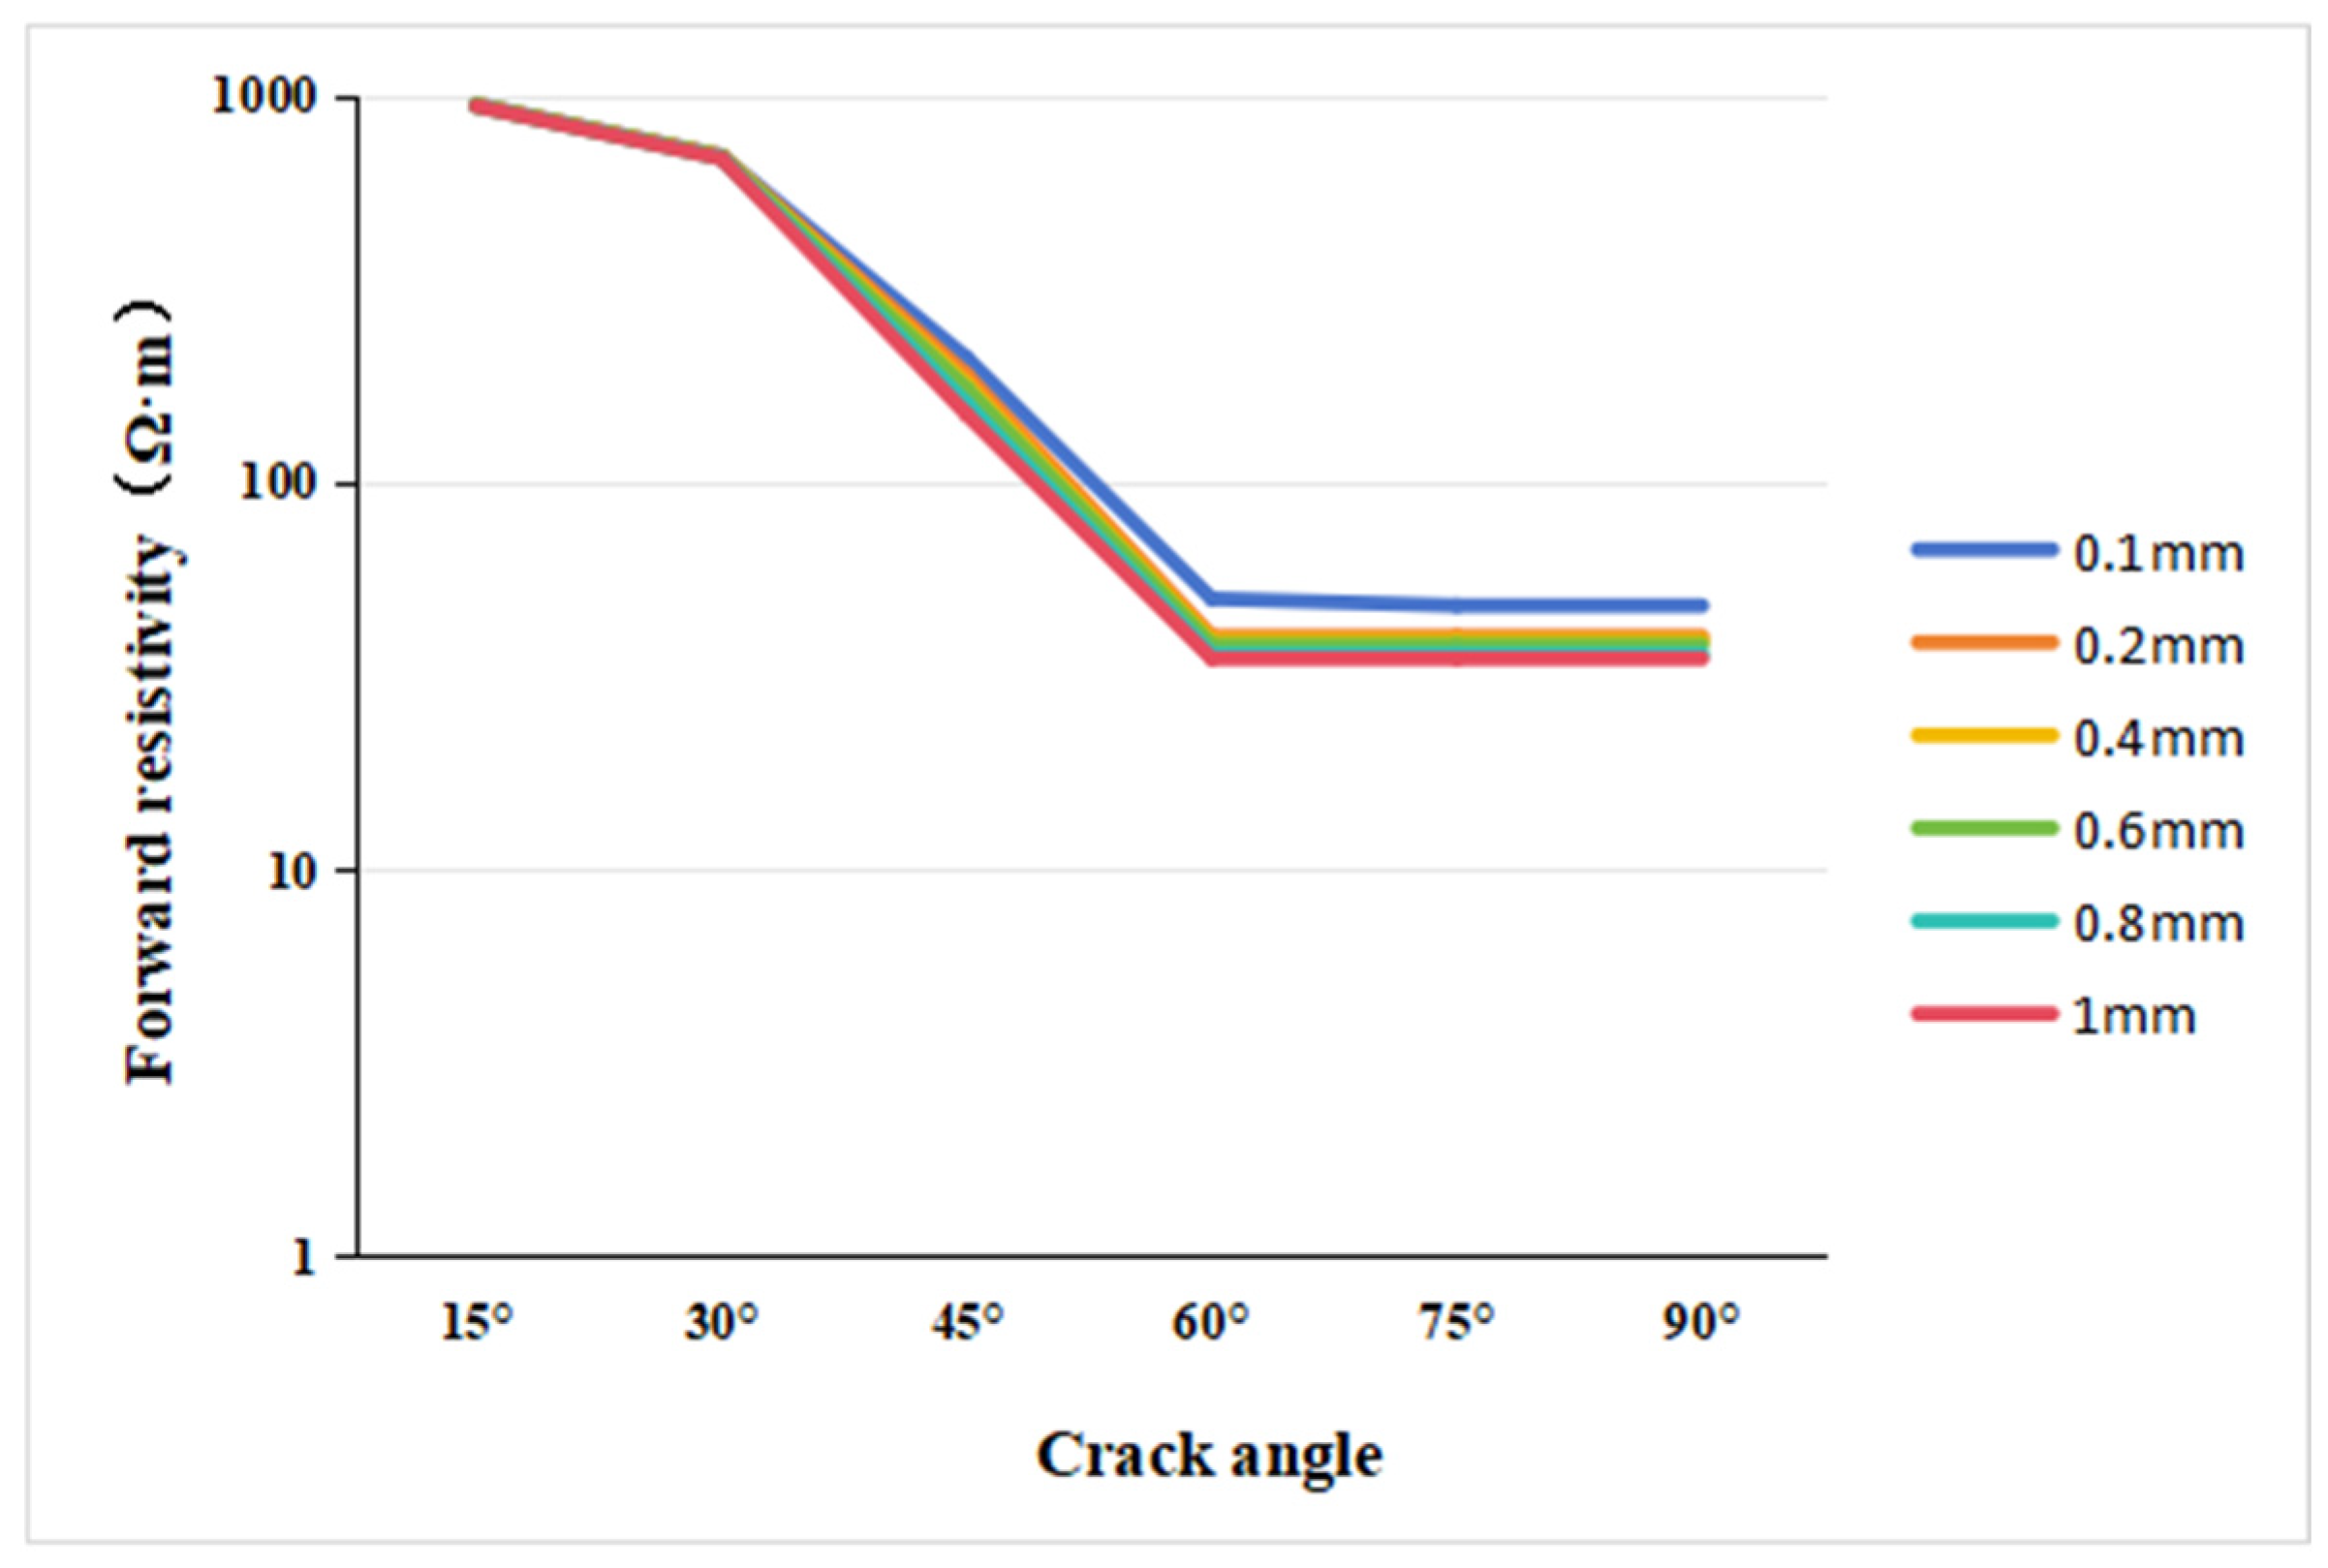
The initial simulation in our investigation addresses the complex fracture scenario involving two parallel fractures. Within this simulation, we systematically vary the dip angle of the fractures from 15° to 90°, with a step size of 15°. Notably, the dip angle is defined as the angle between the horizontal line and the upper crack. Readers can refer to Figure 6 and Figure 7, which show a schematic diagram of the seven dip angles. It is imperative to note that when the angle exceeds 90°, the crack assumes a symmetrical shape relative to the angle preceding 90°, thus warranting exclusive consideration of angles within 90°. Furthermore, the simulation encompasses a range of fracture widths, specifically 100 μm, 200 μm, 400 μm, 600 μm, 800 μm, and 1000 μm. The results are presented in Figure 11. Our analysis unveils a consistent decrease in core resistivity with increasing fracture angle. Notably, within the 30–60° interval of fracture dip angle, the core resistivity exhibits the most significant variation. Beyond a 60° angle, the resistivity demonstrates a tendency toward stabilization. Additionally, as fracture width increases, there is a discernible decrease in core resistivity, albeit with a minimal magnitude of change.

3.2.2. Core Resistivity Response Characteristics of Intersecting Fractures

For the simulation of cross cracks, the first is to consider different crack widths, fix one of the crack levels, and realize the simulation of mesh cracks by changing the angle between another crack and the middle crack. The calculation formula of resistivity is as follows:
R = U / J × S
However, considering that the complex seam is simulated in a two-dimensional case, that is, because the area  S  in Equation (9) does not exist, the coefficient  S  that does not exist needs to be calibrated. The calibration method adopted by  S  is to remove the crack, known potential, and resistance (the resistance is the established matrix resistivity); a certain current value can be obtained, and then the current value and the current density are divided, and the coefficient between the two is calculated, which is the coefficient to be calibrated. Combined with the matrix resistivity of 1000 Ωm in the simulation of this study, the calibrations of 0.001, 0.1, 10, and 1000 Ωm were carried out, and the calibration coefficient in a range was obtained (Table 1). It should be noted that the selection of this value is based on the resistivity of the mud filtrate and the resistivity of the matrix. This calibration method is a geometric simplification method. According to the cross-slit experiments at different angles, it is found that the change in the angle in the core is actually a reflection of the change in the volume of the fluid. Therefore, the coefficient can be used to simplify the volume change, and the purpose is to extract the resistivity calculation formula of the complex seam.
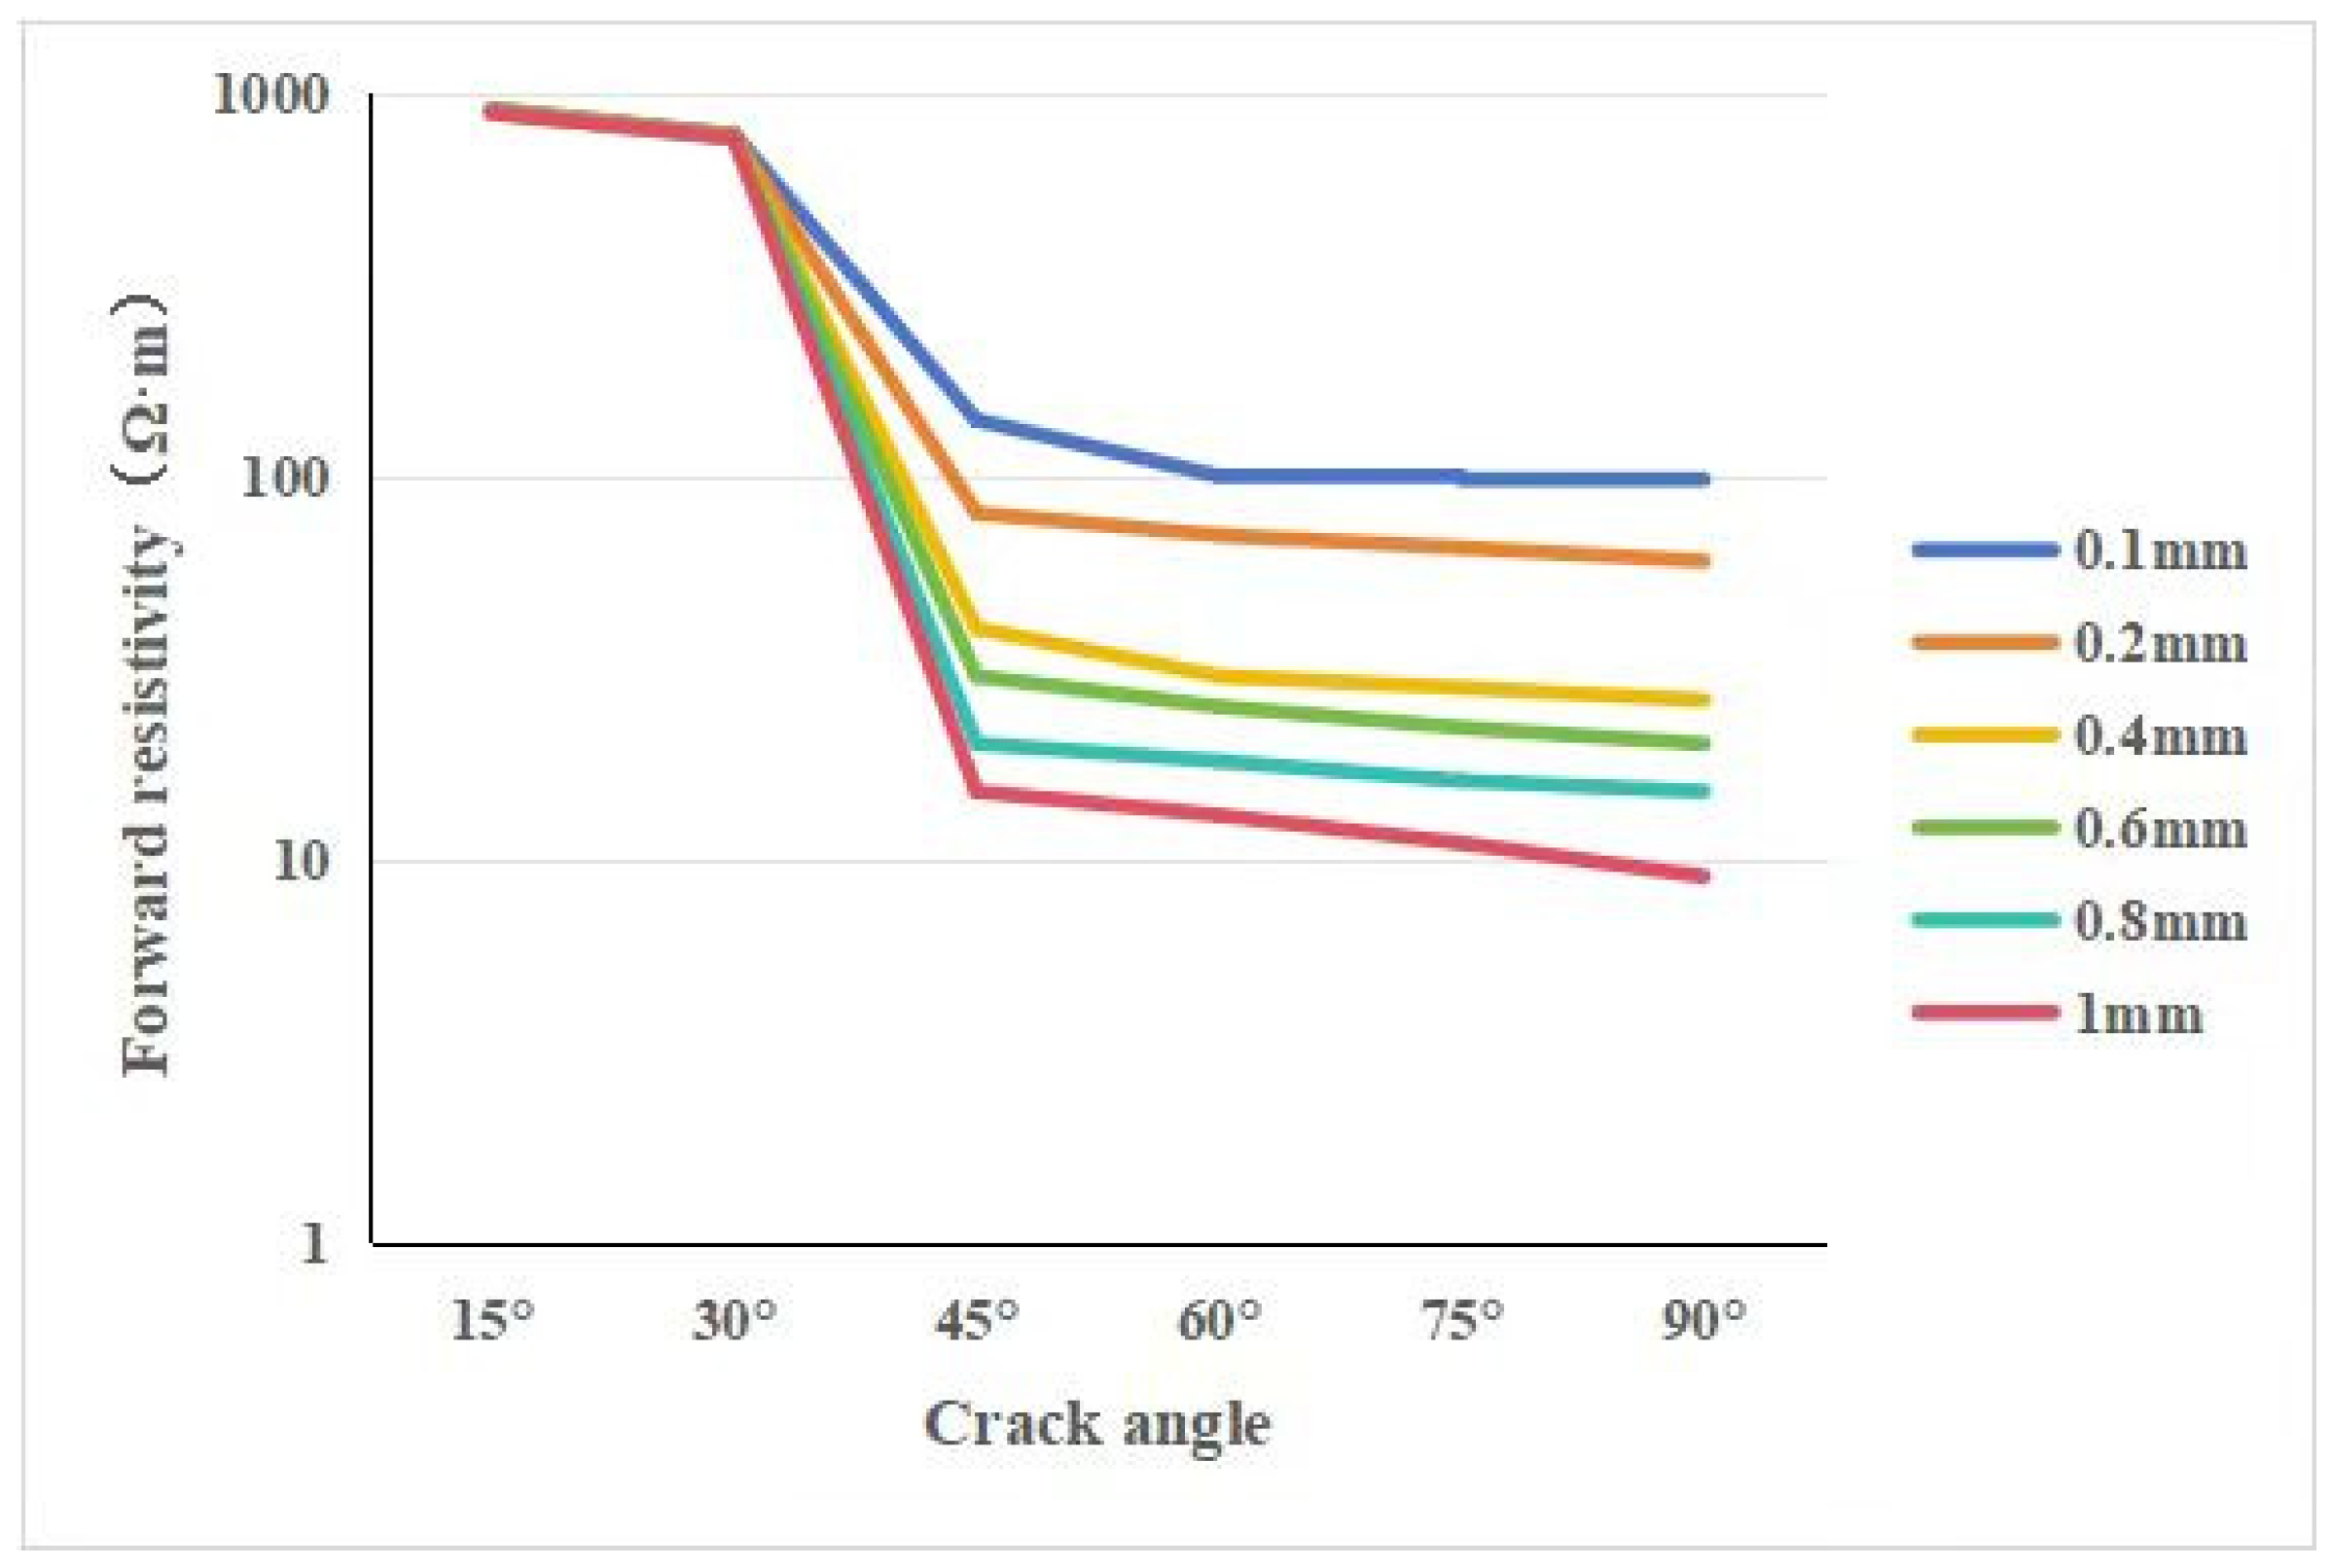
It can be determined that the calculation coefficient of the matrix resistivity of 1000 Ωm is 0.08, which can be substituted into Equation (9) to calculate the resistivity, and thus the relationship diagram, as shown in Figure 12, is obtained: as the angle increases, the core resistivity decreases. The attenuation amplitude of the core resistivity within the angle of less than 45° is significantly higher than that of the angle of more than 45°. The attenuation of the resistivity is the largest when the angle is between 30° and 45°. When the angle is greater than 75°, the attenuation of the core resistivity is the smallest. The core resistivity is the smallest for the same fracture width when the angle is 90°. As the fracture width increases, the core resistivity decreases relatively.
This study also simulated a given initial dip angle of a crack and then changed the angle of the two cracks. Because the simulated matrix resistivity does not change, the calibrated coefficient in Table 1 can still be used. In this simulation, the initial inclination angle is 30° and 60°, the corresponding angle is 15–165°, with 15° as the change step, and the crack width is 100 μm, 200 μm, 400 μm, 600 μm, 800 μm, and 1000 μm. The matrix resistivity is still 1000 Ωm, and the mud filtrate resistivity is 0.1 Ωm. The simulation results are shown in Figure 13 when the initial inclination angles are 30° and 60°. For the initial dip angle of 30° (Figure 13a), when the angle is between 15° and 105°, the core resistivity changes with 60° as the symmetry center. When the angle is greater than 75°, the core resistivity continues to increase with the increase in the angle, and between 105° and 120°, the core resistivity increases sharply. For the initial dip angle of 60° (Figure 13b), the core resistivity shows obvious fluctuation changes, and the core resistivity changes in the angle range of 75–90° and 150–165° are the most obvious compared with other angles. The change in core resistivity in the range of 75–165° is symmetrical. Similarly, with the increase in fracture width, the change range of core resistivity decreases. It should be noted that when the initial dip angle is 60°, the resistivity curve of the core resistivity with the angle is symmetrical when the angle is 75–160°. Then, if one of the two fractures is vertical, the resistivity curve changes with the angle of 90° as the symmetry center. As the angle increases, the core resistivity increases first and then decreases, showing a symmetrical change.
In the realm of core resistivity analysis, the presence of a crack introduces an angle parameter ranging from 0 to 90°. Notably, when considering a uniform mud filtrate composition, core resistivity exhibits a gradual decline with increasing crack angle. This observed trend holds true for both single fractures and parallel fractures, highlighting a consistent behavior across varying fracture configurations. However, the dynamics shift when examining cross fractures, where core resistivity modulation is contingent upon the geometric relationship between the two fractures. Specifically, a notable decrease in core resistivity is observed in scenarios featuring high-angle fractures on both planes. Furthermore, when the sum of the dip angles of the two fractures totals less than 180°, a distinct pattern emerges: the core resistivity diminishes as the combined dip angles increase. This intricate interplay underscores the nuanced influence of fracture orientation on core resistivity responses, shedding light on the complex interactions within subsurface formations and their electrical properties.

4. Discussion

4.1. The Difference between Core Resistivity and Logging Resistivity

There is a difference between the response of core resistivity and the response of actual logging resistivity. The measurement angle of core resistivity is 90° different from the logging angle. As shown in Figure 14, the logging data correspond to the radial direction (Figure 14a), while the core resistivity is vertical (Figure 14b); that is, there is a difference of 90° between the simulation results and the response of logging data. For the response of logging data, taking a single fracture as an example, the resistivity response increases with the increase in fracture angle, and the corresponding core resistivity is a low-angle fracture, which is also consistent [33]. For the solution of fracture angle, many scholars use dual laterolog data. The research results show that for a single fracture, this method can distinguish the angle categories of fractures without considering mud invasion [21,26]. However, there are multiple solutions for multiple cracks, especially when the angle between the two cracks is large. In the actual logging data, the fractured reservoir is obviously affected by the invasion. Therefore, when using the dual laterolog data to calculate the fracture angle, it is also necessary to analyze whether the formation is invaded. Considering the gap between drilling time and logging time, the larger the porosity is, the more developed the fracture is, the faster the invasion is, the deeper the depth is, and the more obviously the resistivity logging formation is invaded.

4.2. The Core Resistivity Response of The Cross Fracture Is Affected by the Background Value of the Matrix and the Resistivity of the Mud

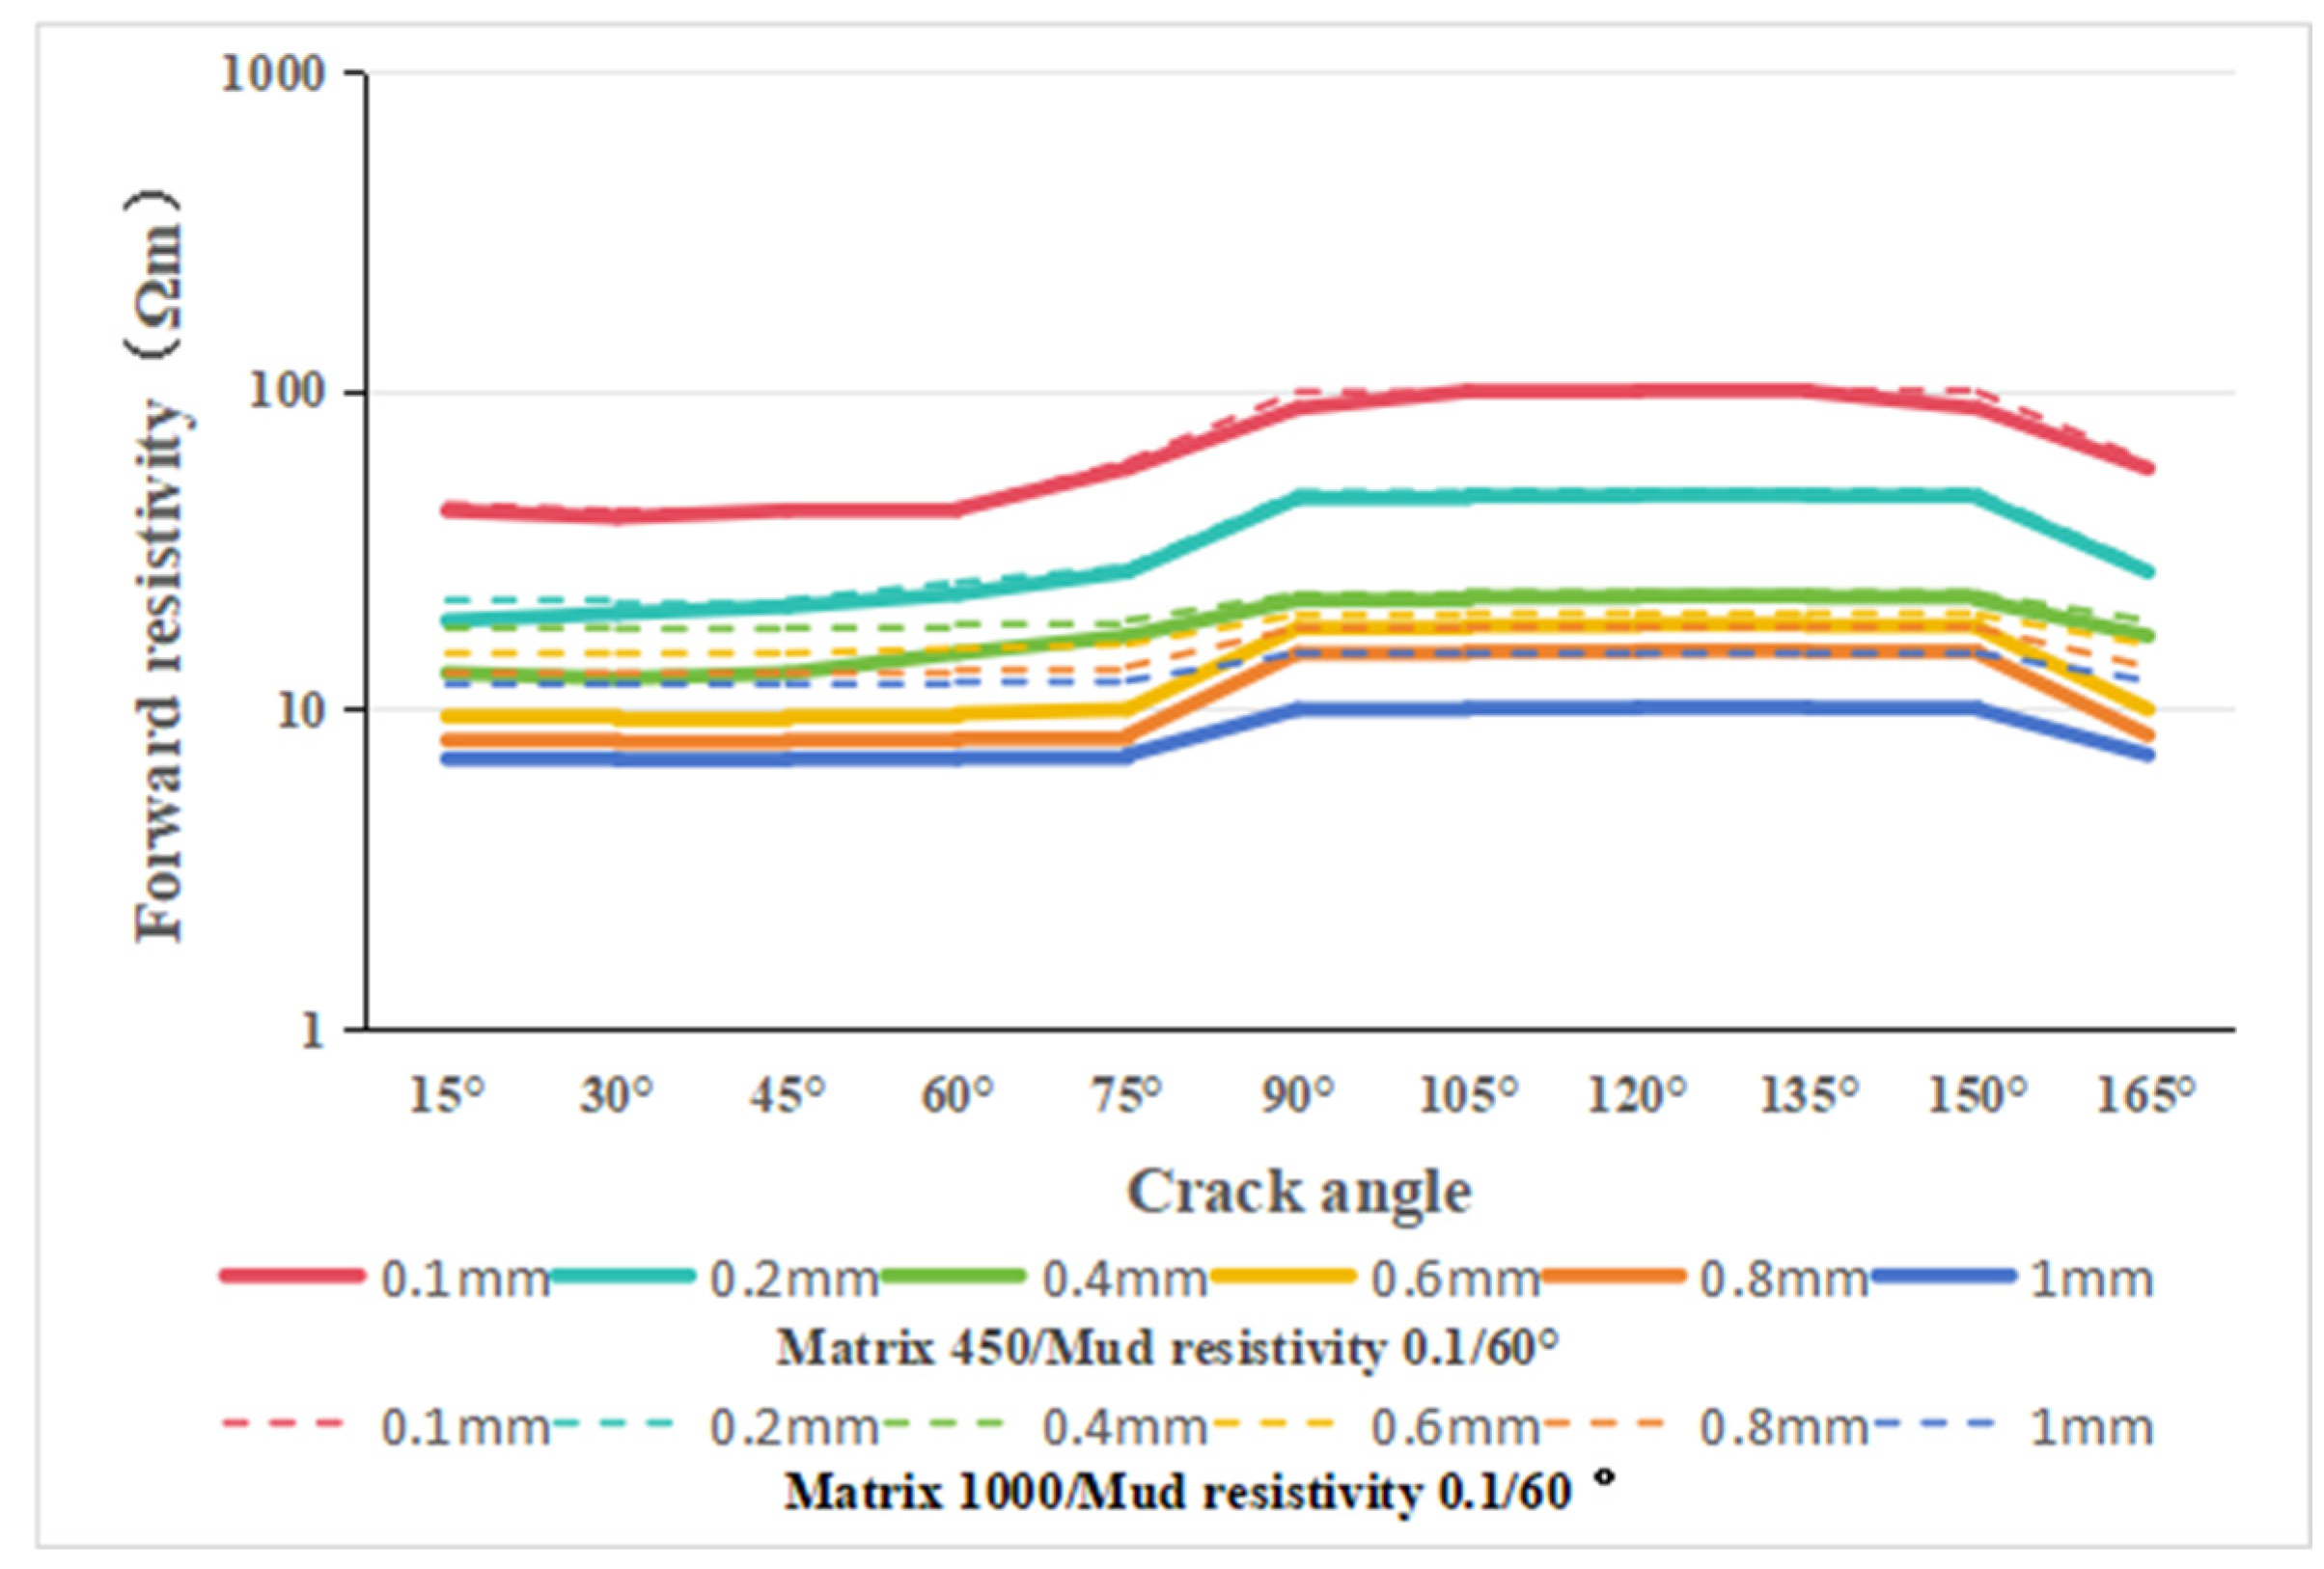
For complex reservoirs, there are also differences in rock mineral content. For different lithologies, resistivity logging response will also be affected. Therefore, it is considered to be studied by changing the matrix resistivity in the simulation. Based on the mesh fracture model with an initial dip angle of 60°, the matrix resistivity of 1000 Ωm is changed to the matrix resistivity of 450 Ωm, and then the simulation is carried out to explore the response law of the fracture angle and the fracture width to the core resistivity under the change in the matrix resistivity. The results are shown in Figure 15. Through comparative analysis, the simulation results of the matrix resistivity of 450 Ωm are the same as those of the matrix resistivity of 1000 Ωm, but there is a numerical difference in the measured core resistivity in the two cases. The difference in core resistivity in different angle fractures is different. For the same angle, the larger the fracture width, the smaller the influence of matrix resistivity change on core resistivity. On the contrary, the smaller the fracture width, the more sensitive to the change in matrix resistivity. Therefore, when using dual laterolog resistivity to solve the fracture angle, in addition to considering the influence of invasion, it is also necessary to consider the lithology of the reservoir. The conductivity difference of different lithologies will also affect the reliability of the calculation results.
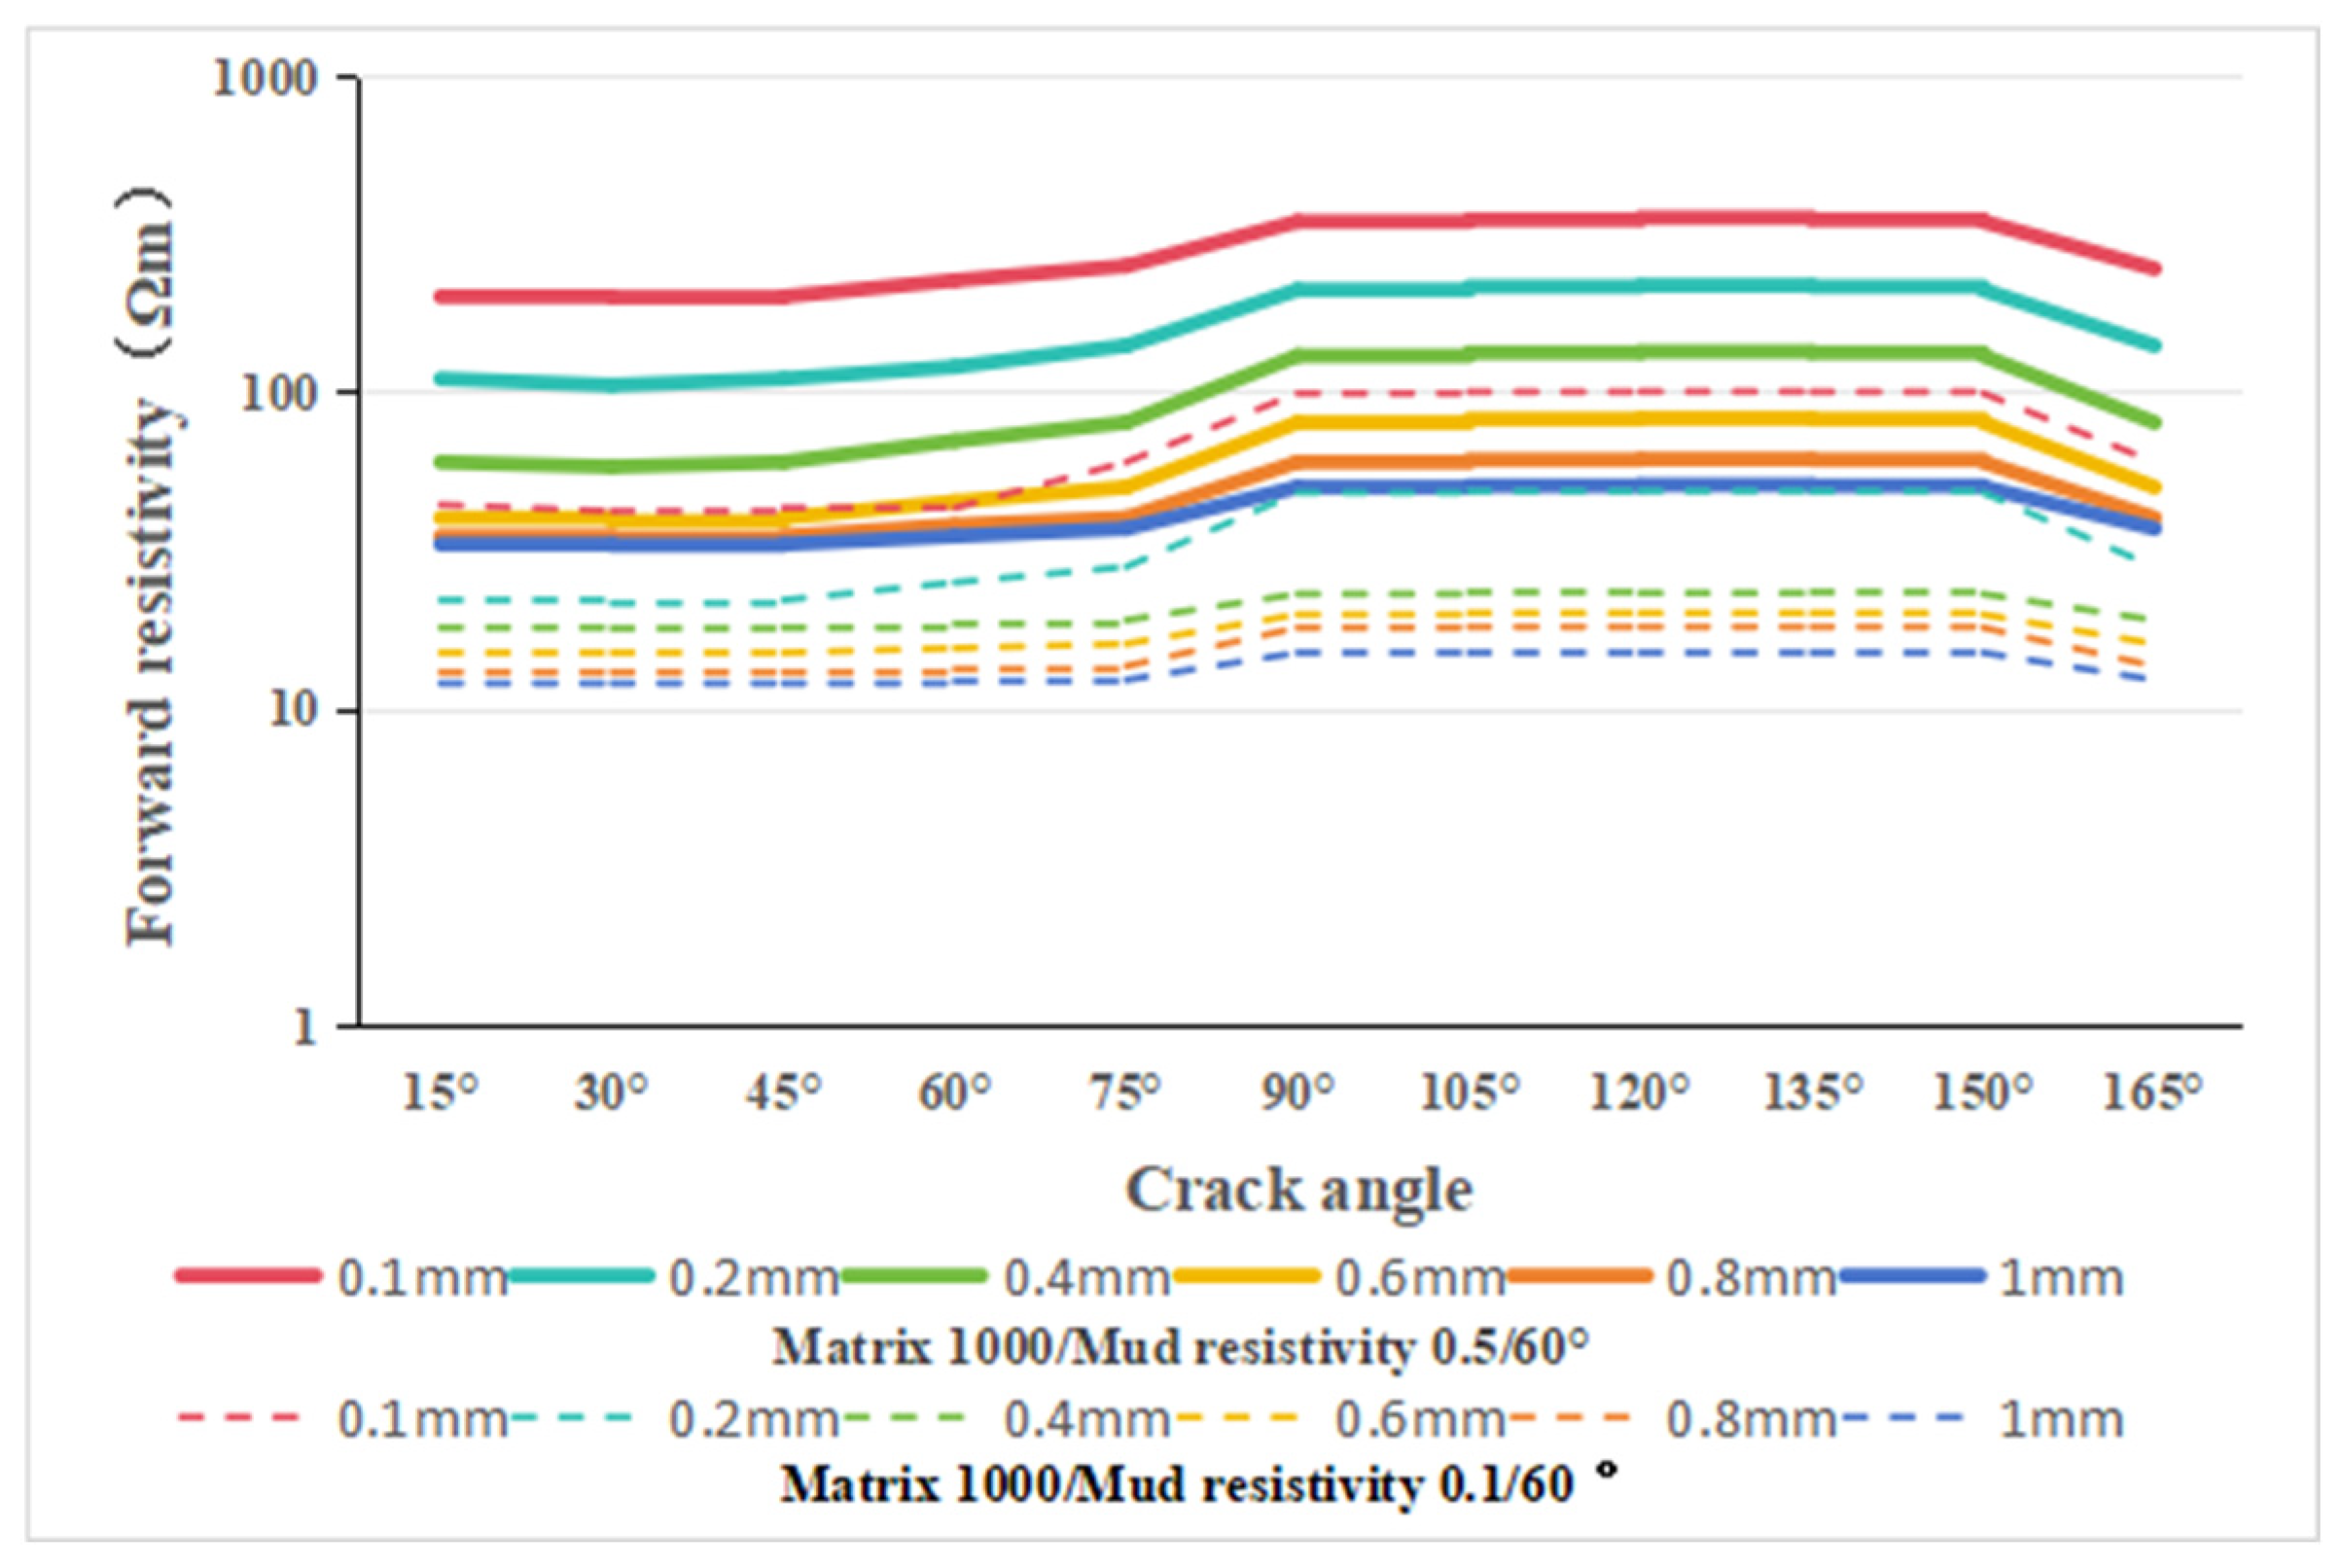
Similarly, the resistivity of the mud will also have an impact on the measurement of core resistivity. For the mesh fracture model with an initial dip angle of 60°, the resistivity of the set 0.1 Ωm mud is changed to 0.5 Ωm, and the mesh fracture model is explored. In the case of changes in mud resistivity, the response of fracture angle and fracture width changes the core resistivity. Considering that the matrix resistivity of this simulation is 1000 Ωm, the resistivity calculation coefficient of 0.08 calibrated by the previous matrix 1000 Ωm can be used to calculate the resistivity of this simulation. The results obtained are compared with the simulation results of the mesh fracture with the initial dip angle of 60° and the mud resistivity of 0.1 Ωm (Figure 16). The overall law and change trend is the same as that of the mud resistivity of 0.1 Ωm, without any change, and the core resistivity value increases in multiples; when the mud resistivity increases from 0.1 Ωm to 0.5 Ωm, the corresponding core resistivity increases with the increase in fracture width, but it is not five times, which is different due to the change in fracture angle. The influence of mud resistivity change on core resistivity has a greater relationship with fracture width and a smaller relationship with fracture angle.

4.3. The Contribution of This Study and the Limitations of the Research

This work studies and summarizes the influence of a single fracture and two fractures on core resistivity when the fracture angle, width, and length change. Compared with previous studies, most research has been conducted from the perspective of logging, and analysis of the core is relatively rare.
Compared with previous work, this research studies the factors that can affect the resistivity of fractured cores, especially in the case of two fractures. The results also show that when there is only one fracture, the dual laterolog resistivity can be used to calculate the fracture angle, but when there are two non-parallel fractures, the traditional calculation method is not applicable. This study reveals this phenomenon through the results of numerical simulation. The same resistivity will correspond to different fracture angles, and it is difficult to determine the specific occurrence of the two fractures. At the same time, for different lithologies, the fracture angle is demonstrated by changing the resistivity of the matrix, which also shows the complexity of the fractured reservoir and needs to be simulated in combination with the actual work area background.
The work of this study also provides a theoretical basis for the interpretation of the oilfield site. For the fractured reservoir, the change in resistivity will be affected by the fracture. The results show that the angle of the fracture has the most obvious influence on the core resistivity, and the fracture angle also has an effect on the reservoir permeability. The results of this study provide more possibilities for the logging interpretation of fractured reservoirs and a further accurate understanding of resistivity logging. It is also helpful for saturation evaluation. After the fracture information is clarified, the correction model of the saturation calculation method can be determined according to the actual situation. The influence of fractures on the cementation index or the coefficient in the conductivity efficiency model can be further studied to improve the accuracy of reservoir evaluation and provide a theoretical basis and model support for the formulation of subsequent development plans.
The work of Reference [20] is aimed at the measurement of core resistivity, but it is aimed at the influence of the measurement method on resistivity response. In the study, the resistivity measurement of different fractured cores is carried out using the same method, aiming to reveal the influence of fractures on core resistivity. However, for the form of numerical simulation and the content of the study, the intersection point of the cross fracture is located in the center of the fracture, which is different from the corresponding situation of the actual logging data measurement. Therefore, the trend is usually consistent in the application of the research conclusion, and additional correction is needed. In the face of the actual data of the fracture development zone, there will be differences between the quantitative calculation results and the actual data. The research is mainly based on theoretical work and explores the influence of fracture parameters on core resistivity. In practical work, resistivity logging is affected by many factors, which is also supplemented in the introduction. At present, the fractured reservoir is extremely complex, and it is difficult to link the two. With the development and maturity of digital core technology, the characterization of fractures will gradually be refined [4,34].

5. Recommendations

For the actual field operation, the research results of this paper prove that it is feasible to use the dual laterolog resistivity to calculate the fracture angle for a single fracture, but for two fractures, there will be multiple solutions, which also shows that the fieldwork needs to consider the number of fractures when calculating the fracture angle, rather than calculating the dip angle only by resistivity logging. The results of this study can also provide suggestions for on-site work:
  • For fractured reservoirs, especially igneous reservoirs, imaging logging is necessary because when the fractures are crossed and irregular, using the resistivity method to determine the fracture occurrence is unreliable, and there are multiple solutions. At this time, imaging logging can be used to solve the fracture parameters finely, which provides more reliable data support for the subsequent calculation of permeability and saturation.
  • The discussion part of Reference [6] reveals the influence of the invasion phenomenon on resistivity measurement, and the fractured reservoir is more obviously affected by the invasion. In order to ensure the reliability of resistivity logging response value, the interval between drilling time and logging time should be shortened as much as possible.
  • The calculation of permeability can be corrected by referring to the angle of fracture, and the permeability model can be corrected according to the actual working area and the research results of this study, which can improve the reliability of reservoir evaluation.

6. Conclusions

This study used the finite element method to conduct numerical simulations of core resistivity responses in single-crack and complex-crack configurations. Using full-diameter cores containing cracks as models, we comprehensively considered various parameters related to the cracks and subsurface formations. Our results demonstrate that the inclination angle, width, and length significantly affect core resistivity for single cracks. An increase in crack angle under typical background values of resistivity and mud filtration leads to a decrease in core resistivity, whereas increasing crack width and length has the opposite effect. Moreover, there is a 90° difference between core resistivity and resistivity logging response, whereby an increase in fracture angle corresponds to a decrease in core resistivity but an increase in resistivity logging response. When two cracks are parallel for complex fractures, the pattern of core resistivity change mirrors that of a single crack. However, in cross fractures, the position of the two cracks plays a more prominent role than crack width and length in determining core resistivity. Calculating the crack angle using bilateral resistivity may lead to polytropic results, making it challenging to accurately determine the crack angle. Additionally, the resistivity response to varying lithology and mud filtrate is nonlinearly correlated with fracture production, necessitating the integration of fracture parameterization with actual logging responses to account for different geological backgrounds. The research results of this study show the influence of complex fractures on resistivity logging results and prove that, for a single fracture, the dual laterolog method can be used to calculate the fracture angle. At the same time, it shows that the traditional method has multiple solutions when calculating the angle of cross fractures, which provides a new idea for field interpretation in the face of abnormal resistivity changes. Our research provides a reference and theoretical basis for interpreting hydrocarbon content in fractured reservoirs based on logging data.

Author Contributions

Conceptualization, H.Z. and Z.Z.; methodology, H.Z., Z.Z. and S.F.; software, S.F.; validation, J.G. and H.Z.; investigation, H.Z. and S.F.; resources, Z.Z. and S.F.; data curation, H.Z. and C.W.; writing—original draft preparation, H.Z.; writing—review and editing, H.Z. and Z.Z.; supervision, Z.Z.; project administration, Z.Z.; funding acquisition, Z.Z. and J.G. All authors have read and agreed to the published version of the manuscript.

Funding

This work was financially sponsored by the Open Fund of Key Laboratory of Exploration Technologies for Oil and Gas Resources, Ministry of Education (No. K2023–02).

Data Availability Statement

Data are contained within the article.

Acknowledgments

The authors would also like to thank the anonymous reviewers for their valuable comments and suggestions. The data of the figures and tables in this paper can be obtained by contacting the corresponding author.

Conflicts of Interest

The authors declare no conflicts of interest.

References

  1. Lee, M.W.; Collett, T.S. Gas hydrate saturations estimated from fractured reservoir at Site NGHP-01-10, Krishna-Godavari Basin, India. J. Geophys. Res. Solid Earth 2009, 114. [Google Scholar] [CrossRef]
  2. Lai, J.; Wang, G. Fractal analysis of tight gas sandstones using high-pressure mercury intrusion techniques. J. Nat. Gas Sci. Eng. 2015, 24, 185–196. [Google Scholar] [CrossRef]
  3. Li, P.; Zheng, M.; Bi, H.; Wu, S.; Wang, X. Pore throat structure and fractal characteristics of tight oil sandstone: A case study in the Ordos Basin, China. J. Pet. Sci. Eng. 2017, 149, 665–674. [Google Scholar] [CrossRef]
  4. Cai, J.; Wei, W.; Hu, X.; Wood, D.A. Electrical conductivity models in saturated porous media: A review. Earth-Sci. Rev. 2017, 171, 419–433. [Google Scholar] [CrossRef]
  5. Wang, G.; Carr, T.R. Organic-rich Marcellus Shale lithofacies modeling and distribution pattern analysis in the Appalachian Basin. AAPG Bull. 2013, 97, 2173–2205. [Google Scholar] [CrossRef]
  6. Zhao, Q.; Guo, J.; Zhang, Z. A method for judging the effectiveness of complex tight gas reservoirs based on geophysical logging data and using the L block of the Ordos Basin as a case study. Processes 2023, 11, 2195. [Google Scholar] [CrossRef]
  7. Li, M.; Zhang, C. An Improved Method to Accurately Estimate TOC of Shale Reservoirs and Coal-Measures. Energies 2023, 16, 2905. [Google Scholar] [CrossRef]
  8. Chu, H.; Liao, X.; Chen, Z.; Zhao, X.; Liu, W.; Zou, J. Pressure transient analysis in fractured reservoirs with poorly connected fractures. J. Nat. Gas Sci. Eng. 2019, 67, 30–42. [Google Scholar] [CrossRef]
  9. Yang, Y.; Yang, J.; Yang, G.; Tao, S.; Ni, C.; Zhang, B.; He, X.; Lin, J.; Huang, D.; Liu, M.; et al. New research progress of Jurassic tight oil in central Sichuan Basin, SW China. Pet. Explor. Dev. Online 2016, 43, 954–964. [Google Scholar] [CrossRef]
  10. Khoshbakht, F.; Azizzadeh, M.; Memarian, H.; Nourozi, G.H.; Moallemi, S.A. Comparison of electrical image log with core in a fractured carbonate reservoir. J. Pet. Sci. Eng. 2012, 86, 289–296. [Google Scholar] [CrossRef]
  11. Aghli, G.; Moussavi-Harami, R.; Tokhmechi, B. Integration of sonic and resistivity conventional logs for identification of fracture parameters in the carbonate reservoirs (A case study, Carbonate Asmari Formation, Zagros Basin, SW Iran). J. Pet. Sci. Eng. 2020, 186, 106728. [Google Scholar] [CrossRef]
  12. Luthi, S.M.; Souhaite, P. Fracture apertures from electrical borehole scans. Geophysics 1990, 55, 821–833. [Google Scholar] [CrossRef]
  13. Wang, D. Study on Interpretation Method of Micro-Resistivity Imaging Logging in Fractured Reservoir. Ph.D. Thesis, China University of Petroleum, Beijing, China, 2001. [Google Scholar]
  14. Ke, S.; Sun, G. On quantitative evaluation of fractures by STAR Imager II. Well Logging Technol. 2002, 26, 101–103. [Google Scholar]
  15. Chen, A. Numerical simulation and analysis of microresistivity imaging tool. Nat. Gas Ind. 2006, 26, 83–85. [Google Scholar]
  16. Cao, Y. The Numerical Stimulation and Experimental Verification of Electrical Imaging Logging in Fractured Formations. Master’s Thesis, Yangtze University, Jingzhou, China, 2014. [Google Scholar]
  17. Ponziani, M.; Slob, E.; Luthi, S.; Bloemenkamp, R.; Nir, I.L. Experimental validation of fracture aperture determination from borehole electric microresistivity measurements. Geophysics 2015, 80, 175–181. [Google Scholar] [CrossRef]
  18. Ammar, A.I. Development of numerical model for simulating resistivity and hydroelectric properties of fractured rock aquifers. J. Appl. Geophys. 2021, 189, 104319. [Google Scholar] [CrossRef]
  19. Epov, M.I.; Moskaev, I.A.; Nechaev, O.V.; Glinskikh, V.N. Effect of Tilted Uniaxial Electrical Anisotropy Parameters on Signals of Electric and Electromagnetic Logging Soundings according to Results of Numerical Simulation. Russ. Geol. Geophys. 2023, 64, 735–742. [Google Scholar] [CrossRef]
  20. He, J.; Liu, T.; Wen, L.; He, T.; Li, M.; Li, J.; Wang, L.; Yao, X. Numerical simulation analysis of difference from a radial resistivity testing method for cylindrical cores and a conventional testing method. Mathematics 2022, 10, 2885. [Google Scholar] [CrossRef]
  21. Tan, M.; Wang, P.; Li, J.; Liu, Q.; Yang, Q. Numerical simulation and fracture evaluation method of dual laterolog in organic shale. J. Appl. Geophys. 2014, 100, 1–13. [Google Scholar] [CrossRef]
  22. Deng, S.; Li, L.; Li, Z.; He, X.; Fan, Y. Numerical simulation of high-resolution azimuthal resistivity laterolog response in fractured reservoirs. Pet. Sci. 2015, 12, 252–263. [Google Scholar] [CrossRef]
  23. Liu, D.; Ma, Z.; Xing, X.; Li, H.; Guo, Z. Numerical simulation of LWD resistivity response of carbonate formation using self-adaptive hp-FEM. Appl. Geophys. 2013, 10, 97–108. [Google Scholar] [CrossRef]
  24. Kang, Z.; Li, X.; Ni, W.; Li, F.; Hao, X. Using logging while drilling resistivity imaging data to quantitatively evaluate fracture aperture based on numerical simulation. J. Geophys. Eng. 2021, 18, 317–327. [Google Scholar] [CrossRef]
  25. Zhao, J.; Sun, J.; Liu, X.; Chen, H.; Cui, L. Numerical simulation of the electrical properties of fractured rock based on digital rock technology. J. Geophys. Eng. 2013, 10, 055009. [Google Scholar] [CrossRef]
  26. Wang, N.; Li, K.; Sun, J.; Wang, D.; He, X.; Xiang, Z.; Liu, H.; Wang, P. Research on dual lateral log simulation of shale bedding fractures under different influencing conditions. Front. Energy Res. 2023, 11, 1249985. [Google Scholar] [CrossRef]
  27. Kim, J.; Hong, C.; Kim, J.; Chong, S. Theoretical and Numerical Study on Electrical Resistivity Measurement of Cylindrical Rock Core Samples Using Perimeter Electrodes. Energies 2021, 14, 4382. [Google Scholar] [CrossRef]
  28. Aghli, G.; Moussavi-Harami, R.; Mohammadian, R. Reservoir heterogeneity and fracture parameter determination using electrical image logs and petrophysical data (a case study, carbonate Asmari Formation, Zagros Basin, SW Iran). Pet. Sci. 2020, 17, 51–69. [Google Scholar] [CrossRef]
  29. Geuzaine, C.; Remacle, J.F. Gmsh: A 3-D finite element mesh generator with built-in pre-and post-processing facilities. Int. J. Numer. Methods Eng. 2009, 79, 1309–1331. [Google Scholar] [CrossRef]
  30. Zhao, X.; Lee, Y.Y.; Liew, K.M. Free vibration analysis of functionally graded plates using the element-free kp-Ritz method. J. Sound Vib. 2009, 319, 918–939. [Google Scholar] [CrossRef]
  31. Beirão da Veiga, L.; Brezzi, F.; Marini, L.D.; Russo, A. Virtual element method for general second-order elliptic problems on polygonal meshes. Math. Models Methods Appl. Sci. 2016, 26, 729–750. [Google Scholar] [CrossRef]
  32. Hao, R.; Lu, Z.; Ding, H.; Chen, L. A nonlinear vibration isolator supported on a flexible plate: Analysis and experiment. Nonlinear Dyn. 2022, 108, 941–958. [Google Scholar] [CrossRef]
  33. Guo, J.; Zhang, Z.; Xiao, H.; Zhang, C.; Zhu, L.; Wang, C. Quantitative interpretation of coal industrial components using a gray system and geophysical logging data: A case study from the Qinshui Basin, China. Front. Earth Sci. 2023, 10, 1031218. [Google Scholar] [CrossRef]
  34. Zhu, L.; Zhang, C.; Zhang, C.; Zhou, X.; Zhang, Z.; Nie, X.; Liu, W.; Zhu, B. Challenges and prospects of digital core-reconstruction research. Geofluids 2019, 2019, 7814180. [Google Scholar] [CrossRef]
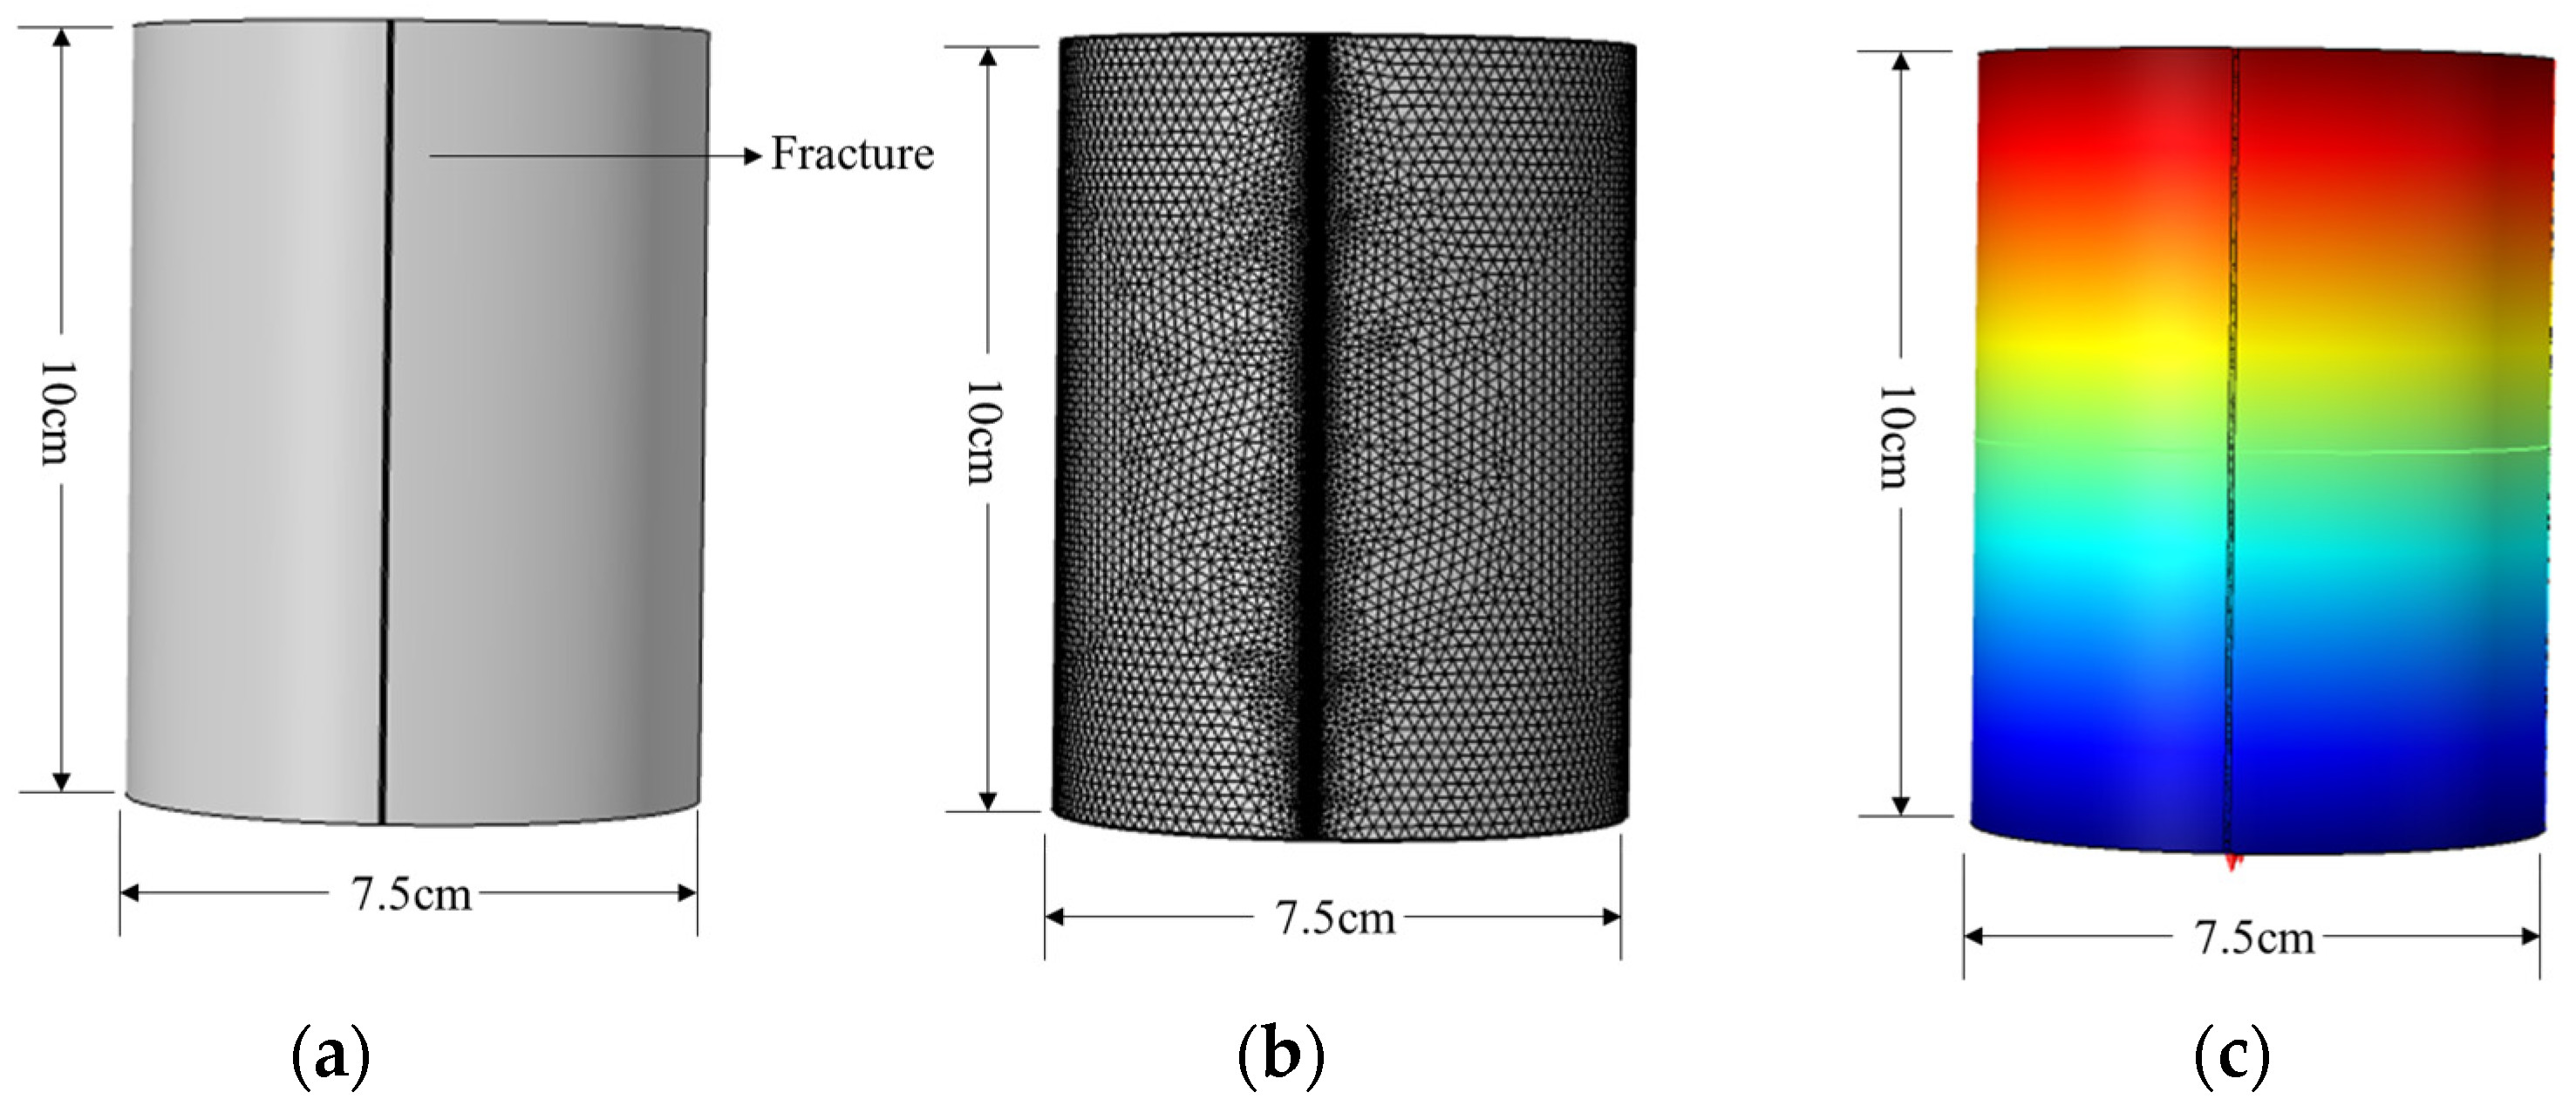
Figure 1. The single-fracture core model solves the regional grid subdivision results. (a) Three-dimensional core model; (b) grid subdivision diagram; and (c) potential distribution map.
Energies 17 01386 g001
Figure 2. The parallel fractures core model solves the regional grid subdivision results. (a) Three-dimensional core model; (b) grid subdivision diagram; and (c) potential distribution map (Different colors represent different potential differences).
Energies 17 01386 g002
Figure 3. Model sketch of intersecting fractures. (a) Cross-seam example; (b) grid subdivision results; and (c) potential distribution diagram (Different colors represent different potential differences).
Energies 17 01386 g003
Figure 4. The research process diagram of this study.
Energies 17 01386 g004
Figure 5. The relationship between the resistivity of the core and the width of the fracture under different fracture angles.
Energies 17 01386 g005
Figure 6. Schematic diagram of different fracture angle models.
Energies 17 01386 g006
Figure 7. The potential distribution diagram of different fracture angle models (Different colors represent different potential differences).
Energies 17 01386 g007
Figure 8. The relationship between the resistivity of the core and the fracture angle under different fracture widths.
Energies 17 01386 g008
Figure 9. The relationship between the resistivity of the core and the length of the fracture at different fracture angles.
Energies 17 01386 g009
Figure 10. The relationship between the resistivity of the core and the resistivity of the mud at different fracture angles.
Energies 17 01386 g010
Figure 11. The relationship between the resistivity of the core and the fracture angle under different fracture widths in the parallel fracture model.
Energies 17 01386 g011
Figure 12. The plotted relationship between the resistivity of the core and the angle of the fracture under different fracture widths in the mesh fracture model with a fixed fracture level.
Energies 17 01386 g012
Figure 13. The relationship between the resistivity of the core and the angle of the fracture under different fracture widths in the mesh fracture model under different initial dip angles. (a) The initial inclination angle is 30°; (b) the initial inclination angle is 60°.
Energies 17 01386 g013
Figure 14. Logging data and core resistivity measurement diagram. (a) Logging data measurement diagram (The black arrow represents the direction of the resistivity logging measurement.); (b) core resistivity measurement diagram.
Energies 17 01386 g014
Figure 15. Comparison of mesh fracture simulation results under different matrix resistivity conditions.
Energies 17 01386 g015
Figure 16. The comparison diagram shows the simulation results of the mesh seam under different mud filtrate resistivity conditions.
Energies 17 01386 g016
Table 1. Coefficient calibration statistical table.
U R I J Coefficient
1000.001100,0001,250,0000.08
1000.1100012,5000.08
10010101250.08
10010000.11.250.08
Disclaimer/Publisher’s Note: The statements, opinions and data contained in all publications are solely those of the individual author(s) and contributor(s) and not of MDPI and/or the editor(s). MDPI and/or the editor(s) disclaim responsibility for any injury to people or property resulting from any ideas, methods, instructions or products referred to in the content.