Abstract
The use of a two-stage combustion system in a hydrogen-fueled engine is characteristic of modern internal combustion engines. The main problem with hydrogen combustion in such systems is knocking combustion. This paper contains the results of research under knock combustion conditions with a single-cylinder internal combustion engine equipped with a turbulent jet ignition system (TJI). A layout with a passive pre-chamber and a variable value of the excess air ratio range λ = 1.25–2.0 with a constant value of the center of combustion (CoC = 4 deg) after top dead center (TDC) was used. Two indicators of knock combustion were analyzed: maximum oscillation of pressure and the Mahle Knock Index. Analyses were also carried out taking into account the rate of heat release and the amount of heat released. As a result of the investigation, it was found that knock combustion occurs intensively at small values of the air excess ratio. Hydrogen knock combustion disappears for λ = 2.0 and greater. The pressure oscillation index was found to be more applicable, as its limiting value (>1 bar) allows easy diagnosis of knock combustion. The Mahle Knock Index is a quantity that allows interval analysis of the knock. The choice of classes and weighting coefficients requires an iterative operation, as they strictly depend on engine characteristics, load, and knock magnitude.
1. Introduction
The main direction in the development of internal combustion engines is the tendency to increase their overall efficiency. This can be realized by developing combustion systems including fuel injection systems.
Knock combustion is one of the main barriers to increasing the thermal efficiency and power output of reciprocating internal combustion engines [1]. This phenomenon has been analyzed since the beginning of the internal combustion engine’s development. The first works on knock combustion were published in 1921 [2] and 1922 [3], as well as the first history of the mentioned topic [4]. Diagnostics of engine operating conditions in terms of knock combustion concerns not only light vehicle engines [5,6], but also marine applications [7,8]. Knock combustion can be eliminated when the flame front absorbs the entire unburned charge before self-ignition occurs. Therefore, knock combustion reduction strategies can be divided into two main groups: (1) those aimed at accelerating the rate of combustion by the flame front (FFA—flame front acceleration) and (2) those aimed at reducing the rate of reaction in the exhaust gases (ERR—end-gas reactivity reduction).
The first group can include the following [4]: charge motion and an ignition system. The second includes charge temperature management, dilution, and exhaust system design. There are activities that can be classified into both groups: mixture formation, fuel (primarily ERR, secondarily FFA), and combustion chamber design.
2. Characteristics of Hydrogen Combustion
2.1. Combustion of Hydrogen in Internal Combustion Engines
The high reactivity and laminar combustion velocity of hydrogen, combined with carbon-free emissions, make hydrogen an attractive fuel for internal combustion engines. Despite its large post-ignition pressure rises, it has great potential for applications in pre-chamber-based combustion systems, especially when less reactive mixtures delivered to the cylinder are utilized [9].
Wu et al. [10] analyzed the effect of direct water injection on the knocking combustion characteristics of a model engine fueled with compressed natural gas (CNG) enriched with 5 and 10% hydrogen. The results were a lower flame propagation velocity, an increase in nitrogen oxide (NOx) concentration (by more than 300%), and a slight reduction in hydrocarbons (HCs) (with only 10% H2 addition by about 30%) and carbon monoxide (CO) (by about 15%). The use of water injection in the engine increases the indicated mean effective pressure (IMEP) by about 5%, increases combustion time, and reduces the engine’s tendency for knock combustion.
A study by Sagar and Agarwal [11] indicates that the knock intensity when burning hydrogen is five times higher than when running on CNG. This value is practically unchanged, with an increase in the proportion of hydrogen in CNG from 10 to 70%.
Wang et al. [12] applied hydrogen to a turbocharged engine with varying air excess ratios (λ values). Increasing the excess air ratio resulted in a decrease in the combustion rate and an increase in the combustion time. At λ = 1.66, knocking combustion was observed for about 10% of the engine cycles. In subsequent tests at λ = 1.2, NOx emissions were obtained at the highest level (52 g/kWh). At λ = 2.0, a significant reduction in NOx was obtained (about 2 g/kWh); with a further increase in the value of the excess air ratio (λ > 2.5), minimal NOx emissions were obtained [13].
The presented investigation focuses on knock combustion in an engine equipped with a turbulent jet ignition system (TJI). Such a system shows better application results relative to the conventional system (SI) under lean combustion conditions [5]. These are conditions where the role of the ignition system in increasing ignition energy is very important.
2.2. Knock Combustion: In General
As early as the 1980s and 1990s, several methods were considered to identify knock combustion [14,15]. Among these are the following:
- Maximum amplitude of the bandpass-filtered pressure;
- Internal bandpass-filtered pressure;
- Peak cylinder pressure;
- Peak rates of pressure rise;
- Third-time derivative of the cylinder pressure;
- Power spectral density.
Numerous works [16,17] exist on the identification of knock combustion, in which full analyses have been conducted. Nowadays, more and more work is also considering artificial neural networks [18]. For safe engine operation, knock detection and ignition timing control to avoid knock are essential to allow the engine to run at high-efficiency operating conditions close to the knock threshold without causing knock [19]. To provide accurate and reliable knock prediction, ML-based models should include these essential features: ICE inputs, including injection timing and pressure, boost pressure, and ignition timing (for SI engines); fuel characteristics, including octane number and molecular structure; engine design; and parameters including compression ratio, injection spray cone angle, and piston crown shape [20].
3. The Aim and Essence of the Investigation
The combustion of hydrogen takes place in a much more intensive process than the combustion of other fuels. It requires a significant ignition delay to achieve a fixed center of combustion (which is the value of the angle for which 50% of the heat release has been achieved, which is defined later in the paper as Equation (5)). For this reason, analyses were conducted on knock combustion in the main chamber as a function of the excess air ratio at a fixed value of the combustion center. In addition, the pressure difference in the two chambers under knock combustion conditions was determined. A comparison of knock indices in the form of maximum amplitude of pressure oscillations (MAPOs) and the Mahle KI was made.
Analyses of knock combustion in light-duty engines with two-stage combustion are a significant new problem and the subject of ongoing work [21,22]. In addition, it is a new development to consider the phenomenon in relation to the combustion of hydrogen, which is a modern carbon-free fuel [23,24]. Therefore, any work that makes it possible to increase the knowledge on knock during hydrogen combustion in a TJI engine is particularly desirable (also in terms of the zero-emission aspect of this fuel).
The authors present the possibility of detecting and evaluating knock combustion in a TJI engine for a wide range of values of the excess air ratio. Under typical combustion conditions, such a high variability in λ is not achievable, which certainly limits the typical operating conditions of an internal combustion engine. The ongoing research work shows the broad context of knock combustion detection.
The suggested strategies for detecting and evaluating knock combustion apply primarily to light vehicle applications. The parameters presented, among others, for displacement volume, refer to a specific group of vehicles. It is not possible to make a direct comparison of the operating indicators of these engines to those of other types, such as heavy-duty or marine engines (in which the engine speed is much lower and the initial combustion chambers should also have a slightly different shape).
4. Research Methodology
4.1. Research Engine Test Stand
This study used a single-cylinder AVL 5804 hydrogen-fueled research engine with a two-stage combustion system. The combustion system consists of a 6-hole pre-chamber with a capacity of 2.29 cm3 with a cylindrical shape (length: 25 mm; diameter: 9 mm). This value accounted for 0.45% of the total engine stroke volume (at BDC) and 6.6% at TDC. The engine configuration includes a passive chamber (no additional fuel supply to the pre-chamber). An asynchronous electric motor drove and braked the combustion engine to maintain constant operating conditions. The temperature of the coolant and lubricating oil during all tests was constant (Tf = 80 °C and Toil = 80 °C). Tests were carried out under steady-state conditions, each time recording 100 cycles of engine operation. A scheme of the engine and its equipment is shown in Figure 1 (data of the engine—Table 1). Fuel supply was realized by injecting hydrogen into the intake port at 240 deg bTDC (port fuel injection—PFI). The injection angle of hydrogen indicates its start already in the expansion stroke (with the exhaust valve open). Fuel mass consumption was measured with a Micro Motion ELITE CMFS010M flow meter (by Emerson, Ferguson, MO, USA) based on the Coriolis principle. The air mass was measured using Sensycon Sensyflow thermal flow meter (by ABB, Zurich, Switzerland). The throttle and ignition were controlled using an external EMU Black controller from ECU Master (Cracov, Poland). A wideband LSU 4.9 probe and LCP80 controller (by Bosch, Stuttgart, Germany) were used to measure the excess air ratio (exhaust side).
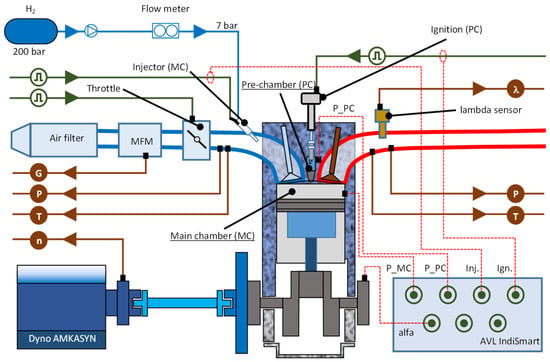
Figure 1.
Schematic of the measurement system analysis for the two-stage combustion system with the hydrogen-fueled AVL 5804 engine and the apparatus for engine indication.

Table 1.
Technical data of the single-cylinder test engine.
Fast-variable parameters were recorded using an 8-channel IndiSmart system (by AVL, Graz, Austria) with integrated charge amplifiers for piezoelectric sensors. Table 2 shows details of the sensors employed and their measurement ranges. The basic measurement data, i.e., cylinder and pre-chamber pressure, were acquired with a resolution of Δα = 0.1 deg.

Table 2.
Technical data of the test equipment and sensors used.
4.2. Scope and Test Layout
Tests were conducted at a constant engine speed of n = 1500 rpm and varying values of the excess air ratio. The change in the excess air ratio was due to changes in the throttle opening without engine supercharging. The engine load was the resultant parameter when keeping the fuel dose constant. The ignition system was adjusted each time to maintain a constant center of combustion CoC = 4 deg aTDC. The test conditions are included in Table 3.

Table 3.
Research conditions.
4.3. Results Calculation Workflow
In knock studies, the most commonly used evaluation measure is the MAPO index [25,26]. It shows the intensity of the impact generated by a knock:
where N is the calculated number of cycles, is the filtered cylinder pressure, ST is the ignition time, and W is the duration of knock combustion. The higher the MAPO value, the greater the knock combustion tendency and intensity. MAPO refers to all engine cycles analyzed.
To obtain MAPO, a digital filtering process was performed on the cylinder pressure signal (at f = 4–25 kHz, in the angular range of 0–70 deg with the resolution of the cylinder pressure signal Δα = 0.1 deg). The results after applying a high-pass filter were used for further analysis. For each measurement cycle (out of 100 recorded cycles), the PPmx (peak pressure maximum) value was determined.
Data on changes in in-cylinder pressure and in-cylinder volume were analyzed to determine the maximum heat release (Qmx) and heat release rate (dQ). For combustion, the net HRR (without heat loss) is determined by applying the first law of thermodynamics with the following equation [27,28]:
and the heat release (Q) is given by
where P is the instantaneous cylinder pressure, is the crank angle, is the ratio of the specific heats, and V is the instantaneous cylinder volume. This latter value was calculated from the engine geometry and crank angle values. Hence, a constant value of λ = 1.35 is considered in this study for analyzing the heat release (Q) in hydrogen operation.
The center of combustion was defined as the angle for which 50% of the heat was released. The value of half of the heat released was calculated based on the following [29,30]:
4.4. Mahle Knock Index
Mahle has presented its own approach to determining the knock index. Classes in the form of cylinder pressure oscillation ranges and the weights of these classes have been defined. Both the classes and the weights can be determined arbitrarily depending on the knock level in the engine. Therefore, this indicator can be used in systems with small as well as large knock values. The limiting value is also set arbitrarily, which makes it highly versatile (on the one hand) and not uniform for all engines (on the other).
In addition to MAPO, the Mahle KI [31] was used, which is defined by
where KI is the factor of knock intensity, k is the class number (oscillation ranges, which are set arbitrarily; a full analysis of the work is presented in Section 5.5), m is the maximum number of classes, nk is the number of cycles with pressure amplitudes in a class, fk is the weighting factor of a class c (number of four-stroke cycles measured), and N is the standardization constant.
Mahle establishes a relationship between piston damage and the occurrence of high-knock combustion peaks. The range of amplitudes, reaching up to 64 bars, is classified into categories corresponding to knock combustion peaks. Each category is assigned a weight that rises with the amplitude of knock combustion. These weights are allocated to each cycle; subsequently, the total sum of weights is computed and divided by the number of cycles (referenced from [32]). The categorization and weighting can be adapted to the specific requirements (Table 4).

Table 4.
The categorization and weighting by AVL and Mahle.
5. Results
5.1. Basic Achieved Parameters
An example of a cylinder pressure course is shown in Figure 2, which includes the main chamber and pre-chamber pressure course. In addition, the charging of the ignition coil is included. A sharp drop causes induction of discharge on the spark plug. For the pressure in the main chamber, the course of the heat release rate and its amount are shown.
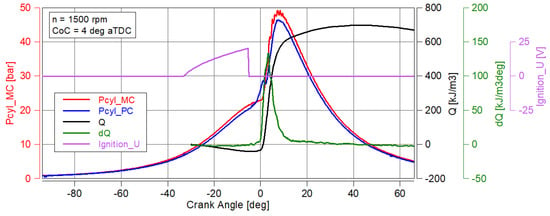
Figure 2.
Example of the waveform of the analyzed parameters (cylinder pressure, ignition coil charging path, rate and amount of heat release).
5.2. Analysis of the Maximum Pressure Oscillation Value
The main chamber pressure waveform was used to determine its high-pass filter component in the 4–20 kHz range (Figure 3). The next step was to determine the absolute values of these oscillations, which resulted in only the values of positive pressure changes P_MC (blue waveforms in Figure 3).

Figure 3.
Example results of main chamber pressure filtering (P_MC) for each case of excess air ratio at n = 1500 rpm and CoC = 4 deg aTDC.
As a result, the maximum value of PPmx oscillation (PPmx means the maximum value of filtered pressure in each engine cycle) for each engine cycle was determined as a function of the excess air ratio.
Figure 4a shows the pressures in the cylinder (red line) and the pre-chamber (blue line). The label P_MC presents the raw cylinder pressure waveform. PPmx denotes the filtered maximum pressure value in the analyzed cycle. Significantly higher oscillations were observed in the main chamber than in the pre-chamber. With each increase in λ, the cylinder pressure increases, as seen in the angular range of 0–5 deg aTDC caused by better cylinder filling. Increasing the excess air ratio simultaneously requires ignition advances to achieve a constant CoC = 4 deg aTDC. Increasing the excess air ratio reduces oscillations and simultaneously reduces knock combustion. The maximum PPmx oscillation values for each engine cycle are shown in Figure 4b. As λ increases, the spread of PPmx values decreases. Only at λ = 1.6 are the scatter values greater than the combustion at λ = 1.5 (this may be due to the operating conditions of the engine, where, at similar values of λ, no clear thermodynamic changes in the combustion process are observed). At λ = 1.25, the average PPmx value (i.e., MAPO) is 4.50 bar. The values of MAPO are 2.86 bar (at λ = 1.35); 1.56 bar (at λ = 1.5); 1.48 bar (at λ = 1.6); and 0.56 bar (at λ = 2.0).
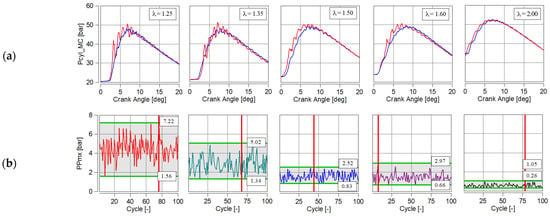
Figure 4.
Example of MC (red) and PC (blue) cylinder pressure (a) and the corresponding PPmx oscillation indicators of each engine cycle (b). The red vertical line indicates the cycle with the maximum PPmx value.
Based on other studies [13,33,34,35], it was found that the limiting MAPO value defining knock combustion is MAPO > 1 bar. As can be seen from the above, only at λ = 2.0 in the analyzed range can one speak of the absence of knock combustion. In other cases, the average value indicates the presence of knock combustion. It is indicated by the averaged value, which does not mean that knock combustion occurs at each successive engine cycle. Such an analysis is made possible by the data in Figure 4b, which indicate the minimum PPmx values. At λ = 1.5 (and higher), engine cycles cannot be counted as knock combustion. At λ = 1.5, the minimum PPmx value is 0.83 bar, which becomes smaller and smaller with increasing excess air. At λ = 2.0, there are a small number of cycles indicating the presence of knock combustion.
Analysis of the PPmx variable (Figure 5) shows a concentration of pressure occurring most frequently with increasing λ and decreasing knock. At λ = 1.25, the most frequently occurring value (ΔPPmx = 1 bar) appears in the amount of 35%, and at λ = 2.0 (no knock combustion) the most frequently occurring value (0.6 bar) appears in the amount of 45% of all values (with the range of ΔPPmx narrowing to 0.2 bar). This means that as knock combustion is reduced, the frequency of occurrence of the average value increases. In addition, it can be pointed out that the inequality in PPmx incidence (i.e., CoV(PPmx)) was as follows (with respect to the increasing value λ): 23.7 → 29.9 → 27.2 → 27.2 → 30.6.

Figure 5.
Distributions of PPmx values with varying values of excess air ratio λ.
Figure 6 shows the ranked order of increasing PPmx values for 100 engine cycles. From such a listing, it is possible to determine the magnitude of changes in PPmx and the number of occurrences of knocking combustion (if the relationship PPmx > 1 bar is assumed). From such a choice, it follows that at λ = 1.25, all cycles are > 1 bar. The maximum values of pressure oscillations are more than 7 bar. In the study by [36], the maximum values of pressure oscillations reached more than 15 bar (gasoline combustion under near stoichiometric conditions). On the other hand, it can be concluded that 40% of the cycles are PPmx < 4 bar (at λ = 1.25). At λ = 1.35, PPmx below 4 bar occurs in as much as 90% of engine cycles. Engine operating conditions at λ = 1.5 and λ = 1.6 are practically no different (this may be due to the specific nature of the engine’s operation at such values of l, as is the course of pressure and PPmx in Figure 4). The numbers of duty cycles with similar PPmx values are similar to each other. At λ = 1.5, there is a slightly larger number of cycles at which PPmx > 2 bar. At λ = 2, as many as 99% of cycles show no knock combustion.
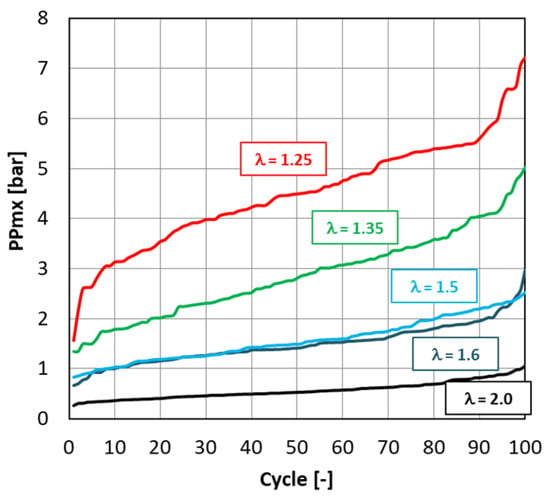
Figure 6.
PPmx cumulative distributions at different values of excess air ratio λ.
5.3. Analysis of Pressure Difference between Chambers
The next step in the analysis was to study the pressure difference in the two combustion chambers (MC and PC). The pressure waveforms in the two chambers are shown in Figure 7a, with the red color indicating the pressure in the MC and the black color indicating the pressure in the PC. When the excess air ratio is increased, the pressure increase during the beginning of combustion in the pre-combustion chamber is reduced. This value also results in a decrease in the differential pressure shown in Figure 7b. At λ = 1.25, the maximum pressure difference in the two chambers is 15 bar (at α = 3 deg aTDC). It is worth noting that a negative differential pressure results in flow into the main chamber, while a positive differential pressure causes backflow. Any increase in the excess air ratio reduces inter-chamber flows. At λ = 2.0, the pressure difference in flow to the main chamber was less than that to the pre-chamber.
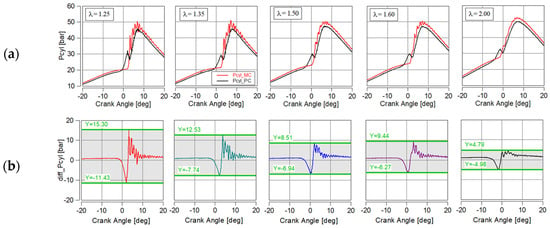
Figure 7.
Cylinder (P_MC: red) and pre-chamber (P_PC: black) pressure waveforms (a) and differential pressure values indicating inter-chamber flows (b).
5.4. Heat Release Characteristics
An analysis of the rate and amount of heat released is shown in Figure 8 (according to Equation (4)). As the excess air ratio increases, a reduction in the maximum value of dQ is observed. At λ = 1.25, the average value of dQ in the main chamber is the highest at 211 kJ/m3deg. When increasing the excess air ratio λ, a slowing down of the combustion process is observed with a simultaneous prolongation of the combustion process (Figure 8a). A similar trend is noted in the pre-chamber. Such a combustion process results in a higher amount of heat released with increasing λ (Figure 8b). Although some authors [37,38] indicate the use of an index related to the heat release rate to determine knock combustion, no such trend was observed in the present study. At small λ values, CoV(dQmx) values are, respectively, 5.53 → 8.41 → 6.48 → 6.48 → 5.17. Large knock combustion does not correspond to large scatterings around the average value. Although at λ = 2 the number of knock combustion cycles is minimal (as can be seen from Figure 4b), the CoV(dQmx) index does not confirm this. Characteristically, the differences in Qmx values (Figure 8b) occur at each value of the λ angle from 30 to 36 kJ/m3. CoV(Qmx) was also determined from Figure 8b. In addition, the relation of knock and the value of CoV(Qmx) is also not confirmed, as these values are (respective to increasing λ) 0.95 → 1.10 → 0.86 → 0.87 → 0.86. The small differences in CoV(Qmx) may be due to the large absolute values of the amount of heat released. In such a case, the change in CoV is not an appropriate measure of scatter, as confirmed by the maintained results.
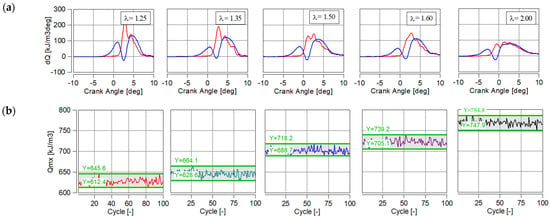
Figure 8.
The heat release rates in the main chamber (red) and pre-chamber (blue) (a) and the value of the maximum amount of heat released (b).
5.5. Knock Indicator Analysis Based on the Mahle KI Model
The Mahle Knock Index (KI) assesses alterations in knock activity. It is computed by assigning a weight to the knock peak value for every cycle, summing these weightings, and then dividing by the total number of cycles, resulting in the KI. A higher KI signifies increased knock activity. The precise magnitude of the KI is subject to variation based on the filtering frequencies and weightings attributed to the knock peak value. Determining the knock peak value involves filtering and rectifying each cylinder pressure trace to isolate solely the oscillations stemming from the knock event [39].
In studies conducted with the Marine Two-Stroke Direct Fuel Injection Engine when fueled with butanol and ethanol, this index ranged from 342 (when fueled with the base fuel—gasoline) to 345 (with 20% butanol addition) [39]. However, the index depends on the weights adopted and the standardization factor N shown in Equation (5). Adopting N = 1 indicates much smaller values of the Mahle KI. In the study conducted by [40], the KI took a maximum value of 0.3. This value indicated a very strong “heavy knock” combustion, which was equivalent to about 15% of the mass of unburned fuel at spontaneous combustion (fuel: CH4: 87.94%; C2H6: 1.94%; C3H8: 10.12%; N2: 0; methane number = 65; ϕ = 0.554).
Calculations were made for the two Mahle KI indicators, taking into account the classes and weights from Table 4. These results are shown in Figure 9. They show that the adoption of different classes and weights depends largely on the size of the knock. This classification can be partially based on the results in Figure 5 and Figure 6. There are no clear guidelines for these sizes. However, the results obtained, regardless of classes and weights, indicate a tendency to increase knock when reducing the excess air ratio.
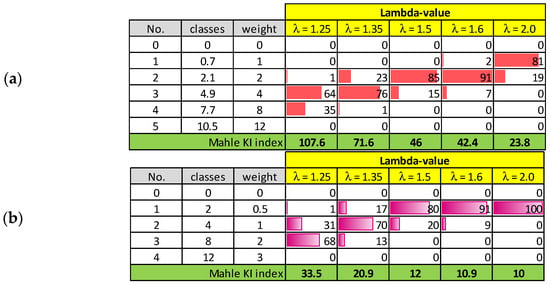
Figure 9.
Classification of Mahle KI according to the adopted classes and coefficients of weight: (a) smaller class ranges and larger weights, (b) larger class ranges and smaller weights.
It seems that adopting more narrow classes (Figure 9a) results in increased resolution of Mahle KI results. This means that the classification and weights should be closely correlated with the values of the tapping that occurs (i.e., PPmx). This means that determining knock based on Mahle KI alone requires iterative steps: it is necessary to verify the adopted ranges after the final results are obtained. When PPmx is taken into account, verification activities are not necessary.
6. Conclusions
Two knock indicators, MAPO and the Mahle KI, were used in this study of the two-stage combustion system. Both indices can be used for knock analysis. The MAPO index quite comprehensively uses a specific magnitude to indicate the knock limit (MAPO > 1 bar). The size of the KI using classes and weights makes it possible to make extensive use of knock while classifying it widely. It is possible to determine knock and its form for small knock values and for a wide spectrum of pressure oscillations. Although MAPO is widely used when the engine is fed with hydrogen, when the knock is significantly higher the latter can be a very good indicator.
This study analyzed knock combustion with varying excess air ratios for a hydrogen-fueled engine with a two-stage combustion system:
- It was found that at λ = 1.25, knocking combustion during hydrogen supply occurs at all cycles of the engine (at CoC = 4 deg aTDC);
- Increasing the excess air ratio (with all other settings unchanged) results in reduced knock combustion; full knock elimination occurs only at a high excess air ratio (λ = 2.0).
Based on the work carried out, two knock indicators were used: PPmx and the Mahle KI value. The possibilities of using both of these values are presented:
- The use of PPmx greatly enhances the possibility of interpreting the knock occurring in the engine; its use makes it possible to detect the knock and, at the same time, to provide statistics of engine operation (PPmx intervals of a certain value).
- The use of Mahle KI also leads to the determination of knock, but the classes and weights must be adopted individually to the engine and the occurring knock.
- Adopting narrower classes results in increased resolution of Mahle KI results. This means that the classification and weights should be closely correlated with the knock values that occur (i.e., PPmx). In addition, it was found that determining tapping only based on Mahle KI requires iterative steps: it is necessary to verify the adopted ranges after the final results are obtained. When PPmx is taken into account, verification activities are not necessary (since the limit of knocking combustion is clearly assumed).
Author Contributions
Conceptualization, I.P. and F.S.; methodology, I.P. and F.S.; software, I.P. and F.S.; validation, I.P. and F.S.; formal analysis, I.P. and F.S.; investigation, I.P. and F.S.; resources, I.P. and F.S.; data curation, I.P. and F.S.; writing—original draft preparation, I.P. and F.S.; writing—review and editing, I.P. and F.S.; visualization, I.P. and F.S.; supervision, I.P. and F.S.; project administration, I.P. and F.S.; funding acquisition, I.P. and F.S. All authors have read and agreed to the published version of the manuscript.
Funding
This research was funded by Poznan University of Technology, grant number 0415/SIGR/7286.
Data Availability Statement
The data presented in this study are available on request from the corresponding author.
Conflicts of Interest
The authors declare no conflicts of interest.
Abbreviations
| CoC | center of combustion |
| CoV | coefficient of variation |
| cyl | cylinder |
| diff | difference |
| dQ | heat release rate |
| EGR | exhaust gas recirculation |
| ERR | end-gas reactivity reduction |
| FFA | flame front acceleration |
| IMEP | indicated mean effective pressure |
| KI | Mahle Knock Index |
| MAPO | maximum amplitude pressure oscillation |
| MC | main chamber |
| mx | maximum |
| n | engine speed |
| P | pressure |
| PC | pre-chamber |
| PFI | port fuel injection |
| PP | peak pressure |
| Q | heat release |
| SOI | start of injection |
| TDC | top dead center |
| TJI | turbulent jet ignition |
| λ | air excess ratio |
References
- Brunt, M.; Pond, C.; Biundo, J. Gasoline Engine Knock Analysis Using Cylinder Pressure Data. In SAE Technical; SAE International: Warrendale, PA, USA, 1998. [Google Scholar] [CrossRef]
- Clerk, D. Cylinder Actions in Gas and Gasoline Engines. In SAE Technical; SAE International: Warrendale, PA, USA, 1921. [Google Scholar] [CrossRef]
- Ricardo, H.R. Recent Research Work on the Internal-Combustion Engine. In SAE Technical; SAE International: Warrendale, PA, USA, 1922. [Google Scholar] [CrossRef]
- Corrigan, D.; Fontanesi, S. Knock: A century of research. SAE Int. J. Engines 2022, 15, 57–127. [Google Scholar] [CrossRef]
- Bueschke, W.; Szwajca, F.; Wislocki, K. Experimental Study on Ignitability of Lean CNG/Air Mixture in the Multi-Stage Cascade Engine Combustion System. In SAE Technical; SAE International: Warrendale, PA, USA, 2020. [Google Scholar] [CrossRef]
- Pielecha, I.; Szwajca, F. Two- and three-stage natural gas combustion system—Experimental comparative analysis. Energies 2023, 16, 3837. [Google Scholar] [CrossRef]
- Zacharewicz, M.; Kniaziewicz, T. Mathematical modelling malfunctions of marine diesel engine. MATEC Web Conf. 2017, 118, 00001. [Google Scholar] [CrossRef]
- Zacharewicz, M.; Kniaziewicz, T. Modelling of the operating process in a marine diesel engine. J. Mar. Eng. Technol. 2017, 16, 193–199. [Google Scholar] [CrossRef]
- Trombley, G.; Toulson, E. A fuel-focused review of pre-chamber initiated combustion. Energy Convers. Manag. 2023, 298, 117765. [Google Scholar] [CrossRef]
- Wu, X.; Liu, K.; Liu, Q.; Fu, J.; Liu, J. Effects of direct water injection timings on knock suppression, combustion, and emission performance of high compression ratio hydrogen-enriched natural gas engine. Energy Convers. Manag. 2021, 250, 114887. [Google Scholar] [CrossRef]
- Sagar, S.M.V.; Agarwal, A.K. Knocking behavior and emission characteristics of a port fuel injected hydrogen enriched compressed natural gas fueled spark ignition engine. Appl. Therm. Eng. 2018, 141, 42–50. [Google Scholar] [CrossRef]
- Wang, K.; Zhang, Z.; Sun, B.; Zhang, S.; Lai, F.; Ma, N.; Ju, X.; Luo, Q.; Bao, L.-Z. Experimental investigation of the working boundary limited by abnormal combustion and the combustion characteristics of a turbocharged direct injection hydrogen engine. Energy Convers. Manag. 2024, 299, 117861. [Google Scholar] [CrossRef]
- Wang, K.; Sun, B.; Luo, Q.; Li, Q.; Wu, X.; Hu, T.; Bao, L.-Z.; Wang, X. Performance optimization design of direct injection turbocharged hydrogen internal combustion engine. Appl. Energy Combust. Sci. 2023, 16, 100204. [Google Scholar] [CrossRef]
- Burgdorf, K.; Denbratt, I. Comparison of Cylinder Pressure Based Knock Detection Methods. In SAE Technical; SAE International: Warrendale, PA, USA, 1997. [Google Scholar] [CrossRef]
- Klimstra, J. The Knock Severity Index—A Proposal for a Knock Classification Method. In SAE Technical; SAE International: Warrendale, PA, USA, 1984. [Google Scholar] [CrossRef]
- Bares, P.; Selmanaj, D.; Guardiola, C.; Onder, C. A new knock event definition for knock detection and control optimization. Appl. Therm. Eng. 2018, 131, 80–88. [Google Scholar] [CrossRef]
- Steurs, K. Cycle-Resolved Analysis and Modelling of Knock in a Homogeneous Charge Spark Ignition Engine Fueled by Ethanol and Iso-Octane. Ph.D. Thesis, ETH Zurich, Zurich, Switzerland, 2014. No. 219882. Available online: https://www.research-collection.ethz.ch/handle/20.500.11850/154797?show=full (accessed on 15 January 2024).
- Hosseini, M.; Chitsaz, I. Knock probability determination in a turbocharged gasoline engine through exhaust gas temperature and artificial neural network. Appl. Therm. Eng. 2023, 225, 120217. [Google Scholar] [CrossRef]
- Wang, Z.; Liu, H.; Reitz, R.D. Knocking combustion in spark-ignition engines. Prog. Energy Combust. Sci. 2017, 61, 78–112. [Google Scholar] [CrossRef]
- Aliramezani, M.; Koch, C.R.; Shahbakhti, M. Modeling, diagnostics, optimization, and control of internal combustion engines via modern machine learning techniques: A review and future directions. Prog. Energy Combust. Sci. 2022, 88, 100967. [Google Scholar] [CrossRef]
- Fan, B.; Wu, X.; Pan, J.; Qi, X.; Fang, J.; Lu, Q.; Zhang, Y. Research on the structure of pre-chamber and jet orifice of a turbulent jet ignition rotary engine fueled with methanol/gasoline blends. Appl. Therm. Eng. 2023, 229, 120588. [Google Scholar] [CrossRef]
- Alvarez, C.E.C.; Couto, G.E.; Roso, V.R.; Thiriet, A.B.; Valle, R.M. A review of prechamber ignition systems as lean combustion technology for SI engines. Appl. Therm. Eng. 2018, 128, 107–120. [Google Scholar] [CrossRef]
- Wang, Z.; Ji, C.; Zhang, T.; Wang, S.; Yang, H.; Zhai, Y.; Yang, J. Experimental study on the combustion of NH3/H2/air based on the passive turbulent jet ignition. Fuel 2024, 365, 131268. [Google Scholar] [CrossRef]
- Qiang, Y.; Ji, C.; Wang, S.; Xin, G.; Hong, C.; Wang, Z.; Shen, J. Study on the effect of variable valve timing and spark timing on the performance of the hydrogen-fueled engine with passive pre-chamber ignition under partial load conditions. Energy Convers. Manag. 2024, 302, 118104. [Google Scholar] [CrossRef]
- Brecq, G.; Bellettre, J.; Tazerout, M. A new indicator for knock detection in gas SI engines. Int. J. Therm. Sci. 2003, 42, 523–532. [Google Scholar] [CrossRef]
- Lasocki, J. Engine knock detection and evaluation: A review. Sci. J. Veh. Inst. 2016, 109, 41–50. Available online: https://repo.pw.edu.pl/info/article/WUT32f6039c8a874a75ac3d2b5e807c18ff (accessed on 15 January 2024).
- Hountalas, D.T.; Kouremenos, A.D. Development and application of a fully automatic troubleshooting method for large marine diesel engines. Appl. Therm. Eng. 1999, 19, 299–324. [Google Scholar] [CrossRef]
- Papagiannakis, R.G.; Hountalas, D.T. Combustion and exhaust emission characteristics of a dual fuel compression ignition engine operated with pilot diesel fuel and natural gas. Energy Convers. Manag. 2004, 45, 2971–2987. [Google Scholar] [CrossRef]
- Han, M. The effects of synthetically designed diesel fuel properties—Cetane number, aromatic content, distillation temperature, on low-temperature diesel combustion. Fuel 2013, 109, 512–519. [Google Scholar] [CrossRef]
- Ravaglioli, V.; Moro, D.; Serra, G.; Ponti, F. MFB50 on-board evaluation based on a zero-dimensional ROHR model. In SAE Technical; SAE International: Warrendale, PA, USA, 2011. [Google Scholar] [CrossRef]
- Mahle GmbH. Pistons and Engine Testing; Springer Fachmedien Wiesbaden GmbH: Wiesbaden, Germany, 2012. [Google Scholar] [CrossRef]
- AVL. AVL Concerto; Version 5 R7.1, March 2023; AVL: Graz, Austria; Available online: http://www.avl.com (accessed on 18 January 2024).
- Pielecha, I.; Szwajca, F.; Skobiej, K. Experimental investigation on knock characteristics from pre-chamber gas engine fueled by hydrogen. Energies 2024, 17, 937. [Google Scholar] [CrossRef]
- Sun, J.; Zhang, X.; Tang, Q.; Wang, Y.; Li, Y. Knock recognition of knock sensor signal based on wavelet transform and variational mode decomposition algorithm. Energy Convers. Manag. 2023, 287, 117062. [Google Scholar] [CrossRef]
- Szwaja, S.; Naber, J.D. Dual nature of hydrogen combustion knock. Int. J. Hydrogen Energy 2013, 38, 12489–12496. [Google Scholar] [CrossRef]
- Cavina, N.; Brusa, A.; Rojo, N.; Corti, E. Statistical Analysis of Knock Intensity Probability Distribution and Development of 0-D Predictive Knock Model for a SI TC Engine. In SAE Technical; SAE International: Warrendale, PA, USA, 2018. [Google Scholar] [CrossRef]
- Bozza, F.; Siano, D.; Torella, E. Cycle-by-cycle analysis, knock modeling and spark-advance setting of a “downsized” spark-ignition turbocharged engine. SAE Int. J. Engines 2010, 2, 381–389. [Google Scholar] [CrossRef]
- Suijs, W.; Graeve, R.; Verhelst, S. An exploratory study of knock intensity in a large-bore heavy-duty methanol engine. Energy Convers. Manag. 2024, 302, 118089. [Google Scholar] [CrossRef]
- Wasil, J.; Johnson, J.; Singh, R. Alternative fuel butanol: Preliminary investigation on performance and emissions of a marine two-stroke direct fuel injection engine. SAE Int. J. Fuels Lubr. 2010, 3, 1071–1080. [Google Scholar] [CrossRef]
- Holly, W.E.; Lauer, T.; Schuemie, H.A.; Murakami, S. Prediction of the knocking combustion and NOx formation for fuel gases with different methane numbers. Int. J. Engine Res. 2016, 17, 35–43. [Google Scholar] [CrossRef]
Disclaimer/Publisher’s Note: The statements, opinions and data contained in all publications are solely those of the individual author(s) and contributor(s) and not of MDPI and/or the editor(s). MDPI and/or the editor(s) disclaim responsibility for any injury to people or property resulting from any ideas, methods, instructions or products referred to in the content. |
© 2024 by the authors. Licensee MDPI, Basel, Switzerland. This article is an open access article distributed under the terms and conditions of the Creative Commons Attribution (CC BY) license (https://creativecommons.org/licenses/by/4.0/).