Abstract
Dual fluidized bed (DFB) reactor systems are widely used in gas–solid two-phase flow applications, whose gas–solid flow characteristics have a significant effect on the performance of many kinds of technologies. A numerical simulation model was established on the basis of a large-scale DFB reactor with a maximum height of 21.6 m, and numerical simulations focused on gas–solid flow characteristics were carried out. The effects of the superficial gas velocity of both beds and the static bed height and particle size on the distribution of the pressure and solid suspension density and the solid circulation rate were studied. The simulation results were in good agreement with the experimental data. With the strong support of the experimental data, the gas–solid flow characteristics of large-scale DFB reactors were innovatively evaluated in this numerical simulation study, which effectively makes up for the shortcomings of the current research. The results showed that the superficial gas velocity of both beds and the static bed height have different degrees of influence on the gas–solid flow characteristics. Specifically, for 282 μm particles, when the superficial gas velocity of both beds and the static bed height were 4.5 m/s, 2.5 m/s, and 0.65 m, respectively, under typical working conditions, the bottom pressure of the two furnaces was 3412.42 Pa and 2812.86 Pa, respectively, and the solid suspension density was 409.44 kg/m3 and 427.89 kg/m3, respectively. Based on the simulation results, the empirical formulas of the solid circulation rate were fitted according to different particle sizes. Under similar conditions, the solid circulation rates of particles with a particle size of 100 μm, 282 μm, 641 μm, and 1000 μm were 2.84–13.28, 0.73–4.91, 0.024–0.216, and 0.0026–0.0095 kg/(m2s), respectively. It can be found that the influence of the particle size on the solid circulation rate is the most significant among all parameters.
1. Introduction
In the context of carbon neutrality, the DFB (dual fluidized bed) reactor has attracted more and more attention [1]. A DFB reactor is a coupling of two fluidized beds, which is widely used in a variety of energy efficient and clean utilization technologies, including coal staged conversion technology [2], biomass gasification technology [3], chemical looping combustion technology [4], and calcium looping technology [5]. As shown in Figure 1, in different technologies, the two fluidized bed reactors cooperate with each other and play different roles in order to achieve the process flow required by the technologies.
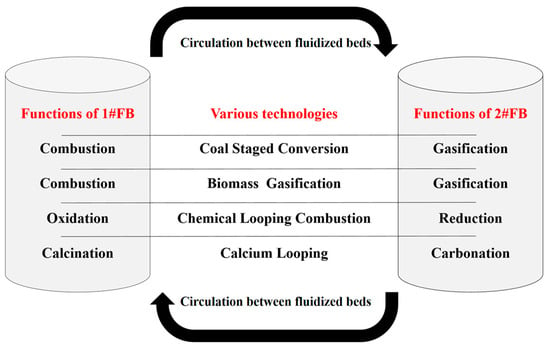
Figure 1.
The specific roles of a DFB reactor in various technologies.
The gas–solid flow characteristics such as pressure distribution, solid suspension density distribution, and solid circulation rate are the key and intuitive parameters to judge the normal operation of a fluidized bed reactor system. The same is true for a complex DFB reactor [1]. In particular, the normal operation of a DFB reactor depends on sufficient circulation of material and heat between the two fluidized beds. The solid circulation rate is a very intuitive representation of the level of material circulation between two fluidized beds, which makes this parameter more important. Therefore, it is of great necessity to carry out research on DFB reactors so as to understand their gas–solid flow characteristics, especially the solid circulation rate.
Various studies on the gas–solid flow characteristics of a fluidized bed have been reported by many researchers. Jie Xu et al. studied gas–solid flow characteristics at the riser wall of a CFB and proposed quantified empirical formulas for estimating key characteristics based on the experiment data [6]. Qitao Bian et al. used electrical capacitance volume tomography to explore particle flow characteristics in a CFB recirculation system and the experimental results showed that the branch had a great impact on the particle flow characteristics in the CFB riser [7]. Michael Stollhof et al. proposed an estimation method of the solid circulation rate in CFB systems after measuring the pressure drop and other parameters in experiments on four different fluidized bed units [8]. Pil-Sang Youn et al. gathered data from their own research and other references and successfully developed empirical formulae of the solids circulation rate and solids inventory in the riser of the CFB [9]. However, these studies were based on a single fluidized bed reactor. For a DFB reactor coupled by two fluidized beds, the internal flow field is simultaneously affected by the operating parameters of both reactors, which allows the gas–solid flow characteristics to change more unpredictably. For example, the solid circulation rate of a single fluidized bed reactor measures its own material circulation, while in a DFB reactor, the solid circulation rate measures the extent to which the material circulates between the two fluidized bed reactors. Therefore, the gas–solid flow characteristics of single fluidized bed reactors are not suitable for DFB reactors.
There are many researchers who have studied the DFB reactor in experimental way. Tobias Proll et al. conducted a series of cold flow model experiments on a 1.8 m scaled DFB reactor, whose results showed that the system ran with high solids circulations between the two reactors, even at low bed inventories [10]. Chunbao Zhou et al. designed and constructed a 4.0 m scaled DFB reactor and drew a conclusion that DFB is a promising system to achieve carbon negative economy, which deserves more research in the future [11]. Fangjun Wang et al. carried out investigations on biomass gasification of 4.8 m scaled compact-fast dual fluidized bed calcium looping and reported that an increase of the solid circulation rate can improve the concentration and the yield of hydrogen, and decrease the content of tar [12]. In general, the existing experimental studies on DFB reactors have not paid enough attention to the gas–solid flow characteristics of these reactors. Even if there are occasional studies focusing on the gas–solid flow characteristics, the research scale, limited by the experimental cost, is far from the actual production scale. Large gaps in scale are likely to lead to unpredictable changes, so the results of small-scale experiments have great limitations in guiding actual production.
Other researchers have carried out numerical simulations based on DFB reactors. Peter Ohlemuller et al. used a validated Aspen simulation model to study the effects of pressure drop, temperature, circulation characteristics, and other factors on the carbon capture performance of a DFB-based CLC pilot plant [13]. Yao Zhu et al. also used Aspen to simulate low-rank coal pyrolysis staged conversion polygeneration technology with a semi-coke heat carrier based on a dual-fluidized bed and found that this technology has absolute advantages in economy compared to the other two polygeneration methods [14]. The results of a numerical investigation reported by Liyan Sun et al. of a 1 MW full-loop chemical looping combustion unit with a DFB reactor showed that the system efficiency was positively correlated with the operating temperature and solid inventory [15]. Numerical simulation on a 1 MWth pilot-scale chemical looping combustion system was carried out by Junjie Lin et al., showing that a higher coal feeding rate will raise the solid temperature, which has positive effects on product yields but negative effects on the transport of solid particles in the system [16]. In general, the existing numerical simulation research on DFB reactors is mainly divided into Aspen simulations and CFD simulations. Aspen simulations pay more attention to the theoretical efficiency and other economic parameters of the process, rather than the internal characteristics of the reactor. Although CFD simulations pay attention to various characteristics of the reactor, they tend to pay more attention to the reaction characteristics and pay less attention to the gas–solid flow characteristics, especially the solid circulation rate.
In summary, gas–solid flow characteristics, especially the solid circulation rate, are the key parameters used to judge the normal operation of a DFB reactor system. In the existing relevant research, the gas–solid flow characteristics studies based on single fluidized bed reactors have lost their reference significance because of the coupling of two fluidized beds. The scale of the experimental systems used in the experimental research based on DFB reactors has a large gap with the actual production, which leads to its reliability being greatly reduced when used to guide the actual production. The numerical simulation research based on DFB reactors pays little attention to the gas–solid flow characteristics, especially the solid circulation rate. Therefore, the existing research on the gas–solid flow characteristics of DFB reactors is still not sufficient.
In view of this, a numerical simulation model was established on the basis of a large-scale DFB reactor with a maximum height of 21.6 m, and a numerical simulation focused on gas–solid flow characteristics was carried out. In this paper, the effects of the superficial gas velocity, static bed height, and particle size on the gas–solid flow characteristics of the DFB reactor, including its pressure distribution, solid suspension density distribution, and solid circulation rate, were studied. The experimental data and simulation results were compared to verify the validity of the numerical simulation model. The validated model was used to simulate the extended working conditions, including a higher static bed height and different superficial gas velocities and particle sizes so as to complete and supplement the data curve. To focus on the solid circulation rate, an empirical formula for a solid circulation rate fitted based on the cold experimental results was firstly verified, and the empirical formula for the solid circulation rate applicable to different particle sizes was further proposed.
With the strong support of the experimental data, the gas–solid flow characteristics of large-scale DFB reactors were innovatively investigated in this numerical simulation study. In particular, a series of empirical formulas were proposed to pay attention to the solid circulation rate. These scientific and innovative results effectively make up for the shortcomings of the current research.
2. CFD Model
2.1. Simulation Objects
Based on the cold mode experiment, a 3D model was constructed according to an actual DFB reactor with a 1:1 ratio, and CFD numerical simulation was carried out using Ansys Fluent 19.0. This research is divided into two parts, verification and extension. Verification refers to using experimental data from previous work to verify the validity of a numerical simulation model. Extension refers to using the validated numerical simulation model to simulate the working conditions not studied in the experimental research, so as to extend and improve the data curve and improve the practicability of the research results.
2.1.1. Verification
Strictness was ensured through two ways in the verification part. On the one hand, the main preset parameters of the simulation, including superficial gas velocity, static bed height, and particle size, were the same as in the experimental study. On the other hand, the main simulation results were compared with the experimental data, including the pressure distribution, solid suspension density distribution, and the solid circulation rate.
2.1.2. Extension
In order to perfect the data curve and improve the reference significance of the research results for practical production applications, the working conditions not involved in the experimental research were simulated. In the first part, different superficial gas velocities and static bed height were used for the simulation. This part of the work improved the data curve of the effect of the superficial gas velocity and static bed height on the gas–solid flow characteristics, and it verified the empirical formula of the solid circulation rate summarized in the experimental study by using new conditions. In the second part, various particle sizes were used for simulation.
This part of the simulation results was sorted into different series according to different particle sizes. Combined with the form of the original empirical formula, the solid circulation rate was fitted with the superficial gas velocity and static bed height, so as to form a series of empirical formulas for practical production reference.
2.2. Model Structure
As shown in Figure 2, the reactor model is mainly divided into 1#FB and 2#FB, with two furnaces, four cyclones, and four loop-seals. The size and structural design of each part of the reactor are shown in Table 1.
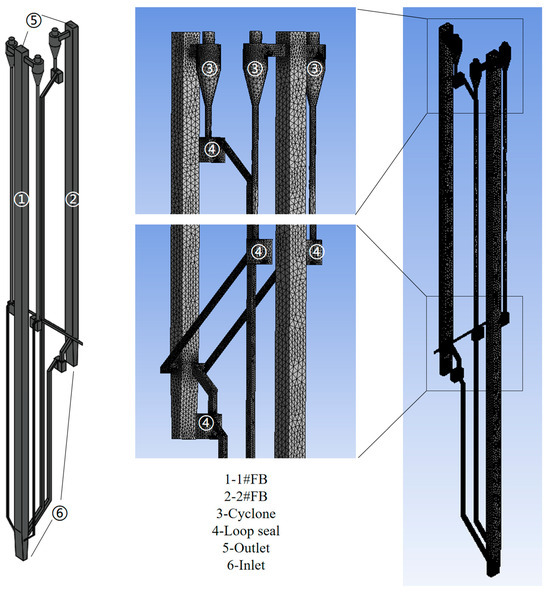
Figure 2.
The structure of the DFB system.

Table 1.
Size and structure design of main parts.
2.3. Simulation Considerations
Referring to the experiment, quartz sand and air were used as the circulating material and the fluidized gas, respectively, in the simulation. The quartz sand in 1#FB is returned to 2#FB by two loop-seals arranged symmetrically. Then, the quartz sand in 2#FB is returned to 1#FB by the upper loop-seal and the bottom loop-seal of 2#FB, respectively. In this way, material circulation between the two reactors is achieved.
Because cold mode simulation was developed, various chemical changes and heat transfer effects were not considered. An RNG (renormalization group) k-ε model was adopted as the turbulence model, which is widely used in numerical simulation. The RNG k-ε model, proposed by Yakhot and Orzag in 1986, is a mathematical model derived from renormalization group methods on instantaneous N-S equations [17]. The equations and coefficients are derived from analytical solutions, improving the ability to simulate high-strain flows in ε equations. Soo-Hwang Ahn et al. used a modified RNG k-ε model to propose an unsteady prediction of cavitating flow around a three-dimensional hydrofoil and the results showed that strong turbulence is mainly produced in the condensation process, which delays the cavitation inception in the next cycle [18].
In the consideration of multiphase flow, due to the particularity of the materials used, the drag force between the air and sand must be emphasized. Some researchers consider interactions between particles [19,20]. Among the many drag models, the EMMS (energy minimization multi-scale) model, proposed by Jinghai Li, is widely recognized and adopted [21,22]. The EMMS model decomposes the local inhomogeneity of a gas–solid into the coexistence of three homogeneous subsystems, including a dense phase, a dilute phase, and a meso-scale interphase. The governing equations are listed for the three subsystems, and the energy consumption of transporting suspended particles in the system is taken as the stability condition to solve the problem so as to obtain the local flow parameters. Compared with other drag models, the EMMS can give more accurate drag values when the voidage is between 0.1 and 0.5. In Emad Ghadirian’s work, the EMMS model performed better in several simulations compared to Syamlal O’Brien’s model and Wen and Yu’s model [23]. Timo Dymala et al. reported that simulations with the EMMS-based drag model show good agreement with the time-averaged axial solids concentration, circulation rate, and riser pressure drop [24]. Yuelin Yang et al. and Pedram Pakseresht et al. also carried out simulations using EMMS models [25,26].
The main conditions involved in the simulation are shown in Table 2.

Table 2.
Numerical conditions.
2.4. Governing Equation
2.4.1. Continuity Equation
For gas phase:
For solid phase:
2.4.2. Momentum Equation
For gas phase:
where the gas stress tensor:
For solid phase:
where the solid stress tensor:
2.4.3. RNG k-ε Model
Equation of turbulent kinetic energy:
Equation of dissipation rate of turbulent kinetic energy:
2.4.4. EMMS Model
Momentum equation for dense phase:
Momentum equation for dilute phase:
Pressure drop balance equation:
Mass conservation equation for gas phase:
Mass conservation equation for solid phase:
Diameter of cluster:
Total voidage equation:
Stability conditions:
3. Results and Discussion
3.1. The Effect of Grid Resolution
It is necessary to determine the effect of grid resolution on the simulation results before proceeding to the formal simulation. In view of this, three simulation cases with a grid of 276,732, 341,146, and 421,208 cells are conducted. As shown in Figure 3 and Figure 4, the pressure distribution along the furnace height of both furnaces was almost identical in all three cases when the superficial gas velocity of 1#FB and 2#FB was 3.5 m/s and 2.5 m/s and the static bed height was 0.65 m. This indicates that the grid resolution has very little effect on the simulation results. Therefore, considering both the accuracy of the results and the time cost, the formal simulations were carried out adopting the 341,146 cells grid.
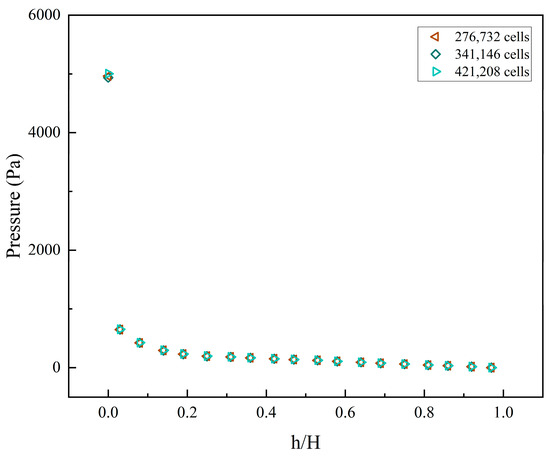
Figure 3.
The pressure distribution along the height of 1#FB under different grid resolutions.
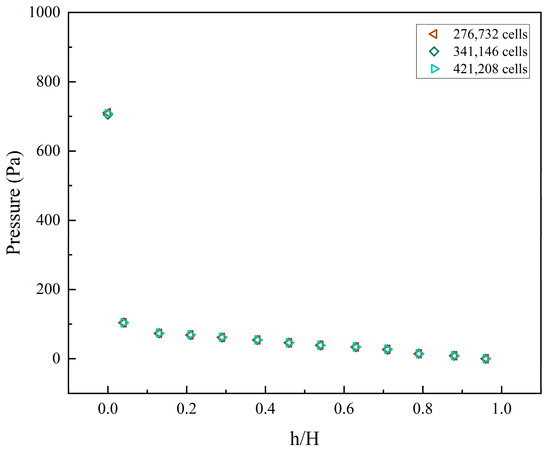
Figure 4.
The pressure distribution along the height of 2#FB under different grid resolutions.
3.2. Verification
In the verification parts, two series of simulations focusing on the superficial gas velocity of 1#FB and the static bed height were conducted using particles with a particle size of 282 μm as materials, and two series of results were obtained. The simulation results revealed the operation pattern of the DFB system preliminarily. After being compared with the experimental data, the simulation results effectively verified the validity of the numerical simulation model, which laid a solid foundation for the work in the expansion stage.
3.2.1. The Effects of Superficial Gas Velocity of 1#FB on Gas–Solid Flow Characteristics
Figure 5 and Figure 6 show the effects of the superficial gas velocity of 1#FB on the distribution of the furnace pressure through the pressure contour and pressure distribution along the height of the furnace, respectively. In the verification parts, the particle size used was 282 μm. In this series, the static bed height and superficial gas velocity were fixed at 0.65 m and 2.5 m/s, respectively, while the superficial gas velocity of 1#FB was 3.0, 3.5, 4.0, and 4.5 m/s. In Figure 5, the superficial gas velocity of 1#FB corresponding to each pressure contour from left to right gradually increased. As can be seen from Figure 5, the pressure was balanced between important components such as the bottom of the two furnaces and four loop-seals. Specifically, the pressure at the bottom of the two furnaces was relatively large, and this bottom area was about 1/10 of the total furnace height. With the increase in height, especially when the critical point of 1/10 was broken, the pressure decreased rapidly. This is because in the material balance, the material is piled up at the bottom of the furnace, and is very thin in the upper part. As can be seen from the figure, with the increase of the superficial gas velocity of 1#FB, the pressure at the bottom of 1#FB obviously decreases. The pressure change at the bottom of 2#FB gradually increases slightly. Due to the scale range, the change in the bottom of 2#FB is not easily detected, which can be more intuitively observed in the pressure distribution diagram along the furnace height.
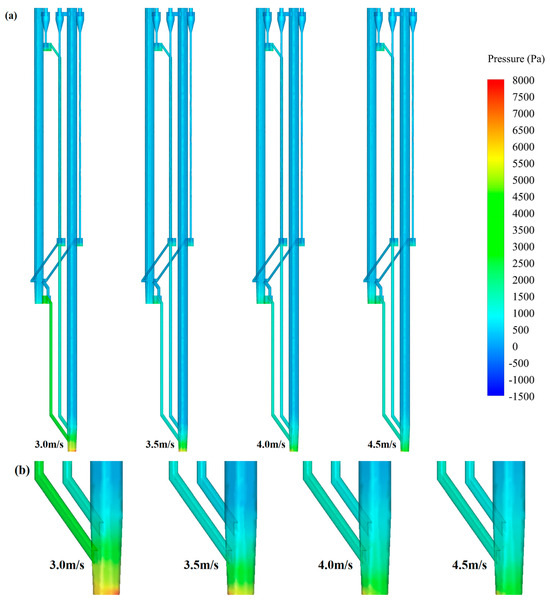
Figure 5.
Pressure contour under different superficial gas velocities of 1#FB: (a) Full view; (b) partially enlarged view.
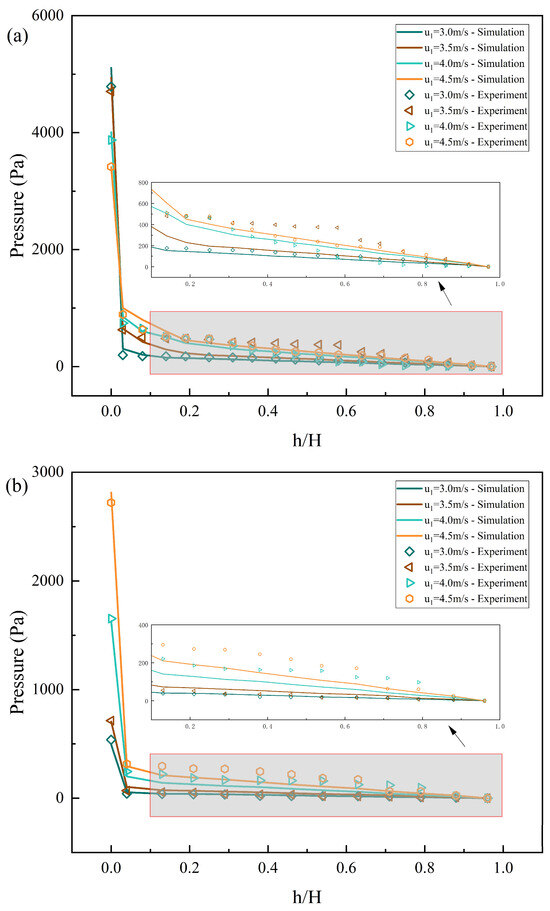
Figure 6.
The effects of superficial gas velocity of 1#FB on the pressure distribution along the furnace height: (a) 1#FB; (b) 2#FB.
Figure 6a,b show the distribution of the pressure of 1#FB and 2#FB along the furnace height, respectively. Compared with the pressure contour, the graph shows more detailed changes. In addition, in the graph, the simulation results and experimental data are directly compared so as to verify the validity of the simulation results and the accuracy of the established model. The superficial gas velocity of 1#FB has a regular and clear effect on the pressure balance of the two furnaces. It can be clearly seen from Figure 6a that the furnace bottom pressure of 1#FB decreases with the increase of superficial gas velocity of 1#FB, while the pressure in the upper zone increases with the increase of the superficial gas velocity of 1#FB. Correspondingly, Figure 6b shows that the pressure at each height of 2#FB increases with the increase of superficial gas velocity of 1#FB. By comparing the simulation results with the experimental data, it can be found that the general trend of both series is consistent, and the data points in the two series match each other well. Specifically, the bottom data points fit well, which verifies the accuracy of the simulation results. In the middle and upper part, the pressure values obtained by the experiment fluctuate greatly but still have a certain law, while the simulation results completely show a relatively uniform law, which can be easily observed in the local magnification diagram. The reason can be considered that the experiment is subject to more external influences, and the error is relatively larger, which leads to large fluctuations of each data point under the constraint of a certain law, and causes great interference with the summary of the law. In contrast, simulations are carried out in idealized environments and settings, so that the results are easily uniform. Compared with the experiment, numerical simulation has some advantages in exploring and summarizing the trend and law.
Figure 7 and Figure 8 show the effects of the superficial gas velocity of 1#FB on the solid suspension density distribution through the contour of the solid suspension density and the distribution of the solid suspension density along the furnace height, respectively. The setting of its working condition is consistent with that in Figure 5 and Figure 6 above. In Figure 7, the superficial gas velocity of 1#FB corresponding to each solid suspension density contour from left to right gradually increases. For 1#FB, its dense phase zone height is about 1/10 of the total furnace height. With the increasing superficial gas velocity of 1#FB, the solid suspension density of the dense phase zone shows a decreasing trend. It is worth noting that its fluidization state also changes continuously. When the superficial gas velocity of 1#FB is 3.0 and 3.5 m/s, the fluidization state is roughly a turbulent bed. This state is conducive to adequate heat and mass transfer in the bottom region. When the superficial gas velocity of 1#FB is 4.0 and 4.5 m/s, the fluidization state is roughly in a fast bed state. This state facilitates the rapid transfer of materials throughout the furnace, thereby improving the level of material circulation between the two furnaces. For 2#FB, contrary to 1#FB, as the superficial gas velocity of 1#FB continues to increase, its solid suspension density in the bottom area shows an increasing trend. The change in the solid suspension density at the bottom of the two furnaces reflects the effects of the superficial gas velocity of 1#FB on the material balance. That is, the increase in the superficial gas velocity of 1#FB will cause the material balance to shift to 2#FB. By keeping the superficial gas velocity 2 constant at 2.5 m/s, the fluidization state of 2#FB is always in a bubbling bed state. This indicates that the residence time of the material in 2#FB is generally larger than in 1#FB.
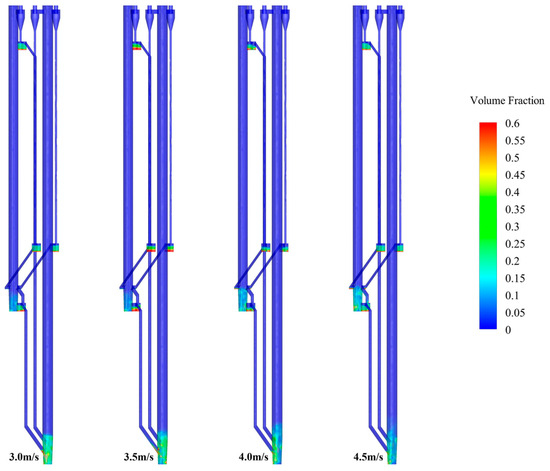
Figure 7.
Volume fraction contour under different superficial gas velocities of 1#FB.
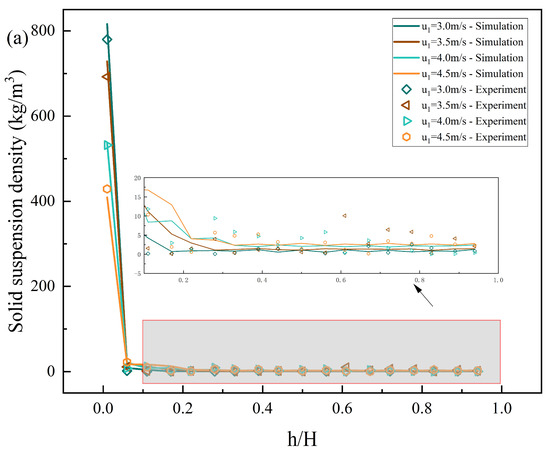
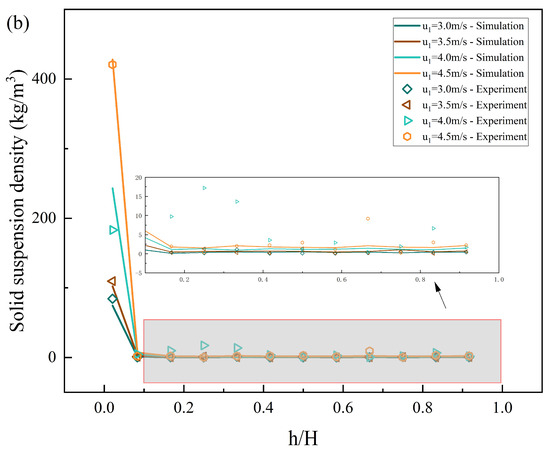
Figure 8.
The effects of superficial gas velocity of 1#FB on the solid suspension density distribution along the furnace height: (a) 1#FB; (b) 2#FB.
Figure 8a,b show the distribution of solid suspension density of 1#FB and 2#FB along the furnace height, respectively. Here, the simulation results are also compared with the experimental data. The superficial gas velocity of 1#FB also has a regular effect on the solid suspension density distribution of the two furnaces. It can be clearly seen from Figure 8a that the solid suspension density at the bottom of 1#FB decreases with the increase in the superficial gas velocity of 1#FB, and yet the solid suspension density in the upper part increases with the increase of the superficial gas velocity of 1#FB. Correspondingly, Figure 8b shows that the solid suspension density at each height of 2#FB increases with the increase of the superficial gas velocity of 1#FB. This is because the increase of the superficial gas velocity of 1#FB changes the material balance, resulting in the transfer of materials from 1#FB to 2#FB, leading to a decrease in the material density in the dense phase zone at the bottom of 1#FB. At the same time, the increase in the superficial gas velocity improves the conveying effect on the material, resulting in a slight increase in the density of 1#FB in the dilute phase zone on the whole.
In the comparison between the simulation results and experimental data, it can be seen from the figure that for most of the data points, the experimental values and simulation results are very close. Only when u = 4.0 m/s, in the dilute phase zone (h/H < 0.1), there is a large error in absolute value between the two. The reasons may be as follows. First of all, although the absolute error is large, the error is about 10, and the simulation results and experimental data of the bottom dense phase zone (h/H < 0.1) are about 200. The relative error is about 5%, which is acceptable. Secondly, because the other three series are well matched, and the computer used in the simulation is absolutely stable, the error when u = 4.0 m/s may come from the fluctuations and measurement errors of the experimental system during the experiment, which indicates that the data obtained from the experiment may not be completely reliable. Therefore, our simulation revised this part of the data to make the data more reliable. Finally, the consistency of the data in the bottom dense phase zone (h/H > 0.1) is more important because this region contains most of the material. In summary, a few absolute errors do not affect the consistency of the overall trend of the two, which once again verifies the accuracy of the simulation results.
Figure 9 shows the effects of the superficial gas velocity of 1#FB on the solid circulation rate and compares the experimental data with the simulation results. In the figure, the horizontal coordinate is the superficial gas velocity of 1#FB, and the vertical coordinate is the solid circulation rate. As can be seen from the figure, the trend of the experimental data and simulation results is the same, and the values are also very close in general. Specifically, the solid circulation rate is positively correlated with the superficial gas velocity of 1#FB. The solid circulation rate of the experimental data is about 0.20–1.75 kg/(m2s), while the solid circulation rate of the simulation results is about 0.75–2.25 kg/(m2s).
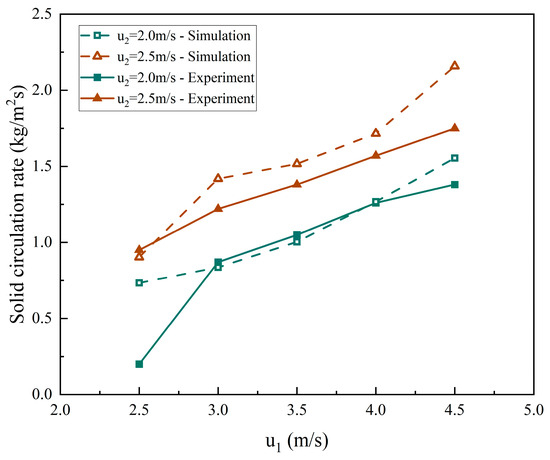
Figure 9.
The effects of the superficial gas velocity of 1#FB on the solid circulation rate.
It is worth mentioning that when the superficial gas velocity of 1#FB and 2#FB are 2.5 m/s and 2.0 m/s, respectively, the experimental data significantly deviates from the normal range. This means that the superficial gas velocity is too low, which results in an abnormal circulating flow of the system material. What is significantly different is that the simulation results under this condition are in line with the normal trend; that is, the system is still in the normal circulation flow state at this time. The reason should be that the numerical simulation makes idealized assumptions, while the experiment has many practical limitations, which leads to the difference.
3.2.2. The Effects of Static Bed Height on Gas–Solid Flow Characteristics
Figure 10 and Figure 11 show the effects of the static bed height on the pressure distribution through the pressure contour and pressure distribution along the furnace height. In this series, the superficial gas velocity of 1#FB and 2#FB were fixed at 4.5 m/s and 2.5 m/s, respectively, while the static bed heights were 0.65, 0.95, and 1.25 m, respectively. In Figure 10, the value of the static bed height corresponding to each pressure contour increases gradually from left to right. As can be seen from Figure 10, with the increase of static bed height, the pressure at the bottom of both furnaces increases significantly, which is an inevitable result of the gradual increase in the amount of materials at the bottom of the furnaces. Figure 11 shows more detailed data. The solid suspension density increased at all altitudes. Specifically, the dense phase zone in the bottom part is raised much more than the dilute phase zone in the upper part. This shows that limited by the superficial gas velocity conveying capacity in the furnace, the increase in bed materials caused by the increase in static bed height is mainly concentrated at the bottom of the furnace.
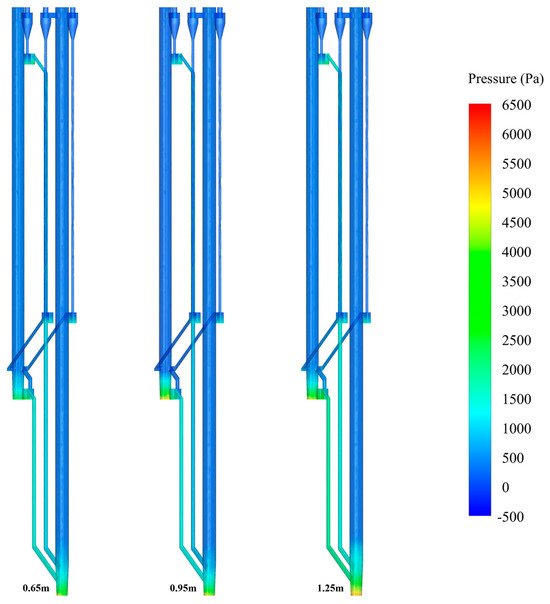
Figure 10.
Pressure contour under different static bed heights.
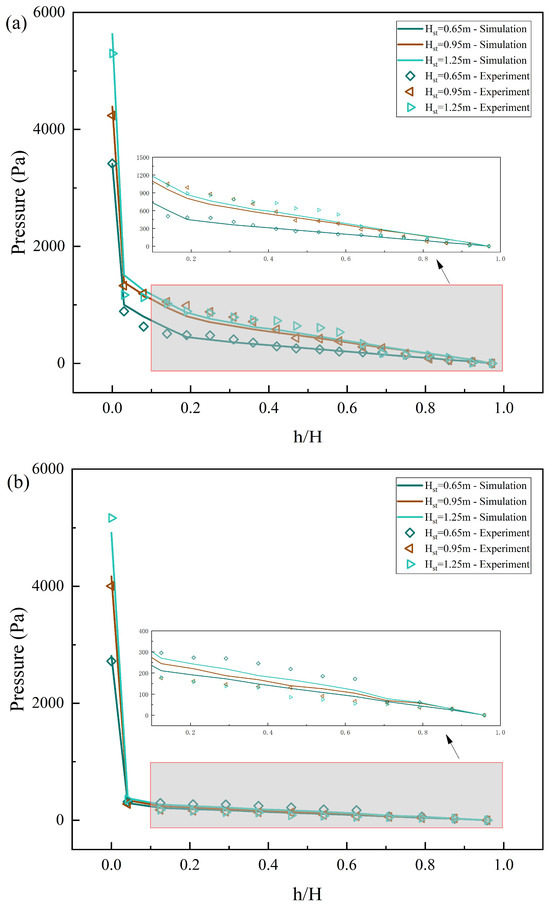
Figure 11.
The effects of static bed height on the pressure distribution along the furnace height: (a) 1#FB; (b) 2#FB.
Figure 12 and Figure 13 show the effects of the static bed height on the solid suspension density through the solid suspension density contour and the distribution graphs of the solid suspension density along the furnace height. The setting of its working condition is consistent with that in Figure 10 and Figure 11 above. In Figure 12, the static bed height values corresponding to each solid suspension density contour gradually increase from left to right. As can be seen from the figure, the fluidization state of 1#FB is roughly in a fast bed state, while the fluidization state of 2#FB is always in a bubbling bed state. At the same time, with the gradual increase of static bed height, the height of the dense phase zone of the two furnaces also gradually increases. When the static bed height is 0.65, 0.95, and 1.25 m, the dense phase zone height of 1#FB is about 1.49, 1.86, and 2.23 m, while the height of the dense phase zone of 2#FB is about 1.12, 1.22, and 1.31 m, respectively. The reasons behind this are obvious. The increase of static bed height leads to the increase of the initial material in the bed, which also increases the solid suspension density of the material in the bed. In particular, since most of the materials are concentrated at the bottom of the furnace during operation, the increase in the bottom materials is particularly obvious, which correspondingly increases the height of the dense phase zone. Figure 13a,b show the distribution of solid suspension density along the furnace height of 1#FB and 2#FB, respectively. The increase in static bed height directly increases the solid suspension density of both furnaces at all heights. Among them, the increase in the bottom is significantly greater than that of the upper area. The reasons for this are as described above.
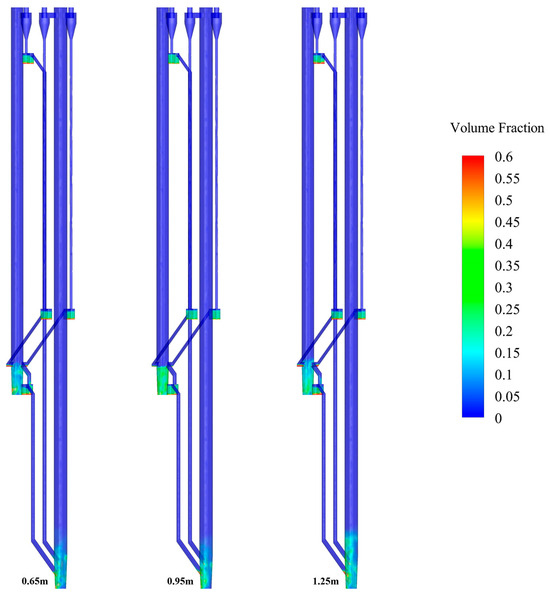
Figure 12.
Volume fraction contour under different static bed heights.
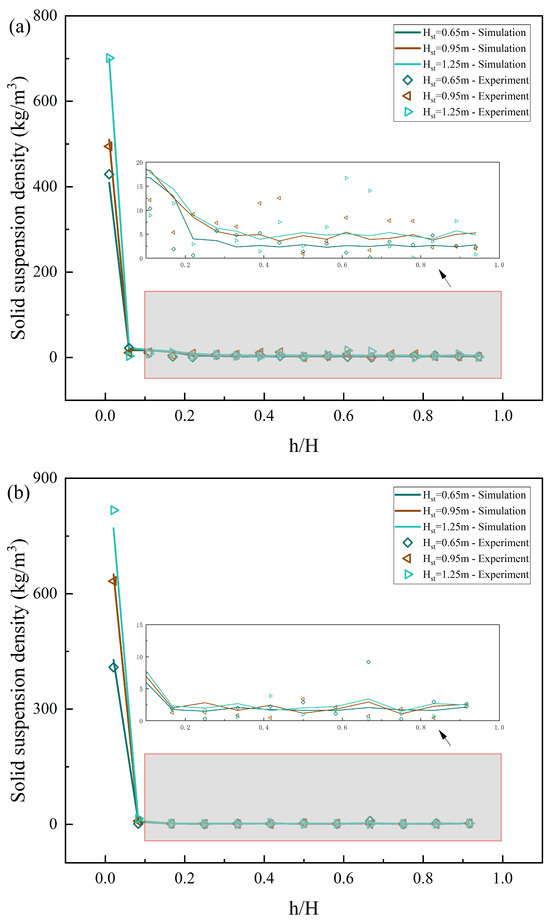
Figure 13.
The effects of static bed height on the solid suspension density distribution along the furnace height: (a) 1#FB; (b) 2#FB.
Figure 14 shows the effects of the static bed height on the solid circulation rate and compares the experimental data with the simulation results. In the figure, the horizontal coordinate is the static bed height and the vertical coordinate is the solid circulation rate. As can be seen from the figure, the solid circulation rate is positively correlated with the static bed height. Specifically, when the three superficial gas velocity settings were used for steady operation, the solid circulation rate given by the experimental data and the simulation results was very close, which is about 0.8–3.6 kg/(m2s). It is worth mentioning that in this series of data, a marginal decreasing phenomenon of the influence of the superficial gas velocity of 1#FB and the static bed height on the solid circulation rate is observed. When the static bed height is equal to 0.65 m, the impact of the superficial gas velocity on the solid circulation rate of the two furnaces is much lower than when the static bed height is equal to 0.95 m and 1.25 m. When the superficial gas velocity of 2#FB is equal to 2 m/s, and the superficial gas velocity of 1#FB is equal to 3 m/s, the effect of the static bed height on the solid circulation rate is much lower than when the other two superficial gas velocity settings are used.
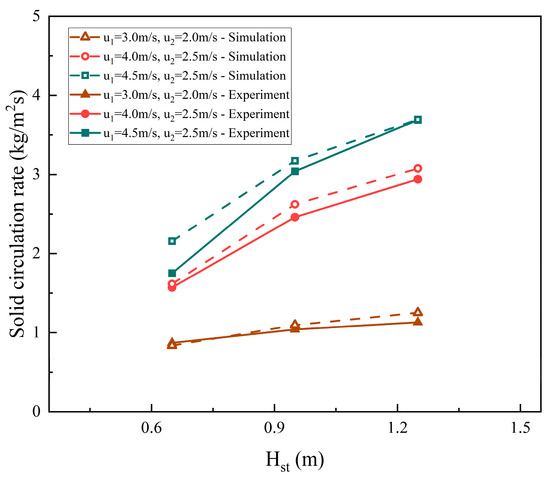
Figure 14.
The effects of static bed height on the solid circulation rate.
3.3. Extension
In the extension stage, firstly, a particle with a particle size of 282 μm was used as the material in simulations focusing on the superficial gas velocity of 2#FB and the static bed height. The effects of the superficial gas velocity of 2#FB on the gas–solid flow characteristics were obtained. The effects of the static bed height on the gas–solid flow characteristics were expanded and deepened. In addition, aiming at the characteristics of the solid circulation rate, four particle sizes of 100 μm, 282 μm, 641 μm, and 1000 μm were used in the simulations, and a series of data were obtained and fitted to obtain empirical formulas. The effects of the particle size on the solid circulation rate were analyzed and summarized.
3.3.1. The Effects of Superficial Gas Velocity of 2#FB on Gas–Solid Flow Characteristics
Figure 15 and Figure 16 are the pressure contour and solid suspension density contour, respectively, where the effects of the superficial gas velocity of 2#FB on the distribution of the furnace pressure and solid suspension density are presented. In this series, the particle size, superficial gas velocity of 1#FB, and static bed height were 282 μm, 4.5 m/s, and 0.65 m, respectively, while the superficial gas velocity of 2#FB was 2.0, 2.5, 3.0, and 3.5 m/s, respectively. In each group of graphs, the values of the superficial gas velocity of 2#FB corresponding to each contour from left to right gradually increases. When the superficial gas velocity of 2#FB increases, the solid suspension density at the bottom of 1#FB increases, while the solid suspension density at the bottom of 2#FB decreases. The same pattern applies to pressure. From the solid suspension density contour, it can be seen that with the gradual increase of the superficial gas velocity of 2#FB, the flow state of 2#FB continues to evolve. When the superficial gas velocity of 2#FB is 2.0 m/s, 2#FB is in a bubbling bed state. When the superficial gas velocity of 2#FB is 2.5 and 3.0 m/s, 2#FB gradually transforms into a turbulent bed, and the material balance gradually moves to 1#FB. When the superficial gas velocity of 2#FB is 3.5 m/s, the strong transport capacity of the superficial gas velocity of 2#FB superimposes the spatial position relationship, resulting in the material in 2#FB being unable to form a dense phase zone stably. Instead, it is quickly circulated to 1#FB. For 1#FB, with the continuous increase of superficial gas velocity 2, the material balance continues to push to 1#FB, and the materials in it continue to increase, thus raising the height of the dense phase zone.
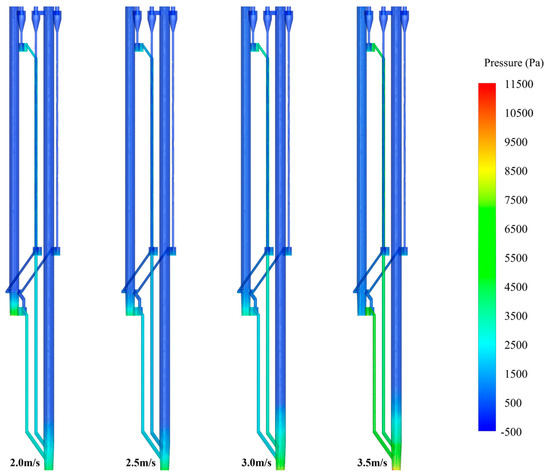
Figure 15.
Pressure contour under different superficial gas velocities of 2#FB.
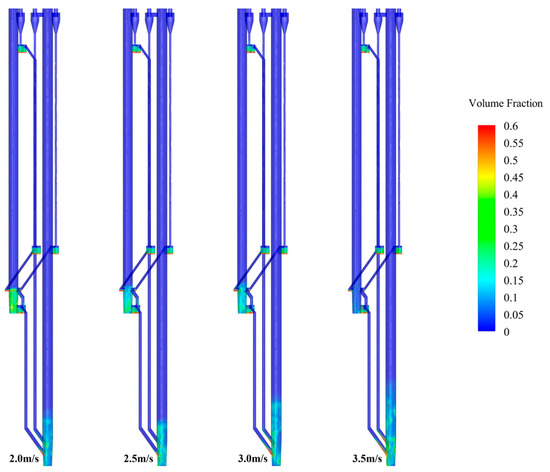
Figure 16.
Volume fraction contour under different superficial gas velocities of 2#FB.
Figure 17 shows the effect of the superficial gas velocity of 2#FB on the solid circulation rate when the superficial gas velocity of 1#FB is 4.5 m/s. The horizontal coordinate is the superficial gas velocity of 2#FB, and the vertical coordinate is the solid circulation rate. As can be seen from the figure, the solid circulation rate is positively correlated with the superficial gas velocity of 2#FB. In this series, the solid circulation rate was about 2.5–5.0 kg/(m2s). As far as the growth rate of the solid circulation rate, the superficial gas velocity of 2#FB has the same effect as that of 1#FB.
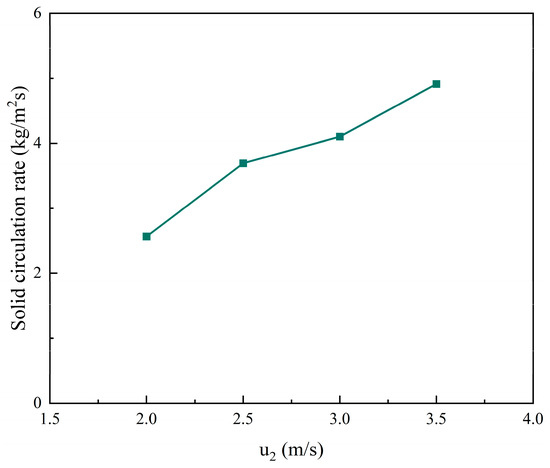
Figure 17.
The effects of superficial gas velocity of 2#FB on the solid circulation rate.
3.3.2. The Effects of Static Bed Height on Gas–Solid Flow Characteristics
Figure 18 and Figure 19 show the pressure contour and solid suspension density contour, respectively, showing the effects of the static bed height on the distribution of the pressure and solid suspension density, respectively. In this series, the particle size and superficial gas velocity of 1#FB and 2#FB were 282 μm for both, and 4.5 m/s and 2.5 m/s, respectively. The static bed height was 0.65, 0.95, 1.25, 1.55, 1.85, and 2.15 m, respectively. In each group of graphs, the value of the static bed height corresponding to each contour from left to right gradually increases. Compared with the verification phase, three new working conditions were added to obtain more simulation results and fully improve the data series to summarize deeper rules. When the static bed height increases, the amount of material in the bed increases, the overall solid suspension density in the bed increases, and the pressure also increases. Since the superficial gas velocity of the two furnaces remains constant, the flow states of 1#FB and 2#FB are always a turbulent bed and bubbling bed, respectively. At the same time, the height of the dense phase zone of the two furnaces continues to increase with the increase in the static bed height. When the static bed height is 1.55, 1.85, and 2.15 m, the height of the dense phase zone of 1#FB is 2.63, 2.82, and 3.01, while that of 2#FB is 1.52, 1.61, and 1.71 m, respectively. It can be seen that the height of the dense phase zone of 1#FB has a more obvious variation.
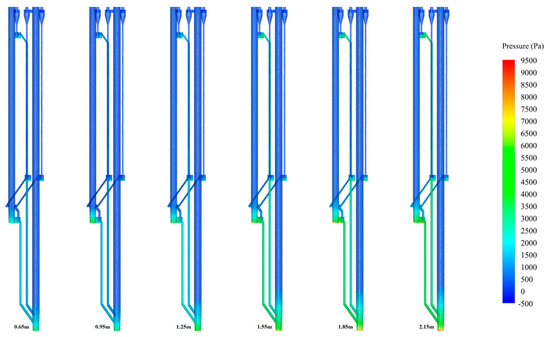
Figure 18.
Pressure contour with new static bed height.
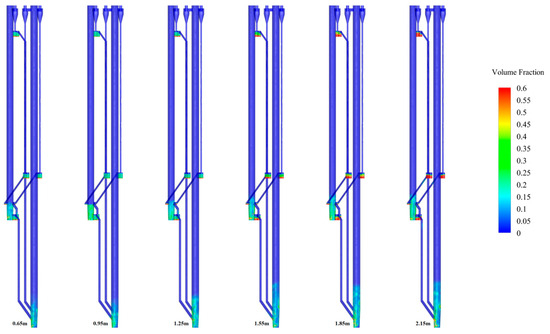
Figure 19.
Volume fraction contour with new static bed height.
Figure 20 shows the effects of the static bed height on the solid circulation rate. In the figure, the horizontal coordinate is the static bed height and the vertical coordinate is the solid circulation rate. In this series, the solid circulation rate was about 1.9–4.5 kg/(m2s). As can be seen from the figure, the solid circulation rate and static bed height are still positively correlated, but there is a marginal decreasing phenomenon. When the static bed height increases from 0.65 m to 0.95 m, the solid circulation rate jumps sharply from 1.9 kg/(m2s) to 3.2 kg/(m2s). Subsequently, with the continuous increase in the static bed height, the increase in the solid circulation rate is far less than before. This is because although the materials available for circulation in the bed are gradually increasing, the conveying capacity of the airflow of the two furnaces is limited, thus limiting the continuous increase of the solid circulation rate.
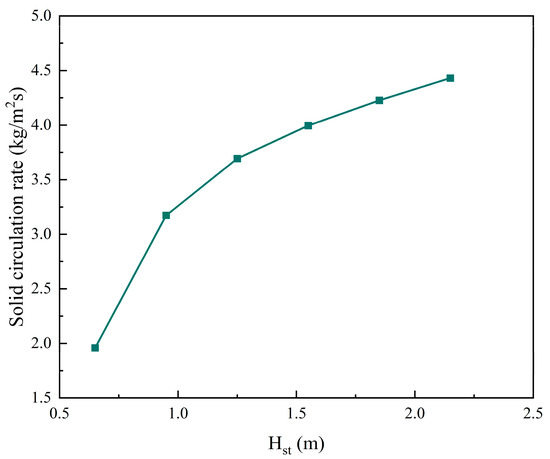
Figure 20.
The effects of static bed height on the solid circulation rate (Extension).
3.3.3. Empirical Formulas of Solid Circulation Rate
Figure 21 shows the fitting of the solid circulation rate of the particles with a particle size of 282 μm with the superficial gas velocity of the two furnaces and the static bed height during steady operation. During fitting, the parameters in the fitting were nondimensionalized based on the simulation that the static bed height is 0.65 m, the superficial gas velocity of 1#FB is 2.5 m/s, the superficial gas velocity of 2#FB is 2 m/s, and the solid circulation rate is 0.2 kg/(m2s). Since the three parameters comprehensively affect the solid circulation rate, and their effects all have a marginal diminishing effect, the following form of fitting is adopted:
where Gs is the solid circulation rate in kg/(m2s); a is a constant defined after fitting; Hst is the static bed height in m; u1 is the superficial gas velocity of 1#FB in m/s; and u2 is the superficial gas velocity of 2#FB in m/s.
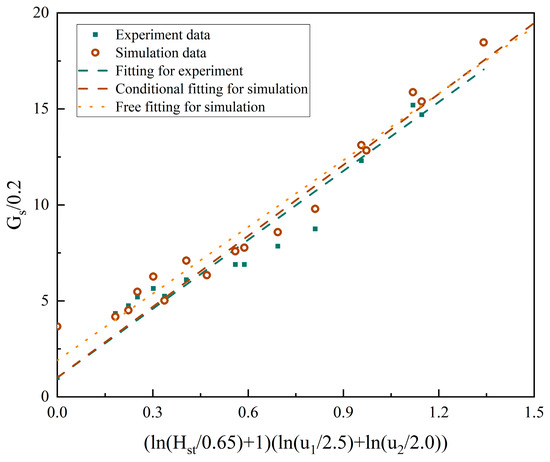
Figure 21.
The solid circulation rate versus operating parameters—282 μm particles.
Here, three separate fittings were performed using different data sources. The first fitting was completely fitted using the experimental data as the basis for three fittings. The second fit took all of the simulation results and enriched the data points as a complement to the first fit. Due to the large deviation between the experimental data and the simulation when the superficial gas velocity of 1#FB was 2.5 m/s and the superficial gas velocity of 2#FB was 2 m/s, the intercept restriction was removed and the simulation results were fitted again for the third time.
a = 11.96 is obtained by fitting the experimental data, so the fitting result is as follows:
a = 12.32 is obtained by fitting the simulation results, so the fitting result is as follows:
After removing the intercept restriction, the simulation results were used and a = 11.59 and an intercept of 1.90 are obtained. Therefore, the fitting result is as follows:
Combining the above equations and Figure 21, it can be seen that the fitting results obtained from the experimental data and the simulation results are very close.
Figure 22 shows the fitting of the solid circulation rate with a particle size of 641 μm with the superficial gas velocity of the two furnaces and the static bed height during steady operation. During fitting, the parameters in the fitting were nondimensionalized based on the simulation that the static bed height was 0.65 m, the superficial gas velocity of 1#FB was 3.5 m/s, and the superficial gas velocity of 2#FB was 2 m/s when the solid circulation rate was 0.0238 kg/(m2s). The fitting form is the same as for the 282 μm particles:
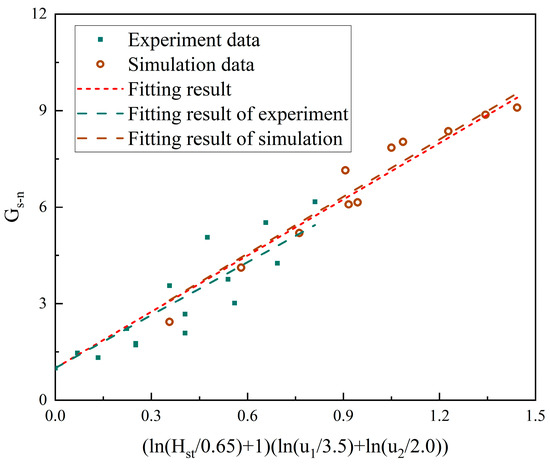
Figure 22.
The solid circulation rate versus operating parameters—641μm particles.
Here, three separate fits were performed using different data sources. The first fit was performed entirely using experimental data. The second fit was completely fitted using the simulation results. The third fitting combined the experimental data and simulation results.
a = 5.48 is obtained by fitting experimental data, so the fitting result is as follows:
a = 5.92 is obtained by fitting the simulation results, so the fitting result is as follows:
a = 5.83 is obtained by fitting the experimental data and simulation results, so the fitting result is as follows:
Combining the above equations and Figure 22, it can be seen that the fitting results obtained from the experimental data and the simulation results are also very close. Compared with 282-micron particles, the solid circulation rate of 641-micron particles during operation is generally an order of magnitude lower, which shows that particle size is the most critical factor affecting solid circulation rate.
Figure 23 shows the fitting of the solid circulation rate of 100 μm and 1000 μm particles with the superficial gas velocity of the two furnaces and static bed height during steady-state operation. For 100 μm particles, the parameters in the fitting were nondimensionalized based on the simulation that the static bed height was 0.65 m, the superficial gas velocity of 1#FB was 3 m/s, and the superficial gas velocity of 2#FB was 2 m/s when the solid circulation rate was 2.84 kg/(m2s). The fitting form is as follows:
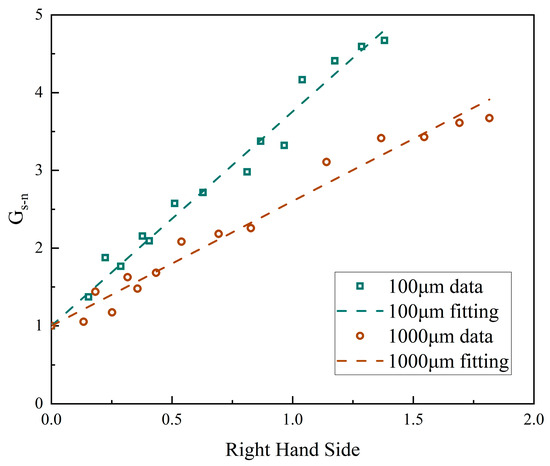
Figure 23.
The solid circulation rate versus operating parameters—100 μm and 1000 μm particles.
For 1000 μm particles, the parameters in the fitting were nondimensionalized based on the simulation that the static bed height was 0.65 m, the superficial gas velocity of 1#FB was 3.5 m/s, and the superficial gas velocity of 2#FB was 2.5 m/s when the solid circulation rate was 0.00259 kg/(m2s). The fitting form is as follows:
a = 2.76 was obtained by fitting the simulation result of 100 μm, so the fitting result is as follows:
a = 1.60 is obtained by fitting the 1000 μm simulation result, so the fitting result is as follows.
Comparing a series of simulation results, it can be found that the solid circulation rate of 282 μm, 641 μm, and 1000 μm particles was three different orders of magnitude from large to small. The previous conclusion that particle size is the most important factor affecting solid circulation rate was verified again.
4. Conclusions
In this paper, a numerical simulation model was established on the basis of a large-scale DFB reactor with a maximum height of 21.6 m, and numerical simulations focused on gas–solid flow characteristics were carried out. The relevant conclusions are summarized as follows:
- The simulation results are in good agreement with the experimental data in terms of the trend, and the specific values are generally similar. Therefore, the numerical model is scientific.
- The superficial gas velocity of 1#FB, the superficial gas velocity of 2#FB, and the static bed height all have an effect on the gas–solid characteristics. The effects of the superficial gas velocity on the pressure and solid suspension density of the two furnaces are the opposite, while the static bed height has the same effect on the two furnaces. At the same time, the influences of different parameters on the gas–solid flow characteristics have marginal decreasing effects.
- According to the simulation results, the empirical formula of the solid circulation rate was fitted according to the different particle sizes. It was found that the influence of particle size on the solid circulation rate could reach three levels of magnitude, and it is the most significant among all of the parameters.
Author Contributions
Conceptualization, Q.W., G.X., M.F. and Z.L.; Methodology, Y.L.; Investigation, Y.L.; Writing—original draft, Y.L.; Writing—review & editing, Q.W. All authors have read and agreed to the published version of the manuscript.
Funding
This work was supported by the Chinese National Natural Science Fund [No. 52076138] and the Fundamental Research Funds for the Central Universities [2022ZFJH004].
Data Availability Statement
Data is contained within the article.
Conflicts of Interest
The authors declare that they have no known competing financial interests or personal relationships that could have appeared to influence the work reported in this paper.
Abbreviations
| Symbols | |
| a | inertial term, m/s2 |
| C | constant in the turbulence model |
| CD | drag coefficient |
| ds | particle diameter, m |
| dcl | cluster diameter, m |
| f | volume fraction |
| Gb | generation term of turbulent kinetic energy caused by buoyancy |
| Gk | generation term of turbulent kinetic energy caused by the mean velocity gradient |
| gravitational acceleration, m/s2 | |
| H | total height of the system, m |
| Hst | static bed height, m |
| unit tensor | |
| Kij | interphase momentum exchange coefficient from phase i to j |
| k | turbulent kinetic energy, m2/s2 |
| Nst | mass-specific energy consumption for suspending and transporting particles, W/kg |
| NT | mass-specific total energy consumption for particles, W/kg |
| p | pressure, Pa |
| t | time, s |
| u | superficial gas velocity, m/s |
| Uslip | superficial slip velocity, m/s |
| v or | velocity, m/s |
| Ym | contribution of pulsation expansion in compressible turbulence |
| Greek Letters | |
| α | volume fraction |
| αk | reciprocal of effective Prandtl number for turbulent kinetic energy |
| αε | reciprocal of effective Prandtl number for dissipation rate of turbulent kinetic energy |
| ε | dissipation rate of turbulent kinetic energy |
| εc | voidage of dense phase in the EMMS model |
| εf | voidage of dilute phase in the EMMS model |
| λ | bulk viscosity, Pa s |
| μ | viscosity, Pa s |
| μeff | effective viscosity, Pa s |
| ρ | density, kg/m3 |
| stress tensor, Pa | |
| Subscripts | |
| 1 | 1#FB |
| 2 | 2#FB |
| c | dense phase in the EMMS model |
| f | dilute phase in the EMMS model |
| g | gas phase |
| i | meso-scale interphase in the EMMS model |
| mf | minimum fluidization |
| s | solid phase |
References
- Shrestha, S.; Ali, B.S.; Binti Hamid, M.D. Cold Flow Model of Dual Fluidized Bed: A Review. Renew. Sustain. Energy Rev. 2016, 53, 1529–1548. [Google Scholar] [CrossRef]
- Gupta, S.; De, S. Investigation of Hydrodynamics and Segregation Characteristics in a Dual Fluidized Bed Using the Binary Mixture of Sand and High-Ash Coal. Adv. Powder Technol. 2021, 32, 2690–2702. [Google Scholar] [CrossRef]
- Hanchate, N.; Ramani, S.; Mathpati, C.S.; Dalvi, V.H. Biomass Gasification Using Dual Fluidized Bed Gasification Systems: A Review. J. Clean. Prod. 2021, 280, 123148. [Google Scholar] [CrossRef]
- Abuelgasim, S.; Wang, W.; Abdalazeez, A. A Brief Review for Chemical Looping Combustion as a Promising CO2 Capture Technology: Fundamentals and Progress. Sci. Total Environ. 2021, 764, 142892. [Google Scholar] [CrossRef]
- Chen, J.; Duan, L.; Ma, Y.; Jiang, Y.; Huang, A.; Zhu, H.; Jiao, H.; Li, M.; Hu, Y.; Zhou, H.; et al. Recent Progress in Calcium Looping Integrated with Chemical Looping Combustion (CaL-CLC) Using Bifunctional CaO/CuO Composites for CO2 Capture: A State-of-the-Art Review. Fuel 2023, 334, 126630. [Google Scholar] [CrossRef]
- Xu, J.; Lu, X.; Wang, Q.; Zhang, W.; Liu, C.; Xie, X.; Sun, S.; Fan, X.; Li, J. Visualization of Gas-Solid Flow Characteristics at the Wall of a 60-Meter-High Transparent CFB Riser. Powder Technol. 2018, 336, 180–190. [Google Scholar] [CrossRef]
- Bian, Q.; Yang, D.; Wu, Z.; Liu, B.; Zhang, J.; Deng, R.; Pu, H. Investigation of Particle Flow Characteristics in a CFB Recirculation System Using Electrical Capacitance Volume Tomography. Powder Technol. 2022, 408, 117765. [Google Scholar] [CrossRef]
- Stollhof, M.; Penthor, S.; Mayer, K.; Hofbauer, H. Estimation of the Solid Circulation Rate in Circulating Fluidized Bed Systems. Powder Technol. 2018, 336, 1–11. [Google Scholar] [CrossRef]
- Youn, P.-S.; Lee, D.H.; Kim, D.; Won, Y.S.; Choi, J.-H.; Joo, J.B.; Ryu, H.-J. Solids Inventory and External Solids Circulation Rate in Risers of Circulating Fluidized Beds. Adv. Powder Technol. 2022, 33, 103810. [Google Scholar] [CrossRef]
- Pröll, T.; Rupanovits, K.; Kolbitsch, P.; Bolhàr-Nordenkampf, J.; Hofbauer, H. Cold Flow Model Study on a Dual Circulating Fluidized Bed (DCFB) System for Chemical Looping Processes. Chem. Eng. Technol. 2009, 32, 418–424. [Google Scholar] [CrossRef]
- Zhou, C.; Chen, L.; Liu, C.; Wang, J.; Xing, X.; Liu, Y.; Chen, Y.; Chao, L.; Dai, J.; Zhang, Y.; et al. Interconnected Pyrolysis and Gasification of Typical Biomass in a Novel Dual Fluidized Bed. Energy Convers. Manag. 2022, 271, 116323. [Google Scholar] [CrossRef]
- Wang, F.; Zhou, W.; Chen, S.; Duan, L.; Xiang, W. Investigations on Biomass Gasification of Compact-Fast Dual Fluidized Bed Calcium Looping. J. Clean. Prod. 2023, 405, 137065. [Google Scholar] [CrossRef]
- Ohlemüller, P.; Alobaid, F.; Abad, A.; Adanez, J.; Ströhle, J.; Epple, B. Development and Validation of a 1D Process Model with Autothermal Operation of a 1 MW Th Chemical Looping Pilot Plant. Int. J. Greenh. Gas Control 2018, 73, 29–41. [Google Scholar] [CrossRef]
- Zhu, Y.; Li, K.; Wang, Q.; Cen, J.; Fang, M.; Luo, Z. Low-Rank Coal Pyrolysis Polygeneration Technology with Semi-Coke Heat Carrier Based on the Dual-Fluidized Bed to Co-Produce Electricity, Oil and Chemical Products: Process Simulation and Techno-Economic Evaluation. Fuel Process. Technol. 2022, 230, 107217. [Google Scholar] [CrossRef]
- Sun, L.; Xiao, R.; Lin, J.; Kong, D.; Luo, K.; Fan, J. Numerical Investigation of a 1MW Full-Loop Chemical Looping Combustion Unit with Dual CFB Reactors. Int. J. Greenh. Gas Control 2023, 123, 103835. [Google Scholar] [CrossRef]
- Lin, J.; Luo, K.; Hu, C.; Sun, L.; Fan, J. Full-Loop Simulation of a 1 MWth Pilot-Scale Chemical Looping Combustion System. Chem. Eng. Sci. 2022, 249, 117301. [Google Scholar] [CrossRef]
- Yakhot, V.; Orszag, S.A. Renormalization-Group Analysis of Turbulence. Phys. Rev. Lett. 1986, 57, 1722–1724. [Google Scholar] [CrossRef] [PubMed]
- Ahn, S.-H.; Xiao, Y.; Wang, Z.; Luo, Y.; Fan, H. Unsteady Prediction of Cavitating Flow around a Three Dimensional Hydrofoil by Using a Modified RNG K-ε Model. Ocean Eng. 2018, 158, 275–285. [Google Scholar] [CrossRef]
- Al-Hanaya, A.; El-Sapa, S.; Ashmawy, E.A. Axisymmetric motion of an incompressible couple stress fluid between two eccentric rotating spheres. J. Appl. Mech. Tech. Phy. 2022, 63, 790–798. [Google Scholar] [CrossRef]
- El-Sapa, S.; Albalawi, W. Interaction of Two Rigid Spheres Oscillating in an Infinite Liquid under the Control of a Magnetic Field. J. Appl. Math. 2023, 2023, 1146872. [Google Scholar] [CrossRef]
- Li, J.; Tung, Y.; Kwauk, M. Method of energy minimization in multi-scale modeling of particle-fluid two-phase flow. In Circulating Fluidized Bed Technology; Elsevier: Amsterdam, The Netherlands, 1988; pp. 89–103. ISBN 978-0-08-036225-0. [Google Scholar]
- Li, J.; Tung, Y.; Kwauk, M. Energy Transport and Regime Transition in Particle-Fluid Two-Phase Flow. In Circulating Fluidized Bed Technology; Elsevier: Amsterdam, The Netherlands, 1988; pp. 75–87. ISBN 978-0-08-036225-0. [Google Scholar]
- Ghadirian, E.; Arastoopour, H. CFD Simulation of a Fluidized Bed Using the EMMS Approach for the Gas-Solid Drag Force. Powder Technol. 2016, 288, 35–44. [Google Scholar] [CrossRef]
- Dymala, T.; Wytrwat, T.; Heinrich, S. MP-PIC Simulation of Circulating Fluidized Beds Using an EMMS Based Drag Model for Geldart B Particles. Particuology 2021, 59, 76–90. [Google Scholar] [CrossRef]
- Yang, Y.; Zhang, Q.; Pan, T.; Qu, Y.; Liu, X.; Li, X.; Cheng, Y.; Wang, L.; Liu, W. The Hydrodynamics of Low-Density Particles and Optimization of the EMMS Calculation Process. Powder Technol. 2022, 405, 117511. [Google Scholar] [CrossRef]
- Pakseresht, P.; Yao, Y.; Fan, Y.; Theuerkauf, J.; Capecelatro, J. A Critical Assessment of the Energy Minimization Multi-Scale (EMMS) Model. Powder Technol. 2023, 425, 118569. [Google Scholar] [CrossRef]
Disclaimer/Publisher’s Note: The statements, opinions and data contained in all publications are solely those of the individual author(s) and contributor(s) and not of MDPI and/or the editor(s). MDPI and/or the editor(s) disclaim responsibility for any injury to people or property resulting from any ideas, methods, instructions or products referred to in the content. |
© 2024 by the authors. Licensee MDPI, Basel, Switzerland. This article is an open access article distributed under the terms and conditions of the Creative Commons Attribution (CC BY) license (https://creativecommons.org/licenses/by/4.0/).