
Lithium-Ion Battery Capacity Estimation Based on Incremental Capacity Analysis and Deep Convolutional Neural Network


Abstract
1. Introduction
2. Experimental Battery Data and Feature Extraction
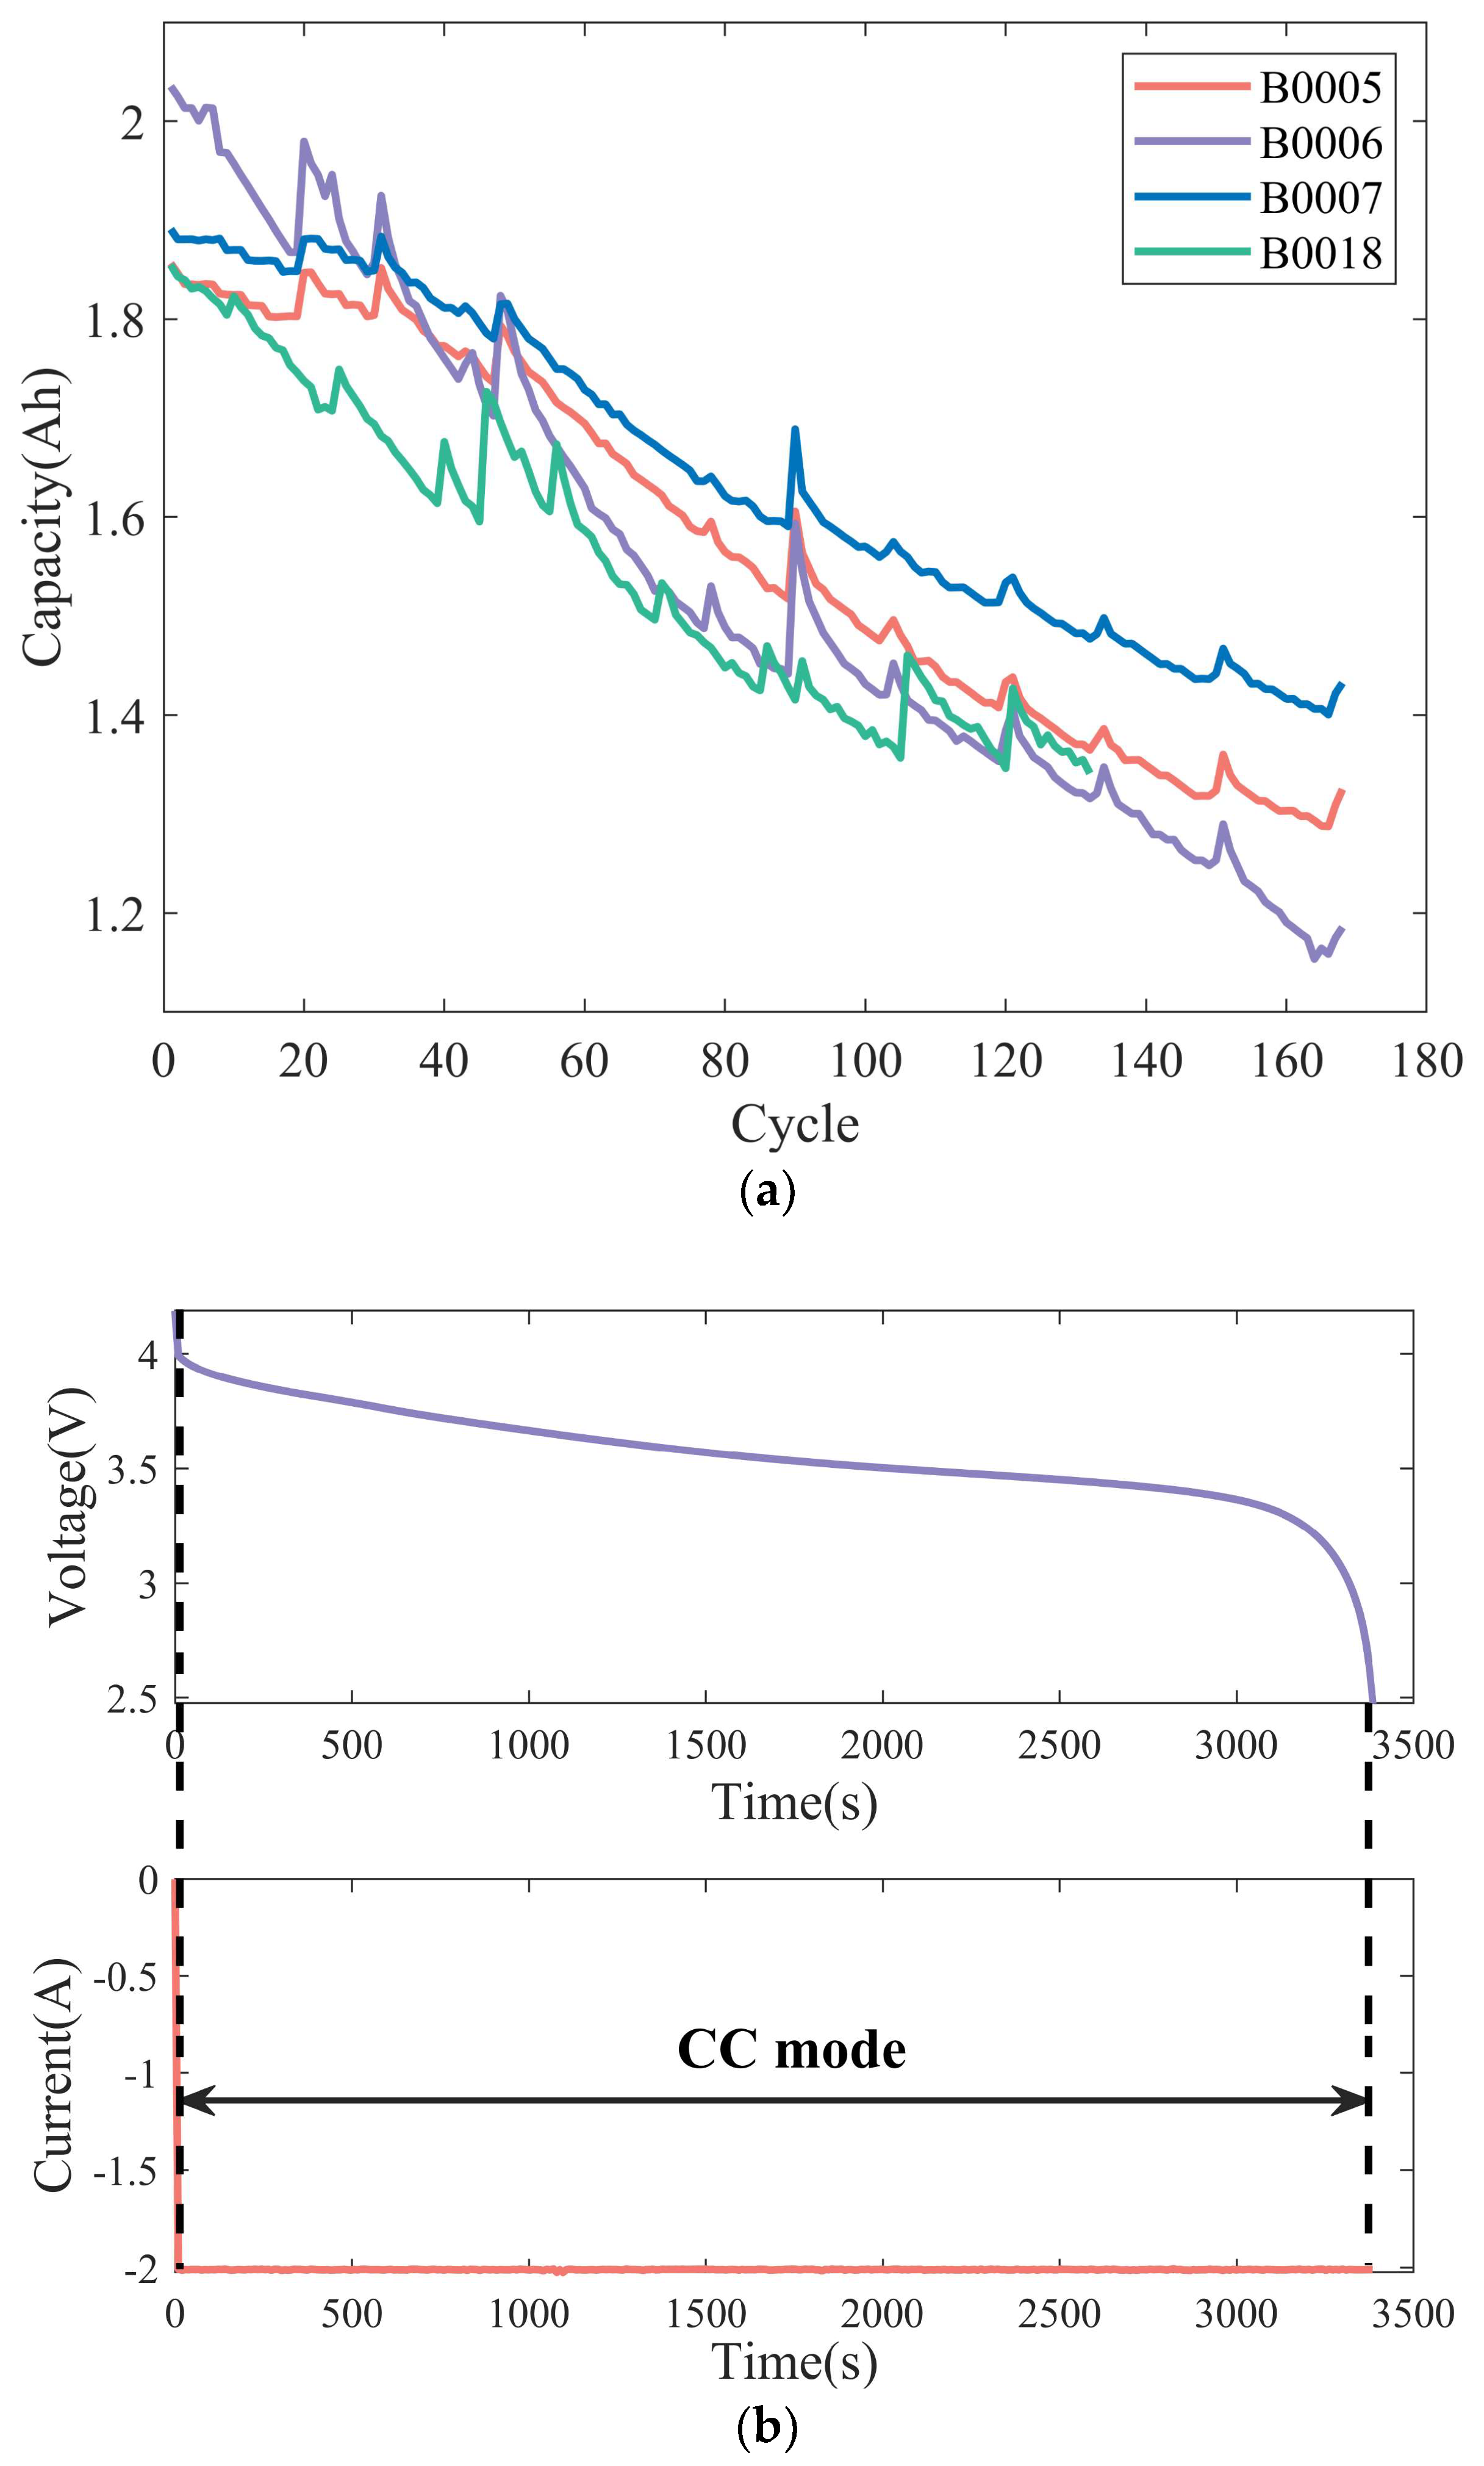
2.1. Experimental Battery Data
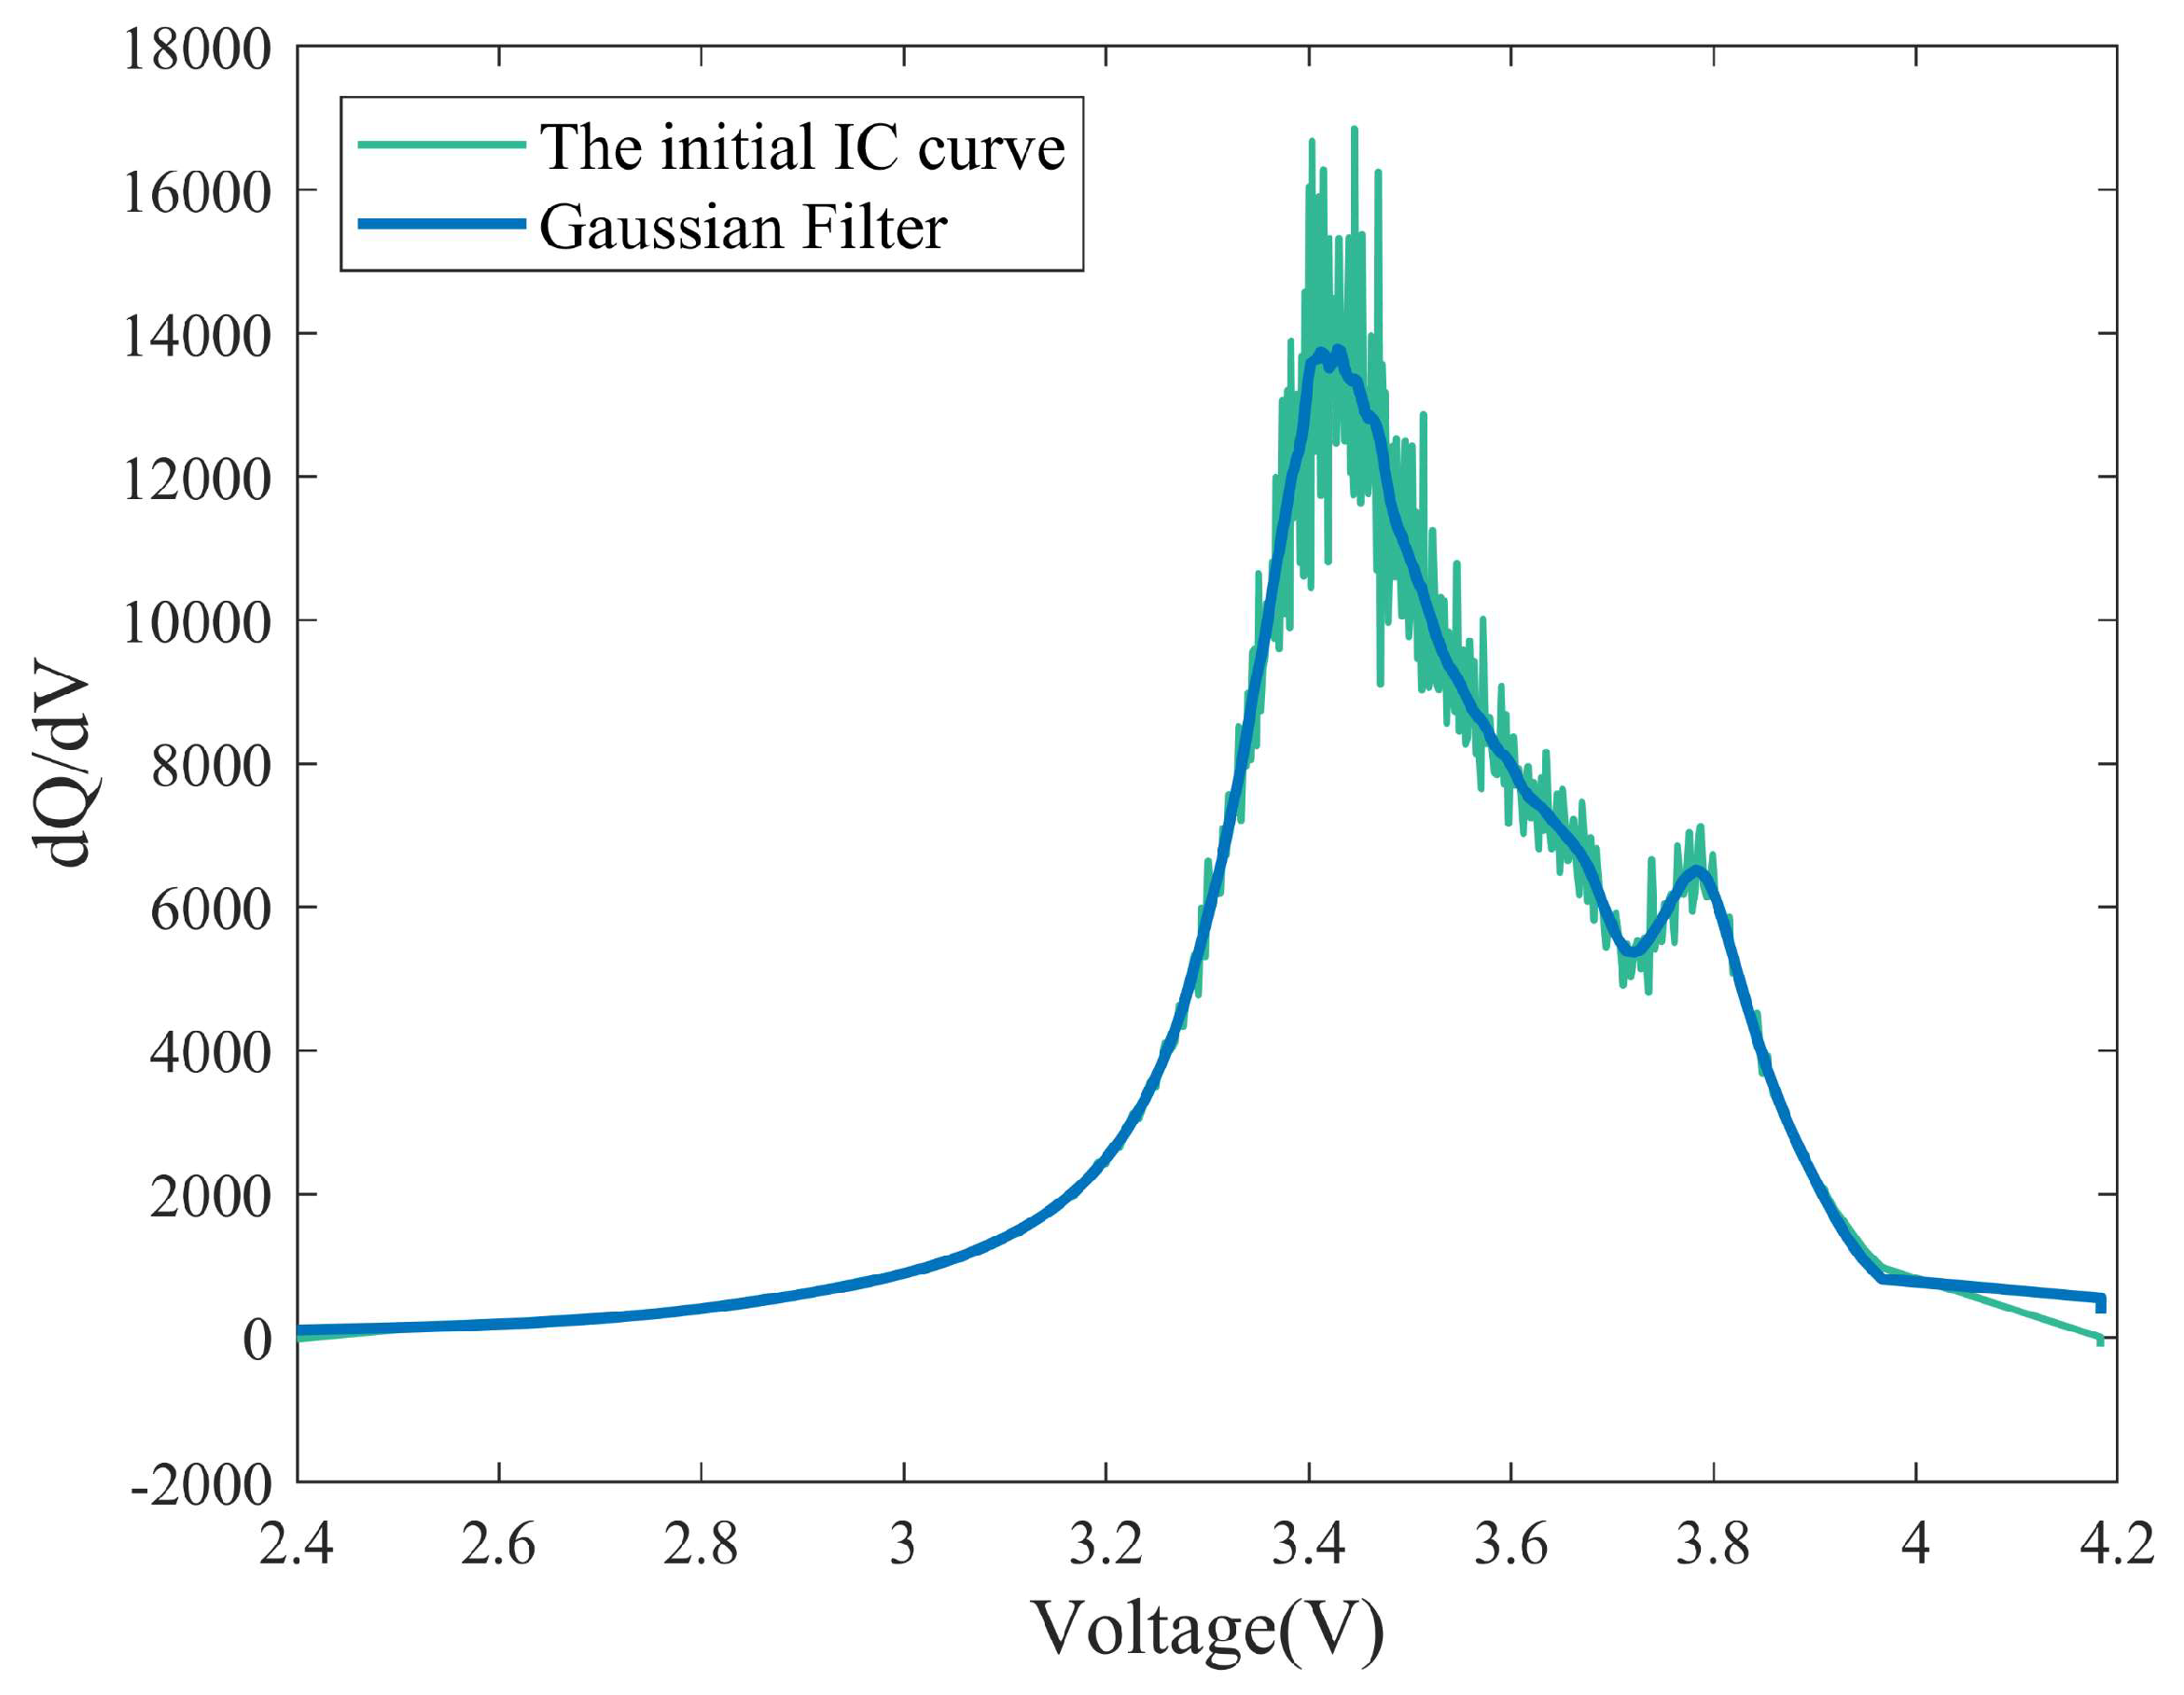
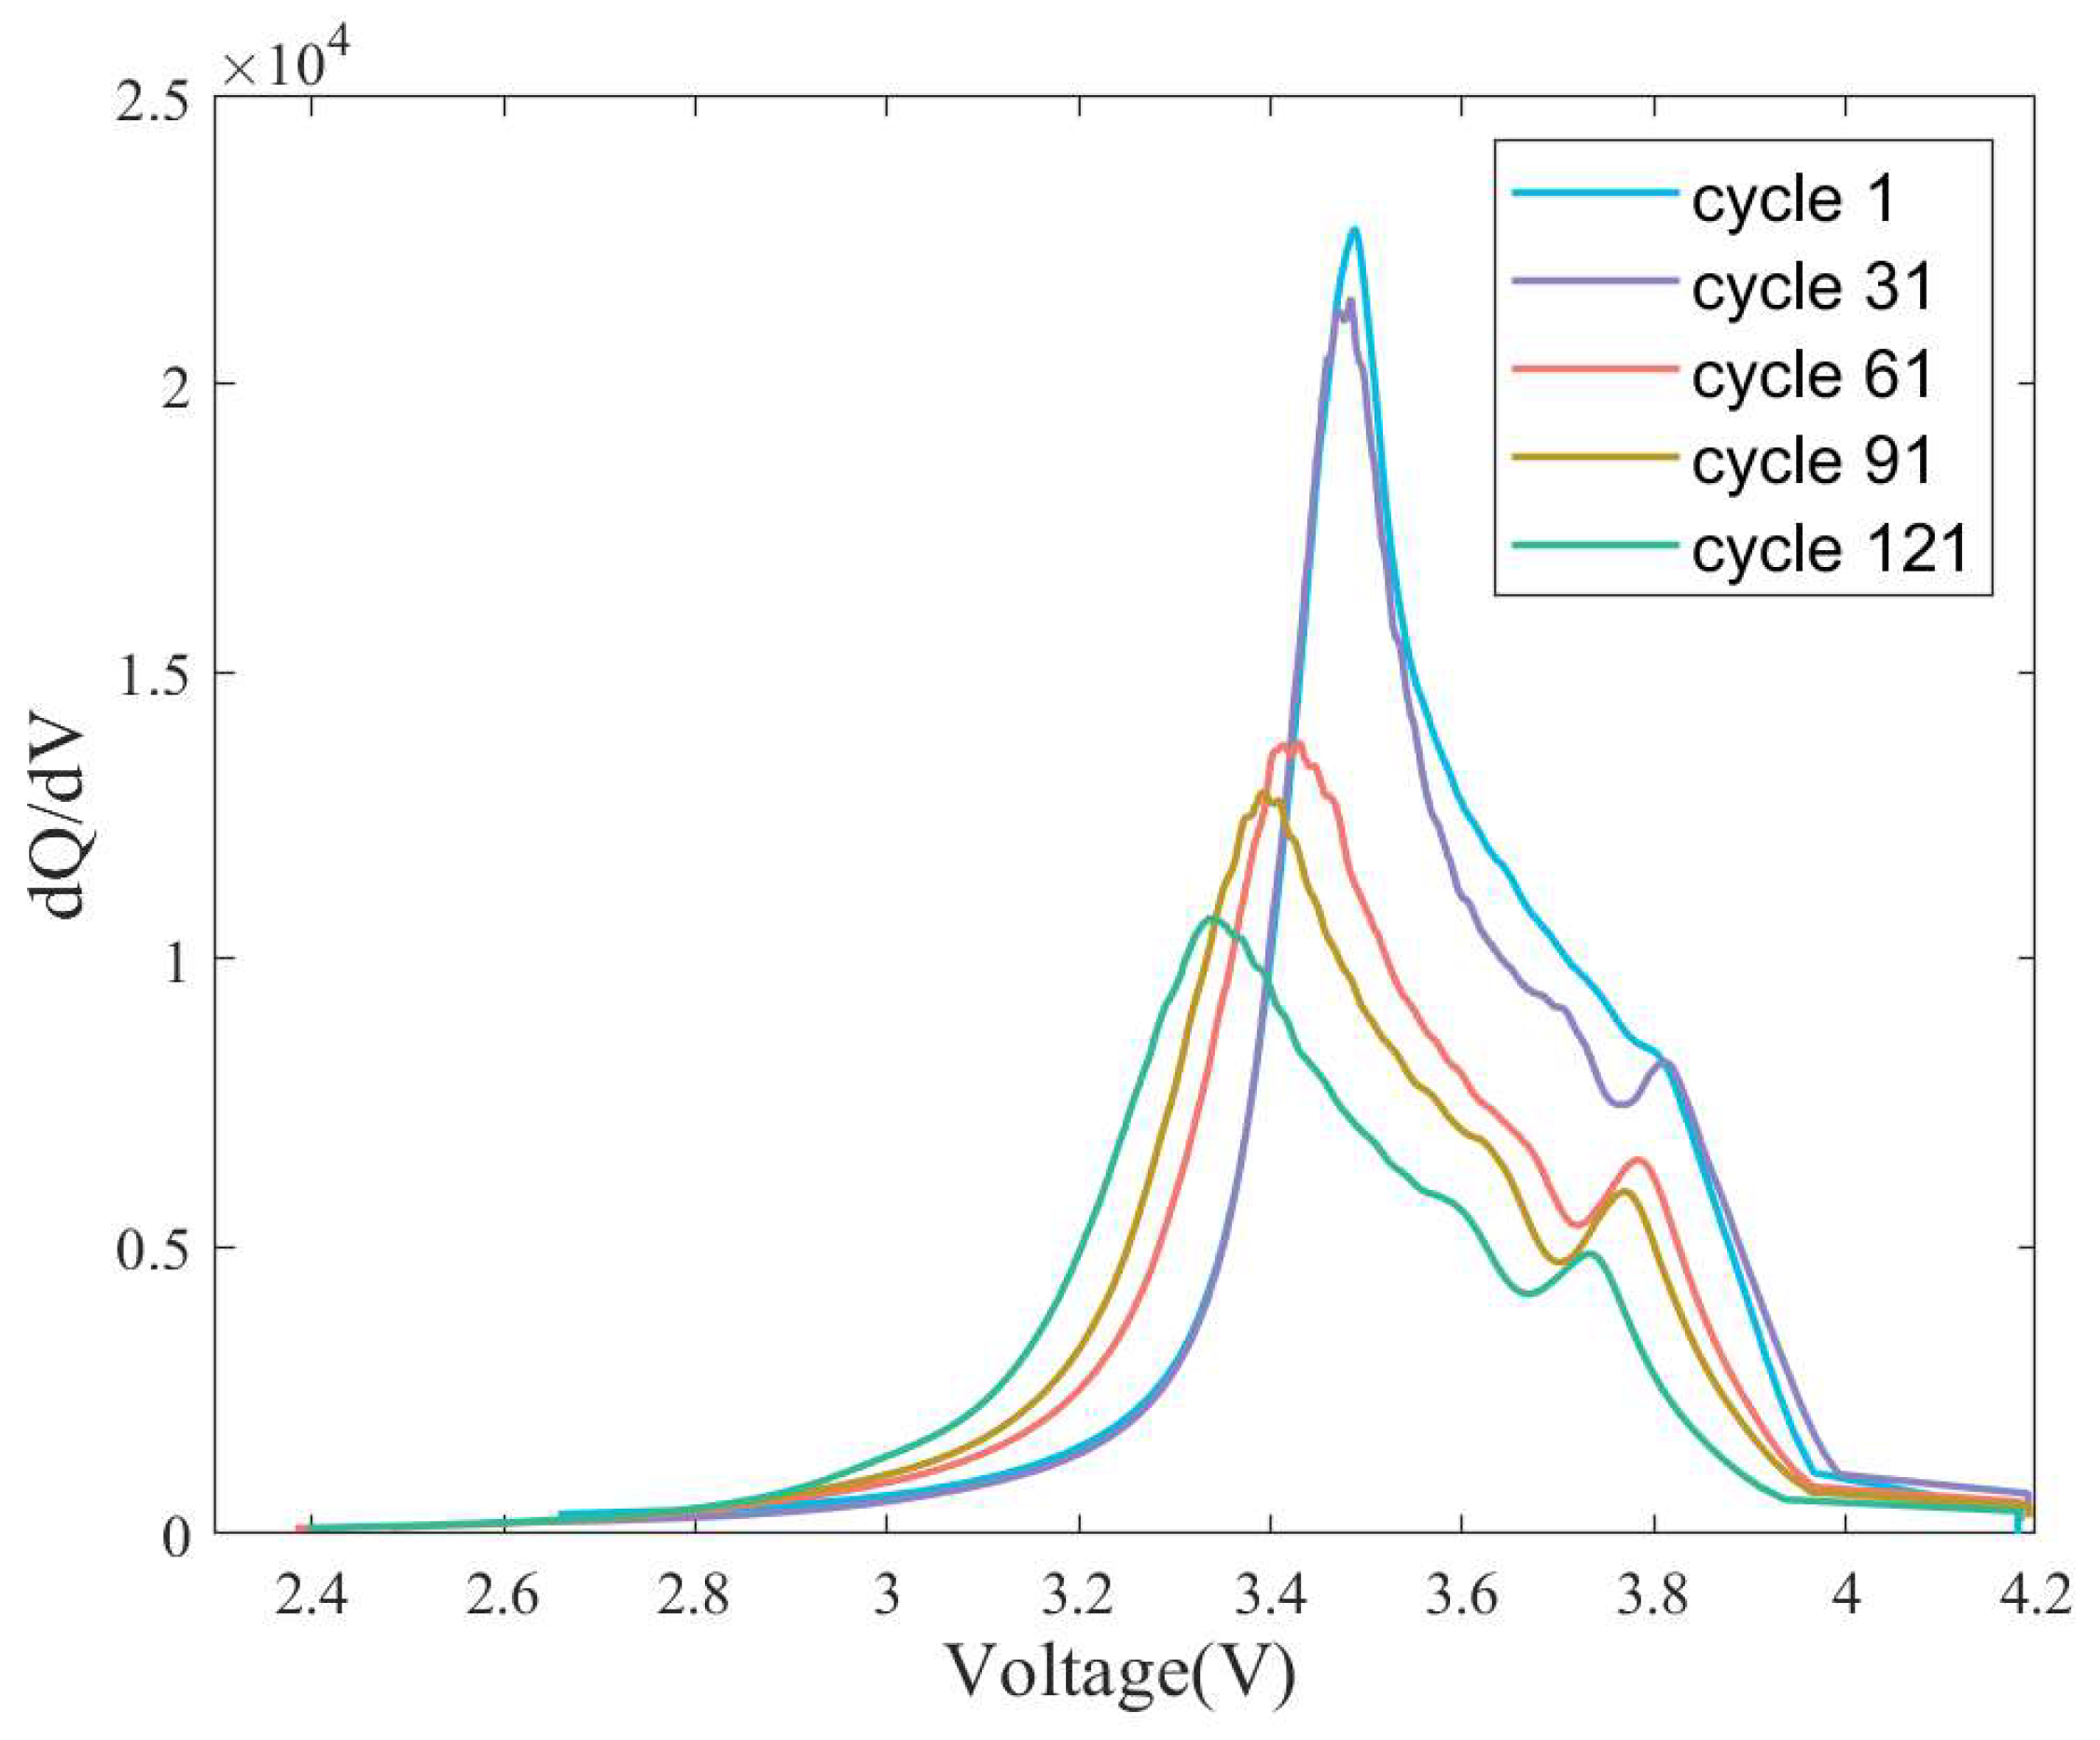
2.2. Incremental Capacity Curve
2.3. Temperature
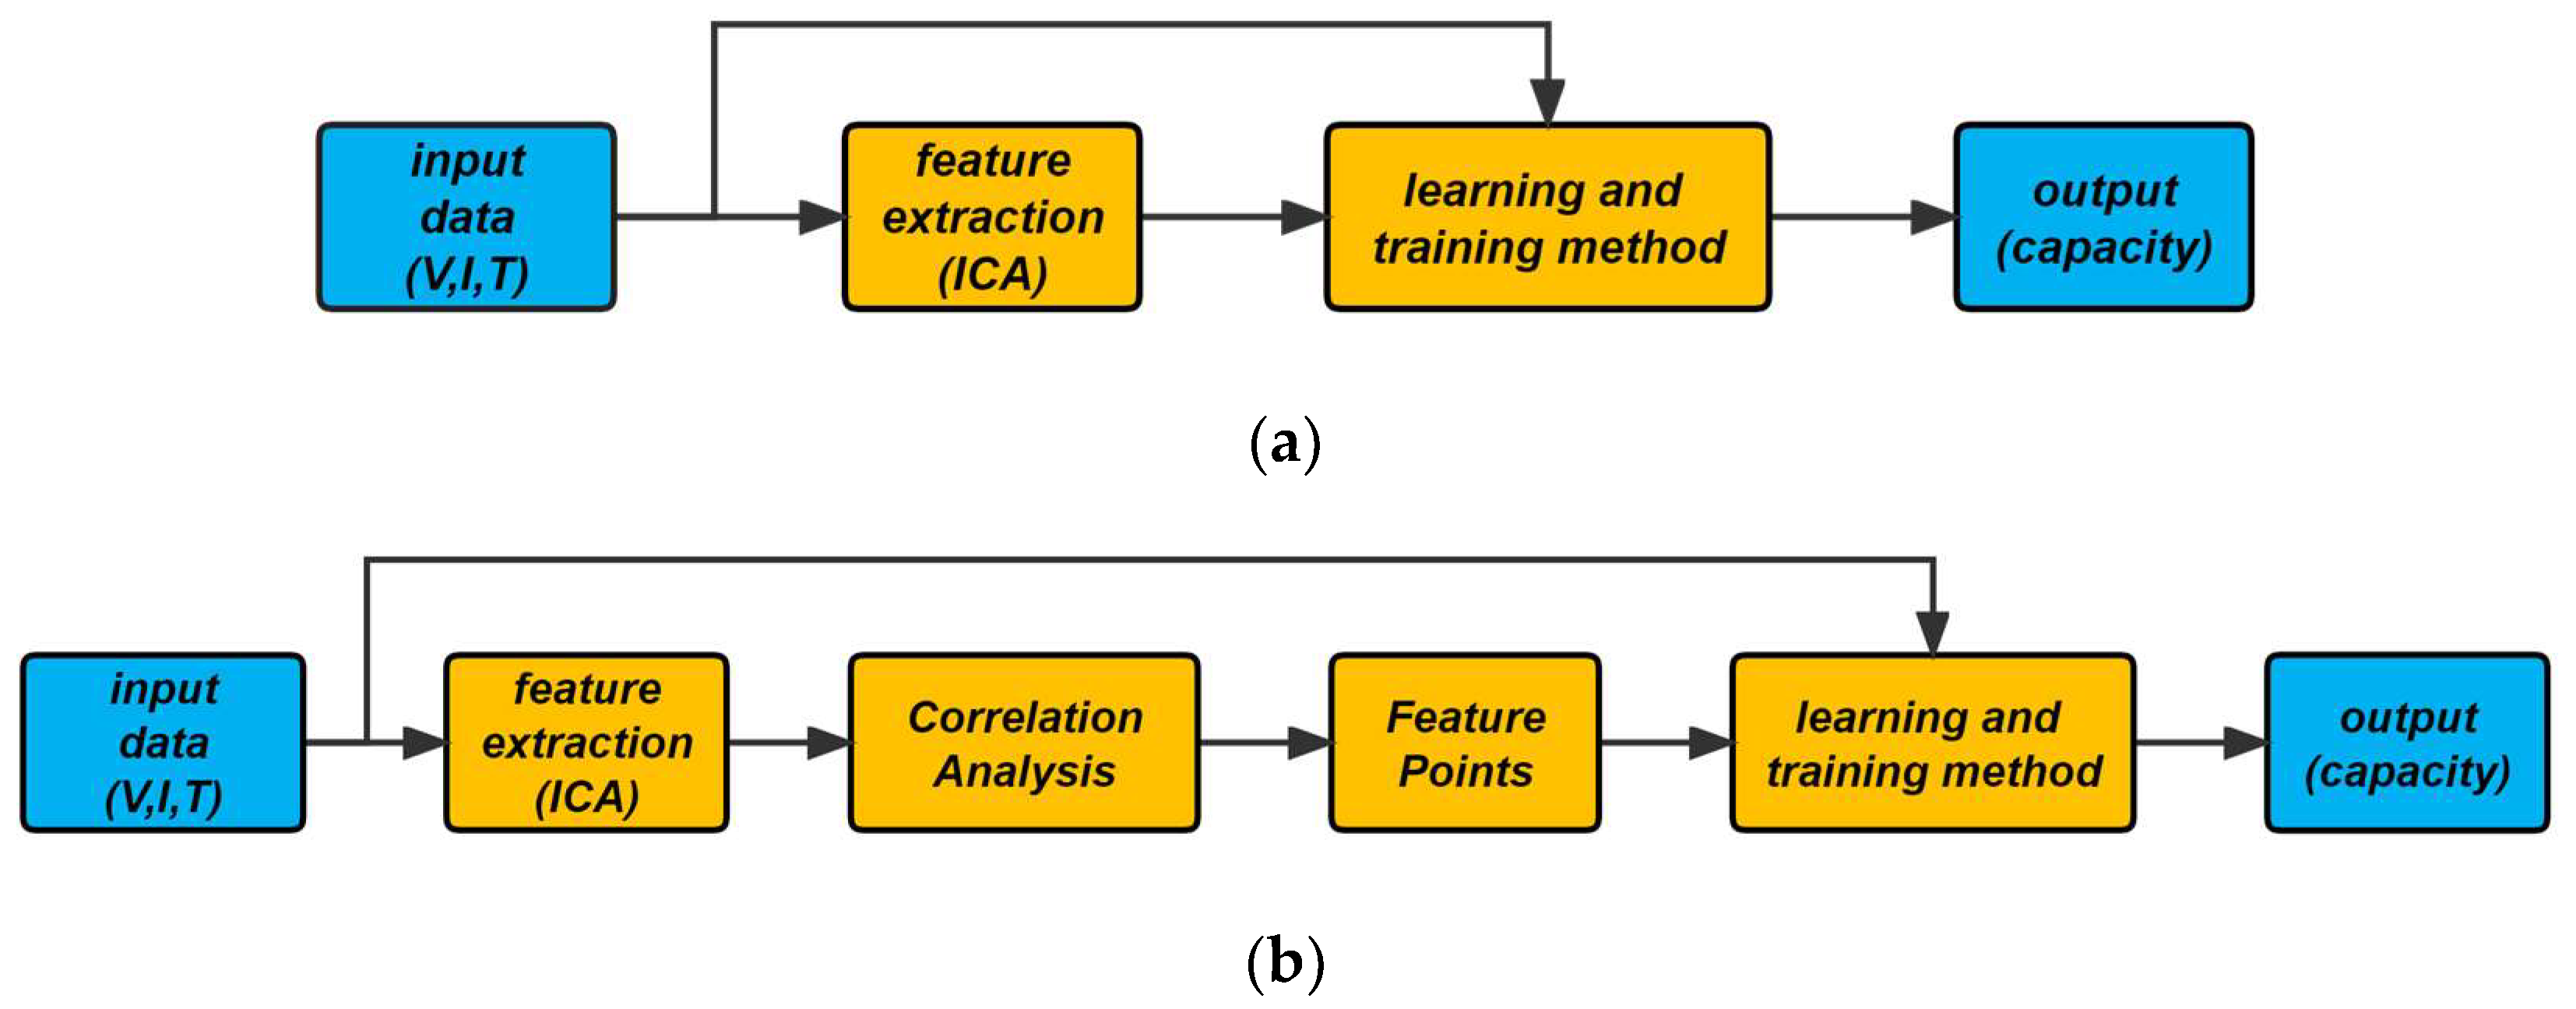
3. Methodology
3.1. Input and Output Matrix
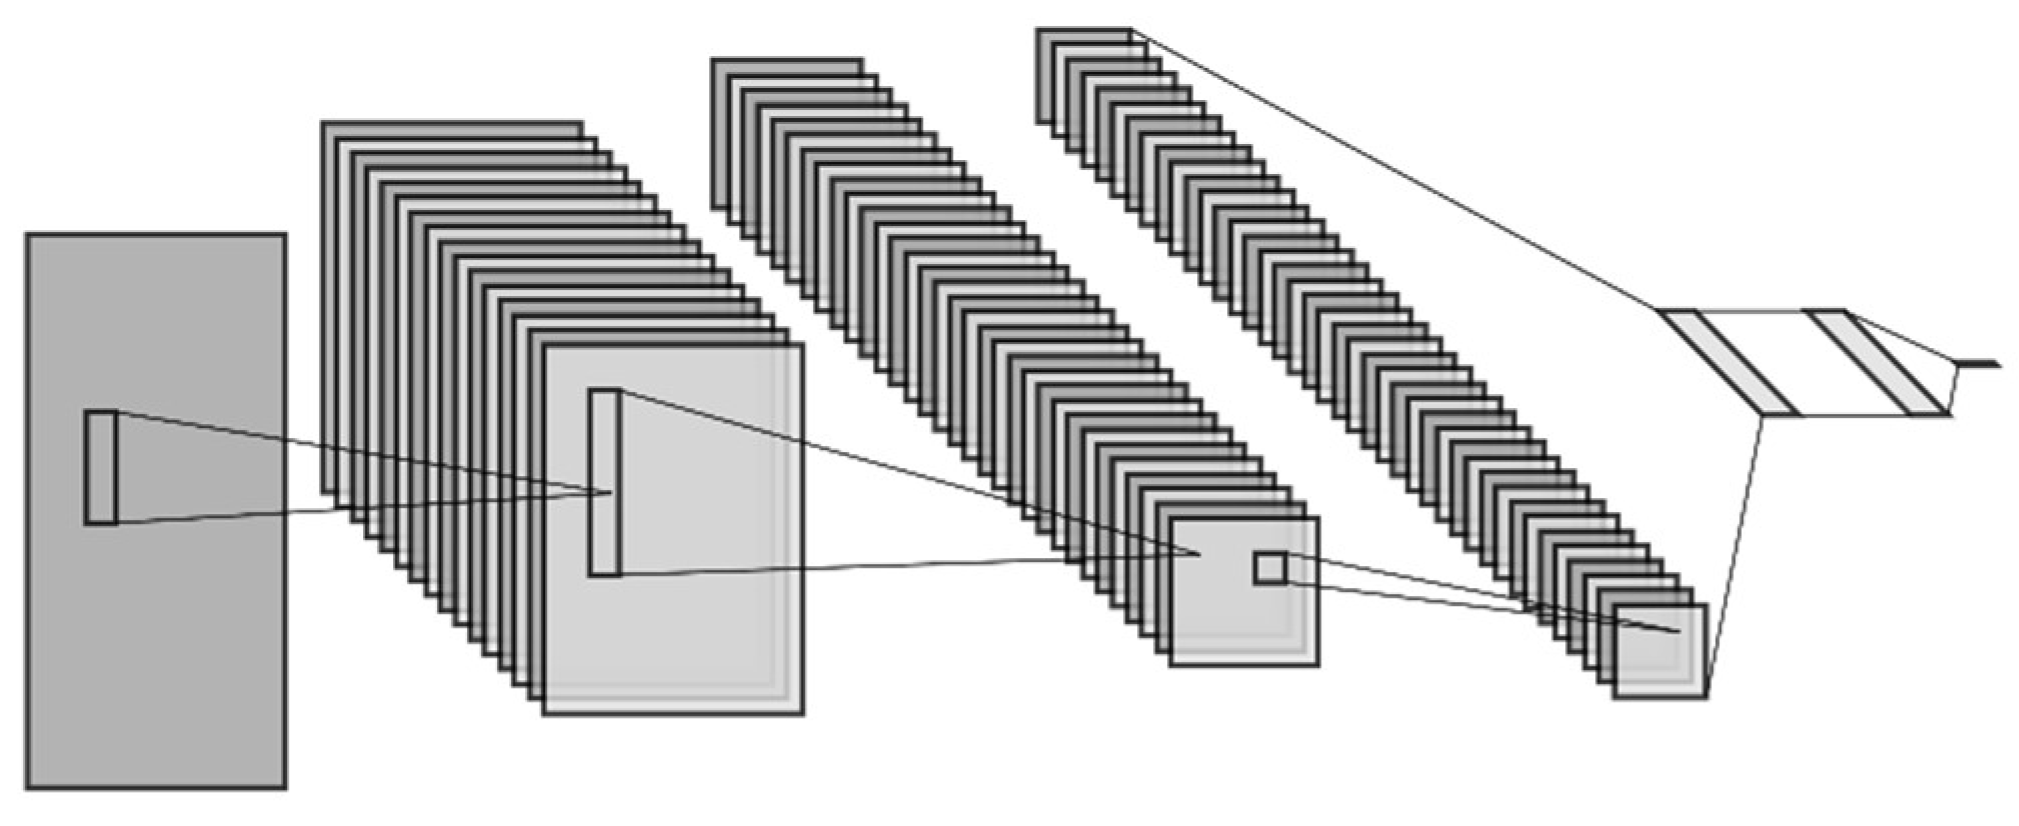
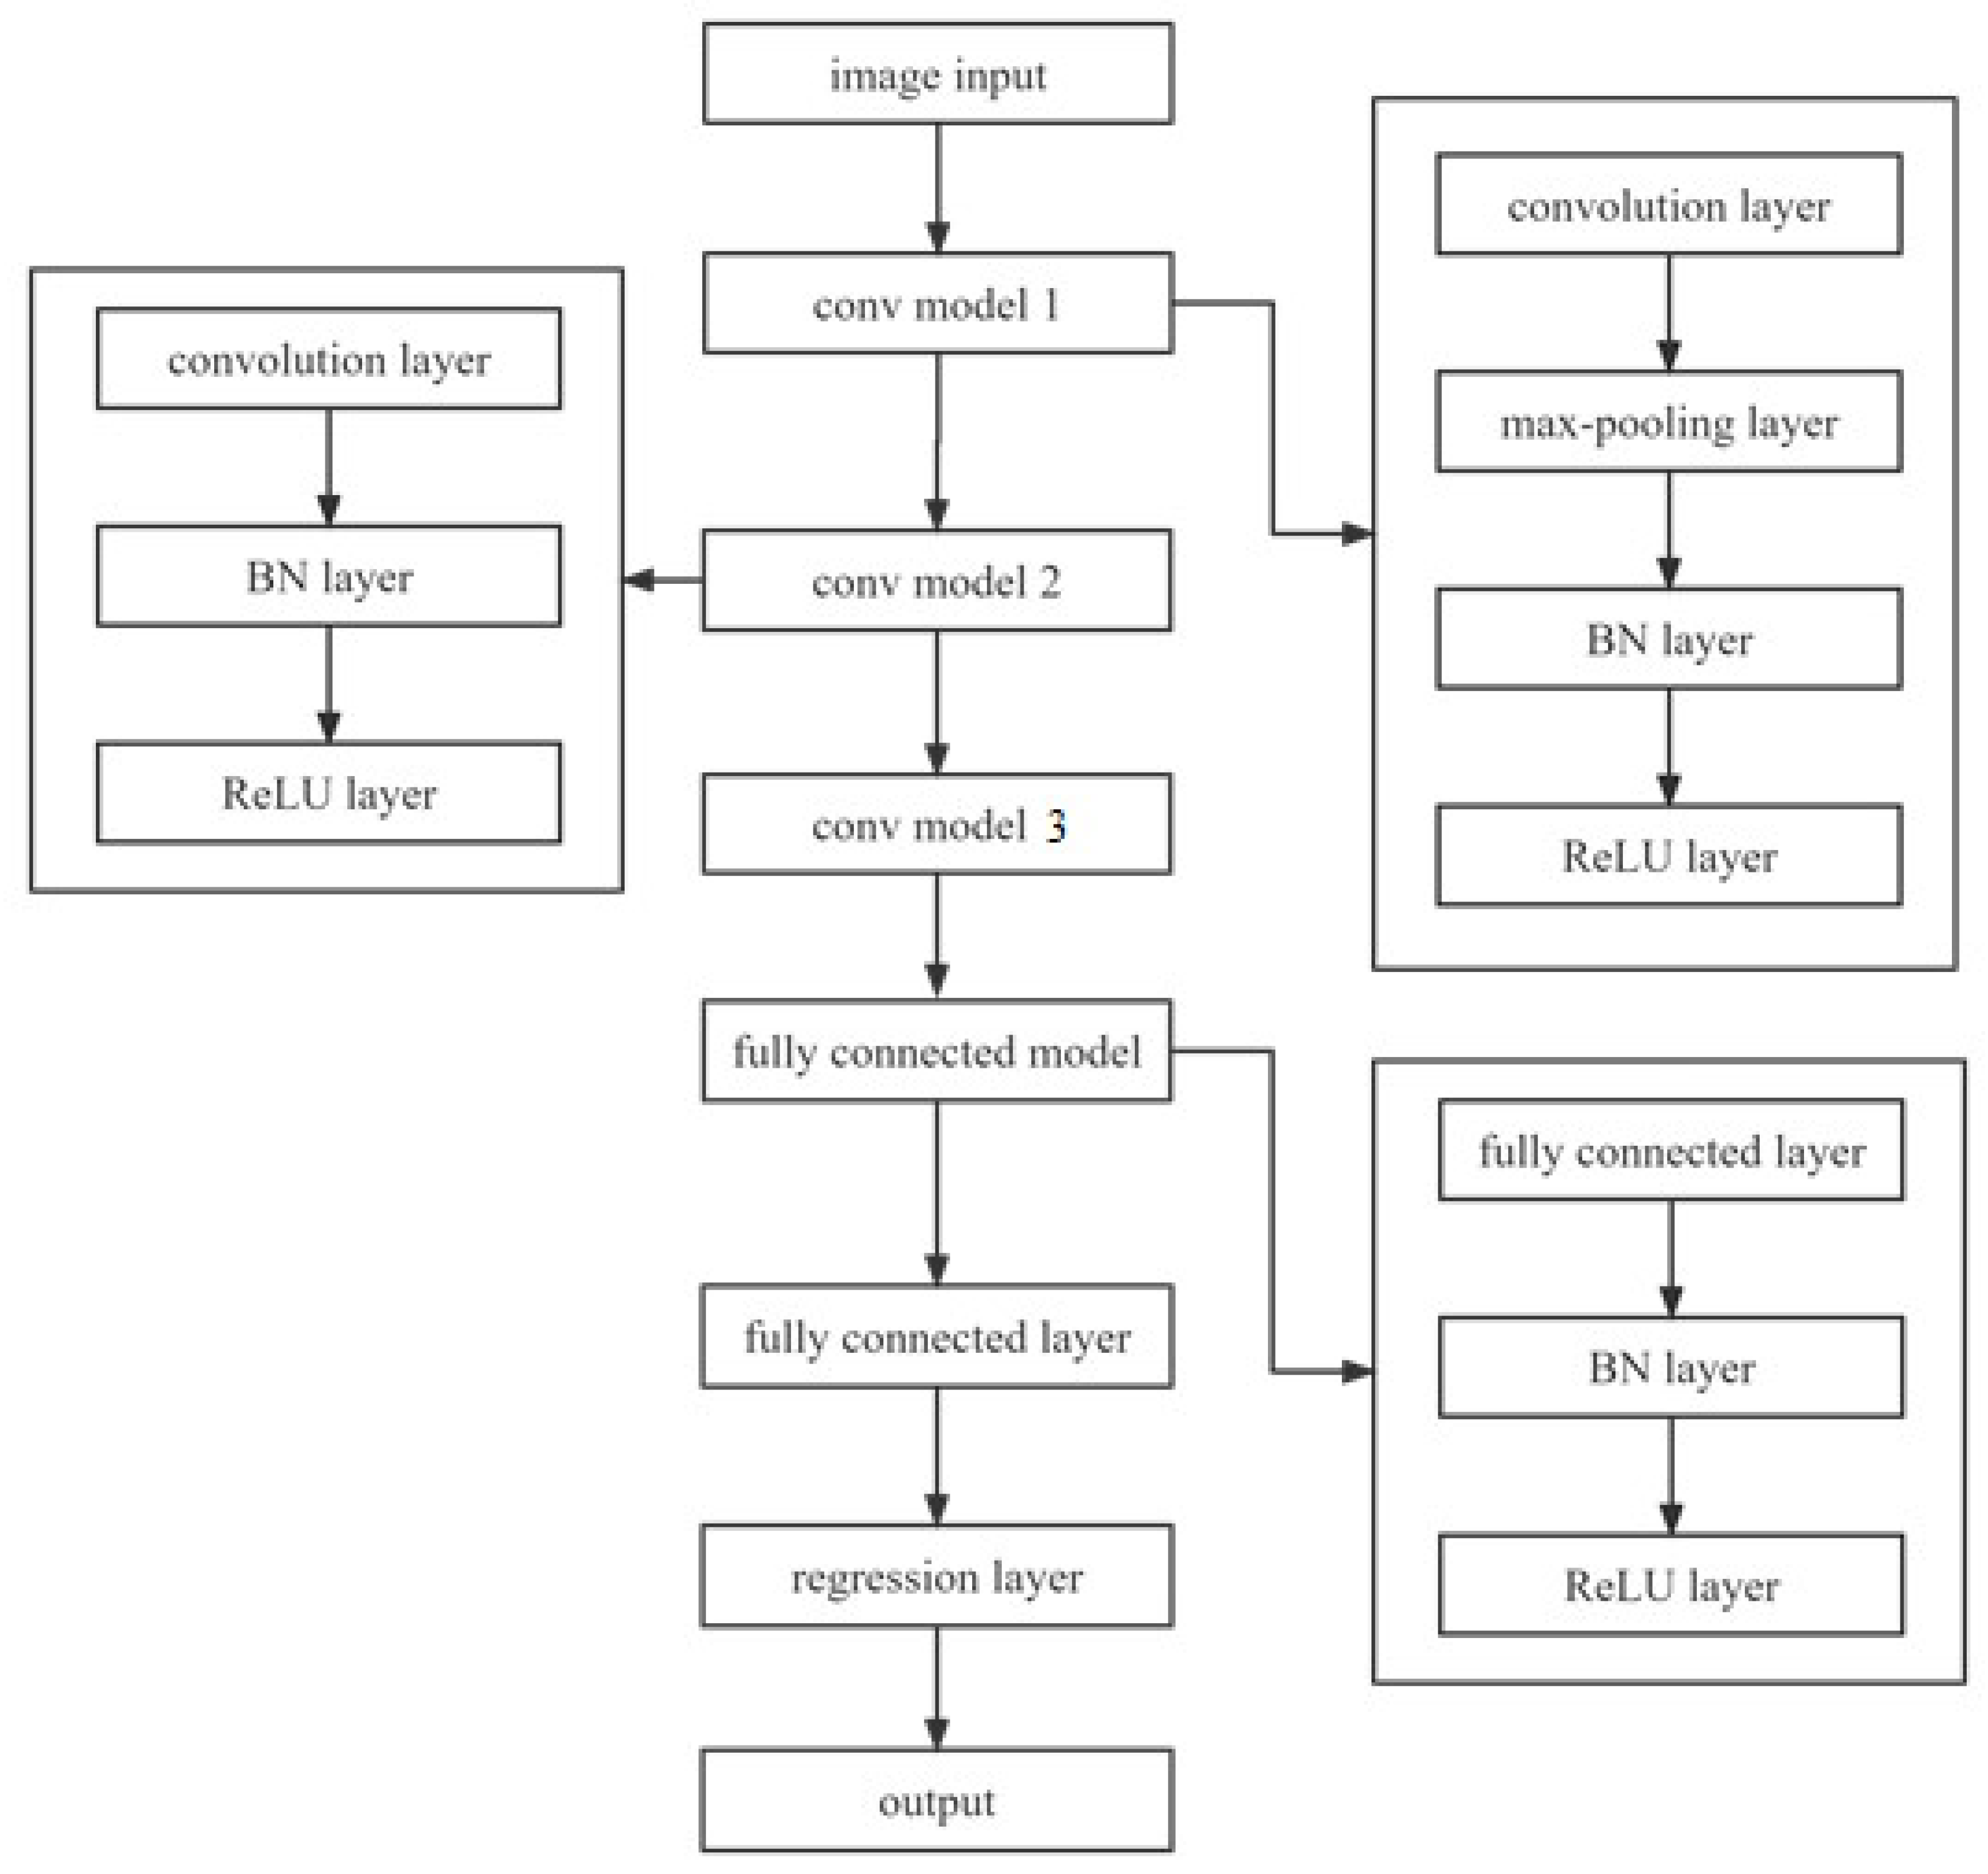
3.2. Overall Structure of CNN Net
- Convolutional layer
- 2.
- Batch normalization
- 3.
- ReLU (rectified linear unit) layer
- 4.
- Fully connected layers
3.3. Implemented CNN Architecture
3.4. Parameter Update and Stochastic Gradient Descent with Momentum
3.5. Detail Information of CNN
3.6. Capacity Estimation by CNN
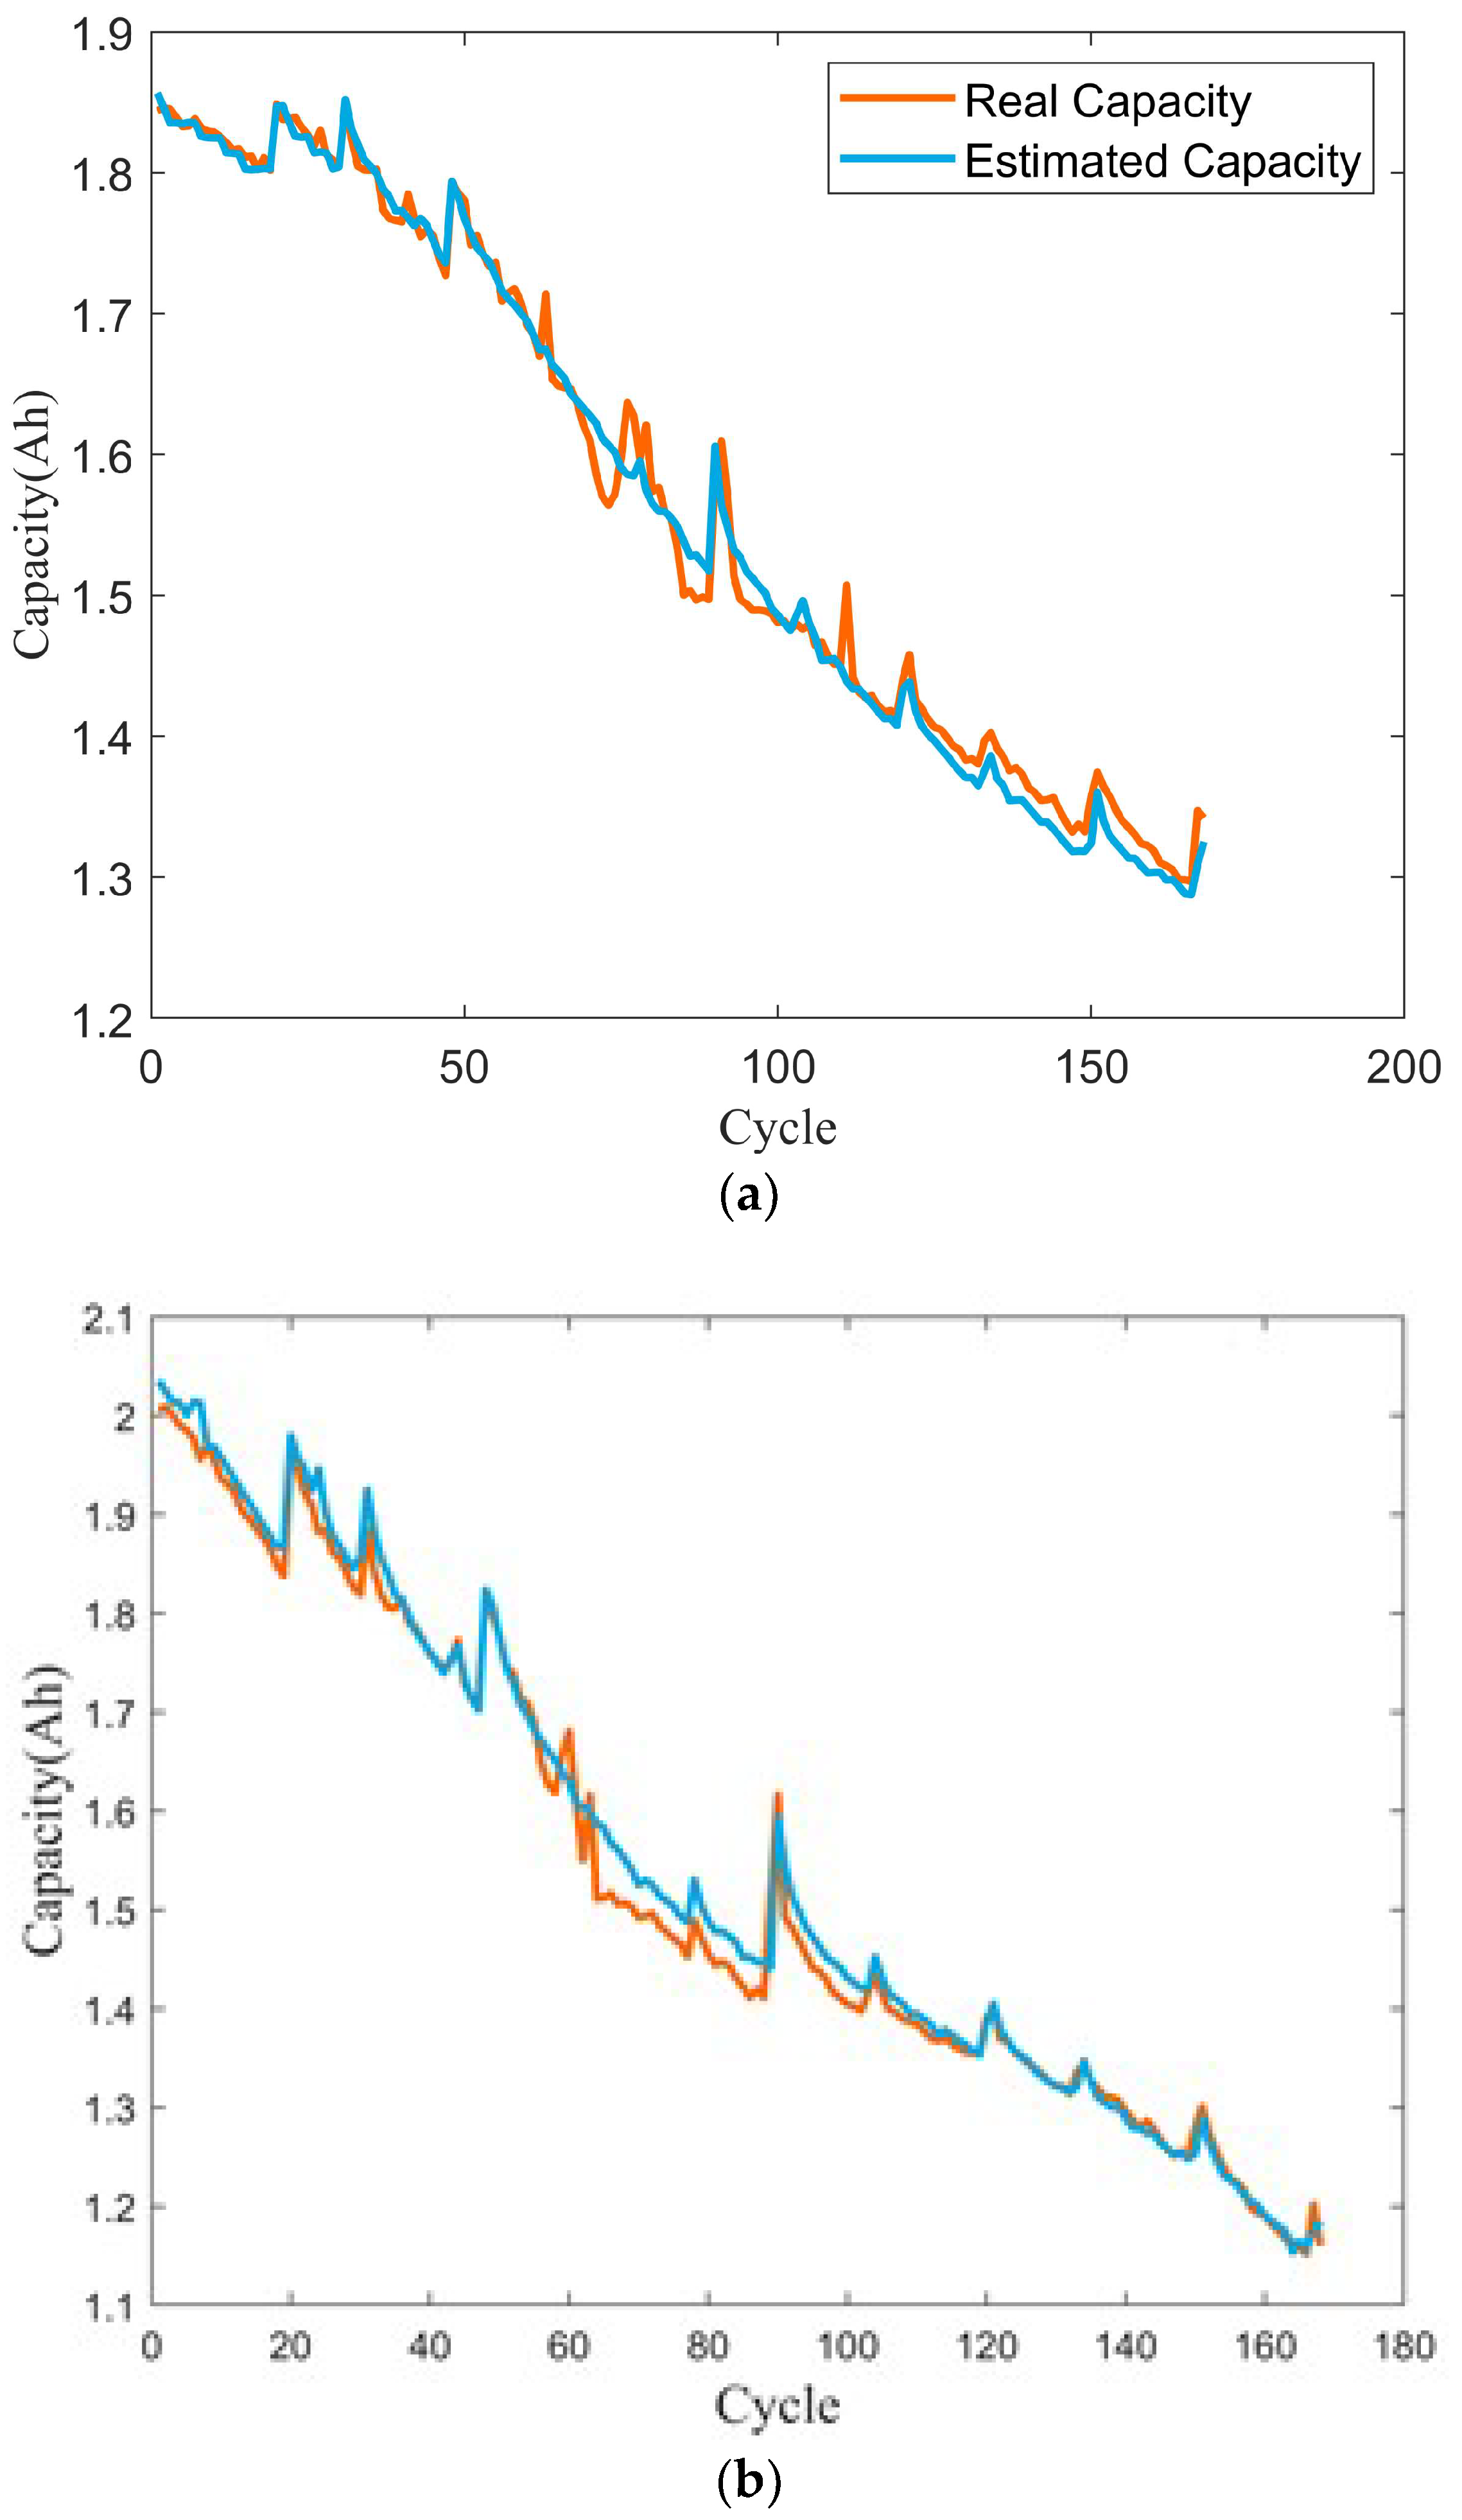
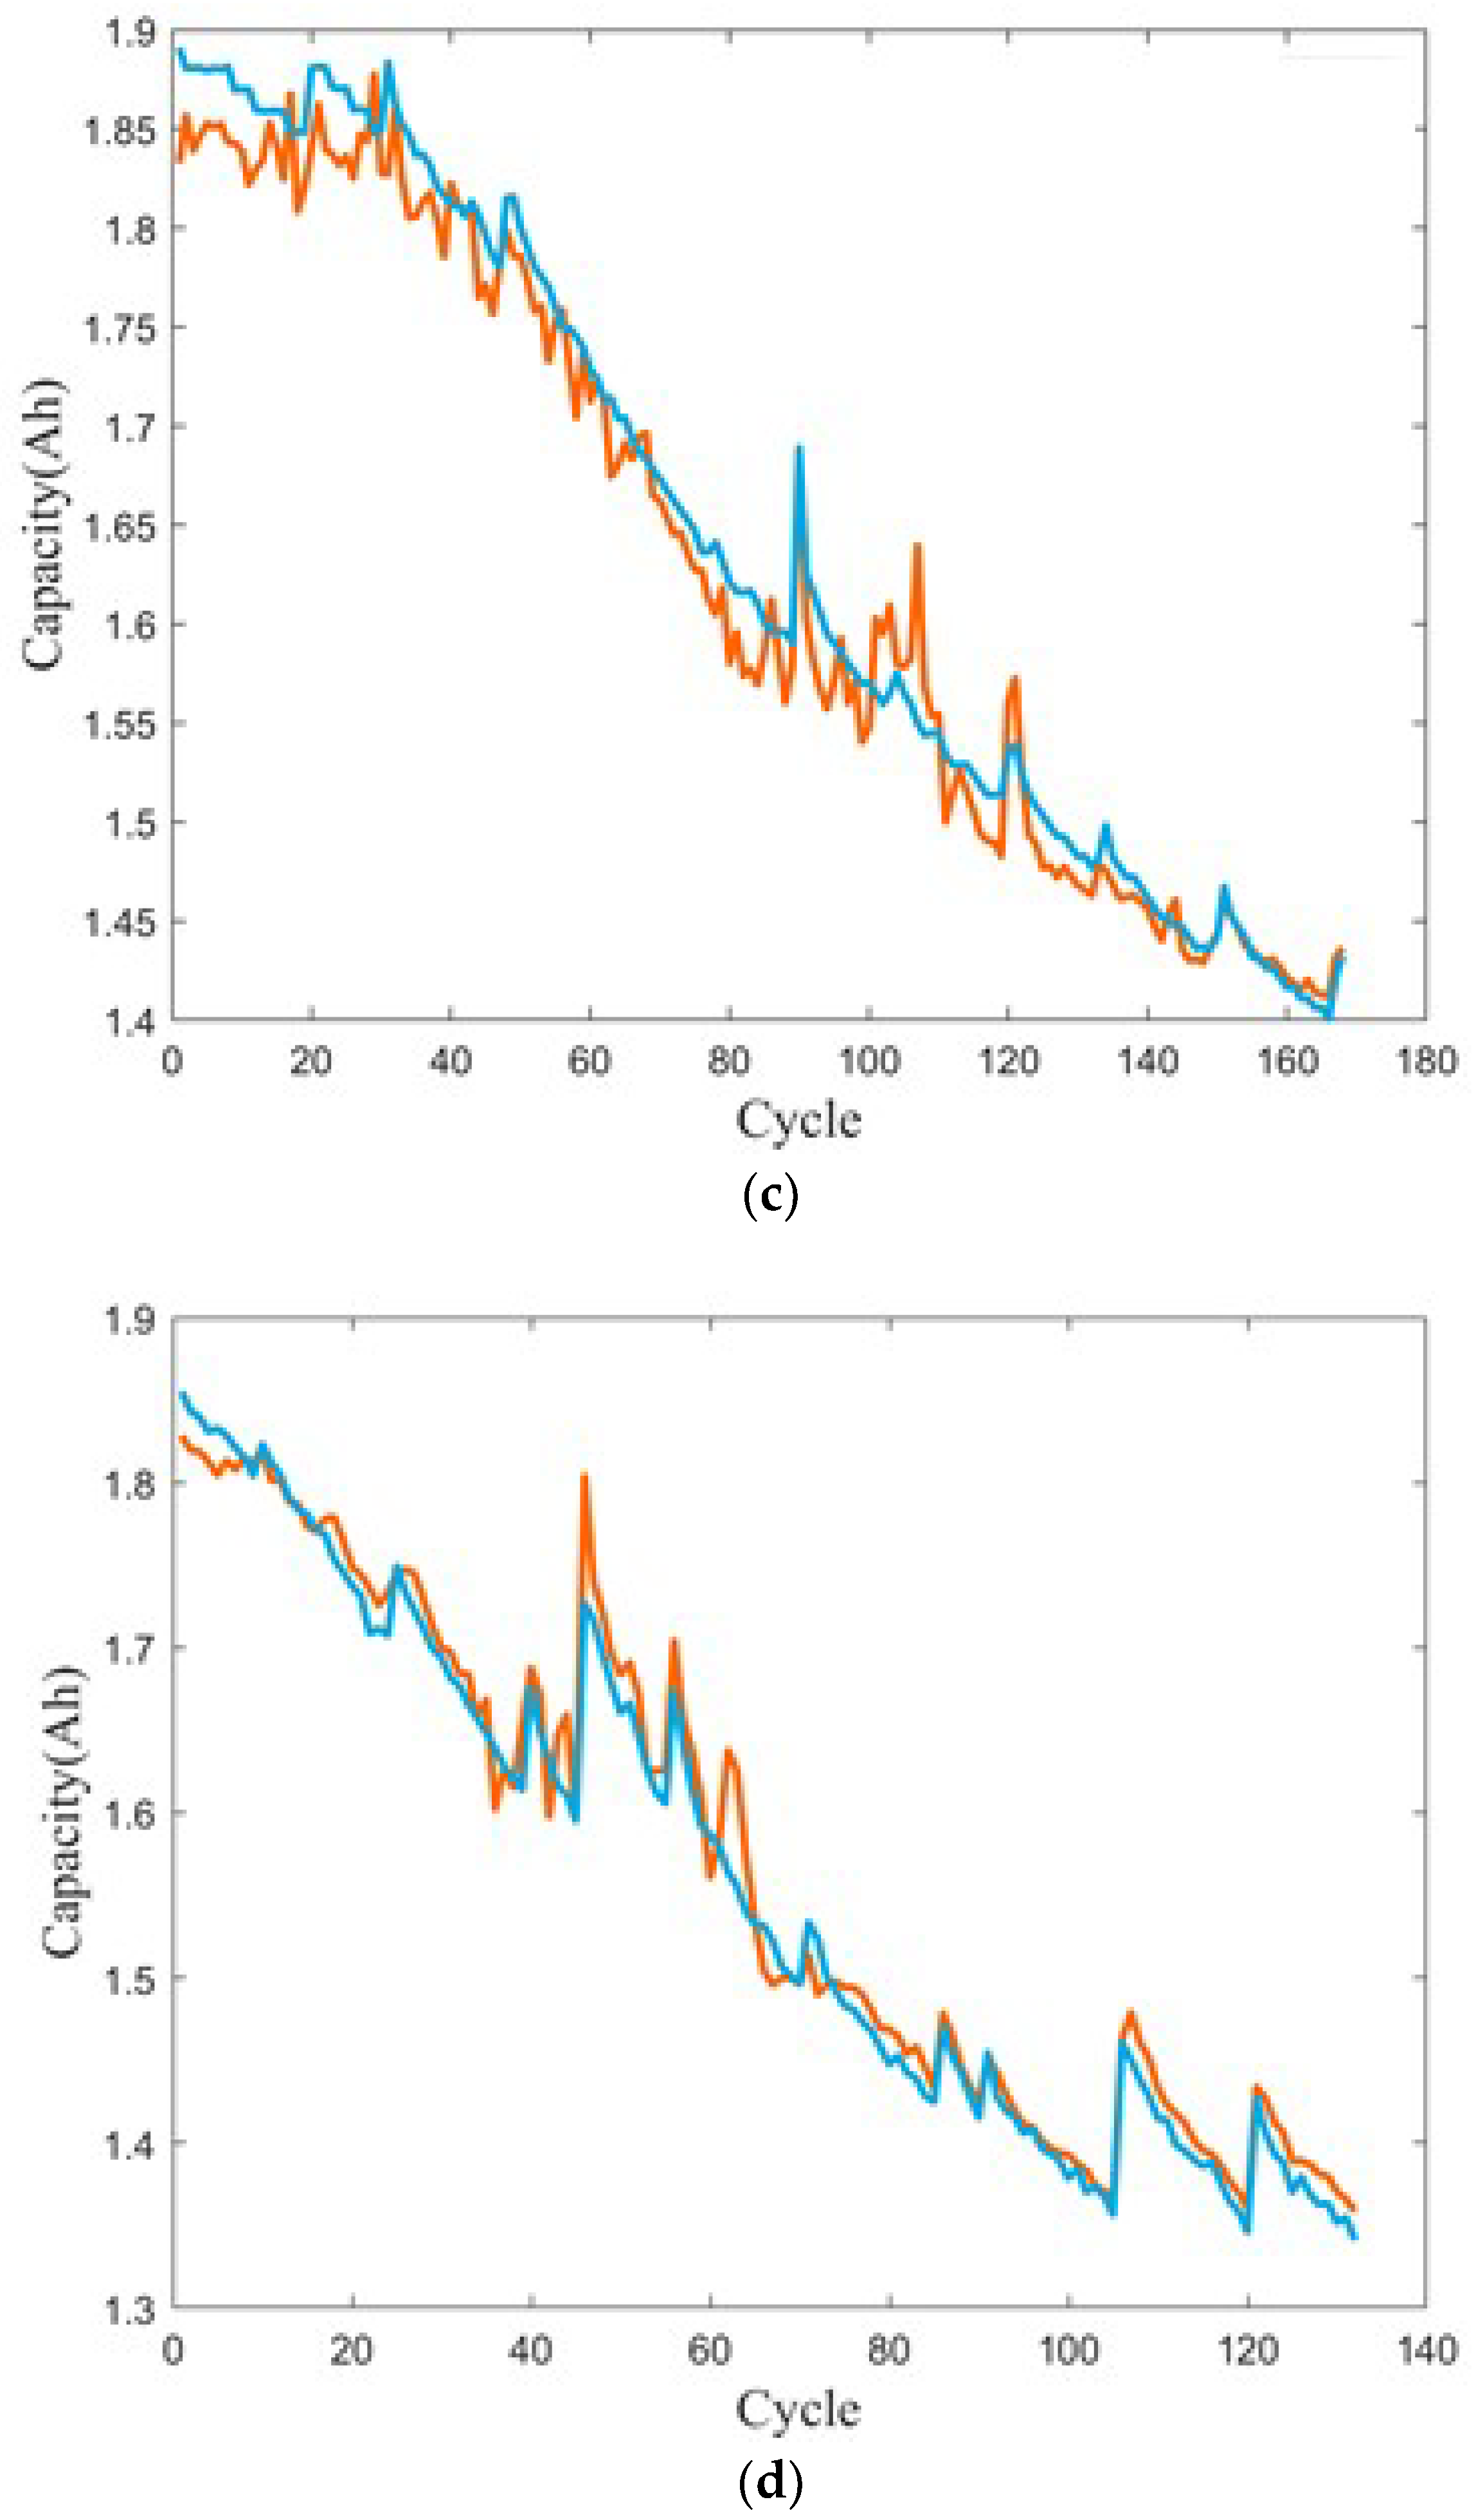
4. Results and Analysis
5. Conclusions
Author Contributions
Funding
Data Availability Statement
Conflicts of Interest
References
- Liu, D.; Zhou, J.; Guo, L.; Peng, Y. Survey on lithium-ion battery health assessment and cycle life estimation. Chin. J. Sci. Instrum. 2015, 36, 1–16. [Google Scholar]
- Wang, Q.; Mao, B.; Stoliarov, S.I.; Sun, J. A review of lithium ion battery failure mechanisms and fire prevention strategies. Prog. Energy Combust. Sci. 2019, 73, 95–131. [Google Scholar] [CrossRef]
- Kouchachvili, L.; Yaïci, W.; Entchev, E. Hybrid battery/supercapacitor energy storage system for the electric vehicles. J. Power Sources 2018, 374, 237–248. [Google Scholar] [CrossRef]
- Zhang, L.; Hu, X.; Wang, Z.; Sun, F.; Dorrell, D.G. A review of supercapacitor modeling, estimation, and applications: A control/management perspective. Renew. Sustain. Energy Rev. 2018, 81, 1868–1878. [Google Scholar] [CrossRef]
- Dong, G.Z.; Chen, Z.H.; Wei, J.W.; Ling, Q. Battery Health Prognosis Using Brownian Motion Modeling and Particle Filtering. IEEE Trans. Ind. Electron. 2018, 65, 8646–8655. [Google Scholar] [CrossRef]
- Zheng, Y.; Ouyang, M.; Lu, L.; Li, J. Understanding aging mechanisms in lithium-ion battery packs: From cell capacity loss to pack capacity evolution. J. Power Sources 2015, 278, 287–295. [Google Scholar] [CrossRef]
- Long, B.; Xian, W.; Jiang, L.; Liu, Z. An improved autoregressive model by particle swarm optimization for prognostics of lithium-ion batteries. Microelectron. Reliab. 2013, 53, 821–831. [Google Scholar] [CrossRef]
- Peng, Y.; Hou, Y.; Song, Y.; Pang, J.; Liu, D. Lithium-Ion Battery Prognostics with Hybrid Gaussian Process Function Regression. Energies 2018, 11, 1420. [Google Scholar] [CrossRef]
- Pang, X.; Huang, R.; Wen, J.; Shi, Y.; Jia, J.; Zeng, J. A Lithium-ion Battery RUL Prediction Method Considering the Capacity Regeneration Phenomenon. Energies 2019, 12, 2247. [Google Scholar] [CrossRef]
- Eddahech, A.; Briat, O.; Woirgard, E.; Vinassa, J. Remaining useful life prediction of lithium batteries in calendar ageing for automotive applications. Microelectron. Reliab. 2012, 52, 2438–2442. [Google Scholar] [CrossRef]
- Wu, J.; Zhang, C.; Chen, Z. An online method for lithium-ion battery remaining useful life estimation using importance sampling and neural networks. Appl. Energy 2016, 173, 134–140. [Google Scholar] [CrossRef]
- Liu, J.; Chen, Z. Remaining Useful Life Prediction of Lithium-Ion Batteries Based on Health Indicator and Gaussian Process Regression Model. IEEE Access 2019, 7, 39474–39484. [Google Scholar] [CrossRef]
- Lu, C.; Tao, L.; Fan, H. Li-ion battery capacity estimation: A geometrical approach. J. Power Sources 2014, 261, 141–147. [Google Scholar] [CrossRef]
- Guha, A.; Patra, A. Online Estimation of the Electrochemical Impedance Spectrum and Remaining Useful Life of Lithium-Ion Batteries. IEEE Trans. Instrum. Meas. 2018, 67, 1836–1849. [Google Scholar] [CrossRef]
- Berecibar, M.; Gandiaga, I.; Villarreal, I.; Omar, N.; Van Mierlo, J.; Van den Bossche, P. Critical review of state of health estimation methods of Li-ion batteries for real applications. Renew. Sustain. Energy Rev. 2016, 56, 572–587. [Google Scholar] [CrossRef]
- Wang, J.; Liu, P.; Hicks-Garner, J.; Sherman, E.; Soukiazian, S.; Verbrugge, M.; Finamore, P. Cycle-life model for graphite-LiFePO4 cells. J. Power Sources 2011, 196, 3942–3948. [Google Scholar] [CrossRef]
- Wang, Z.P.; Ma, J.; Zhang, L. State-of-Health Estimation for Lithium-Ion Batteries Based on the Multi-Island Genetic Algorithm and the Gaussian Process Regression. IEEE Access 2017, 5, 21286–21295. [Google Scholar] [CrossRef]
- Zhang, X.; Lu, J.; Yuan, S.; Yang, J.; Zhou, X. A novel method for identification of lithium-ion battery equivalent circuit model parameters considering electrochemical properties. J. Power Sources 2017, 345, 21–29. [Google Scholar] [CrossRef]
- Chen, Z.; Mi, C.C.; Fu, Y.; Xu, J.; Gong, X. Online battery state of health estimation based on Genetic Algorithm for electric and hybrid vehicle applications. J. Power Sources 2013, 240, 184–192. [Google Scholar] [CrossRef]
- Zhang, C.; Allafi, W.; Dinh, Q.; Ascencio, P.; Marco, J. Online estimation of battery equivalent circuit model parameters and state of charge using decoupled least squares technique. Energy 2018, 142, 678–688. [Google Scholar] [CrossRef]
- Plett, G.L. Extended Kalman filtering for battery management systems of LiPB-based HEV battery packs—Part 3. State and parameter estimation. J. Power Sources 2004, 134, 277–292. [Google Scholar] [CrossRef]
- Plett, G.L. Sigma-point Kalman filtering for battery management systems of LiPB-based HEV battery packs—Part 2: Simultaneous state and parameter estimation. J. Power Sources 2006, 161, 1369–1384. [Google Scholar] [CrossRef]
- Zou, Y.; Hu, X.; Ma, H.; Li, S.E. Combined State of Charge and State of Health estimation over lithium-ion battery cell cycle lifespan for electric vehicles. J. Power Sources 2015, 273, 793–803. [Google Scholar] [CrossRef]
- Zhang, F.; Liu, G.J.; Fang, L.J. Battery State Estimation Using Unscented Kalman Filter. In Proceedings of the IEEE International Conference on Robotics and Automation, Kobe, Japan, 12–17 May 2009; IEEE: New York, NY, USA, 2009; pp. 3574–3575. [Google Scholar]
- Olivares, B.E.; Munoz, M.A.C.; Orchard, M.E.; Silva, J.F. Particle-Filtering-Based Prognosis Framework for Energy Storage Devices With a Statistical Characterization of State-of-Health Regeneration Phenomena. IEEE Trans. Instrum. Meas. 2013, 62, 364–376. [Google Scholar] [CrossRef]
- Mistry, A.; Franco, A.A.; Cooper, S.J.; Roberts, S.A.; Viswanathan, V. How Machine Learning Will Revolutionize Electrochemical Sciences. ACS Energy Lett. 2021, 6, 1422–1431. [Google Scholar] [CrossRef] [PubMed]
- Jokar, A.; Rajabloo, B.; Désilets, M.; Lacroix, M. Review of simplified Pseudo-two-Dimensional models of lithium-ion batteries. J. Power Sources 2016, 327, 44–55. [Google Scholar] [CrossRef]
- Laue, V.; Roder, F.; Krewer, U. Practical identifiability of electrochemical P2D models for lithium-ion batteries. J. Appl. Electrochem. 2021, 51, 1253–1265. [Google Scholar] [CrossRef]
- Zhang, C.; He, Y.; Yuan, L.; Xiang, S. Capacity Prognostics of Lithium-Ion Batteries using EMD Denoising and Multiple Kernel RVM. IEEE Access 2017, 5, 12061–12070. [Google Scholar] [CrossRef]
- Zhang, S.Z.; Zhai, B.Y.; Guo, X.; Wang, K.K.; Peng, N.A.; Zhang, X.W. Synchronous estimation of state of health and remaining useful lifetime for lithium-ion battery using the incremental capacity and artificial neural networks. J. Energy Storage 2019, 26, 100951. [Google Scholar] [CrossRef]
- Liu, D.; Pang, J.; Zhou, J.; Peng, Y.; Pecht, M. Prognostics for state of health estimation of lithium-ion batteries based on combination Gaussian process functional regression. Microelectron. Reliab. 2013, 53, 832–839. [Google Scholar] [CrossRef]
- Li, X.; Wang, Z.; Yan, J. Prognostic health condition for lithium battery using the partial incremental capacity and Gaussian process regression. J. Power Sources 2019, 421, 56–67. [Google Scholar] [CrossRef]
- Singh, P.; Vinjamuri, R.; Wang, X.; Reisner, D. Design and implementation of a fuzzy logic-based state-of-charge meter for Li-ion batteries used in portable defibrillators. J. Power Sources 2006, 162, 829–836. [Google Scholar] [CrossRef]
- Zenati, A.; Desprez, P.; Razik, H. Estimation of the SOC and the SOH of Li-ion Batteries, by combining Impedance Measurements with the Fuzzy Logic Inference. In Proceedings of the 36th Annual Conference of the IEEE Industrial-Electronics-Society (IECON)/4th IEEE International Conference on E-Learning in Industrial Electronics/IES Industry Forum, Glendale, AZ, USA, 7–10 November 2010; IEEE: New York, NY, USA, 2010. [Google Scholar]

| Battery | Rated Capacity (Ah) | Rated Voltage (V) | Cut-Off Voltage (V) | Discharge Current (A) | Initial Temperature (°C) |
|---|---|---|---|---|---|
| #5 | 2.2 | 3.7 | 2.7 | 2 | 24 |
| #6 | 2.2 | 3.7 | 2.5 | 2 | 24 |
| #7 | 2.2 | 3.7 | 2.2 | 2 | 24 |
| #18 | 2.2 | 3.7 | 2.5 | 2 | 24 |
| Parameters | Value |
|---|---|
| Number of epochs | 40 |
| Momentum | 0.9 |
| Initial learning rate | 0.01 |
| L2 regularization, | 0.001 |
| Mini-batch size | 40 |
| Layer | Filter | Kernel | Stride |
|---|---|---|---|
| Input | (40, 3, 1) | - | - |
| Conv.1 | (2, 1) | 16 | (1, 1) |
| Conv.2 | (3, 1) | 32 | (1, 1) |
| Conv.3 | (3, 3) | 40 | (1, 1) |
| FC.1 | (40, 1) | - | - |
| FC.2 | (40, 1) | - | - |
| FC.3 | (1, 1) | - | - |
| Battery | Max Error (%) | Mean Absolute Percentage Error Rate (%) |
|---|---|---|
| #5 | 4.30 | 1.27 |
| #6 | 2.05 | 1.12 |
| #7 | 2.32 | 1.32 |
| #18 | 4.70 | 1.00 |
| Overall | 4.70 | 1.12 |
Disclaimer/Publisher’s Note: The statements, opinions and data contained in all publications are solely those of the individual author(s) and contributor(s) and not of MDPI and/or the editor(s). MDPI and/or the editor(s) disclaim responsibility for any injury to people or property resulting from any ideas, methods, instructions or products referred to in the content. |
© 2024 by the authors. Licensee MDPI, Basel, Switzerland. This article is an open access article distributed under the terms and conditions of the Creative Commons Attribution (CC BY) license (https://creativecommons.org/licenses/by/4.0/).
Share and Cite
Zeng, S.; Chen, S.; Alkali, B. Lithium-Ion Battery Capacity Estimation Based on Incremental Capacity Analysis and Deep Convolutional Neural Network. Energies 2024, 17, 1272. https://doi.org/10.3390/en17061272
Zeng S, Chen S, Alkali B. Lithium-Ion Battery Capacity Estimation Based on Incremental Capacity Analysis and Deep Convolutional Neural Network. Energies. 2024; 17(6):1272. https://doi.org/10.3390/en17061272
Chicago/Turabian StyleZeng, Sibo, Sheng Chen, and Babakalli Alkali. 2024. "Lithium-Ion Battery Capacity Estimation Based on Incremental Capacity Analysis and Deep Convolutional Neural Network" Energies 17, no. 6: 1272. https://doi.org/10.3390/en17061272
APA StyleZeng, S., Chen, S., & Alkali, B. (2024). Lithium-Ion Battery Capacity Estimation Based on Incremental Capacity Analysis and Deep Convolutional Neural Network. Energies, 17(6), 1272. https://doi.org/10.3390/en17061272