Article

Synergistic Hybrid Marine Renewable Energy Harvest System

1
School of Sustainability, Civil and Environmental Engineering, University of Surrey, Guildford GU2 7XH, UK
2
Ramboll UK Limited, London SE1 8NW, UK
3
Department of Civil, Construction, and Environmental Engineering, North Carolina State University, Raleigh, NC 27695, USA
4
School of Civil, Mining, Environmental and Architectural Engineering, Faculty of Engineering and Information Sciences, University of Wollongong, Wollongong 2522, Australia
5
School of Chemistry and Chemical Engineering, University of Surrey, Guildford GU2 7XH, UK
*
Author to whom correspondence should be addressed.
Energies 2024, 17(5), 1240; https://doi.org/10.3390/en17051240
Submission received: 29 January 2024 / Revised: 20 February 2024 / Accepted: 22 February 2024 / Published: 5 March 2024
(This article belongs to the Section A: Sustainable Energy)

Abstract

:
This paper proposes a novel hybrid marine renewable energy-harvesting system to increase energy production, reduce levelized costs of energy and promote renewable marine energy. Firstly, various marine renewable energy resources and state-of-art technologies for energy exploitation and storage were reviewed. The site selection criteria for each energy-harvesting approach were identified, and a scoring matrix for site selection was proposed to screen suitable locations for the hybrid system. The Triton Knoll wind farm was used to demonstrate the effectiveness of the scoring matrix. An integrated energy system was designed, and FE modeling was performed to assess the effects of additional energy devices on the structural stability of the main wind turbine structure. It has been proven that the additional energy structures have a negligible influence on foundation/structure deflection (<1%) and increased system natural frequency by 6%; thus, they have a minimum influence on the original wind system but increased energy yield.

1. Introduction

Cost-effectively harvesting renewable energy is a crucial step to address the UN sustainable development Goal 7—“ensure access to affordable, reliable, sustainable, and modern energy for all” and Goal 13—“take urgent action to combat climate change and its impacts.” Moving the energy portfolio from fossil fuel-based to a balanced mix of renewable energies could combat climate changes and lead to a sustainable planet. Ocean renewable energy can be harvested from various resources, including wind energy harvested by offshore wind turbines (OWTs), wave, tidal, and current energy harvested by marine hydrokinetic (MHK) devices, and geothermal energy of the oceanic crust via offshore foundation systems integrated with heat exchanger systems.
The 2022 UN Ocean Conference has confirmed that the ocean is facing unprecedented threats due to human activities. The ocean space needs to be managed sustainably and synergistically. To address this, new concepts of integrated wind and wave energy converter (WEC) devices have been established in the literature. Such a configuration can potentially increase the energy yield per unit area of marine space and reduce power fluctuation, thereby contributing to the optimal use of available natural resources [1]. Other benefits include the shadowing effect leading to milder loading and the minimization of environmental impact through the deployment of more than one marine energy device at the same location [2]. Possible deployment configurations include Peripherally Distributed Array, Uniformly Distributed Array and Non-uniformly Distributed Array [3]. The effects of WEC spacing and layout on the shadowing effect, resulting in a reduction in significant wave height at wind turbines, have been demonstrated through a case study in southwest England [4] and a case study off the Danish coast [5].
Integrated energy systems can be in the form of co-location or hybrid. Co-location refers to the placement arrays of MHK devices in the vicinity of wind farms. Figure 1 shows a schematic rendering of wave devices co-located utilizing the foundation system of the wind turbine. A hybrid system combines wind turbine and wave and/or current converters on the same structure, whether bottom-fixed or floating. Figure 2 shows a schematic rendering of current turbines integrated with a wind turbine tower. The deployment of co-located and hybrid marine renewable energy devices provides a unique opportunity for optimizing the costs of installation, operation, and maintenance and reducing the costs of supporting infrastructures such as cable boxes and grid connectivity [6]. Goldschmidt and Muskulusby [7] indicated that shared anchoring and mooring for offshore wind turbines led to a cost reduction of up to 60% in the mooring system and 8% in total system costs. Castro-Santos et al. [8] conducted a cost assessment of combined offshore wind and wave energy systems. The authors concluded that the hybrid system could reduce insurance, administration, operation and maintenance, manufacturing, and installation costs, decreasing the LCOE. Given the advent state of offshore wind energy worldwide, the opportunity to deploy wave and current devices integrated with offshore wind farms can propel the MHK industry into the expedient deployment and operation of full-scale arrays.
No substantial data/information can be found in the literature that addresses the anchoring foundation response supporting multiple devices in either co-location or hybrid settings. The standards developed by the IEC TC 114 do not include shared anchoring and mooring provisions even within the sole deployment of the wave, tidal, or current arrays. An essential aspect of the success of hybrid and co-located offshore devices is the successful sharing of mooring and anchors compared to the use of separate anchoring systems for each device.
The previous studies only integrate offshore wind energy with one or two marine hydrodynamic energy forms. In the current study, a novel synergistic hybrid offshore energy platform, which incorporates all feasible marine renewable energy harvest devices as well as energy storage devices, as illustrated in Figure 3, is proposed. As proposed by Zhang et al. [10], the hybridization of physical systems follows two principles: complementary principle and compatibility principle. The complementary principle refers to the feature in which the strength of one component complements the weakness of other components, and its weakness is compensated by the strength of other components. The compatibility principle requires adjustments to the physical component level to minimize their side effects when integrating two systems. Wind, wave, and current energy sources are intermittent; the imbalance in supply and demand can be addressed by energy storage to enhance energy exploitation efficiency and reduce the levelized cost of energy (LCOE), which follows the complementary principle. While integrating the energy devices to the hybrid platform, the configurations need to be designed properly to avoid the shadowing effect, which conforms to the compatibility principle. An intensive review of the state-of-the-art technologies of individual offshore renewable energy harvest approaches and the latest energy storage techniques was first presented to identify the design challenges. A scoring matrix system is proposed to determine if a hybrid system is feasible at a specific marine site. This matrix system is tested using the case study of the Triton Knoll wind farm. A hybrid system was designed at this farm, and FE modeling was performed to assess the effects of the additional energy harvesting and storage structure on the structural stability and natural frequency of the main wind tower structure (Technology readiness levels 2–3 research).

2. Marine Renewable Energy Harvest Devices and Energy Storage Technologies

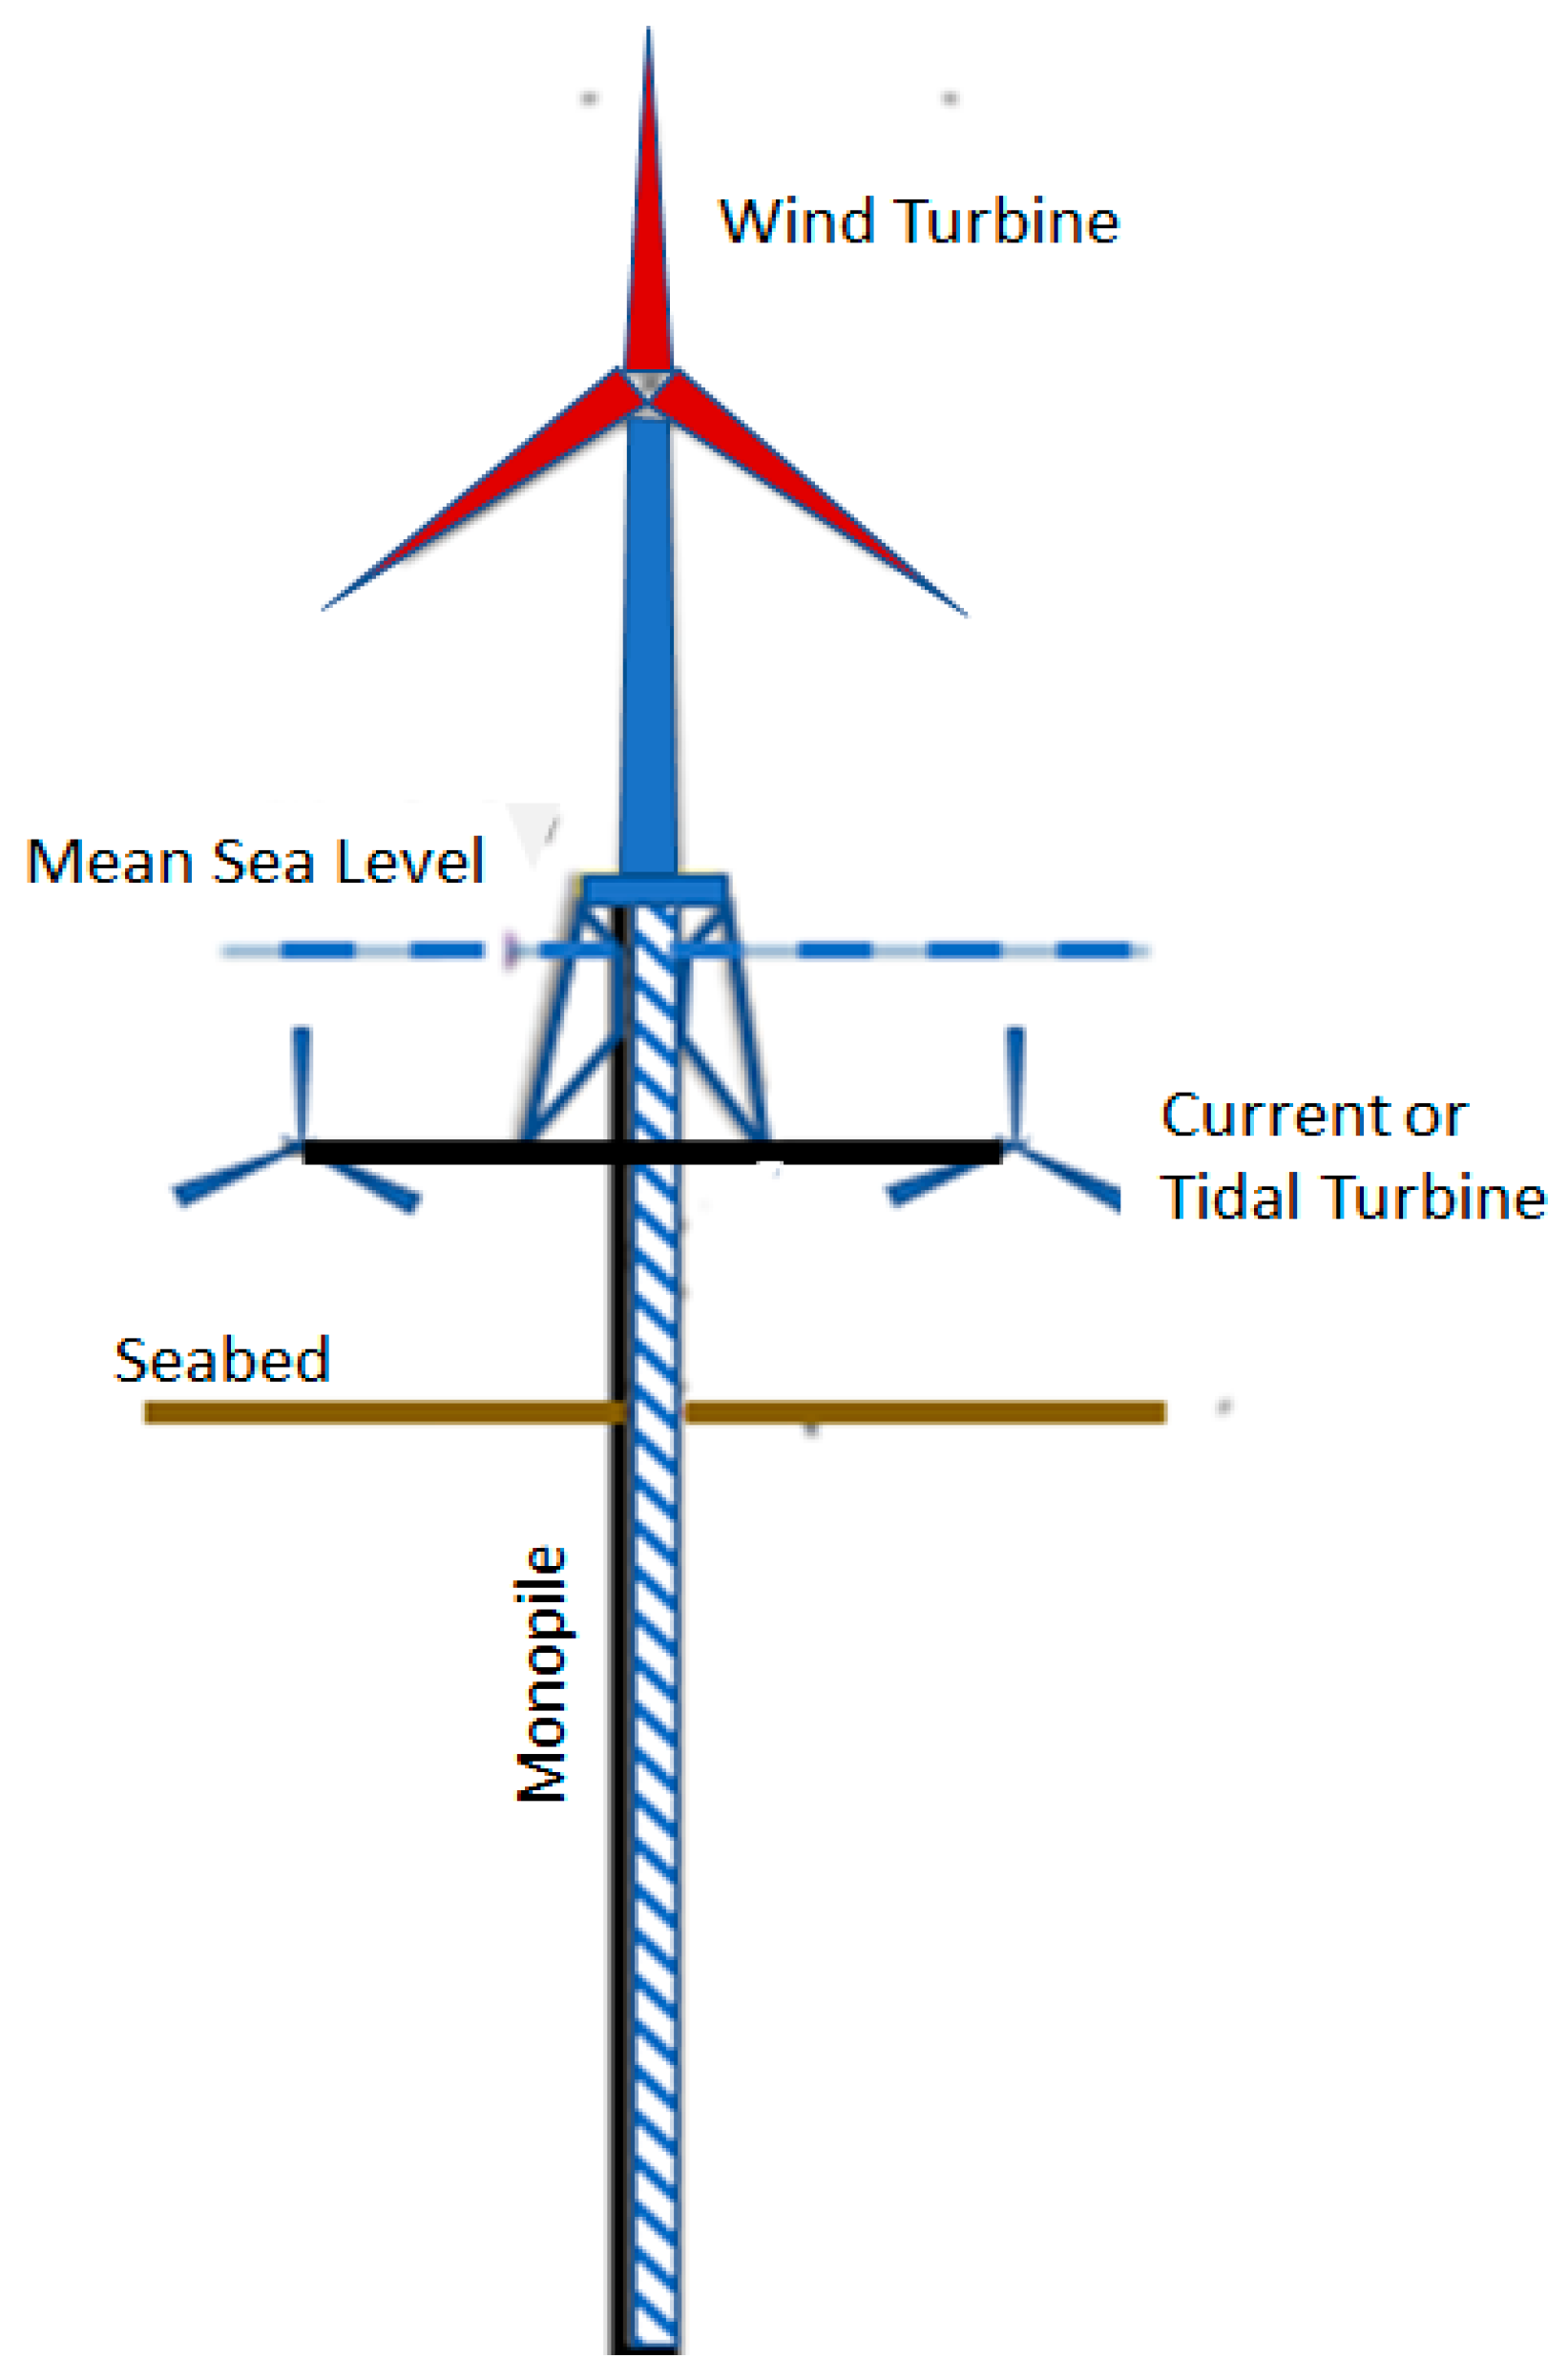
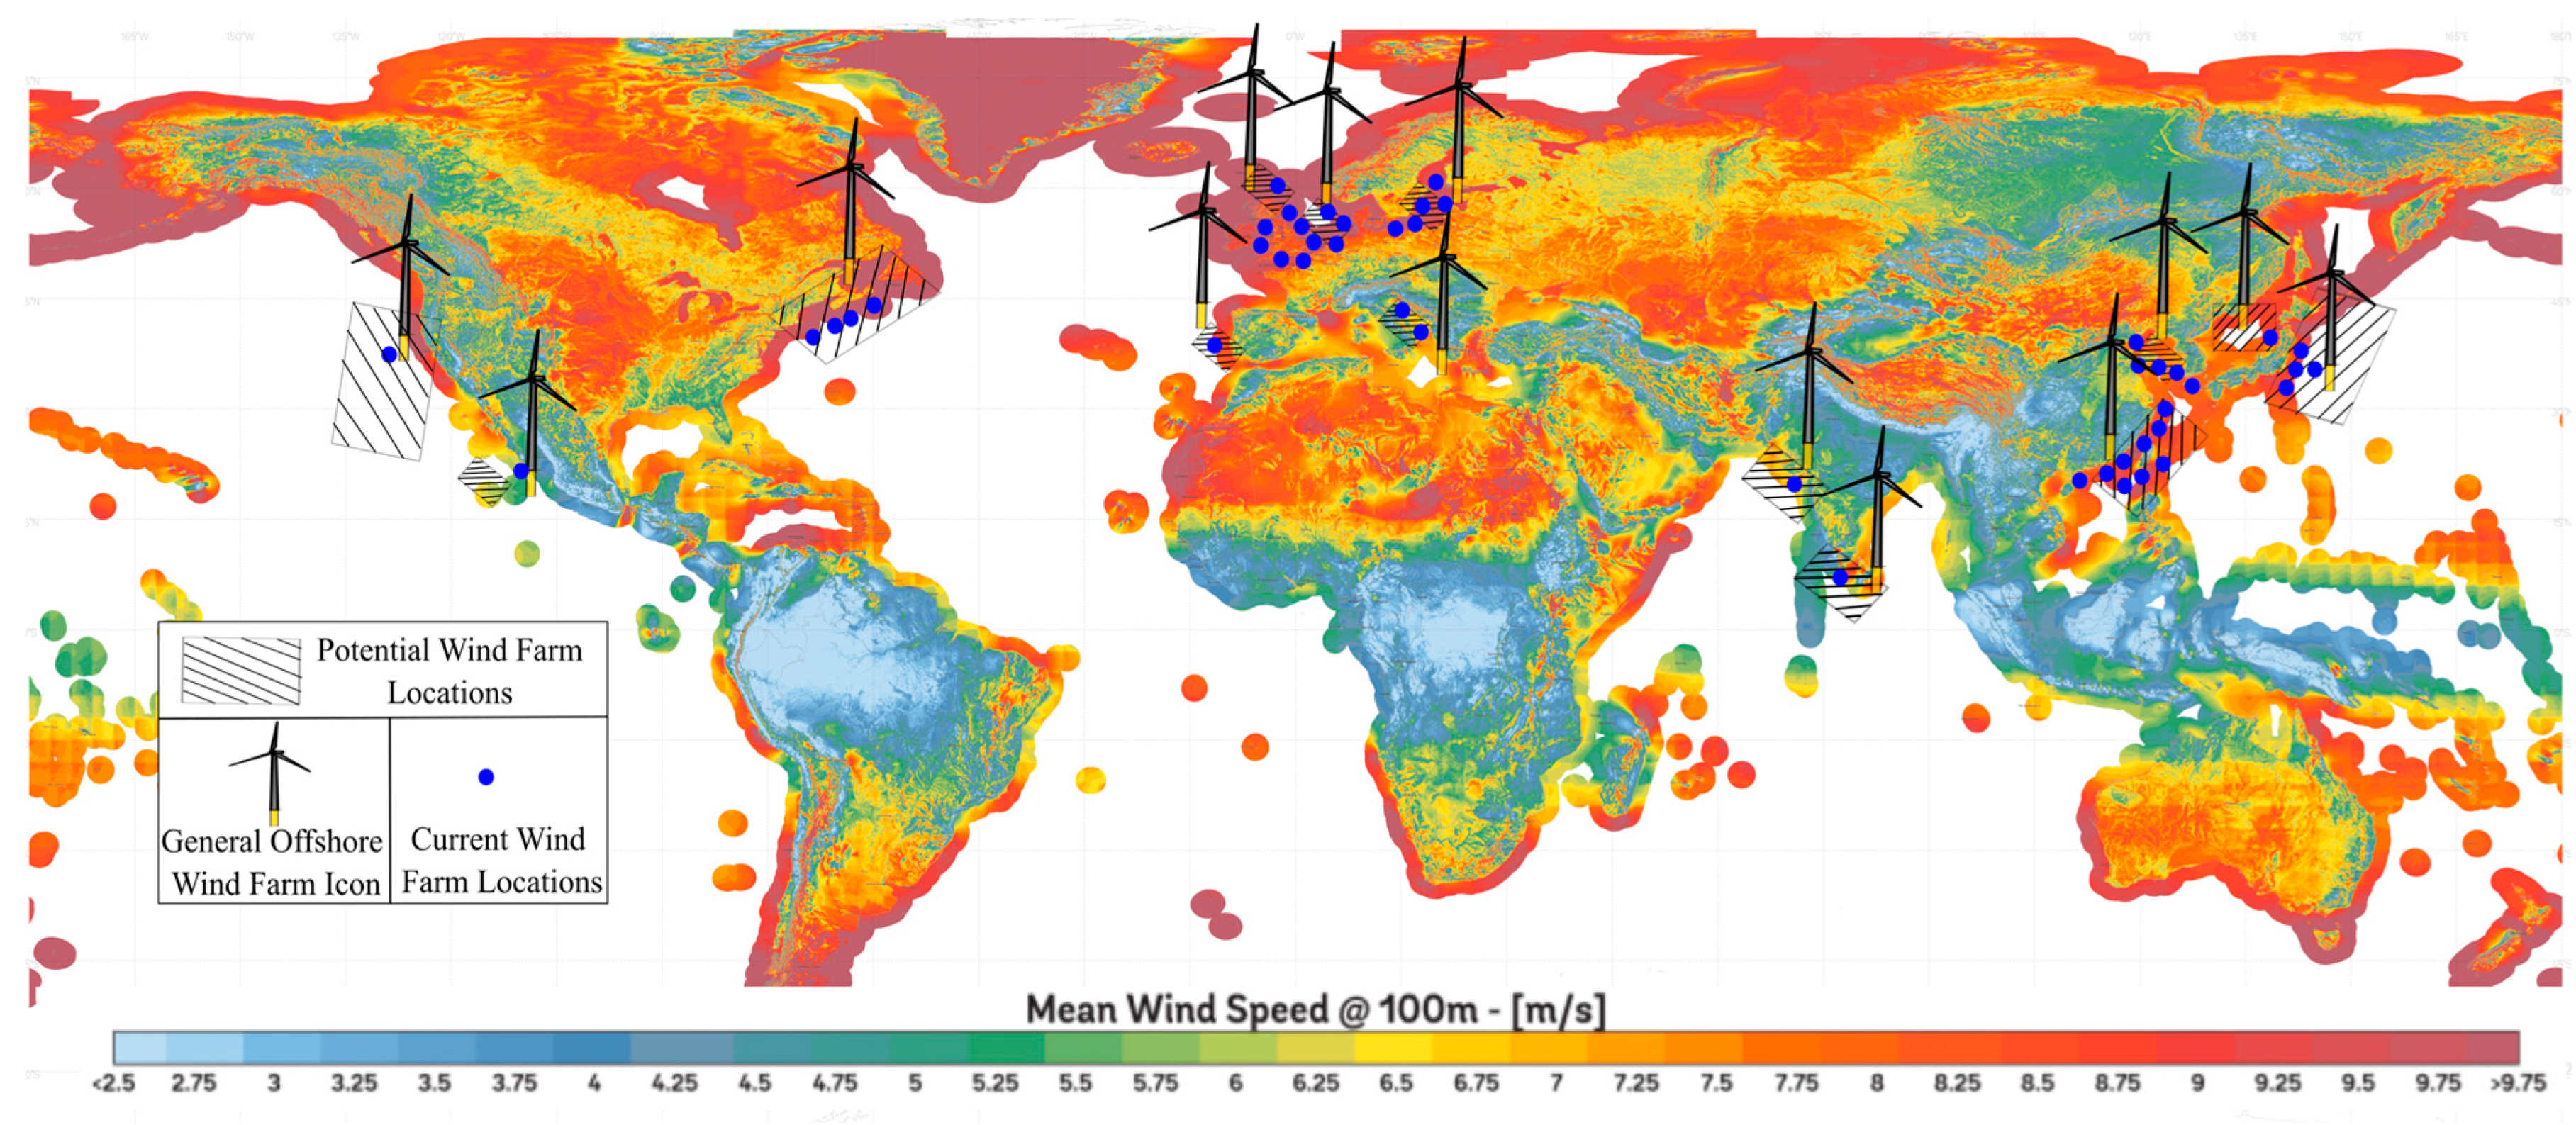
2.1. Offshore Wind Turbines (OWT)

The extraction of kinetic energy from wind can be backdated to 2000 years ago. Wind energy is mainly harvested by turning the turbine blades and spinning the rotor to generate electricity. The potential for wind energy is enormous, especially offshore wind energy, due to the more robust and stable wind speed offshore. The potential of wind energy resources can be illustrated by the annually averaged wind speed map, as shown in Figure 4, where orange to red colors are suited for producing wind energy. In recent decades, wind energy saw considerable growth in installed wind turbine capacities, both onshore and offshore, and reduced LCOE. As described in the Global Wind Report 2022 [11], almost 94 GW of turbine capacity, with 21 GW offshore, was installed in 2021, which brings the global cumulative wind power capacity to 837 GW with 57 GW offshore. According to the report, the global wind energy market is expected to grow by 6.6% annually on average until 2026.
Wind turbine technology is a complicated multi-disciplinary technology involving aerodynamics, structural dynamics, geotechnics, meteorology, and electrical engineering. A wind turbine consists of a tower, a nacelle with blades, an electricity generation and transmission system mounted on the top of a tower, and a foundation holding the tower in place and resisting environmental loading from wind, wave, current, and potential seismic activities. Offshore wind turbines are usually installed as arrays in a wind farm with each unit connected to transmission lines leading to a substation before being transmitted to the national electricity grid. The costs for an offshore wind turbine include capital expenditure (CAPEX), operational expenditure (OPEX), and decommissioning expenditure (DECEX). The CAPEX includes the development and consenting costs, production (including turbine, substructure, and transmission assets), and installation costs. Amongst these, the substructure and transmission assets are required for any energy harvest system and might be shared between different systems to save costs.
In a wind farm, each turbine is spaced with a distance typically six to seven times the rotor diameter in the prevailing wind direction and four to five times across the wind to the avoid the wake effect [14]. The wind turbine and the subsea infrastructure encompass an area approximately 1% of the total marine area occupied by the OWT array. The remaining 99% area provides plenty of spaces to add co-located other energy harvest or storage devices without impairing the energy production efficiency of each component. With the additional energy harvest devices deployed in the already occupied marine space, the total energy yield will be increased significantly, thus enhancing the energy yield per unit area.

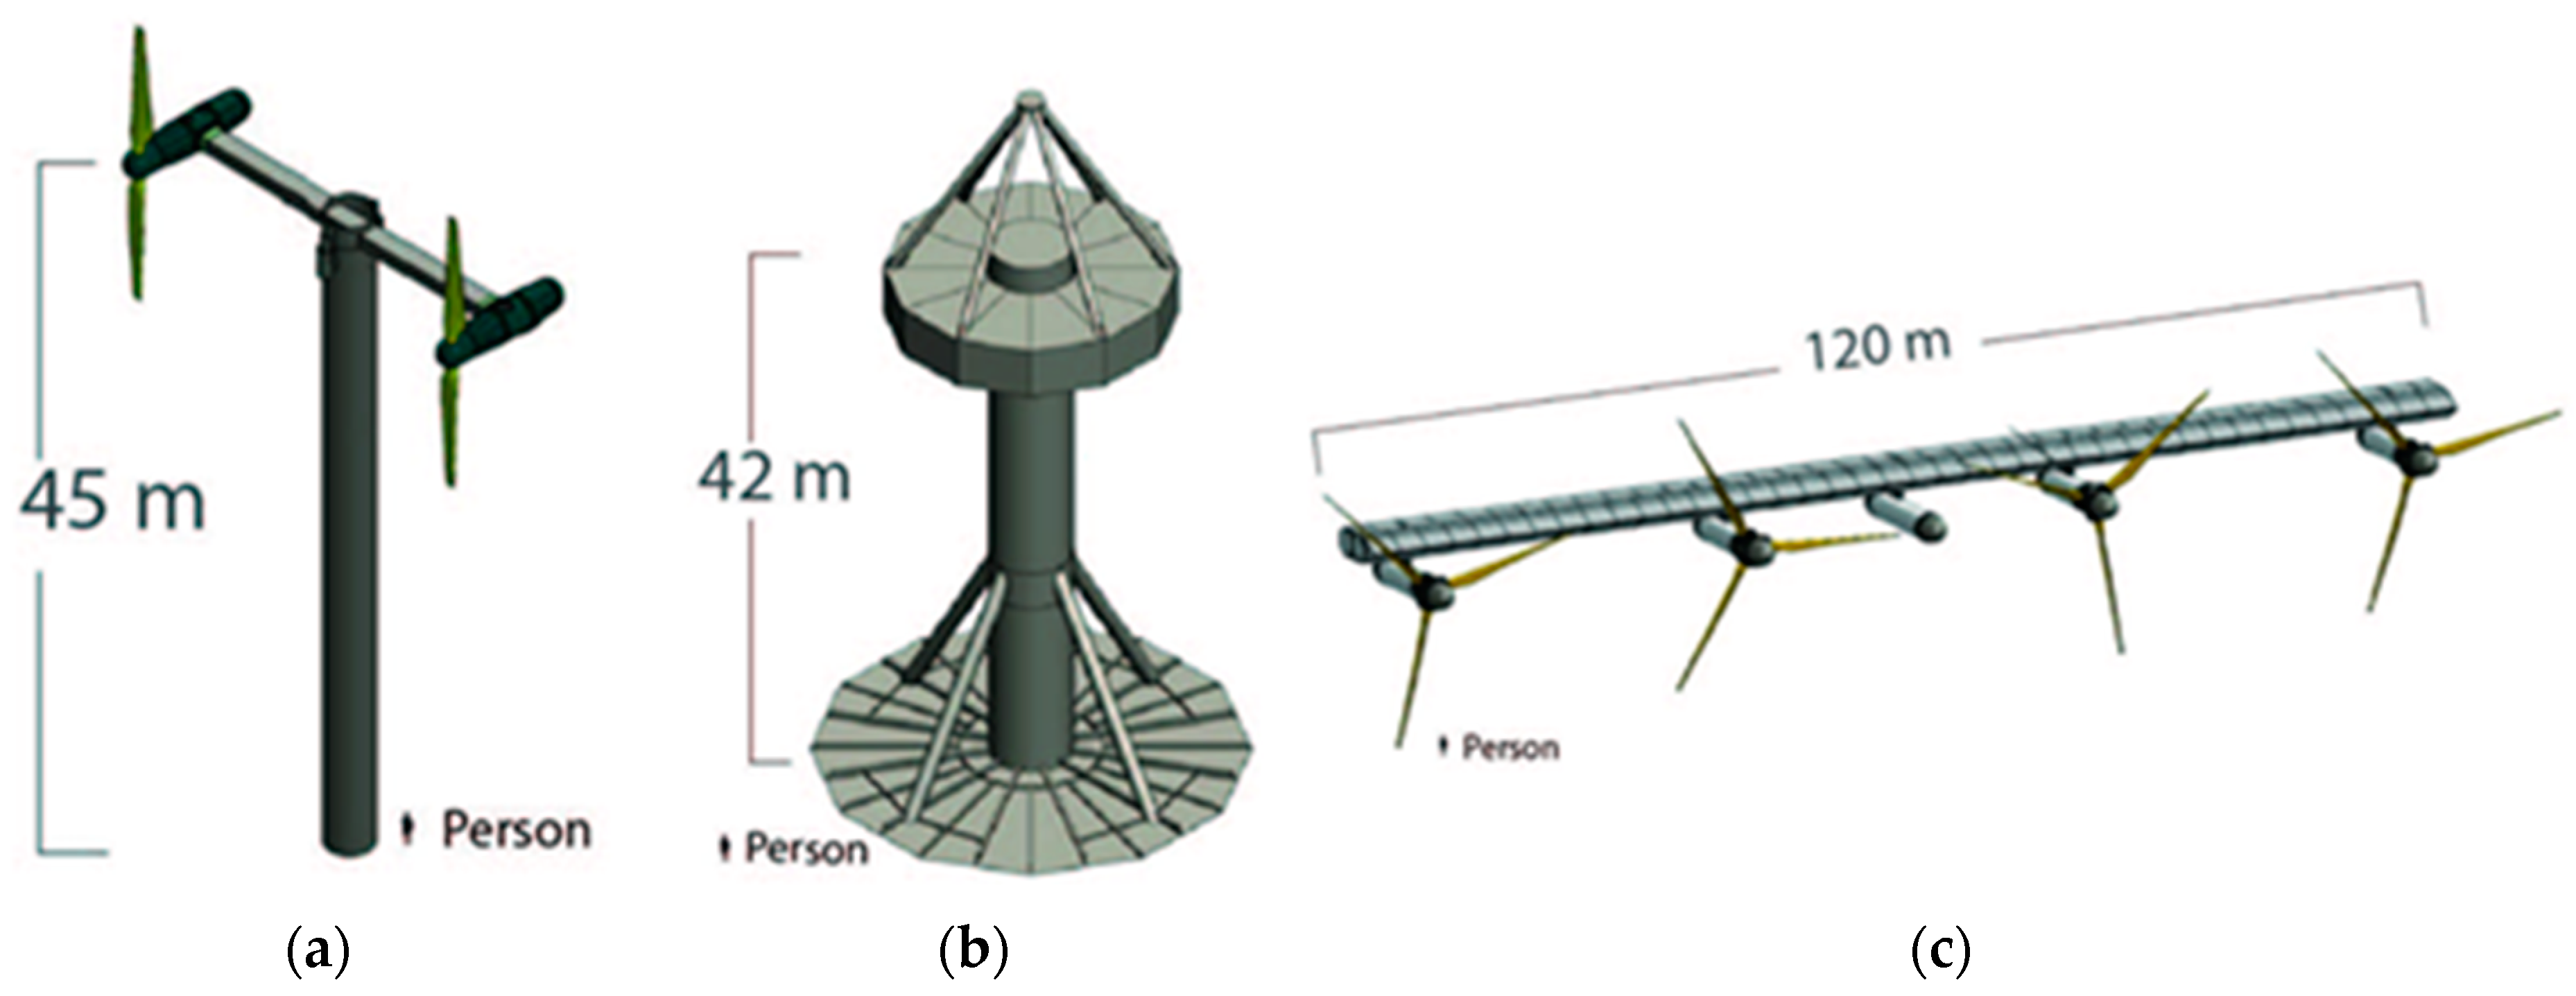
2.2. Marine Hydrokinetic (MHK) Energy Harvest Devices

Offshore ocean waves, diurnal tides, and currents are renewable energy resources that can be harvested by deploying Maine Hydrokinetics (MHK) arrays. Devices in such arrays convert the kinetic energy into electric power that is transferred to shore through “shore-to-land” cables. The US Department of Energy [15] compiled data quantifying the theoretical marine energy resources in the USA, as shown in Figure 5. The data show potential marine energy resources of 2.3 Tera Watt-Hour (TWh) in theory. Ocean waves, tidal waves, and ocean currents are the major sources of energy on the east coast of the US, while wave energy is a primary source on the west coast of the US. Both currents and waves are significant energy sources in Hawaii and Alaska. Thermal resources are available throughout the fifty states and the US territories.
The MHK devices are classified into waves and current devices. Current devices can be operated in tidal, ocean, or river currents. The European Marine Energy Centre (EMEC) provided an early schematic rendering of such devices. The US Department of Energy has presented base models for several types of MHK devices [16]. These are referred to as “Reference Models” or “RMs” and include extensive documentation, including device configurations, dimensions, and operating parameters. Figure 6 shows three examples of such reference models. Figure 6a shows RM1, a tidal current converter with dual-horizontal-axis rotors rates at 1100 kilowatts (kW); Figure 6b shows a wave floating point absorber with a rated capacity of 360 kW, and Figure 6c shows an ocean current device with four turbines with each turbine having a capacity of 1000 kW [16]. No commercial-scale deployment of MHK is in operation off the US coast. Two recent developments in the US are worthy of mentioning. The first is the experimental deployment of the tri-frame mounted tidal turbines by Verdant Power in New York’s East River. Over six months, 210 MWh of electricity was generated. The second is the issuance of a federal marine hydrokinetic energy (MHK) research lease in 2021 by the Bureau of Ocean Energy Management to Oregon State University. The lease is for developing an open ocean wave energy test facility with one of the test sites scheduled to start operation in 2023 [16].
Significant advances in the development of MHK standards and specifications have been made by the International Electrotechnical Commission (IEC) Technical Committee (TC) 114 [16]. The specification covers resource assessment, environmental impact and economic assessment, and system and array components design. Each RM, regardless of its type, requires anchoring and mooring lines integrated as a main component of the system deployment. Concerning the anchoring and mooring system, the standards and specifications guide serviceability, ultimate, and fatigue limit states. The mooring/anchoring systems are frequently designed based on extreme conditions with 100 years of recurrence, with representative data time series significantly challenging in designing such systems.

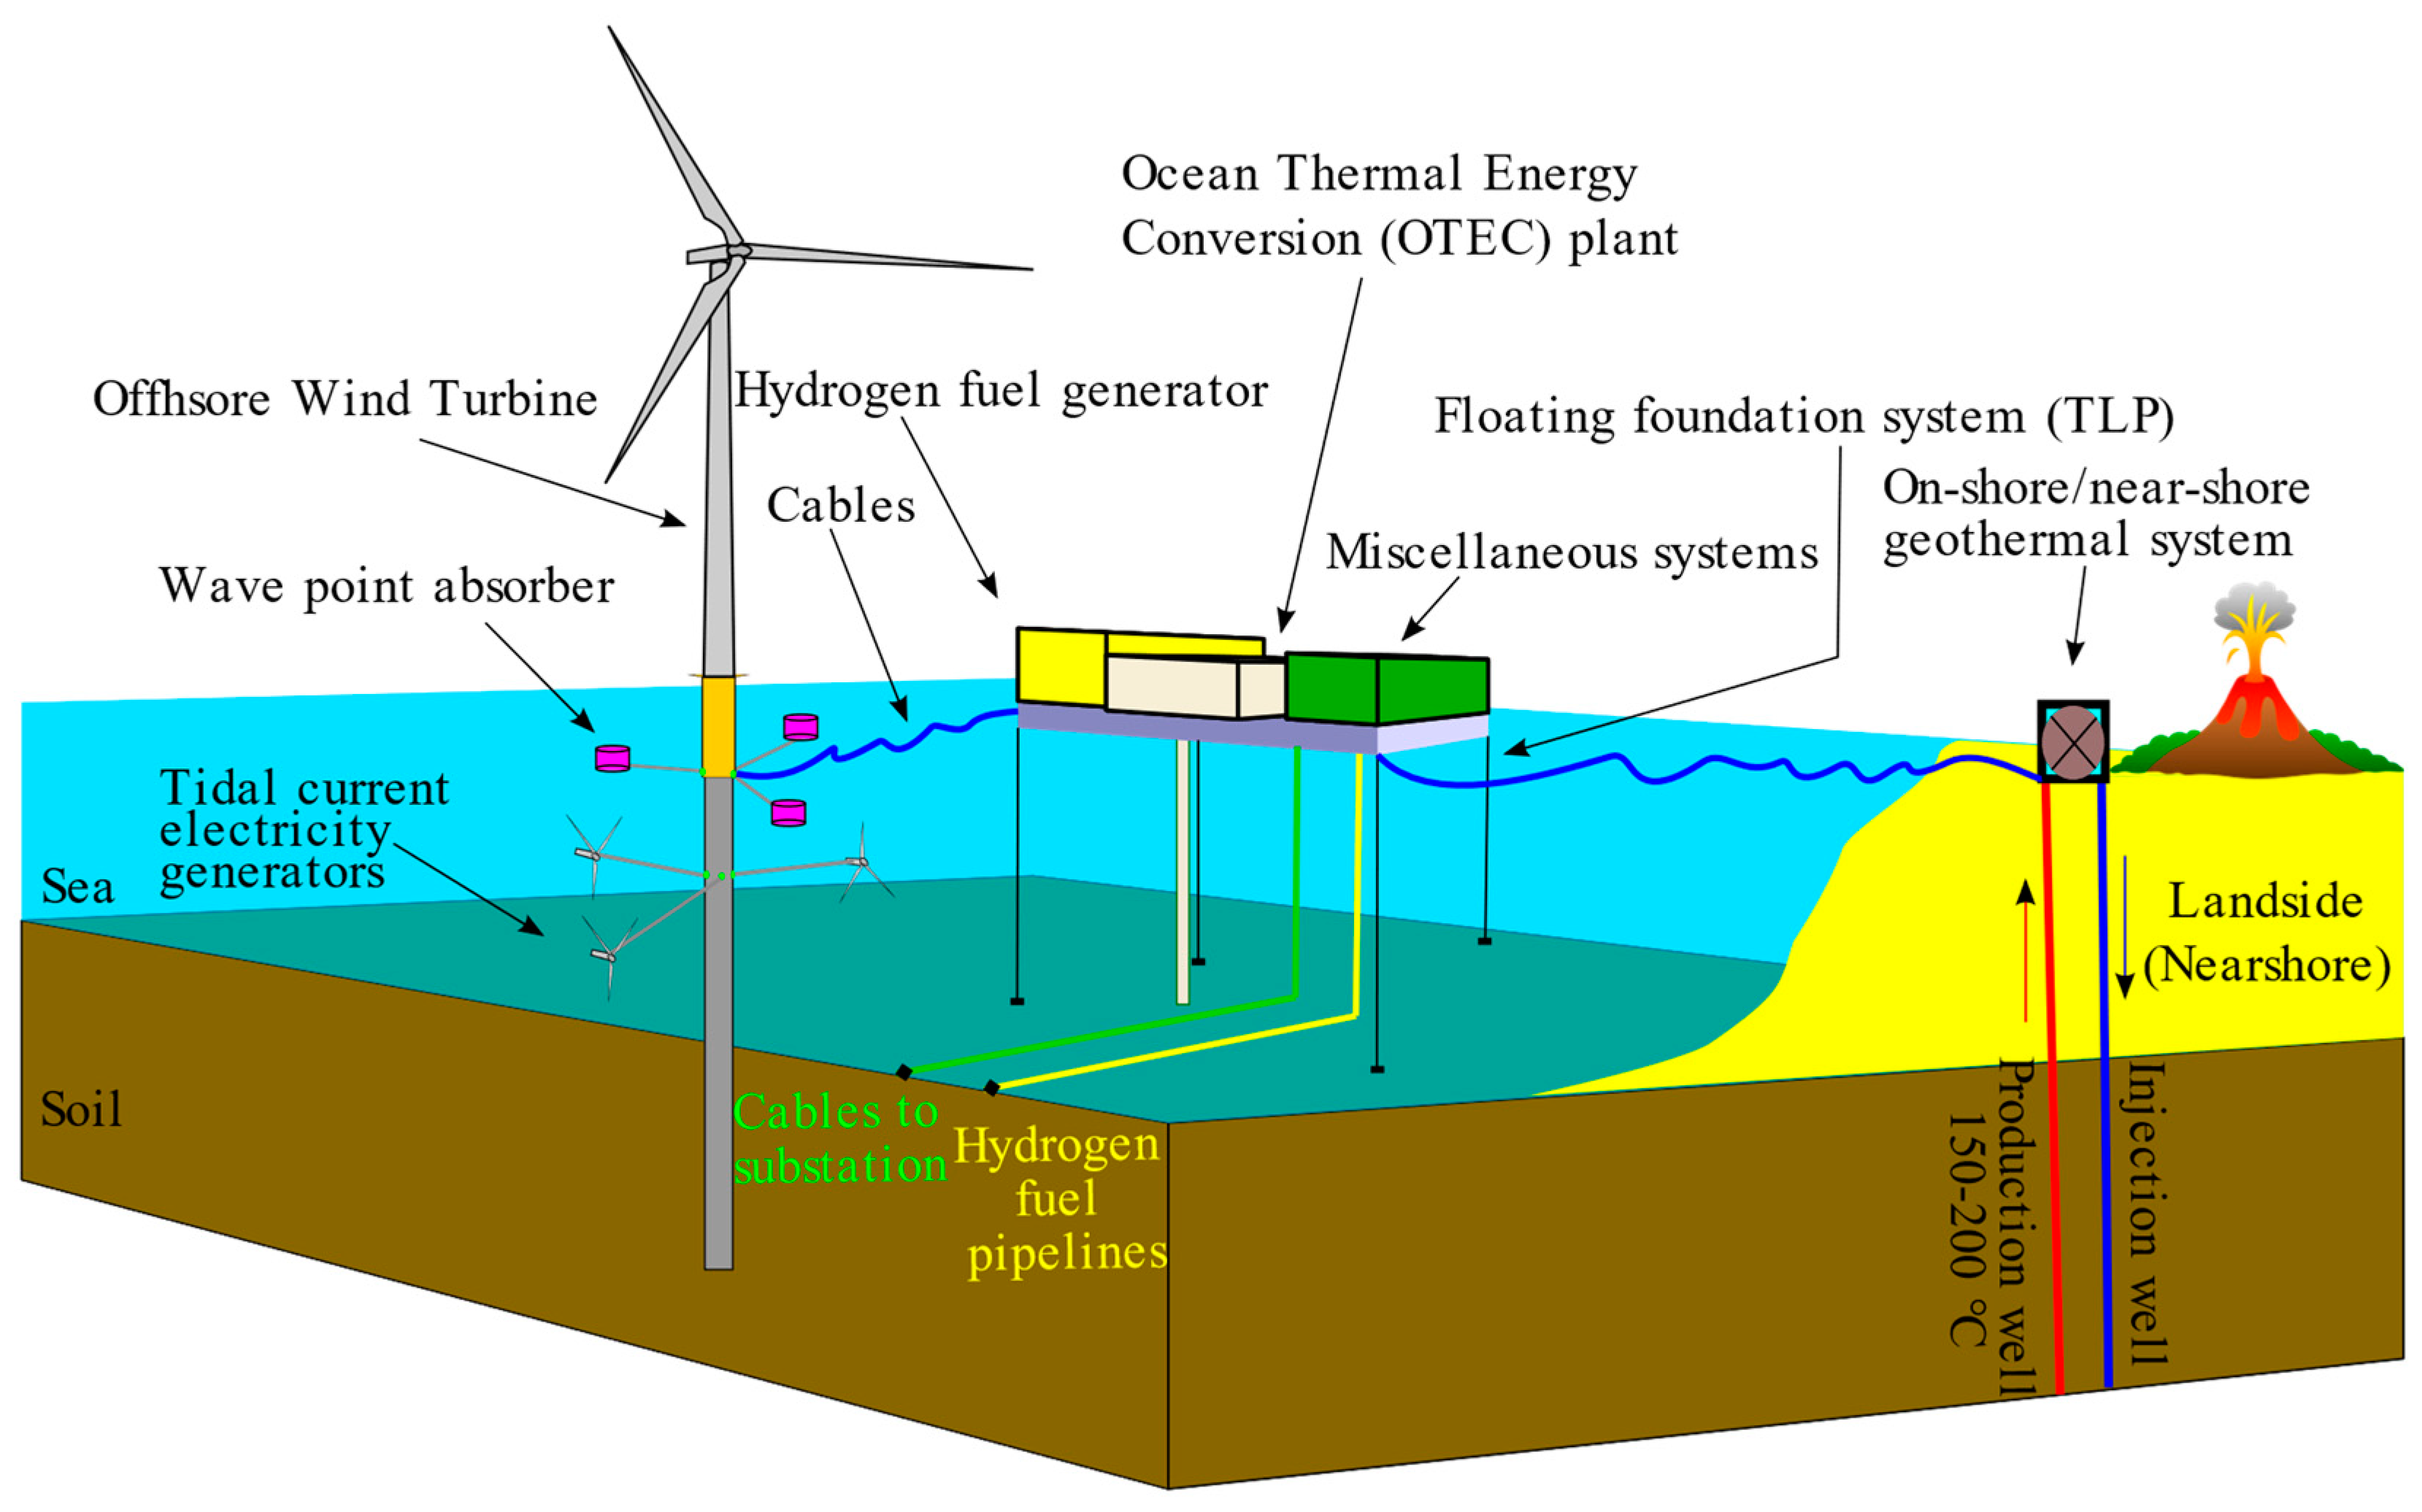
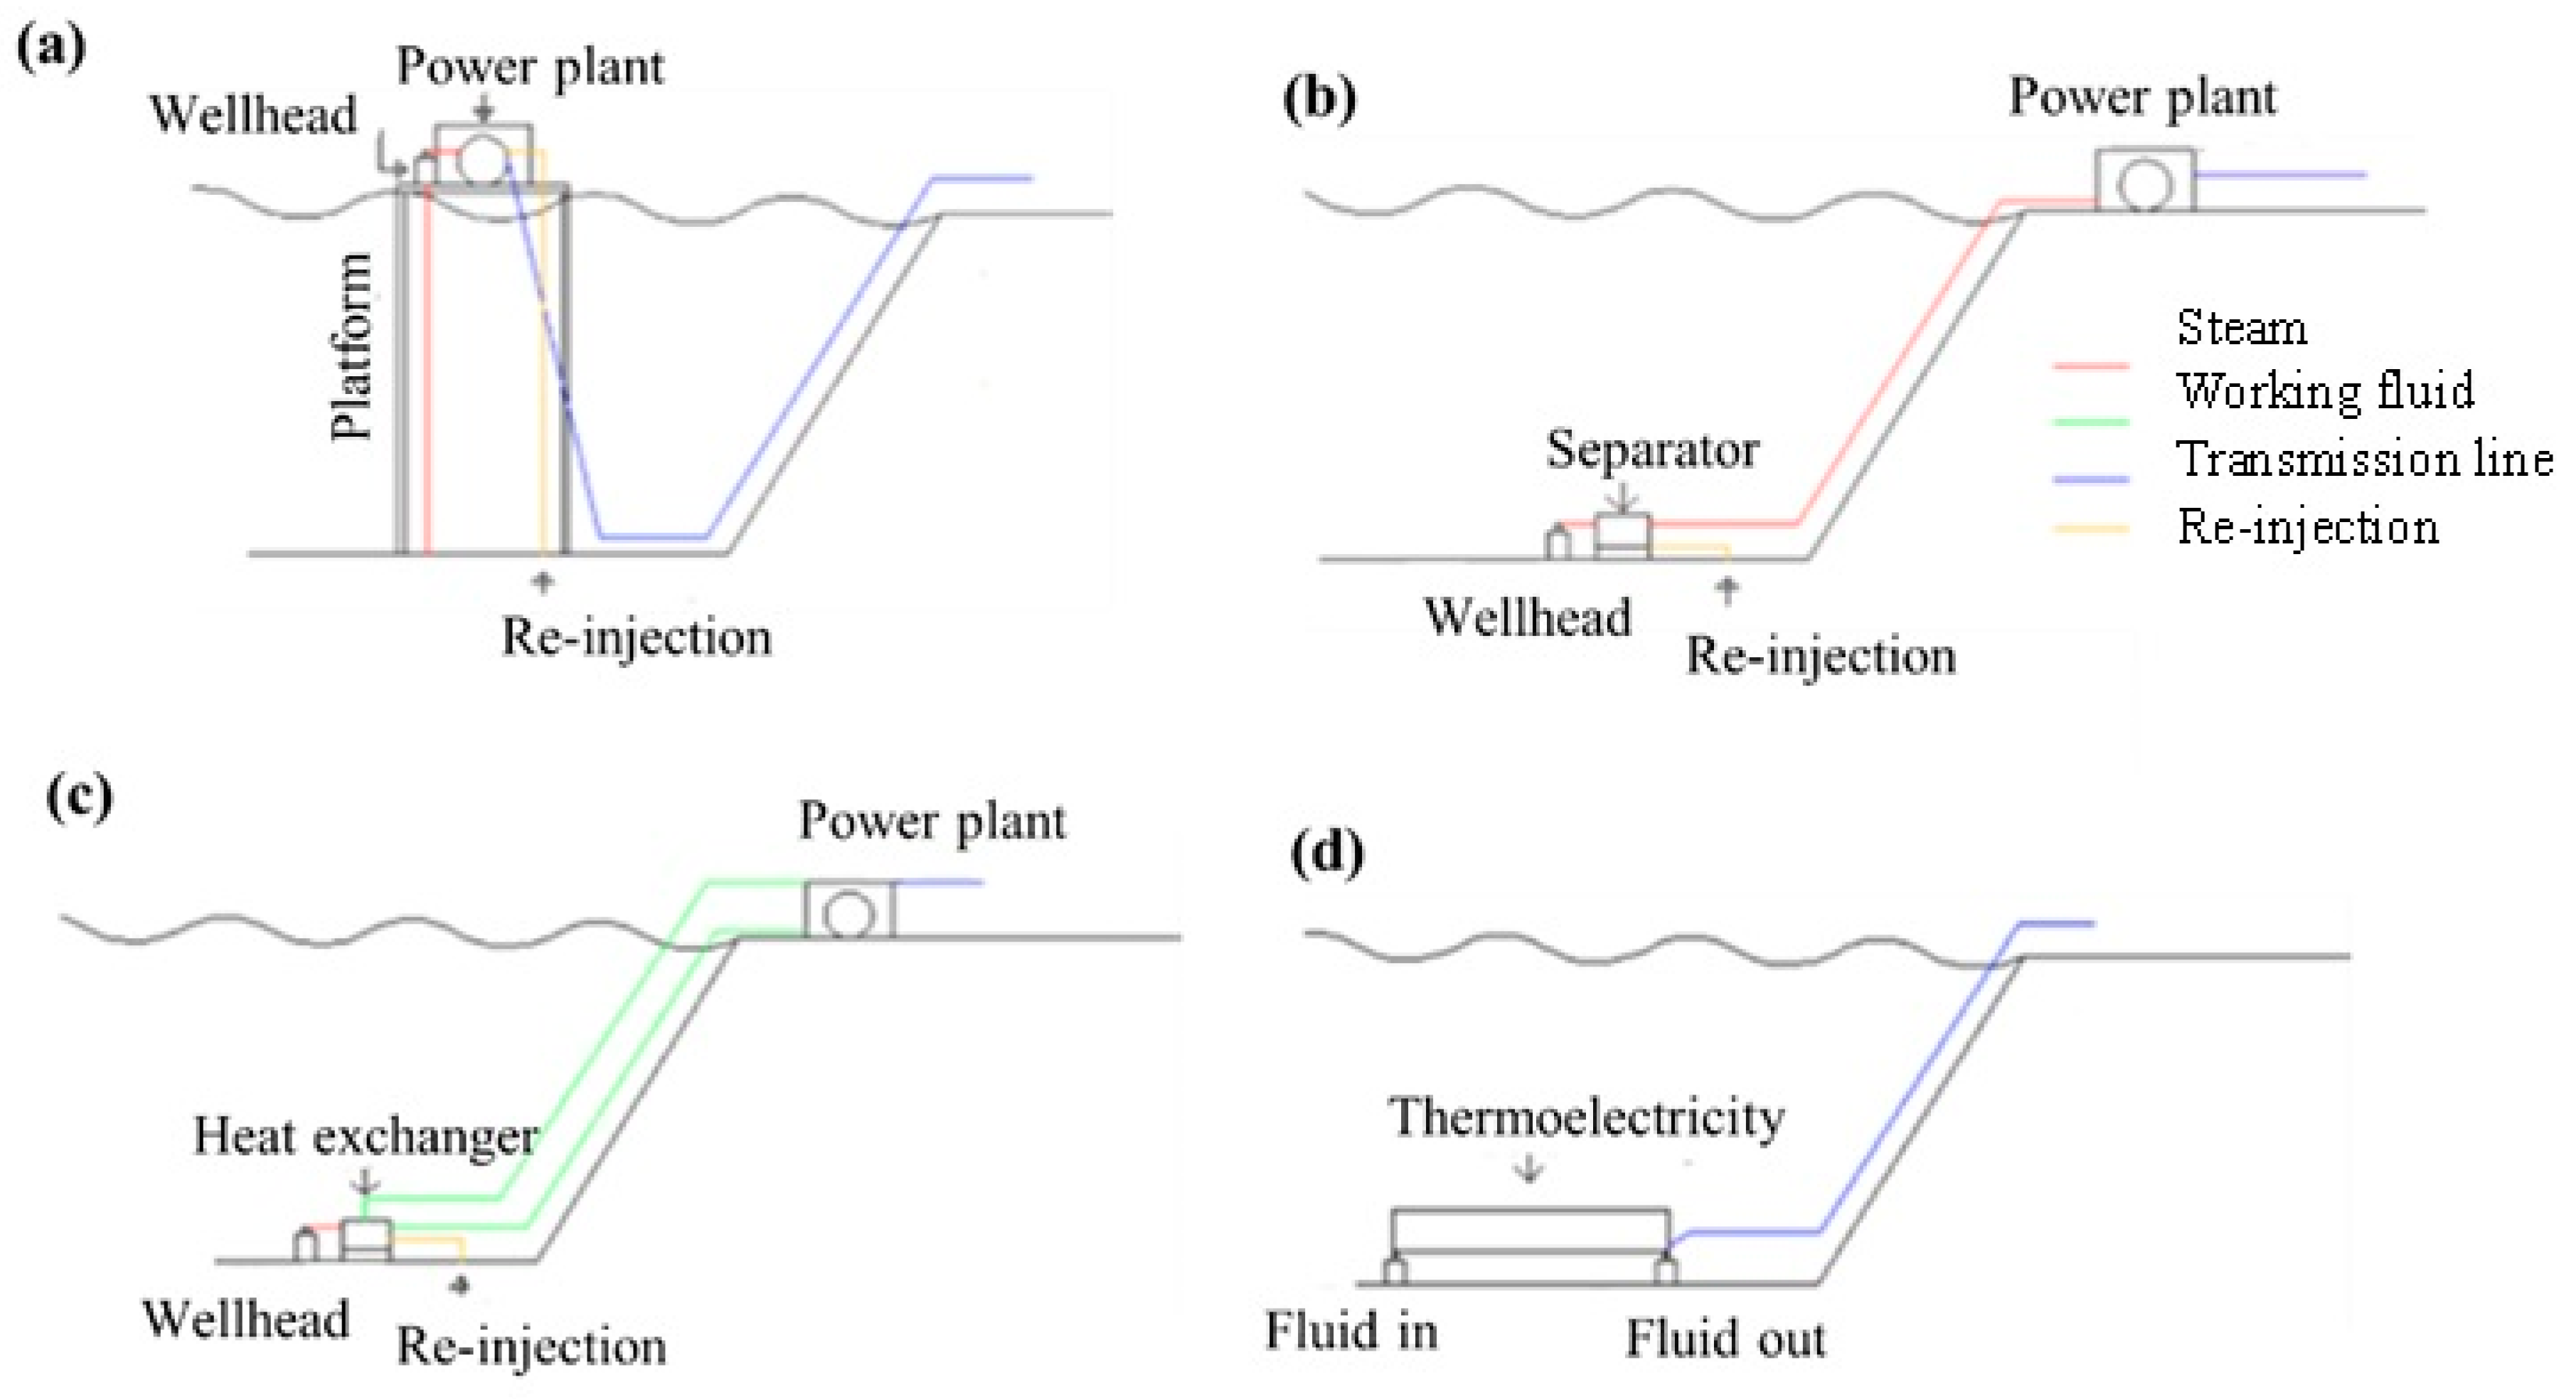
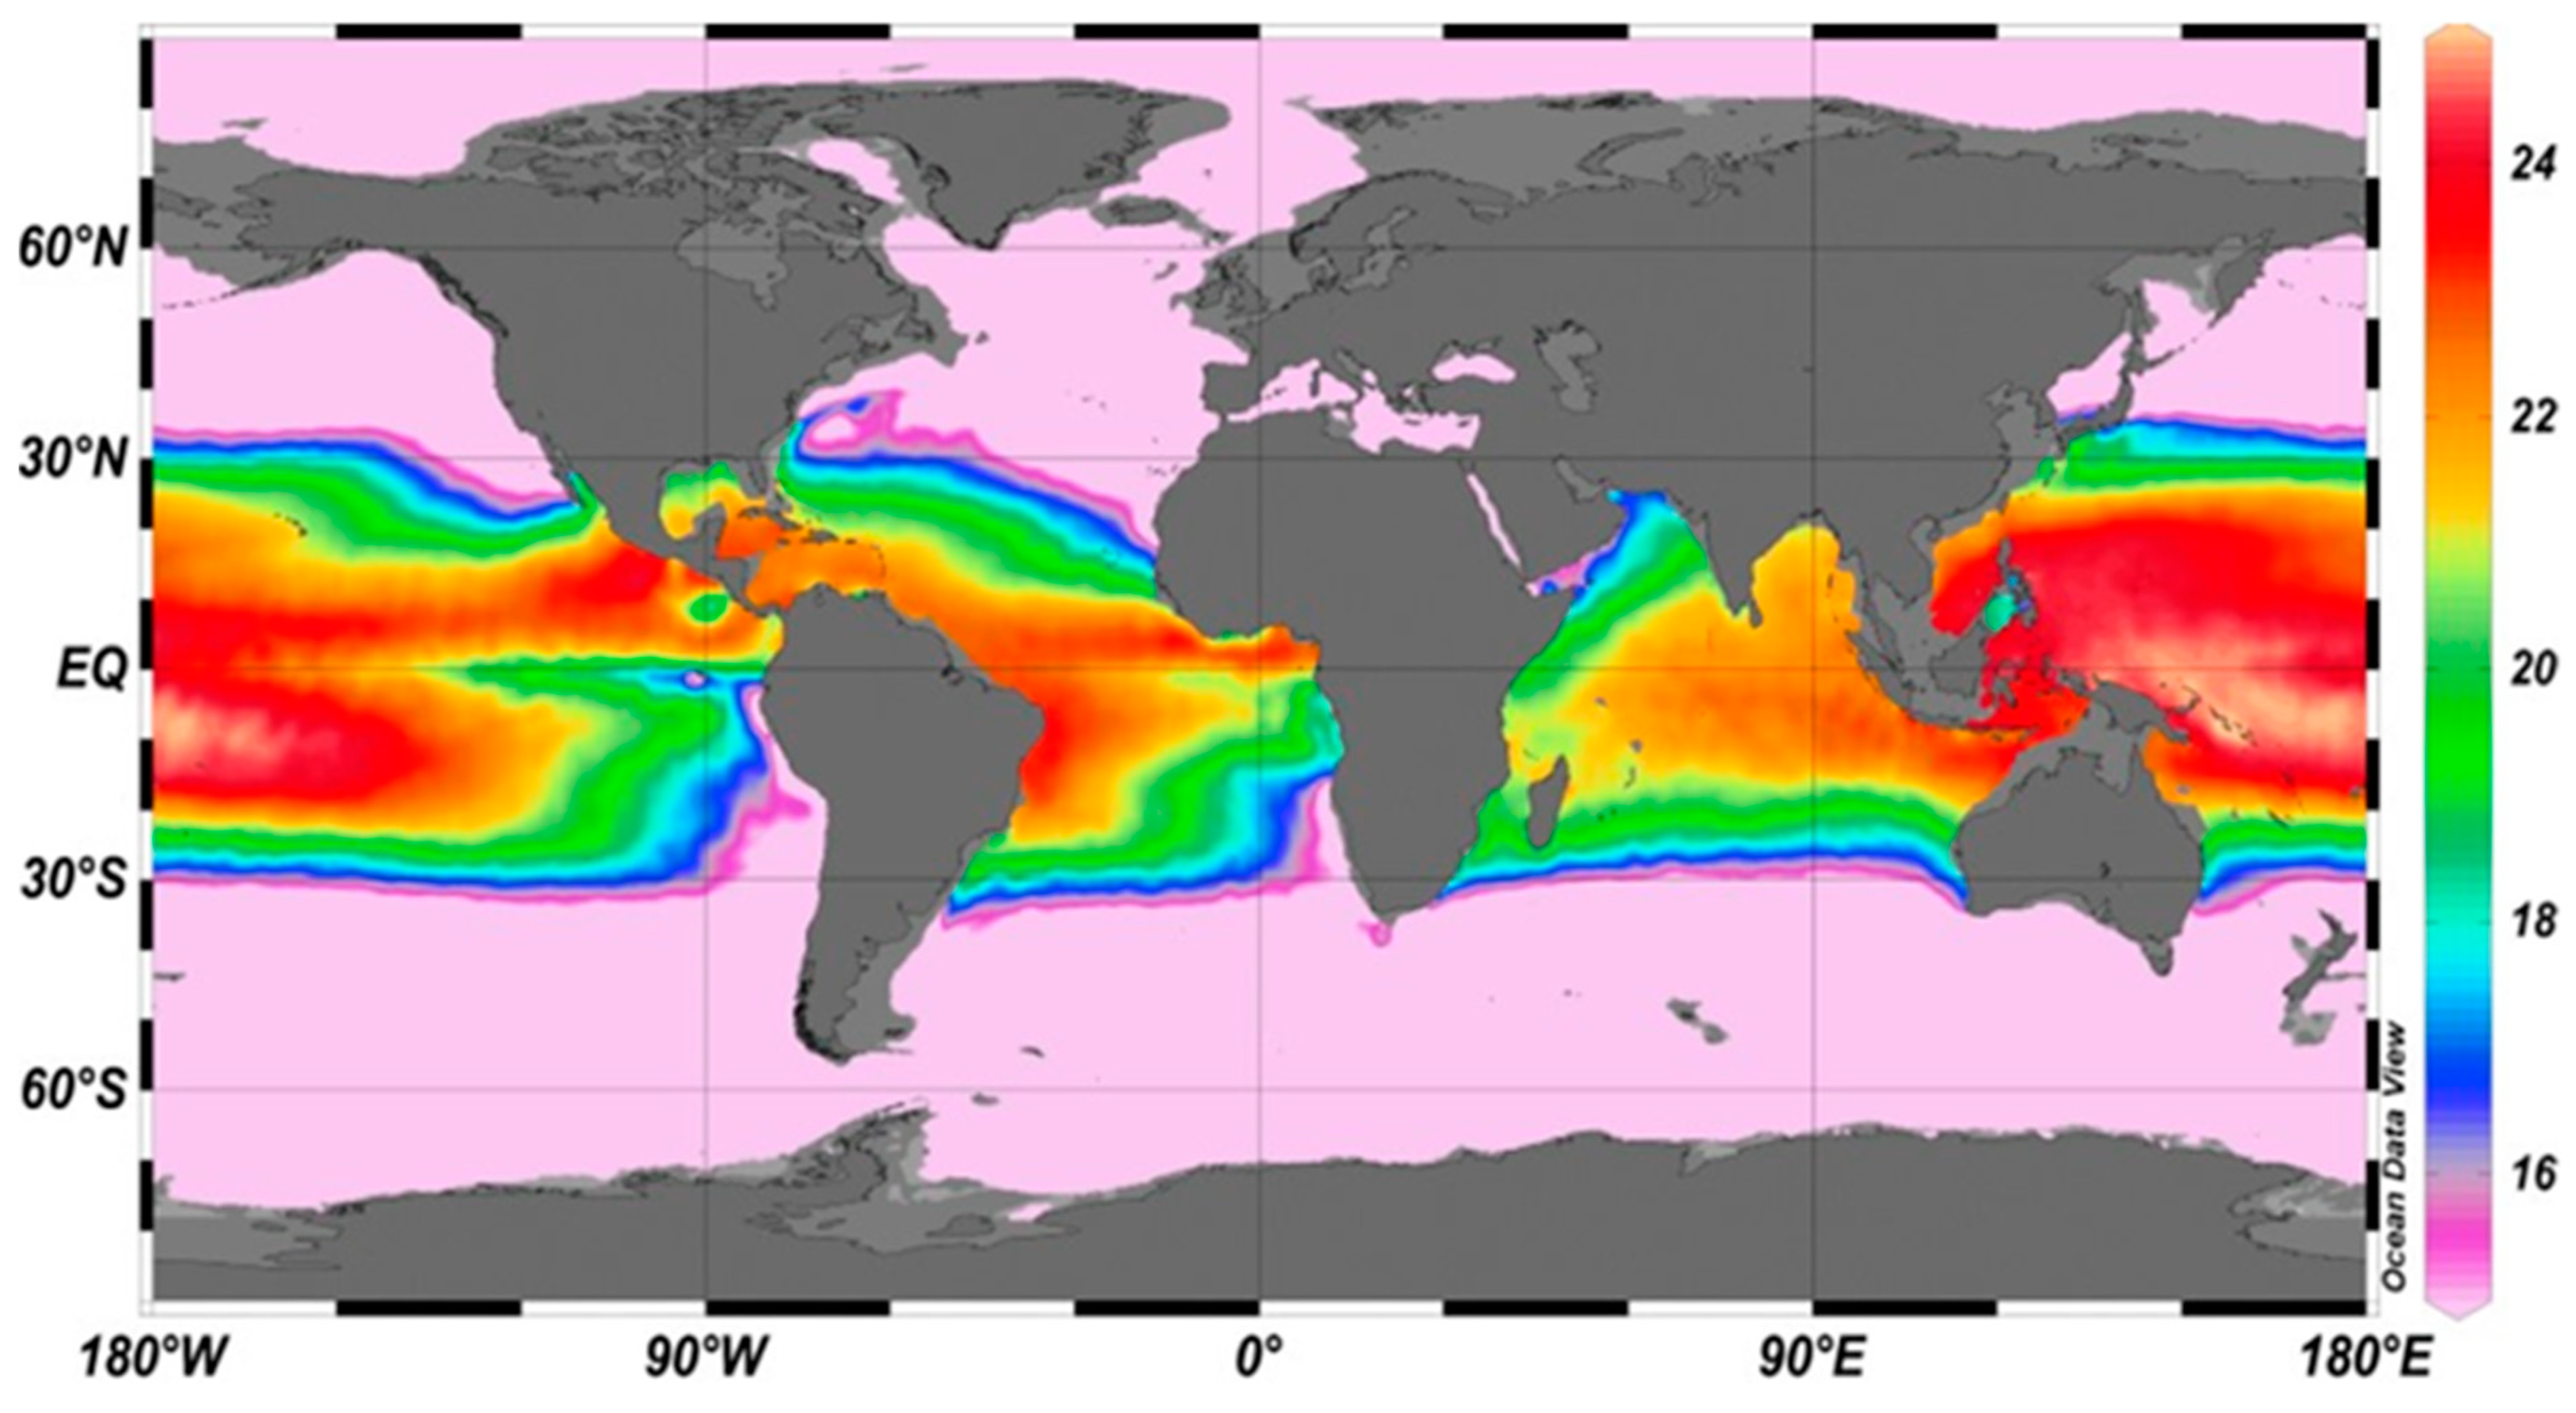
2.3. Marine Geothermal and Ocean Thermal Energy Conversion Technologies

Geothermal energy can be understood as the energy generated from the extraction of heat originating from the earth’s crust. Offshore geothermal energy is essentially similar to traditional onshore geothermal energy with the main difference being that resources are extracted from underwater. Despite the challenges associated with expensive offshore explorations and installations and the uncertainty of accurate prediction of bottom-hole temperatures in deep offshore wells [17], offshore geothermal technology offers unique opportunities. These include (1) the presence of infinite seawater, which can be utilized as a recharging fluid, and condenser for the heat exchanger system; (2) thinner oceanic crust with an average heat flow of 99 W/m2 compared to the continental crust (average of 57 W/m2), and (3) the potential use of pre-existing offshore structures from oil and gas industries [18]. Since high geothermal gradients and permeable geological formations that allow substantial flow rates are the core of conventional geothermal energy production, identifying underwater volcano locations and hydrothermal systems enables the determination of the areas with the most offshore geothermal potential [19]. Enhanced geothermal systems (EGSs) technology can be further optimized for potential in offshore energy systems, mainly toward retrofitting abandoned oil and gas wells [20]. Figure 7 illustrates several proposed conceptual options for offshore geothermal energy productions, including the following [21]:
(a)
Platform-based geothermal power plant where the geothermal fluids and re-injection fluids go through a pipeline from the seabed to the platform;
(b)
Land-based single-flash power plant and a separator located at the seabed;
(c)
Land-based binary power plant and a heat exchanger located at the seabed;
(d)
Underwater thermo-electricity power station.
Among these options, land-based power plants close to the shoreline would be more realistic considering existing technologies. Increased distance from the land-based power plant to the geothermal source may significantly increase the cost due to longer pipelines. The thermo-electricity-based power plant would be another alternative option; however, the number of thermo-electricity devices to be used, the cost, and the efficiency are important considerations in this regard [22]. The Icelandic energy company North Tech Energy (NTE) has been awarded a license to investigate high-temperature areas on the Icelandic continental shelf [23] to develop a power plant installed on a jack-up platform [24]. Other countries where offshore geothermal developments could be potentially interesting are Italy [25,26], Indonesia [19], Portugal, the Philippines, Japan, New Zealand, the United States, and countries in Central America and the Caribbean [27], considering the available offshore geothermal resources.
Ocean thermal energy can be further harnessed by ocean thermal energy conversion (OTEC) technology which utilizes the difference in temperature between the water surface and deep below the surface. Although OTEC is not a geothermal technology, both of these technologies employ natural temperature gradients between the surface and depth and operate under similar thermodynamic principles [28]. Regions where the temperature differential of 18–25 °C at 1 km are considered as favorable locations to implement OTEC technologies are shown in Figure 8. Several countries, including the United States, Japan, Korea, and India, have explored the technology, including demonstrative projects such as Mini-OTEC, OC-OTEC (USA), Nauru OTEC (Japan), and NIOT OTEC (India). A 1 MW OTEC demonstration plant has been deployed on the East Sea of Korea by the Korea Research Institute of Ships and Ocean Engineering (KRISO) [29]. There are three different configurations for OTEC and its energy storage: closed, open, and hybrid [30]. Enhanced OTEC systems with improved thermodynamic cycles, such as dual-pressure organic Rankine cycle (DPORC), have been considered [31]. The efficiency of OTEC can be further enhanced by integrating other locally available heat resources, including geothermal energy, solar energy, or incineration heat that enable the improvement of the temperature differential to 30–80 °C [32].

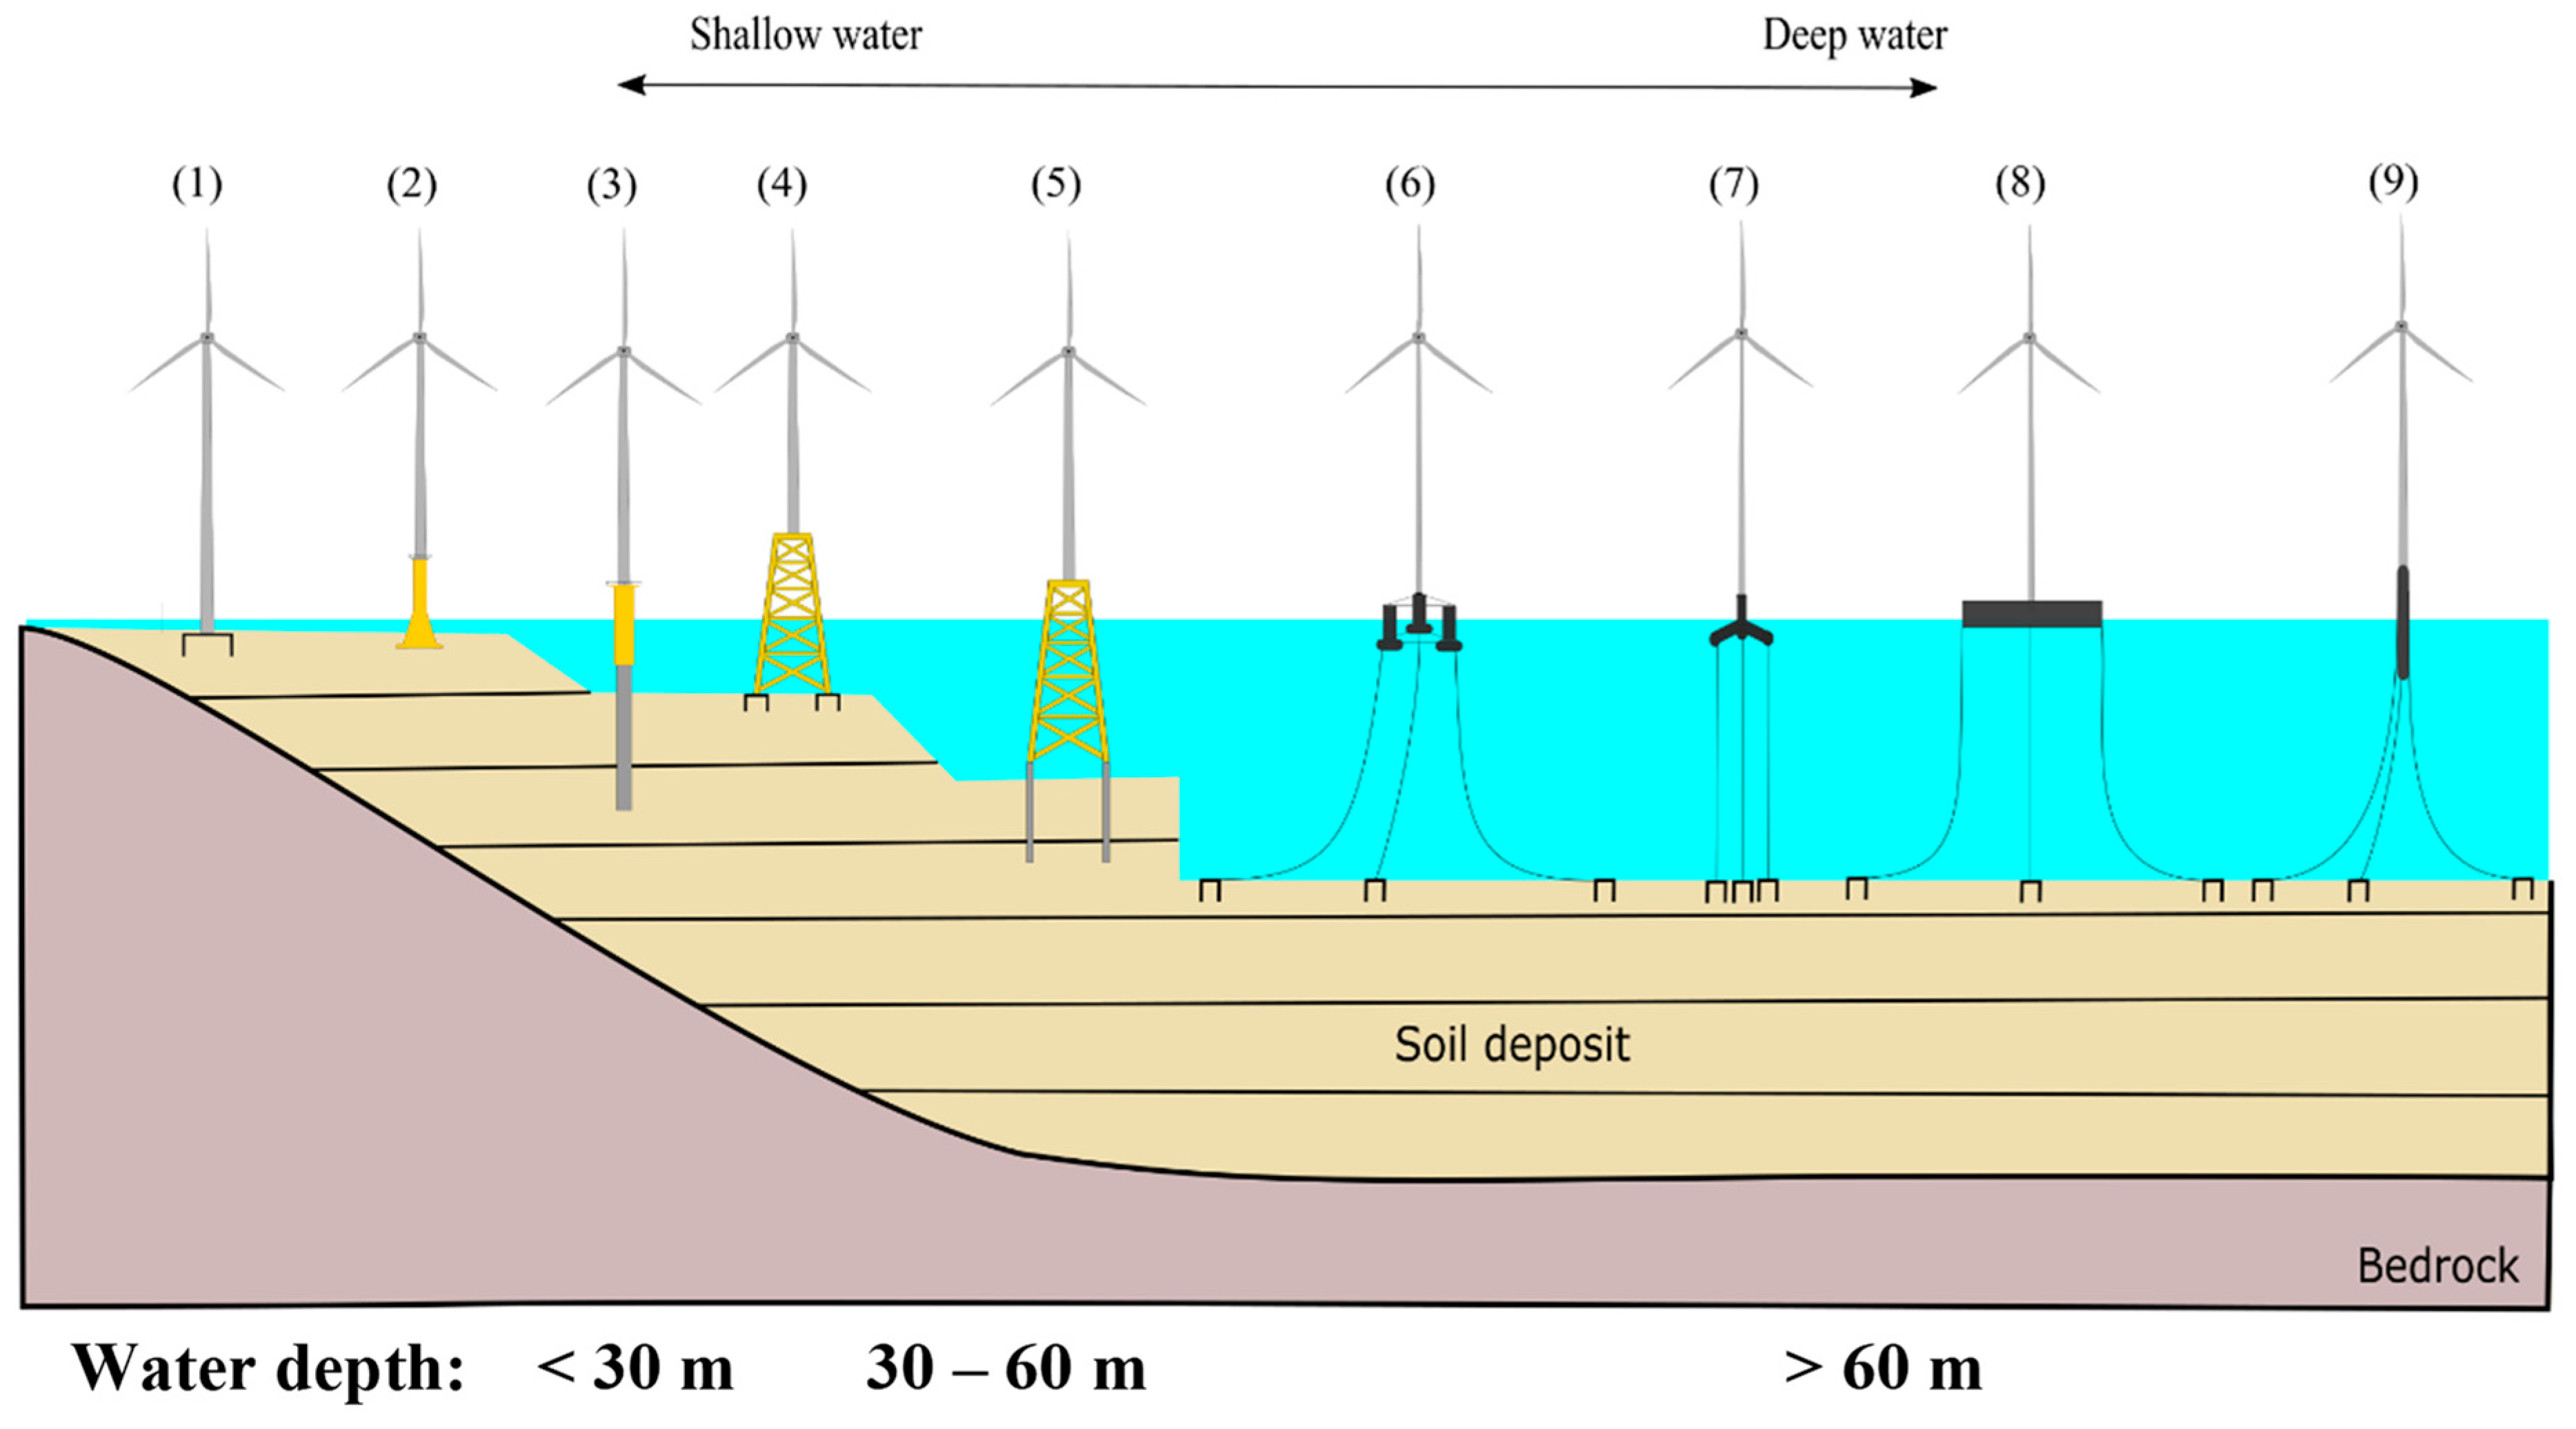
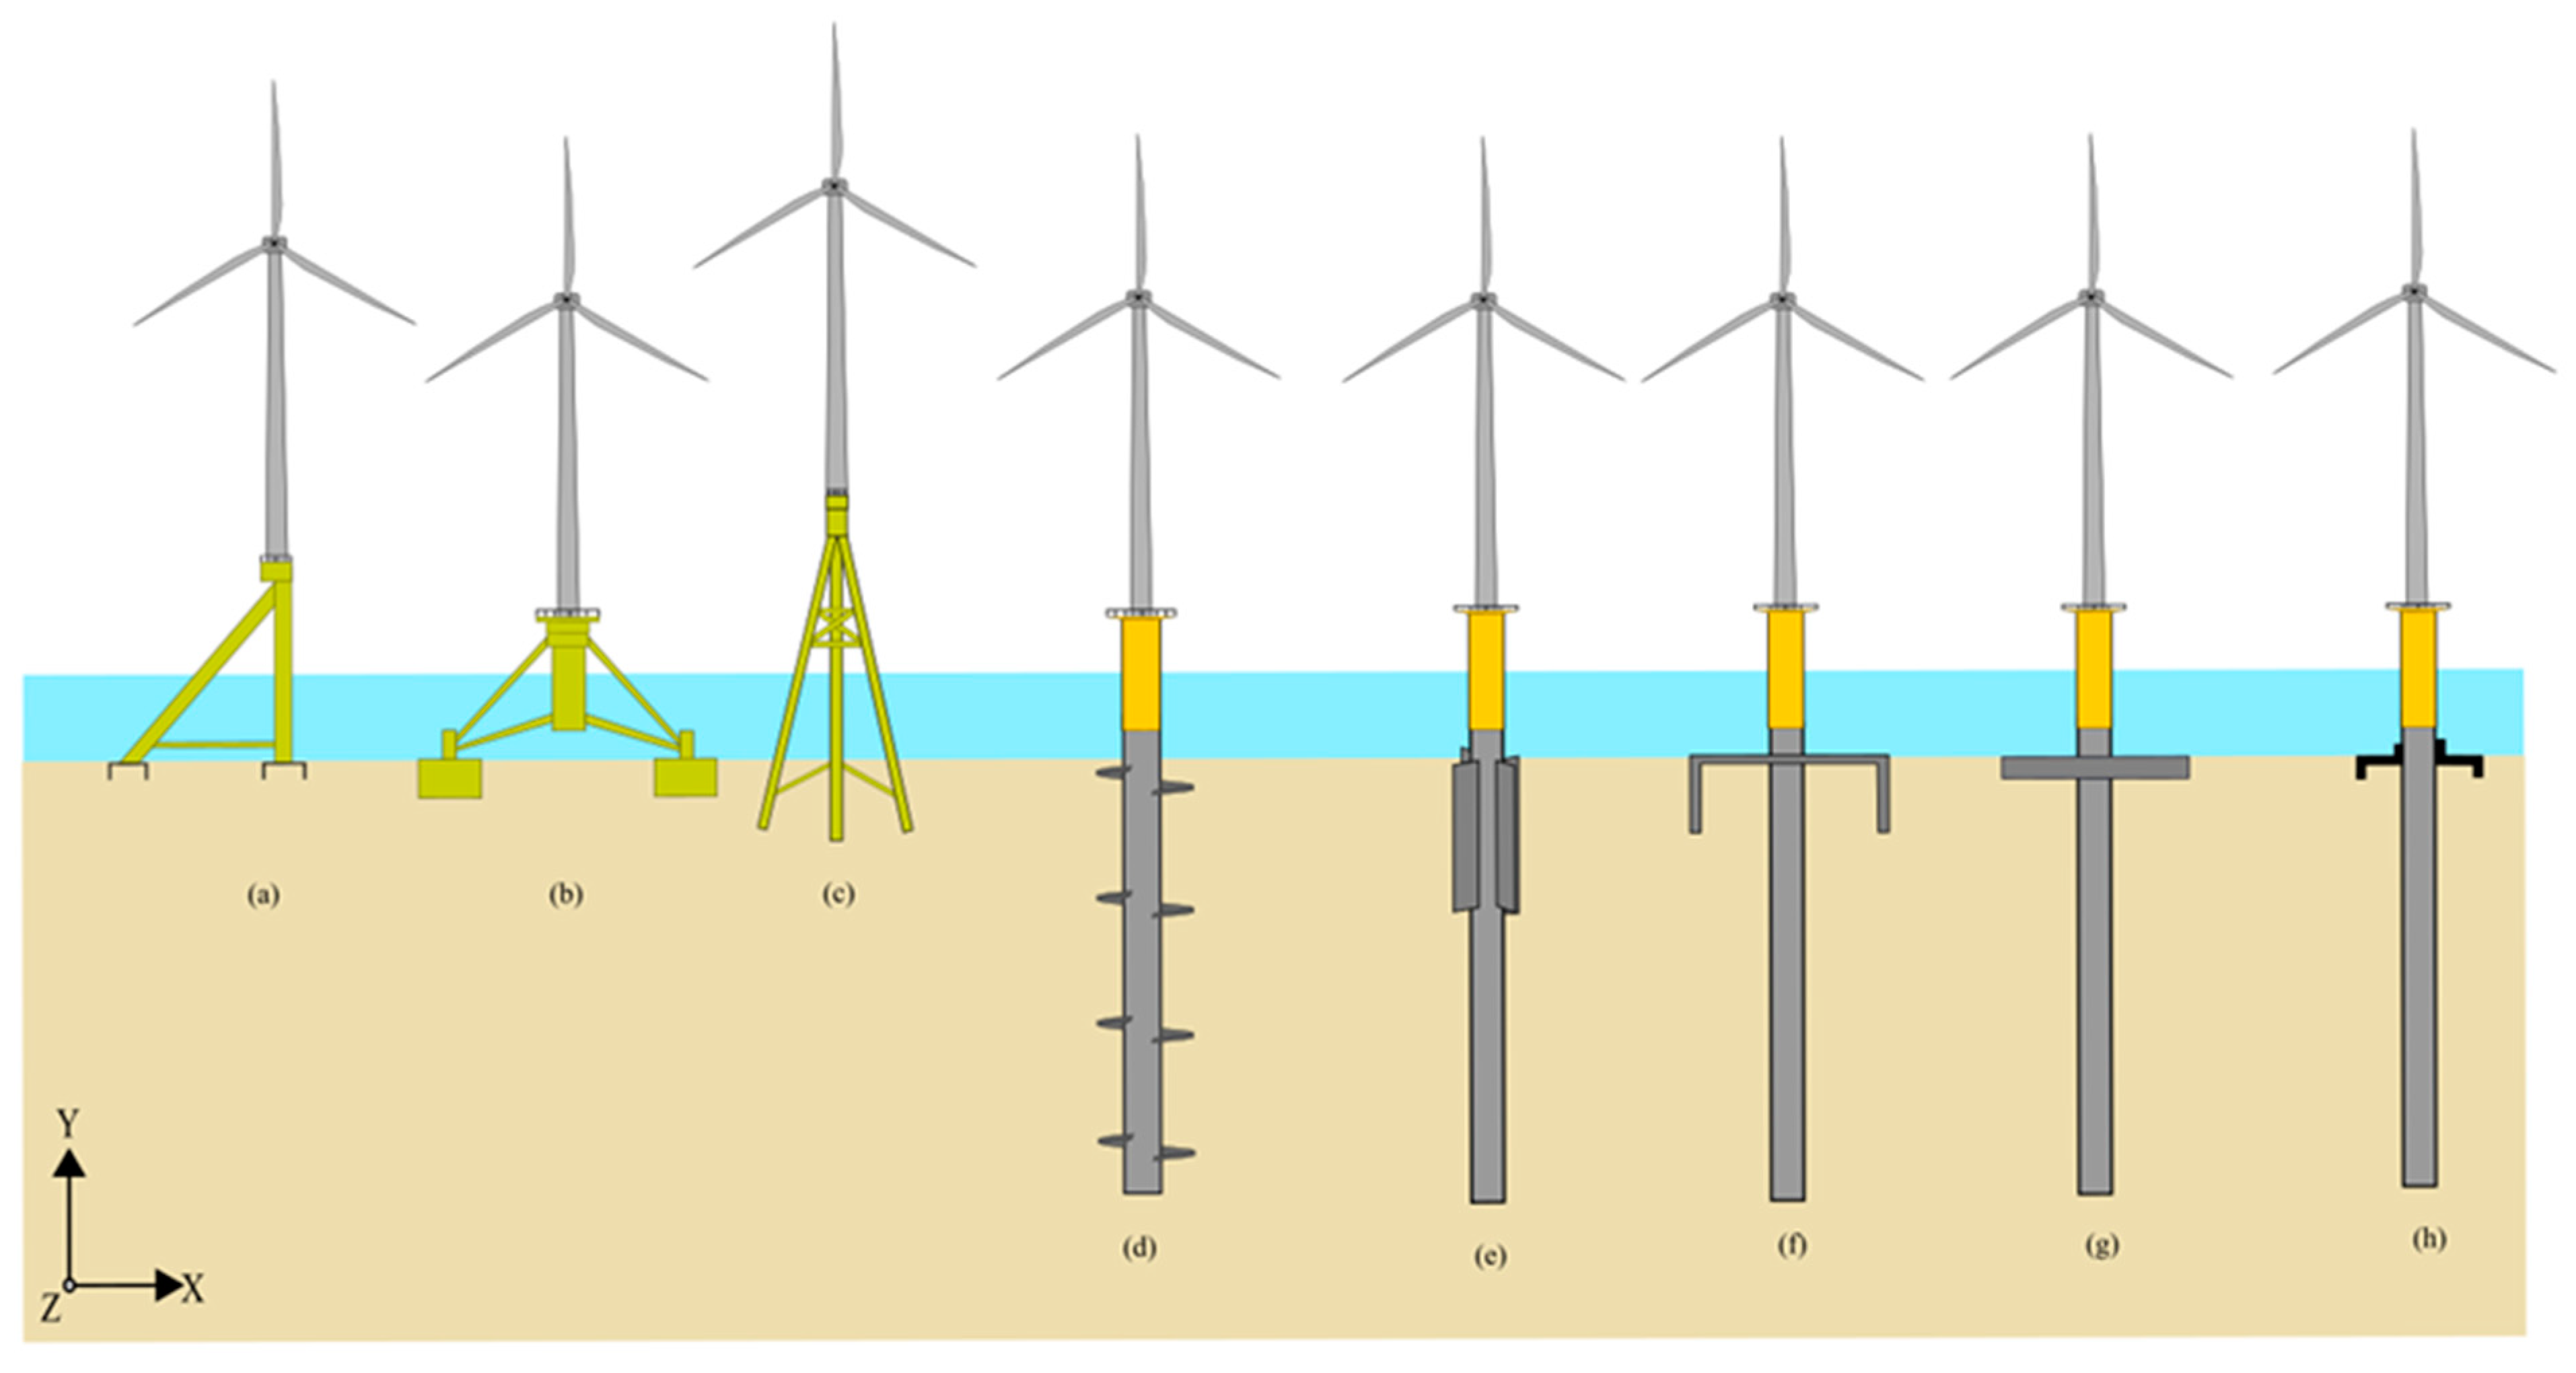
2.4. Foundation Support Systems for Energy Devices

2.4.1. Fixed-Based Foundations

With the first offshore wind turbines deployed in Ørsted in 1991, these are relatively new structures and differ considerably from the offshore infrastructure used in the offshore oil and gas industry. From a design perspective, one of the most important distinctions is that offshore wind turbines are susceptible to dynamic loads arising from wind, waves, currents, and geologic hazards, including earthquakes and marine slope failure. These structures have stringent Serviceability Limit States (SLSs) criteria compared to other structures. With increasing water depth, the foundation changes from a fixed-based (grounded) system to a floating system. Most operating turbines are supported on monopile (single large-diameter steel hollow pile) foundations due to their simplicity in manufacture and installation. Future deployment farther offshore in deeper waters may require a jacket or floating structures [33]. Figure 9 shows an inventory of foundation types for offshore wind turbines, including suction caisson, gravity-based, monopile, jacket on a suction caisson, jacket on piles, mooring line stabilized platform with suction caisson, and spar-buoy.
Foundations typically cost between 16 and 35% of an OWT project. A more cost-effective foundation design is one of the most promising research areas for reducing offshore wind LCOE. Figure 10 shows a range of innovations being conceptualized to cater to challenging ground and environmental conditions and, in some cases, to support more giant turbines in deeper water.

2.4.2. Floating Foundations

The development of an anchoring/mooring system for the OWTs or various MHK systems is a challenging task. OWTs and MHK devices are subjected to repetitive wave, current, and wind loading, including those encountered during severe storm conditions. Since loading is multiaxial and is expected to be random in direction and large in amplitude, the anchoring foundations for mooring these devices will need to sustain biaxial moments, torsions, axial loading (with tension and compression components), and lateral loadings depending on the rigidity of the lines connecting the device to the anchoring foundation element. The MHK devices are either mounted on a fixed foundation system, for example, in tidal turbines, or free-floating and flexibly anchored to buoys or directly to the seabed using one or more mooring lines as in the case of a floating-point absorber wave device.
While a significant level of knowledge exists within the realm of oil and gas offshore platforms regarding the foundation system, the design of MHK devices, whether floating or bottom-fixed, are “lightweight” structures and are generally located in high-energy environments where water depth ranges from 30 to 250 m. The shallower depth values are compatible with tidal and wave devices, and the deeper values are compatible with ocean current devices.
Foundation systems, including monopolies, micropiles, suction caissons, tripod/tetrapods with short caissons, plate anchors, and suction-embedded plate anchors, provide adequate support for the loading and excitation frequencies imposed on bottom-fixed and floating MHK devices. The use of a given system is a function of the loading conditions, the subsurface soil properties, and the site’s geologic conditions and potential hazards.
For example, Figure 11 schematically shows a mooring and anchoring system for an ocean current turbine embedded 50 m below the mean sea level in water depth at 200 m. In this case, buoyancy mooring lines transfer the pull-out force from the buoyancy tank and the turbines to the micropiles’ anchoring system. The plate anchor transfers the thrust force created by the turbine through the thrust mooring line, which is configured with a 4:1 scope.
The design loading cases and recurrence periods for wind, wave, and current have been defined in the literature and in the three common standards API-RP-2GEO [35], IEC 61400-3-1 [36], and DNVGL-RP-C212 [37]. In these standards, the response of the foundation system is compared to the ultimate, serviceability, accidental, and limit states, with fatigue life being characterized in terms of system natural frequency and damping within the context of the loading frequencies.
In summary, the proposed hybrid platform fitted with multiple energy harvest devices can be supported with a shared foundation that is either fix-based or floating; thus, the manufacturing and installation costs can be reduced.

2.5. Transmission Infrastructures

Offshore wind farms are located quite far away from where people live. Transmission infrastructures are required to deliver wind energy to major population centers. Offshore wind grid connection typically consists of two parts: (1) offshore wind turbines are connected via 33 or 66 kV inter-array cables to an offshore AC substation, (2) the AC offshore substation is connected via a 132–220 kV HVAC/HVDC export cable with an onshore substation, from where electricity to be connected to the mainland grid and distribution network [11]. Based on the 2020 Cost of Wind Energy Review [38], the electrical infrastructure shares 10–18% of the CAPEX for a typical fixed-based offshore wind farm. As described in the Sandia Report [39], the electricity transmission infrastructure shares 20–30% of the installation costs for an array of 100 tidal current turbines, while it shares about 15% of the installation costs for an array of 100 wave point absorbers. Therefore, sharing the transmission infrastructure between different energy devices can reduce the costs greatly.

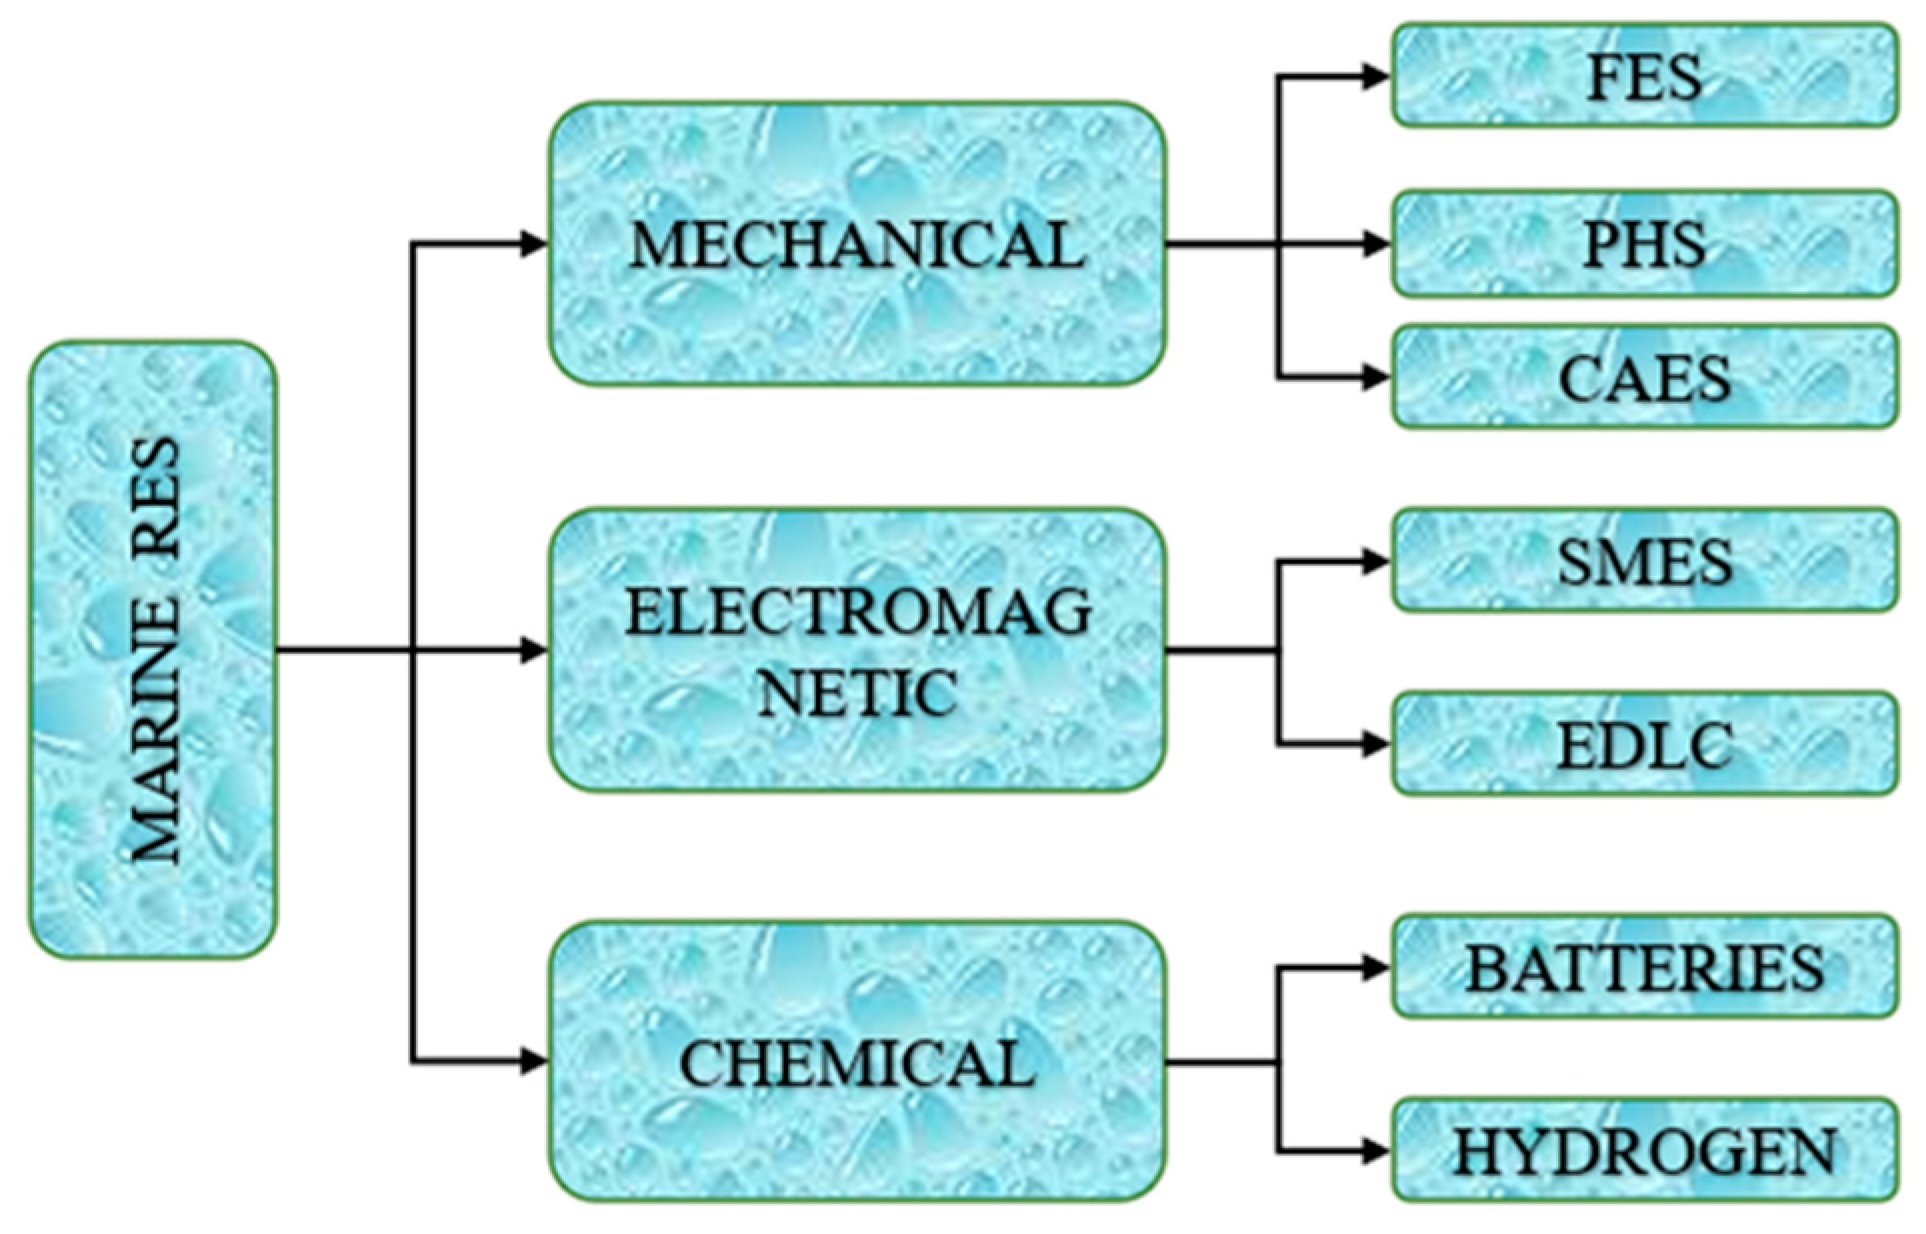
2.6. Green Energy Storage Technique

Most renewable energy production fluctuates due to the nature of wind, wave and current. The peak times of energy production normally do not align with the peak times of energy demand. A steady energy source—mainly from fossil or nuclear sources—is used as a hybrid grid. Integrating excess electricity generated from offshore renewable resources to the grid can be a risk of security of supply. Electrical energy storage is an effective solution with many present technologies that could match the supply–demand balance and provide the stored energy as fast as possible when there is an instant or long-term high load requirement from the grid as well as for grid stability and quality. It is also critical to include energy storage in the grid to increase the rate of dramatically fluctuating renewables penetration from 10 to 50% by providing grid stability [40]. Energy storage can be classified into five main sub-sections: mechanical (kinetic and potential), electromagnetic (capacitors and supercapacitors), electrochemical (batteries, hydrogen), biological and thermal. Here, heat requiring storage technologies is excluded, since heat cannot be provided by the aforementioned marine power technologies [41]. Figure 12 demonstrates types of electrical energy storage with various technologies.
Green hydrogen production methods generally split water via an electrochemical, a thermochemical, or a hybrid electro-thermochemical technique by either electricity or medium to high-temperature thermal energy from a renewable source. Some methods for hydrogen production, storage, and utilization are summarized in Figure 13. Proton exchange membrane (PEM) and alkaline electrolysis (AE) are mature and commercialized processes operating at ambient or above ambient temperatures and require electrical energy to produce hydrogen from water at above 4.5 kWh/Nm3 H2 production [42]. Anion exchange membrane (AEM) electrolyzers are considered better-performing alternatives to other methods to reduce electrolyzer costs by phasing out noble electrocatalysts and other issues related to AE and PEM electrolyzers [43].
Thermochemical hydrogen production via water splitting is an alternative to pure water electrolysis to replace intensive electricity consumption with thermal energy, which is four times less costly. The pure thermolysis of water requires exceptionally high temperatures. Various multi-step-reaction cycles are proposed to decrease the high-temperature requirement [44]. Over 70 thermochemical cycles have been proposed since the beginning of the 1970s, and most of them have been abandoned due to material handling, efficiency, and complexity issues. A novel hybrid cycle has been proposed to modify the thermochemical Zn/ZnO redox cycle for hydrogen production [45]. The thermochemical Zn/ZnO cycle requires over 2000 °C for the reduction reaction, while the new hybrid redox cycle overcomes this problem with the electrolysis of ZnO by forming a zincate solution in alkali media to produce pure zinc and hydrogen. Electrolysis of the zincate requires higher electricity consumption than pure water electrolysis; however, the oxidation of zinc below 300 °C results in further hydrogen production in the exothermic thermochemical step. Produced hydrogen via the above technologies should be stored for later use via fuel cells or for other purposes. Hydrogen compression (C-H2) is commercial at small scales under commercial use in fuel cell electric vehicle (FCEV) cars such as Toyota Mirai and Honda Clarity [46]. Hydrogen is stored at up to 700 bars in composite tanks, and hydrogen compression requires energy corresponding to 4.1 wt. % of hydrogen, while the storage efficiency can go above 85% [47].
The production, storage, and utilization of hydrogen are more complex and less efficient than conventional electrical energy technologies such as pumped storage hydropower (PHS) and compressed air energy storage (CAES). Recent technology offers a 100 MW rated capacity, which can be increased in shorter terms to compete with CAES technology. Even though H2 storage is less efficient and costly compared to many other methods, its diverse end use is critical not only for grid energy management but also for transportation and residential heating replacement. A representation of the hydrogen route for renewable energy storage is provided in Figure 14.
A normalized comparison of selected energy storage methods is visualized in Figure 15. PHS has the highest life expectancy, while it is one of the lowest energy-dense options, while hydrogen storage is the least efficient and one of the highest energy-density methods independent from site selection as in batteries. Based on the renewable energy grid’s scale, an electric double layer capacitor (EDLC) or superconducting magnetic energy storage (SMES) is inevitable for grid stability, while the fast-responding battery and hydrogen storage can be used for overnight energization of the grid. Most technologies for electricity storage are mature and commercially available, while a selection of the technology should be made based on the grid’s requirements and the RES’s scale. Given the availability of renewable electric sources, a hybrid electro-thermochemical cycle could be the most suitable option to run on an offshore hybrid platform for green hydrogen production and storage. With the on-board hydrogen production facility, the excess electricity generated can be utilized to split water and generate hydrogen, reducing the risks of grid surge and security issues. The produced hydrogen can be stored in compressed tanks and transported onshore regularly.

3. Site Selection Considerations Using Scoring Matrix System for Hybrid Energy Systems

As a first step, feasibility verification of the hybrid energy system requires assessing the capacities of various renewable marine energy resources and identifying the optimum location. The ideal working conditions for various energy harvest systems are relatively different. Developing a decision-making scoring matrix system is desirable to determine if a specific site is suitable for hybrid offshore energy systems design. Once the site and suitable energy devices are determined, it is essential to design a robust platform with stable structure and suitable foundation. The scoring matrix designed in this study has two objectives: determine a suitable foundation and choose feasible energy harvest devices.
To develop the matrix, factors and parameters governing the performance of each energy harvest system will be first discussed, and resources to attain these data will be provided. Then, a scoring system will be established by converting the importance and contribution of each parameter to energy production and energy farm construction, operation and maintenance as analyzed in previous studies into the weighted score for each parameter. The threshold for triggering a suitable site for a hybrid energy system will be determined. An Excel-based tool kit is developed to synthesize these scores for decision making.
The scoring matrix, built in the Excels tool kit, includes the following forms of marine energy infrastructure:
  • Offshore wind turbine;
  • Wave energy converter;
  • Tidal current converter;
  • Geothermal energy;
  • Ocean thermal energy conversion;
  • Hydrogen generation.
While the possibility of considering solar energy was also assessed at the initial stage of this study, it was not further pursued due to the current limitations of installing and cleaning PV panels in a salty water environment [50]. A similar design criterion was proposed by Zanuttigh et al. [51] for wind, wave and tidal. In their design of multi-criteria for a hybrid platform, four steps are followed: assessment of energy resources, design of a platform for the primary energy device, identification of suitable additional devices, and production of the layout of the hybrid platform. They did not perform any structural analysis. A similar approach was proposed here by choosing offshore wind as the primary energy source, developing a scoring matrix to determine the suitability of other components. More energy resources and also energy storage devices are considered in the current study. In addition, more effort was placed on the structural integrity analysis in the current study.

3.1. Data Definition

This section outlines guidance on obtaining the necessary site data. The data obtained could be later used for decision making.
Wind Speed: An adequate wind speed is one of the vital elements for wind farm site selection. The minimum recommended wind speed must be above 6 m/s at the hub height to produce sufficient electricity for maintaining a financially viable wind energy project [33]. The wind data are collected and studied during the site investigation [52]. The Global Wind Atlas database could provide general information about wind data [12]. Alternatively, countries across the globe maintain databases of average annual wind speed data, such as the UK Atlas [53]. The wind speed at an offshore location increases with increasing distance to the shore. This is because the wind traveling over the surface of the seawater experiences less resistance than on land where there are trees, buildings, and hills. There is a more reliable and less turbulent wind flow further out at sea, which is one of the benefits of offshore wind energy compared to on-shore wind.
Water depth: Water depth is one of the defining parameters in choosing the foundation types in offshore structures design. The water depth data are collectible from the Global Wind Atlas [12] or each country’s bathymetry data, such as the UK Atlas [53]. Bottom-fixed foundations are typically deployed in water depths up to 60 m. For depths up to 30 m, monopiles are preferred. Typical foundation systems between 30 and 60 m include monopiles, suction caissons, and jacket structures [33]. After exceeding 60 m, water-depth floating systems are recommended.
Wave height: The wave height and period must be considered, as this governs the dynamic wave loading on the foundations. The cyclic loading of waves can cause the structure to resonate if the driving frequency is similar to the structural natural frequency. This means the structure will oscillate with larger amplitudes and accelerate the structure fatigue, giving the turbine a shorter lifespan. As a result, a location with smaller wave amplitudes and a frequency outside the structure’s natural frequency is preferred. On the other hand, wave height is crucial and favorable for wave energy harvest devices. The recommended operational wave height is (0.75 m, 6 m) [16]. Its dual effects need to be balanced in decision making. The worst location for OWT foundations in terms of wave height and loading could be the northwest of Scotland with a mean wave height of 3.5 m. However, there are enormous wave energy resources at this location. The wind and wave maps show that the best location for wind speeds also coincides with the most significant wave heights.
Radar communications: The National Air Traffic Services (NATS) has a division that provides civilian en route air traffic control called NATS En-Route PLC (NERL) using secondary surveillance radar (SSR). SSR is a communication method for air traffic controllers to contact aircraft in busy spaces. Turbine blades interfere with SSR if they are within 10 km of the radar head. A wind farm must avoid interfering with NERL’s electronic infrastructure. Otherwise, NERL will object to the project.
Buried services: Buried services must be identified, so the foundation does not damage existing subsea cables and pipelines. A cable or pipe in a wind farm site would not prevent the construction of a wind farm because each wind turbine location can be adjusted to avoid an interception with the cables and pipes. Array cable trenching must avoid cutting existing cables or pipes. Care must be taken to avoid applying a load or rotation on the cable by soil differential settlement. In the future, retired natural gas pipelines could be repurposed to transport hydrogen gas generated by hydrolysis using offshore electrical energy produced by wind farms, eliminating the need for expensive export cables to transfer the electrical energy to the shore.
Distance to ports: Port locations are needed to factor in the vessel transportation costs from the port to the wind farm site. Considering that a jack-up vessel costs over £80,000 a day, money can be saved during construction, maintenance, and decommissioning by reducing the transportation time from the port to the site [54]. A closer distance to the ports would also benefit the developers, since it would lower the construction costs.
Shipping routes: Shipping routes need to be considered for three reasons: the wind farm location should not obstruct significant shipping routes and port entrances, as this will interrupt shipping activities; areas with a higher degree of boat activity have an increased risk of a boat collision with a turbine tower and should be avoided; shipping anchors can damage buried export cables as they are only buried 2 m below the surface. The optimal site will ideally be located with low shipping activity.
Ground Profile: The characteristics of ground condition and its stiffness could hint at the type of bottom fixed foundations. The overall structure’s natural frequency varies based on different types of foundations and surrounding soils. The installation of monopiles in weak ground deposits could often be expensive and non-economical; a solution could be using jacket foundations or improving the ground stiffness. This could be beneficial to improve the stability of the offshore wind turbine that could be subjected to seismic, typhoon, tsunami, and other natural hazards [55].
Fault rupture and seismically active region: Fault rupture as a hazard could have direct and indirect risks. In the scoring matrix system, a score is allocated for the bottom-fixed foundations due to their high vulnerability to seismic loads and possible damage risks.
Distance to the national grid: A shorter distance to the shoreline means lower costs associated with transmission lines and less energy loss during transmission.
Seabed topography and water depth clearance: A distance clearance from the seabed level is required to install tidal and current generators. A site with a non-flat seabed surface would have difficulty installing an array of generators. The water depth and the bathymetry data could be obtained from the Global Wind Atlas [12].
Current speed: The water current speed is the main source of current energy. Some repositories, such as https://earth.nullschool.net [56], could be useful for finding the current speed. The recommended operational current speed for current turbine is 0.5–3.0 m/s [57].
Electricity transmission Infrastructure: Investment in offshore wind farms could often be challenging. In this process, decision making based on risk and budget is typically considered. In this decision-making process, the pre-existing infrastructures are valuable and could reduce the construction cost.
Not protected as a MPA or SSSI: The other important question is to investigate whether the location is not protected as a Marine Protected Area (MPA) or Site of Special Scientific Interest (SSSI).
Geothermal/ocean thermal energy: The favorable characteristics of geothermal developments include a significant heat source, high geothermal gradient (higher heat flux), and suitable geological characteristics, including (1) permeable reservoir rocks which enable fluid circulation; (2) an overlying layer of impervious rock to minimize the dissipation of formation pressure; and (3) high temperature and a reliable recharge mechanism to eliminate depletion of the heat resource and a supply of water for the commercial energy production purposes [58]. Considering the average geothermal gradients of 25–30 °C/km, subsurface temperature gradients in excess of 30 °C/km where the reservoirs could produce above 75 °C fluids with flow rates in excess of 1000 l/min can be considered as critical criteria for geothermal production [59]. To produce economical production rates, an annual average temperature gradient in excess of 18 °C/km is expected for OTEC technology [29]. The possibility of integrating other thermal energy resources (i.e., solar/ geothermal) to enhance the thermodynamic performance of the OTEC plant, the presence of hydrogen/ammonia production plants which could potentially enable hydrogen as an energy carrier for electricity production, and local demand for heat and desalination chemical production make the technology more economically attractive [32].

3.2. Data Evaluation and Decision-Making Criteria

The site selection of wind energy is carried out together with foundation decision making. The foundations are divided into bottom-fixed and floating foundations. The bottom-fixed foundations include gravity-based structure (GBS), monopile, and jacket foundations, and the floating includes spar buoy, barge, and TLP foundations.
The main questions asked to determine the suitability of a site for wind turbine installation are based on the criteria defined in [33] as outlined in Table 1. The wind speed and seabed geotechnical conditions are the main consideration factors. Other factors are for the considerations of installation, operation and maintenance as well as impact to other users of the ocean. An allocated score is given based on its importance to the energy production at the end of each question in the form of (X and Y). The X represents the maximum score allocated for the most suitable condition for the bottom-fixed foundations, and the Y represents the maximum score allocated for the most suitable condition for the floating foundation systems. Most criteria affect both types of foundations to the same extent except for four criteria: ground profile and seismic activities have more effects on fixed foundations than on floating foundations and more scores allocated for fixed foundations. As floating foundations use multiple anchors and mooring lines and occupy more ocean spaces, the buried services and shipping route have a larger effect on them; thus, higher scores are allocated. The awarded score for each site for each question is in the range of 0 and X/Y, proportional to its suitability by referring to parameter descriptions in Section 3.1. The summation of all scores for each energy resource to be included for exploitation is 100%, and if the percentage drops below a threshold, e.g., 70%, that type of foundation is considered unsuitable to be included in the hybrid platform.
As wind energy is the main energy resource considered in the current framework due to its maturity and exploitation levels and other types of energy are additional resources, the site selection matrices for other types of energy only include the exclusive criteria for that energy, as the common criteria have been considered in the wind energy matrix. The key questions asked to determine the suitability of installing additional wave generators for a selected site are the availability of wave resources as outlined in Table 2.
The key questions asked to determine the suitability of installing tidal current turbines for a selected site are the sufficiency of current speed and space for turbine installation as outlined in Table 3, according to [60].
The critical questions asked to determine the suitability of exploiting geothermal energy for a selected site are mainly the availability of geothermal resources and ground profile, as outlined in Table 4, according to Yousefi et al. [61] and White [62], and for OTEC in Table 5 according to Dugger et al. [63].
The key assumptions to determine the suitability of considering energy storage by hydrogen generation in the offshore area for a selected region are the availability of clean water and electricity for the hydrogen generation equipment and the storage and transportation of hydrogen, as outlined in Table 6.

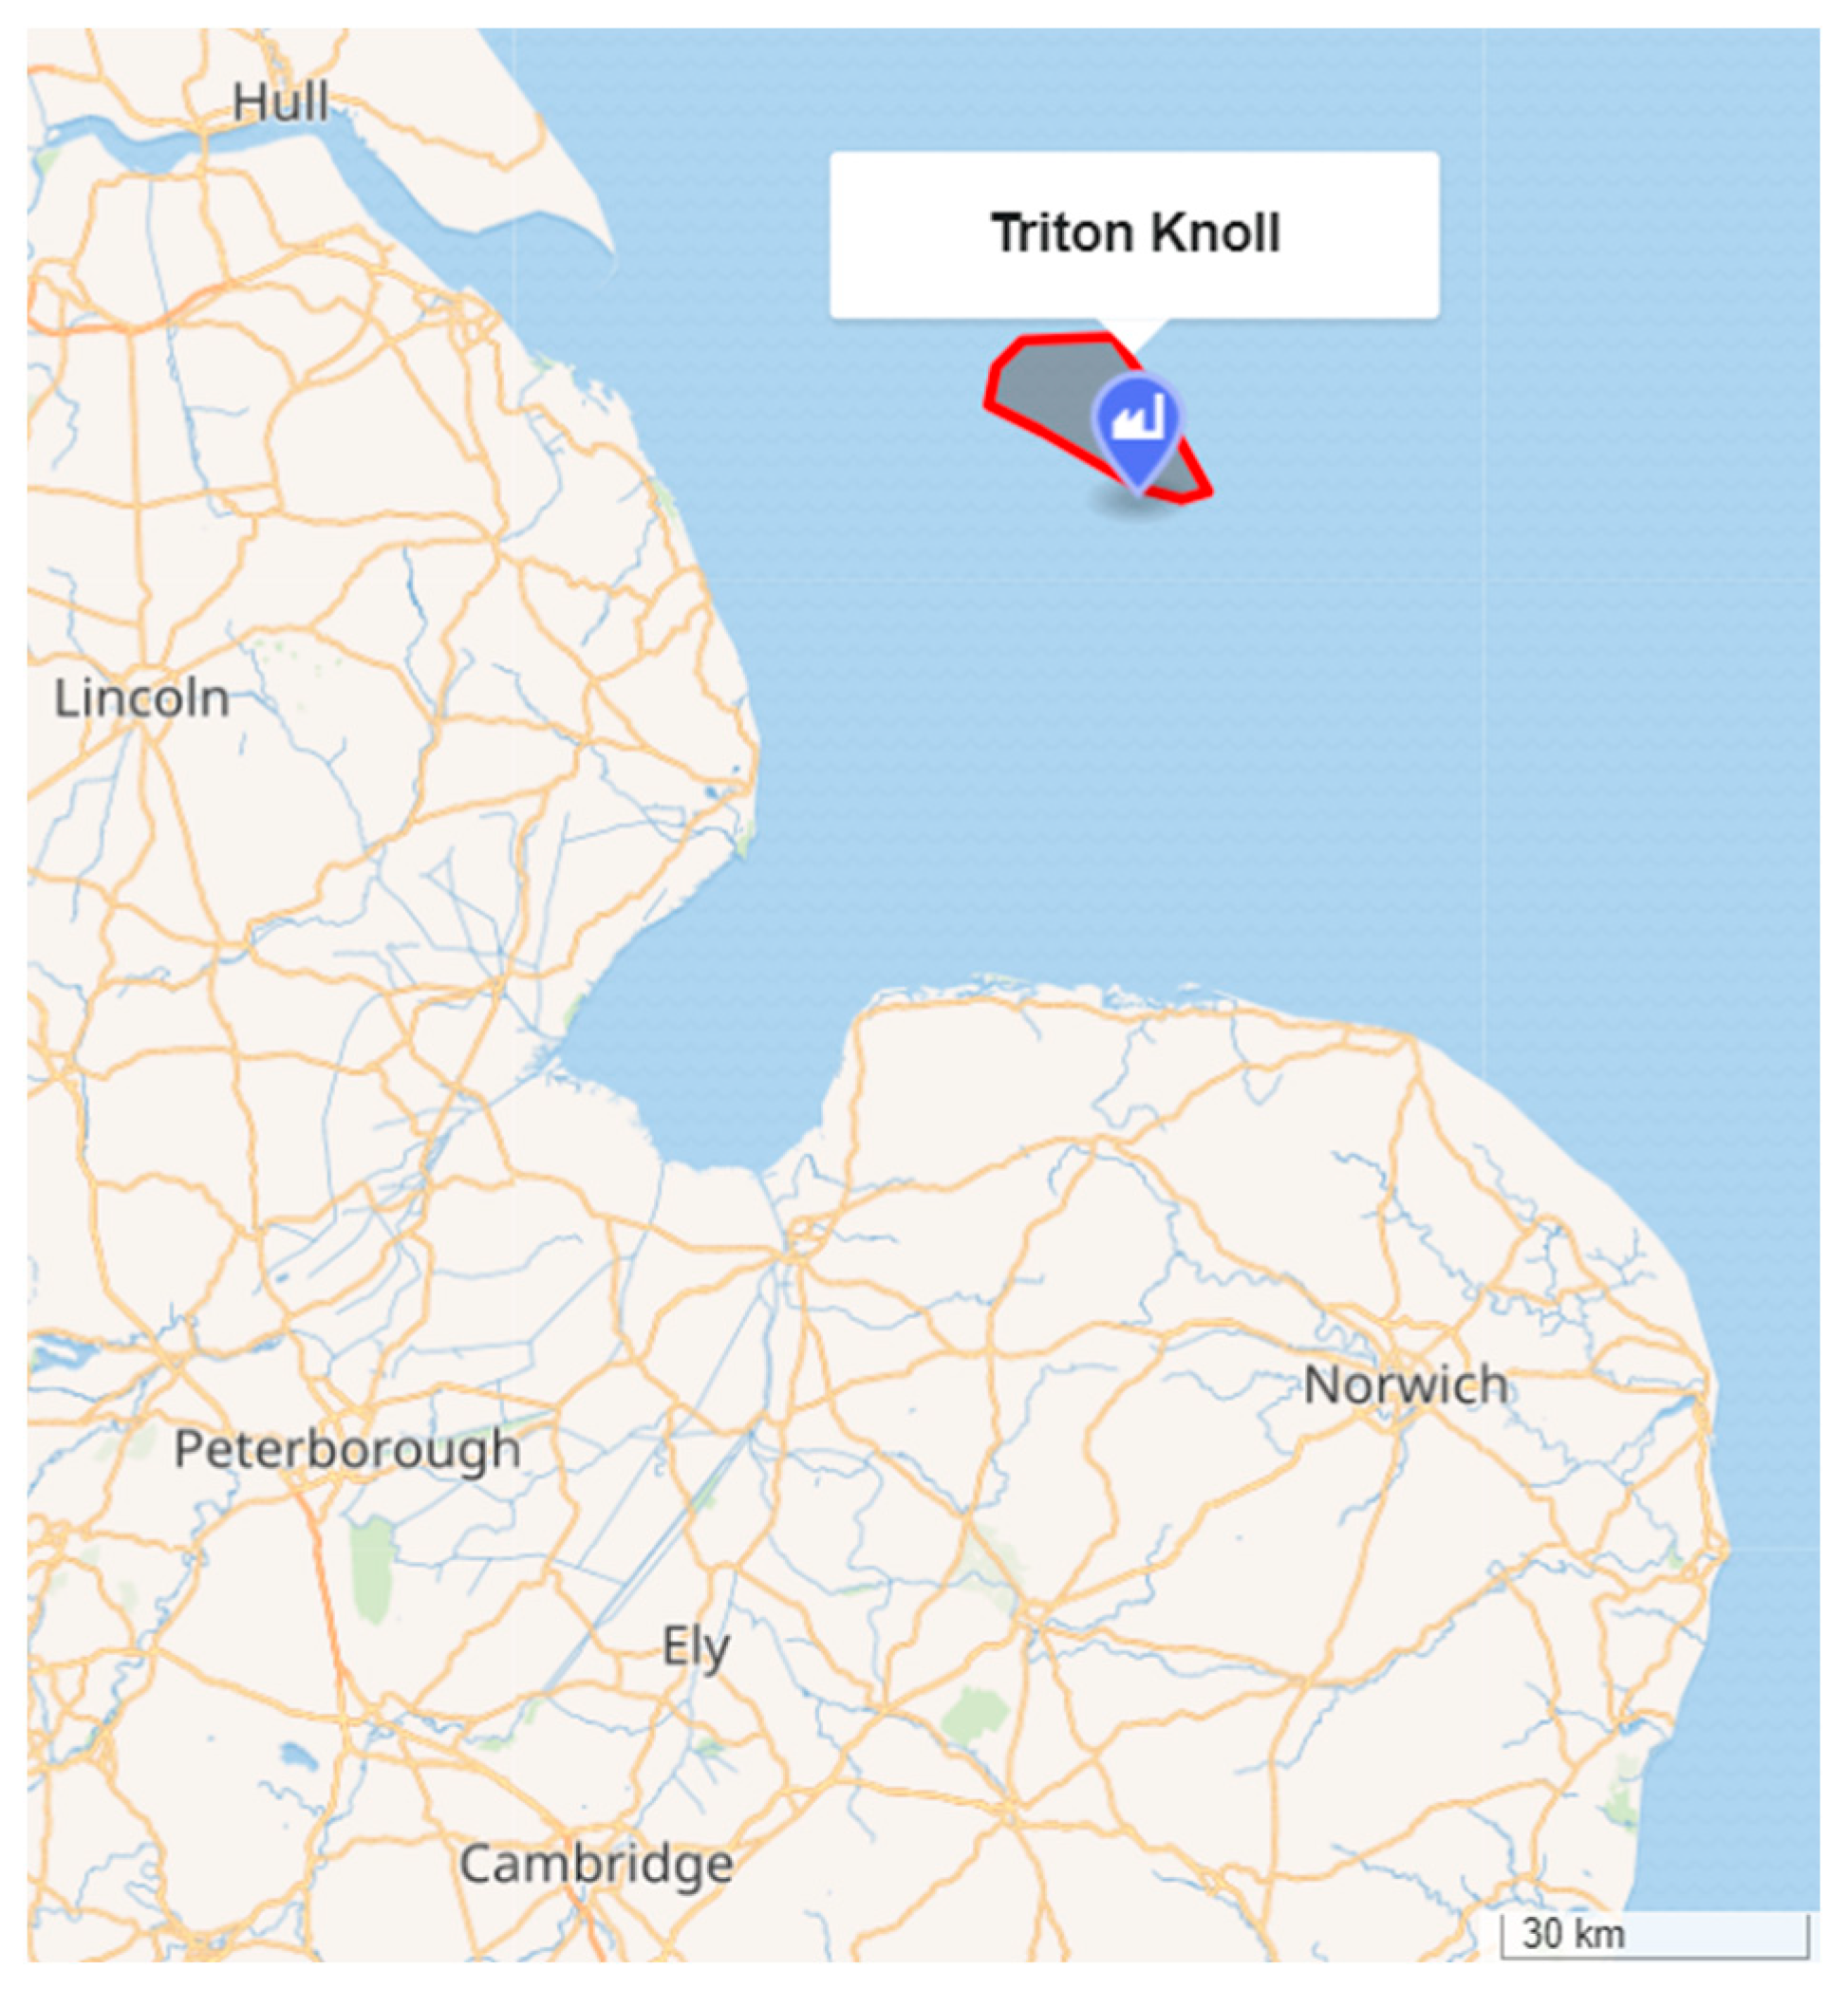
4. Application of the Scoring Matrix at Triton Knoll Wind Farm

The Triton Knoll wind farm was used as an example to demonstrate the steps of using the decision-making scoring matrix to find suitable energy combinations and foundations. A flowchart is provided in Figure 16 to illustrate the steps of designing the configuration of the hybrid platform from determining the components using the scoring matrix to the verification of structural integrity. It uses the existing offshore wind turbine as the primary energy source and considers the feasibility of adding other types of energy sources to make a hybrid energy platform. A structural integrity evaluation using the Finite Element Method (FEM) was performed to assess the influence of additional structure on the existing wind turbines.

4.1. Triton Knoll Wind Farm, Site Data and Characteristics

The Triton Knoll wind farm is 32 km off the Lincolnshire coast (Figure 17 [64]) and is expected to provide 860 MW of electricity for at least 800,000 households in the UK. The Triton Knoll wind farm includes offshore wind turbines with monopile length in the range of 20 to 30 m and diameter in the range of 6.5 to 6.9 m [65,66]. This wind farm includes 90 MHI Vestas V164-9.5 MW wind turbines. The Triton Knoll wind farm includes sandy and clayey soil deposits, as shown in Table 7.
The Triton Knoll wind farm’s average water depth was 18 m [12]. The wind speed at this site was estimated to be between 9 and 10 m/s. The wave data are illustrated in Table 8, where d1—first deployment period; d2—second deployment period; Hs—significant wave height; Tm—mean wave period; Tp—peak wave period.

4.2. Example of Use of Scoring Matrix
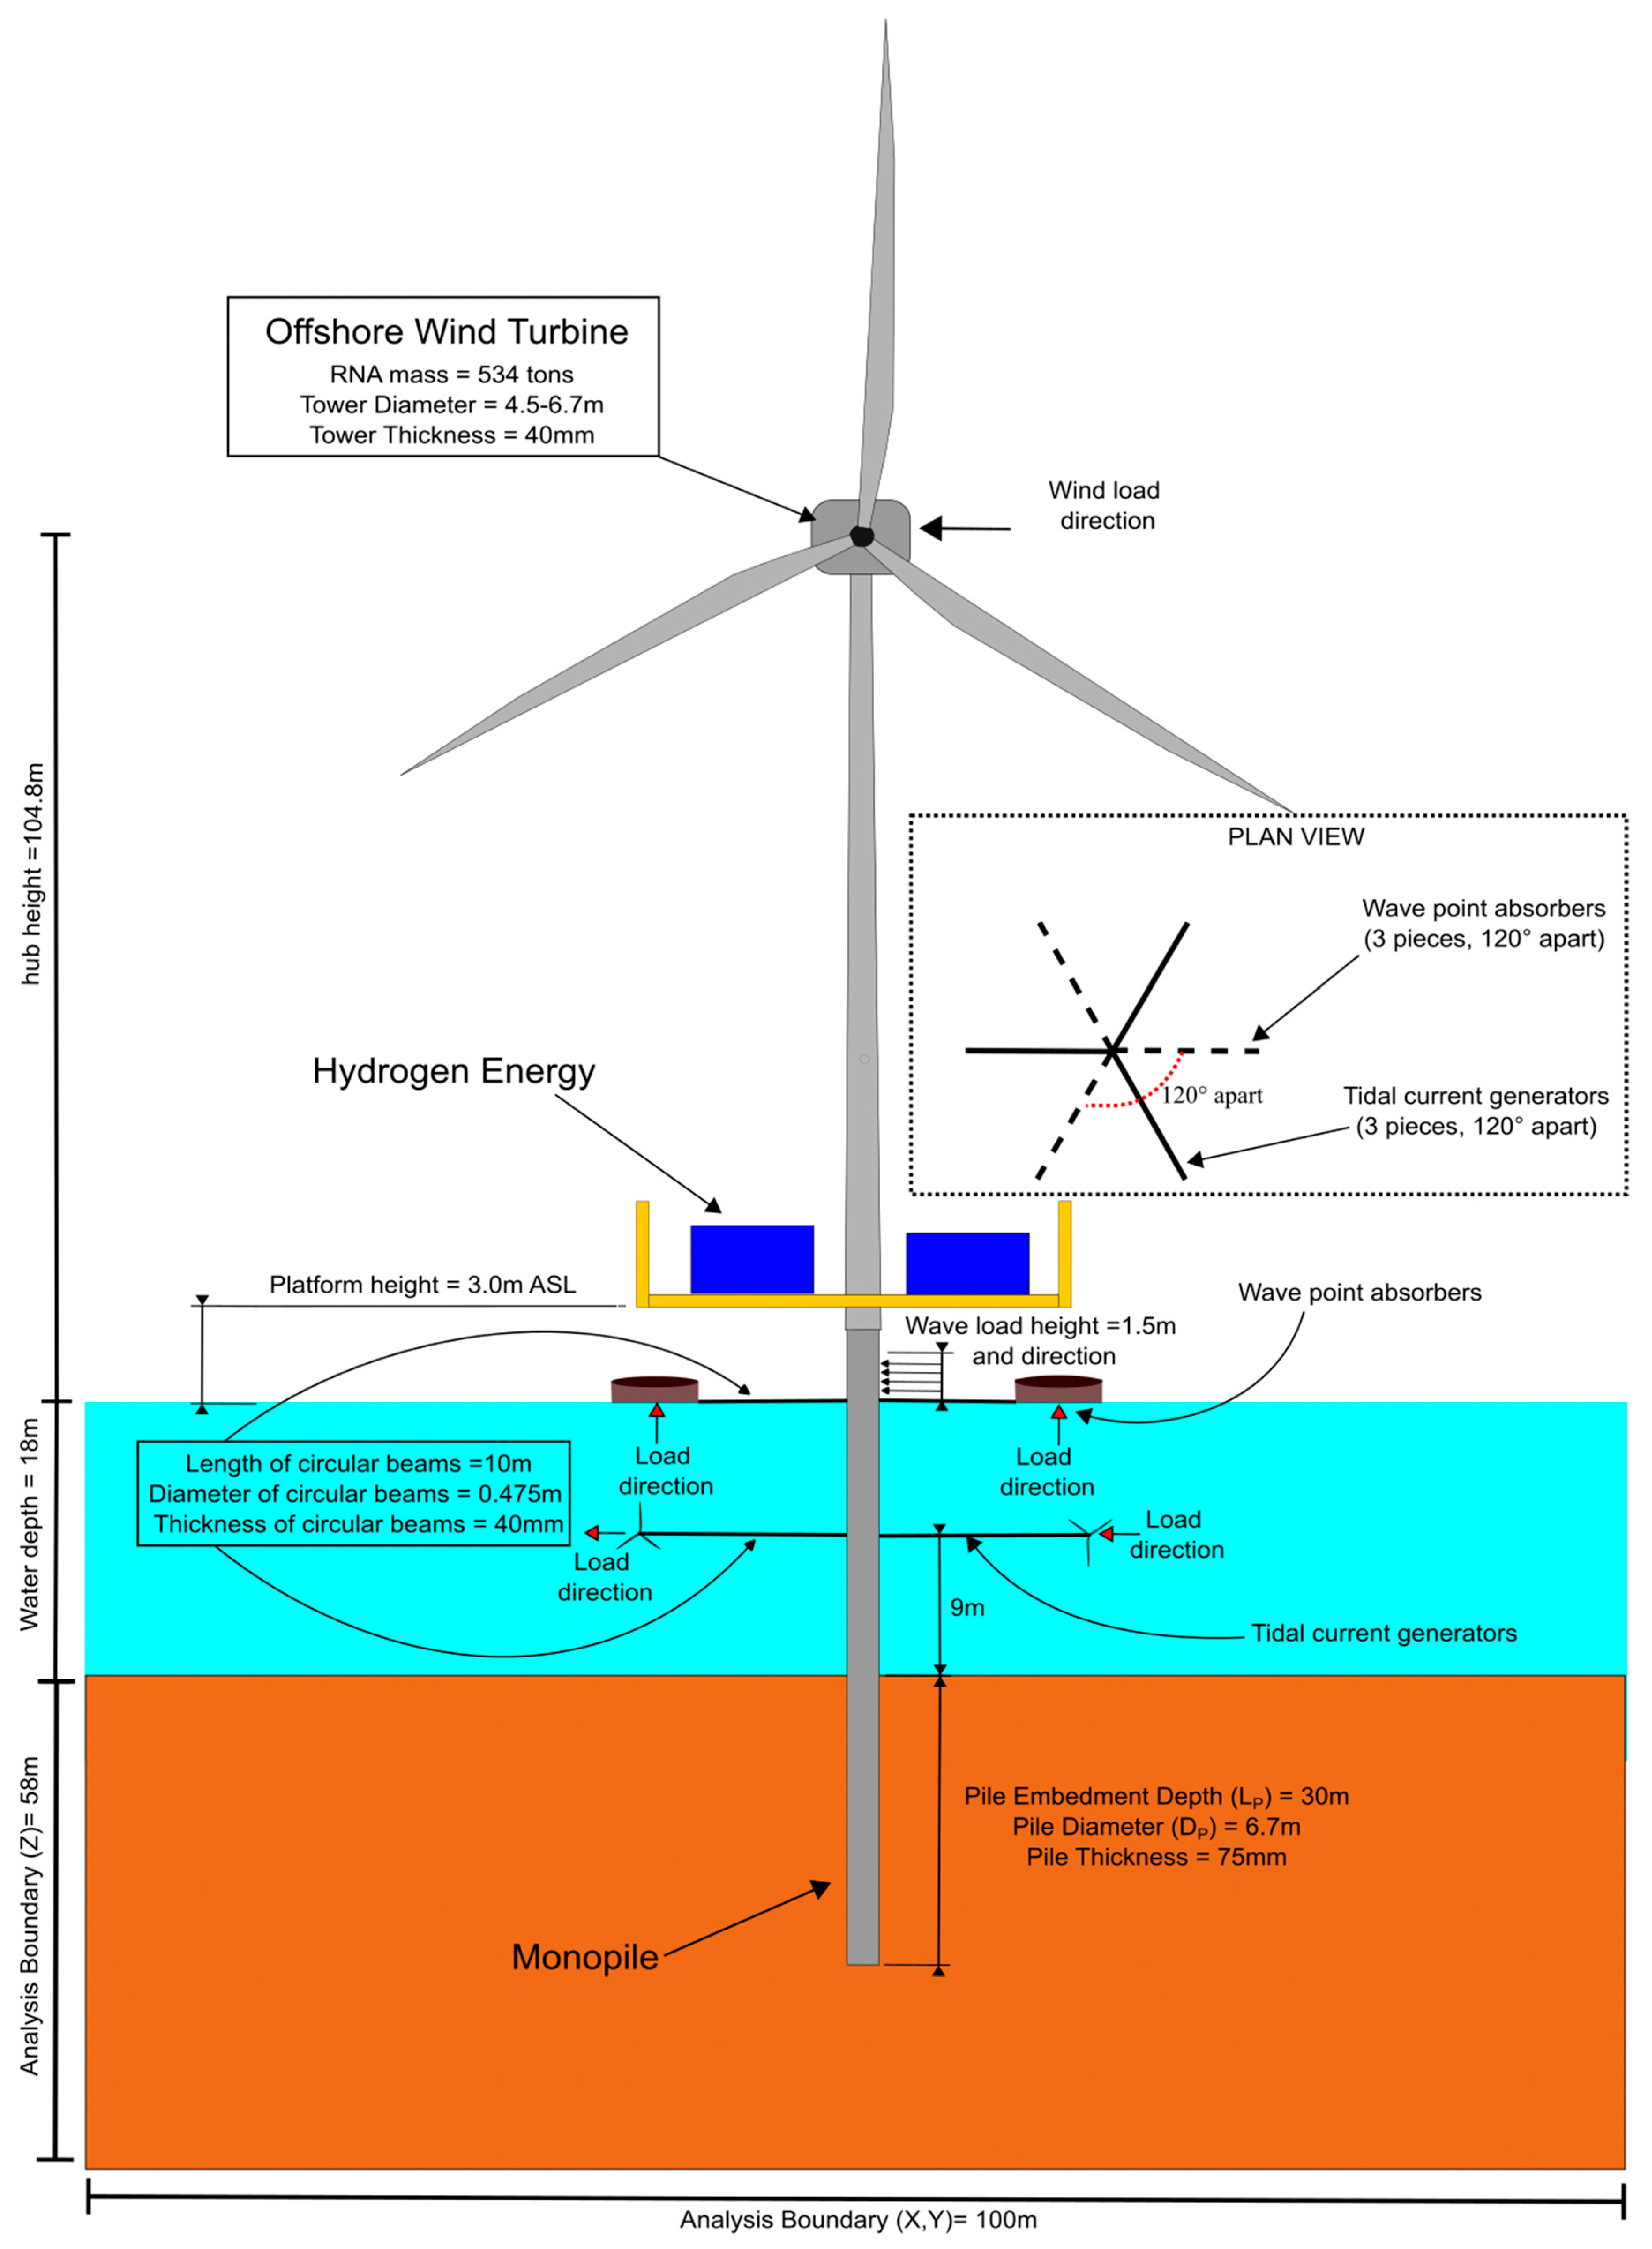
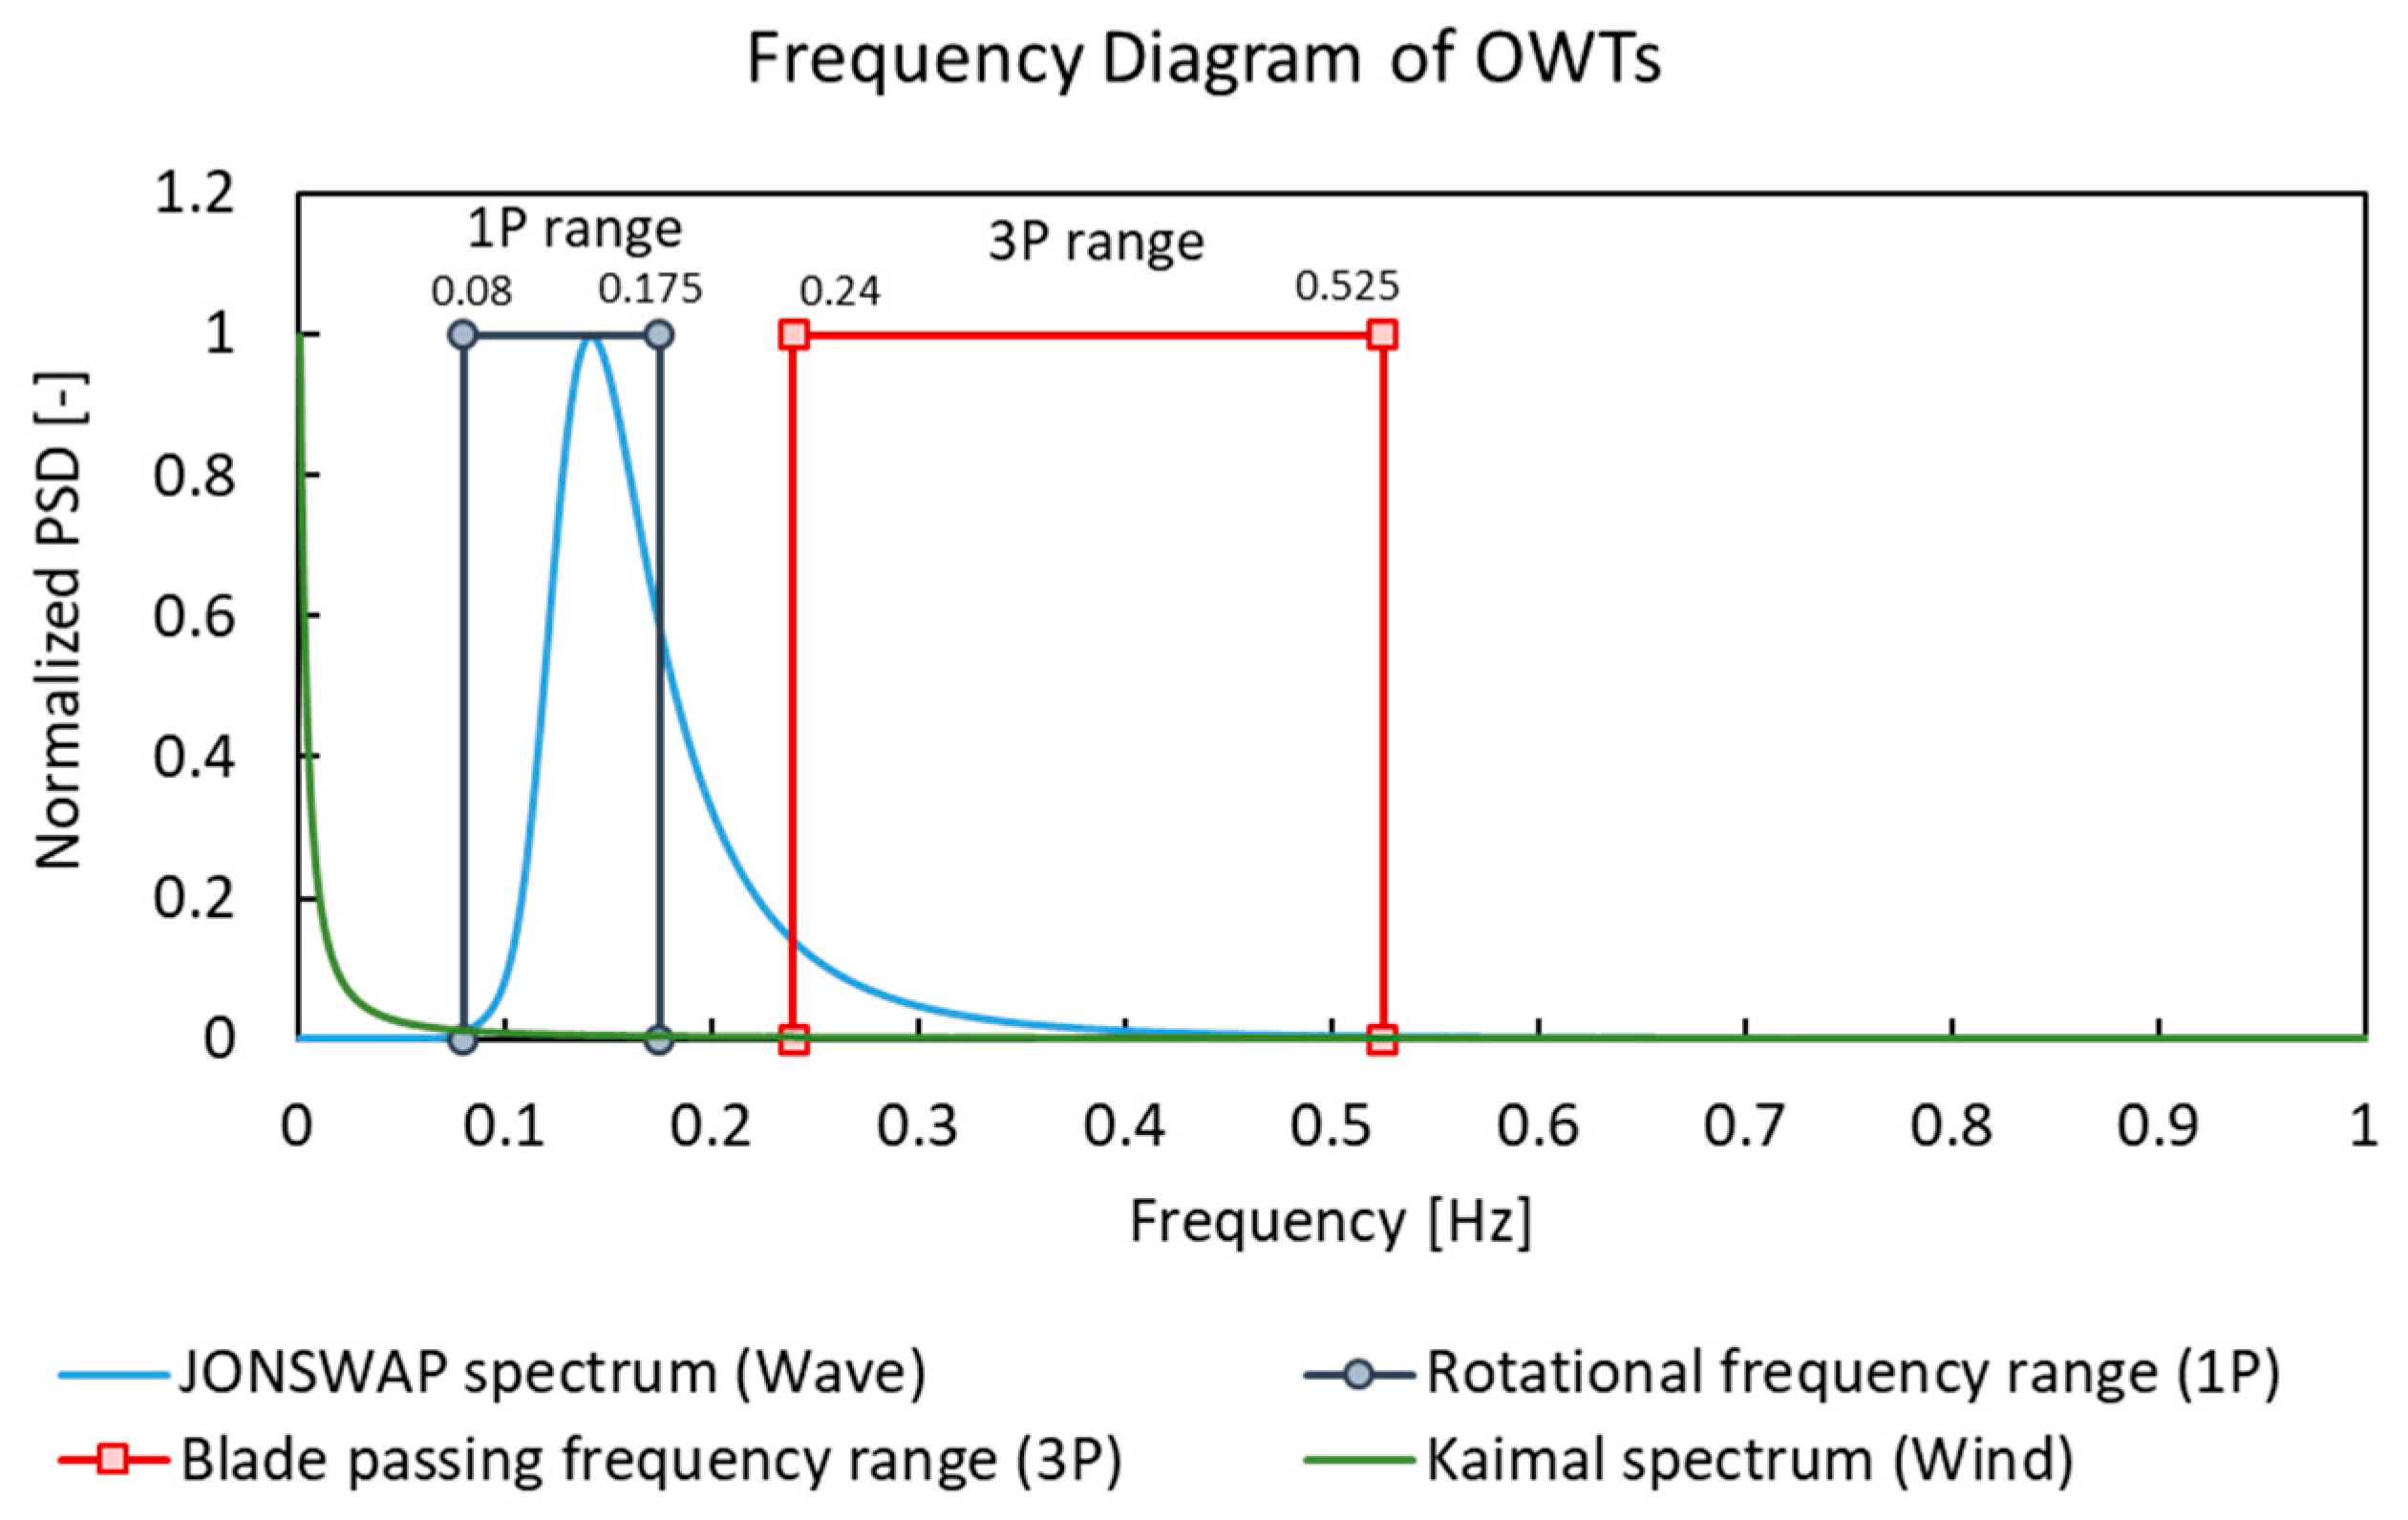
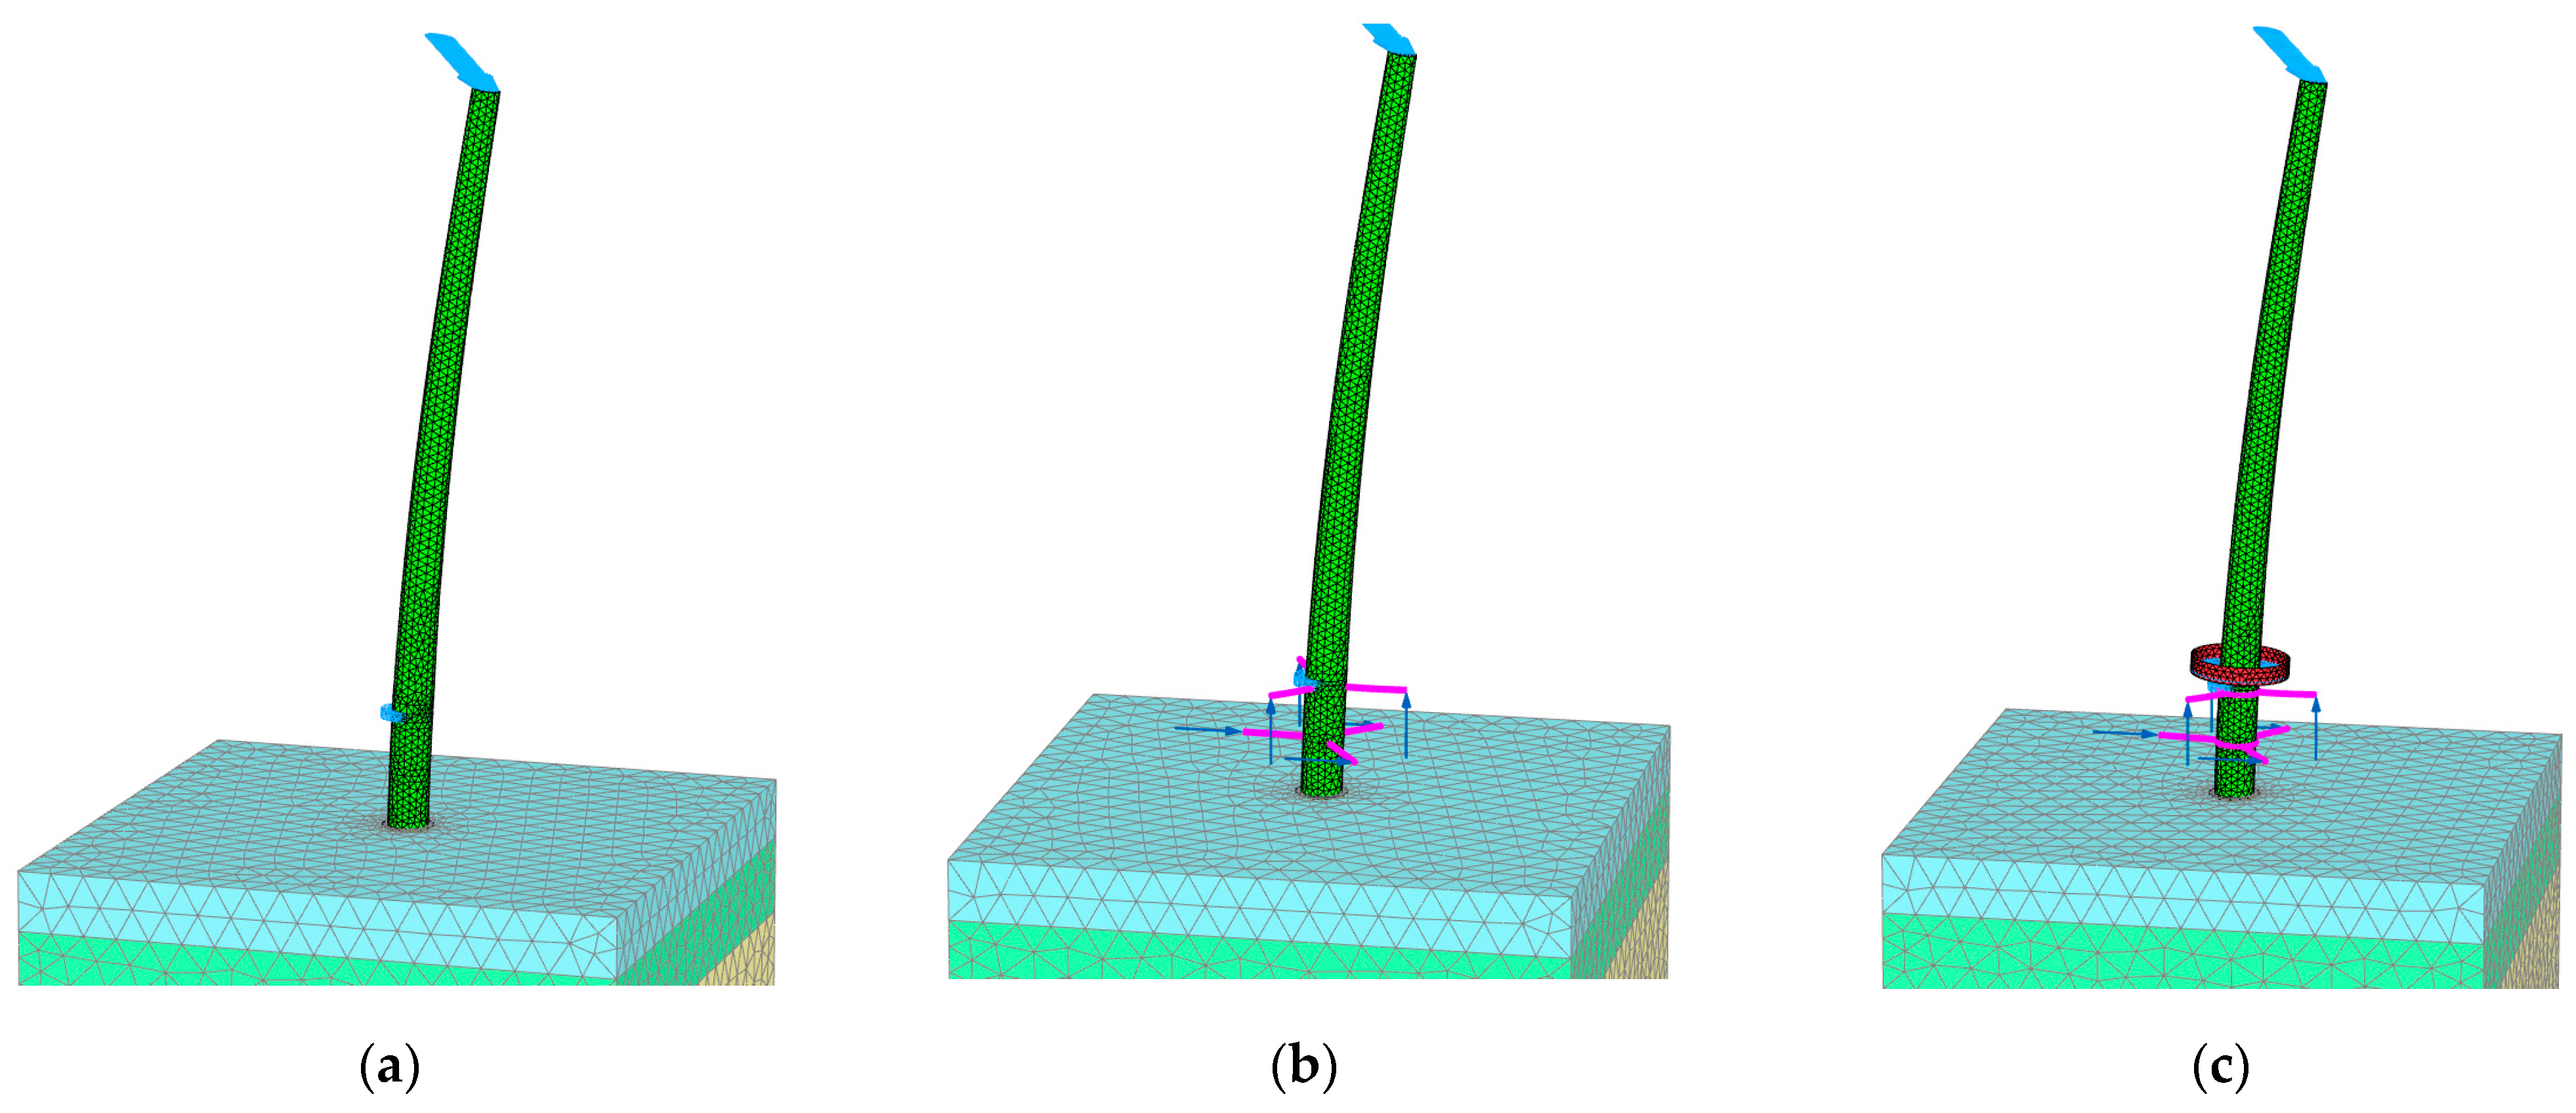
Scores are awarded for each question based on the extent to which the Triton Knoll wind farm site meets the requirement as raised in the question. The scores of the key questions for the offshore wind energy matrix are outlined in Table 9, and the scores of the key questions for other additional energy devices and energy storage equipment are provided in Table 10. Based on the scores, this site is suitable for hybrid wind turbines, wave energy converters (WECs), and current turbines with hydrogen generation equipment and the optimum foundation is monopile. No sufficient geothermal or ocean thermal energy at this site.

4.3. Modeling

The FEM package, PLAXIS 3D [67], was used to model the hybrid platform integrated with the selected wind turbine, wave absorber, current turbine and hydrogen generator supported by a monopile foundation at this farm to assess its stability. There are plenty of studies of hybrid offshore energy platforms for wind and waves supported by floating foundations, e.g., the dynamics of hybrid platforms with heaving point absorbers connected to a semi-submersible floating offshore wind turbine [68] and the dynamic analysis of the Submerged Tension-Leg Platform (STLP) combined with a heaving-type point absorber wave energy converter [69]. However, the study of hybrid platform supported by fixed-bottom foundation is very rare. To verify the design, a benchmark model of a single OWT founded on monopile was first established, which has well-established design guidelines.
The soil profile at this farm as listed in Table 7 was modeled using PLAXIS 3D, and a soil body with a size of 100 m × 100 m × 58 m (X × Y × Z) was chosen with very fine mesh and about 22,000 elements. The soil is modeled using a Mohr–Coulomb constitutive model with the soil parameters given in Table 7 under an undrained condition. The platform configuration is illustrated in Figure 18, and the dimensions and parameters of the turbine and the foundation are listed in Table 11. The loads applied to the system are listed in Table 12. The ultimate limit state (ULS) wind load and the ULS wave load were estimated using the formula described by Arany et al. [70]. The wind load was assigned as a surface load at the hub level. The wave load was assigned as a surface load to the tower’s surface between the height of 18.0 and 19.5 m, corresponding to the water depth of 18 m and the wave height of 1.5 m. The Triton Knoll wind farm includes an MHI Vestas V164-9.5 MW wind turbine.
In addition to the main structure, three circular steel beams were mounted on the upper section of the monopile to connect the tidal current turbines, and another three circular steel beams were installed at the water surface level to connect the wave point absorbers. Their dimensions, layout and parameters are provided in Table 11 and Figure 18. This layout can minimize the mutual shadowing effects between wave absorbers and current turbines, which can lead to a reduction in energy output. A circular hydrogen fuel platform is added to the system to facilitate on-board hydrogen production. The platform material is made of rigid steel perpendicular to the tower structure. The weights of the hydrogen production equipment, desalination facility and hydrogen tanks are represented by a 20 kPa surface load. A 60 kN static loading was applied on each tidal current turbine in the same direction of wind load and was also applied on each wave point absorber vertically upwards to test the impact of the load on the overall structural integrity (see Figure 18).
Three different load scenarios were studied using FEM: (i) benchmark model with only wind and wave load; (ii) adding three tidal current turbines and three wave points absorbers; (iii) scenario (ii) with the hydrogen generation platform. In each scenario, different loads were added step by step, as listed in Table 13 and Table 14, to show their influence.
Using the metocean and geotechnical data at the Triton Knoll wind farm, the natural frequency of the system has been estimated for different types of the hybrid systems by adding additional mass to the tower to represent the condition of the attached hybrid systems. To estimate the values of natural frequency, the proposed method by Arany et al. [70] has been used. In terms of the stiffness of the system, closed-form solutions have been used to predict the stiffness of the base in the forms of lateral (KL), rotational (KR) and coupling stiffnesses (KLR). The readers are referred to [33] for further information. A typical damping ratio of 4% according to Adhikari and Bhattacharya has been employed to carry out the calculations. The predicted results are shown in Table 13 and Table 14.
The ranges of wind turbine rotational frequency (1P) and blade passing frequency (3P) of the considered wind turbine system at this farm were also estimated based on closed-form solutions proposed by Arany et al. [70]. The frequency ranges are shown in Figure 19. To avoid structural instability and resonance, the system natural frequency is required to fall in the range of 0.175 and 0.24 Hz (“soft–stiff” design).
It was found from Table 13 and Table 14 that in all the loading scenarios (i, ii, iii), the natural frequency of the hybrid system was at a safe distance from the 1P frequency range (rotor frequency) and in some cases near the 3P frequency range (blade-passing frequency). When all additional devices were attached, the natural frequency increased from 0.217 to 0.230 (6% increase), which is still outside the 3P frequency range (0.24–0.525). Resonance is not likely to be caused by the additional structures associated with the hybrid system.
The FEM models with deformed mesh for Design Load Cases (DLCs) 1, 5 and 9 are shown in Figure 20, and the structural deformations are outlined in Table 13 and Table 14. The maximum deflection of the beam tip is 0.28 m, which is acceptable for the size of the system. The change in pile head deflection due to additional structures is negligible (-1.0% to 0.36%). An interesting observation is that with the upward forces applied on the wave point absorbers, the maximum displacement of beams connecting the tidal current turbines is suppressed slightly. With the weight of hydrogen production equipment, the main structures are stabilized with less pile and tower deflections.

5. Discussion and Conclusions

The state of the art of renewable marine energy resources and several of their harvesting approaches and energy-storage technologies were first reviewed. A synergistic hybrid system incorporating multiple energy harvest devices was proposed. Based on the review of existing analysis of hybrid wind-wave energy system, it can be concluded that the proposed hybrid wind-wave–current–hydrogen system will have four main advantages compared to traditional single-source energy systems:
  • It increases the energy yield per unit area of marine space and optimizes the use of available natural resources.
  • The shadowing effect of multiple energy devices leads to milder loading and a minimization of environmental impact on the base structure.
  • It optimizes the costs of installation, operation, and maintenance and reduces the costs of supporting infrastructures such as cable boxes and grid connectivity. This will lead to a reduction in the levelized cost of energy and benefit energy users.
  • On-board hydrogen production addresses the intermittent production of marine energy and provides solutions to supply–demand balance.
  • The new contributions of this paper are outlined below:
  • The key factors to consider when developing the hybrid design are enumerated and the proposed new scoring matrix is proved to be effective for selecting viable energy resources to be incorporated into the hybrid system. This scoring matrix can be used in any marine site as the first step for hybrid system design.
  • It is demonstrated that the hybrid system incorporating additional structures connecting wave point absorbers and current turbines to the main wind tower does not influence the wind tower structural integrity (<1% more deflection) or fatigue life significantly (6% increase in natural frequency). Some additional vertical load even reduced the structural deflections.
The current case study only considered the fixed-bottom foundation. Other sites suitable for floating foundations and the platform design utilizing a floating foundation will be investigated in future studies. The current load scenarios are limited to ULS loadings. Responses of hybrid systems under dynamic loads will be investigated in the future.
The next step of this study is to establish an integrated design and operation management model for the hybrid system to include the whole lifecycle engineering design, levelized costs analyses, and operational management. Further work will explore the beneficial synergy of different energy harvest devices, e.g., the suppression of wave/current load on the supporting foundation by the operation of wave point absorber and current turbine or reduction in shoreline erosion due to the energy absorption from the marine hydrokinetic resources. Suitable floating foundations for the hybrid system still need intensive research to coup with the complicated interactions between components. The feasibility of the hybrid system will then be further validated in the field to reach higher TRLs, and connections to power grids will be considered next. Social acceptance, policy and regulatory incentive and barriers also need to be investigated thoroughly. These findings can promote the exploitation of the novel hybrid system and guide the system design, which will lead to the promotion of renewable marine energy to society and achieve zero-emission targets in the long term.

Author Contributions

Conceptualization, L.C., M.G., W.G.P.K., A.A., B.A.H. and S.B.; methodology, L.C., M.G., W.G.P.K., A.A., B.A.H. and S.B.; software, S.A.; validation, S.A.; formal analysis, S.A.; investigation, S.A.; data curation, S.A.; writing—original draft preparation, L.C., S.A., M.G., W.G.P.K., A.A., H.O., B.A.H. and S.B.; writing—review and editing, L.C., S.A., M.G., W.G.P.K., A.A., H.O., B.A.H. and S.B.; visualization, S.A.; supervision, L.C.; project administration, L.C.; funding acquisition, L.C., M.G., W.G.P.K., A.A., B.A.H. and S.B. All authors have read and agreed to the published version of the manuscript.

Funding

This research was funded by the University Global Partnership Network (UGPN) Research Collaboration Fund 2021.

Data Availability Statement

The data are available upon request from the corresponding author.

Conflicts of Interest

Author Sadra Amani was employed by the company Ramboll UK Limited. The remaining authors declare that the research was conducted in the absence of any commercial or financial relationships that could be construed as a potential conflict of interest.

References

  1. Azzellino, A.; Riefolo, L.; Lanfredi, C.; Vicinanza, D. Marine renewables: Exploring the opportunity for combining wind and wave energy. ENEA Special Issue Ocean energy: Ongoing reseach in Italy. Energ. Ambiente Innov. 2015, 43–51. [Google Scholar] [CrossRef]
  2. Astariz, S.; Perez-Collazo, C.; Abanades, J.; Iglesias, G. Hybrid wave and offshore wind farms: A comparative case study of co-located layouts. Int. J. Mar. Energy 2016, 15, 2–16. [Google Scholar] [CrossRef]
  3. Pérez-Collazo, C.; Greaves, D.; Iglesias, G. A review of combined wave and offshore wind energy. Renew. Sust. Energy Rev. 2015, 42, 141–153. [Google Scholar] [CrossRef]
  4. Astariz, S.; Perez-Collazo, C.; Abanades, J.; Iglesias, G. Towards the optimal design of a co-located wind-wave farm. Energy 2015, 84, 15–24. [Google Scholar] [CrossRef]
  5. Astariz, S.; Iglesias, G. Selecting optimum locations for co-located wave and wind energy farms. Part I: The Co-Location Feasibility index. Energy Convers. Manag. 2016, 122, 589–598. [Google Scholar] [CrossRef]
  6. Astariz, S.; Iglesias, G. Accessibility for operation and maintenance tasks in co-located wind and wave energy farms with non-uniformly distributed arrays. Energy Convers. Manag. 2015, 106, 1219–1229. [Google Scholar] [CrossRef]
  7. Goldschmidt, M.; Muskulus, M. Coupled Mooring Systems for Floating Wind Farms. Energy Procedia 2015, 80, 255–262. [Google Scholar] [CrossRef]
  8. Castro-Santos, L.; Martins, E.; Soares, C.G. Cost assessment methodology for combined wind and wave floating offshore renewable energy systems. Renew. Energy 2016, 97, 866–880. [Google Scholar] [CrossRef]
  9. Vo, L.; Jamaleddin, N.; Gabr, M.; Borden, R. Natural Frequency and Foundation Damping of Colocated and Hybrid Systems Sharing Wind Turbine Monopiles under Operational Conditions. Int. J. Geomech. 2024, 24, 04023259. [Google Scholar] [CrossRef]
  10. Zhang, W.J.; Ouyang, P.R.; Sun, Z.H. A novel hybridization design principle for intelligent mechatronics systems. In Proceedings of the 5th International Conference on the Advanced Mechatronics(ICAM2010): The Japan Society of Mechanical Engineers, Toyonaka, Japan, 4–6 October 2010. [Google Scholar] [CrossRef]
  11. Lee, J.; Zhao, F. Global Wind Report 2022; Global Wind Energy Council: Brussels, Belgium, 2022; pp. 1–154. [Google Scholar]
  12. Global Wind Atlas Version 3.0. 2018. Available online: https://globalwindatlas.info (accessed on 1 October 2021).
  13. Davis, N.N.; Badger, J.; Hahmann, A.N.; Hansen, B.O.; Mortensen, N.G.; Kelly, M.; Larsén, X.G.; Olsen, B.T.; Floors, R.; Lizcano, G.; et al. The Global Wind Atlas: A High-Resolution Dataset of Climatologies and Associated Web-Based Application. Bull. Am. Meteorol. Soc. 2023, 104, E1507–E1525. [Google Scholar] [CrossRef]
  14. Sun, H.; Yang, H.; Gao, X. Investigation into wind turbine wake effect on complex terrain. Energy 2023, 269, 126767. [Google Scholar] [CrossRef]
  15. Kilcher, L.; Fogarty, M.; Lawson, M. Marine Energy in the United States: An Overview of Opportunities. Golden, CO: National Renewable Energy Laboratory. NREL/TP-5700-78773. 2021. Available online: https://www.nrel.gov/docs/fy21osti/78773.pdf (accessed on 1 October 2021).
  16. Neary, V.S.; Lawson, M.; Previsic, M.; Copping, A.; Hallett, K.C.; LaBonte, A.; Rieks, J.; Murray, D. (Eds.) Methodology for Design and Economic Analysis of Marine Energy Conversion (MEC) Technologies. In Proceedings of the 2nd Marine Energy Technology Symposium, METS2014, Seattle, WA, USA, 15–17 April 2014. [Google Scholar]
  17. Kutasov, I.; Kagan, M. Procedures correct temperatures for deep offshore wells. Oil Gas J. 2002, 100, 56–61. [Google Scholar]
  18. Bu, X.; Ma, W.; Li, H. Geothermal energy production utilizing abandoned oil and gas wells. Renew. Energy 2012, 41, 80–85. [Google Scholar] [CrossRef]
  19. Prabowo, T.R.; Fauziyyah, F.; Suryantini Bronto, S. A new idea: The possibilities of offshore geothermal system in Indonesia marine volcanoes. IOP Conf. Ser. Earth Environ. 2017, 103, 12012. [Google Scholar] [CrossRef]
  20. Allahvirdizadeh, P. A review on geothermal wells: Well integrity issues. J. Clean Prod. 2020, 275, 124009. [Google Scholar] [CrossRef]
  21. Karason, B.; Gudjonsdottir, M.S.; Valdimarsson, P.; Thorolfsson, G. (Eds.) Utilization of Offshore Geothermal Resources for Power Production. In Proceedings of the Thirty-Eighth Workshop on Geothermal Reservoir Engineering, Stanford, CA, USA, 11–13 February 2013. [Google Scholar]
  22. Banerjee, A.; Chakraborty, T.; Matsagar, V. Evaluation of possibilities in geothermal energy extraction from oceanic crust using offshore wind turbine monopiles. Renew. Sust. Energy Rev. 2018, 92, 685–700. [Google Scholar] [CrossRef]
  23. Richter, A. Green Electricity from Heat under the Sea—Offshore Geothermal Energy; Think GeoEnergy: Reykjavík, Iceland, 2019. [Google Scholar]
  24. Atkins, D.; Audunsson, H. (Eds.) Exploration Techniques for Locating Offshore Geothermal Energy Near Iceland. In Proceedings of the Thirty-Eighth Workshop on Geothermal Reservoir Engineering, Stanford, CA, USA, 11–13 February 2013. [Google Scholar]
  25. Armani, F.B.; Paltrinieri, D. Perspectives of offshore geothermal energy in Italy. EPJ Web. Conf. 2013, 54, 2001. [Google Scholar] [CrossRef]
  26. Italiano, F.; Santis, A.D.; Favali, P.; Rainone, M.; Rusi, S.; Signanini, P. The Marsili Volcanic Seamount (Southern Tyrrhenian Sea): A Potential Offshore Geothermal Resource. Energies 2014, 7, 4068–4086. [Google Scholar] [CrossRef]
  27. Gonzalez-Fernández, A.; Neumann, F.; Negrete-Aranda, R.; Contreras, J.; Kretzschmar, T.; Batista-Cruz, R.Y.; Avilés-Esquivel, T.A.; Reyes Ortega, V.; Flores-Luna, C.F.; Gomez-Trevino, E.; et al. (Eds.) Conceptual Model for the Geothermal System of the Wagner Basin. In Proceedings of the American Geophysical Union Fall Meeting: American Geophysical Union, San Francisco, CA, USA, 11–15 December 2023. [Google Scholar]
  28. Faizal, M.; Bouazza, A.; Singh, R.M. An Overview of Ocean Thermal and Geothermal Energy Conversion Technologies and Systems. Int. J. Air-Conditioning Refrig. 2016, 24, 1630006. [Google Scholar] [CrossRef]
  29. Kim, H.-J.; Lee, H.-S.; Lim, S.-T.; Petterson, M. The Suitability of the Pacific Islands for Harnessing Ocean Thermal Energy and the Feasibility of OTEC Plants for Onshore or Offshore. Geosci. Process. 2021, 11, 407. [Google Scholar] [CrossRef]
  30. Vega, L.A. Ocean thermal energy conversion. In Encyclopedia of Sustainability Science and Technology, 6th ed.; ARCLER Press: Burlington, ON, Canada, 2012; pp. 7296–7328. [Google Scholar]
  31. Wu, Z.; Feng, H.; Chen, L.; Tang, W.; Shi, J.; Ge, Y. Constructal thermodynamic optimization for ocean thermal energy conversion system with dual-pressure organic Rankine cycle. Energy Convers. Manag. 2020, 210, 112727. [Google Scholar] [CrossRef]
  32. Ramachandran, A.; Shal, U.A.; Ramachandran, S. Finite Time Thermodynamic Investigation of a Solar-Boosted Irreversible OTEC, Smart Technologies for Energy. Environ. Sustain. Dev. 2022, 1, 849–859. [Google Scholar]
  33. Bhattacharya, S. Design of Foundations for Offshore Wind Turbines; John Wiley & Sons Ltd.: Hoboken, NJ, USA, 2019. [Google Scholar]
  34. Bhattacharya, S.; Lombardi, D.; Amani, S.; Aleem, M.; Prakhya, G.; Adhikari, S.; Aliyu, A.; Alexander, N.; Wang, Y.; Cui, L.; et al. Physical Modelling of Offshore Wind Turbine Foundations for TRL (Technology Readiness Level) Studies. J. Mar. Sci. Eng. 2021, 9, 589. [Google Scholar] [CrossRef]
  35. API. Recommended Practice for Planning, Designing and Constructing Fixed Offshore Platforms-Working Stress Design; American Petroleum Institute: Washington, DC, USA, 2007. [Google Scholar]
  36. IEC 61400-3-1:201; Wind Energy Generation Systems—Part 3-1: Design Requirements for Fixed Offshore Wind Turbines. International Electrotechnical Commission: Geneva, Switzerland, 2019.
  37. DNV. DNVGL-RP-C212: Offshore Soil Mechanics and Geotechnical Engineering. 2019. Available online: https://www.dnv.com/oilgas/download/dnv-rp-c212-offshore-soil-mechanics-and-geotechnical-engineering.html (accessed on 20 May 2022).
  38. Stehly, T.; Duffy, P. Cost of Wind Energy Review-NREL/TP-5000-81209; 2020; p. 1–77. Available online: https://www.nrel.gov/docs/fy23osti/84774.pdf (accessed on 28 September 2022).
  39. Neary, V.S.; Lawson, M.; Previsic, M.; Copping, A.; Harllett, K.C.; Labonte, A.; Rieks, J.; Murray, D. Methodology for Design and Economic Analysis of Marine Energy Conversion (MEC) Technologies; Contract No.: SAND2014-9040; Sandia National Laboratories: Albuquerque, NM, USA, 2014.
  40. Weisser, D.; Garcia, R.S. Instantaneous wind energy penetration in isolated electricity grids: Concepts and review. Renew. Energy 2005, 30, 1299–1308. [Google Scholar] [CrossRef]
  41. Hameer, S.; van Niekerk, J.L. A review of large-scale electrical energy storage. Int. J. Energy Res. 2015, 39, 1179–1195. [Google Scholar] [CrossRef]
  42. Carmo, M.; Fritz, D.L.; Mergel, J.; Stolten, D. A comprehensive review on PEM water electrolysis. Int. J. Hydrogen Energy 2013, 38, 4901–4934. [Google Scholar] [CrossRef]
  43. Henkensmeier, D.; Najibah, M.; Harms, C.; Žitka, J.; Hnát, J.; Bouzek, K. Overview: State-of-the Art Commercial Membranes for Anion Exchange Membrane Water Electrolysis. J. Electrochem. Energy Convers. Storage 2021, 18, 024001. [Google Scholar] [CrossRef]
  44. El-Emam, R.S.; Ozcan, H.; Zamfirescu, C. Updates on promising thermochemical cycles for clean hydrogen production using nuclear energy. J. Clean. Prod. 2020, 262, 121424. [Google Scholar] [CrossRef]
  45. Horri, B.A.; Choolaei, M.; Chaudhry, A.; Qaalib, H. A highly efficient hydrogen generation electrolysis system using alkaline zinc hydroxide solution. Int. J. Hydrogen Energy 2019, 44, 72–81. [Google Scholar] [CrossRef]
  46. Rivard, E.; Trudeau, M.; Zaghib, K. Hydrogen Storage for Mobility: A Review. Materials 2019, 12, 1973. [Google Scholar] [CrossRef] [PubMed]
  47. von Colbe, J.B.; Ares, J.-R.; Barale, J.; Baricco, M.; Buckley, C.; Capurso, G.; Gallandat, N.; Grant, D.M.; Guzik, M.N.; Jacob, I.; et al. Application of hydrides in hydrogen storage and compression: Achievements, outlook and perspectives. Int. J. Hydrogen Energy 2019, 44, 7780–7808. [Google Scholar] [CrossRef]
  48. Sakintuna, B.; Lambaridarkrim, F.; Hirscher, M. Metal hydride materials for solid hydrogen storage: A review. Int. J. Hydrogen Energy 2007, 32, 1121–1140. [Google Scholar] [CrossRef]
  49. Sabihuddin, S.; Kiprakis, A.; Mueller, M. A Numerical and Graphical Review of Energy Storage Technologies. Energies 2014, 8, 172–216. [Google Scholar] [CrossRef]
  50. Costoya, X.; DeCastro, M.; Carvalho, D.; Arguilé-Pérez, B.; Gómez-Gesteira, M. Combining offshore wind and solar photovoltaic energy to stabilize energy supply under climate change scenarios: A case study on the western Iberian Peninsula. Renew. Sustain. Energy Rev. 2022, 157, 112037. [Google Scholar] [CrossRef]
  51. Zanuttigh, B.; Angelelli, E.; Kortenhaus, A.; Koca, K.; Krontira, Y.; Koundouri, P. A methodology for multi-criteria design of multi-use offshore platforms for marine renewable energy harvesting. Renew Energy 2016, 85, 1271–1289. [Google Scholar] [CrossRef]
  52. Bakhsh, T.T.; Monim, M.; Simpson, K.; Lapierre, T.; Dahl, J.; Rowe, J.; Spaulding, M.; Miller, J. Potential Earthquake, Landslide, Tsunami and Geo-Hazards for the U.S. Offshore Pacific Wind Farms. 2020. Available online: https://www.rpsgroup.com/imported-media/5565/potential-earthquake-landslide-tsunami-and-geohazards-for-the-us-offshore-pacific-wind-farms.pdf (accessed on 28 September 2022).
  53. Atlas of UK Marine Renewable Energy Resources. ABPmer. 2008. Available online: https://marine.gov.scot/data/atlas-uk-marine-renewable-energy-resources-2008-abpmer (accessed on 1 December 2021).
  54. Dalgic, Y.; Lazakis, I.; Turan, O. Vessel charter rate estimation for offshore wind O&M activities. In Developments in Maritime Transportation and Exploitation of Sea Resources; CRC Press: Boca Raton, FL, USA, 2013; pp. 899–907. [Google Scholar]
  55. Bhattacharya, S.; Amani, S.; Prabhakaran, A.; Macabuag, J. Hazard considerations in the vulnerability assessment of offshore wind farms in seismic zones. Earthq. Eng. Resil. 2022, 1, 88–109. [Google Scholar] [CrossRef]
  56. Beccario, C. earth.nullschool.net. 2022. Available online: https://earth.nullschool.net/about.html (accessed on 18 July 2022).
  57. Bir, G.S.; Lawson, M.J.; Li, Y. (Eds.) Structural Design of a Horizontal-Axis Tidal Current Turbine Composite Blade: Ocean Space Utilization, Ocean Renewable Energy; ASMEDC: New York, NY, USA, 2011; Volume 5. [Google Scholar]
  58. DiPippo, R. Geothermal Power Plants: Principles, Applications, Case Studies and Environmental Impact, 3rd ed.; Elsevier: Amsterdam, The Netherlands, 2012; 624p. [Google Scholar]
  59. Breede, K.; Dzebisashvili, K.; Liu, X.; Falcone, G. A systematic review of enhanced (or engineered) geothermal systems: Past, present and future. Geotherm. Energy 2013, 1, 4. [Google Scholar] [CrossRef]
  60. Cooper, A.; Garcia-Ibanez, J.; Gilbert, C.; Mack, S.; Mendiluce, X.M. A Methodology for a Decision Support Tool for a Tidal Stream Device: University of Strathclyde. 2014. Available online: https://www.esru.strath.ac.uk//EandE/Web_sites/13-14/Tidal/index.html (accessed on 1 December 2021).
  61. Yousefi, H.; Ehara, S.; Noorollahi, Y. (Eds.) Geothermal potential site selection using GIS in Iran. In Proceedings of the Thirty-Second Workshop on Geothermal Reservoir Engineering Stanford University, Standford, CA, USA, 22–24 January 2007. [Google Scholar]
  62. White, P. Site Selection for Geothermal Power Plants: Comprehensive Visualization of Geographical Data. 2021. Available online: https://www.dgi.com/blog/site-selection-geothermal-power-plants-comprehensive-visualization-geographical-data/ (accessed on 20 September 2022).
  63. Dugger, G.L.; Francis, E.J.; Avery, W.H. Technical and economic feasibility of Ocean Thermal Energy Conversion. Sol Energy 1978, 20, 259–274. [Google Scholar] [CrossRef]
  64. OpenStreetMap. Triton Knoll Offshore Wind Farm. 2024. Available online: https://en.wikipedia.org/wiki/Triton_Knoll#/map/0 (accessed on 15 February 2024).
  65. Craven, H. Decommissioning Programme for Triton Knoll Offshore Wind Farm. 2018. Available online: http://www.tritonknoll.co.uk/wp-content/uploads/2018/12/2505-TKN-CON-K-TA-0011_03_201812_TK-Decommissioning_consult.pdf (accessed on 1 October 2021).
  66. RWE. 2020. Available online: https://www.tritonknoll.co.uk (accessed on 2 December 2021).
  67. Plaxis. PLAXIS 3D Material Models Manual. 2019. Available online: https://communities.bentley.com/products/geotech-analysis/w/wiki/50826/manuals-archive---plaxis (accessed on 18 October 2022).
  68. da Silva, L.S.P.; Sergiienko, N.Y.; Cazzolato, B.; Ding, B. Dynamics of hybrid offshore renewable energy platforms: Heaving point absorbers connected to a semi-submersible floating offshore wind turbine. Renew. Energy 2022, 199, 1424–1439. [Google Scholar] [CrossRef]
  69. Rony, J.S.; Karmakar, D. Coupled Dynamic Analysis of Hybrid Offshore Wind Turbine and Wave Energy Converter. J. Offshore Mech. Arct. Eng. 2022, 144, 032002. [Google Scholar] [CrossRef]
  70. Arany, L.; Bhattacharya, S.; Macdonald, J.; Hogan, S.J. Design of monopiles for offshore wind turbines in 10 steps. Soil Dyn. Earthq Eng. 2017, 92, 126–152. [Google Scholar] [CrossRef]
Figure 1. Rendering of wind-wave co-located system.
Energies 17 01240 g001
Figure 2. A concept of hybrid system: wind turbine with current turbines sharing monopile [9].
Energies 17 01240 g002
Figure 3. The concept of a synergistic hybrid marine renewable energy harvest system.
Energies 17 01240 g003
Figure 4. Global mean wind speed map [12,13].
Energies 17 01240 g004
Figure 5. Marine energy resources [15].
Energies 17 01240 g005
Figure 6. Reference models: (a) RM1—tidal current turbine, (b) RM3—floating point absorber, and (c) RM4—ocean current turbine [16].
Energies 17 01240 g006
Figure 7. Proposed conceptual options for offshore geothermal energy production [21]. (a) Platform-based geothermal power plant where the geothermal fluids and re-injection fluids go through a pipeline from the seabed to the platform; (b) Land-based single-flash power plant and a separator located at the seabed; (c) Land-based binary power plant and a heat exchanger located at the seabed; (d) Underwater thermo-electricity power station.
Energies 17 01240 g007
Figure 8. Distribution of annual average temperature difference between 1000 m deep water and surface water [29].
Energies 17 01240 g008
Figure 9. Typical bottom fixed and floating foundations. (1) Suction bucket caisson, (2) gravity-based foundation, (3) monopile, (4) jacket on suction caisson, (5) jacket on monopile, (6) semi-submersible, (7) tension leg platform (TLP), (8) barge, (9) spar.
Energies 17 01240 g009
Figure 10. New foundations are either in use or proposed. Some examples: (a) asymmetric frame on suction caisson; (b) tetrapod/ tripod on shallow foundations; (c) twisted jacket; (d): helical monopiles; (e) winged piles; (f) collared monopile (caisson + monopile); (g) hybrid monopile with plate; (h) stiffened monopile (reproduced from [34]).
Energies 17 01240 g010
Figure 11. A schematic rendering of a mooring system for an ocean current device.
Energies 17 01240 g011
Figure 12. Common methods for electrical energy storage.
Energies 17 01240 g012
Figure 13. Production, storage, and utilization of hydrogen from green energy sources.
Energies 17 01240 g013
Figure 14. Electrical energy storage and utilization routes with hydrogen from marine RES technologies.
Energies 17 01240 g014
Figure 15. Comparison of selected energy storage technologies [41,48,49].
Energies 17 01240 g015
Figure 16. Flowchart showing hybrid platform design steps.
Energies 17 01240 g016
Figure 17. Location of Triton Knoll wind farm [64] (available under the Open Database License).
Energies 17 01240 g017
Figure 18. Detailed specifications of the analyzed hybrid platform configuration.
Energies 17 01240 g018
Figure 19. Target frequency diagram of Triton Knoll wind farm.
Energies 17 01240 g019
Figure 20. FEM model with deformed mesh for: (a) DLC 1; (b) DLC 5; (c) DLC 9.
Energies 17 01240 g020
Table 1. Main questions and the allocated scores for bottom-fixed foundation and floating foundation for site selection of offshore wind farms.
NumberDescriptionMaximum Score
Q.1Is the wind speed sufficient?(20, 20)
Q.2Is the ground profile suitable for this specific foundation type?(15, 10)
Q.3Is water depth suitable for the foundations type?(10, 10)
Q.4Is the region less prone to earthquakes and fault ruptures?(15, 10)
Q.5Is the location not protected as a Marine Protected Area (MPA) or Site of Special Scientific Interest (SSSI)? (10, 10)
Q.6Distance to ports for the access to install facilities(5, 5)
Q.7Distance to the national grid(5, 5)
Q.8There are no obstructions to the RADARs (5, 5)
Q.9There are no buried services around(5, 10)
Q.10Is the wave height excess to cause damage or the wave period close to system natural frequency?(5, 5)
Q.11Are there busy shipping routes?(5, 10)
Table 2. Main questions and the allocated scores for site selection of wave absorbers.
NumberDescriptionMaximum Score
Q.1Is the wave height sufficient and suitable?(70, 70)
Q.2Is the wave period suitable?(30, 30)
Table 3. Main questions and the allocated scores for site selection of tidal current turbines.
NumberDescriptionMaximum Score
Q.1Is the current speed above 0.5 m/s for consideration of energy production efficiency and below 6 m/s for structural stability? (60, 60)
Q.2Is the minimum water depth greater than 15 m? (40, 40)
Table 4. Main questions and the allocated scores for site selection of geothermal energy.
NumberDescriptionMaximum Score
Q.1 Are there volcanic rocks/volcanic mud in the area?(10, 10)
Q.2 Are there any active volcanoes in the region? (10, 10)
Q.3 Are there any active faults in the region? (10, 10)
Q.4Are there any hot springs in the area?(5, 5)
Q.5 Are there any reported geothermal direct-use applications in the locality?(5, 5)
Q.6 Can you drill a borehole 150 m below the ground level?(20, 20)
Q.7If any recorded subsurface temperature data are available, is the geothermal gradient above the average geothermal gradient (in excess of 30 °C/km)?(15, 15)
Q.8Can the reservoir produce above 75 °C fluids with flow rates in excess of 1000 L/minute?(15, 15)
Q.9Are there any offshore oil and gas platforms/offshore wells/pipelines available that could be potentially repurposed for geothermal applications?(10, 10)
Table 5. Main questions and the allocated scores for site selection of Ocean Thermal Energy Storage (OTEC).
NumberDescriptionMaximum Score
Q.1 Is the annual average temperature difference between the ocean surface and water at 1 km depth in excess of 18 °C? (70, 70)
Q.2 Is it possible to integrate other thermal energy resources (i.e., solar/geothermal) to enhance the thermodynamic performance of the OTEC plant?(10, 10)
Q.3 Are there nearby hydrogen/ammonia production plants? (10, 10)
Q.4Are there other demanding applications in the locality, such as heat, desalination, and chemical/metal production?(10, 10)
Table 6. Main questions and the allocated scores for site selection for hydrogen generation.
NumberDescriptionMaximum Score
Q.1Is it close to the shoreline? (25, 25)
Q.2Is there a transport route available? (25, 25)
Q.3Is there fresh water available or a desalination facility available? (25, 25)
Q.4Is the significant wave height not so excessive?(25, 25)
Table 7. Soil profile and properties of Triton Knoll wind farm [65,66].
Layer DepthSoil TypeSu (kPa)φ’ (°)Gmax (MPa)γ’ (kN/m3)
0–10 mSlightly sandy and gravelly clay200N/a6010
10–23 mSlightly fine to coarse sandN/a355510
23–47 mSandy clay250N/a7510
47–58White chalk300N/a9010
Table 8. Wave data for Triton Knoll wind farm [65,66].
Site IDDominant Wave Direction (°N)Most Frequent Wave Height (m) and % of Total RecordMaximum Hs (m) and Associated Direction (°N)Most Frequent Tm (s) and % of Total RecordTp (s) and Associated Hs (m)
107 (d1 and d2)345–150.0–0.5
(39%)
2.0–2.5
(345–15)
4.0–4.5
(30%)
8.5–9.0
(0.0–0.5)
MN345–150.5–1.0
(41%)
2.0–2.5
(165–195)
4.5–5.0
(30%)
8.0–8.5
(0.0–0.5)
SW15–450.0–0.5
(49%)
2.0–2.5
(165–195)
4.5–5.0
(33%)
7.5–8.0
(0.0–0.5)
SW345–150.0–0.5
(41%)
2.0–2.5
(345–15)
4.5–5.0
(34%)
Recording error
Table 9. Scoring matrix results for the foundation selection of offshore wind turbines.
NumberParameter (Maximum Scores)Wind Energy and Foundation Decision Making
Bottom Fixed WTFloating WT
Type of FoundationGBSMonopileJacketSpar BuoyBargeTLP
1.1Is the wind speed sufficient? (20, 20)202020202020
1.2Is the ground profile suitable for this specific foundation type? (15, 10) 151515101010
1.3Is water depth suitable for the foundations mentioned? (10, 10)0105000
1.4Is the region less prone to earthquakes and fault ruptures? (15, 10)151515101010
1.5Is the location not protected as a Marine Protected Area (MPA) or Site of Special Scientific Interest (SSSI)? (10, 10)101010101010
1.6Distance to ports for the access to install facilities (10, 10)555555
1.7Distance to the national grid (5, 5)555555
1.8There are no obstructions to the RADARs (5, 5)555555
1.9There are no buried services around (5, 10)555101010
1.10Is the wave height excess to cause damage or is the wave period close to system natural frequency? (5, 5)555555
1.11Are there busy shipping routes? (5, 10)555101010
Decision-making score (main matrix) 90%100%95%90%90%90%
Table 10. Scoring matrix results for WEC, tidal current turbines, geothermal energy, and hydrogen production.
Wave Energy Converter (WEC)Awarded Score
2.1Is the wave height sufficient and suitable? (70, 70)70
2.2Is the wave period suitable? (30, 30)30
Decision-making score (local matrix)100%
Tidal Current TurbinesAwarded score
3.1Is the current speed above 0.5 m/s for consideration of energy production efficiency and below 6 m/s for structural stability? (60, 60)60
3.2Is the minimum water depth greater than 15 m? (40, 40)40
Decision-making score (local matrix)100%
Geothermal EnergyAwarded score
4.1Are there volcanic rocks/volcanic mud in the area? (10, 10)0
4.2Are there any active volcanoes in the region? (10, 10)0
4.3Are there any active faults in the region? (10, 10)0
4.4Are there any hot springs in the area? (5, 5)0
4.5Are there any reported geothermal direct-use applications in the locality? (5, 5)0
4.6Can you drill a borehole 150 m below the ground level? (20, 20)20
4.7If any recorded subsurface temperature data are available, is the geothermal gradient above the average geothermal gradient (in excess of 30 °C/km)? (15, 15)0
4.8Can the reservoir produce above 75 °C fluids with flow rates in excess of 1000 L/minute? (15, 15)0
4.9Are there any offshore oil and gas platforms/offshore wells/pipelines available that could be potentially repurposed for geothermal applications? (10, 10)10
Decision-making score (local matrix)30%
Ocean Thermal Energy Storage (OTEC)Awarded score
5.1Is the annual average temperature difference between the ocean surface and water at 1 km depth in excess of 18 °C? (70, 70)0
5.2Is it possible to integrate other thermal energy resources (i.e., solar/geothermal) to enhance the thermodynamic performance of the OTEC plant? (10, 10)10
5.3Are there nearby hydrogen/ammonia production plants? (10, 10)0
5.4Are there other demanding applications in the locality, such as heat, desalination, and chemical/metal production? (10, 10)10
Decision-making score (local matrix)20%
Hydrogen EnergyAwarded score
6.1Is it close to the shoreline? (25, 25)25
6.2Is there a transport route available? (25, 25)25
6.3Is there fresh water available or a desalination facility available? (25, 25)25
6.4Is the significant wave height not so excessive? (25, 25)10
Decision-making score (local matrix)85%
Table 11. Properties of the modeled turbine and foundation.
Input ParameterSymbolUnitValue
Mass of RNAmRNAtons534
Hub heightLTm104.8
Tower bottom diameterDbm6.7
Tower top diameterDtm4.5
Average wall thicknessTtm0.04
Tower Young’s modulusETGPa210
Tower weightmTtons558
Monopile diameterDPm6.7
Monopile embedment depthLpm30.0
Monopile wall thicknessTPm0.075
Monopile Young’s modulusEPGPa210
Circular beam diameterDbm0.457
Circular beam thicknessTbmm40
Circular beam lengthLbm10
Outer and inner diameter of hydrogen production platform-m16.7/6.7
Table 12. Loads for the FEM modeling.
ConsiderationsAbbreviationQuantity
ULS WindWind5.08 MN
ULS WaveWave3.618 MN
Self-Weight of Beams Connecting Tidal Current TurbinesSTSteel section with the unit weight of 78.5 kN/m3
Force on Tidal Current TurbinesFT60 kN
Self-Weight of Beams Connecting Wave Point AbsorbersSWSteel section with the unit weight of 78.5 kN/m3
Force on Wave Point AbsorbersFW60 kN
Hydrogen Energy PlatformHEP20 kPa
Table 13. Key outputs from the FEM modeling of scenarios (i) and (ii).
DLCLoad ConfigurationPile Head Lateral Displacement (m)Maximum Displacement of Steel Beam (m)Tower Top Lateral Displacement (m)Natural Frequency (f1)-Hz
1Wind+Wave0.168-2.6520.217
2Wind+Wave+ST+SW0.16840.2552.6520.218
3Wind+Wave+ST+SW+FT0.16890.2672.6550.220
4Wind+Wave+ST+SW+FW0.16900.2402.6530.220
5Wind+Wave+ST+ SW+FW+FT0.16900.2802.6540.223
Table 14. Key outputs from the FEM modeling of scenario (iii).
DLCLoad ConfigurationPile Head Lateral Displacement (m)Maximum Displacement of Steel Beam (m)Tower Top Lateral Displacement (m)Natural Frequency (f1)-Hz
6Wind+Wave+ST+SW+HEP0.16670.2182.6370.227
7Wind+Wave+ST+SW+HEP+FT0.16670.2412.6370.229
8Wind+Wave+ST+SW+HEP+FW0.16730.2192.6400.229
9Wind+Wave+ST+SW+HEP+FW+FT0.16740.2412.6390.230
Disclaimer/Publisher’s Note: The statements, opinions and data contained in all publications are solely those of the individual author(s) and contributor(s) and not of MDPI and/or the editor(s). MDPI and/or the editor(s) disclaim responsibility for any injury to people or property resulting from any ideas, methods, instructions or products referred to in the content.

