Article

Measurement of Carbon Total Factor Productivity in the Context of Carbon–Electricity Market Collaboration: An Application of Biennial Luenberger Productivity Index

1
State Grid Anhui Electric Power Co., Ltd., Economic Technology Research Institute, Hefei 230061, China
2
School of Economics, Hefei University of Technology, Hefei 230601, China
3
State Grid Anhui Electric Power Co., Ltd., Hefei 230601, China
4
School of Management, Hefei University of Technology, Hefei 230601, China
*
Author to whom correspondence should be addressed.
Energies 2024, 17(5), 1219; https://doi.org/10.3390/en17051219
Submission received: 12 December 2023 / Revised: 21 February 2024 / Accepted: 22 February 2024 / Published: 4 March 2024
(This article belongs to the Special Issue The Extreme Climate, Electricity–Carbon Markets, and Digitalization)

Abstract

:
China’s industrial sector generally relies on electricity as its main source of energy, and industrial production can be affected if there are problems with the electricity supply. In order to deal with the uncertain electricity supply and achieve the “dual carbon” target, the industrial sector needs to take effective measures to enhance carbon total factor productivity (CTFP). We use the biennial Luenberger productivity index (BLPI) to try to provide strategies for low-carbon industrial development in China. The results indicate that the overall CTFP of China’s industrial sector showed an increasing trend from 2006 to 2019. Technology change was the main contributor to the change in CTFP, but fluctuations in efficiency change remained a challenge. Differences were observed between the light industry sector (LIS) and the heavy industry sector (HIS) in terms of changes in CTFP, with LIS showing more stable changes and HIS experiencing larger fluctuations. Most sub-sectors showed increased CTFP during the sample period. R&D investment and R&D personnel have a positive impact on CTFP, while energy structure is found to hinder CTFP. According to the research results of this study, we offer the corresponding policy implications. This study is the first to explore the balance between low-carbon goals and industrial production from the perspective of improving CTFP, providing a new viewpoint on the contributions of technological innovation to solving socio-economic issues.

1. Introduction

Climate change has been one of the hottest issues in recent years. Evidence shows that greenhouse gas emissions caused by human activities are closely related to climate change [1]. China has experienced unprecedented economic growth over the past few decades, but this has come at a high environmental cost. China’s carbon emissions in 2019 were 14.093 billion tons, accounting for about 27% of the total global carbon emissions [2]. The Chinese government has committed to peaking its carbon dioxide (CO2) emissions by 2030 and achieving carbon neutrality by 2060 [3]. To address this challenge, the Chinese government is working on a number of fronts, such as actively promoting low-carbon technology innovation [4] and exploring an emissions trading scheme [5]. In addition, the Chinese government has introduced the carbon market to the electricity sector, coupling it with the electricity market [6,7,8]. However, this coupling puts added pressure on the industrial sector, as it heavily relies on electricity consumption. Figure 1 shows the impact of carbon–electricity market collaboration on the industrial sector. As the price signal of the carbon market, the carbon price affects energy-intensive thermal electricity generators and energy-saving thermal electricity generators, respectively, which can eventually lead to a change in electricity supply in the electricity market by affecting profits. As the price signal of the electricity market, the price of electricity will affect the supply and demand of electricity [9]. Industrial production requires a large amount of electricity, so the unclear electricity supply situation will put industrial enterprises under a certain pressure in the production process. In the future, China’s carbon trading market will gradually cover all industries in the industrial sector. This means that industrial enterprises need to consider the additional costs of producing carbon emissions. Therefore, under the dual pressure of uncertain electricity supply and potential future carbon costs, it is necessary for the industrial sector to enhance carbon total factor productivity (CTFP).
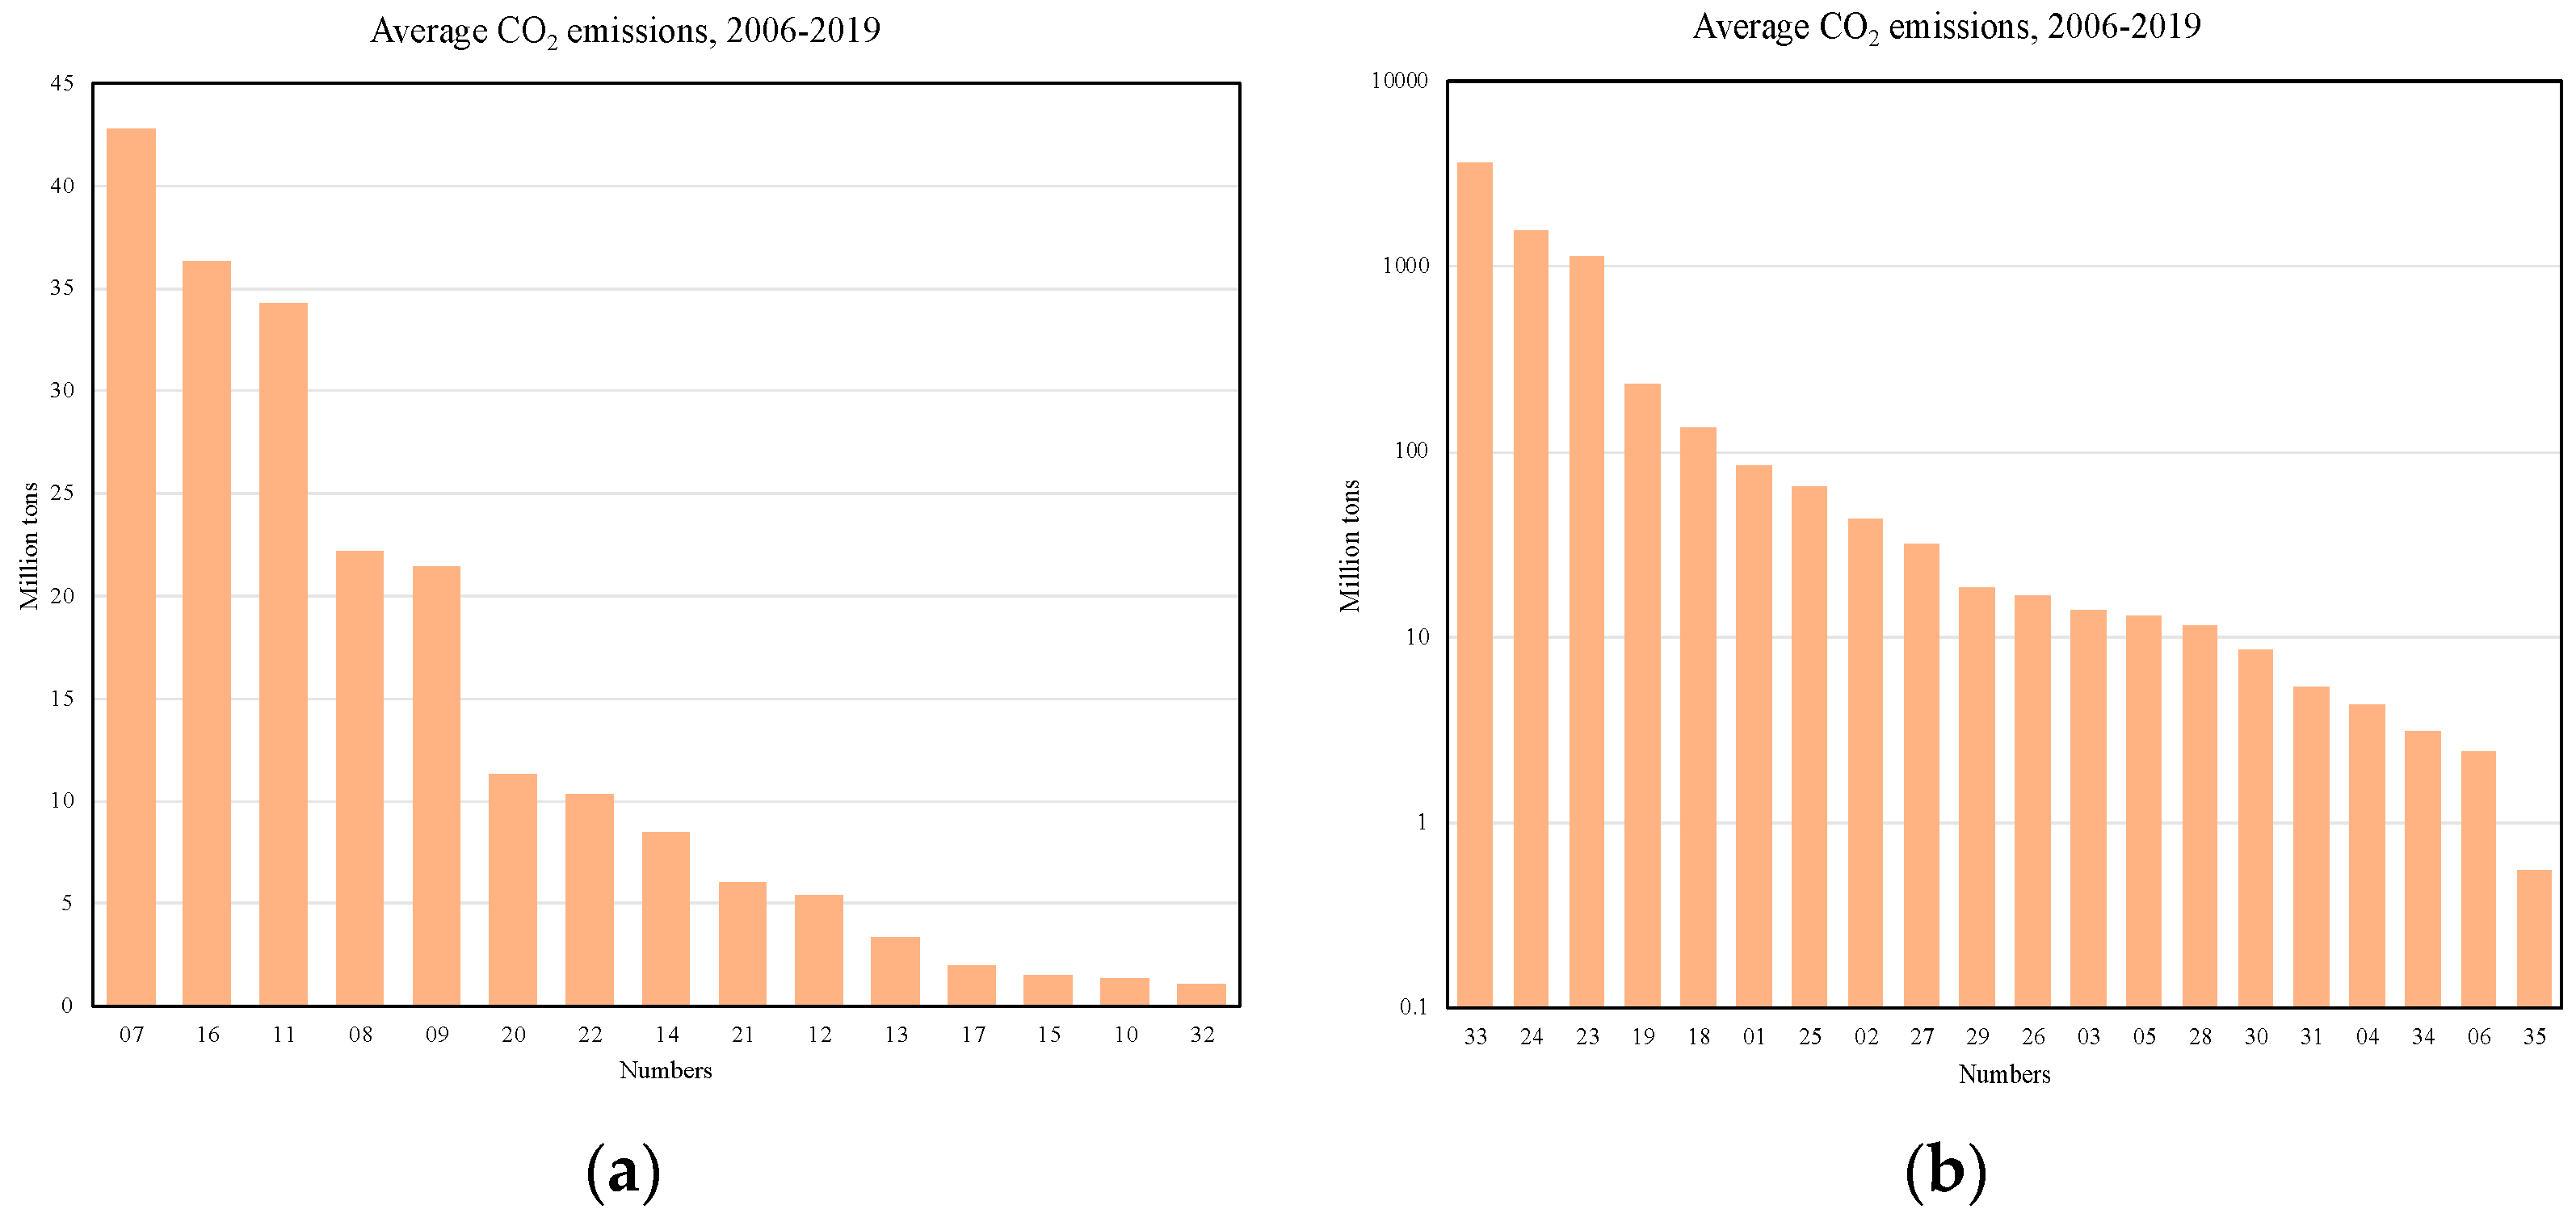
CO2 emissions from China’s industrial sector are the main source of China’s total CO2 emissions. China’s industrial sector accounts for about 40% of China’s total CO2 emissions and 70% of China’s total energy consumption [10]. In particular, the heavy industry sector, whose production methods are often characterized by high pollution and high CO2 emissions, has seriously hindered China’s efforts to protect the ecological environment and achieve carbon neutrality [11,12]. Therefore, measuring CTFP in the industrial sector and analyzing its influencing factors can help the Chinese government better evaluate the performance of carbon reduction in the industrial sector and provide targeted policy recommendations. At present, there has been a significant increase in energy demand and production in the industrial sector of China, leading to a corresponding rise in greenhouse gas emissions. Despite efforts to improve energy efficiency and reduce emissions through various policies and measures, such as the Law of the People’s Republic of China on Conserving Energy [13,14], China’s industrial sector still faces significant challenges in achieving carbon neutrality and reducing its environmental impact. The average CO2 emissions in each sub-sector are shown in Figure 2.
Total factor productivity (TFP) is a widely used measure of efficiency in economics [15,16,17], and CTFP has emerged as a promising metric to evaluate the environmental performance of industries [18]. CTFP reflects the ability of firms to produce more goods or services with fewer carbon emissions, which can help achieve both economic growth and carbon reduction goals. Despite the potential of CTFP, few studies have focused on its measurement in China’s industrial sector. Existing studies mainly use traditional CTFP measures, which cannot accurately assess its dynamic changes and have not clarified the possible influencing factors of CTFP. As such, this study aims to fill this research gap by estimating the CTFP of China’s industrial sector and identifying the factors that affect it.
The Malmquist index based on data envelopment analysis (DEA) has been widely used in the calculation of TFP [19,20]. Xue et al. [21] used the DEA Malmquist index to investigate productivity changes in the Chinese construction industry from 1997 to 2003. The results show that there is significant regional heterogeneity in the productivity of the construction industry in different regions. Lin et al. [22] assessed the economic performance of 31 Chinese provinces from 2005 to 2006 based on the Malmquist index. Sun et al. [23] used the Malmquist index to measure the efficiency of 24 resource-based cities in China and their changes. Wu et al. [24] measured the industrial utilization efficiency of 30 Chinese provinces from 2006 to 2009. It was found that the eastern region of China had the highest energy utilization efficiency. Li and Wu [25] studied the efficiency of financial support for the wind power industry in China from 2010 to 2014 using a sample of 30 listed companies in the wind power industry.
Unfortunately, the above application of the DEA Malmquist index does not take into account the impact of undesirable outputs such as greenhouse gases or air pollution on the actual efficiency. This is especially important in industrial processes. As desirable outputs are often accompanied by undesirable outputs (CO2, SO2, PM2.5, etc.), the industrial TFP is wrongly estimated [25,26,27]. Chung et al. [28] used the Malmquist–Luenberger (ML) index to assess the TFP of Swiss paper mills. They used the directional distance function (DDF) to increase the desired output while decreasing the undesired output, thus estimating the change in TFP more precisely. He et al. [29] used the ML index to evaluate the change in TFP of China’s steel industry from 2001 to 2008 and included waste gas, waste water, and solid waste generated in the production process as undesirable outputs in the analysis framework. The results show that TC is the main contributor to the growth of TFP. Fu et al. [30] studied the carbon emissions performance of Chinese cities from 2008 to 2016, taking 210 prefecture-level cities in China as research samples.
Although the ML index overcomes the Malmquist index, which does not take into account the undesirable output, it also creates some new problems. First and foremost, there may be infeasibility problems when using intertemporal DDF [31]. Second, the ML index is obtained from the geometric average of the two current ML indexes, so its form is not transitive and cyclic [18]. Based on the ML index, On [32] proposed the global Malmquist–Luenberger (GML) productivity index. The GML index can effectively overcome the infeasible solution problems that may be caused by the ML index. In addition, since the GML index is a reference frontier that puts all the input/output data together to construct different periods, its results are also transitive and cyclic. Zhang et al. [33] used the GML index to evaluate the total factor energy efficiency of 30 provinces in China from 2003 to 2018. They found that the change in total factor energy efficiency in all provinces was relatively stable from 2003 to 2018, while technological progress showed an increasing trend. Li et al. [34] measured the environmental energy efficiency of the metal industry in 30 provinces of China through the GML index. The results showed that, although the environmental energy efficiency of the metal industry as a whole has increased, there are still gaps between different regions and different sub-sectors.
However, the GML index is not perfect. First, the GML index is based on ratios and does not reflect the difference. If one of the variables is close to zero, the productivity index may be biased. Secondly, with the addition of new samples, the efficiency value of decision-making units (DMUs) needs to be recalculated, which may cause the measured results to be less robust. Fujii et al. [35] proposed the Luenberger index, constructed based on the non-radial directional distance function (NDDF). The Luenberger index is based on the difference and can solve the problem of bias near 0. Therefore, this study uses the measurement method of Zhou et al. [36] and introduces biennial technology to construct BLPI. This study sets the scenario in China’s industrial sector and uses the BLPI to measure the CTFP, EC, and TC of each industrial sub-sector.
The objective of this study is to measure the CTFP of China’s industrial sector, examine its influencing factors, and try to answer the following research questions:
Rq1: what is the changing trend of CTFP in China’s industrial sector?
Rq2: what is the main contributor to CTFP change?
Rq3: is there heterogeneity in CTFP change between the light industry sector and the heavy industry sector?
Rq4: which factors will affect CTFP?
This study contributes to the existing literature as follows: (1) This study measures the change in CTFP in China’s industrial sector using the biennial Luenberger productivity index (BLPI) and sheds light on the driving forces of CTFP from the perspective of factor decomposition. The conclusions of this study not only enrich the literature related to energy economics and low-carbon development but also offer strong empirical evidence for policy making. (2) This study considers the between-group heterogeneity between the light industrial sector and the heavy industrial sector and measures the productivity gap index (PGI), the technical change gap (TCG), and the efficiency change gap (ECG) on this basis. (3) This study further discusses the factors that may have an impact on CTFP, viewpoints not yet tested in the literature.
The rest of the paper is organized as follows. Section 2 describes the data and methodology used in this study. Section 3 presents the measurement results and analyzes the factors that affect CTFP. Section 4 concludes the paper and discusses policy implications.

2. Methodology and Data

2.1. BNDDF

Consider that there are N subsectors in China’s industrial sector, which can also be called DMUs. Each sub-sector obtains its main business income by utilizing capital, labor, and energy to produce, but at the same time also emits CO2 that is unexpected to be produced. The production possibility set P t can be described in Equation (1):
P t = K t , L t , E t , Y t , C t ( K t , L t , E t   c a n   p o d u c e   ( Y t , C t )
The environmental technology of the above N DMUs can be described in Equation (2) [37]:
P t = K t , L t , E t , Y t , C t : j = 1 J z j t K j t K t , j = 1 J z j t L j t L t , j = 1 J z j t E j t E t , J = 1 J z j t Y j t Y t , J = 1 J z j t C j t = C t , z j 0
Referring to the practice of Pastor et al. [38], this study combines the environmental technology P t of phase t and the environmental technology P t + 1 of phase t + 1 , representing biennial environmental technology. We combine the biennial environmental technology with the NDDF to construct the biennial non-radial directional distance function (BNDDF), which can be described in Equation (3):
D I B K t , L t , E t , Y t , C t ; g = β I B t = m a x   w L β I L B t + w K β I K B t + w E β I E B t + w Y β I Y B t + w C β I C B t
s . t .     i = 1 J z i t K i t + i = 1 J z i t + 1 K i t + 1 + β I K B t g I K t K I t i = 1 J z i t L i t + i = 1 J z i t + 1 L i t + 1 + β I L B t g I L t L I t i = 1 J z i t E i t + i = 1 J z i t + 1 E i t + 1 + β I E B t g I E t E I t     i = 1 J z i t Y i t + i = 1 J z i t + 1 Y i t + 1 β I Y B t g I Y t Y I t i = 1 J z i t C i t + i = 1 J z i t + 1 C i t + 1 + β I C B t g I C t = C I t z i 0 ,   f o r   i = 1,2 , J , β I L B t , β I K B t , β I E B t w Y β I Y B t , β I C B t 0
In Equation (3), B represents the biennial technology, g = ( g K , g L , g E , g Y , g C ) is the direction vector, which identifies the direction of the increase or decrease in desirable output and undesirable output. w = ( ) Τ is the weight of each element, and the weight sum is 1. Based on the principle of equal weight distribution, the weight of one desirable output and one undesirable output is set to w = ( 1 / 9,1 / 9,1 / 9,1 / 3,1 / 3 ) Τ .

2.2. Measurement of CTFP and PGI

Referring to the method proposed by Zhou et al. [36], this study combines the BNDDF with the Luenberger index [39] to construct the BLPI. According to Equation (4), we can use the BLPI to measure the change in CTFP of each industrial sub-sector between periods t and t + 1 .
B L P I = D I B K t , L t , E t , Y t , C t ; g t D I B K t + 1 , L t + 1 , E t + 1 , Y t + 1 , C t + 1 ; g t + 1
Since B L P I = E C + T C , this study further decomposed the change of CTFP into technology change (TC) and efficiency change (EC). EC and TC can be calculated as follows:
E C = D I t K t , L t , E t , Y t , C t ; g D I t + 1 K t + 1 , L t + 1 , E t + 1 , Y t + 1 , C t + 1 ; g t + 1
T C = B L P I E C = D I B K t , L t , E t , Y t , C t ; g t D I t K t , L t , E t , Y t , C t ; g D I B K t + 1 , L t + 1 , E t + 1 , Y t + 1 , C t + 1 ; g t + 1 D I t + 1 K t + 1 , L t + 1 , E t + 1 , Y t + 1 , C t + 1 ; g t + 1
This study refers to the method of Fujii et al. [35] to decompose BLPI, TC, and EC at the factor level through the addition and subtraction characteristics of NDDF and the Luenberger index in order to distinguish the contribution of different driving factors for BLPI, TC, and EC. The decomposition of BLPI can be written as Equation (7). Similarly, the decomposition of EC and TC can be written as Equations (8) and (9).
B L P I = B L P I K + B L P I L + B L P I E + B L P I Y + B L P I C
E C = E C K + E C L + E C E + E C Y + E C C
T C = T C K + T C L + T C E + T C Y + T C C
Combined with the meta-frontier and considering the technological heterogeneity of different sub-sectors, 35 sub-sectors are grouped according to LIS and HIS. The meta-frontier consists of the efficiency frontier of LIS and the efficiency frontier of HIS. The productivity gap index (PGI) is defined by the BLPI calculated under the sector frontier (SBLPI) and the BLPI calculated under the meta-frontier (MBLPI). PGI can be defined as follows:
P G I = S B L P I M B L P I
Taking LIS as an example, PGI reflects the gap between the change of CTFP under the sector frontier of LIS and the change of CTFP under the meta-frontier from period t to period t + 1 . If P G I > 0 , it means that the growth rate of CTFP in LIS is faster than the overall growth rate of the industrial sector. Otherwise, it is slower than the overall growth rate of the industrial sector, and the same is true for HIS. The efficiency change index (SEC) and technology change index (STC) can be obtained under the sector frontier. The efficiency change index (MEC) and technology change index (MTC) can also be obtained under the meta-frontier. Equation (12) can be rewritten as follows:
P G I = S E C + S T C M B L P I = S E C + S T C M E C + M T C = S E C M E C + S T C M T C = E C G + T C G
Through Equation (11), this study can define the ECG and the TCG. TCG reflects the gap between the change of TC under the sector frontier and the change of TC under the meta-frontier from period t to period t + 1 , while ECG reflects the gap between the change of EC under the sector frontier and the change of EC under the meta-frontier from period t to period t + 1 . E C G > 0 indicates that the EC of the sector is faster than the overall growth rate of the industrial sector. T C G > 0 indicates that the TC of the sector is faster than the overall growth rate of the industrial sector.

2.3. Variables and Resources

In this study, the measurement of CTFP and the subsequent analysis of influencing factors needed to obtain data from several yearbooks and official websites. Based on the availability of data, we chose 2006–2019 as the sample period for the study because we could obtain relatively complete input, output, and influencing factor data during this period. We use the input and output data of 35 industrial sub-sectors during 2006–2019. The variables in this study are as follows:
(1) Net value of fixed assets (K). The data are obtained from the China Industry Statistical Yearbook (CISY). (2) Annual average number of employed persons (L). The data are obtained from the CISY. (3) Total energy consumption (E). The energy consumption data are derived from the China Energy Statistical Yearbook (CESY). (4) Desirable output. This study uses main business income (Y) to represent desirable output, which is obtained from the China Statistical Yearbook (CSY). (5) Undesirable output. In this study, total CO2 emissions (C) are regarded as the undesirable output of industrial production. CO2 emissions data are derived from CEADs.
It should be noted that, since the China Industrial Statistics Yearbook did not release the relevant data in 2017 and 2018, this study uses the China Economic Census Yearbook (CECY) and the statistical data of the National Bureau of Statistics of China as supplements. In addition, it is worth mentioning that there were some changes in the classification of industrial sub-sectors and the caliber of statistical data before and after 2011. This study refers to the latest catalogue of industrial sub-sectors in the CSY and excludes some industry data with inconsistent statistical caliber before and after, counting a total of 35 industrial sub-sectors.

3. Empirical Analysis and Discussion

3.1. Trend Analysis of CTFP in China’s Industrial Sector

Table 1 presents the descriptive statistics for this study and Abbreviations show more details.
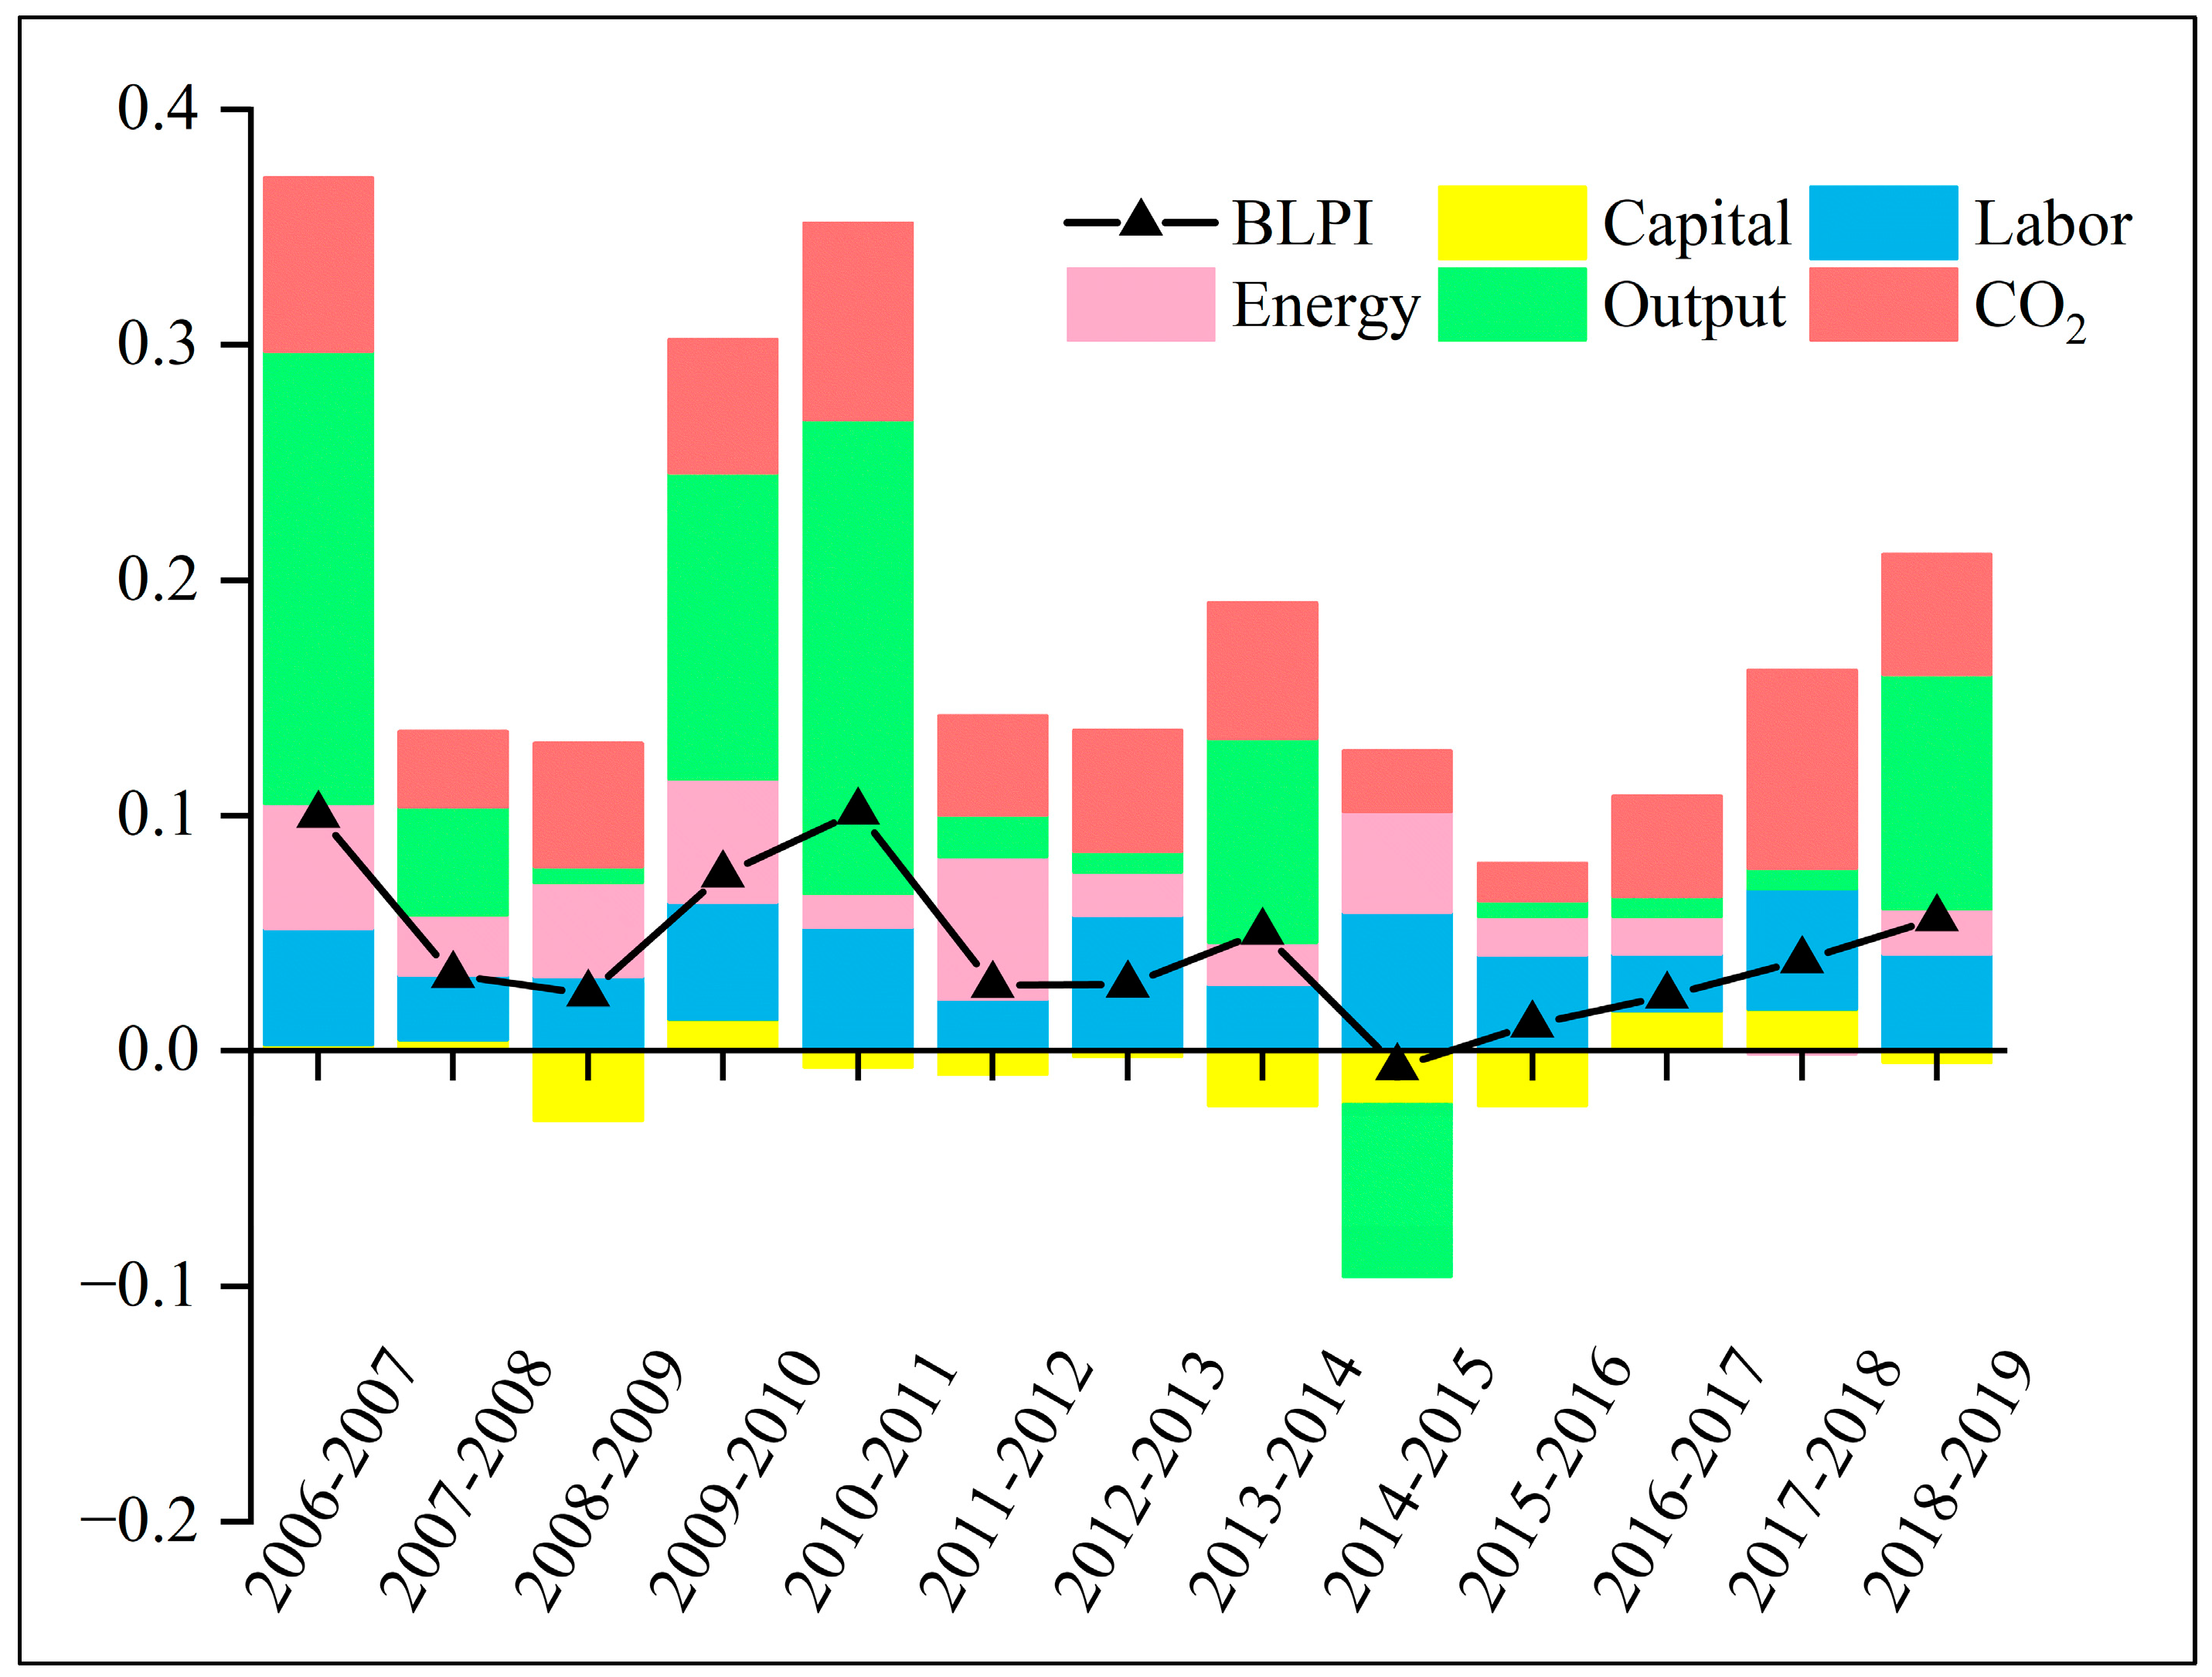
By calculating Equations (1)–(6), this study calculates the change in CTFP of each industrial sub-sector from 2006 to 2019. On this basis, the change of CTFP is decomposed into TC and EC. Then, by calculating Equations (7)–(9), the change is decomposed from the perspective of driving factors to distinguish the contribution of different input/output factors. In this section, we focus on the overall situation of China’s industrial sector, so we do not consider between-group heterogeneity. The average of the calculation results of 35 industrial sub-sectors is used to represent the overall level of China’s industrial sector, and the results are shown in Figure 3. It is not difficult to find that during 2006–2019, the CTFP of the industrial sector as a whole shows an upward trend. Referring to the “Five-year Plan” and policy layout of the Chinese government, this study roughly divides the sample period into three stages: 2006–2010, 2011–2015, and 2016–2019, which correspond to the “11th Five-Year Plan”, the “12th Five-Year Plan”, and the “13th Five-Year Plan” of the Chinese government.
From 2006 to 2011, CTFP showed a downward trend and then an upward trend. The main reason for the decline may be the impact of the 2008 international financial crisis, which was a heavy blow to the development of China’s industrial sector. From the factor point of view, BLPILabor and BLPIOutput contributed significantly less in 2007–2008 and 2008–2009, while BLPICapital even hindered productivity growth. On the one hand, China’s industrial growth fell sharply during the financial crisis, corporate profits shrank, and industrial investment slowed. On the other hand, the deteriorating business environment led some industrial enterprises to suspend production or close down, reducing employment, especially in the industrial enterprises along the southeast coast. Therefore, the Chinese government quickly formulated relevant policies to cope with the impact. Since November 2008, the Chinese government has implemented stimulus investment plans with the goal of expanding domestic demand and stabilizing growth, requiring local governments to make additional supporting investments. A considerable part of the investment has been used for infrastructure construction and industrial sector recovery. Stimulated by macroeconomic policies, more industrial enterprises have adapted to the changing environment and entered a benign state of operation. As can be seen from Figure 3, the change in CTFP in 2009–2010 increased significantly (BLPI = 0.075) and reached its highest value in 2010–2011 (BLPI = 0.102). BLPIOutput and BLPILabor recovered to levels before the financial crisis. In addition, BLPICO2 was also significantly improved. From 2011 to 2015, the change of CTFP showed a fluctuation decline and reached its lowest value in 2014–2015 (BLPI = −0.007 < 0). Two large drops occurred at the beginning and end of the period, respectively. The influence of BLPIOutput on CTFP was weakened and replaced by the comprehensive effect of various input/output factors. From 2016 to 2019, the change in CTFP in China’s industrial sector began to increase steadily, from 0.023 (2016–2017) to 0.056 (2018–2019). Regarding BLPICO2 and BLPILabor, due to the “13th Five-Year Plan” period, the Chinese government implemented the industrial efficiency catch-up plan focusing on six energy-intensive industries and supported 500 key energy-using units to carry out comprehensive energy efficiency improvement demonstrations.
It is worth noting that, except for the impact of unexpected events (financial crisis), the relative growth rate of CTFP tended to be lower at the end of the last “Five-Year Plan” or at the beginning of the next, e.g., 2011–2012 (BLPI = 0.028), 2014–2015 (BLPI = −0.007), and 2015–2016 (BLPI = 0.011). We need to pay attention to this “structural stall” in the transition period. Due to data availability, this study does not measure the CTFP after 2019, and it is impossible to know whether such a “structural stall” still existed at the end of the “13th Five-Year Plan” or the beginning of the “14th Five-Year Plan”. However, according to the existing calculation results, this structural stall did not appear in the early stage of the “13th Five-Year Plan”, indicating that the Chinese government was also aware of this problem and has made good progress in connecting the preceding and the following when carrying out the layout of the “13th Five-Year Plan”.
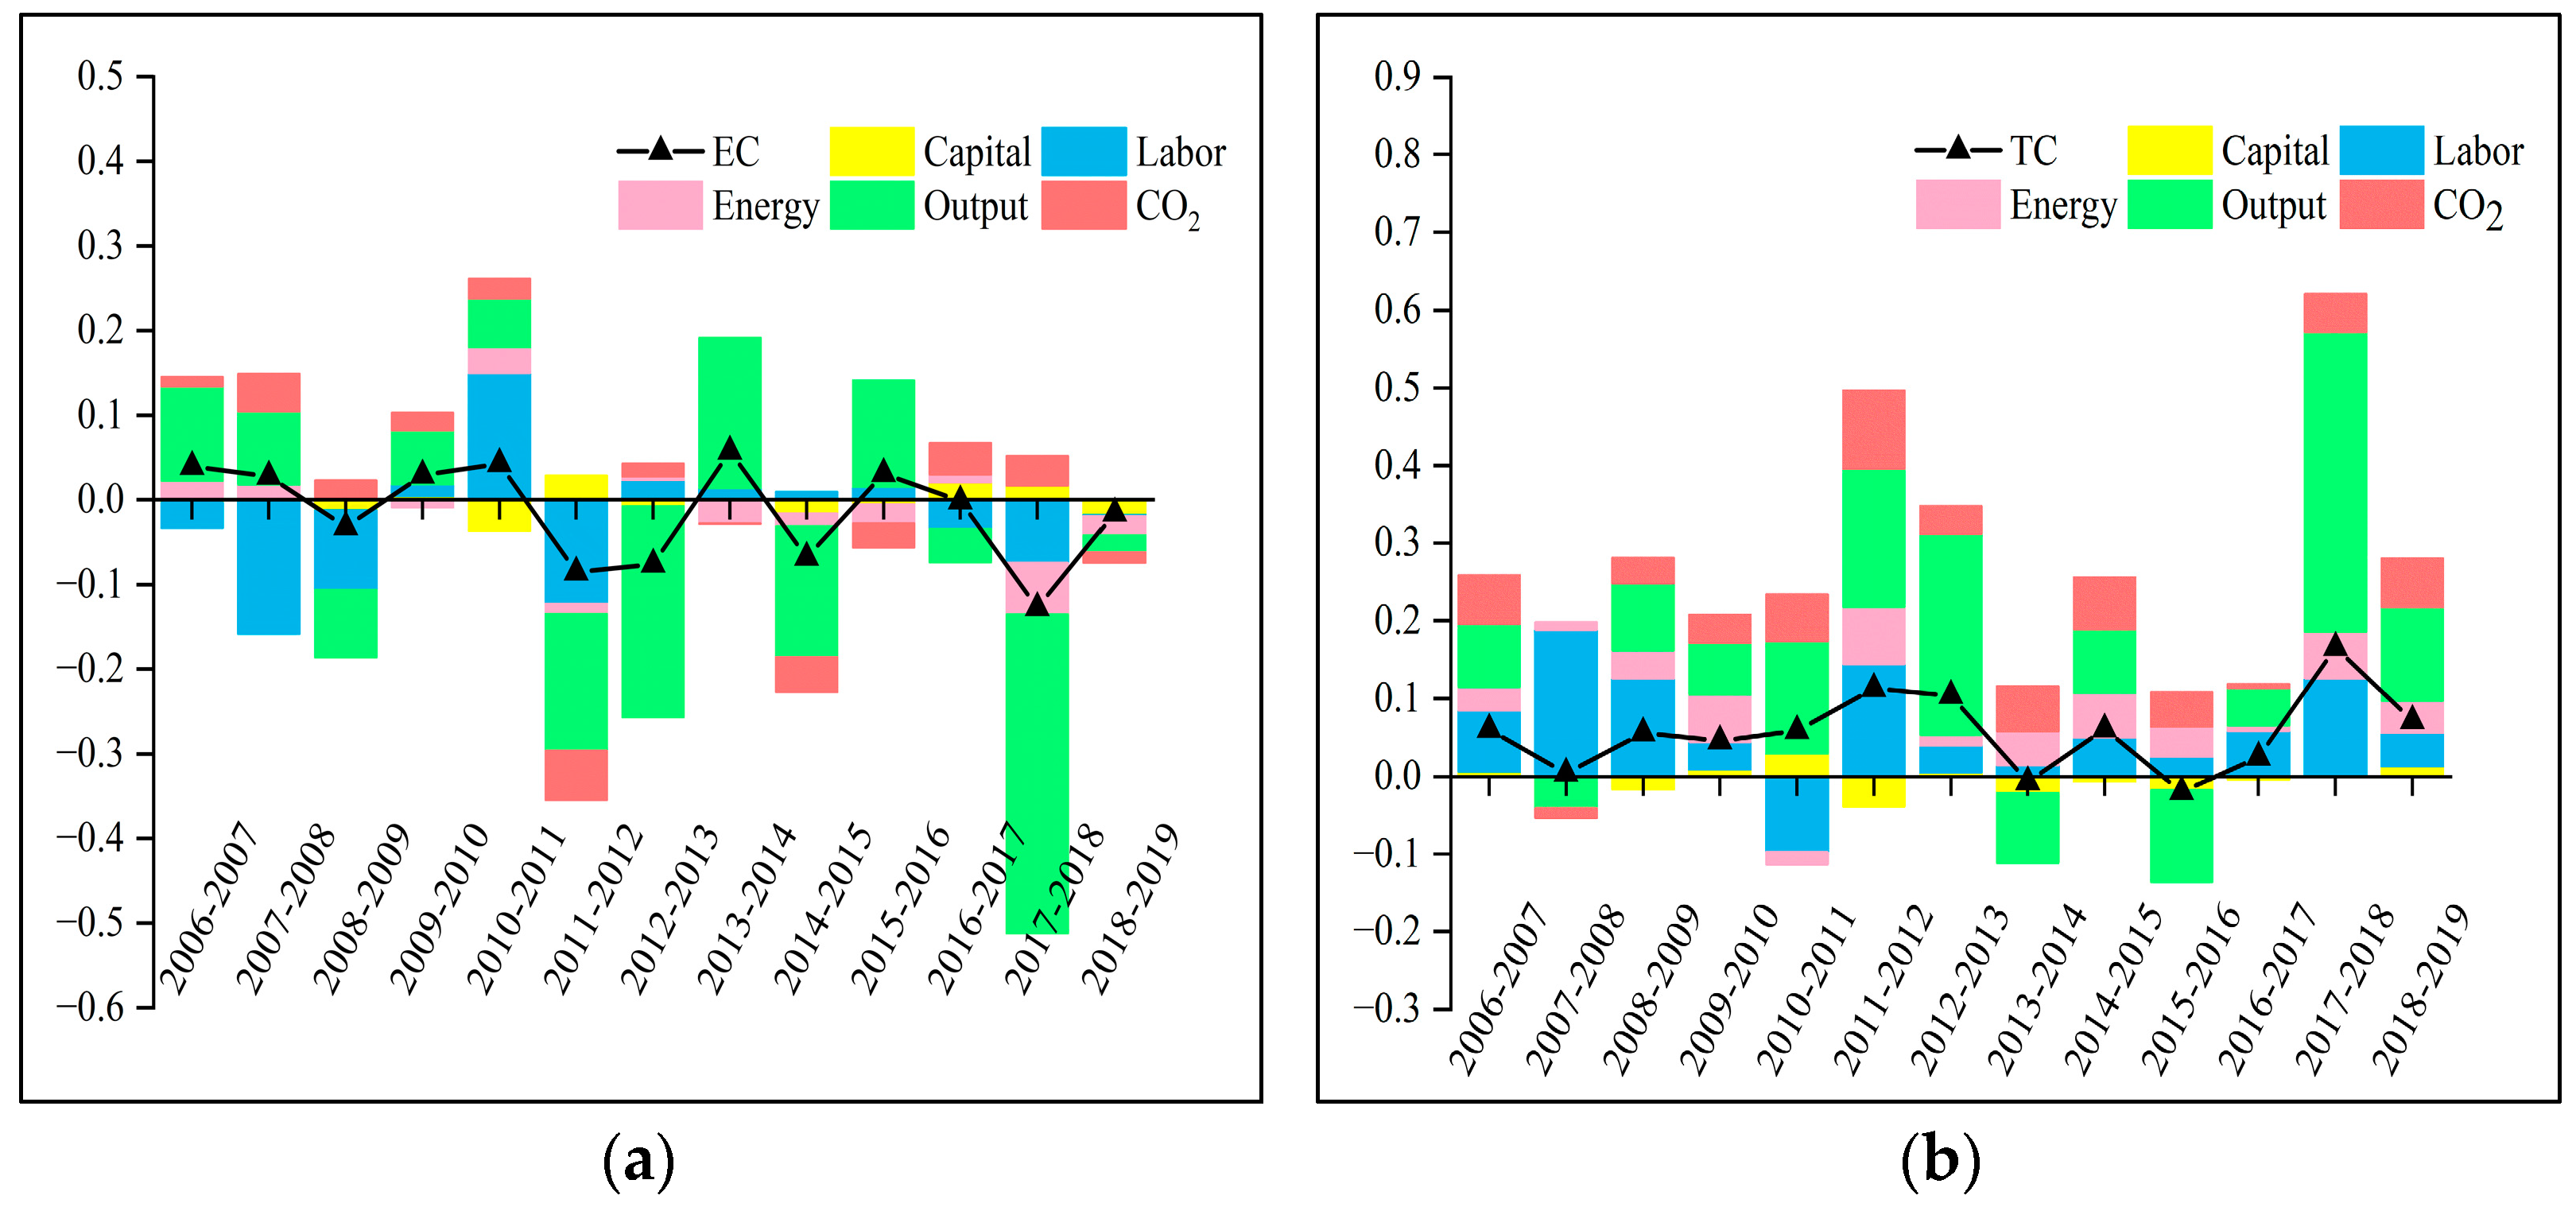
Figure 4a shows the EC and factor contributions from 2006 to 2019. During the sample period, the change in EC fluctuated greatly, and ECOutput determined the direction of EC. ECLabor had a great influence on EC at the beginning of the sample period, but with the adjustment of industry scale, the labor structure tended to improve. After 2012, the influence of ECLabor on the EC began to decrease. Figure 4b shows the TC and factor contributions from 2006 to 2019. The direction of TC and CTFP was relatively consistent, and the overall trend was also increasing, only in 2013–2014 (TC = −0.007 < 0) and 2015–2016 (TC = −0.020 < 0) showing a negative change. It is not difficult to find that TC was the main contributor to the change in CTFP. From the perspective of factor contribution, TCCapital and TCOutput hindered the low-carbon innovation of China’s industrial sector many times, which indicates that there may be more unsustainable production equipment in China’s industrial sector. Fortunately, TCEnergy and TCCO2 in the vast majority of the years regarding carbon emissions have a positive role in promoting CTFP, showing that the Chinese government in the recent ten-year investment in low-carbon technology has obtained a certain reward. As early as during the financial crisis, stimulative fiscal policies made some investments for carrying out technical research and the development of energy saving and emissions reduction.

3.2. Trend Analysis of CTFP in the Sector Frontier

In Section 3.1, we do not consider the heterogeneity between LIS and HIS, and directly measure the CTFP, TC, and EC under the meta-frontier and carry out factor-level decomposition. In fact, there are clear technical differences between different industries. There have been many studies confirming the existence of technological differences between LIS and HIS in China [40,41]. In this section, we group 35 industrial sub-sectors according to LIS and HIS and show the relevant empirical results. Among them, LIS includes 15 sub-sectors, and HIS includes 20 sub-sectors.
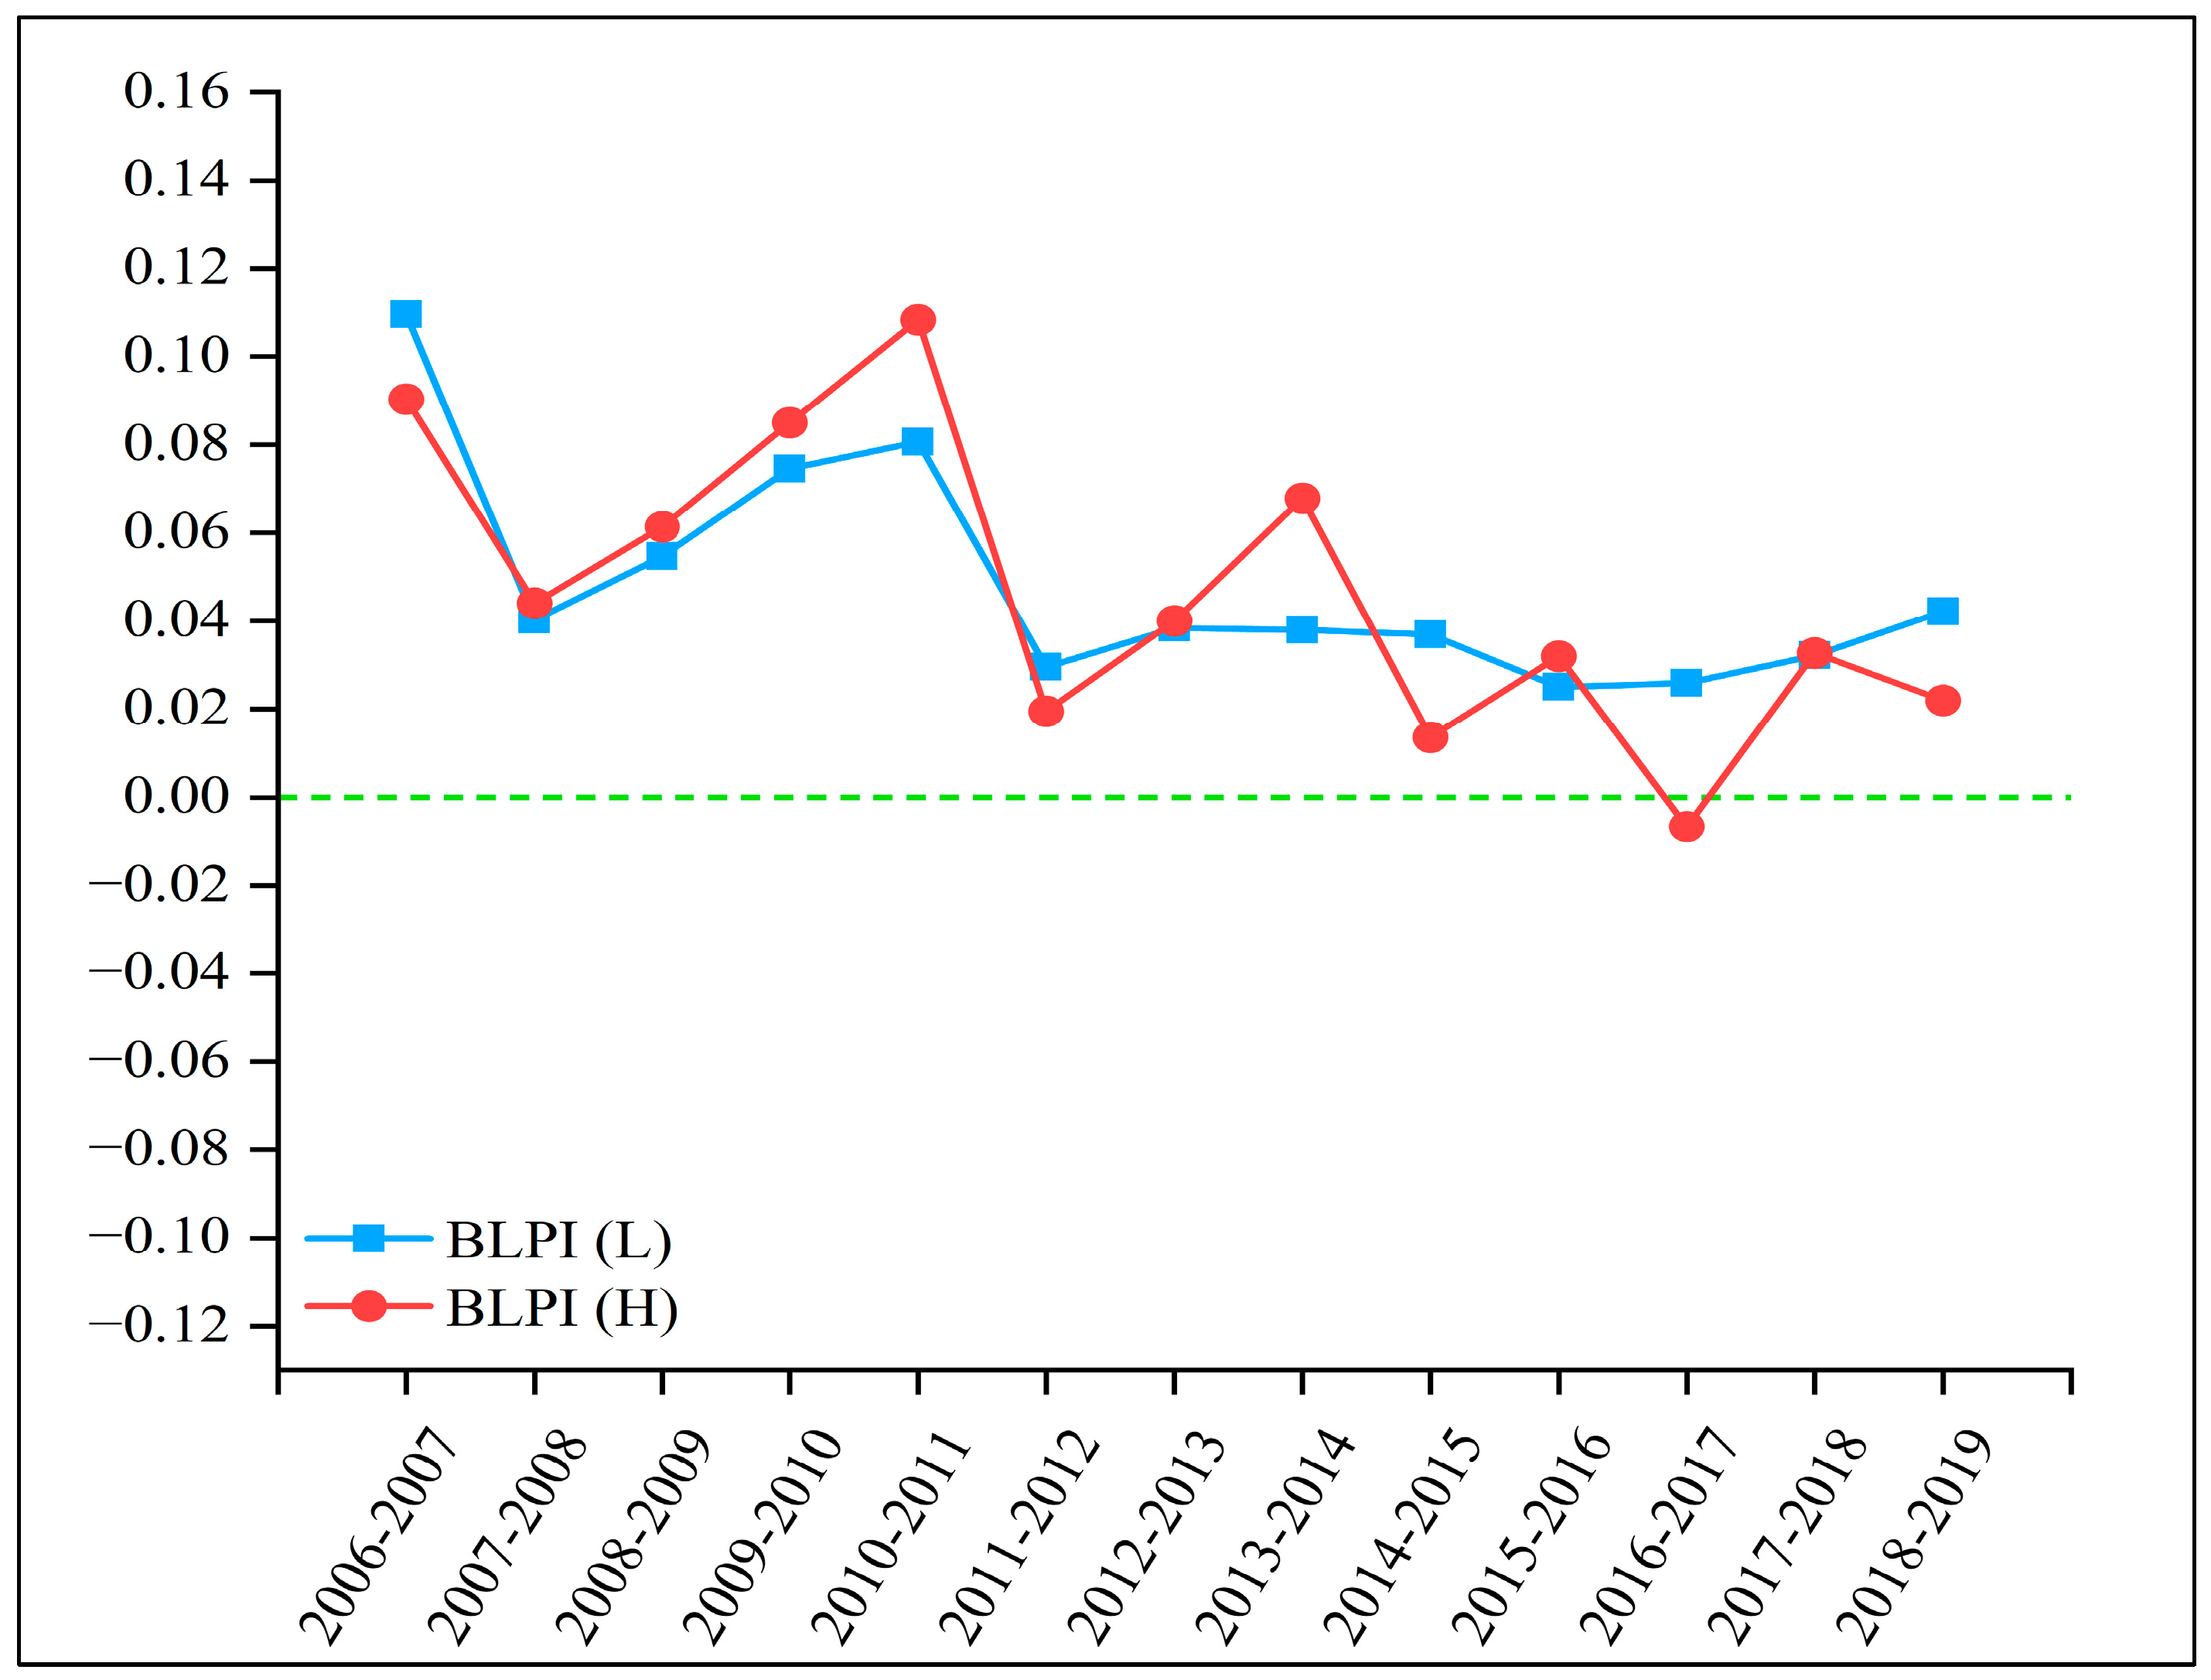
Figure 5 shows the calculation results and decomposition of the change in CTFP under the sector frontier. The change in CTFP in LIS and HIS is basically consistent with the calculated results in Section 3.1. Specifically, the CTFP of LIS showed an increasing trend from 2006 to 2009. The CTFP of HIS increased significantly in 2006–2016 and 2017–2019, with a decrease only in 2016–2017 (BLPI = −0.007 < 0). Both sectors showed relatively large declines in 2007–2008 and 2011–2012, which may be due to the impact of the financial crisis and the adjustment of the policy transition period we mentioned in Section 3.1. However, compared with HIS, the change performance of LIS was more stable, and the fluctuation range of HIS was larger. Figure 6 shows the calculation results and decomposition of the change of EC and TC under the sector frontier. It is worth mentioning that the direction of TC and EC in HIS tended to be consistent as a whole, while the trend of TC and EC in LIS was opposite, which further verifies the conjecture of technological heterogeneity between LIS and HIS. By calculating Equations (10) and (11), this study calculates the PGI, TCG, and ECG.
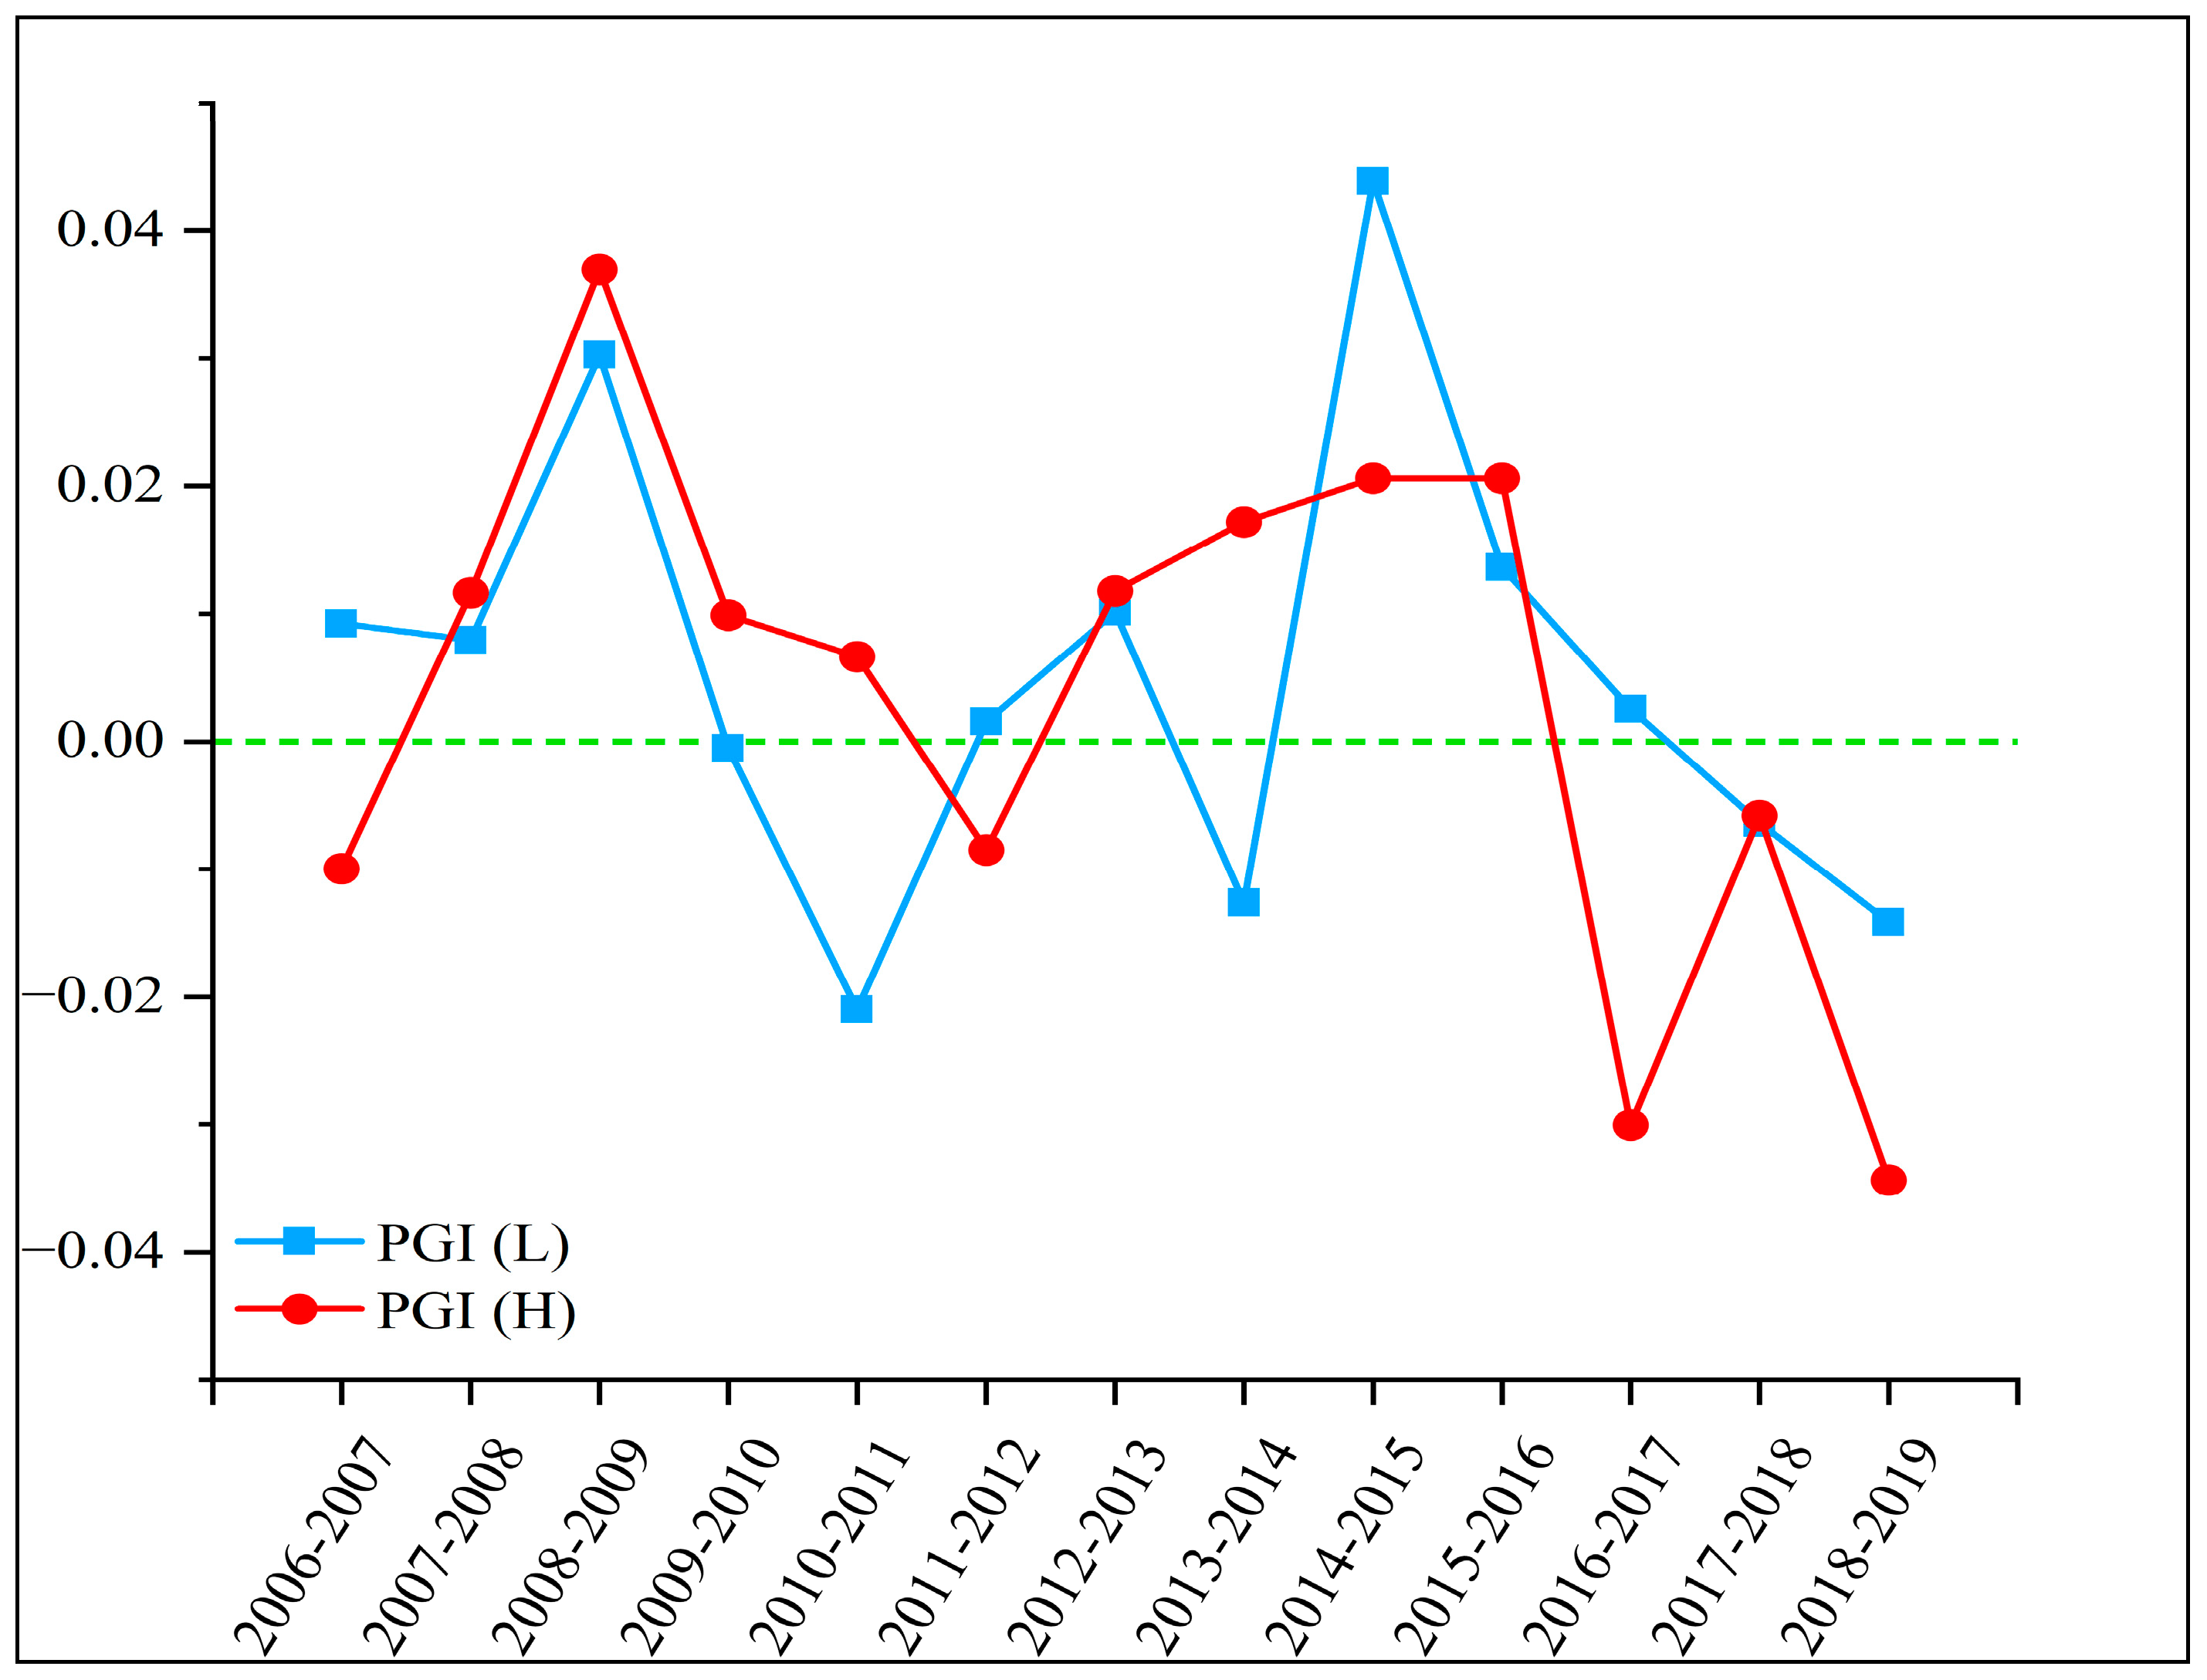
Figure 7 shows the PGI between LIS and HIS from 2006 to 2019. In 2006–2007, the growth rate of LIS was faster than that of the overall industrial growth rate, while HIS lagged behind. From 2007 to 2016, the CTFP of HIS improved significantly. Except for 2011–2012, the growth rate of HIS was faster than the overall industrial growth rate in other periods. The PGI of LIS fluctuated greatly, but it was still faster than the overall growth rate in most years. Among them, HIS grew faster than LIS in most years. From 2016 to 2019, the growth rate of LIS and HIS decreased significantly. The growth rate of LIS was faster than the overall industrial growth rate only from 2016 to 2017, while the growth rate of HIS lagged behind the overall industrial growth rate.
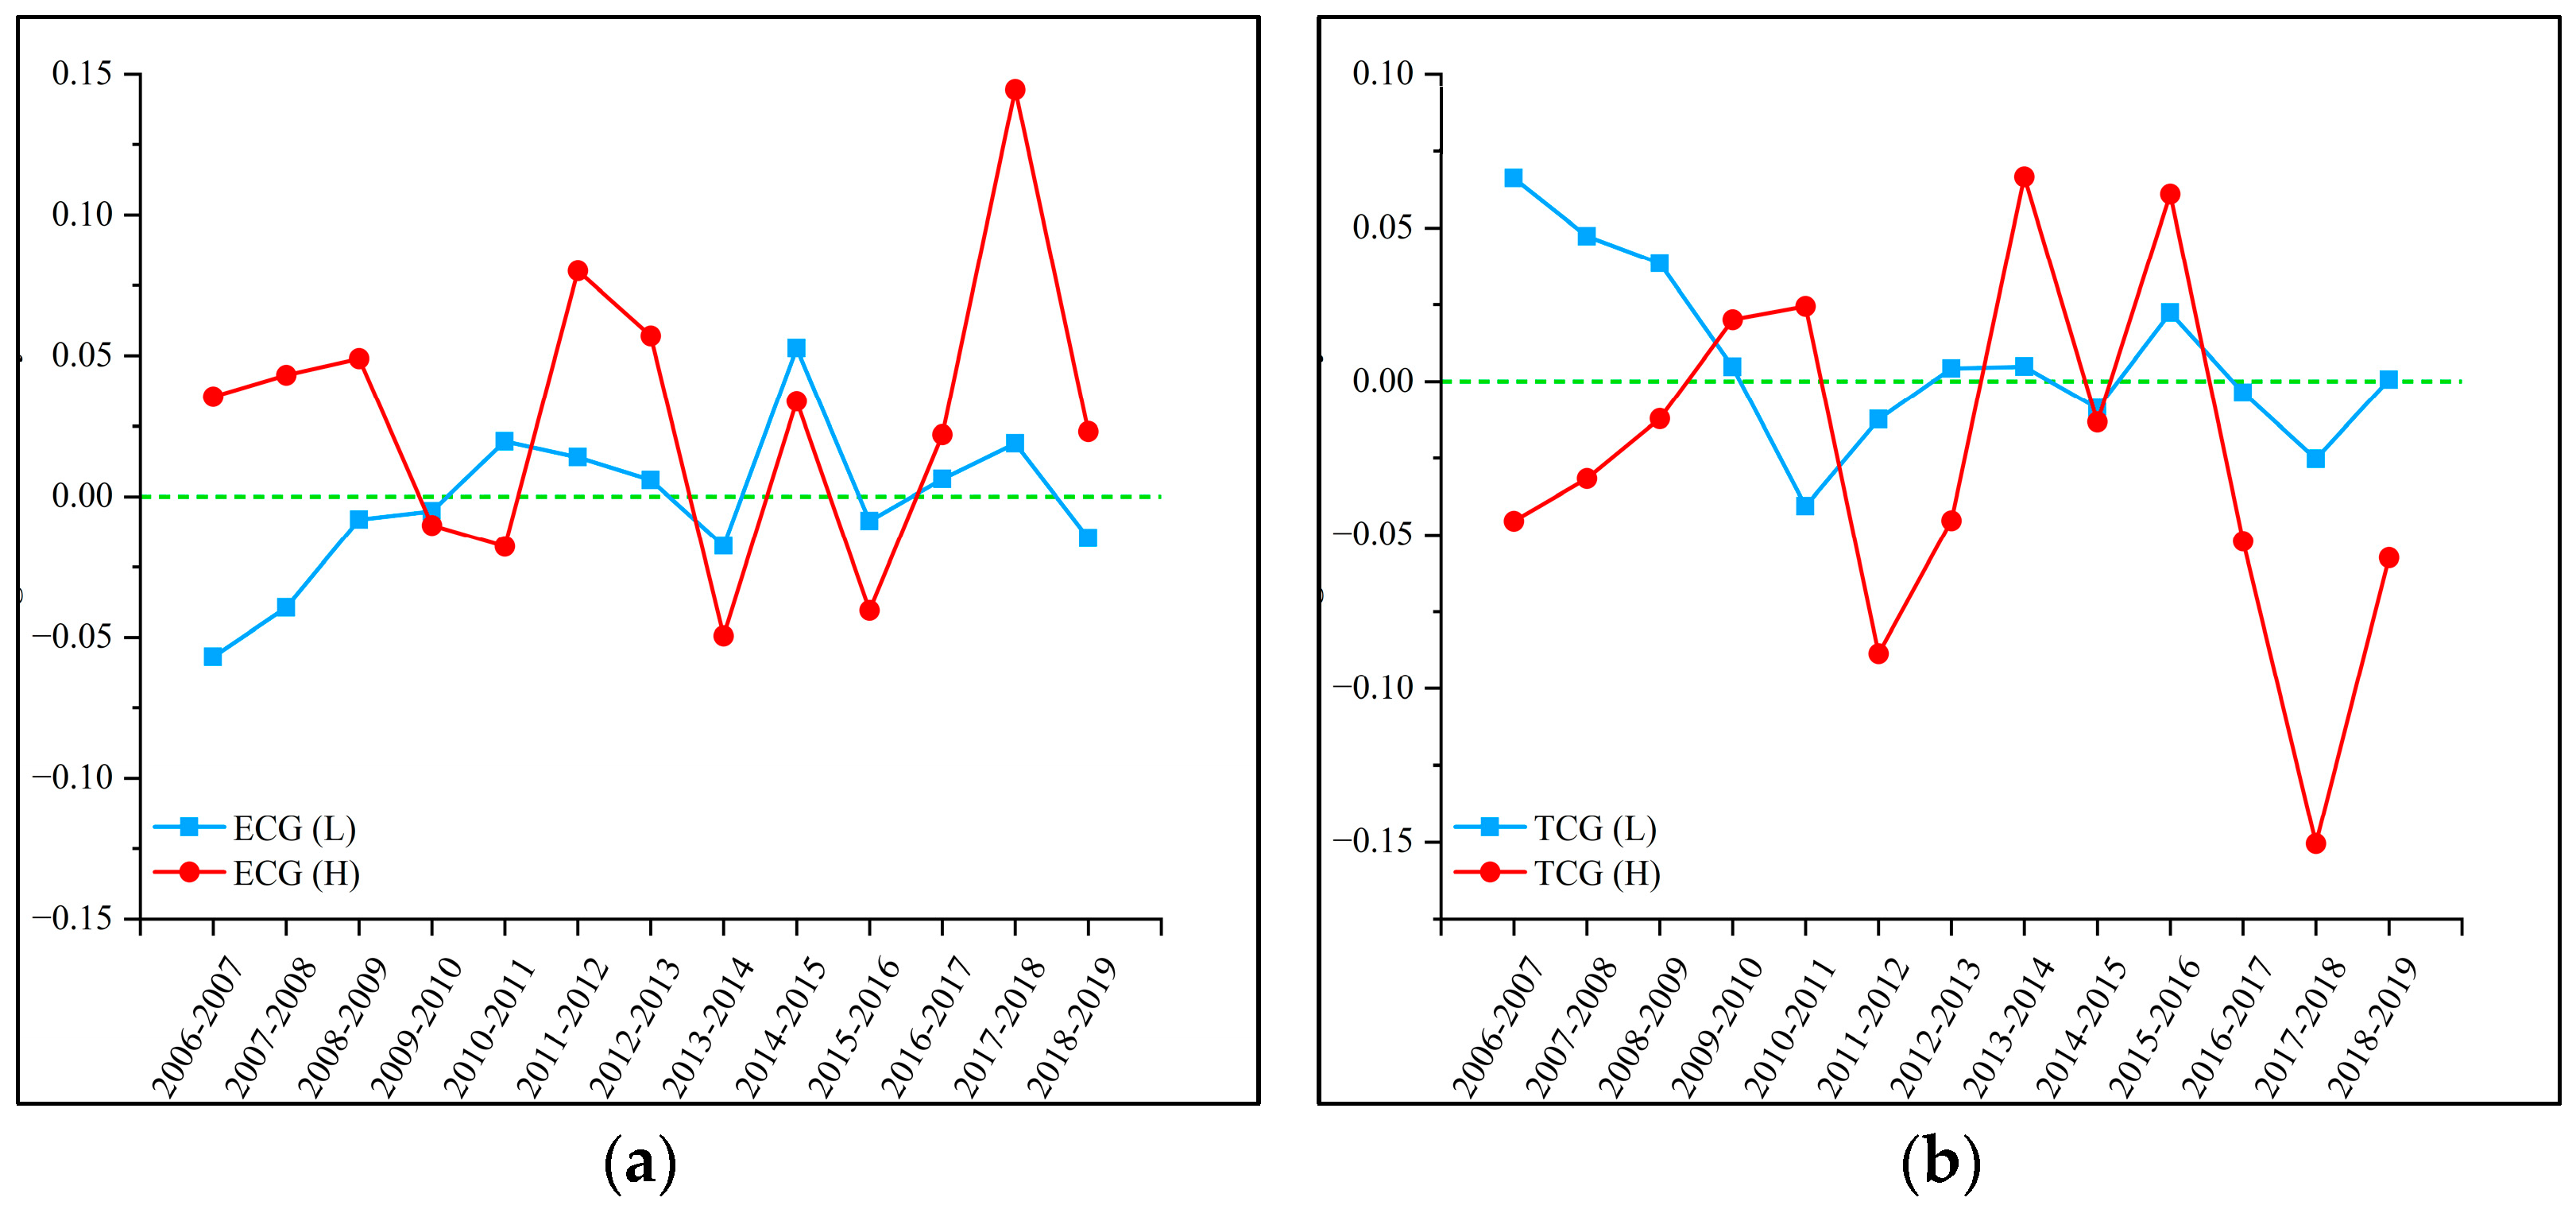
Figure 8a,b show the ECG and TCG of LIS and HIS from 2006 to 2019, respectively. It is interesting that the two showed opposite situations. For example, from 2006 to 2009, the low-carbon technology innovation of LIS was better than that of the overall industrial sector, while the low-carbon innovation technology of HIS lagged behind that of the overall industrial sector. However, in terms of energy conservation and emissions reduction efficiency, the opposite was true. Similar characteristics were also observed in other periods. This means the Chinese government has had some problems with the relevant overall planning work. Whether it is LIS or HIS, low-carbon technology innovation and improving efficiency are of the utmost importance.

3.3. Trend Analysis of CTFP in Each Sub-Sector

In this section, we hope to demonstrate specific change in CTFP from the perspective of sub-sectors to obtain policy recommendations that are precise to sub-sectors. Due to space limitations, this study only shows the variation and factor contribution of CTFP in each sub-sector from 2006 to 2019 (see Table A2 and Table A3 in Appendix A for EC and TC). In order to make the measurement results of each sub-sector comparable, we refer to the meta-frontier instead of the sector frontier.
Table 2 shows the variation of CTFP and factor contributions for each industrial sub-sector from 2006 to 2019. Only three sub-sectors showed a decrease in CTFP, namely mining and washing of coal (BLPI = −0.023 < 0), mining and processing of ferrous metal ores (BLPI = −0.036 < 0), and mining and processing of non-ferrous metal ores (BLPI = −0.059 < 0), all of which are heavy industry sectors. The CTFP of processing of petroleum, coking and processing of nuclear fuel (BLPI = 0.233 > 0.1), production and supply of water (BLPI = 0.193 > 0.1), and production and supply of gas (BLPI = 0.109 > 0.1) grew faster. Specifically, the reasons for the decline of the first three were mainly caused by output factors, and the obstacles of BLPIOutput were −0.114, −0.167, and −0.267, respectively. For the processing of petroleum and the coking and processing of nuclear fuel, BLPIEnergy and BLPICO2 were the main reasons for the growth of CTFP in this sub-sector. It is possible that the energy consumption structure of this sub-sector has been improved during the sample period, and the CO2 emissions in the production process have been effectively controlled with the help of low-carbon technologies. In addition, it is noted that the CTFP of production and supply of gas and supply and production and supply of water has significantly improved with the contribution of output factors. These two sub-sectors are closely related to the life of residents. Since the “11th Five-Year Plan”, the Chinese government has paid attention to controlling the total and intensity of water consumption and alleviating overcapacity. It is worth noting that the sub-sectors with a decline in CTFP and the sub-sectors with the fastest growth in CTFP are both in HIS. Therefore, for the carbon emissions reduction target of Chinese industry, we need to make it clear that HIS is the focus of attention and research.

3.4. Influencing Factors of CTFP in China’s Industrial Sector

This study refers to the relevant literature [42,43,44] and considers that industrial scale (denoted as Scale), R&D investment (denoted as R&D investment), R&D personnel (denoted as R&D personnel), and energy structure (denoted as ES) will have an impact on CTFP. The measurement methods for each influencing factor are shown in Table 3. The data come from CSY, CISY, CESY, and the China Statistical Yearbook on High Technology Industry (CSYHTI). The econometric model is set as Equation (12). At the same time, the influence of the above factors on EC and TC is further investigated.
Y i , t = β 0 + k = 1 4 β k X i , t + θ i + η t + ε i , t
where Y denotes CTFP, EC, and TC; i and t represent different industrial sub-sectors and years, respectively; X i , t denotes the influencing factors; β 1 β 4 are the estimated coefficient; η t is the year fixed effects; θ i is the sub-sectors fixed effects. ε i , t is the random error term.
In order to eliminate heteroscedasticity, Scale and R&D personnel are treated logarithmically. The results are shown in Table 4. R&D investment and R&D personnel have significant positive effects on the improvement of CTFP (5% significance level), while ES hinders the improvement of CTFP (1% significance level). From the perspective of EC and TC, Scale has a significant negative effect on EC. In addition, R&D personnel has a positive effect on both EC and TC, while ES is not conducive to the improvement of TC.
To present our empirical results more concisely, we summarize the key findings as follows:
  • CTFP of China’s industrial sector showed an increasing trend from 2006 to 2019, which was attributed to TC.
  • There were certain differences between the two sectors in terms of change in CTFP. The change in LIS was more stable, while the fluctuations in HIS were larger.
  • At the sub-sector level, only three sub-sectors showed a decline in CTFP during the sample period. Processing of petroleum, coking and processing of nuclear fuel, production and supply of water, and production and supply of gas showed faster CTFP growth.
  • R&D investment and R&D personnel had a positive impact on the CTFP, while energy structure was not conducive to the improvement of CTFP.

4. Conclusions and Policy Implications

4.1. Conclusions

The industrial sector is one of the main sources of China’s carbon emissions. By enhancing CTFP, which means achieving higher output with lower carbon emissions, the negative environmental impact of industrial activities can be significantly reduced, promoting sustainable development. Increasing CTFP implies more efficient use of resources. This not only helps to reduce production costs and enhance competitiveness but also further tackles the additional costs of producing carbon emissions in the future while decreasing dependency and pressure on resources. Based on the BNDDF and Luenberger index, this study uses the BLPI to calculate the CTFP of the industrial sector in China from 2006 to 2019 under carbon–electricity market collaboration and further analyzes the main influencing factors. The primary conclusions are as follows:
The CTFP of China’s industrial sector showed an increasing trend from 2006 to 2019, which was attributed to TC. This indicated that the Chinese government’s investment in low-carbon technologies in recent years had achieved fruitful results, specifically reflected in the contribution of TCEnergy and TCCO2 to CTFP. However, the EC fluctuated greatly, which was mainly due to ECOutput, indicating that China’s industrial sector may have a series of problems. This study further considers the technological heterogeneity between LIS and HIS. We find that there are certain differences between the two sectors in terms of change in CTFP, EC, and TC. The change in LIS was more stable, while the fluctuations in HIS were larger. This conclusion is further verified by the measurement results of the gap between sectors. At the sub-sector level, only three sub-sectors showed a decline in CTFP during the sample period. Processing of petroleum, coking and processing of nuclear fuel, production and supply of water, and production and supply of gas showed faster CTFP growth. The results of the research on influencing factors show that R&D investment and R&D personnel have a positive impact on the CTFP, while industrial scale is not conducive to the improvement of the CTFP. Further research suggests that R&D investment and R&D personnel increase TC, while energy structure hinders EC.

4.2. Policy Implications

This study proposes the following policy implications to promote CTFP improvement and low-carbon transition in China’s industrial sector.
Promote low-carbon technology innovation and application. Provide financial support and incentive measures to encourage enterprises to increase investment in low-carbon technology research and development. Establish more research and development centers and laboratories to support the research and development of low-carbon technologies. Strengthen cooperation between the government and the industry, create collaborative platforms, and accelerate the promotion and commercialization of low-carbon technologies.
Optimizing production scale and efficiency. Encourage enterprises to conduct internal reviews to ensure production scale aligns with market demand, avoiding excessive expansion or unnecessary waste. Encourage the adoption of advanced production technologies and management methods by enterprises to improve resource utilization efficiency and energy efficiency. Provide training and consulting services to help enterprises enhance their operations and management, reducing energy consumption and waste emissions.
Differentiated policies for different industries. Develop differentiated policies based on the characteristics of LIS and HIS. For example, for LIS, the government can provide more fiscal and tax incentives to encourage technological upgrades and innovation. For HIS, the government should strengthen environmental supervision and emission reduction requirements, promote the transformation of high-energy-consuming industries towards low-carbon development, and facilitate sustainable resource utilization.
Increasing research and development investment and talent cultivation. Provide tax preferences and financial support for increased enterprise investment in research and development, encouraging technological innovation and product improvement. Establish more research institutions and higher education institutions to cultivate a larger pool of researchers and professionals. Promote industry–academia collaboration to facilitate the transformation and application of technological achievements.
Strengthening regulation and standard setting. Enhance laws and regulations related to environmental protection and carbon emissions management, and increase penalties for non-compliance. Develop comprehensive carbon emission standards and industry guidelines to guide enterprises towards more environmentally friendly and low-carbon production methods. Establish a monitoring system to continuously monitor and evaluate the carbon emissions of enterprises, promptly detect and rectify non-compliant behavior.
It is worth noting that our study has some limitations. This research utilizes panel data from 35 industrial sub-sectors, which are based on data at the national level in China. In fact, there can be significant differences within the same industrial sub-sector between different provinces or prefecture-level cities in China. This is due to variations in economic development, geographical conditions, and resource endowments across regions. Therefore, future research could further collect data on industrial sub-sectors from different provinces or prefecture-level cities. Calculating CTFP based on these data could provide more valuable information for the low-carbon development of industries in specific provinces or prefecture-level cities.

Author Contributions

Conceptualization, Z.S.; Methodology, H.L.; Software, L.Z.; Validation, W.S. (Wei Shi); Investigation, H.L.; Data curation, W.S. (Wenxiang Sheng); Writing—original draft, L.Z. All authors have read and agreed to the published version of the manuscript.

Funding

This research was funded by Anhui Provincial Natural Science Foundation (2208085UD02), State Grid Anhui Economic Research Institute Enterprise Research Project (B6120923000M).

Data Availability Statement

The data presented in this study are available on request from the corresponding author.

Conflicts of Interest

The authors declare no conflict of interest.

Abbreviations

LISLight industry sector
HISHeavy industry sector
CTFPCarbon total factor productivity
BLPIBiennial Luenberger productivity index
ECEfficiency change
TCTechnology change
PGIProductivity gap index
TCGTechnology change gap
ECGEfficiency change gap

Appendix A

Table A1. The numbers and types for each sub-sector.
No.Sub-SectorsTypes
01Mining and Washing of CoalH
02Extraction of Petroleum and Natural GasH
03Mining and Processing of Ferrous Metal OresH
04Mining and Processing of Non-Ferrous Metal OresH
05Mining and Processing of Non-metal OresH
06Mining of Other OresH
07Processing of Food from Agricultural ProductsL
08Manufacture of FoodsL
09Manufacture of Liquor, Beverages, and Refined TeaL
10Manufacture of TobaccoL
11Manufacture of TextileL
12Manufacture of Textile, Wearing Apparel, and AccessoriesL
13Manufacture of Leather, Fur, Feather, and Related Products and FootwearL
14Processing of Timber, Manufacture of Wood, Bamboo, Rattan, Palm, and Straw ProductsL
15Manufacture of FurnitureL
16Manufacture of Paper and Paper ProductsL
17Printing and Reproduction of Recording MediaL
18Processing of Petroleum, Coking and Processing of Nuclear FuelH
19Manufacture of Raw Chemical Materials and Chemical ProductsH
20Manufacture of MedicinesL
21Manufacture of Chemical FibersL
22Manufacture of Rubber and Plastics ProductsL
23Manufacture of Non-Metallic Mineral ProductsH
24Smelting and Pressing of Ferrous MetalsH
25Smelting and Pressing of Non-Ferrous MetalsH
26Manufacture of Metal ProductsH
27Manufacture of General Purpose MachineryH
28Manufacture of Special Purpose MachineryH
29Manufacture of Transport EquipmentH
30Manufacture of Electrical Machinery and ApparatusH
31Manufacture of Computers, Communication, and Other Electronic EquipmentH
32Manufacture of Measuring Instruments and MachineryL
33Production and Supply of Electric Power and Heat PowerH
34Production and Supply of GasH
35Production and Supply of WaterH
Note: L represents LIS and H represents HIS.
Table A2. EC and its decomposition values for each sub-sector from 2006 to 2019.
Sub-SectorsECCapitalLaborEnergyOutputCO2
01−0.0590.000 −0.020 0.000 −0.169 −0.002
02−0.081−0.019 0.000 −0.009 −0.216 −0.018
03−0.0760.000 0.001 0.004 −0.228 0.000
04−0.1030.000 −0.008 0.002 −0.317 0.010
05−0.0050.000 −0.029 −0.002 −0.004 −0.001
060.0420.000 0.000 0.077 0.027 0.073
07−0.0090.000 −0.052 −0.009 −0.009 0.000
08−0.0100.000 −0.052 −0.003 −0.010 −0.002
09−0.0120.000 −0.044 −0.004 −0.015 −0.003
100.0000.000 0.000 0.000 0.000 0.000
11−0.0060.000 −0.038 −0.011 −0.004 0.002
120.0030.000 −0.014 −0.015 −0.009 0.027
13−0.0300.000 −0.070 −0.045 −0.007 −0.045
140.0110.000 −0.039 −0.007 0.038 0.012
150.0020.000 −0.026 −0.036 −0.005 0.033
16−0.0150.000 −0.038 −0.005 −0.027 −0.004
170.0060.008 −0.059 −0.026 0.053 −0.011
18−0.041−0.029 0.000 −0.075 −0.011 −0.076
19−0.0360.000 −0.011 −0.003 −0.099 −0.005
200.0030.000 −0.046 −0.010 0.001 0.028
21−0.0230.000 −0.024 −0.011 −0.032 −0.025
220.0030.000 −0.049 −0.011 −0.009 0.037
230.0030.000 −0.044 −0.001 0.026 −0.001
24−0.016−0.010 0.013 −0.002 −0.046 −0.002
25−0.0230.000 0.024 −0.003 −0.068 −0.009
26−0.0140.000 −0.032 −0.005 −0.023 −0.007
27−0.0110.000 −0.038 −0.007 −0.026 0.007
280.0020.000 −0.042 0.001 −0.014 0.033
290.0000.015 −0.045 0.003 −0.044 0.053
300.0220.002 0.026 0.023 0.000 0.050
310.0000.000 0.000 0.000 0.000 0.000
320.003−0.015 −0.032 −0.022 0.000 0.031
33−0.021−0.009 0.000 −0.006 −0.057 −0.001
34−0.013−0.002 −0.022 −0.006 −0.035 0.005
350.0160.003 0.015 0.001 0.042 0.000
Note: The numbers for each sub-sector are shown in Table A1.
Table A3. TC and its decomposition values for each sub-sector from 2006 to 2019.
Sub-SectorsTCCapitalLaborEnergyOutputCO2
010.037 0.000 0.081 0.015 0.055 0.023
020.114 −0.024 0.000 0.001 0.332 0.016
030.039 0.000 0.094 0.015 0.061 0.021
040.044 0.000 0.085 0.017 0.050 0.047
050.021 0.000 0.063 0.010 0.030 0.010
060.039 −0.015 0.146 0.000 0.083 −0.009
070.026 0.000 0.062 0.013 0.038 0.016
080.029 0.000 0.074 0.028 0.031 0.022
090.039 0.000 0.069 0.034 0.057 0.026
100.077 0.050 0.078 0.084 0.000 0.159
110.027 0.000 0.058 0.014 0.028 0.028
120.041 −0.003 0.156 0.088 0.058 −0.015
130.088 0.003 0.138 0.085 0.001 0.187
140.026 0.000 0.055 0.019 0.022 0.033
150.035 −0.025 0.108 0.066 0.053 0.002
160.045 0.000 0.071 0.015 0.084 0.022
170.047 −0.025 0.126 0.017 0.118 −0.016
180.273 0.180 0.000 0.534 0.039 0.542
190.043 −0.002 0.074 0.005 0.092 0.012
200.048 0.000 0.065 0.017 0.075 0.040
210.054 0.000 0.062 0.014 0.078 0.060
220.043 0.000 0.064 0.017 0.029 0.072
230.028 0.000 0.078 0.006 0.054 0.002
240.062 −0.049 0.002 0.000 0.199 0.002
250.040 −0.008 0.032 0.004 0.091 0.019
260.032 0.000 0.051 0.006 0.054 0.023
270.029 0.000 0.061 0.015 0.045 0.016
280.044 −0.018 0.068 0.031 0.048 0.056
290.050 −0.161 0.003 −0.089 0.263 −0.031
300.049 0.026 0.076 0.073 0.000 0.088
310.030 0.039 0.057 0.041 0.000 0.046
320.038 0.018 0.078 0.060 0.000 0.063
330.072 −0.014 0.000 0.001 0.221 0.001
340.057 −0.003 0.063 0.035 0.092 0.046
350.176 −0.033 −0.013 −0.016 0.550 0.000
Note: The numbers for each sub-sector are shown in Table A1.

References

  1. Zhou, H.; Hui, X.; Li, D.; Hu, D.; Chen, X.; He, X.; Gao, L.; Huang, H.; Lee, C.; Mu, X. Metal–organic framework-surface-enhanced infrared absorption platform enables simultaneous on-chip sensing of greenhouse gases. Adv. Sci. 2020, 7, 2001173. [Google Scholar] [CrossRef]
  2. Xu, X.; Cui, X.; Zhang, Y.; Chen, X.; Li, W. Carbon neutrality and green technology innovation efficiency in Chinese textile industry. J. Clean. Prod. 2023, 395, 136453. [Google Scholar] [CrossRef]
  3. Li, K.; Yan, Y.; Zhang, X. Carbon-abatement policies, investment preferences, and directed technological change: Evidence from China. Technol. Forecast. Soc. Social. Change 2021, 172, 121015. [Google Scholar] [CrossRef]
  4. Xu, L.; Fan, M.; Yang, L.; Shao, S. Heterogeneous green innovations and carbon emission performance: Evidence at China’s city level. Energy Econ. 2021, 99, 105269. [Google Scholar] [CrossRef]
  5. Wu, Q.; Wang, Y. How does carbon emission price stimulate enterprises’ total factor productivity? Insights from China’s emission trading scheme pilots. Energy Econ. 2022, 109, 105990. [Google Scholar] [CrossRef]
  6. Song, Y.; Liu, T.; Ye, B.; Li, Y. Linking carbon market and electricity market for promoting the grid parity of photovoltaic electricity in China. Energy 2020, 211, 118924. [Google Scholar] [CrossRef]
  7. Fang, P.; Wan, L.; Fang, W. The Choice of Cooperative Governance Mechanism in Open Innovation Projects under the Synergy of the Electricity–Carbon Market. Energies 2023, 16, 6110. [Google Scholar] [CrossRef]
  8. Deng, J.; Zheng, Y.; Zhang, Y.; Liu, C.; Pan, H. Dynamic Spillovers between Carbon Price and Power Sector Returns in China: A Network-Based Analysis before and after Launching National Carbon Emissions Trading Market. Energies 2023, 16, 5578. [Google Scholar] [CrossRef]
  9. Wang, H.R.; Feng, T.T.; Zhong, C. Effectiveness of CO2 cost pass-through to electricity prices under “electricity-carbon” market coupling in China. Energy 2023, 266, 126387. [Google Scholar] [CrossRef]
  10. Wang, J.; Hu, M.; Rodrigues, J.F. The evolution and driving forces of industrial aggregate energy intensity in China: An extended decomposition analysis. Appl. Energy 2018, 228, 2195–2206. [Google Scholar] [CrossRef]
  11. Ouyang, X.; Fang, X.; Cao, Y.; Sun, C. Factors behind CO2 emission reduction in Chinese heavy industries: Do environmental regulations matter? Energy Policy 2020, 145, 111765. [Google Scholar] [CrossRef]
  12. Xu, B.; Xu, R. Assessing the carbon intensity of the heavy industry in China: Using a nonparametric econometric model. Environ. Impact Assess. Rev. 2023, 98, 106925. [Google Scholar] [CrossRef]
  13. Zhang, Y.; Shen, L.; Shuai, C.; Bian, J.; Zhu, M.; Tan, Y.; Ye, G. How is the environmental efficiency in the process of dramatic economic development in the Chinese cities? Ecol. Indic. 2019, 98, 349–362. [Google Scholar] [CrossRef]
  14. Mo, J.; Tu, Q.; Wang, J. Carbon pricing and enterprise productivity-The role of price stabilization mechanism. Energy Econ. 2023, 120, 106631. [Google Scholar] [CrossRef]
  15. Xiao, J.; Li, G.; Zhu, B.; Xie, L.; Hu, Y.; Huang, J. Evaluating the impact of carbon emissions trading scheme on Chinese firms’ total factor productivity. J. Clean. Prod. 2021, 306, 127104. [Google Scholar] [CrossRef]
  16. Yasmeen, R.; Zhang, X.; Tao, R.; Shah, W.U.H. The impact of green technology, environmental tax and natural resources on energy efficiency and productivity: Perspective of OECD Rule of Law. Energy Rep. 2023, 9, 1308–1319. [Google Scholar] [CrossRef]
  17. Shah, W.U.H.; Hao, G.; Yan, H.; Zhu, N.; Yasmeen, R.; Dincă, G. Role of renewable, non-renewable energy consumption and carbon emission in energy efficiency and productivity change: Evidence from G20 economies. Geosci. Front. 2023, 101631. [Google Scholar] [CrossRef]
  18. Zhu, Q.; Liu, C.; Li, X.; Zhou, D. The total factor carbon emission productivity in China’s industrial Sectors: An analysis based on the global Malmquist-Luenberger index. Sustain. Energy Technol. Assess. 2023, 56, 103094. [Google Scholar] [CrossRef]
  19. Malmquist, S. Index numbers and indifference surfaces. Trab. Estadística 1953, 4, 209–242. [Google Scholar] [CrossRef]
  20. Färe, R.; Grosskopf, S.; Norris, M.; Zhang, Z. Productivity growth, technical progress, and efficiency change in industrialized countries. Am. Econ. Rev. 1994, 66–83. Available online: https://www.jstor.org/stable/2117971 (accessed on 1 July 2023).
  21. Xue, X.; Shen, Q.; Wang, Y.; Lu, J. Measuring the productivity of the construction industry in China by using DEA-based Malmquist productivity indices. J. Constr. Eng. Manag. 2008, 134, 64–71. [Google Scholar] [CrossRef]
  22. Lin, M.I.; Lee, Y.D.; Ho, T.N. Applying integrated DEA/AHP to evaluate the economic performance of local governments in China. Eur. J. Oper. Res. 2011, 209, 129–140. [Google Scholar] [CrossRef]
  23. Sun, W.; Li, Y.; Wang, D.; Fan, J. The efficiencies and their changes of China’s resources-based cities employing DEA and Malmquist index models. J. Geogr. Sci. 2012, 22, 509–520. [Google Scholar] [CrossRef]
  24. Wu, A.H.; Cao, Y.Y.; Liu, B. Energy efficiency evaluation for regions in China: An application of DEA and Malmquist indices. Energy Effic. 2014, 7, 429–439. [Google Scholar] [CrossRef]
  25. Li, H.; Wu, L. Analysis of financial support efficiency for China’s wind power industry. Energy Sources Part. B Econ. Plan. Policy 2016, 11, 1035–1041. [Google Scholar] [CrossRef]
  26. Liu, W.; Zhan, J.; Wang, C.; Li, S.; Zhang, F. Environmentally sensitive productivity growth of industrial sectors in the Pearl River Delta. Resour. Conserv. Recycl. 2018, 139, 50–63. [Google Scholar] [CrossRef]
  27. Wang, K.L.; Pang, S.Q.; Ding, L.L.; Miao, Z. Combining the biennial Malmquist–Luenberger index and panel quantile regression to analyze the green total factor productivity of the industrial sector in China. Sci. Total Environ. 2020, 739, 140280. [Google Scholar] [CrossRef]
  28. Chung, Y.H.; Färe, R.; Grosskopf, S. Productivity and undesirable outputs: A directional distance function approach. J. Environ. Manag. 1997, 51, 229–240. [Google Scholar] [CrossRef]
  29. He, F.; Zhang, Q.; Lei, J.; Fu, W.; Xu, X. Energy efficiency and productivity change of China’s iron and steel industry: Accounting for undesirable outputs. Energy Policy 2013, 54, 204–213. [Google Scholar] [CrossRef]
  30. Fu, Y.; He, C.; Luo, L. Does the low-carbon city policy make a difference? Empirical evidence of the pilot scheme in China with DEA and PSM-DID. Ecol. Indic. 2021, 122, 107238. [Google Scholar] [CrossRef]
  31. Wang, Y.; Sun, X.; Wang, B.; Liu, X. Energy saving, GHG abatement and industrial growth in OECD countries: A green productivity approach. Energy 2020, 194, 116833. [Google Scholar] [CrossRef]
  32. Oh, D.H. A global Malmquist-Luenberger productivity index. J. Product. Anal. 2010, 34, 183–197. [Google Scholar] [CrossRef]
  33. Zhang, W.; Cheng, J.; Liu, X.; Zhu, Z. Heterogeneous industrial agglomeration, its coordinated development and total factor energy efficiency. Environ. Dev. Sustain. 2023, 25, 5511–5537. [Google Scholar] [CrossRef]
  34. Li, S.; Zhu, X.; Zhang, T. Optimum combination of heterogeneous environmental policy instruments and market for green transformation: Empirical evidence from China’s metal sector. Energy Econ. 2023, 123, 106735. [Google Scholar] [CrossRef]
  35. Fujii, H.; Managi, S.; Matousek, R. Indian bank efficiency and productivity changes with undesirable outputs: A disaggregated approach. J. Bank. Financ. 2014, 38, 41–50. [Google Scholar] [CrossRef]
  36. Zhou, T.; Huang, X.; Zhang, N. The effect of innovation pilot on carbon total factor productivity: Quasi-experimental evidence from China. Energy Econ. 2023, 125, 106895. [Google Scholar] [CrossRef]
  37. Färe, R.; Grosskopf, S.; Pasurka, C.A., Jr. Environmental production functions and environmental directional distance functions. Energy 2007, 32, 1055–1066. [Google Scholar] [CrossRef]
  38. Pastor, J.T.; Asmild, M.; Lovell, C.K. The biennial Malmquist productivity change index. Socio-Econ. Plan. Sci. 2011, 45, 10–15. [Google Scholar] [CrossRef]
  39. Chambers, R.G.; Chung, Y.; Färe, R. Benefit and distance functions. J. Econ. Theory 1996, 70, 407–419. [Google Scholar] [CrossRef]
  40. Li, J.; Lin, B. Ecological total-factor energy efficiency of China’s heavy and light industries: Which performs better? Renew. Sustain. Energy Rev. 2017, 72, 83–94. [Google Scholar] [CrossRef]
  41. Kang, Y.Q.; Xie, B.C.; Wang, J.; Wang, Y.N. Environmental assessment and investment strategy for China’s manufacturing industry: A non-radial DEA based analysis. J. Clean. Prod. 2018, 175, 501–511. [Google Scholar] [CrossRef]
  42. Cui, H.; Wang, H.; Zhao, Q. Which factors stimulate industrial green total factor productivity growth rate in China? An industrial aspect. Greenh. Gases Sci. Technol. 2019, 9, 505–518. [Google Scholar] [CrossRef]
  43. Jiang, H.; Jiang, P.; Wang, D.; Wu, J. Can smart city construction facilitate green total factor productivity? A quasi-natural experiment based on China’s pilot smart city. Sustain. Cities Soc. 2021, 69, 102809. [Google Scholar] [CrossRef]
  44. Ding, T.; Li, H.; Tan, R.; Zhao, X. How does geopolitical risk affect carbon emissions?: An empirical study from the perspective of mineral resources extraction in OECD countries. Resour. Policy 2023, 85, 103983. [Google Scholar] [CrossRef]
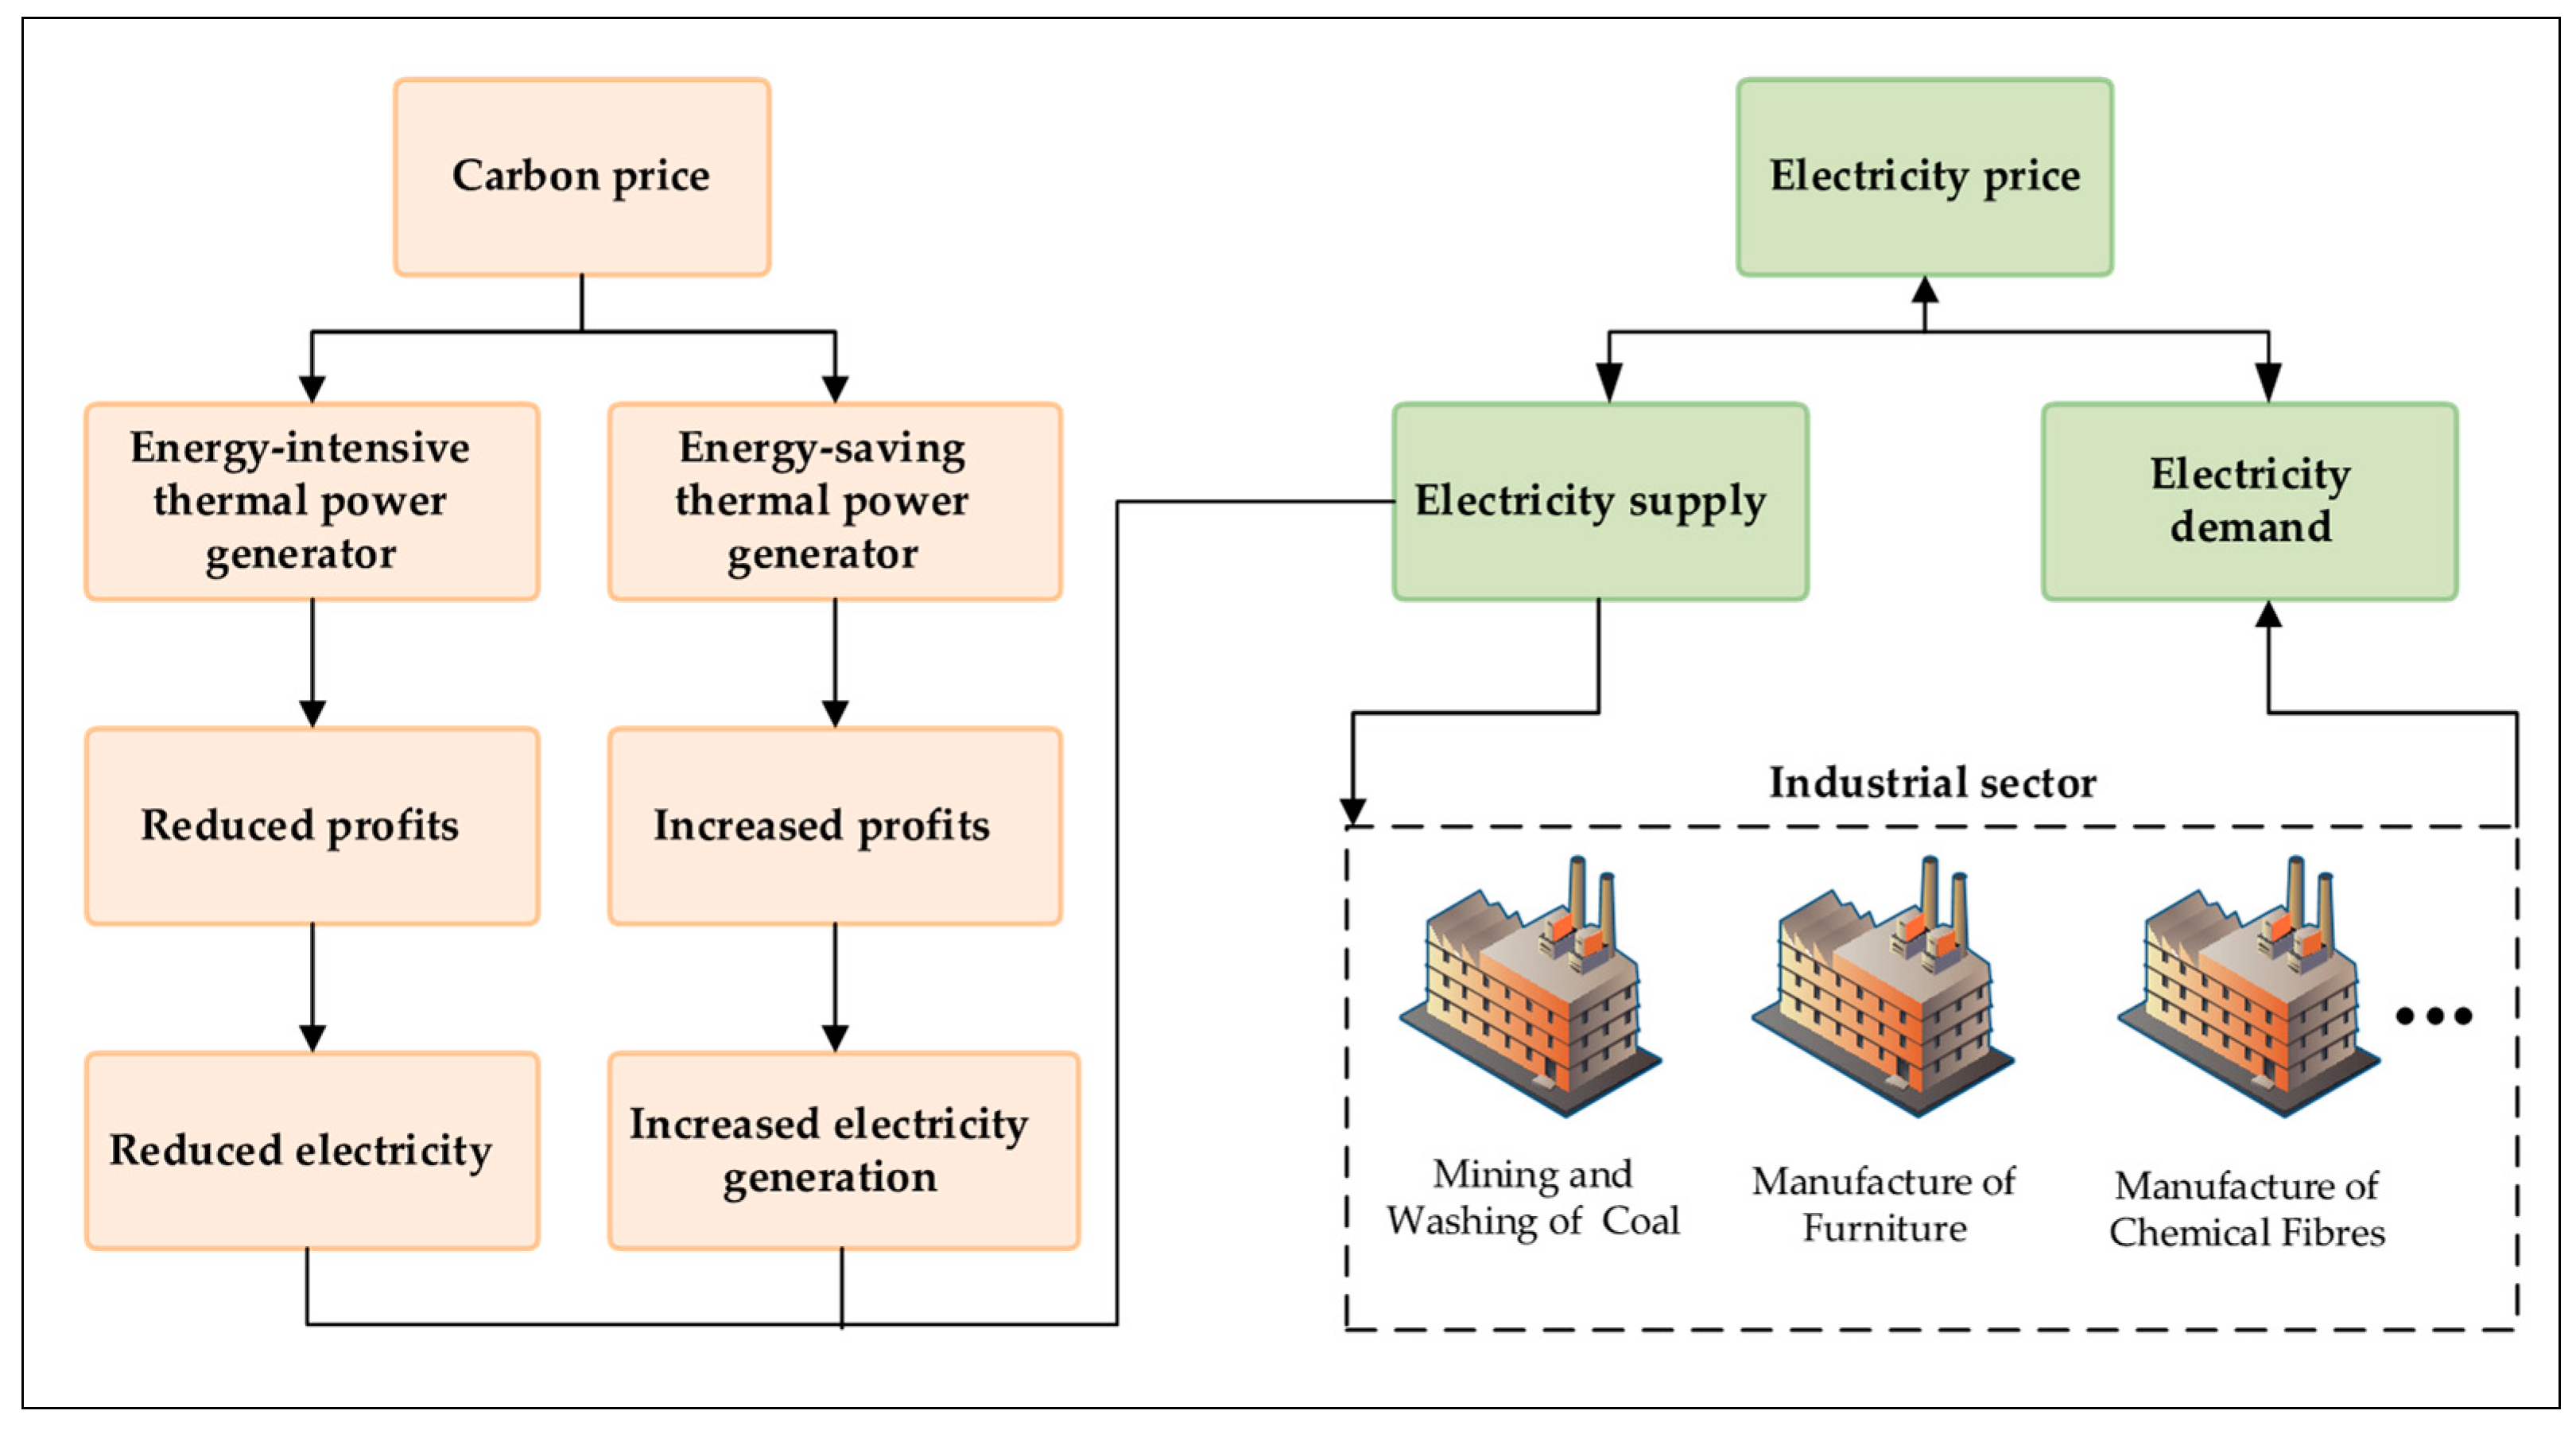
Figure 1. The impact of carbon–electricity market collaboration on the industrial sector.
Energies 17 01219 g001
Figure 2. (a) Shows the average CO2 emissions in LIS from 2006–2019; (b) shows average CO2 emissions in HIS from 2006 to 2019. Notes: The numbers for each sub-sector are shown in Table A1; CO2 emissions data are derived from the Carbon Emission Accounts and Datasets (CEADs).
Energies 17 01219 g002
Figure 3. The trend of BLPI in China’s industrial sector from 2006–2019.
Energies 17 01219 g003
Figure 4. (a) Shows the trend of EC from 2006–2019; (b) shows the trend of TC from 2006–2019.
Energies 17 01219 g004
Figure 5. The trend of BLPI in the sector frontier from 2006–2019. Note: L represents LIS and H represents HIS.
Energies 17 01219 g005
Figure 6. (a) Shows the trend of EC in the sector frontier from 2006–2019; (b) shows the trend of TC in the sector frontier from 2006–2019. Note: L represents LIS and H represents HIS.
Energies 17 01219 g006
Figure 7. The trend of PGI from 2006–2019. Note: L represents LIS and H represents HIS.
Energies 17 01219 g007
Figure 8. (a) Shows the trend of ECG from 2006–2019; (b) shows the trend of TCG from 2006–2019. Note: L represents LIS and H represents HIS.
Energies 17 01219 g008
Table 1. Descriptive statistics.
IndexUnitTypeNMeanStd. DevMinMax
KCNY 100 millionL2102454.8161845.578348.6739316.616
H2808541.12511,322.2720.73275,400.112
L10,000 personsL210200.496144.83216.2652.06
H280281.481231.8260.08911.69
E10,000 tons of SCEL2101878.8861836.089143.2787487
H28011,407.25715,962.733126.5169,342
YCNY 100 millionL21011,785.03210,005.1771460.37958,969.151
H28024,709.96221,792.3253.7987,384.372
CMillion tonsL21013.86214.8560.28752.388
H280349.276865.8380.0074641.959
Notes: SCE represents standard coal equivalent; L represents LIS and H represents HIS.
Table 2. BLPI and its decomposition values for 35 sub-sectors from 2006–2019.
Sub-SectorsBLPICapitalLaborEnergyOutputCO2
01−0.0230.0000.0620.016−0.1140.020
020.032−0.0430.000−0.0090.116−0.002
03−0.0360.0000.0950.020−0.1670.020
04−0.0590.0000.0770.019−0.2670.057
050.0160.0000.0340.0080.0260.009
060.081−0.0150.1460.0770.1100.064
070.0170.0000.0100.0040.0290.016
080.0190.0000.0210.0250.0210.020
090.0280.0000.0240.0290.0420.023
100.0770.0500.0780.0840.0000.159
110.0210.0000.0190.0020.0240.030
120.044−0.0030.1420.0730.0490.012
130.0580.0030.0680.040−0.0050.141
140.0380.0000.0160.0110.0600.045
150.037−0.0250.0810.0290.0480.035
160.0300.0000.0330.0100.0570.018
170.052−0.0170.067−0.0080.170−0.027
180.2330.1510.0000.4590.0280.466
190.007−0.0020.0630.002−0.0070.007
200.0510.0000.0190.0070.0760.068
210.0320.0000.0380.0040.0460.035
220.0450.0000.0150.0060.0210.109
230.0310.0000.0340.0040.0790.001
240.045−0.0590.015−0.0020.1520.000
250.017−0.0080.0560.0000.0230.010
260.0180.0000.0190.0010.0310.016
270.0180.0000.0230.0080.0200.023
280.045−0.0180.0250.0320.0340.089
290.050−0.146−0.042−0.0860.2190.022
300.0710.0280.1010.0950.0000.137
310.0300.0390.0570.0410.0000.046
320.0410.0020.0460.0380.0000.094
330.051−0.0230.000−0.0060.1630.000
340.109−0.061−0.008−0.0060.3190.032
350.193−0.0290.002−0.0150.5920.000
Note: The numbers for each sub-sector are shown in Table A1.
Table 3. The measurement methods of each influencing factor.
FactorsMeasurement MethodsUnit
ScaleThe number of industrial enterprises above designated size1 enterprise
R&D investmentThe proportion of R&D expenditure in industrial output%
R&D personnelThe number of R&D personnel1 personnel
ESThe proportion of coal consumption in total energy consumption%
Table 4. The empirical results of influencing factors.
Variables(1)(2)(3)
CTFPECTC
Ln (Scale)0.0076
(0.20)
−0.1245 **
(−1.99)
−0.0072
(−0.11)
R&D investment0.0851 **
(2.42)
−0.0511
(−1.39)
0.1360 ***
(3.62)
Ln (R&D personnel)0.1024 ***
(4.66)
0.1106 **
(2.54)
0.2551 ***
(5.75)
ES−0.0891 ***
(−7.69)
−0.0021
(−0.11)
−0.0515 **
(−2.40)
Constant−5.5562
(−1.65)
1.5177 ***
(2.68)
−0.6770
(−1.17)
Year FEYesYesYes
Sub-sector FEYesYesYes
R20.43560.26370.3848
Notes: t statistics in parentheses. ** p < 0.05, *** p < 0.01.
Disclaimer/Publisher’s Note: The statements, opinions and data contained in all publications are solely those of the individual author(s) and contributor(s) and not of MDPI and/or the editor(s). MDPI and/or the editor(s) disclaim responsibility for any injury to people or property resulting from any ideas, methods, instructions or products referred to in the content.