Article

Analysis and Suppression of Harmonic Resonance in Photovoltaic Grid-Connected Systems

1
State Grid Sichuan Electric Power Company, Chengdu 610041, China
2
College of Electrical Engineering, Sichuan University, Chengdu 610065, China
*
Author to whom correspondence should be addressed.
Energies 2024, 17(5), 1218; https://doi.org/10.3390/en17051218
Submission received: 29 January 2024 / Revised: 26 February 2024 / Accepted: 27 February 2024 / Published: 3 March 2024
(This article belongs to the Section A2: Solar Energy and Photovoltaic Systems)

Abstract

:
In photovoltaic grid-connected systems, the interaction between grid-connected inverters and the grid may cause harmonic oscillation, which severely affects the normal operation of the system. To improve the quality of the output electrical energy, photovoltaic grid-connected systems often use LCL filters as output filters to filter out high-frequency harmonics. Taking the three-phase LCL-type photovoltaic grid-connected inverter system as an example, this paper addresses the issue of harmonic resonance. Firstly, based on the harmonic linearization method and considering the impact of the coupling compensation term on the grid-side voltage, a modular positive and negative sequence impedance modeling method is proposed, which simplifies the secondary modeling process of the converter under feedback control. Then, the stability analysis is conducted using the Nyquist criterion, revealing the mechanism of high-frequency resonance in photovoltaic grid-connected systems. Furthermore, this paper delves into the impact of changes in system parameters on impedance characteristics and system stability. The results indicate that the proportional coefficient of the internal loop current controller has a significant influence on system impedance characteristics. Additionally, this paper proposes an active damping design method that combines lead correction and capacitor current feedback to impedance-reconstruct the easily oscillating frequency band. Finally, the effectiveness of this method is verified in the simulation platform. Simulation results confirm the effectiveness of this method in suppressing harmonic resonance while maintaining rapid dynamic response.

1. Introduction

Addressing the growing demand for load, power generation technologies based on nonrenewable energy have caused environmental problems due to their greenhouse gas emissions into the atmosphere, negatively impacting human health and ecosystems [1,2]. Currently, there is a gradual shift from nonrenewable energy towards renewable sources such as solar, wind, and water energy [3]. Among all renewable energy sources, solar photovoltaic power generation stands out as one of the most promising and sustainable options for power generation [4,5]. Photovoltaic grid-connected systems often adopt the LCL filter as the output filter to filter out high-frequency harmonics and improve the quality of the output electrical energy [6]. The LCL filter circuit has inherent resonant peaks. When stimulated by various harmonic sources, especially in scenarios where distributed energy sources are connected, power electronic devices may interact with the grid-connected system, resulting in harmonic oscillation, which in turn jeopardizes the stable operation of the system [7].
At present, the main research methods for resonance in grid-connected systems include modal analysis, state space modeling, and impedance analysis. Modal analysis establishes a corresponding admittance matrix for the studied grid-connected system, performs eigenvalue decomposition on the system admittance matrix, and obtains information such as the key resonance modes, key characteristic vectors, and participation factors. It conducts mathematical analysis of the resonance nodes and the participation of each node to explain the resonance mechanism and locate the resonance points. An admittance matrix for the IEEE 14 bus system is established in [8], with an analysis of the key resonance modes and the participation of each node in the system, followed by simulation verification. Additionally, a method for detecting resonance modes in weakly interconnected power grids, considering the harmonic impedance of the main power grid, is proposed in [9].
Establishing a complete state space model for a grid-connected system is a common method for analyzing its stability and interactive effects. In [10], a detailed mathematical model of a wind farm based on a DFIG connected to the grid through a series compensation transmission line was established and derived. By establishing the state space matrix equation for the entire system, the performance of this model was analyzed. In [11], a simplified practical model of a PMSG-type wind farm was derived, and the rotor flux orientation control strategy was applied to the modeling of a permanent magnet synchronous generator (PMSG). Taking the IEEE 3-bus test system as a benchmark, a simulation scenario was conducted where the PMSG-type wind farm replaced the synchronous generator, and eigenvalue analysis was performed to evaluate the impact of the PMSG wind farm on the small signal stability of the power system. In [12], each module of a photovoltaic power station was subjected to small signal modeling, establishing a complete small signal system model for the photovoltaic power station. Using the eigenvalue analysis method, the small disturbance stability was studied. By analyzing the contributing factors and eigenvalue trajectories, the impact of controller parameters on the stability of the photovoltaic power generation system was understood. In [13], based on the state space, the harmonic stability analysis of a parallel grid-connected inverter system was conducted, and the eigenvalue trajectory related to time delay and coupled grid impedance was obtained. This illustrated how unstable inverters can produce harmonic resonances and lead to the instability of the entire parallel system. While the method of establishing a state space model for the system can provide a more comprehensive mathematical model of the entire system, such methods have more complex theoretical calculations, with higher order state space matrices and greater spatial complexity. In some cases, if only one aspect of the system’s characteristics is of concern, a complete mathematical model need not be established.
The foundation of impedance analysis methods is to establish an impedance model for three-phase grid-connected inverters, which has a clear physical meaning and a simple stability criterion. It can accurately reveal the oscillation mechanism and effectively reduce the number of variables. This method is often used to analyze the stability of grid-connected systems [14]. In [15], a time-domain input impedance model based on harmonic linearization for single-phase LCL-type grid-connected voltage source converters was established. The influence of the grid impedance on the stability of single-phase VSCs was analyzed using the generalized Nyquist criterion. In [16,17], an impedance model was established for three-phase LCL-type grid-connected inverters, and the stability of the grid system was analyzed using the Nyquist criterion. In [18], an impedance model considering the phase-locked loop (PLL), current control loop, and decoupling control method with an established LCL filter. The influence of controller parameters and control strategies on system stability was analyzed using the generalized Nyquist criterion. In [19], a unified impedance model for grid-connected voltage source converters was proposed. The dynamic influence of PLL and current control was analyzed based on the unified impedance model. However, the impedance models established in the above references did not consider the influence of the coupling compensation term on the grid-side voltage. In [20], an inverter output impedance model considering sampling and control delay was first established, and then an impedance compensation strategy based on voltage feedforward was proposed to improve system stability. In [21,22], the mechanism and characteristics of the damping loop were analyzed and explained from the perspective of grid-connected system stability. Aiming at the harmonic resonance problem of photovoltaic grid-connected systems, this paper first proposes a modular photovoltaic grid-connected system impedance modeling method based on harmonic linearization, and derives an impedance model for the photovoltaic grid-connected system with grid-side voltage coupling compensation terms. Then, the stability of the grid-connected system is analyzed based on the Nyquist criterion, revealing the mechanism of oscillation generation in photovoltaic grid-connected systems. Further analysis summarizes the influence of system parameter variations on the impedance characteristics of the photovoltaic grid-connected system and system stability. On this basis, a design method for active damping based on lead correction and capacitive current feedback is proposed. The system parameters are tuned based on the impedance model of the photovoltaic grid-connected system with capacitive current feedback, and the impedance of the system in the easily oscillating frequency band is reshaped to achieve system oscillation suppression. Finally, a three-phase LCL-type photovoltaic grid-connected inverter system was built based on the Matlab/Simulink (R2022b) simulation platform. By comparing the system voltage, current, and dynamic characteristics under vector control and with the additional active damping control, it was proven that the use of additional active damping control can effectively suppress oscillation while maintaining its original dynamic characteristics. This verifies the effectiveness and feasibility of the designed active damping control.
The rest of this paper is organized as follows. In Section 2, the structure of the photovoltaic grid-connected system is introduced, and a modular method for impedance modeling of the photovoltaic grid-connected system is proposed. Based on this method, an impedance model of the photovoltaic grid-connected system, including a coupling compensation term of the grid-side voltage, is derived. The stability analysis of the grid-connected system is conducted using the Nyquist criterion, and further analysis is performed on the impact of parameter variations on the impedance characteristics of the photovoltaic grid-connected system and system stability in Section 3. In Section 4, an active damping design method based on lead correction and capacitive current feedback is proposed to suppress system oscillation. The effectiveness of the proposed method was verified by comparing it with the vector control method in Matlab/Simulink. Finally, the conclusions are drawn in Section 5.

2. Modeling of Positive and Negative Sequence Impedance in Photovoltaic Grid-Connected Systems

2.1. Photovoltaic Grid-Connected System Structure

The photovoltaic grid-connected system studied in this article is shown in Figure 1. The DC side of the photovoltaic power generation unit uses a simplified model, with its DC voltage equivalent to Udc, which is connected to the AC grid through a three-phase LCL grid-connected inverter. The LCL filter is composed of L1, L2, Cf, and Rd. L1 is the inverter side inductance, L2 is the grid side inductance, Cf is the filtering capacitor, and Rd is the series damping resistor. The AC grid uses a Thevenin equivalent circuit, with us as the power source and Zg as the equivalent impedance. S1S6 are the switching devices using IGBTs; uc is the inverter output voltage; ic, if, ig are the inverter side inductor current, filter capacitor current, and grid side inductor current, respectively; ug is the voltage at the point of common coupling (PCC); θPLL is the phase of ug, Hi(s) is the PI controller link, Hi(s) = kpinv + kiinv/s, kpinv, kiinv are the proportional integral coefficients of the inner loop current controller. ud, uq, id, and iq are the dq axis components of ug and ig, respectively. This article uses a control method with fixed active power and fixed reactive power in the outer loop, and direct current control in the inner loop. The photovoltaic power generation unit control system collects the voltage ug at the PCC point and the grid-side inductor current ig, and uses a phase locked loop (PLL) to lock the phase of ug. The dq-axis transformation of ug and ig is performed, and the control of the inverter is carried out in the dq-axis coordinate system.

2.2. Modular Impedance Modeling

This article considers a three-phase symmetric power grid situation, without zero sequence components. Assuming there are positive and negative sequence harmonic components in the voltage at the PCC Point and the grid-side inductive current, the expression for the a-phase voltage and current is as follows:
u ga = u 1 cos ( 2 π f 1 + φ u 1 ) + u p cos ( 2 π f p + φ up ) + u n cos ( 2 π f n + φ un ) i ga = i 1 cos ( 2 π f 1 + φ i 1 ) + i p cos ( 2 π f p + φ ip ) + i n cos ( 2 π f n + φ in )
In Equation (1): u1, up, un, f1, fp, fn, φu1, φup, φun, respectively, represent the amplitude, frequency, and initial phase of the fundamental wave, positive sequence, and negative sequence voltages; i1, ip, in, φi1, φip, φin, represent the amplitude and initial phase of the fundamental wave, positive sequence, and negative sequence currents. For ease of calculation, the Fourier transforms of the positive and negative sequence harmonic voltages and currents are denoted as upφup, ±fp), unφun, ±fn), ipφip, ±fp), and inφin, ±fn).
The positive and negative sequence harmonic impedance is the ratio of the positive and negative sequence harmonic voltage current, and its frequency domain expression is:
Z p ( ± f p ) = u p ( ± φ up , ± f p ) i p ( ± φ ip , ± f p ) Z n ( ± f n ) = u n ( ± φ un , ± f n ) i n ( ± φ in , ± f n )
The external circuit relationship of the parallel inverter can be represented by Equation (3), where the positive and negative sequence components of ig, ug, and uc all satisfy Equation (3).
( s L 1 + s L 2 + s 3 L 1 L 2 C f s C f R d + 1 ) i g + ( 1 + s 2 L 1 C f s C f R d + 1 ) u g = u c
The inverter control system collects the grid voltage ug and current ig as control signals and inputs them to the control loop. After internal current control, ug and ig output the reference voltage uc. Consequently, the positive and negative sequence harmonic components of uc can be linearly represented by the positive and negative sequence harmonic components of ug and ig. Thus, the expressions for the positive and negative sequence components of the phase a reference voltage, ucp and ucn, are as follows:
u cp = H V ( s j 2 π f 1 ) u p H I ( s j 2 π f 1 ) i p u cn = H V ( s ± j 2 π f 1 ) u n H I ( s ± j 2 π f 1 ) i n
Due to the convolutional processing performed in the Pike’s inverse transformation, the transfer functions corresponding to ucp and ucn exhibit a fundamental frequency shift, leading to a similar shift in the positive and negative harmonic component coefficients of uc, HV(s ∓ j2πf1), HI(s ∓ j2πf1), HV(s ± j2πf1), HI(s ± j2πf1).
By combining Equations (2)–(4), the expression for the positive and negative sequence harmonic impedance is obtained as Equation (5). Based on Formula (5), it can be inferred that when the external circuit parameters are known, if the values of HV(s ∓ j2πf1), HI(s ∓ j2πf1), HV(s ± j2πf1), HI(s ± j2πf1) are obtained, the positive and negative sequence harmonic impedances can be accurately determined.
Z ± f p = s L 1 + s L 2 + s 3 L 1 L 2 C f s C f R d + 1 + H I s j 2 π f 1 1 + s 2 L 1 C f s C f R d + 1 H V s j 2 π f 1 Z ± f n = s L 1 + s L 2 + s 3 L 1 L 2 C f s C f R d + 1 + H I s ± j 2 π f 1 1 + s 2 L 1 C f s C f R d + 1 H V s ± j 2 π f 1
Since the coefficients of the positive and negative sequence harmonic components of uc have only been shifted in the frequency domain based on the fundamental frequency, only one phase sequence harmonic component coefficient needs to be calculated. Below, the calculation of the positive sequence harmonic component coefficient is taken as an example for modular sequence impedance modeling.
The three-phase AC voltage and current are controlled through the Park transformation into dq-axis voltage and current. In the steady state, the control loop only contains the DC component after the Park transformation. Due to the presence of harmonic voltage and current, their Park transformation introduces AC components. The dq-axis voltage and current can be expressed as upφup, ±(fpf1)),up(±(φup − π/2), ± (fpf1)) − u1Δθ, ipφip, ±(fpf1)) + i1sin(φi1θ, and ip(± (φip − π/2), ±(fpf1)) − i1cos(φi1θ. Δθ is the disturbance of harmonic voltage and current to the output phase of the phase-locked loop, which can be decomposed into a linear combination of ug and ig [23]:
Δ θ = j G ( s ) u p ( ± φ up , ± ( f p f 1 ) )
As shown in Figure 2, the inverter control loop can be divided into a DC component equivalent model and an AC component equivalent model. ucddc, ucqdc, ucdac, and ucqac represent the DC component and AC component of the dq-axis reference voltage, respectively. Under the DC component equivalent model, the signals injected into the control loop are all constant values. Since the steady-state dq-axis reference current is equal to the actual dq-axis current, the dq-axis reference voltage is only determined by the coupling compensation term. Under the AC component equivalent model, the dq-axis reference voltage is not only determined by the coupling compensation term, but also influenced by the current inner-loop PI control loop. By further simplifying the AC component equivalent model, the model shown in Figure 3 is obtained.
In Figure 3, the red line represents the input of the harmonic voltage upφup, ±(fpf1)), and the green line represents the input of the harmonic current ipφip, ±(fpf1)). The values along the path are the gains of the corresponding circuit. The time-domain expression of the a-phase reference voltage output by the controller is:
u ca ( t ) = cos ( 2 π f 1 t ) [ u cdac ( t ) Δ θ ( t ) u cqdc ] sin ( 2 π f 1 t ) [ u cqac ( t ) + Δ θ ( t ) u cddc ]
To solve for the harmonic impedance expression in the frequency domain, we perform a Fourier transform on the above equation. The direct current (DC) component is given by −cos(2πf1t)Δθ(t)ucqdc − sin(2πf1t)Δθ(t)ucddc. According to the Fourier transform properties, multiplication in the time domain equals convolution in the frequency domain. The DC components of the dq-axis reference voltage, ucddc and ucqdc, do not contain the time variable t. Therefore, only the convolution of cos(2πf1t)Δθ(t) and sin(2πf1t)Δθ(t) needs to be performed. The Fourier transform of the trigonometric functions is in the form of an impulse function. Therefore, after convolution, it is equivalent to shift the Fourier transform of Δθ(t) in frequency. The term with the cosine function cos(2πf1t) multiplies 1/2, and the term with the sine function sin(2πf1t) multiplies ±1/2j. Similarly, for the AC components cos(2πf1t)ucdac − sin(2πf1t)ucqac, only the Fourier transforms of ucdac and ucqac need to be shifted in frequency and then multiplied by the corresponding coefficients. When combining like terms, we use a one-to-one correspondence principle, that is, the coupling compensation term coefficients are combined, and the current inner loop PI control loop coefficients are combined. Finally, the expressions for HV(s) and HI(s) are obtained:
H VPQ ( s ) = 0.5 0.5 i 1 H i ( s ) G ( s ) e j φ i 1 + 0.5 j k dq i 1 G ( s ) e j φ i 1 + 0.5 G ( s ) ( u cddc + j u cqdc ) H IPQ ( s ) = H i ( s ) + j k dq
In the equation, HVPQ(s) and HIPQ(s) represent HV(s) and HI(s) under PQ control. By substituting Equation (8) into Equation (5), the expression for the sequence impedance under PQ control is obtained as follows:
Z ± f p = s L 1 + s L 2 + s 3 L 1 L 2 C f s C f R d + 1 + H i ( s j 2 π f 1 ) + j k dq 1 + s 2 L 1 C f s C f R d + 1 0.5 + 0.5 G ( s j 2 π f ) 0.5 i 1 H i ( s j 2 π f 1 ) e j φ i 1 + 0.5 j k dq i 1 e j φ i 1 + u cddc + j u cqdc Z ± f n = s L 1 + s L 2 + s 3 L 1 L 2 C f s C f R d + 1 + H i ( s ± j 2 π f ) + j k dq 1 + s 2 L 1 C f s C f R d + 1 0.5 + 0.5 G ( s ± j 2 π f ) 0.5 i 1 H i ( s ± j 2 π f 1 ) e j φ i 1 + 0.5 j k dq i 1 e j φ i 1 + u cddc + j u cqdc

2.3. Frequency Sweeping Verification of Photovoltaic Series Impedance Model

Based on the Matlab/Simulink simulation platform, a photovoltaic power generation unit simulation model is constructed, as shown in Figure 1. Specific parameters are listed in Table 1. Meanwhile, in Matlab/Simulink, the positive and negative sequence harmonic impedance expressions of each system are written to perform theoretical calculations. To compare with the time-domain simulation values, the impedance of the simulation system is measured using a frequency scanning method. The specific method is as follows: inject a specific frequency positive and negative sequence harmonic voltage at the PCC point, and measure the positive and negative sequence voltage and current at the exit of the photovoltaic grid-connected system. Then, perform Fourier decomposition on them to obtain the voltage and current harmonic components at that frequency. The ratio of the two is the positive and negative sequence harmonic impedance at that frequency.
The theoretical curve of the impedance of the photovoltaic grid-connected system is shown in Figure 4, along with the time-domain simulation curve. The theoretical values of the impedance model are essentially consistent with the time-domain simulation values, showing good agreement with the latter. For both positive and negative sequence impedances, at low frequencies, there is a certain difference between them. In the expression for positive sequence impedance, the transfer functions of the phase-locked loop (PLL) and the inner-loop current controller result in a negative frequency shift due to convolution calculations, causing significant fluctuations in the impedance magnitude and phase around the fundamental frequency. In contrast, the expression for negative sequence impedance contains a positive frequency shift, leading to a smoother impedance magnitude and phase at low frequencies with no significant changes. At high frequencies, the trends exhibited by positive and negative sequence impedances are essentially consistent, both having two resonant peaks. As the frequency increases, their phases approach 90°, which is determined by the frequency characteristics of the LCL-type filtering circuit.

3. Resonance Stability Analysis of Photovoltaic Grid-Connected Systems

This section first conducts stability analysis of the grid-connected system based on the Nyquist criterion, revealing the mechanism of oscillation generation in photovoltaic grid-connected systems. Further, combined with the previously established sequence impedance model of the photovoltaic grid-connected system, it provides a detailed analysis and summary of the impact of system parameter variations on the impedance characteristics of the photovoltaic grid-connected system and system stability.

3.1. Resonance Stability Analysis

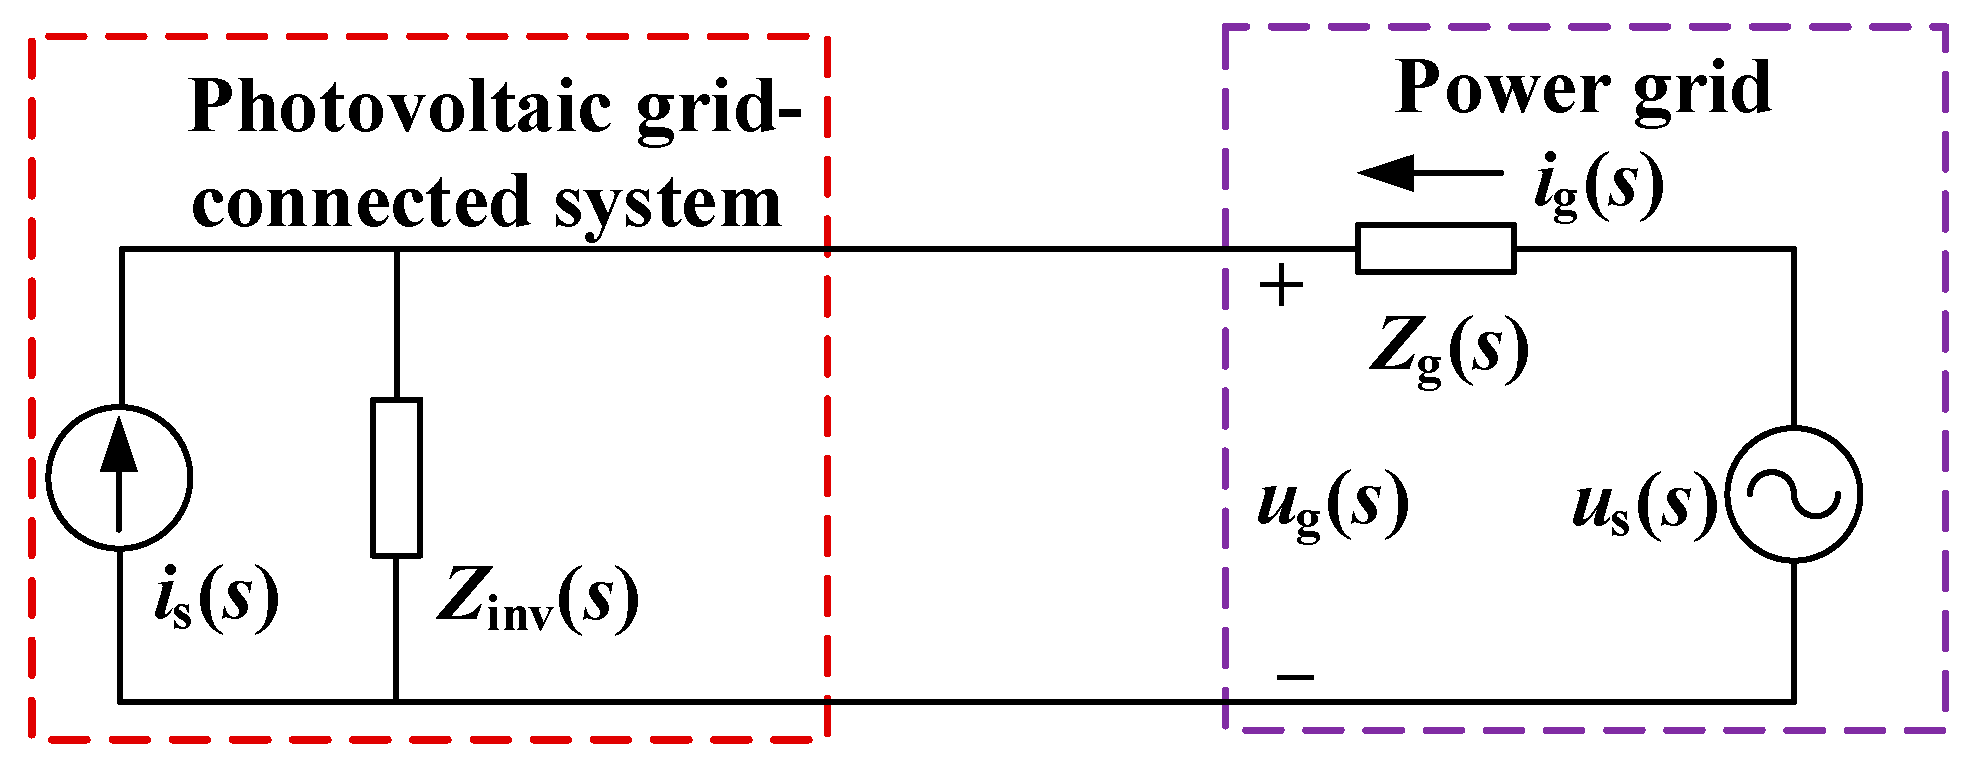
In the impedance stability criterion, Figure 1 can be equivalent to the small-signal model shown in Figure 5. The photovoltaic grid-connected system adopts the Norton equivalent, which is equivalent to the parallel form of the current source is(s) and the output impedance Zinv(s). The power grid adopts the Thevenin equivalent, which is equivalent to the series form of the voltage source us(s) and the equivalent impedance Zg(s) on the grid side.
Based on Figure 5, the expression for the PCC point voltage ug(s) can be obtained:
u g ( s ) = i s ( s ) Z g ( s ) + u s ( s ) 1 1 + Z g ( s ) / Z inv ( s )
The stability of the system mainly depends on the stability of the closed-loop transfer function of 1/(1 + Zg(s)/Zinv(s)). The forward path of this transfer function is 1, the feedback path is Zg(s)/Zin(s), and the open-loop transfer function is Zg(s)/Zin(s). When Zg(s)/Zin(s) satisfies the logarithmic frequency stability criterion, the system is stable.
Let the crossing frequency of grid-side impedance and parallel subsystem impedance amplitude be fi, and define the phase margin PM as:
PM = 180 angle ( Z g ( f i ) ) angle ( Z inv ( f i ) )
If the phase margin PM is less than 0°, the system will be unstable; if the phase margin PM is between 0° and 30°, the system will have poor robustness and be susceptible to the influence of harmonic sources, affecting system stability.
Figure 6 shows the impedance characteristics of the photovoltaic grid-connected system before impedance reshaping. The black dashed lines in the figure correspond to the curves at Zg = 0.1 mH, 1 mH, and 6 mH, which intersect with the impedance amplitude of the photovoltaic grid-connected system. The impedance of the photovoltaic grid-connected system exhibits insufficient phase margin in the frequency band of 1 kHz–5 kHz, with a phase of approximately −92°. The corresponding range of the grid-side impedance Zg is 0.1~6 mH, indicating a relatively severe oscillation risk in this case. In the frequency band of 10 kHz and above, the impedance phase of the photovoltaic grid-connected system is close to 90°, indica ting a larger phase margin. The system is relatively stable at this time. To increase the system’s phase margin and reduce the risk of oscillation, it is necessary to raise the impedance phase of the photovoltaic grid-connected system in the frequency band of 1 kHz–5 kHz. To maintain a large phase margin, it is recommended to increase the impedance phase in the frequency band of 1 kHz–5 kHz to at least −60°.

3.2. Analysis of the Impact of Parameter Variations on System Impedance Characteristics and Harmonic Resonance Characteristics

Based on the analysis of the modeling process in Section 2, considering the variables that have a great influence on the impedance characteristics of the photovoltaic grid-connected system, this section mainly studies the influence of the phase-locked loop proportional integral coefficient of the photovoltaic grid-connected system, the proportional integral coefficient of internal loop current controller, and the changes in the parameters of the filtering link on the DC side on the impedance characteristics of the photovoltaic grid-connected system and the stability of the system.

3.2.1. Analysis of the Influence of the Phase-Locked Loop (PLL) Proportional Integral Coefficient Change in the Photovoltaic Grid-Connected System

The proportional coefficient kpPLL_inv of the photovoltaic grid-connected system is set to 1.72, 17.2 m, and 172, respectively, and the integral coefficient kiPLL_inv is set to 49.22, 492.2, and 4922, respectively. To simulate weak power grids and large power grids, the equivalent inductance Zg is taken as 0.001 H. Other parameters remain unchanged, and the impedance characteristics and stability of the photovoltaic grid-connected system under different kpPLL_inv and kiPLL_inv values are studied.
From Figure 7, it can be observed that regardless of kpPLL_inv values of 1.72, 17.2, or 172, and kiPLL_inv values of 49.22, 492.2, or 4922, the photovoltaic grid-connected system’s phase-locked loop (PLL) only affects the impedance characteristics near the fundamental frequency. The impact of the scaling coefficient on the impedance amplitude is less significant than the impact of the integral coefficient on the impedance amplitude, while the influence on the impedance phase is greater than that of the integral coefficient. For kpPLL_inv values of 1.72, 17.2, or 172, there is essentially no change in the amplitude of the impedance near the fundamental frequency, with the phase increasing for frequencies below the fundamental frequency and decreasing for frequencies above it. Conversely, for kiPLL_inv values of 49.22, 492.2, or 4922, the amplitude of the impedance near the fundamental frequency gradually decreases, with peaks at (26.6 dB, 27.9 dB), (26.1 dB, 26.5 dB), and (24.1 dB, 24.3 dB). However, the influence on the impedance phase is minimal, with a slight decrease in phases below the fundamental frequency. In summary, the photovoltaic grid-connected system’s PLL has a narrow bandwidth, and primarily affects the impedance characteristics near the low-frequency fundamental frequency band. At this point, the photovoltaic grid-connected system intersects with the impedance of the larger power grid at 2393 Hz, with a phase difference of 181.8°, indicating a significant oscillation risk.

3.2.2. Analysis of the Influence of the Inner Loop Proportional Integral Coefficient Change in the Photovoltaic Grid-Connected System

The proportional coefficient kpinv of the inner loop current controller in the photovoltaic grid-connected system is set to 1, 10, and 100, respectively, and the integral coefficient kiinv is set to 16, 160, and 1600, respectively. Other parameters remain constant. The impedance characteristics and stability of the photovoltaic grid-connected system under different kpinv and kiinv values are studied.
From Figure 8, it can be observed that the impact of the proportional coefficient kpinv on the impedance of the photovoltaic grid-connected system is generally greater than that of the integral coefficient kiinv. The influence of kpinv on the impedance characteristics of the photovoltaic grid-connected system is mainly concentrated in the frequency bands of 1 Hz to 30 Hz and 70 Hz to 10 kHz, with the greatest impact on the impedance characteristics in the 70 Hz to 10 kHz frequency band. When kpinv = 1, 10, and 100, the amplitude of the photovoltaic grid-connected system in the 1 Hz to 30 Hz frequency band slightly decreases from 23 dB to 24 dB, to 15 dB to 16 dB. The phase of this frequency band gradually decreases and becomes smoother, from around 11° to approximately −50°. In contrast, the impedance characteristics of the photovoltaic grid-connected system in the 70 Hz to 10 kHz frequency band undergo more significant changes. When kpinv = 1, a new resonant point appears near 90 Hz, with a resonant peak amplitude of 45.4 dB. The phase at the resonant peak suddenly changes from 94° to −67.2°. In the high-frequency oscillation band (2 kHz to 5 kHz), the intersection point with the grid impedance amplitude shifts to the left, with a frequency of 2130 Hz and a corresponding phase difference of 154.1°. The phase in the oscillation-prone frequency band is higher than that when kpinv = 10, from −91.6° to approximately −65.5°. When kpinv = 100, the overall impedance amplitude from 70 Hz to 10 kHz is increased, with the intersection point frequency with the grid impedance amplitude shifting to the right, to a frequency of 3870 Hz. The corresponding phase difference is 270.9°. Both resonant peak amplitudes increase, from 38.9 dB and −0.9 dB to 47.0 dB and 12.1 dB, respectively. The oscillation-prone frequency band shifts to the right and the phase margin in this frequency band becomes smaller, from −91.6° to approximately −160.9°, leading to worse system stability. In summary, under kpinv = 1, 10, and 100, the cross-point frequency and phase difference between the impedance of the photovoltaic grid-connected system and the impedance of the power grid are 2130 Hz and 154.1°, 2393 Hz and 181.8°, and 3870 Hz and 270.9°, respectively. Under these sets of parameters, the phenomenon of harmonic resonance is more likely to occur, with kpinv = 100 being the most severe.
The impact of kiinv on the impedance characteristics of the photovoltaic grid-connected system is mainly concentrated in the frequency band below 200 Hz. It has essentially no impact on the impedance characteristics of the photovoltaic grid-connected system in the high-frequency band. The intersection frequency with the grid impedance amplitude is also consistent. For kiinv = 16, 160, and 1600, the impedance amplitude below 30 Hz increases sequentially, from around 16 dB to 18 dB. The peak impedance amplitude near the fundamental frequency increases, from 20.1 dB and 20.2 dB to 26.6 dB and 27.8 dB, respectively. There is little impact on the impedance amplitude in the frequency band above 200 Hz. As for the phase, for kiinv = 16, 160, and 1600, the phase below 20 Hz increases sequentially, from −30° to approximately −22°. The phase has the most significant impact between 30 Hz and 70 Hz. The phase increases sequentially in the frequency band from 30 Hz to 50 Hz, and then decreases in the frequency band from 50 Hz to 70 Hz. The phase decreases sequentially in the frequency band from 100 Hz to 300 Hz, and has no significant impact on the remaining frequency bands. It does not affect the frequency of the resonant point.
In summary, the analysis of the influence of the parameters of the photovoltaic grid-connected system’s phase-locked loop and inner-loop current controller on the impedance characteristics of the photovoltaic grid-connected system leads to the following conclusion:
  • The parameters kpPLL_inv and kiPLL_inv of the phase locked loop (PLL) have a minor impact on the impedance characteristics of the photovoltaic grid-connected system, and they primarily affect the impedance characteristics around the fundamental frequency. kpPLL_inv mainly affects the impedance phase, while kiPLL_inv mainly affects the impedance magnitude. They do not impact the frequency of the intersection point between the impedance of the photovoltaic grid-connected system and the impedance magnitude of the power grid.
  • The parameters kpinv and kiinv of the inner-loop current controller have a greater impact on the impedance characteristics of the photovoltaic grid-connected system than the parameters of the phase-locked loop. Among them, kpinv has the greatest impact on the impedance of the photovoltaic grid-connected system, and the impact band is broad, with the highest frequency of the impact band reaching 10 kHz. Within a certain range, as kpinv increases, the impedance phase of the photovoltaic grid-connected system in the low-frequency band (below 30 Hz) decreases, the frequency of the intersection point between the impedance of the photovoltaic grid-connected system and the grid impedance shifts backward, and the phase margin in the easily oscillating frequency band becomes smaller. kiinv affects the impedance characteristics of the photovoltaic grid-connected system below 200 Hz, mainly affecting the phase in the frequency band of 30 Hz–70 Hz, and the impact on the amplitude is somewhat smaller.

4. Active Damping Design of the Photovoltaic Grid-Connected System Based on Positive and Negative Sequence Impedance Models

Adding damping resistors at the appropriate positions of the filter can improve the impedance characteristics of the external circuit to some extent, suppressing the resonance peak and realizing impedance reshaping. However, the introduction of damping resistors also brings additional power losses and the inability to adapt flexibly to operating conditions while suppressing resonance. Active damping, as an improvement to passive damping, introduces an additional control loop instead of the actual damping resistor, which can maintain the stable operation of the system while avoiding the above two problems. This section proposes an active damping design method based on lead correction and capacitor current feedback, and performs parameter tuning based on the impedance characteristics of the photovoltaic grid-connected system before reshaping and the impedance model of capacitor current feedback. Finally, the effectiveness of this method is verified in the simulation platform.

4.1. Active Damping Design Based on Lead Correction and Capacitive Current Feedback

4.1.1. Additional Active Damping Method
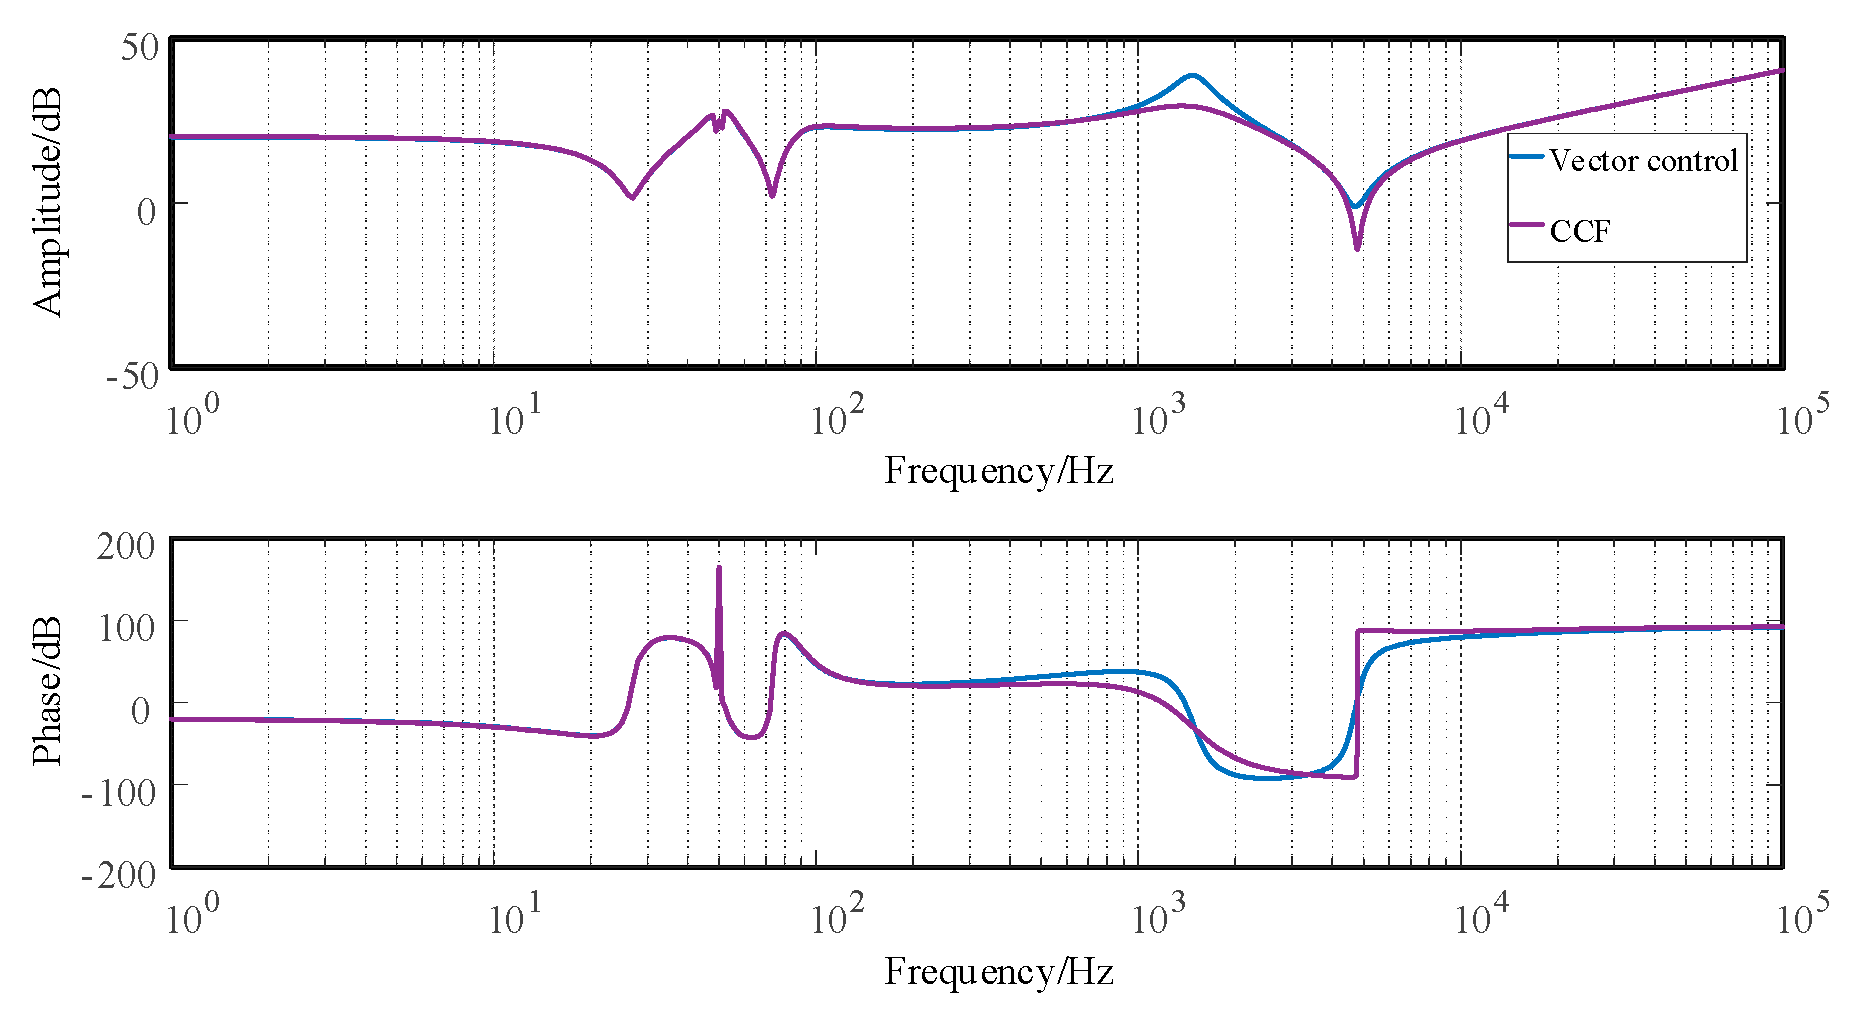
The impact of proportional capacitive current feedback (CCF) active damping control on filtering performance is minimal, thus, it has been widely adopted in the industry [24]. Figure 9 depicts the positive-sequence impedance diagram of a photovoltaic grid-connected system under CCF (capacitive current feedback), from Figure 9, it can be observed that the introduced capacitive current feedback loop reduces the amplitude of the first resonance peak of the impedance, but it does not significantly improve the phase margin of its resonant frequency band. To address this issue, this article introduces a series lead compensation based on CCF, which is used to change the phase frequency characteristics of the photovoltaic grid-connected system impedance, improve the phase margin in the mid-high frequency range, and thus enhance the robustness of the system. The series lead compensation strives to improve the phase margin in the mid-high frequency range of the photovoltaic grid-connected system impedance without changing the magnitude of the impedance.
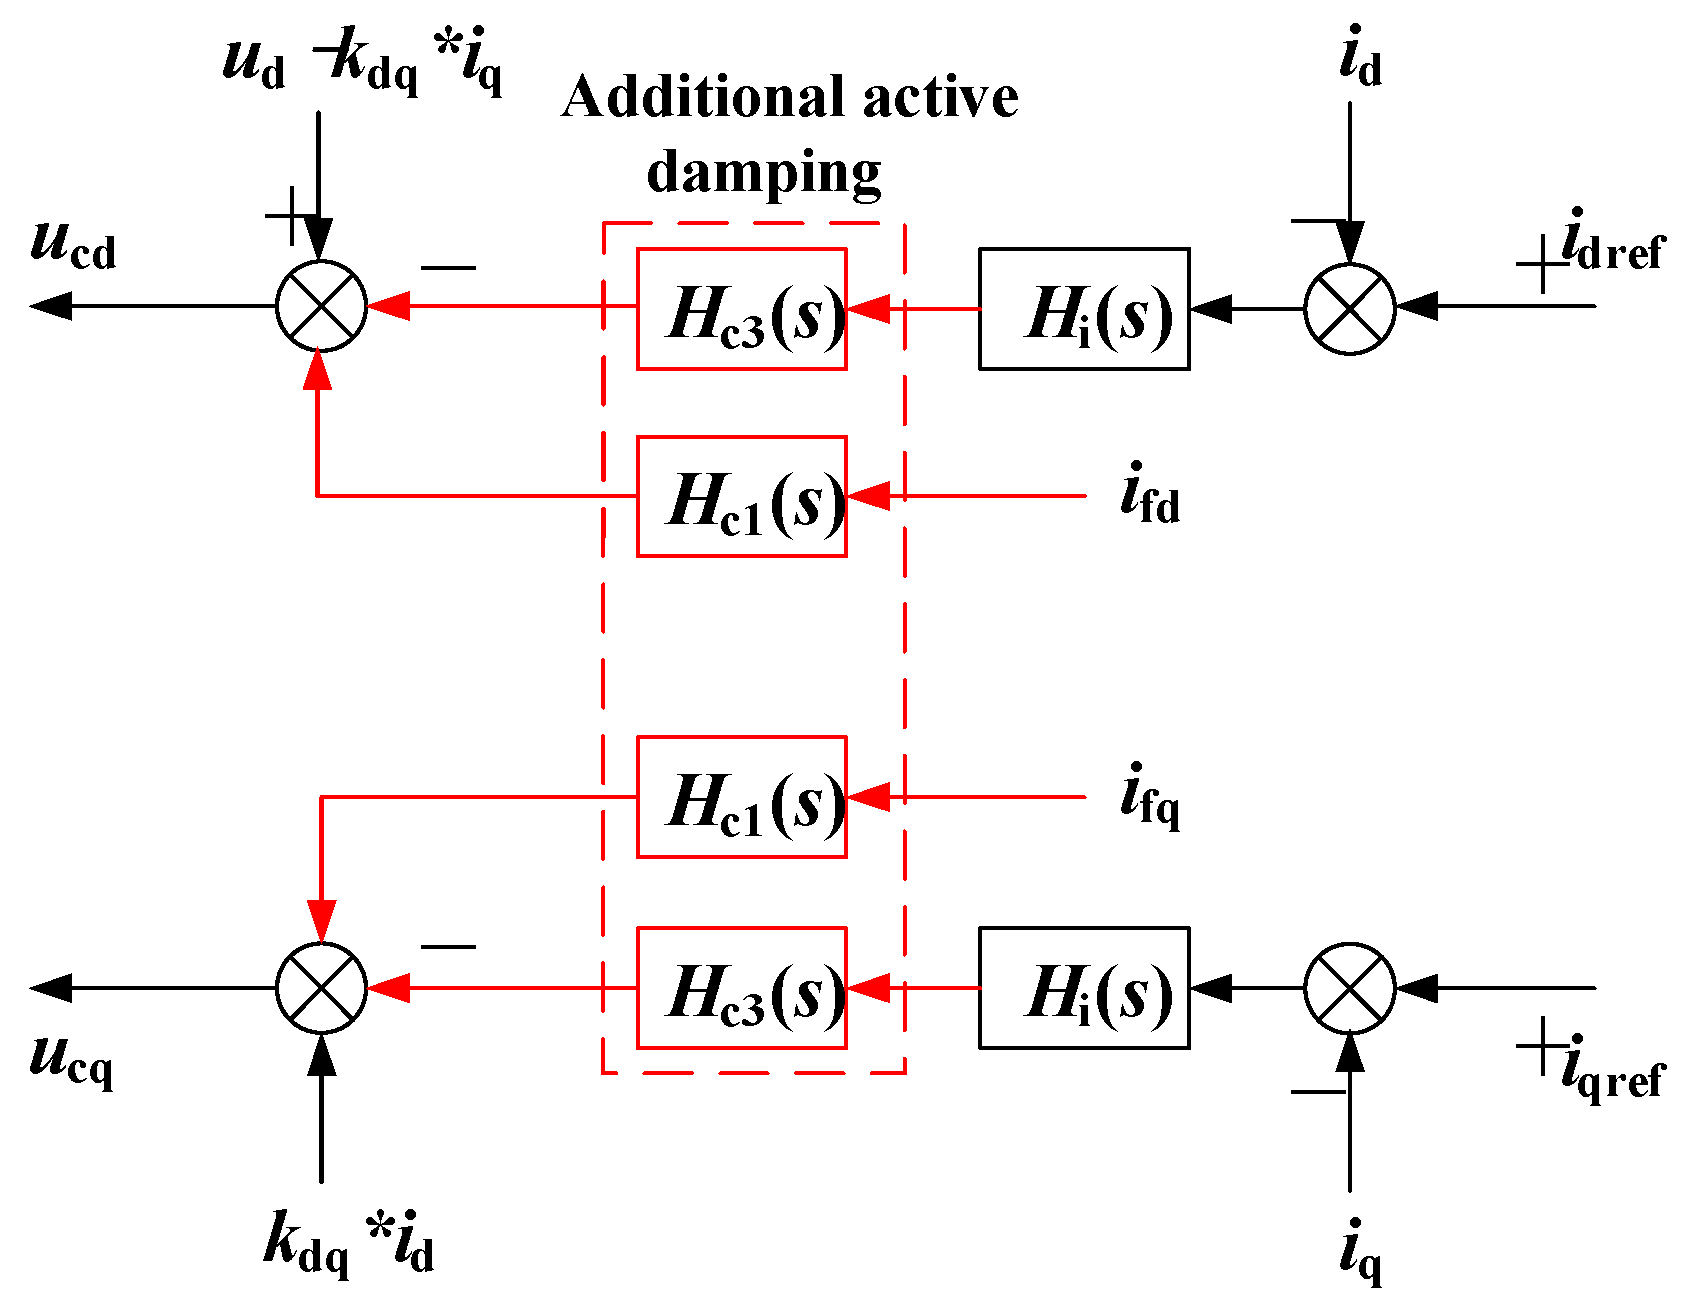
The inner-loop current control loop after the addition of an active damping link is shown in Figure 10. In Figure 10, ucd and ucq represent the reference voltages on the dq-axis of the inverter side, Hc1 indicates the capacitance current feedback compensation coefficient, and Hc3(s) represents the series lead correction loop. The calculation methods are as shown in Equations (12) and (13):
H c 1 = 1 C f R e
H c 3 ( s ) = 1 + α τ s 1 + τ s
In the equation, Re represents the parallel equivalent virtual resistance of the capacitor branch after the introduction of capacitive current feedback; α and τ denote the lead correction loop coefficient and time constant, respectively.
Figure 10. Structural diagram of additional active damping control.
Energies 17 01218 g010

4.1.2. Parameter Tuning

The idea of capacitive current feedback involves introducing the capacitor branch current as a feedback variable into the current inner-loop controller. This feedback loop only injects the capacitor current into the coupling compensation term. If Hc1 represents the feedback coefficient, with the introduction of capacitive current feedback, HV(s), HI(s) can be represented by HVPQ(s), HIPQ(s) under PQ control plus the increase from the introduced feedback loop.
H VCF ( s ) = H VPQ ( s ) + H c 1 s C f ( 0.5 u 1 1 ) 1 + s C f R d + 0.5 i 1 H c 1 s C f e j φ i 1 1 + s C f R d H ICF ( s ) = H IPQ ( s ) H c 1 s 2 C f L 2 1 + s C f R d
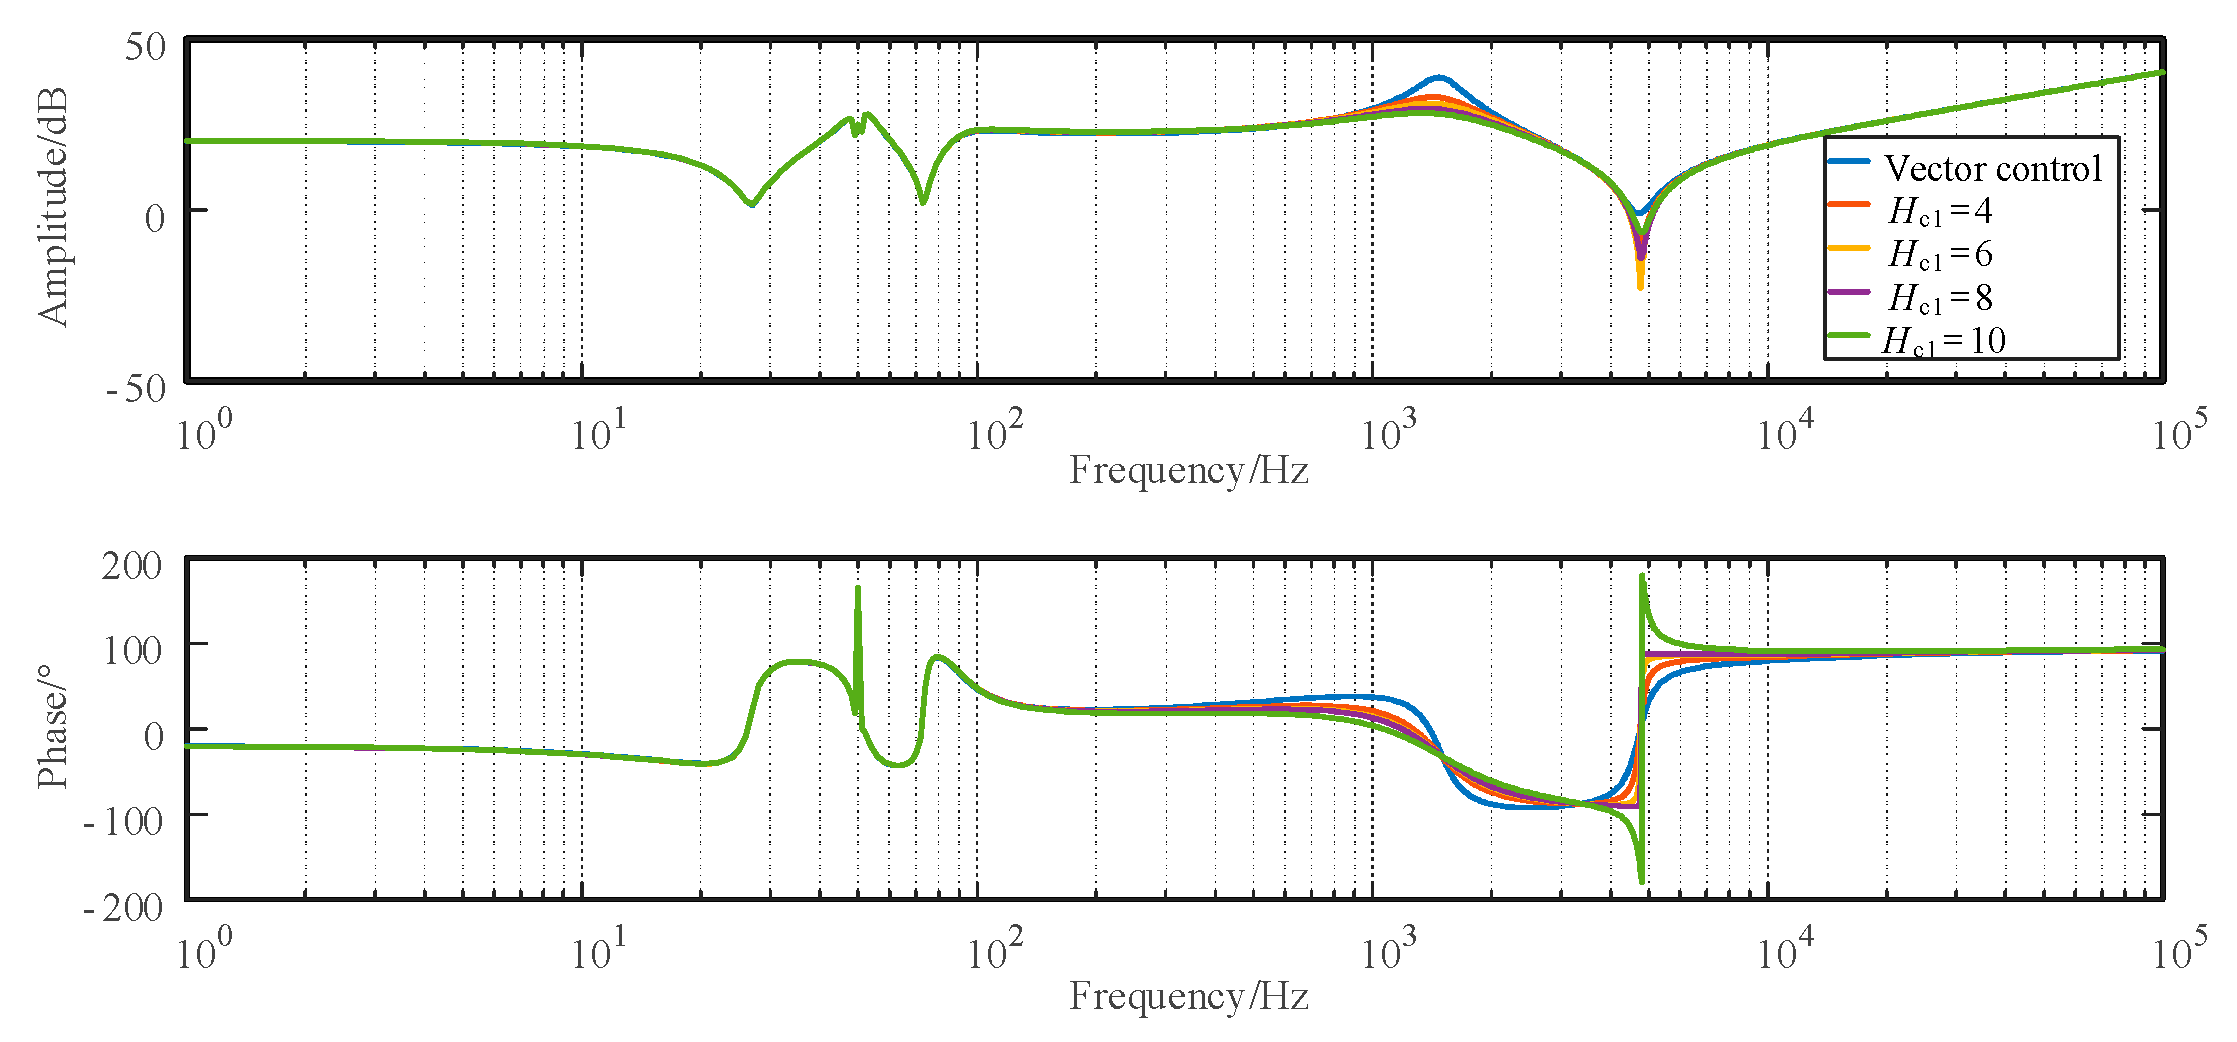
Substituting Equation (13) into Equation (5) can obtain the expression of the sequence impedance of the photovoltaic grid-connected system with capacitive current feedback. The Hc1 values selected are 4, 6, 8, 9, and 10, and an impedance characteristic diagram of the photovoltaic grid-connected system with capacitive current feedback is plotted in Figure 11. The first resonance peak values of the corresponding impedance amplitude are 38.9 dB, 33.1 dB, 31.1 dB, 29.7 dB, and 28.4 dB, respectively. It can be observed that as the feedback compensation coefficient Hc1 increases, the rate at which its peak value decreases becomes increasingly slow, with the decrease being 5.8 dB, 2.0 dB, 1.4 dB, 1.3 dB, respectively. The rate of decrease reaches its maximum near Hc1 = 8. After introducing capacitive current feedback, the resonant peak of the amplitude-frequency curve is somewhat reduced, and the intersection of the impedance amplitude values located in the easily oscillatory frequency band shifts to the right. The maximum increase in impedance phase within the easily oscillatory frequency band is 11.2°, 18.4°, and 21.7° for Hc1 = 10, respectively. However, after Hc1 > 8, the phase of the impedance near the second resonant peak experiences significant fluctuations, with a smaller phase appearing in the rear of the easily oscillatory frequency band, introducing a new easily oscillatory frequency band. Considering the impact of the feedback compensation coefficient Hc1 on the amplitude-frequency and phase-frequency characteristics of the impedance, selecting Hc1 = 8 can effectively suppress the first resonant peak, eliminate some resonant intersections, thereby effectively improving the phase margin within the easily oscillatory frequency band. At the same time, it can avoid the redundancy caused by setting a large feedback compensation coefficient.
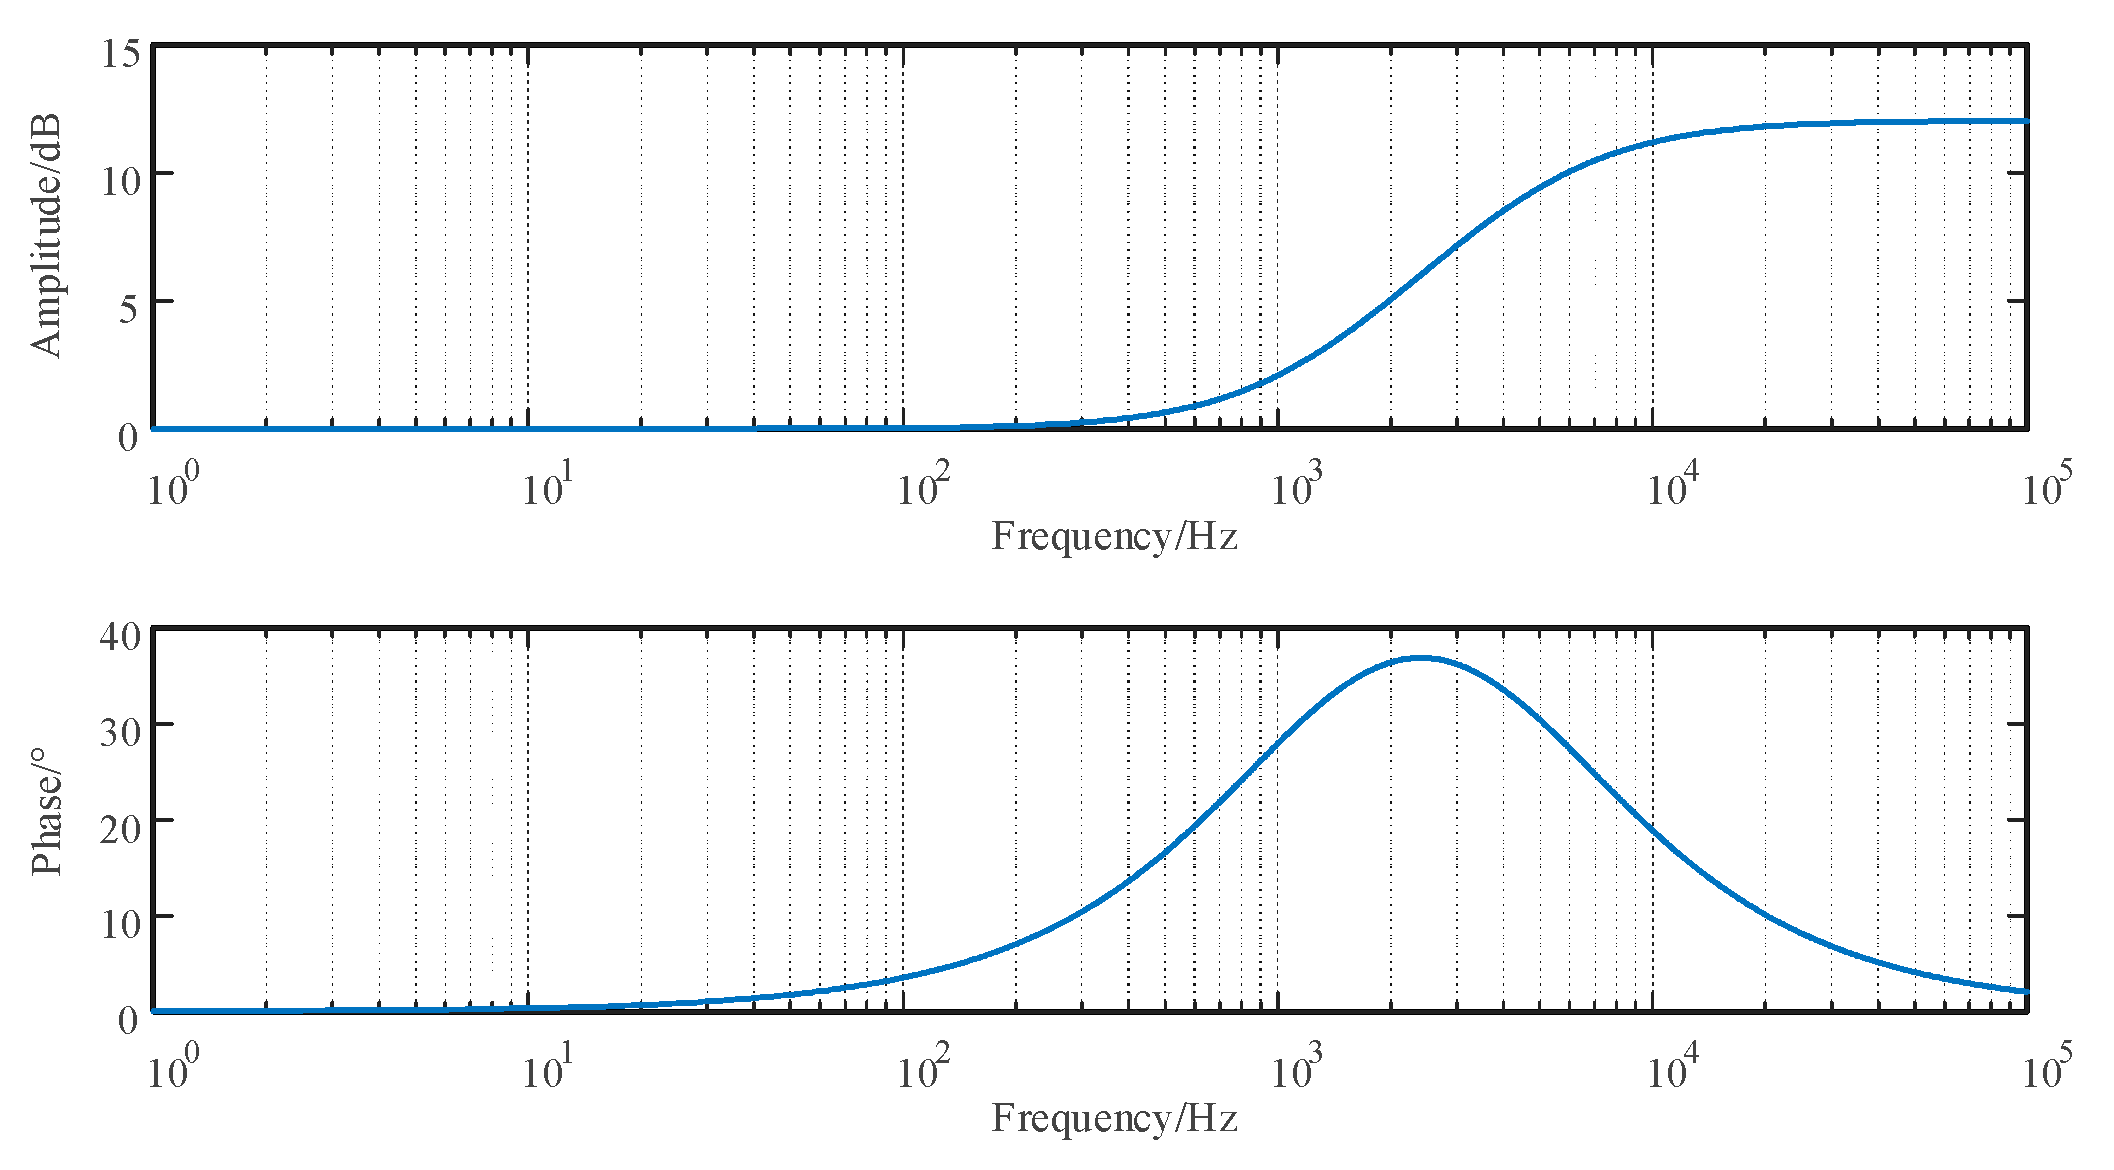
Figure 12 shows the characteristic curve of the lead correction loop. The amplitude of the lead correction loop increases monotonically with frequency after 100 Hz, with minimal variations. The phase, on the other hand, first increases and then decreases with frequency, reaching an extremum at the extreme frequency. To achieve a significant compensation effect from this loop, the extremum point should be chosen near the midpoint of the desired compensation frequency range. The phase function of the lead correction loop, φc3(ω), is as follows:
φ c 3 ( ω ) = arctan ( α 1 ) τ ω 1 + α τ 2 ω 2
To suppress the high-frequency oscillation of the photovoltaic grid-connected system and ensure that the compensation loop has a good compensation effect on the overall impedance phase angle, the midpoint phase in the oscillation-prone frequency band should be increased to at least −60°. The midpoint frequency of 2393 Hz within the oscillation-prone frequency band is selected as the maximum compensation point. By differentiating the phase function of the lead correction loop, we obtain its extreme value point ωm and the extreme value φm:
ω m = 1 τ α φ m = arctan α α α 2 α
The extreme point of the lead compensation section is set to the midpoint of the desired compensation frequency range, φm, which should be at least 32°. Setting φm to 45° gives α ≈ 3, and from the frequency of the extreme point being 2393 Hz, we obtain the time constant τ = 3.8 × 10⁻⁵.
The amplitude-frequency and phase-frequency plots after impedance remodeling of the photovoltaic grid-connected system are shown in Figure 13.
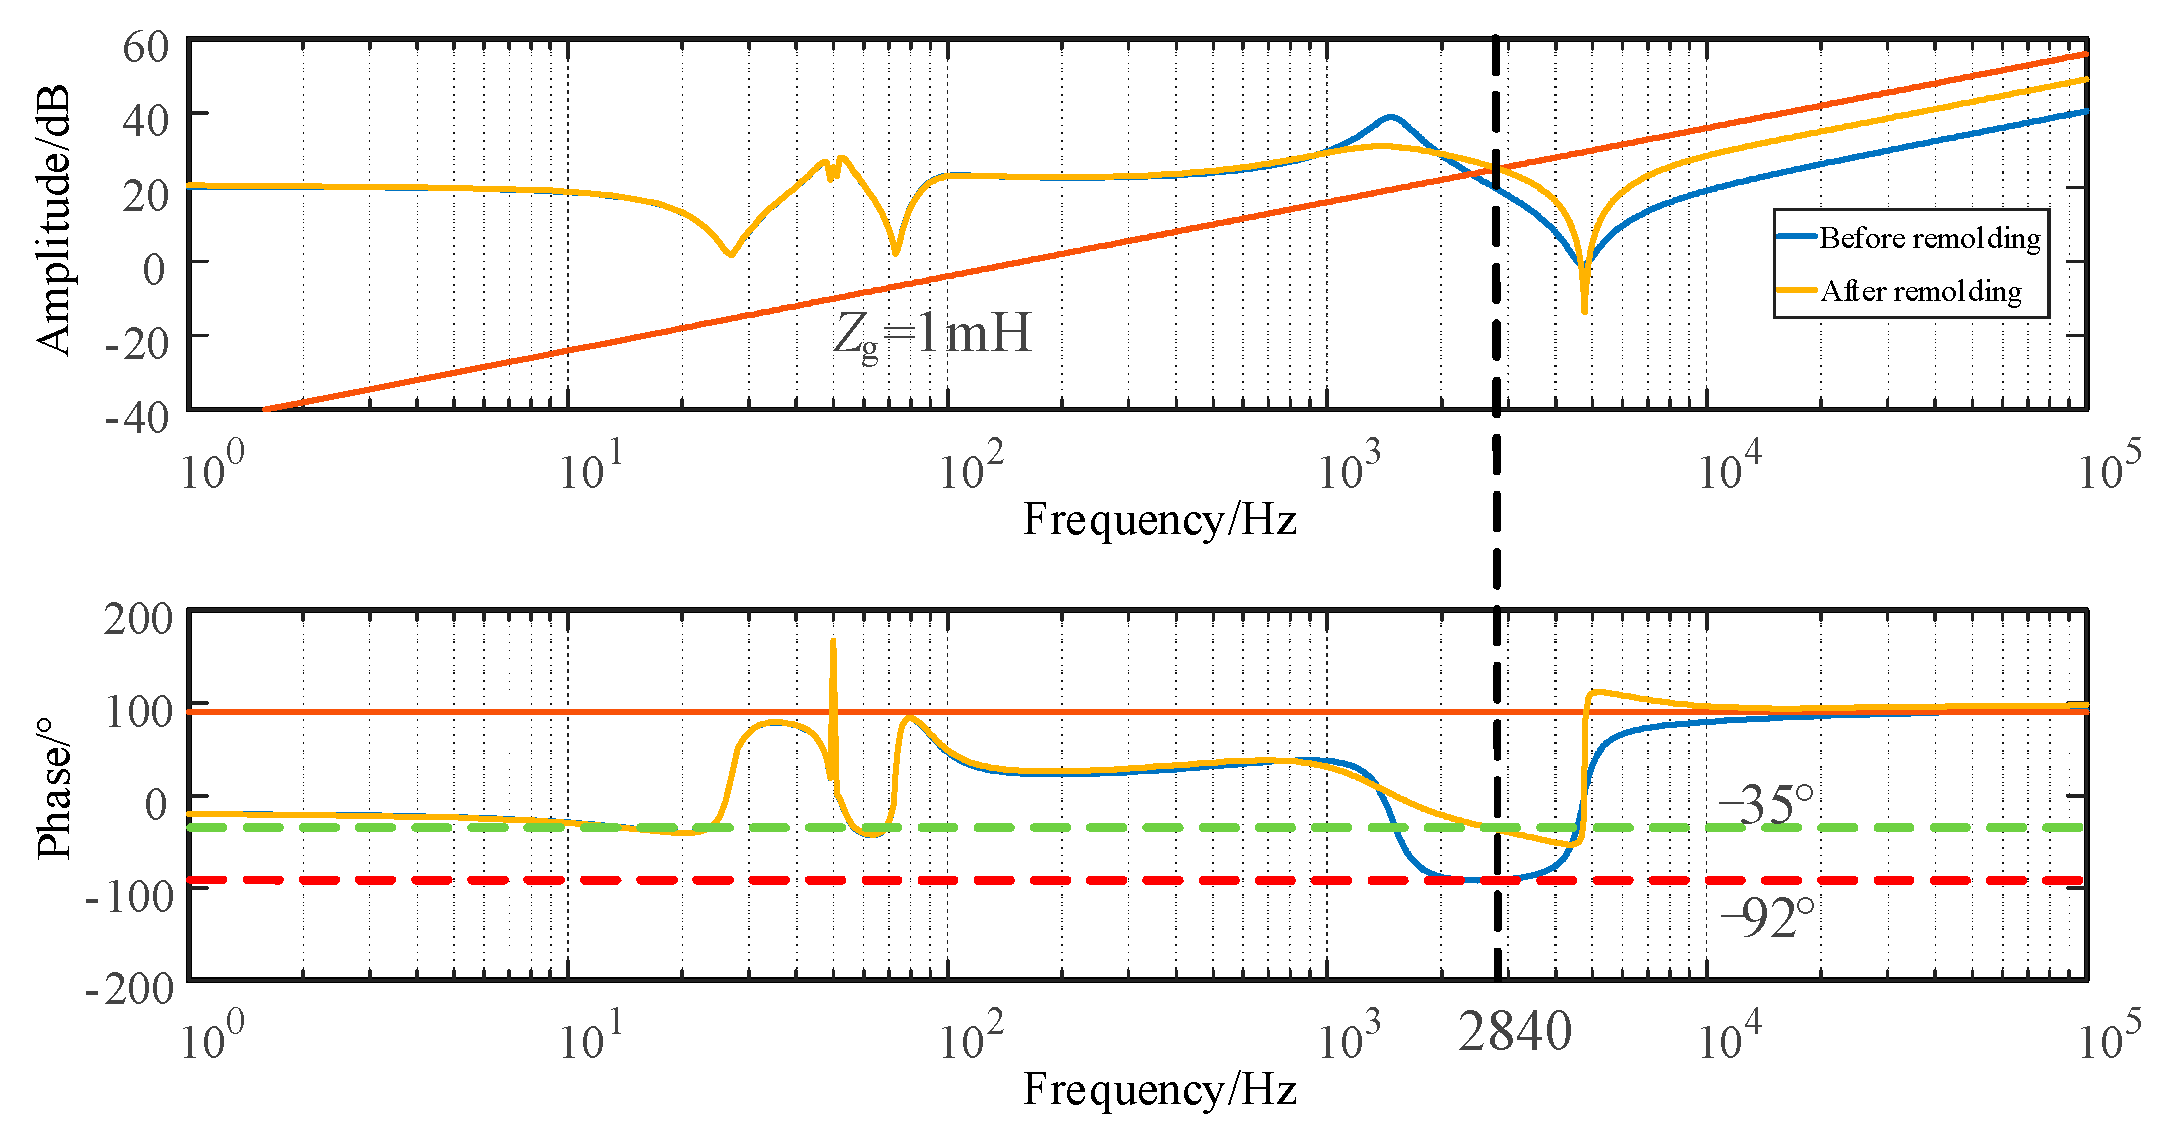
The low-frequency impedance characteristics of the photovoltaic grid-connected system have not been significantly affected. Due to the introduction of the capacitive current feedback control branch, damping has been increased. As a result, the intersection point between the amplitude of the photovoltaic grid-connected system impedance and the system impedance has shifted right, changing from 2393 Hz to 2840 Hz, and its resonant peak has also been reduced. After the lead correction link was introduced, the phase had a significant improvement at the frequency center of the required compensation, rising from around −92° to −35°. According to Formula (11) for calculating the phase margin PM of the system, it can be seen that the phase margin PM of the system has increased from −2° to 55°. The phase margin is greater than 30°, enhancing system robustness, thereby effectively suppressing system oscillation.

4.2. Simulation Verification of Active Damping Based on Lead Correction and Capacitive Current Feedback

To validate the effectiveness of the additional active damping design method, three sets of simulation experiments were conducted using the corresponding grid-side impedances Zg = 0.5 mH, 1 mH, and 6 mH within the phase margin deficiency range. The simulation step size was 1e−6 s. Before 0.2 s, conventional PQ vector control was employed, and after 0.2 s, it switched to the additional active damping control. The simulation results of the grid-connected system using vector control and additional damping control are shown in Table 2 and Figure 14.
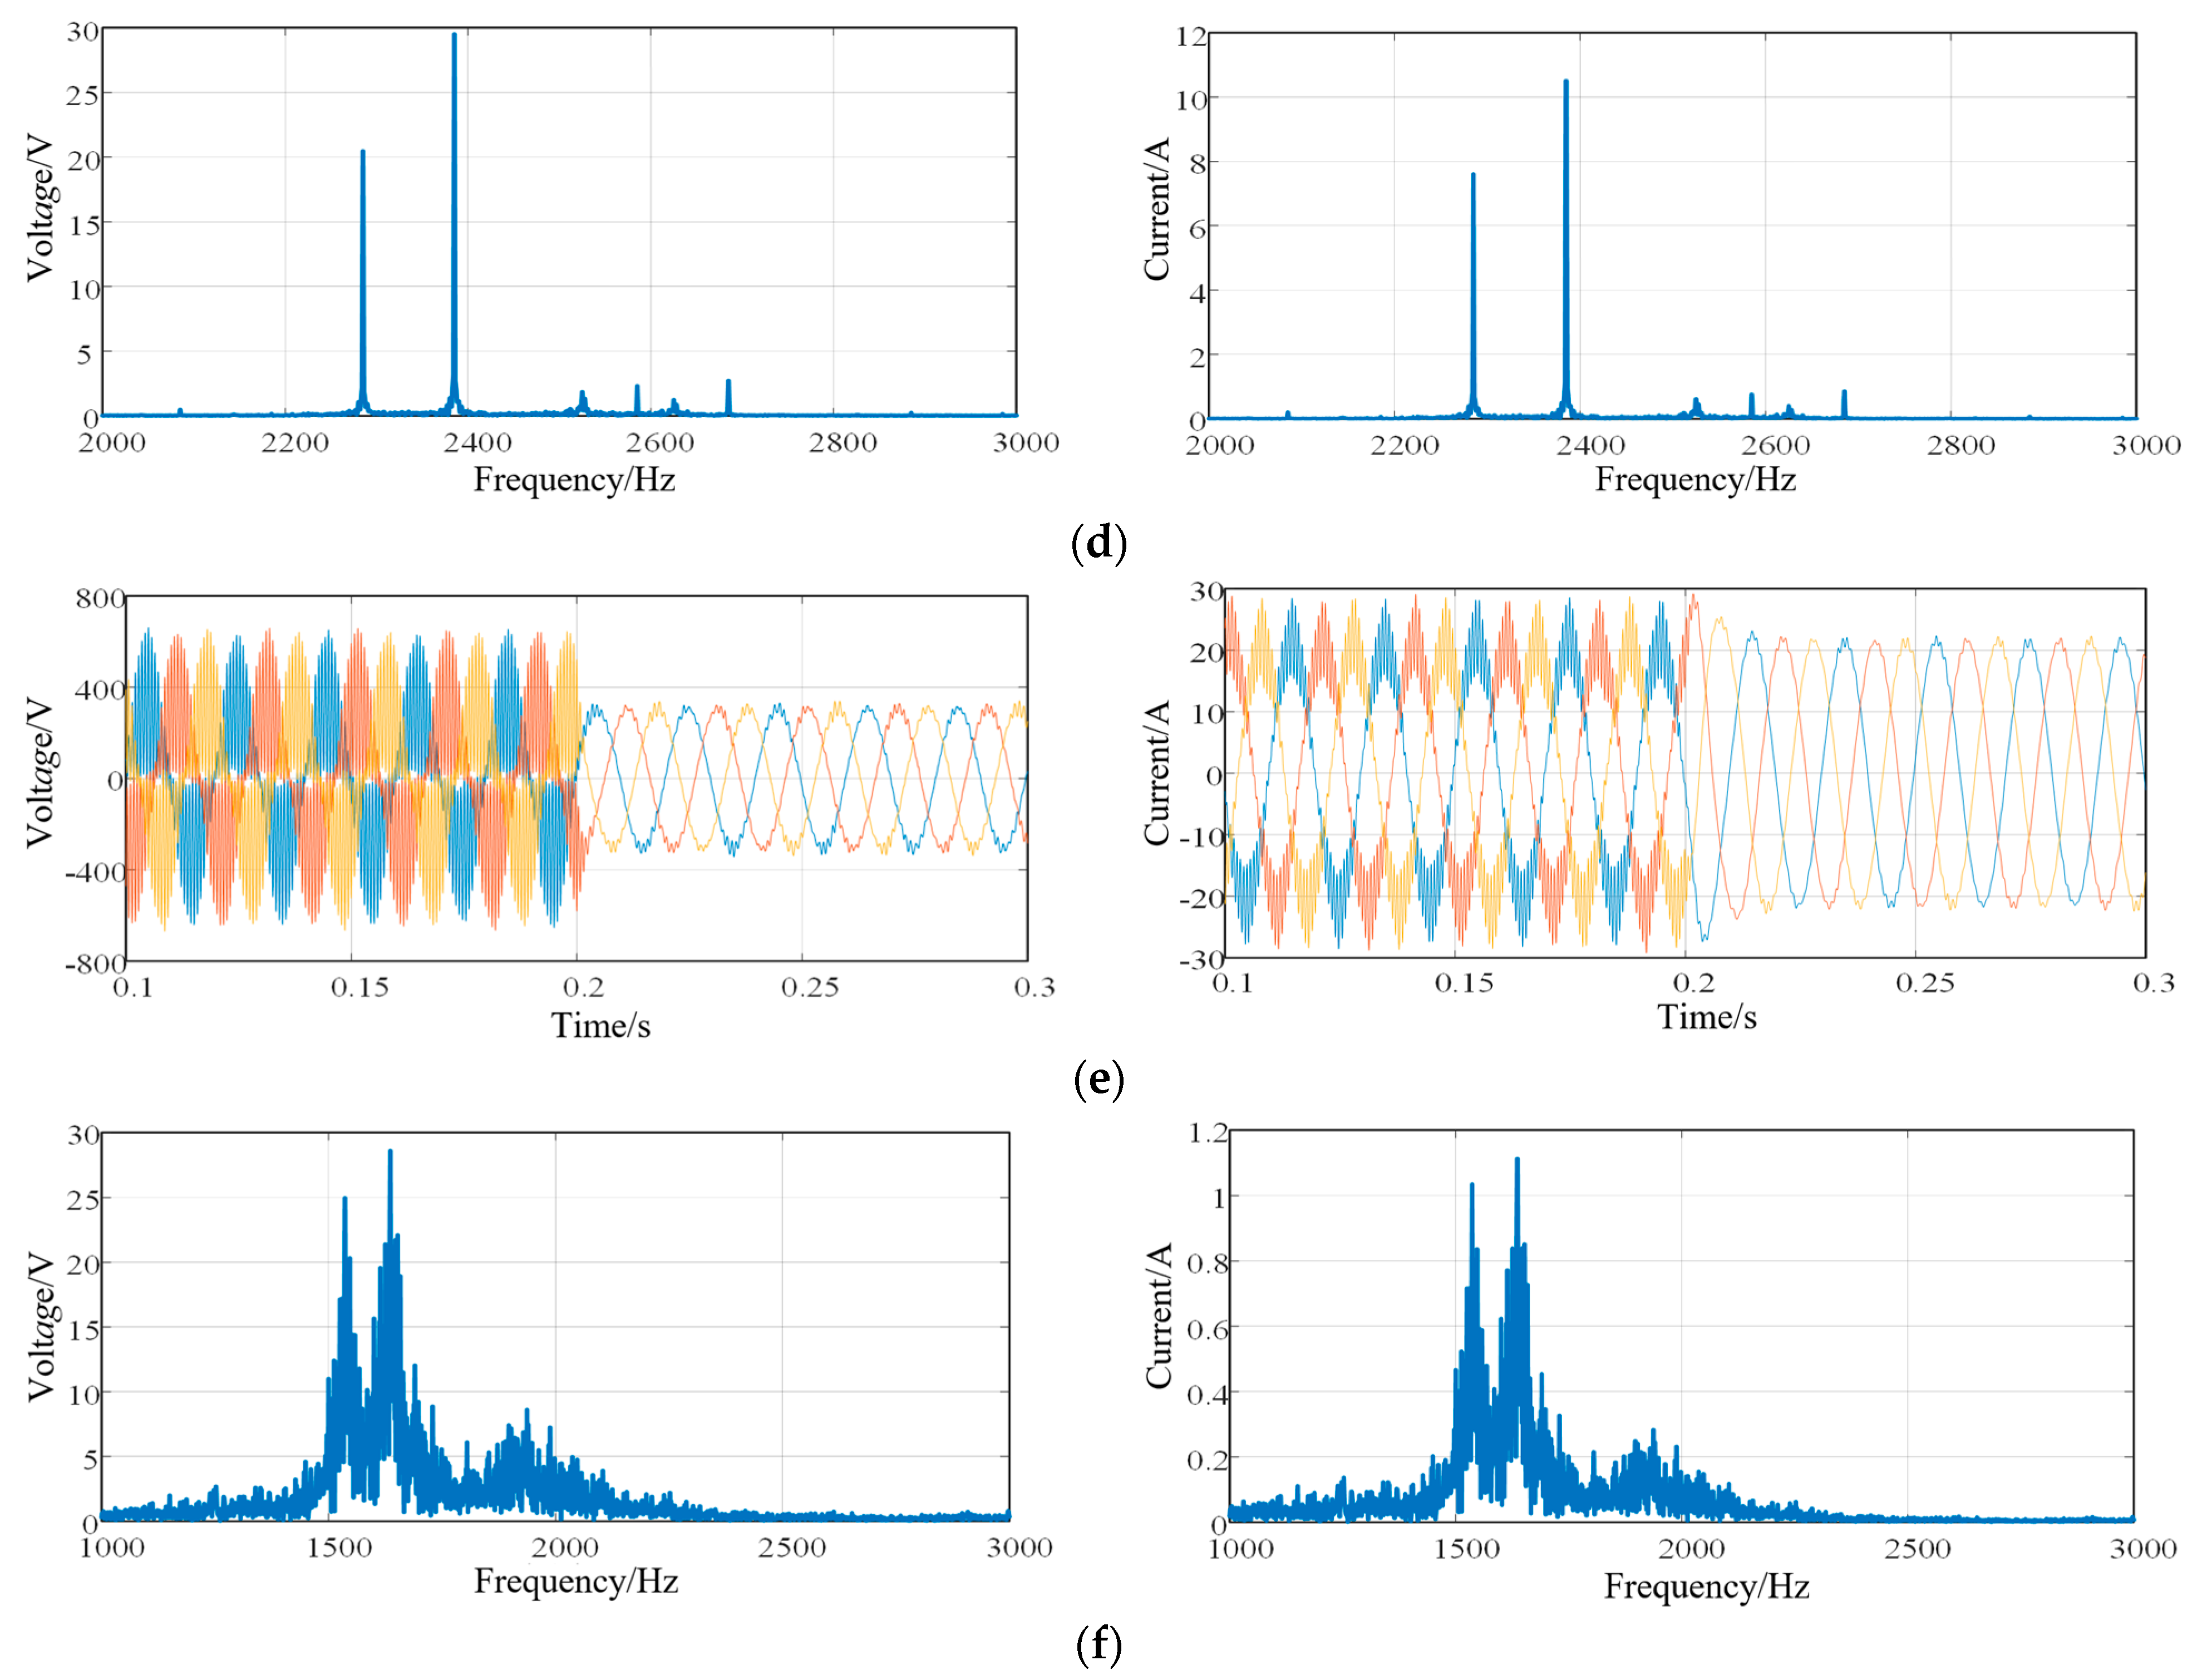
As can be seen from the simulation results, before 0.2 s, the voltage at PCC point and the current at the grid-side oscillated violently. Due to the existence of the frequency coupling effect, the harmonic wave at f frequency will output the harmonic wave at f − 2f1 frequency after going through the control link of the inverter, where f1 is the fundamental frequency. Therefore, the oscillation frequencies of Zg = 0.5 mH, 1 mH, and 6 mH are concentrated at 3835 Hz and 3935 Hz, 2283 Hz and 2383 Hz, and 1526 Hz and 1626 Hz, respectively, which are basically consistent with the intersection frequency of the impedance amplitude of the photovoltaic grid-connected system and the impedance amplitude of the grid in Figure 6. After switching to additional active damping control at 0.2 s, the voltage and current waveforms are symmetrical, the system quickly recovers to stability, and the voltage and current amplitudes return to stable values. The spectrum diagram is obtained after FFT analysis, and the spectrum diagram of the main oscillation frequency band is given. When Zg = 0.5 mH, 1 mH and 6 mH are controlled by vector control, THD is 15.4%, 54.3%, and 73.6%, respectively. The simulation results show that the impedance analysis method can be used to calculate the oscillation frequency of the system more accurately, and the additional active damping link based on the impedance characteristics can effectively suppress the system oscillation, the suppression speed is faster, the performance is better in the steady state, and the system will not cause another oscillation.
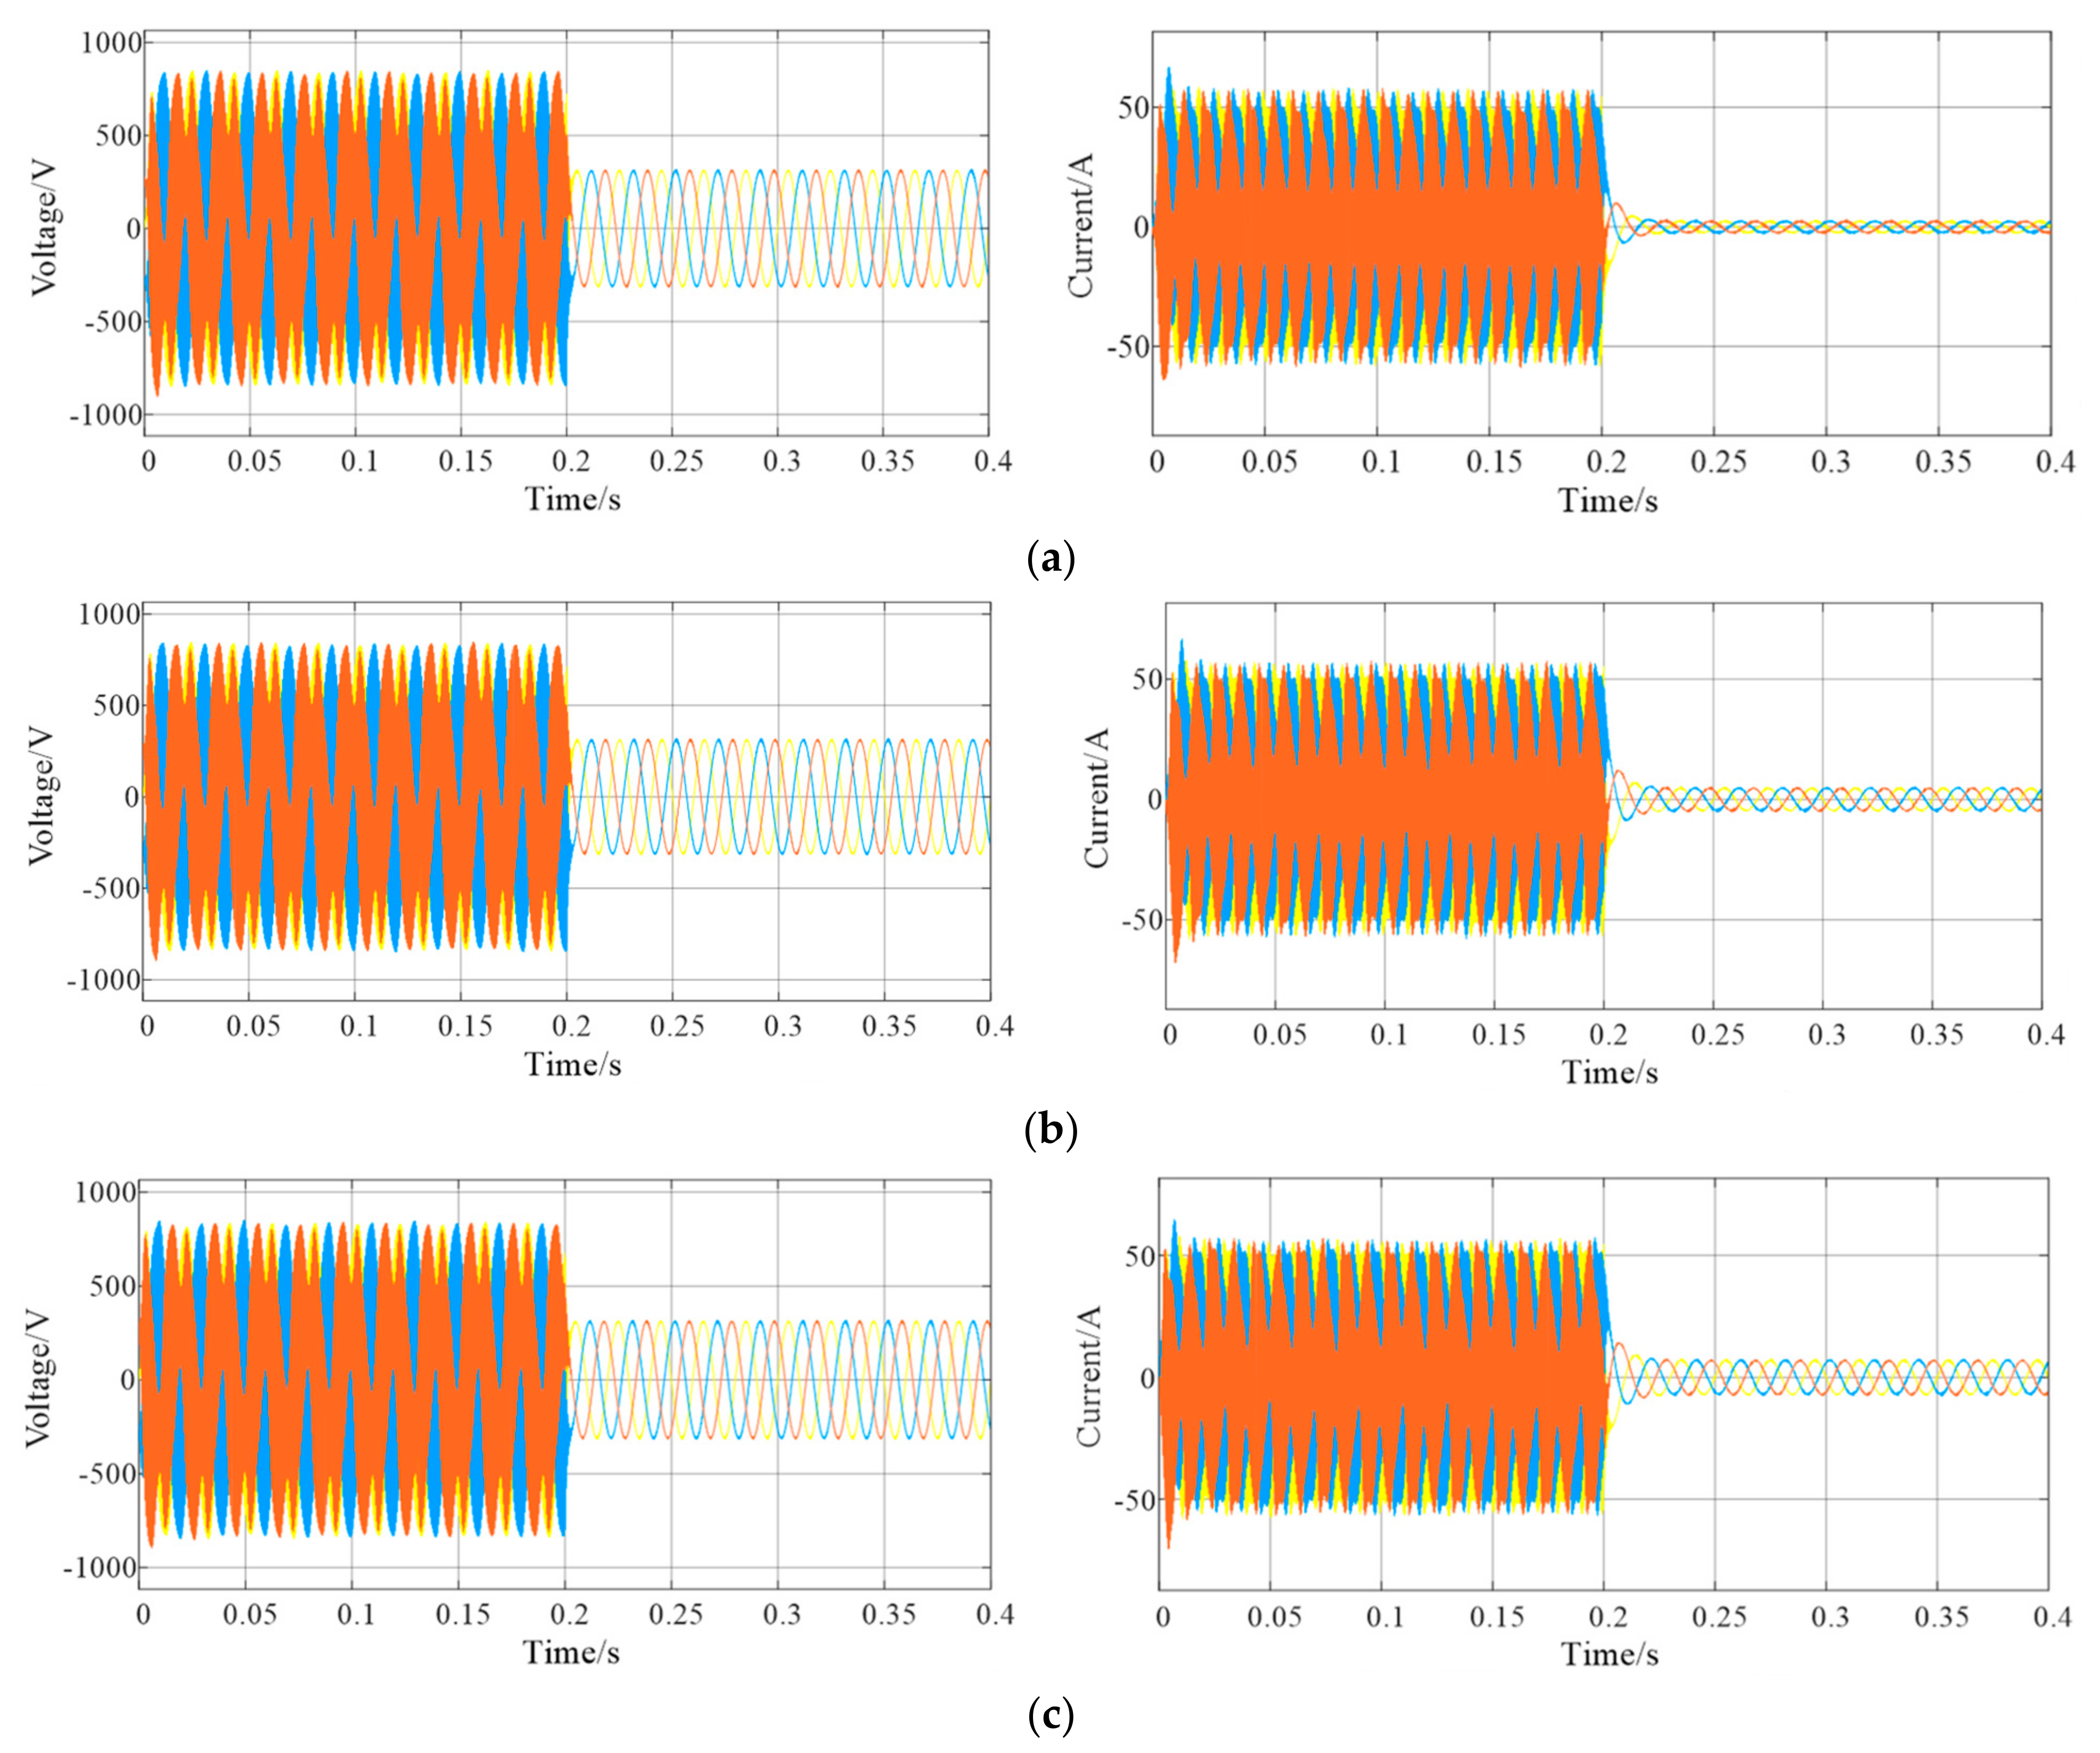
To evaluate the effectiveness of the active damping method proposed in this study in mitigating oscillations arising from variations in photovoltaic output power, we conducted a series of experiments. In these tests, we set the photovoltaic output power at three distinct levels, 5 kW, 10 kW, and 15 kW, while maintaining a consistent grid impedance of 0.1 mH. Initially, for the first 0.2 s, the system was controlled using vector control. Following this, active damping control was applied. The voltage and current waveforms observed during these experiments are clearly illustrated in the accompanying Figure 15. The results demonstrate that the active damping design proposed in this paper effectively suppresses oscillations in response to changes in photovoltaic output power.
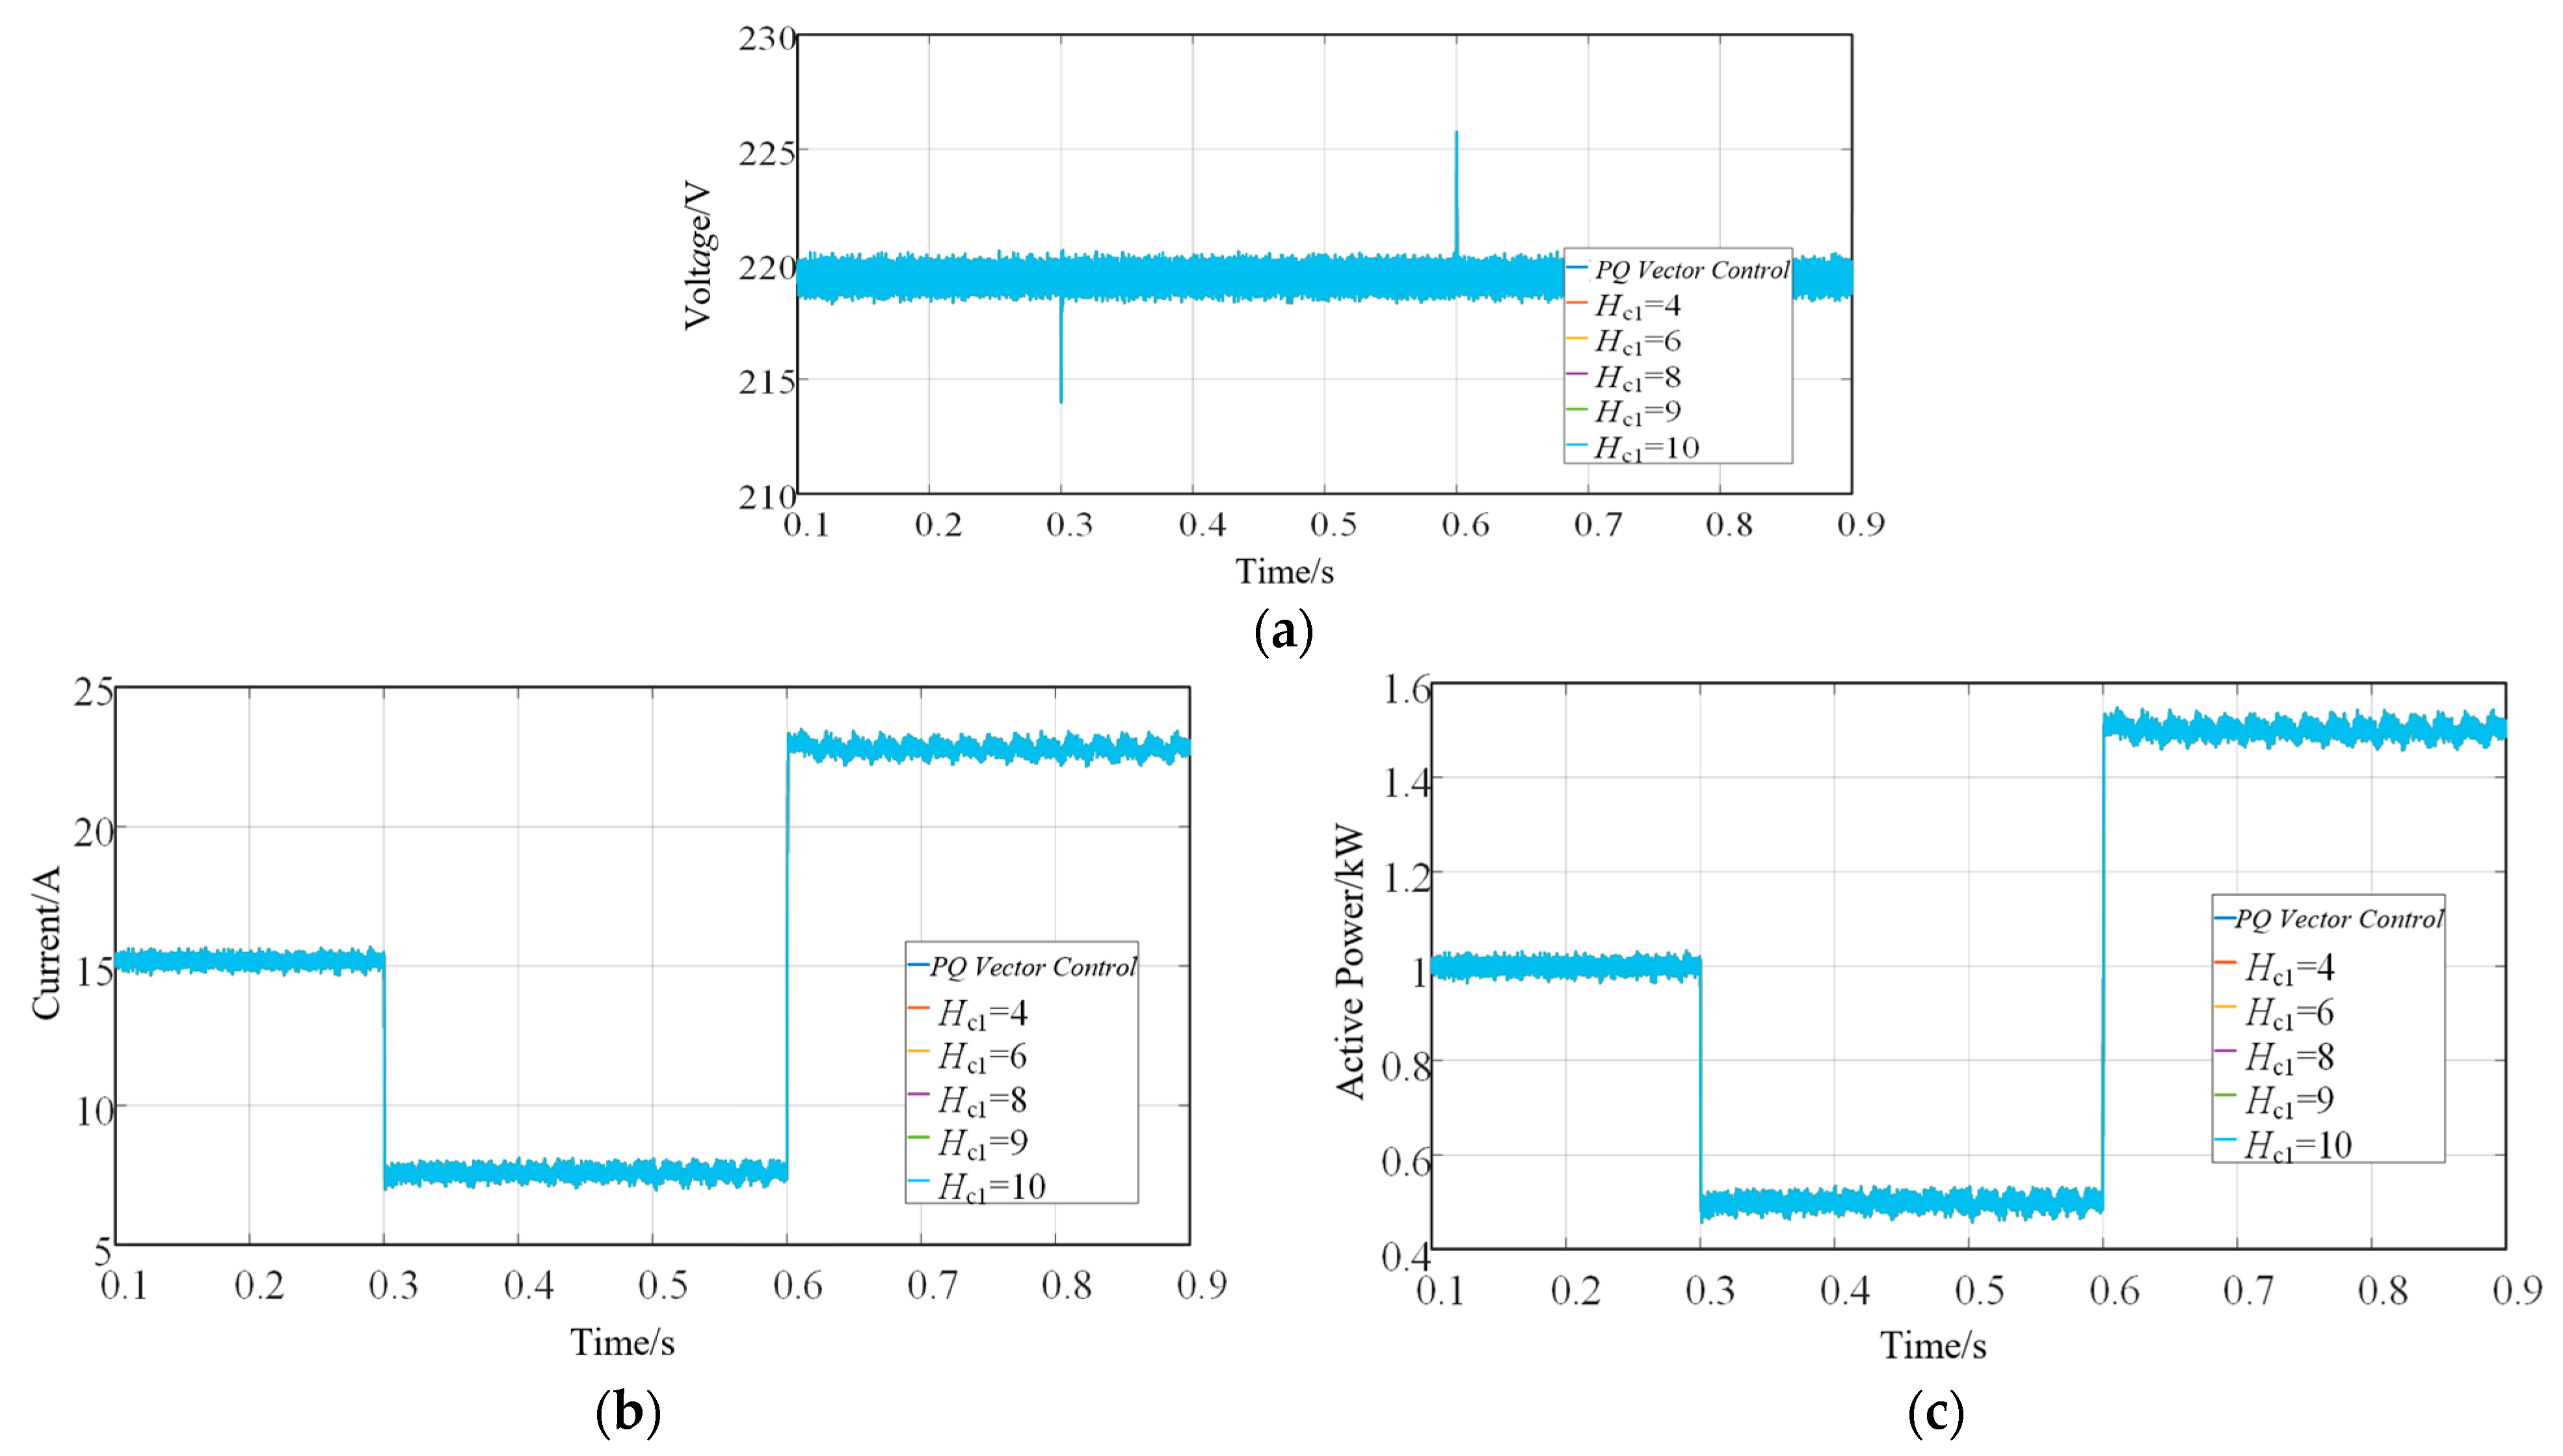
To investigate the control effect and dynamic characteristics after selecting capacitor current feedback and lead correction parameters based on the impedance characteristics of the photovoltaic grid-connected system, the initial active power reference value of the photovoltaic grid-connected system was set to 10 kW. At 0.3 s, the active power decreased to 5 kW, and at 0.6 s, the power increased to 15 kW. Vector control and additional active damping control were set up for comparison. In the case of the additional active damping control, the capacitor current feedback coefficient Hc1 was set to 4, 6, 8, 9, and 10, respectively. The lead correction coefficient α was set to 3, and the time constant τ was set to 3.8 × 10⁻⁵. The grid-side inductance Zg was set to 0.01 mH to ensure system stability. The simulation results are shown in Figure 16.
From the simulation results, it can be observed that the power curve is essentially consistent under both vector control and with the addition of active damping control. The power command value decreases to 5 kW at 0.3 s. The voltage at the PCC point is determined by the grid-side, and changes in the active power value essentially do not affect the grid-side voltage. The grid-side voltage only experiences a transient value of 214 V at the instant when the active power changes. The line current smoothly transitions to another steady state, returning to a stable value at 0.301 s. The active power quickly tracks the adjustment and also returns to a stable value of 5 kW at 0.301 s. The transient process lasts for 1 ms. The power command value increases from 5 kW to 15 kW at 0.6 s, and the effective value of the line current reaches its maximum of 32.48 A at 0.63 s. It then returns to a stable value at 0.65 s, and the active power begins to increase. Similarly, the effective value of the line voltage experiences a transient value of 225 V. Both the line current and the active power return to stable values at 0.601 s. From the above analysis, it can be concluded that during the change in power command value, both vector control and the addition of active damping control can quickly respond to its power changes. Furthermore, the capacitance current feedback coefficient does not significantly affect its response characteristics, maintaining the system’s inherent dynamic response characteristics. The response speed is fast, and the process of returning to a stable value is short, indicating good response characteristics.

5. Conclusions

This paper first introduces the structure of the photovoltaic grid-connected system. Then, based on the methods of harmonic linearization and dual Fourier transform, a modular sequence impedance modeling method is proposed, which simplifies the secondary modeling process under the active damping control method. The analytical expressions of the positive and negative sequence impedances of the photovoltaic grid-connected system are derived. The stability of the photovoltaic grid-connected system under different parameters is analyzed. Subsequently, based on the established impedance model, an additional active damping control method is designed, and simulation verification is conducted. The following conclusions are drawn:
  • The proposed modular photovoltaic grid-connected system impedance modeling method greatly simplifies the secondary modeling process under active damping control. The mathematical model of sequence impedance derived based on the modular impedance modeling method, taking into account the coupling compensation term, matches well with the measured values obtained from actual simulations, which verifies the correctness of the established model and the effectiveness of the modular impedance modeling method.
  • The photovoltaic grid-connected system exhibits an oscillatory frequency band. By analyzing the impedance characteristics of the photovoltaic grid-connected system under various parameters, it is observed that the inner-loop current controller’s proportional coefficient has the most significant impact on the system’s impedance characteristics. Moreover, using an impedance-based stability criterion, the stability of the photovoltaic grid-connected system under different parameters is assessed. This approach unveils the mechanism and characteristics of system harmonic resonance from the perspective of impedance stability.
  • An active damping method utilizing lead correction and capacitive current feedback has been devised. This damping loop’s parameters are established using the impedance model of the photovoltaic power generation unit. In the frequency band prone to oscillations, an empirical contrast was drawn between active damping control and vector control. The experimental results reveal that the supplementary active damping control, without compromising its inherent dynamic properties, adeptly mitigates oscillations. This validates the efficacy and viability of the designed active damping control. In contrast to passive damping, active damping control merely introduces an extra control loop within the control segment, rendering it cost-effective and minimally complex. Furthermore, the active damping method presented in this paper enhances the robustness of the photovoltaic grid-connected system when compared to the conventional CCF approach. In the event of system oscillations, the proposed method offers an economical and efficacious remedy. Even in the absence of oscillations, this control can be incorporated as a preventive measure.
While this article has made strides in analyzing harmonic resonance issues in photovoltaic grid-connected systems, further exploration is warranted.
  • The impedance model of the established photovoltaic grid-connected system is based on the premise of decoupling between positive and negative sequence impedance. However, in recent research, there may still be a coupling relationship between positive and negative sequence impedance. Therefore, there may be some errors between the calculated oscillation frequency and the actual oscillation frequency in the stability analysis of this article.
  • Due to time and experimental constraints, the impedance model established in this article only considers the three-phase equilibrium condition. The actual system is more complex and may have three-phase imbalance, harmonic disturbance components, etc. Digital simulation verification is performed on the Matlab/Simulink simulation platform. In subsequent research, a semiphysical simulation platform will be built for physical experiment verification and comparative analysis.
  • The active damping designed in this article only includes one feedback quantity, namely the capacitor current feedback. It is possible to further derive the effects of multiple feedback quantities and various feedback forms on the impedance characteristics of grid-connected inverters, and then design higher-performance and more economical active damping methods.

Author Contributions

Conceptualization, T.Z. and G.H.; investigation, X.O. and W.Z.; methodology, X.O. and X.Y.; software, W.Z. and Y.W. (Yanfeng Wang); data curation, T.Z. and G.H.; validation, X.O. and G.H.; formal analysis, T.Z. and X.Y.; resources, G.H. and Y.W. (Yanfeng Wang); writing—original draft preparation, T.Z. and G.H.; writing—review and editing, W.Z. and Y.W. (Yuhong Wang); visualization, Y.W. (Yanfeng Wang) and X.Y.; supervision, Y.W. (Yuhong Wang) and S.G.; project administration, Y.W. (Yuhong Wang) and S.G.; funding acquisition, T.Z. and S.G. All authors have read and agreed to the published version of the manuscript.

Funding

This work was supported by the Science and Technology Project of State Grid Corporation of China under Grant 52199723001G.

Data Availability Statement

The data presented in this study are available on request from the corresponding author upon reasonable request and with the permission of the State Grid Sichuan Electric Power Company.

Conflicts of Interest

The authors declare that this study received funding from State Grid Corporation of China. The funder was not involved in the study design, collection, analysis, interpretation of data, the writing of this article or the decision to submit it for publication. Authors Tong Zhu, Gechao Huang, Xuetong Ouyang, Yanfeng Wang and Xi Ye were employed by the company State Grid Sichuan Electric Power Company, the remaining authors declare that the research was conducted in the absence of any commercial or financial relationships that could be construed as a potential conflict of interest.

References

  1. Haque, A.; Alshareef, A.; Khan, A.I.; Alam, M.M.; Kurukuru, V.S.B.; Irshad, K. Data Description Technique-Based Islanding Classification for Single-Phase Grid-Connected Photovoltaic System. Sensors 2020, 20, 3320. [Google Scholar] [CrossRef] [PubMed]
  2. Qaiyum, S.; Margala, M.; Kshirsagar, P.R.; Chakrabarti, P.; Irshad, K. Energy Performance Analysis of Photovoltaic Integrated with Microgrid Data Analysis Using Deep Learning Feature Selection and Classification Techniques. Sustainability 2023, 15, 11081. [Google Scholar] [CrossRef]
  3. Ebrahim, M.A.; Ward, S.A.; El-Gohary, M.F.; Mohamad, M.A.; Eid, M.M.; Alharbi, A.H.; Khafaga, D.S. AI-based voltage and power quality control of high-penetration grid-connected photovoltaic power plant. Front. Energy Res. 2023, 11, 1178521. [Google Scholar] [CrossRef]
  4. Ali, A.; Irshad, K.; Khan, M.F.; Hossain, M.M.; Al-Duais, I.N.A.; Malik, M.Z. Artificial Intelligence and Bio-Inspired Soft Computing-Based Maximum Power Plant Tracking for a Solar Photovoltaic System under Non-Uniform Solar Irradiance Shading Conditions—A Review. Sustainability 2021, 13, 10575. [Google Scholar] [CrossRef]
  5. Darwish, M.M.F.; Samy, A.; Abbas, A.A.; Mansour, D.-E.A.; Ward, S.A. Impact of On-grid Photovoltaic System on Thermal Performance of the Oil-filled Transformers. In Proceedings of the 2022 23rd International Middle East Power Systems Conference (MEPCON), Cairo, Egypt, 13–15 December 2022; pp. 1–5. [Google Scholar] [CrossRef]
  6. Manef, B.; Azeddine, H.; Houda, B.A.S.; Mohamed, M. Modeling and Resonance Analysis of Parallel Grid-Connected Inverters with LCL Filters. In Proceedings of the 2018 International Conference on Electrical Sciences and Technologies in Maghreb (CISTEM), Algiers, Algeria, 29–31 October 2018; pp. 1–6. [Google Scholar] [CrossRef]
  7. Hu, H.; Shi, Q.; He, Z.; He, J.; Gao, S. Potential Harmonic Resonance Impacts of PV Inverter Filters on Distribution Systems. IEEE Trans. Sustain. Energy 2015, 6, 151–161. [Google Scholar] [CrossRef]
  8. Xu, W.; Huang, Z.; Cui, Y.; Wang, H. Harmonic Resonance Mode Analysis. IEEE Trans. Power Deliv. 2005, 20, 1182–1190. [Google Scholar] [CrossRef]
  9. Teng, Y.; Zhang, X.; Fan, C.; Chen, X.; Zhang, R. Resonance Risk in Infirm-interconnected Grid Considering Photovoltaic Devices. In Proceedings of the 2018 International Conference on Power System Technology (POWERCON), Guangzhou, China, 6–9 November 2018; pp. 1004–1011. [Google Scholar] [CrossRef]
  10. Mahalakshmi, R.; Thampatty, K.S. Sub-Synchronous Resonance analysis on DFIG based windfarm. In Proceedings of the TENCON 2016—2016 IEEE Region 10 Conference, Singapore, 22–25 November 2016; pp. 930–935. [Google Scholar] [CrossRef]
  11. Kang, L.; Shi, L.; Ni, Y.; Yao, L.; Masoud, B. Small signal stability analysis with penetration of grid-connected wind farm of PMSG type. In Proceedings of the 2011 IEEE International Conference on Advanced Power System Automation and Protection (APAP), Beijing, China, 16–20 October 2011; pp. 147–151. [Google Scholar] [CrossRef]
  12. Yu, J.; He, T.; Wu, J.; Xu, J.; Wang, D.; Yu, Y. Study on Small Disturbance Stability of Photovoltaic Grid-Connected Power Generation System. In Proceedings of the 2023 5th Asia Energy and Electrical Engineering Symposium (AEEES), Chengdu, China, 23–26 March 2023; pp. 1429–1433. [Google Scholar] [CrossRef]
  13. Wang, Y.; Wang, X.; Chen, Z.; Blaabjerg, F. State-space-based harmonic stability analysis for paralleled grid-connected inverters. In Proceedings of the IECON 2016—42nd Annual Conference of the IEEE Industrial Electronics Society, Florence, Italy, 24–27 October 2016; pp. 7040–7045. [Google Scholar] [CrossRef]
  14. Sun, J. Impedance-Based Stability Criterion for Grid-Connected Inverters. IEEE Trans. Power Electron. 2011, 26, 3075–3078. [Google Scholar] [CrossRef]
  15. Sun, Z.; Sun, Y.; Lin, J.; Xie, S.; Han, H.; Wu, Z. Impedance Modeling and Stability Analysis of Single-Phase LCL-type Grid-Connected VSC Based on Harmonic Linearization. In Proceedings of the 2021 IEEE 12th Energy Conversion Congress & Exposition—Asia (ECCE-Asia), Singapore, 24–27 May 2021; pp. 2143–2148. [Google Scholar] [CrossRef]
  16. Lu, M.; Wang, X.; Blaabjerg, F.; Muyeen, S.; Al-Durra, A.; Leng, S. Grid-voltage-feedforward active damping for grid-connected inverter with LCL filter. In Proceedings of the 2016 IEEE Applied Power Electronics Conference and Exposition (APEC), Long Beach, CA, USA, 25–29 February 2016; pp. 1941–1946. [Google Scholar] [CrossRef]
  17. Guo, W.; Mu, L. Control principles of micro-source inverters used in microgrid. Prot. Control Mod. Power Syst. 2016, 1, 5. [Google Scholar] [CrossRef]
  18. Yang, H.; Xia, D.; Zhang, X.; Xu, D. Impedance Modeling and Stability Analysis of Three-phase Grid-connected Inverter with LCL Filter in dq-frame. In Proceedings of the 2019 21st European Conference on Power Electronics and Applications (EPE ‘19 ECCE Europe), Genova, Italy, 3–5 September 2019; pp. P.1–P.10. [Google Scholar] [CrossRef]
  19. Wang, X.; Harnefors, L.; Blaabjerg, F. Unified Impedance Model of Grid-Connected Voltage-Source Converters. IEEE Trans. Power Electron. 2017, 33, 1775–1787. [Google Scholar] [CrossRef]
  20. Ling, P.; Peng, Z.; Chao, G. An Impedance Reshaping Control Strategy to Enhance Adaptability to Grid for Grid-Connected Inverters. In Proceedings of the 2018 China International Conference on Electricity Distribution (CICED), Tianjin, China, 17–19 September 2018; pp. 12–18. [Google Scholar] [CrossRef]
  21. Liu, Z.; Liu, J.; Bao, W.; Zhao, Y. Infinity-Norm of Impedance-Based Stability Criterion for Three-Phase AC Distributed Power Systems with Constant Power Loads. IEEE Trans. Power Electron. 2015, 30, 3030–3043. [Google Scholar] [CrossRef]
  22. Cespedes, M.; Sun, J. Impedance Modeling and Analysis of Grid-Connected Voltage-Source Converters. IEEE Trans. Power Electron. 2014, 29, 1254–1261. [Google Scholar] [CrossRef]
  23. Pugliese, S.; Kwon, Y.; Liserre, M. Positive-Negative Sequence SRF-PLL Model for Accurate Stability Analysis in Grid-Tied Converters. In Proceedings of the 2020 IEEE Energy Conversion Congress and Exposition (ECCE), Detroit, MI, USA, 11–15 October 2020; pp. 3593–3600. [Google Scholar] [CrossRef]
  24. Li, S.; Lin, H. A Capacitor-Current-Feedback Positive Active Damping Control Strategy for LCL-Type Grid-Connected Inverter to Achieve High Robustness. IEEE Trans. Power Electron. 2022, 37, 6462–6474. [Google Scholar] [CrossRef]
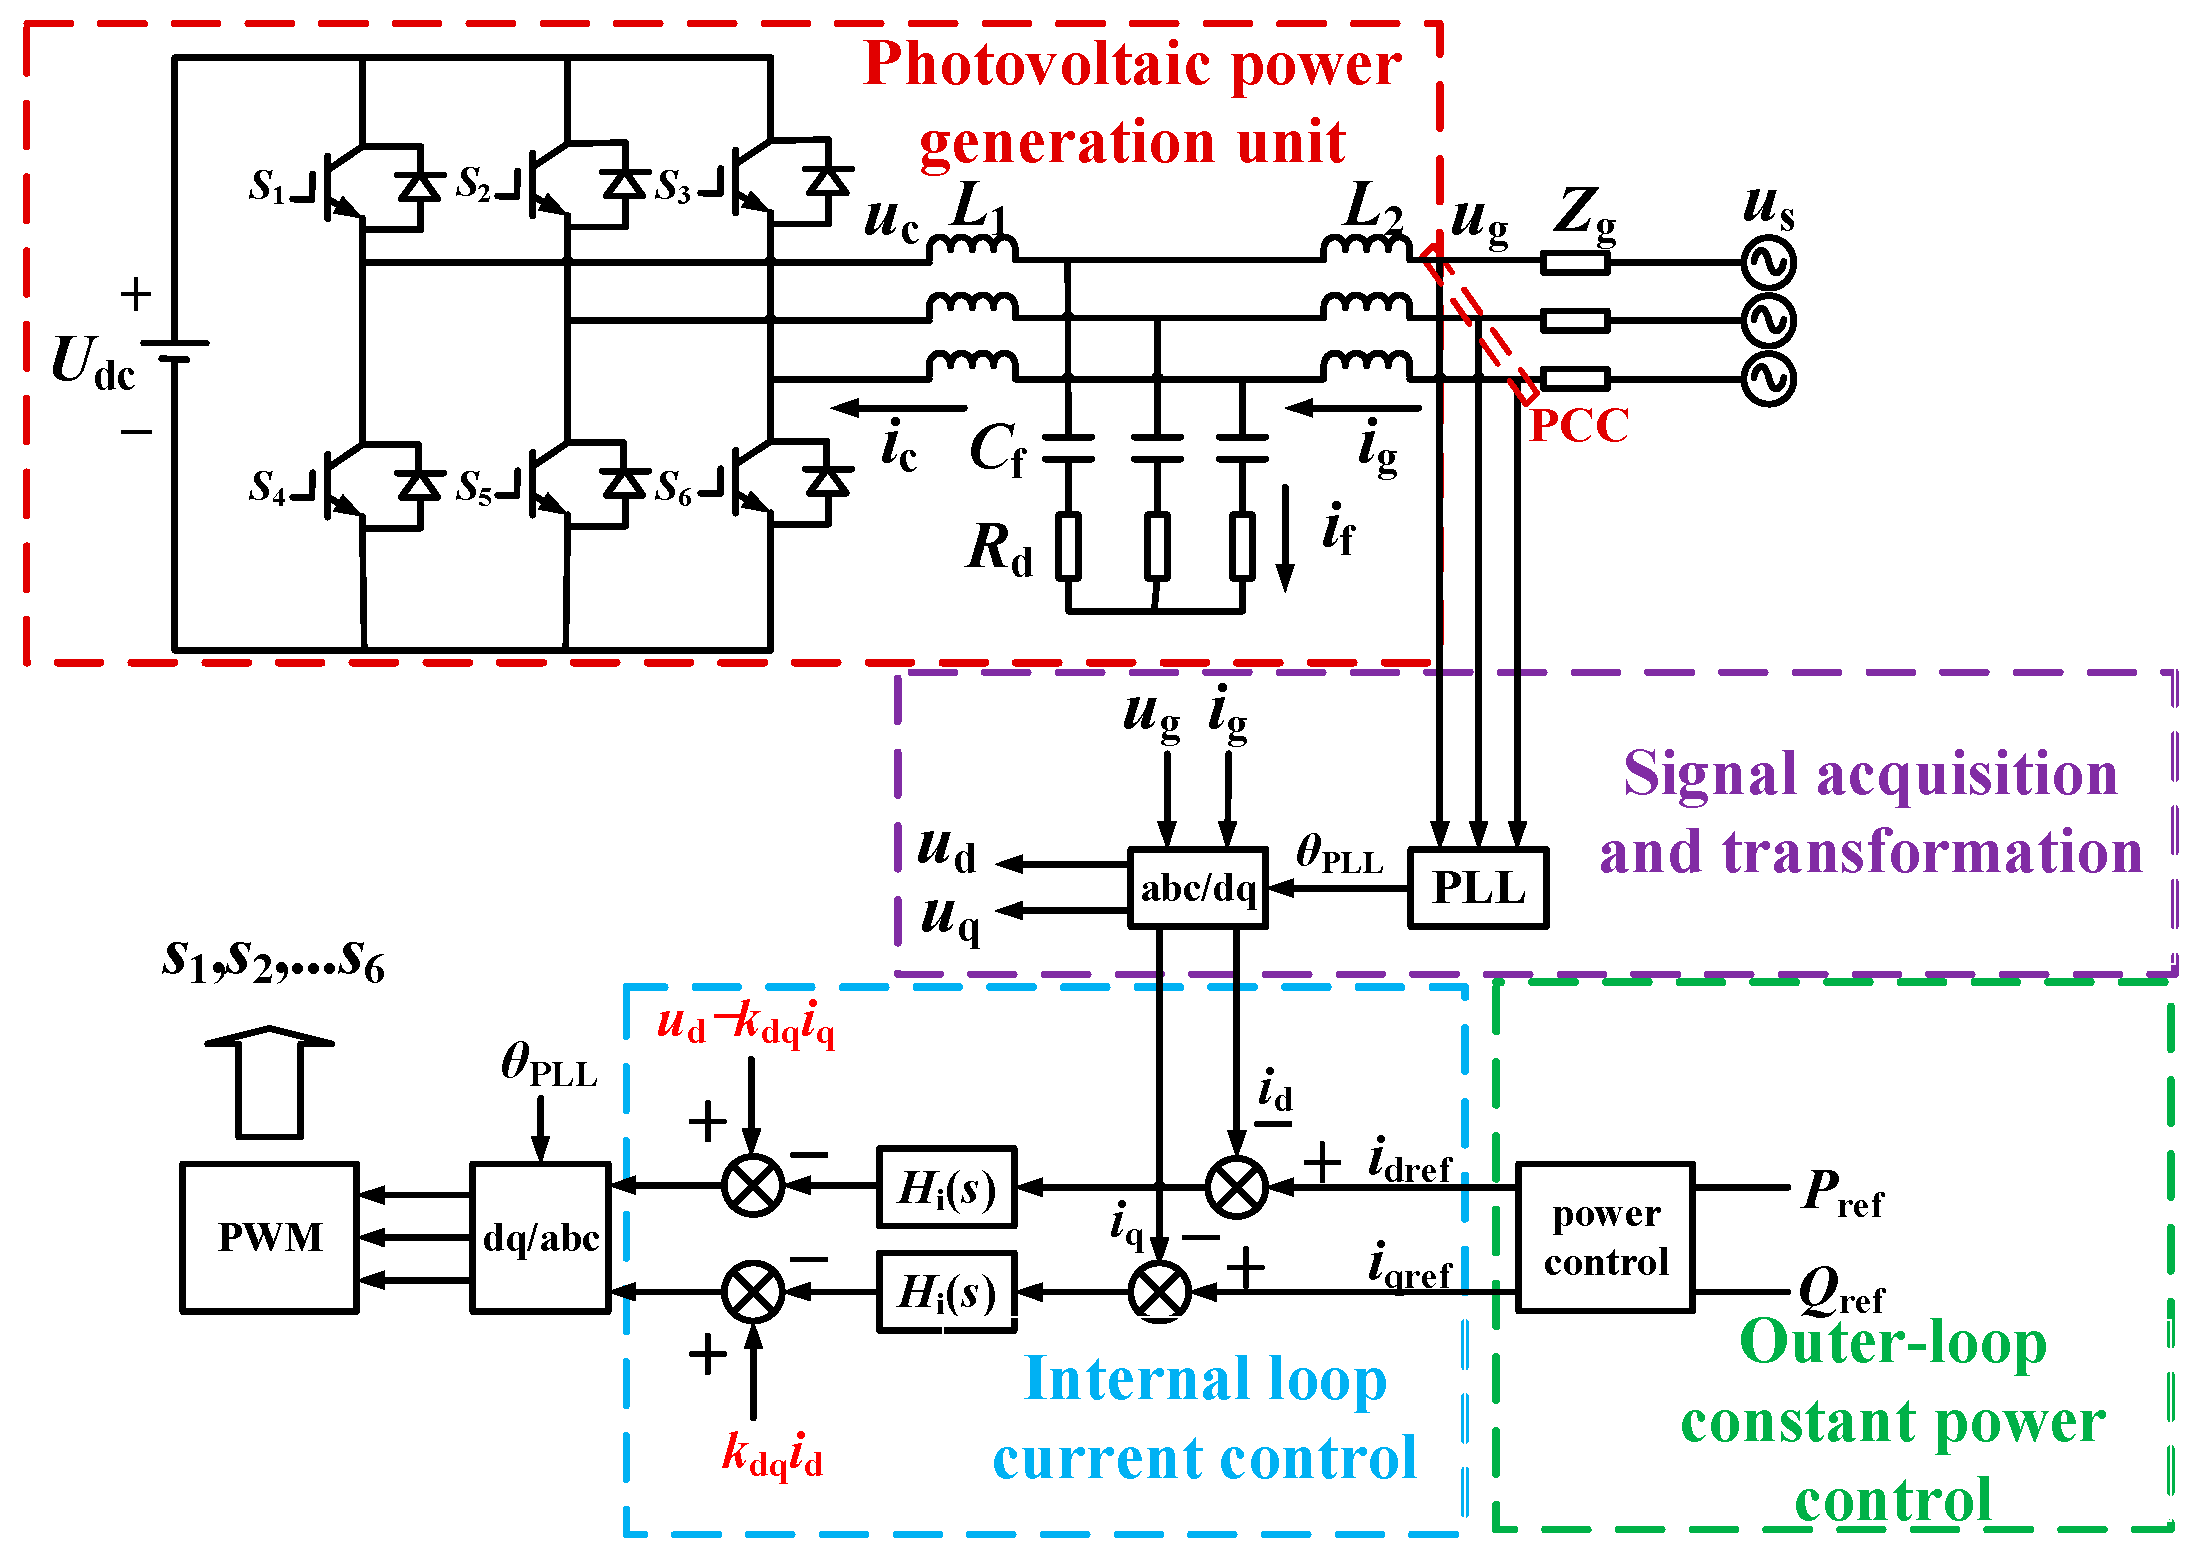
Figure 1. Structure diagram of photovoltaic grid-connected system.
Energies 17 01218 g001
Figure 2. Equivalent block diagram of controller under AC and DC components.
Energies 17 01218 g002
Figure 3. Simplified block diagram of controller under AC component.
Energies 17 01218 g003
Figure 4. Theoretical curve and actual results of the positive and negative sequence output impedance of the photovoltaic grid-connected system. (a) Amplitude-frequency and phase-frequency characteristic curve of the positive sequence impedance of the photovoltaic grid-connected system; (b) amplitude-frequency and phase-frequency characteristic curve of negative-sequence impedance of the photovoltaic grid-connected system.
Energies 17 01218 g004
Figure 5. Small signal model of photovoltaic grid-connected system.
Energies 17 01218 g005
Figure 6. Impedance characteristic diagram of photovoltaic grid-connected system before impedance remolding.
Energies 17 01218 g006
Figure 7. Impedance characteristics of the photovoltaic grid-connected system under different kpPLL_inv and kiPLL_inv conditions. (a) The impedance characteristics of the photovoltaic grid-connected system under kpPLL_inv = 1.72, 17.2, 172; (b) the impedance characteristics of the photovoltaic grid-connected system under kiPLL_inv = 49.22, 492.2, 4922.
Energies 17 01218 g007
Figure 8. Impedance characteristics of the photovoltaic grid-connected system under different kpinv and kiinv conditions. (a) The impedance characteristics of the photovoltaic grid-connected system under kpinv = 1, 10, 100; (b) the impedance characteristics of the photovoltaic grid-connected system under kiinv = 16, 160, 1600.
Energies 17 01218 g008
Figure 9. Characteristic diagram of positive sequence impedance after introducing capacitive current feedback.
Energies 17 01218 g009
Figure 11. Characteristic diagram of positive sequence impedance after introducing capacitive current feedback under different feedback coefficient Hc1.
Energies 17 01218 g011
Figure 12. Characteristic curve of the lead correction loop.
Energies 17 01218 g012
Figure 13. Characteristic diagram of impedance of the photovoltaic grid-connected system after impedance remolding and impedance on the grid-side.
Energies 17 01218 g013
Figure 14. Three-phase voltage and current waveform diagram of the grid point under vector control with additional active damping control. (a) Voltage and current at the point of interconnection under Zg = 0.5 mH; (b) spectrum diagram of voltage and current under vector control at Zg = 0.5 mH; (c) voltage and current at the grid point under Zg = 1 mH; (d) spectrum diagram of voltage and current at the grid point under vector control with Zg = 1 mH; (e) voltage and current at the grid point under Zg = 6 mH; (f) spectrum diagram of voltage and current at the grid point under vector control with Zg = 6 mH.
Energies 17 01218 g014aEnergies 17 01218 g014b
Figure 15. Three-phase voltage and current waveform diagram of the grid point under vector control with additional active damping control. (a) Voltage and current at the point of interconnection under photovoltaic output power is 5 kW; (b) voltage and current at the point of interconnection under photovoltaic output power is 10 kW; (c) voltage and current at the point of interconnection under photovoltaic output power is 15 kW.
Energies 17 01218 g015
Figure 16. Voltage, current, and power under the change of active power command value. (a) Voltage at the grid connection point; (b) current at the grid connection point; (c) output power.
Energies 17 01218 g016
Table 1. The photovoltaic grid-connected system parameters.
ParameterValueParameterValue
DC side voltage Udc/V800line-side inductance L2/mH0.2
effective value of grid line voltage/V380filter capacitor Cf/uF6.8
output Active Power P/kW10damping resistor Rd1.7
output reactive power Q/kVar0phase-locked loop kpPLL_inv1.72
fundamental frequency f1/Hz50phase-locked loop kiPLL_inv492.2
switching frequency fsw/kHz35Internal loop current controller kpinv10
inverter side inductance L1/mH1.5Internal loop current controller kiinv1600
Table 2. Oscillation suppression simulation results.
Grid-Side InductanceTHD of Vector ControlTHD of Damping ControlOscillation Frequency
0.5 mH15.4%4.8%3835 Hz 3935 Hz
1 mH54.3%1.5%2283 Hz 2383 Hz
6 mH73.6%4.7%1526 Hz 1626 Hz
Disclaimer/Publisher’s Note: The statements, opinions and data contained in all publications are solely those of the individual author(s) and contributor(s) and not of MDPI and/or the editor(s). MDPI and/or the editor(s) disclaim responsibility for any injury to people or property resulting from any ideas, methods, instructions or products referred to in the content.