Article

Flow and Heat Transfer Characteristics of Superheater Tube of a Pulverized Coal-Fired Boiler Using Conjugate Heat Transfer Modeling

by
Kanmaniraja Radhakrishnan
and
Jun Su Park
*
Department of Automotive Engineering, Korea National University of Transportation, Chungju 27469, Republic of Korea
*
Author to whom correspondence should be addressed.
Energies 2024, 17(5), 1161; https://doi.org/10.3390/en17051161
Submission received: 27 January 2024 / Revised: 26 February 2024 / Accepted: 27 February 2024 / Published: 29 February 2024
(This article belongs to the Section J1: Heat and Mass Transfer)

Abstract

:
This study is a numerical study to predict the temperature of the heat exchange tubes inside the pulverized coal-fired boiler through the conjugate heat transfer analysis. Due to the aspect ratio and number of tubes inside the pulverized coal-fired boiler, actual tube modeling analysis has rarely been conducted. Most of the research has been conducted through the porous media method, resulting in limited information on the temperature distribution of each tube. However, for the development of a digital twin model for improving the performance of the boiler and reducing maintenance costs, information on the local temperature of the tubes is required. In this study, all the tubes inside the boiler were modeled, and conjugate heat transfer analysis was performed to confirm the local temperature distribution. For this purpose, the analysis was conducted using Fluent 2020 r2, and the analysis model was constructed using more than 300 million structured grids. The calculation was performed considering conjugate heat transfer in the pulverized coal-fired boiler, heat exchange by steam inside the tubes, and conductive heat transfer of the tubes. As a result, it was confirmed that there is a significant deviation in the local temperature for each tube position. Furthermore, the maximum temperature of the PrSH tube ranges widely, between 492 and 532 degrees, depending on the tube’s position. It was observed that the point of the highest temperature inside the tubes also varies for each tube due to the flow of external combustion gas. Based on these results, it is expected that strategic approaches to boiler design and maintenance can be achieved. Furthermore, it is anticipated to contribute to the high efficiency of power facilities by being utilized as basic data for the development of a digital twin model for the boiler.

1. Introduction

Nowadays, the increased use of power requires more energy to be generated. To meet this demand, research and development continue to create new energy power plants and improve existing ones, making them more reliable and robust. In this respect, pulverized coal-fired boilers in thermal power plants have made a remarkable contribution worldwide. These boilers consist of many components, among which the superheater tubes play a key role. The radiative and convective heat transfer between the gases from the furnace chamber and the high-pressure steam flowing in the superheater tubes takes place in the tubes. Detailed modeling of bundles of the superheater tubes is impossible because it is computationally very expensive, and also due to the complexity of ash deposition on the tube outer surfaces and the presence of tri-atomic gases that take part in the radiation [1,2].
The inclusion of all superheaters and economizers in a pulverized coal combustion model causes the mesh elements to be more than ten to the eighth, which requires huge CFD workstations to solve such types of three-dimensional models. Such simulations become very expensive and also unsuitable choices. To mitigate the complexity and expense, the porous media method (also known as the distributed resistance method) [3] is a pragmatic approach to replace superheater tube bundles by solving the addition of momentum source terms: viscous loss term, and inertial loss term to the standard fluid flow equations by the Reynolds-averaged Navier–Stokes equations, and the CFD results using the porous media approach have been reasonably agreed with the designed data. As a result, the porous media technique has been widely used in several numerical studies [4,5,6,7,8,9,10,11,12]. However, a drawback of employing porous media is that no visible tube surfaces to the combusted gas are provided. So, the radiation exchange between the tube surface and combusted gas is too low. This radiation exchange is important, especially for downstream heat exchangers [7]. In addition, the outlet temperature and wall temperature of steam tubes are not possible to calculate when employing a porous media approach to replace the bundles of superheater tubes [8], which is mandatory to enhance better operational efficiency and also to avoid material damage due to the thermal stress in the thick-walled components of superheaters and steam turbines [13]. These insufficient design and performance data can cause approximately 40% of all boiler failures due to overheating of tube materials [14].
In a combustion furnace, the main gaseous emitters and absorbers of radiant energy are CO2 and H2O [15]. The emissivity and absorption coefficient calculation of these gaseous species based on gray gases using polynomial equations for weighing factors and the weighted sum of grey gases method has been widely used in CFD [16,17,18]. When the hot gases move to the furnace walls and superheater tube walls, the radiation plays a vital role in transferring the heat from the hot side to high-pressure steam in the superheater tubes [19]. The radiation effect in the conjugate heat transfer problem has been modeled by radiation models such as P-1 radiation [20,21], the Rosseland radiation model, discrete transfer radiation [22], discrete ordinates (DO) radiation [15,19,22], surface-to-surface radiation, and the Monte Carlo radiation model. These radiation models were employed to solve the radiative transfer equation (RTE) based on the optical thickness, scattering, emissivity, particular effects, semi-transparent walls, and non-gray radiation preferred in the computational domain [23], in which the P-1 radiation model has been extensively used owing to its computationally cheap price and applicability to any complex geometries [21,24]. A brief summary of numerical methods used in the literature studies is listed in Table 1.
CFD techniques in boiler applications become a viable approach to investigate the intrinsic heat transfer characteristics between the steam side flow and hot side flow, which can assist in enhancing boiler safety by providing insight into thermal flow analysis using a finite volume approach [15]. Due to the rise in computational expense, comprehensive boiler modeling is not accessible. For this, researchers performed simulations simply using the combustion furnace, ignoring all superheater tubes, and employing thermal wall boundaries such as wall temperature, emissivity, and heat transfer coefficient [9,11,25]. Similarly, most of the boiler simulations have been conducted by ignoring combustion furnaces as well as superheater tubes by employing constant wall temperature and the porous media approach [26]. The constant wall surface boundary condition in CFD studies can considerably overstate the net heat absorption of the furnace wall if water saturation temperature is adopted as the wall surface temperature [27].
The power plant systems have recently tried to adopt the digital twin model to maintain and control the system efficiently. To adopt the digital twin model in the power system, detailed information about the power system, such as velocity, pressure, and temperature, is required to predict and calculate the power system status following the operating conditions. However, the previous studies using the porous media method just suggested the average values in each area of the steam boiler in the power plant and did not suggest detailed information. So, a detailed and sizeable numerical analysis of the steam boiler is required to supply the information to build the digital twin model.
The present work focuses on the conjugate heat transfer modeling between the steam and hot gas sides by incorporating all superheater solid domains and steam as the fluid domain in a CFD simulation, considering simulation complexity and computational expenses. In addition, the CFD simulation is used to calculate the steam temperature of superheater tubes, which is compared against the 100% workload of boiler data. Furthermore, the intrinsic heat transfer characteristics of superheater tube walls are investigated when the hot gases come into contact with them. Also, the flow characteristics across the primary superheater bundles are shown. The detailed and local data on each point in the steam boiler help to understand the heat exchange between hot combustion gas and steam. It can be used to build the high-resolution digital twin model and upgrade the boiler structure to increase efficiency and reduce maintenance costs.

2. Modeling and Methodology
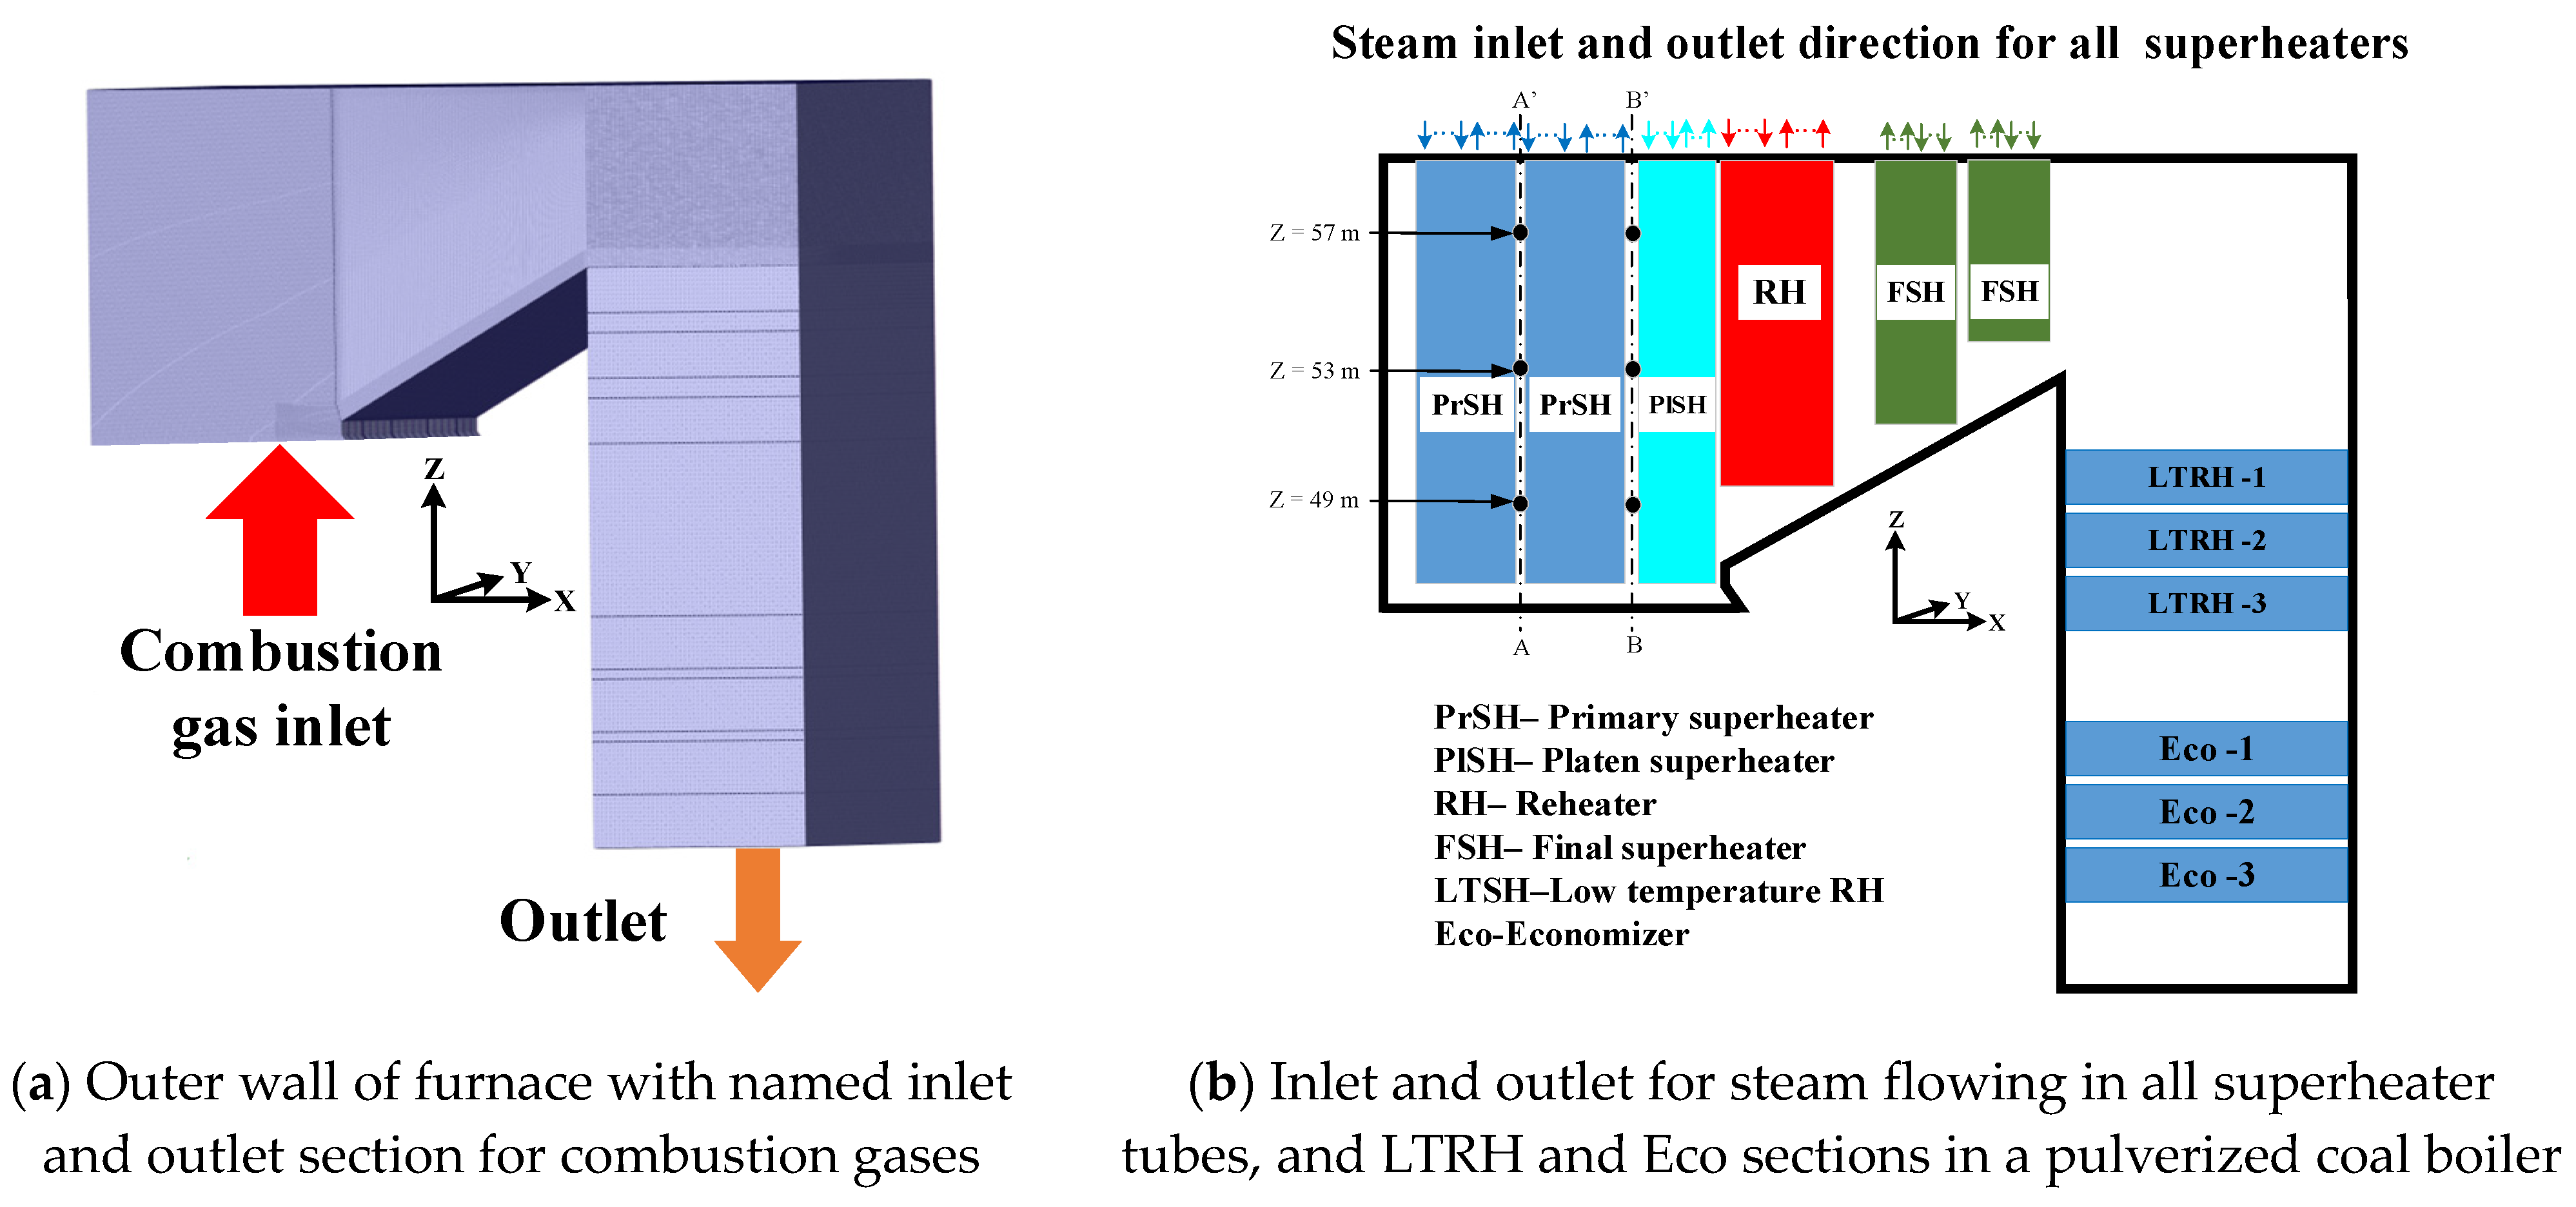
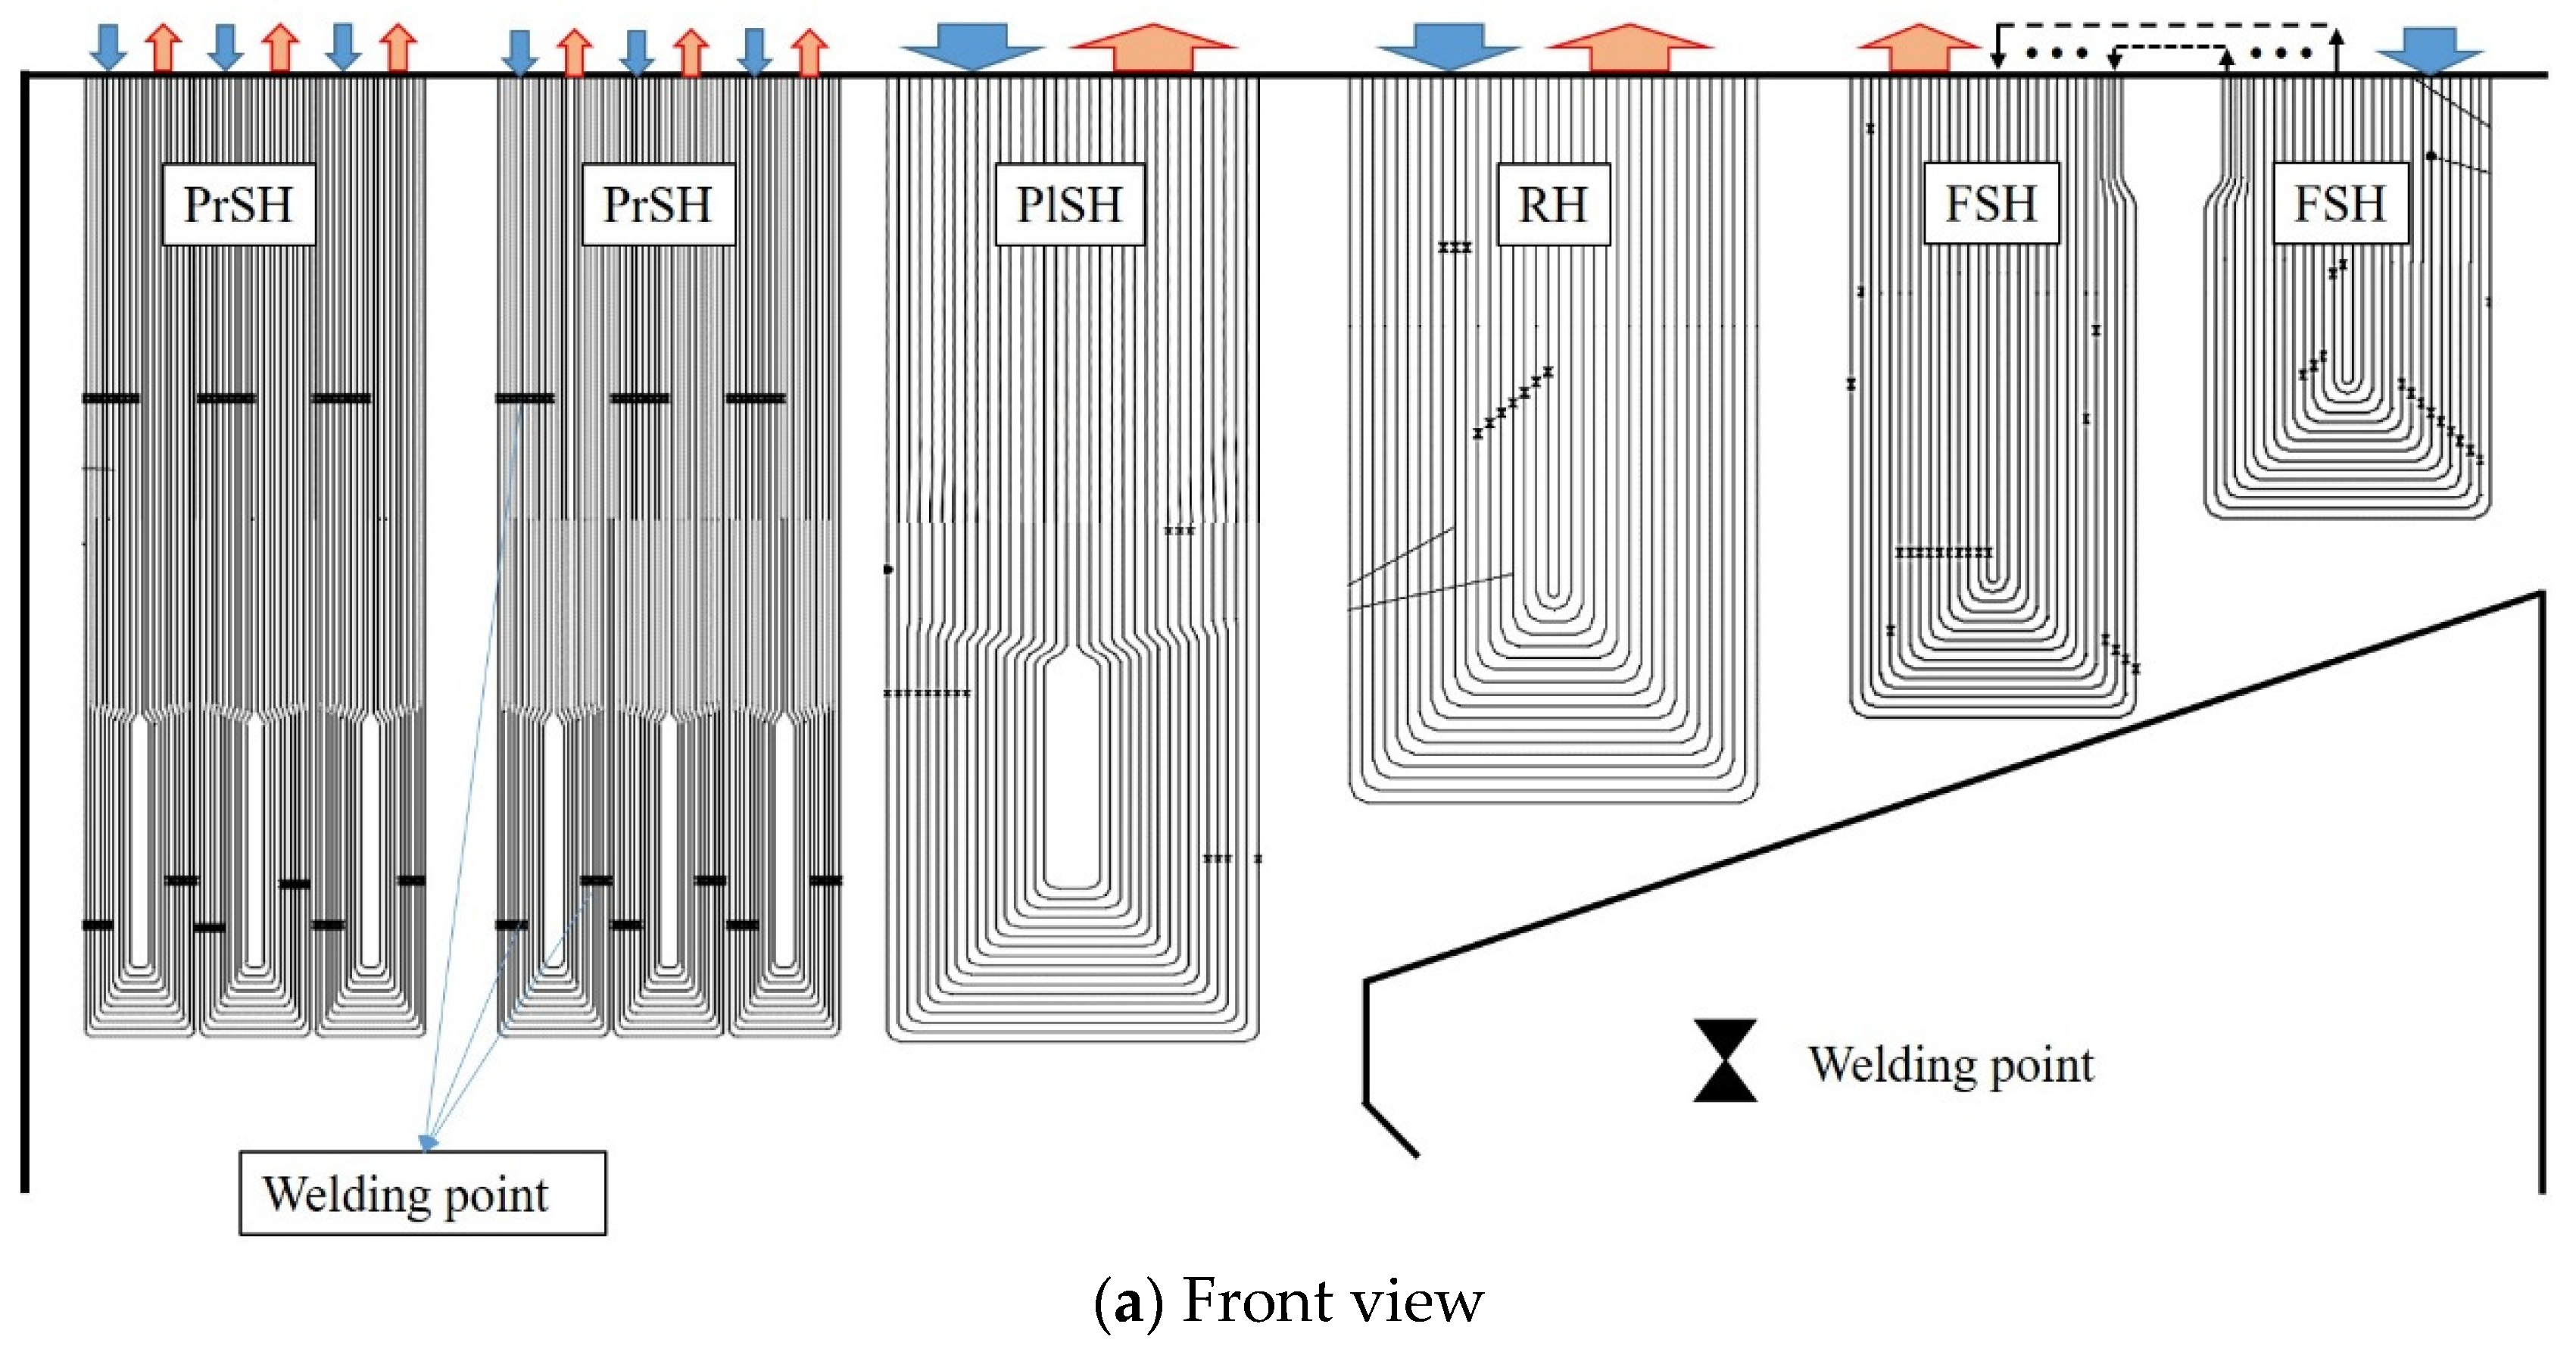
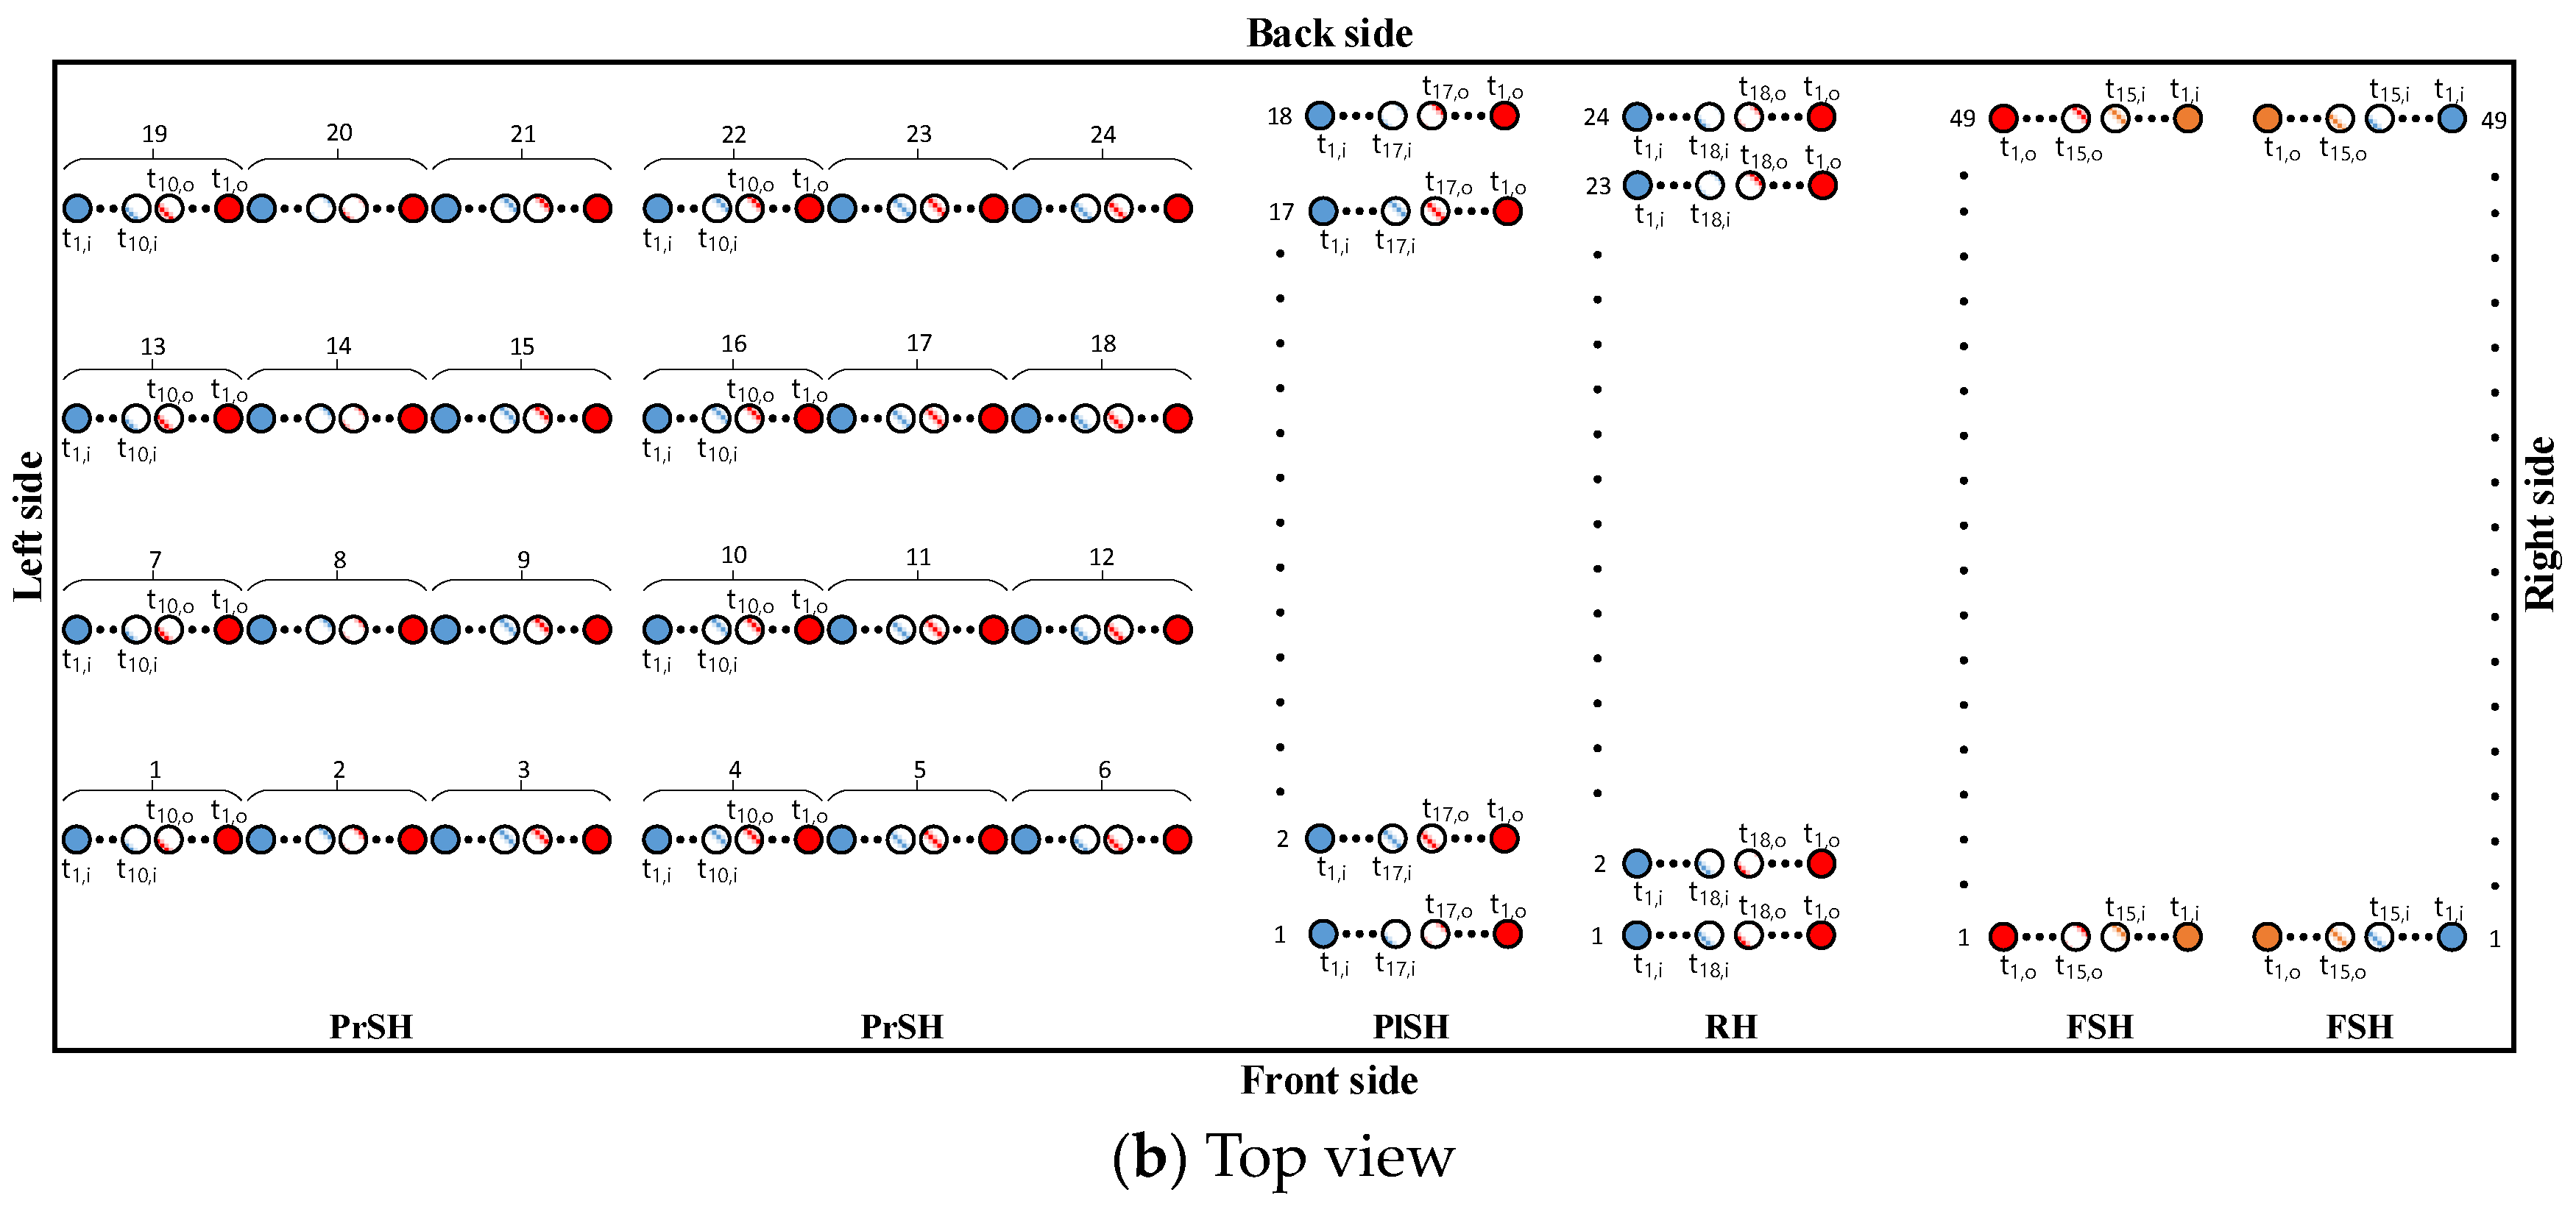
2.1. Physical Model

The simulation geometry used in this work is a supercritical coal-fired steam generator in a 500 MW thermal power plant unit. As the present work focuses mainly on the modeling of a superheater heat exchanger, only a computational domain with all superheaters excluding a combustion furnace chamber is considered, as shown in Figure 1a, where the combustion furnace exit is considered as an inlet for the hot gas entering into the computational domain (red arrow in Figure 1a). The simulation domain has the dimensions of 60.159 m (height in Z-direction) × 33.406 m (length in X-direction) × 16.8 m (width in Y-direction). In the boiler flue gas passage region, the primary superheater (PrSH), platen superheater (PlSH), reheater (RH), final superheater (FSH), low-temperature reheaters (LTRH), and economizers (Eco) are installed, in which the PrSH and PlSH are installed above the furnace exit and the remaining all superheaters are installed in the flue gas passage region going to the downstream side. The schematic sketch of these superheater regions is shown in Figure 1b. The installed PrSH and PlSH above the furnace exit have more radiant heat transfer due to the direct radiation from the hot gases and the radiant heat decreases as the hot gas flows downstream where the convective heat transfer is a main factor for occurring heat transfer on the RH, FSH tube surface.
Superheaters consist of a large number of bundles and tubes. The PrSH has 24 bundles, each one consisting of 10 tubes, thus, having a total of 240 tubes. The 24 bundles are arranged in 4 × 6 matrix. The PlSH consists of 18 bundles of which each bundle has 17 tubes, thus, having a total of 306 tubes. The 18 bundles are arranged in 18 × 1 matrix. The RH consists of 24 bundles of which each bundle has 18 tubes, thus, having a total of 432 tubes. The 24 bundles are arranged in 24 × 1 matrix. The FSH consists of 98 bundles of which each bundle has 15 tubes, thus, having a total of 1470 tubes. The 49 bundles are arranged in 49 × 2 matrix. A front side and top side view of the tubes in the superheaters are shown in Figure 2. A flow direction of steam in the superheater tubes is specified in Figure 2a. The blue arrow is the steam inlet direction, the red arrow is the steam outlet direction. Each tube is made up of two or three small tubes with different materials that are joined by joint welding as in Figure 2a, and the tube length of each steel grade and the structure of tube connecting with different steel grades from steam inlet to outlet of each tube in the superheaters are provided in Table 2. And the inner diameter and thickness of all tubes are listed in Table 3.

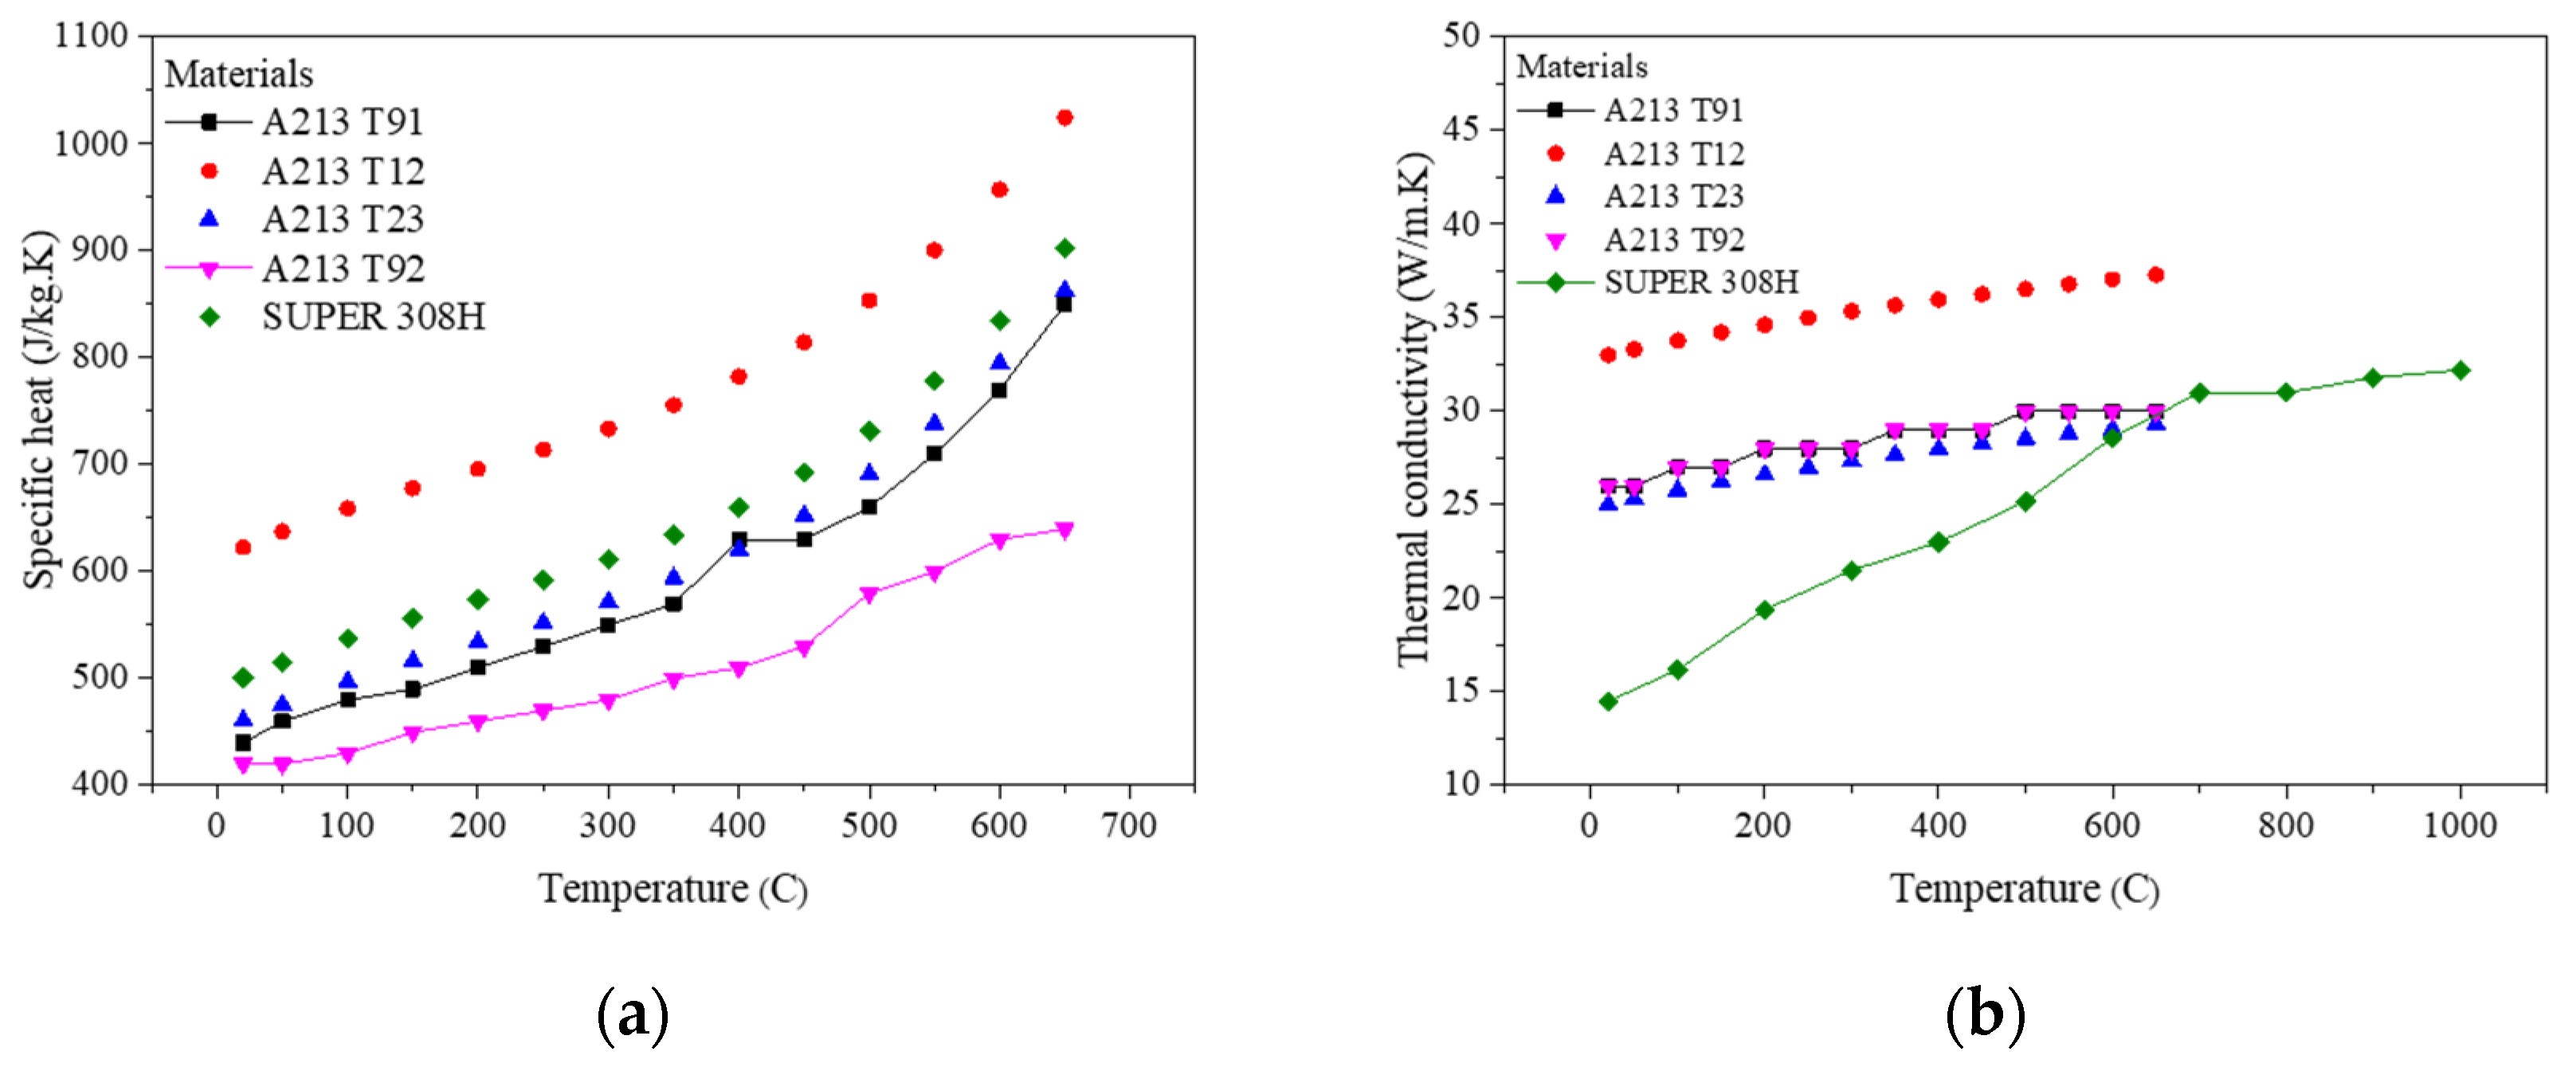
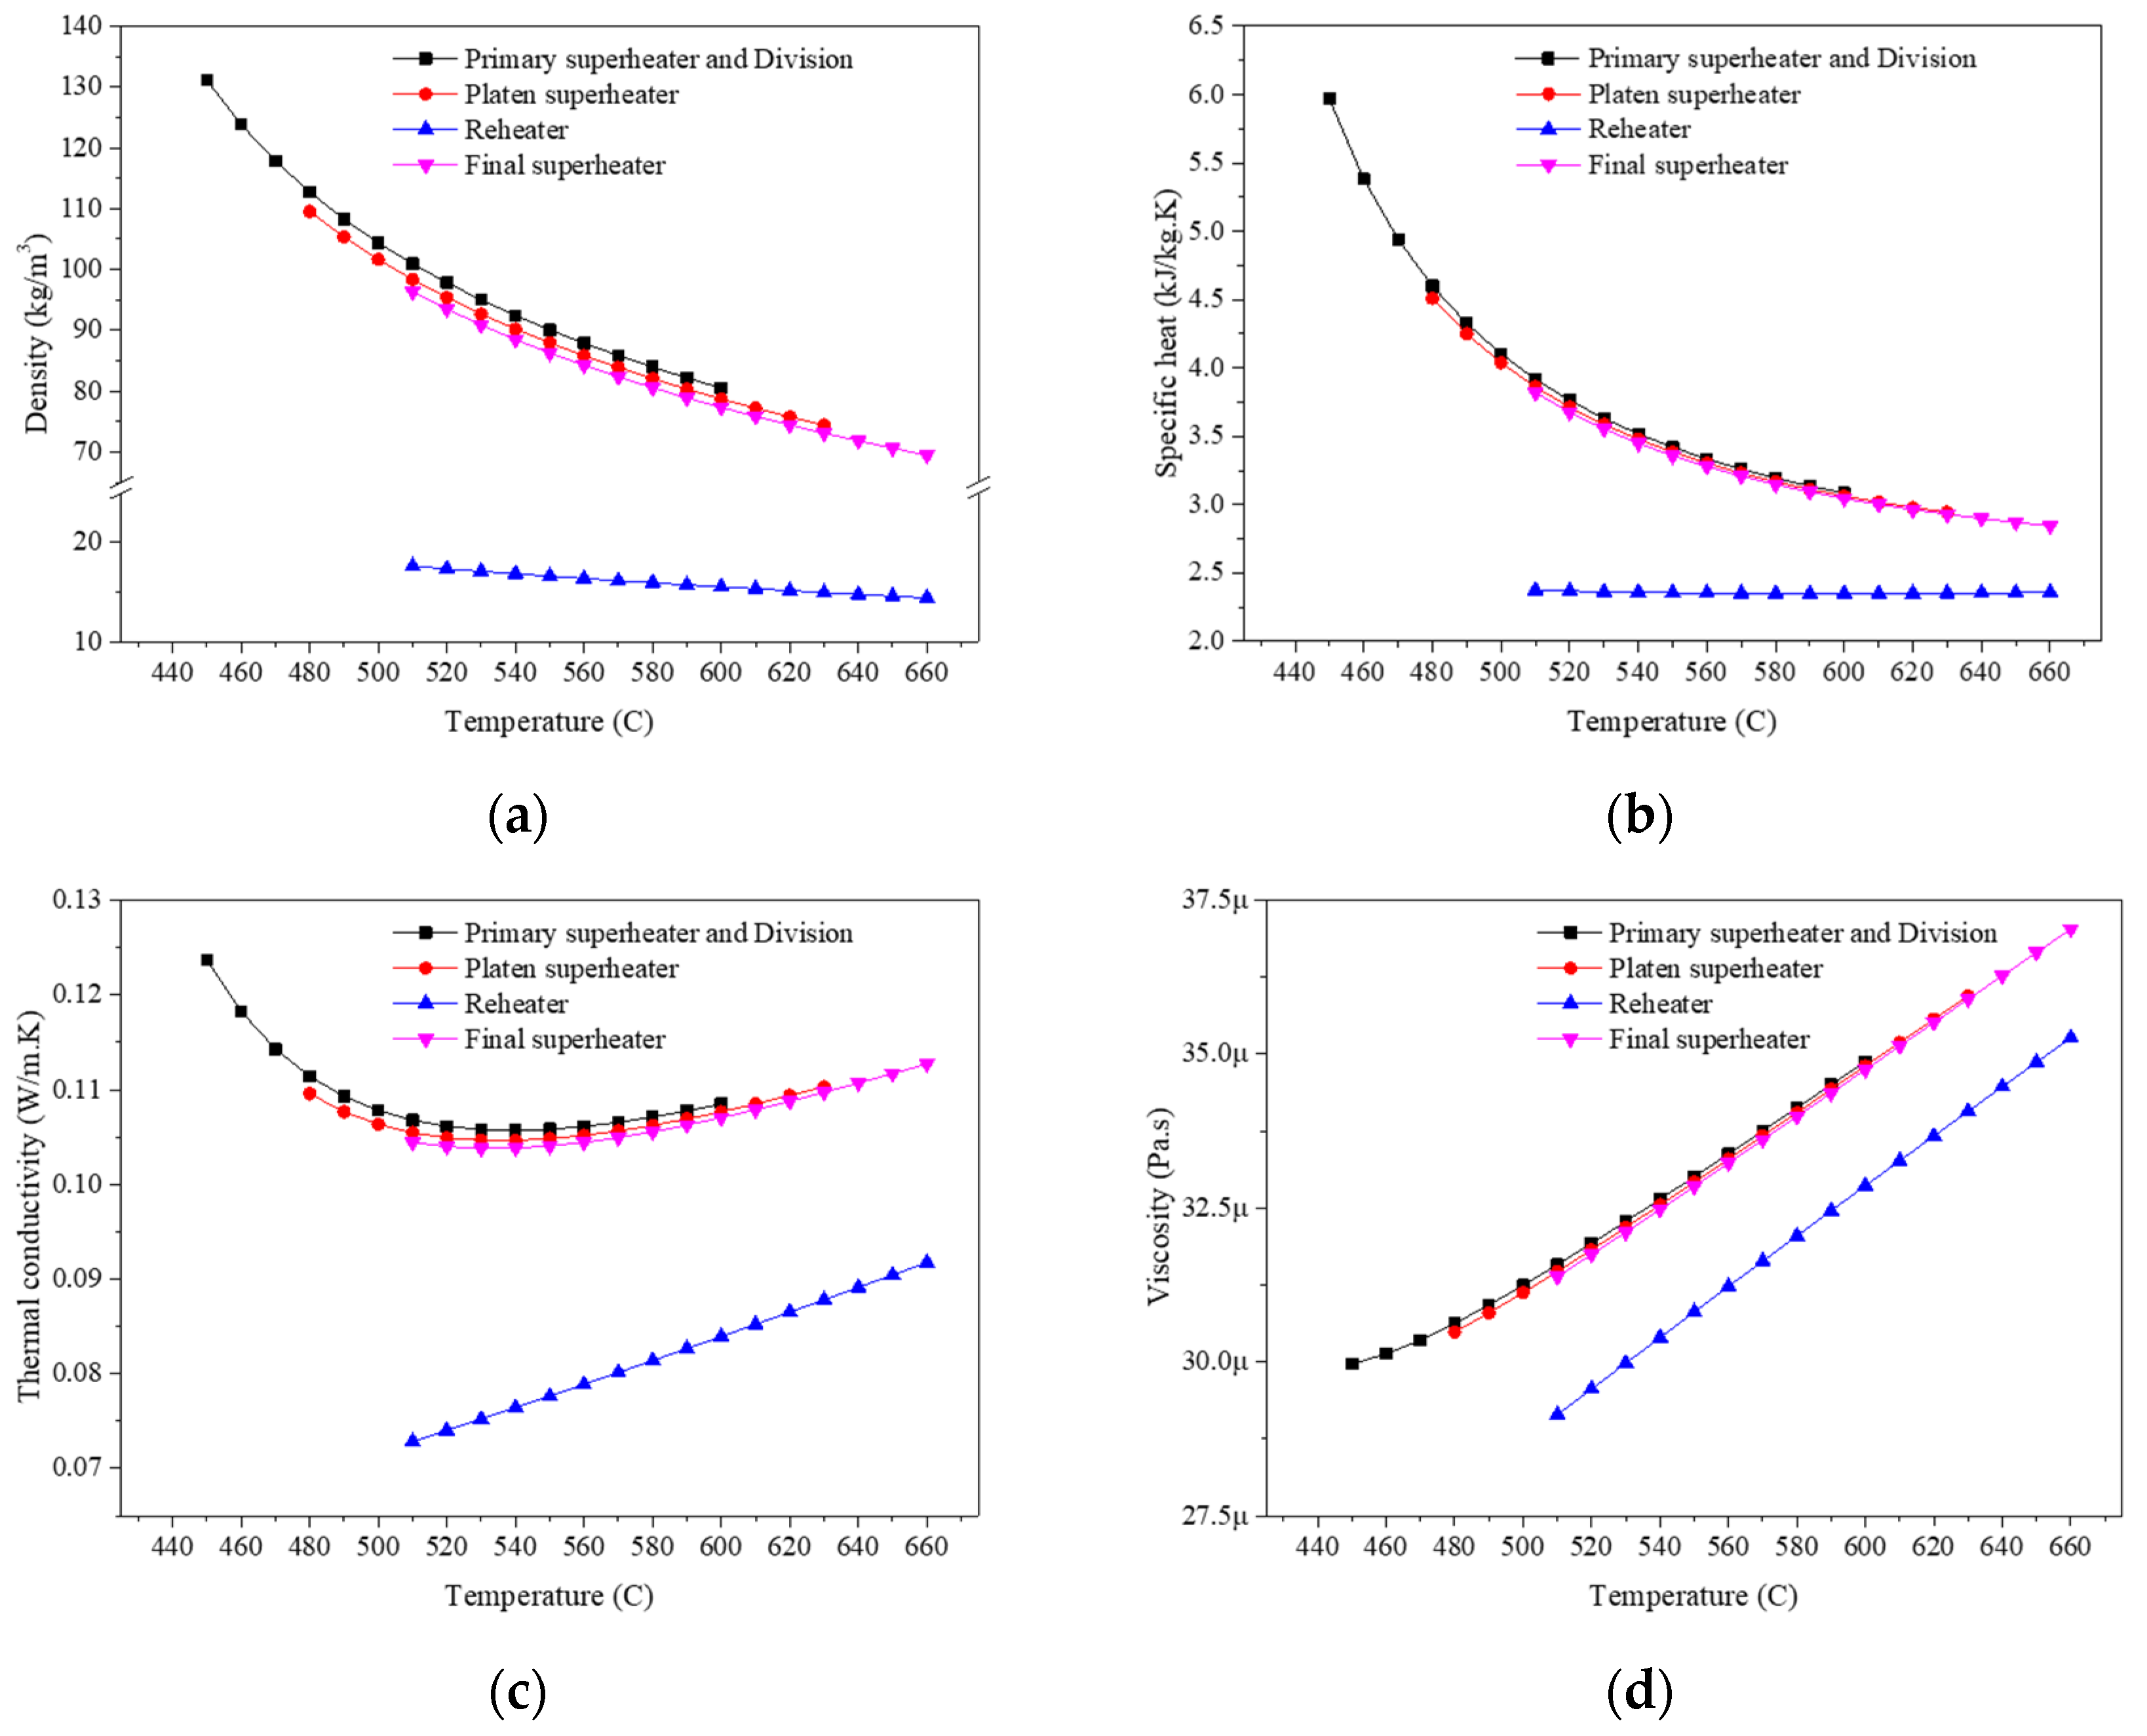
2.2. Thermophysical Properties

Generally, the steam tube is formed by joining two or three, sometimes four tubes, made up of different materials for permitting the metal temperature within an acceptable range and achieving a reasonable manufacturing cost. In this present work, the steam tube has two or three sections where one of these solid materials such as A213-T12, A213-T23, A213-T91, A213-T92, and SUPER 304H is used. The wall temperature of steel grade varies with the external hot gas temperature in the adjacent cell of the computational domain, which changes the steam temperature inside the tubes. Therefore, the thermophysical properties of steel grade are assumed to be a function of temperature and are used in the simulation via a piecewise linear equation. The values of the specific heat (Figure 3a) and thermal conductivity values (Figure 3b) with the variable temperature are shown in Figure 3. However, a constant density of 7760, 7700, 7770, 7900, and 7900 kg/m3 for A213-T12, A213-T23, A213-T91, A213-T92, and SUPER 304H, respectively, are considered.
Since the compressed steam is flowing inside the superheater tubes, then the thermophysical properties of steam are changeable, that is the function of temperature. Moreover, based on the inlet pressure condition for all superheaters in the present simulation, the steam is in a vapor state and supercritical state in the reheater tubes and the remaining superheater tubes, respectively. Therefore, by considering the steam inlet pressure as an isobaric condition, the thermophysical properties of compressed steam obtained from the NIST database are applied via the piecewise polynomial equation. The values of the density (Figure 4a), specific heat (Figure 4b), thermal conductivity (Figure 4c), and viscosity (Figure 4d) of steam are shown in Figure 4.

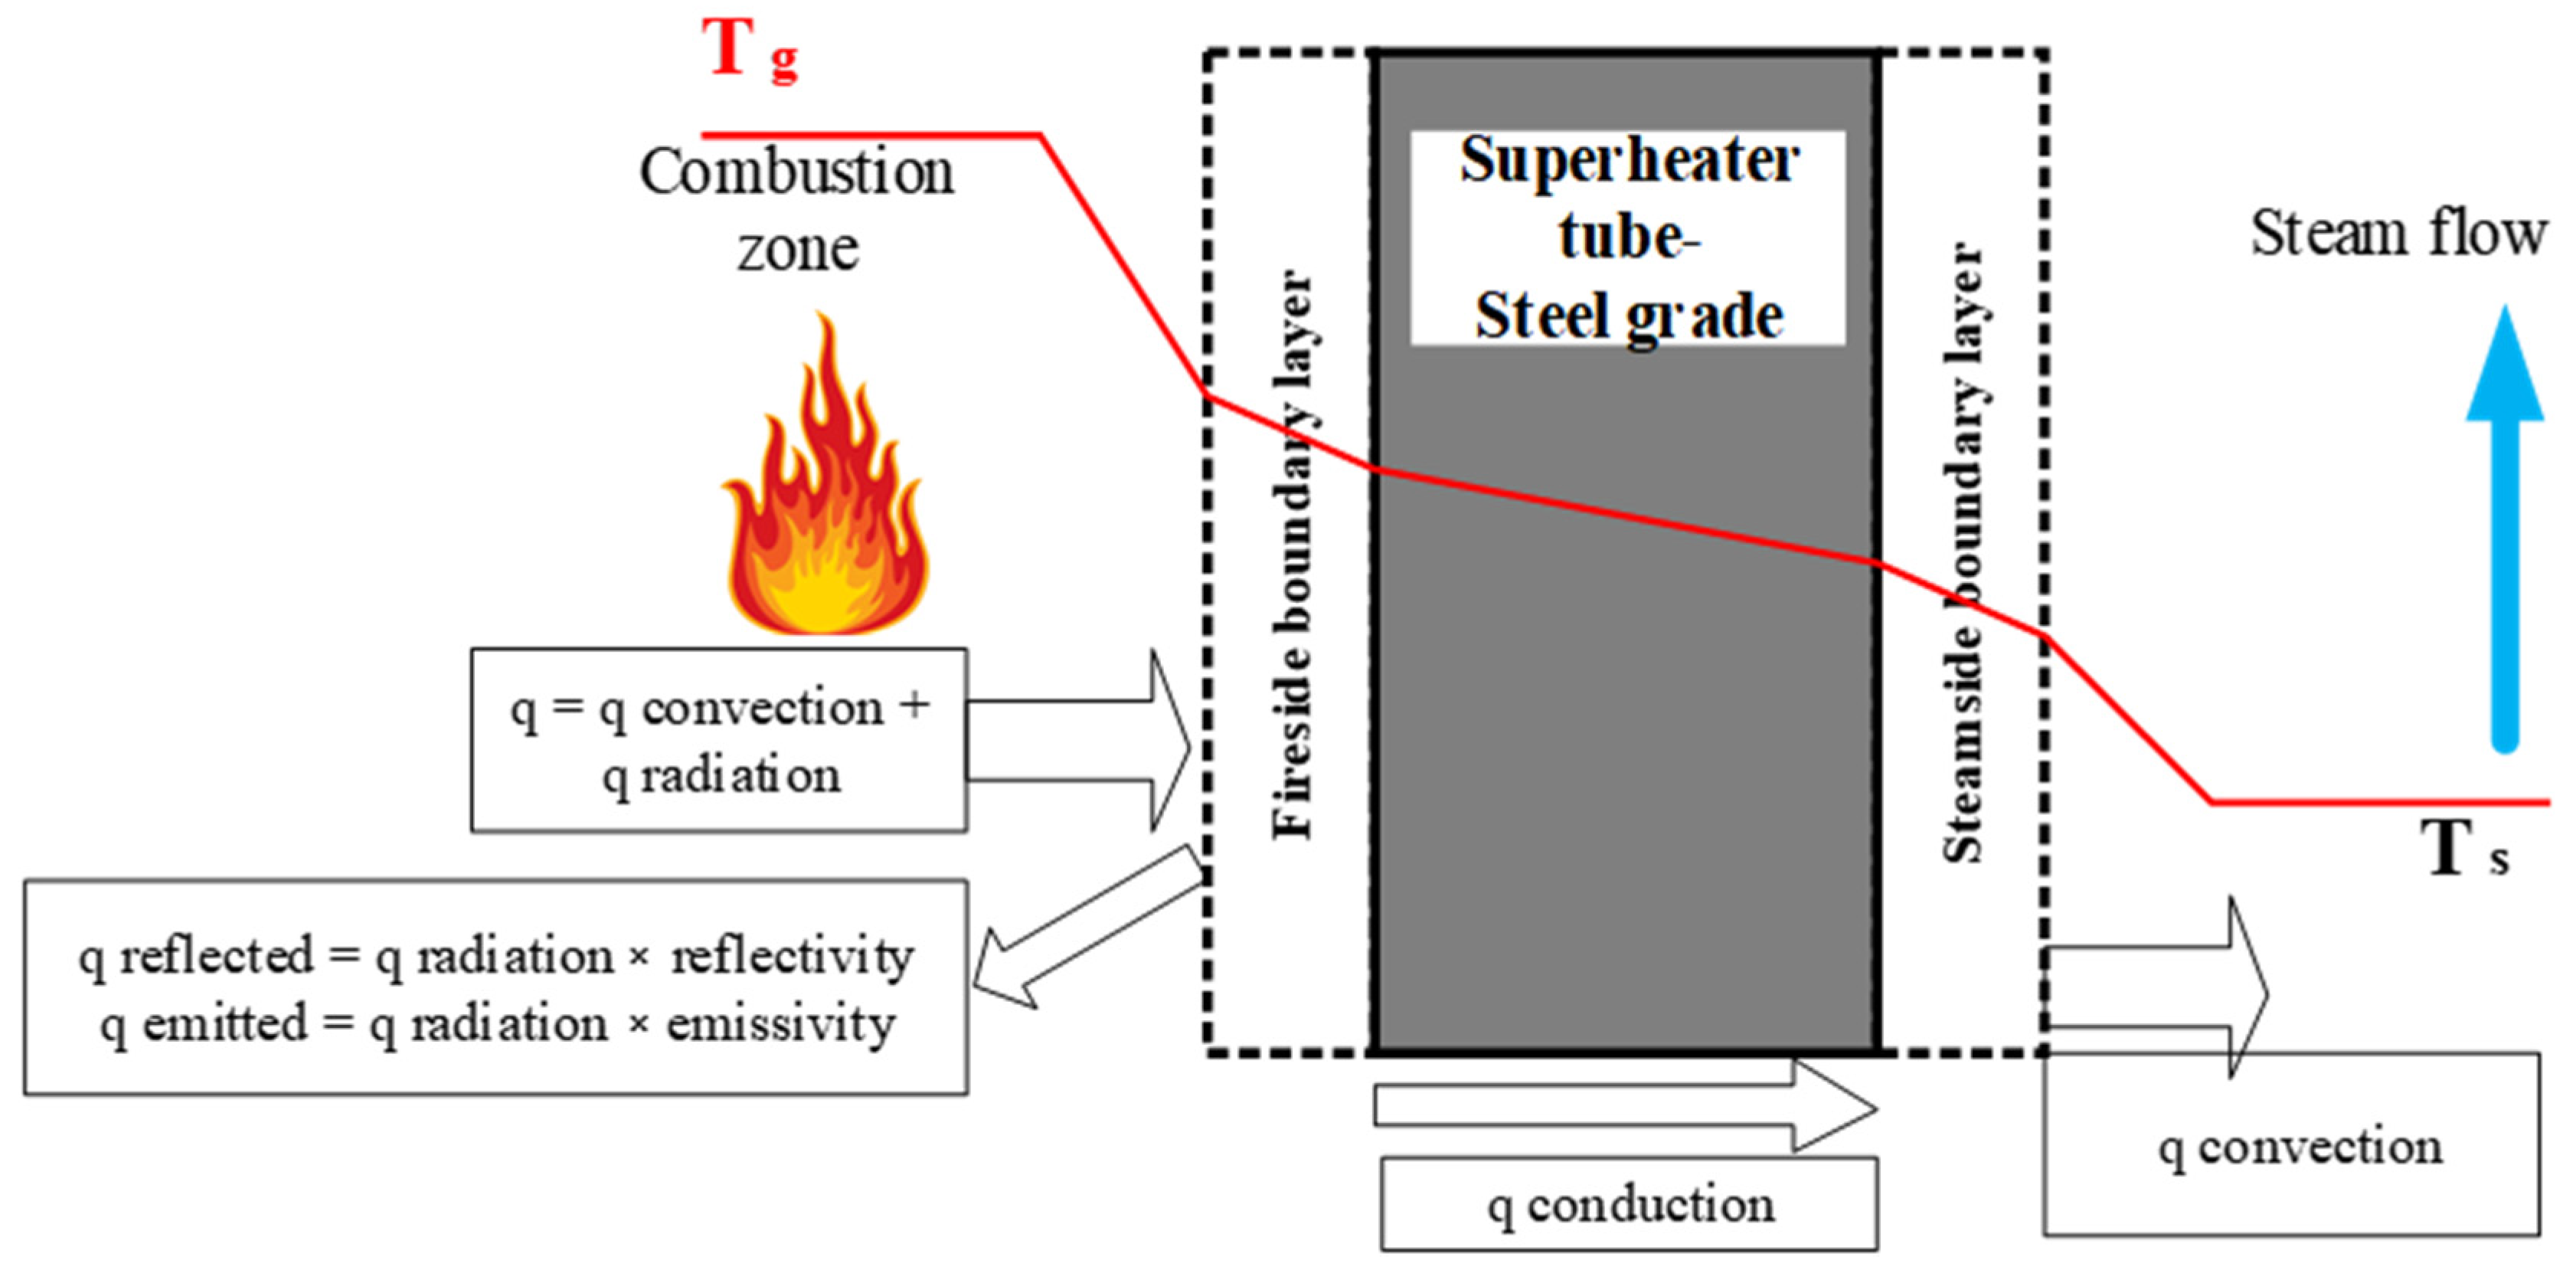
2.3. Mathematical Models

For solving the conjugate heat transfer problem in a boiler, the following models and sub-models are incorporated in a commercial ANSYS Fluent solver. The flow and turbulence solution are obtained by solving the continuity, momentum, and turbulence equations, while the heat transfer taking place from the hot gas side to the steam side through a solid medium is obtained by solving the energy equation and radiative transfer equation (RTE). A 3D steady-state flow type is considered to solve the governing equations and additional transport equations where the realizable k-epsilon equations with a standard wall function are utilized for turbulence modeling. The steady-state governing equations are written as follows:
Continuity:
ρ v = 0
Momentum:
ρ v v = p + τ ̿ + ρ g + F
Energy:
v ρ E + p = k e f f T j h j J j + τ ̿ e f f . v + S h
where ρ is the density, v is the velocity field, p is the static pressure, τ ̿ is the stress tensor, ρ g is the gravitational body force, F is the external force of a porous media, E is the internal energy, h j is the sensible enthalpy, k e f f is the effective conductivity ( k e f f = k + k t , k t is the turbulent thermal conductivity from the turbulence model), J j is the diffusion flux of species j , and S h is the radiation source term and is solved from the radiative transfer equation using the P-1 radiation model [23].
Radiative heat transfer for conjugate heat transfer problem is solved through the Radiative Transfer Equation (RTE) using the P-1 model [20,21,24]. The radiation source term in the energy Equation (3) for modeling the gray radiation is directly substituted by Equation (4).
q r = 4 a n 2 σ T 4 + a G
Considering the walls are diffuse gray surfaces, then, the flux of the incident radiation G at a wall can be calculated using Equation (5):
q r , w = ε w 2 2 ε w 4 n 2 σ T w 4 G w
where q r is the flux of the incident radiation G , a is the absorption coefficient, n is the refractive index, T is the local radiation temperature, σ is the Stefan–Boltzmann constant (5.669 × 10⁻⁸ W/(m2×K4), ε is the emissivity, and the subscript w is the wall.
The temperature is imposed at the outer wall of the boiler geometry using a fixed wall temperature T w . Thereby, the heat transfer coefficient at the outer wall of the boiler can be calculated using Equation (6) by q r from Equation (5), T w (user input), and an adjacent cell temperature of hot gas T a d j .
q r , w = h T w T a d j
In the superheater regions, the interface between solid and fluid sides is coupled using the two-sided wall boundary condition. Thereby the interface has appeared as a wall and shadow wall where the material type and the wall emissivity are specified. However, the wall thickness and heat generation are specified as zero so that the solver assumes that the walls have zero thermal resistance. However, the assumption of zero wall thickness is not applicable because of ash deposition and scale formation on the tube wall in an actual coal boiler. The formation of both ash and scale is not considered in this present work, which is mainly focused on an ideal superheater design. Therefore, the solver calculates the heat transfer from the solution in the adjacent cells. Equation (5) along with the gas phase energy conservative equation gives the wall surface temperature T w at the superheater tubes, which is substituted into Equation (6) to find the heat transfer coefficient h of each tube in the superheater regions. As the material type is specified, the solver can calculate the wall temperature at the steam side using the thermal conductivity of the specified material and the same value of heat flux from the hot side wall. This value is used for calculating the steam temperature. The schematic for showing the heat transfer from the hot to the steam side for an ideal case is shown in Figure 5.

2.4. Simulation Conditions

As the present simulation domain does not include a combustion furnace, therefore, the temperature and velocity data of a hot gas taken from a furnace exit of our previous combustion simulation, as shown in Figure 6a, which is used in an initial design of the boiler, are directly given as inlet data in this present work using the velocity inlet boundary condition, and are shown in Figure 6b,c. Here, the air is considered as a fluid medium for the hot gas. For the superheaters, the inlet pressure and inlet temperature using a pressure inlet boundary condition are provided at the steam inlet, and a prescribed mass flow rate is fixed at the steam outlet to determine the steam outlet temperature based on the mass conservation. The steam inlet and outlet boundary conditions for superheaters are given in Table 4. The temperature for the external boiler wall is applied as 680 K. The SIMPLE scheme is employed to solve the pressure–velocity equations while the solution accuracy is improved by adopting QUICK scheme spatial discretization.

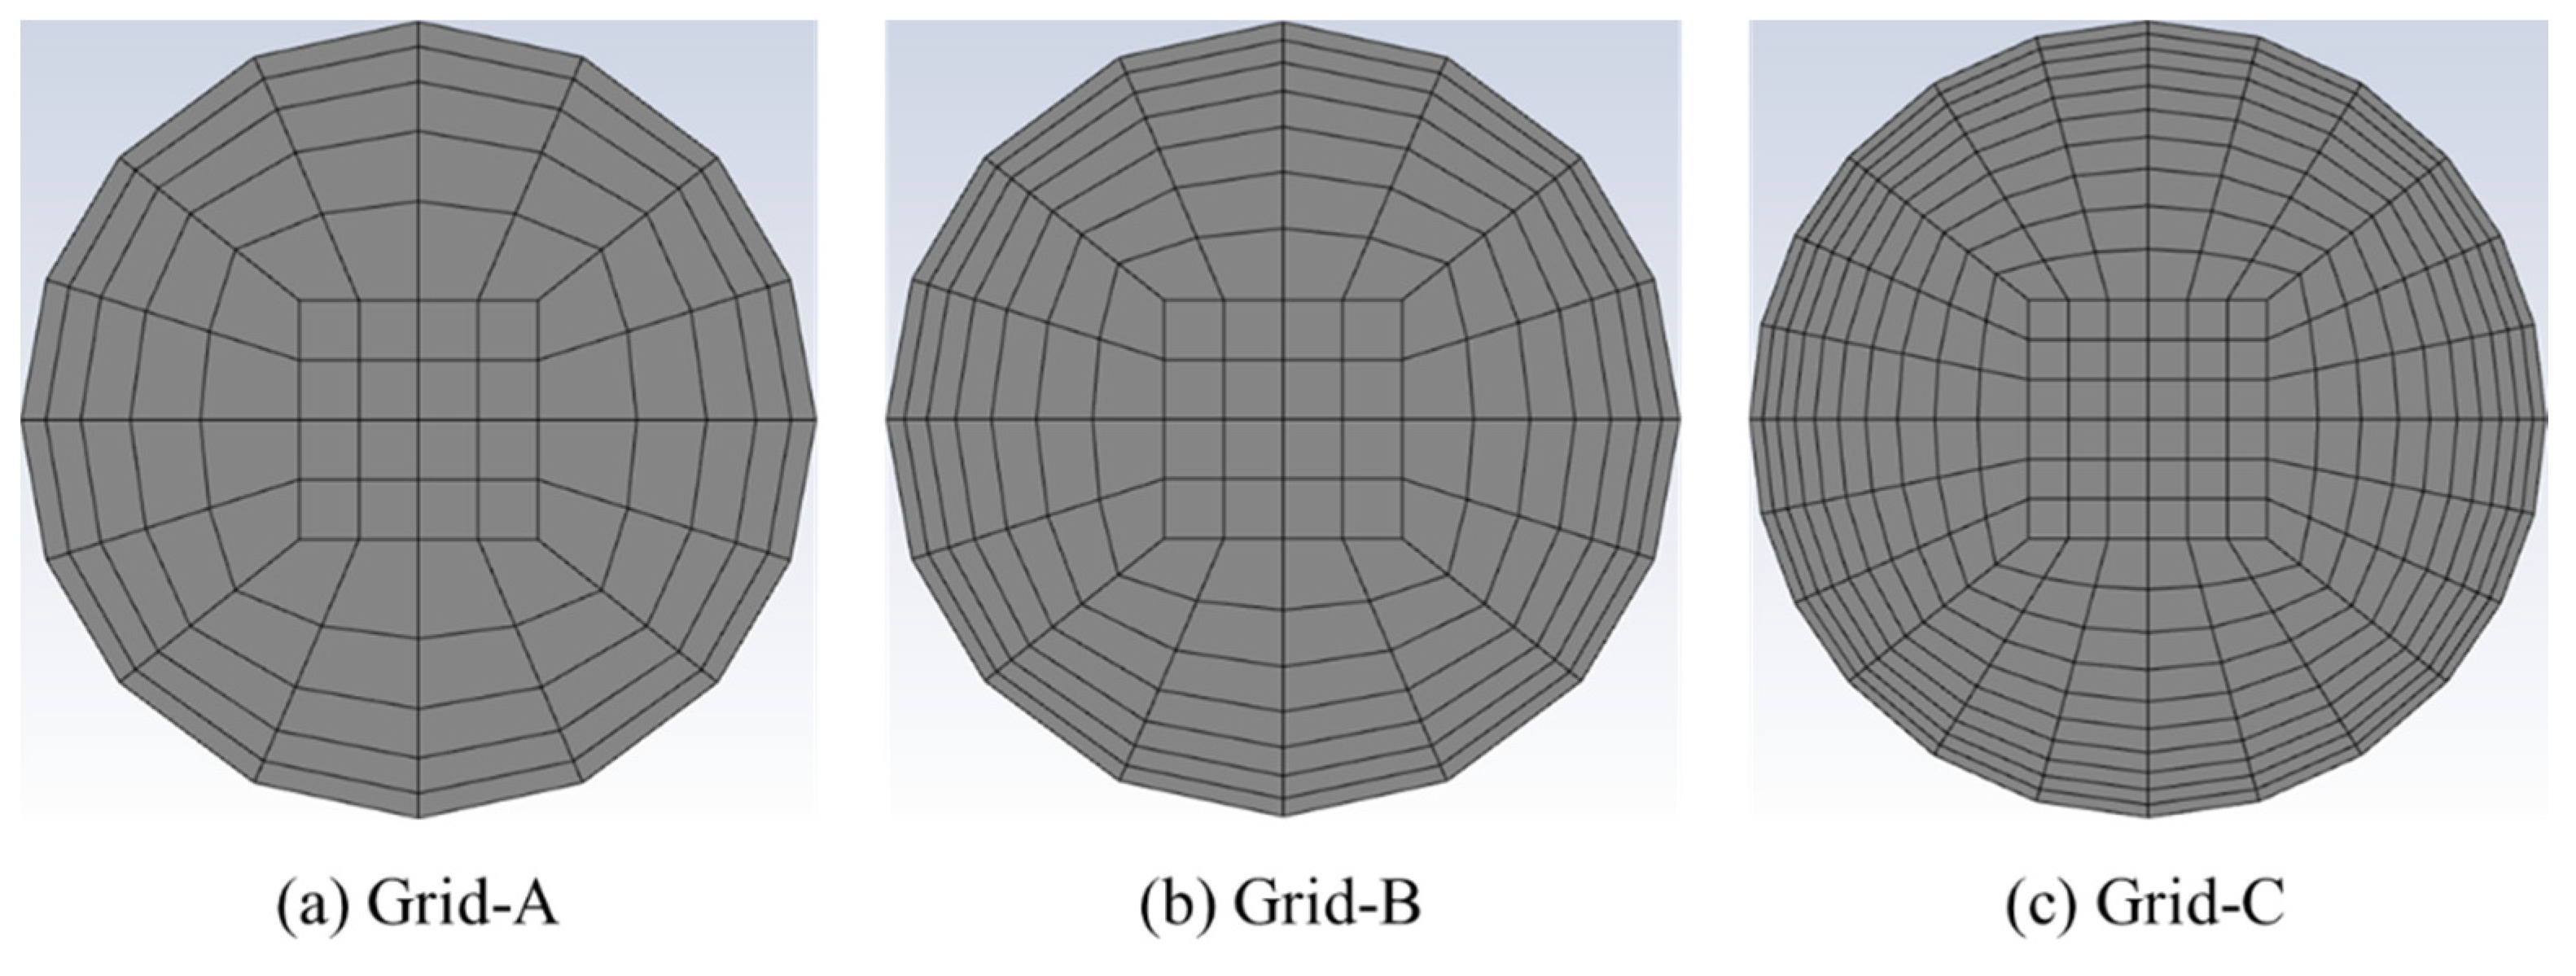
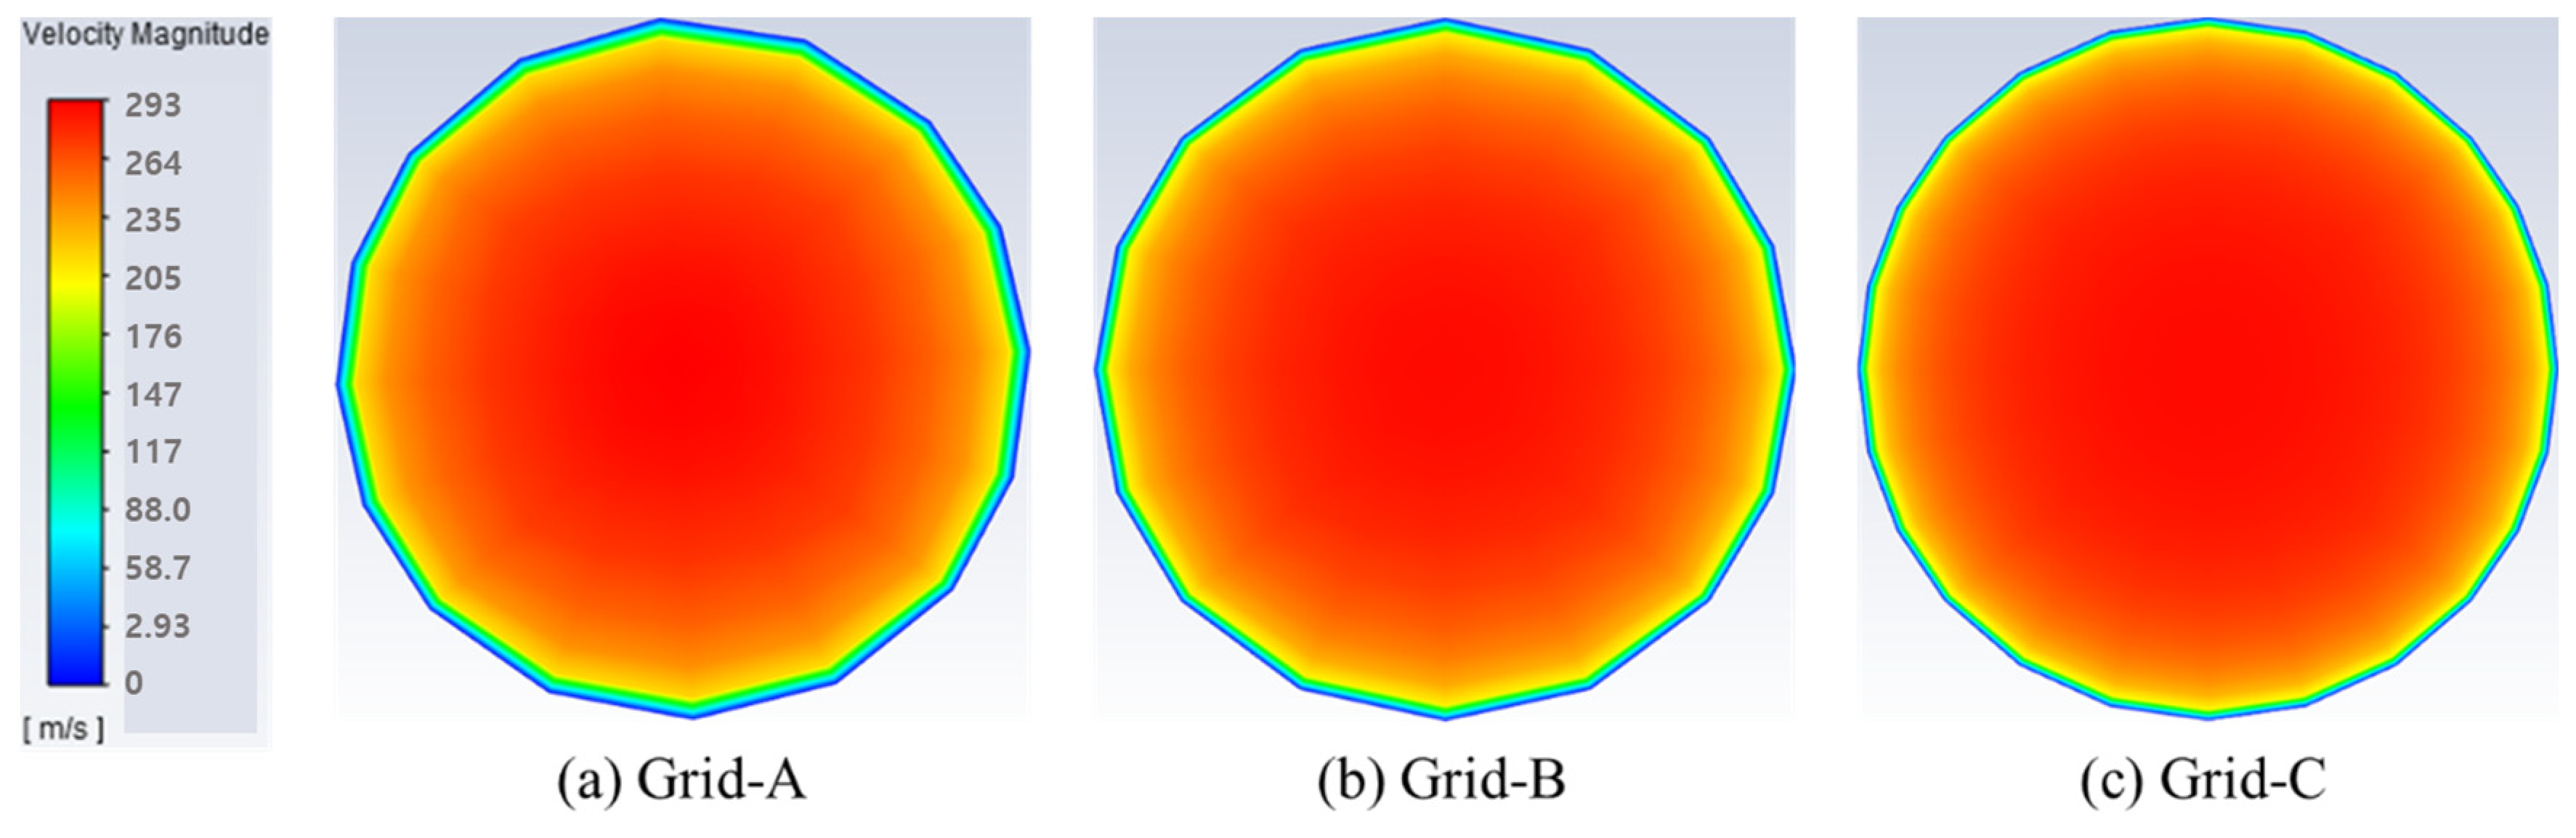
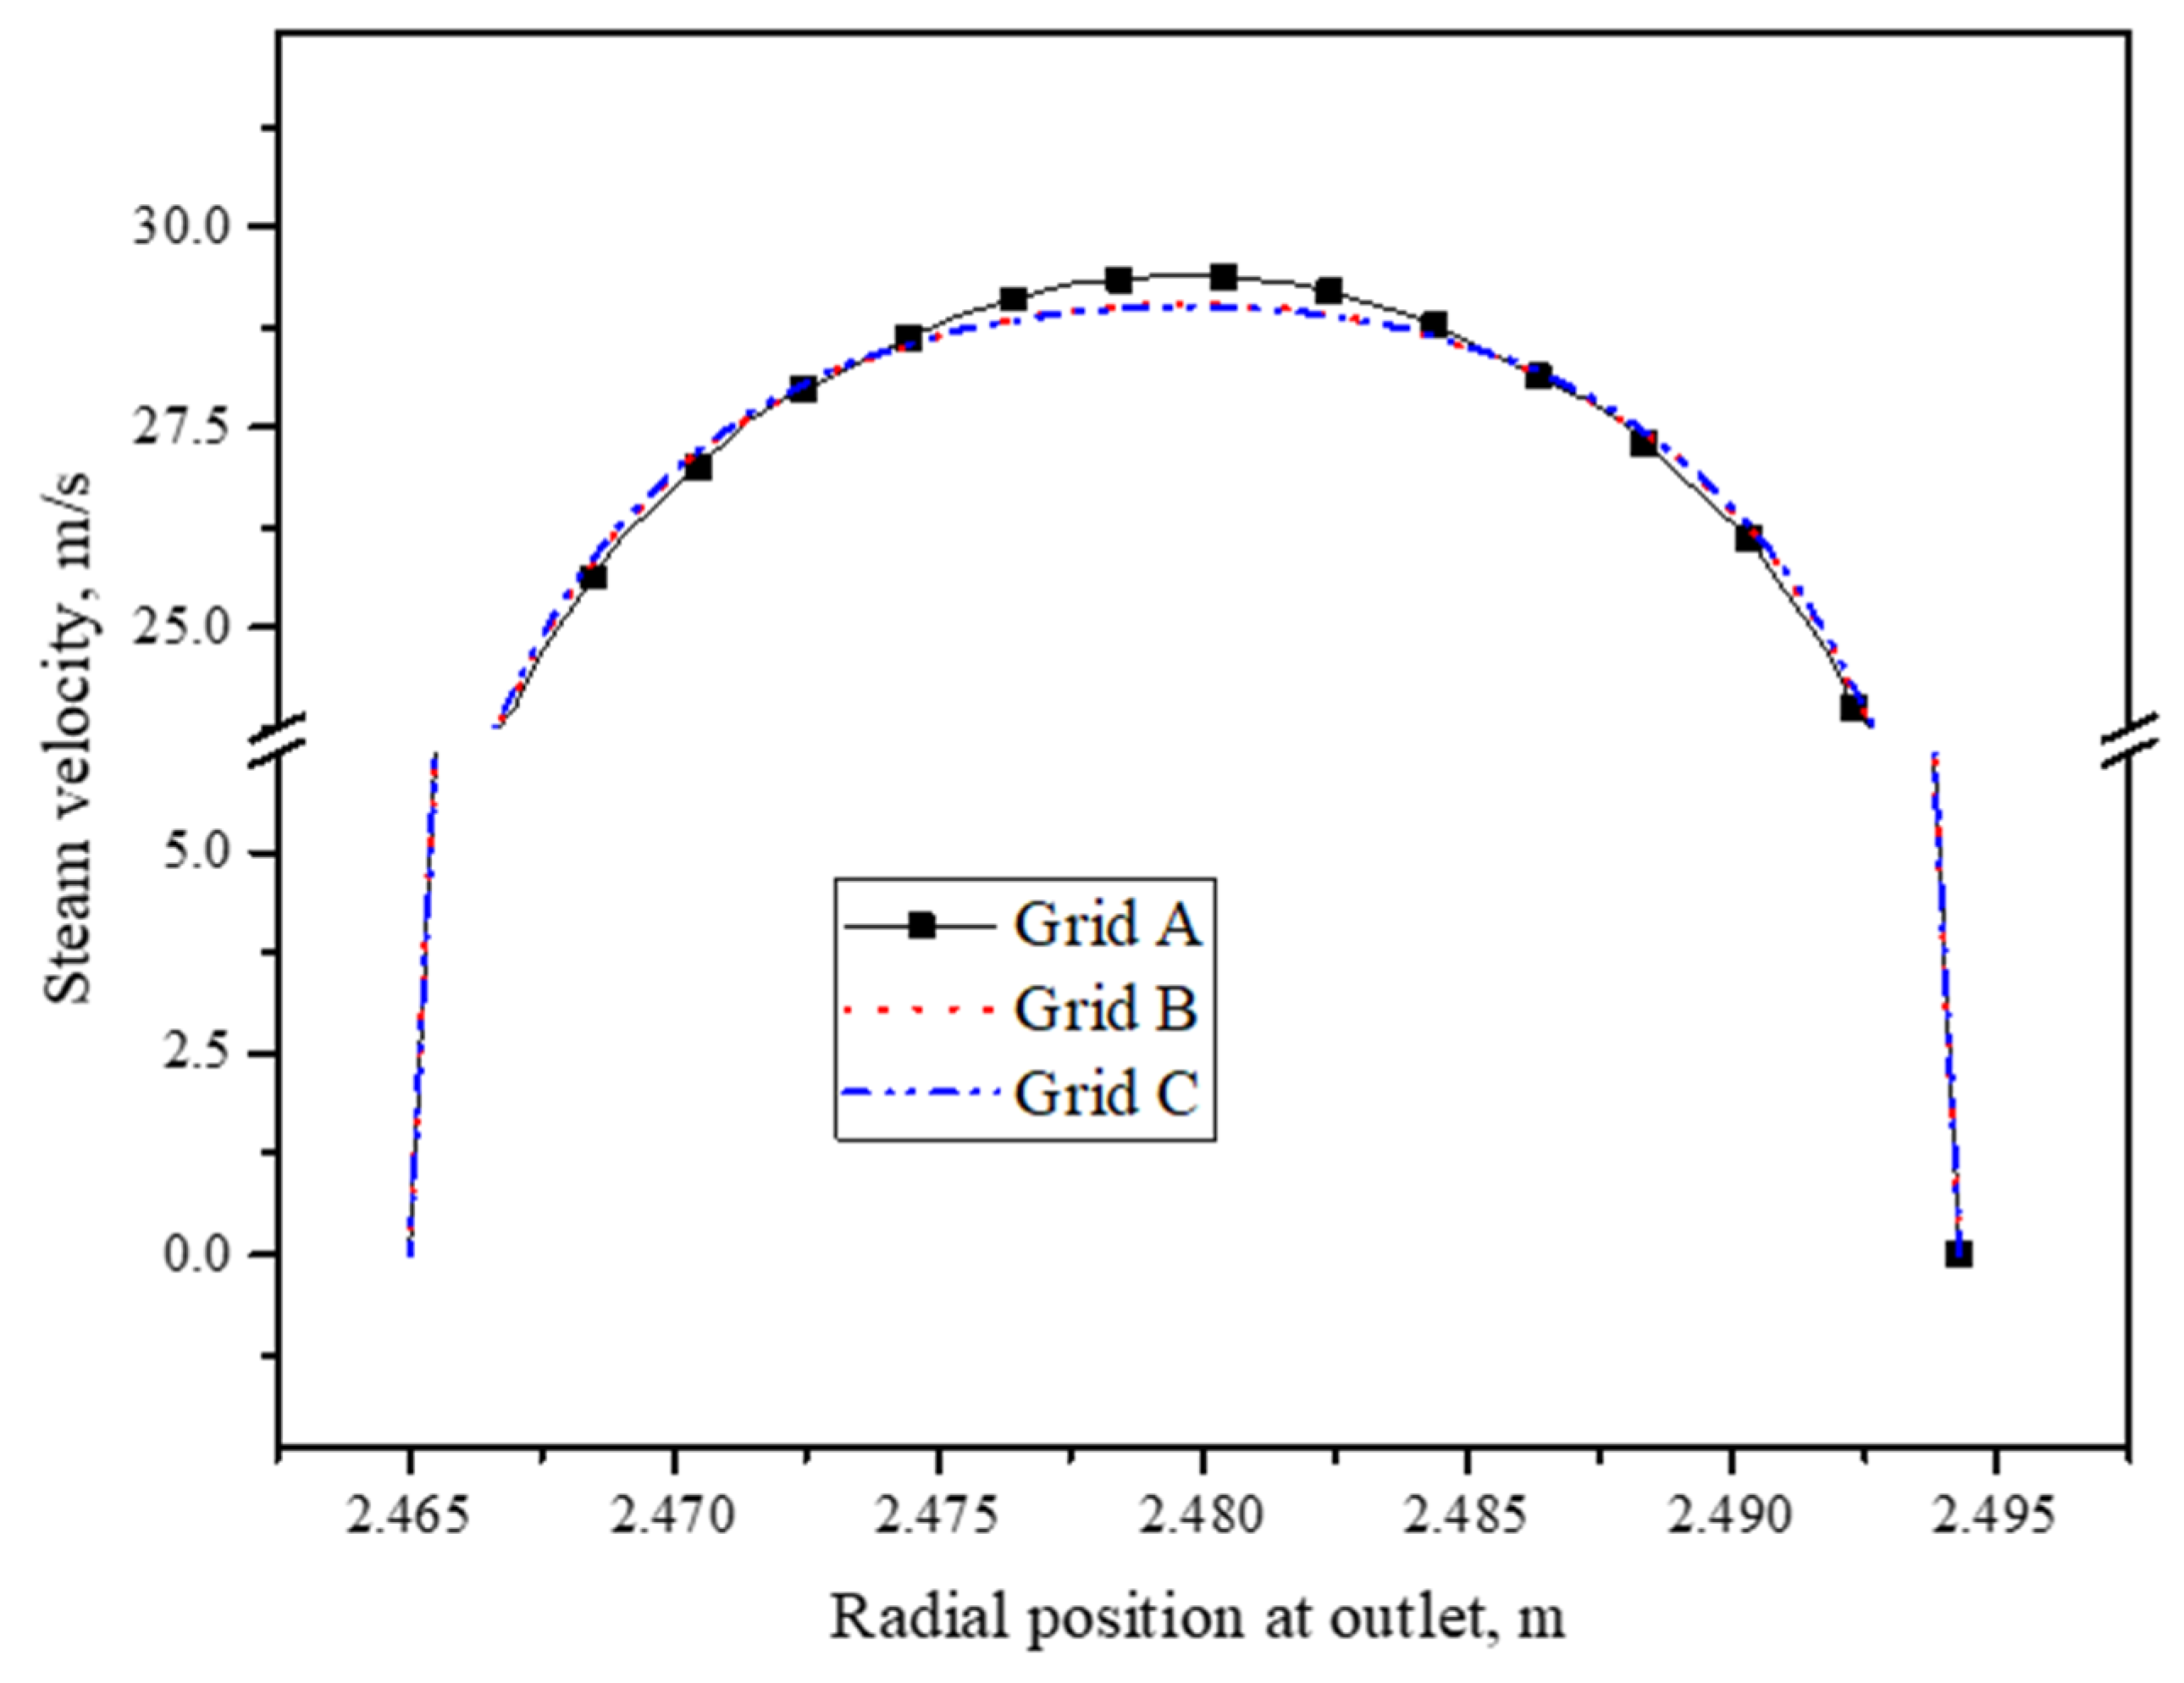
2.5. Grid Independence Study

The utilized meshes in the computational domain are exceedingly large numbers due to a large number of superheater tubes, which necessitates a greater amount of computational time and resources. To mitigate the computing complexity, a single tube is considered rather than all tubes to perform a grid independence analysis. In this way, the first tube of the FSH is considered without any specific reason. The diameter and height of the tube were 0.02928 m and 7.918 m. The minimum size of the grid element was 2.12 mm and three different sets of structured grids, 49,192 (Grid-A), 78,001 (Grid-B), and 159,883 (Grid-C) were adopted to mesh the tube, as shown in Figure 7. The simulation result of a velocity contour for the three different grids is shown in Figure 8 and the outlet velocity profile along a radial direction of the tube is shown in Figure 9. The grid analysis shows that all grids provided the same velocity profile except at the center. The velocity profile was not changed by increasing grid numbers from Grid-B to Grid-C. Therefore, the element size in Grid-B was considered for remaining all tubes. Thus, the domain had a total number of 323,912,051 cells to perform this simulation.

3. Results and Discussion

3.1. Validation

We validated the numerical methods used in the present CHT modeling by applying the designed boundary condition (Table 4) provided by the plant manufacturer on the ideal case simulation with different values of wall emissivity: 1.0, 0.8, and 0.2~0.4. The simulation data were compared to the designed steam outlet temperature of a 100% load condition. The comparison of the averaged steam outlet temperature of all superheater tubes, PrSH, PlSH, RH, and FSH, is shown in Figure 10. The comparison shows that the simulation case with a wall emissivity of 1.0 and 0.8 had a larger margin of steam temperature against the designed data than the simulation case with a smaller wall emissivity of 0.2~0.4. However, by considering the smaller value of wall emissivity, the simulation predicted the steam outlet temperature a little higher than the designed data of PlSH, RH, and FSH, but the simulated value of the averaged steam outlet temperature profile shows a better agreement with the designed data than the other emissivity values of 1.0 and 0.8.
The emissivity of coal-fired power plants is well-known, ranging from 0.2 to 0.4 according to numerous previous studies [28]. Emissivity is contingent upon the fire flame temperature and each heating zone. In this study, distinct emissivity values were assigned to the pipe walls. Despite being in the same heating pipe zone, the inner pipes, not directly exposed to the flame, were assigned an emissivity of 0.2. Conversely, the outer pipes, directly exposed to the flame, were given a higher emissivity of 0.4.
The primary objective of this study is to discern detailed flow and heat transfer characteristics by simulating all pipes in the superheater area of the pulverized coal-fired boiler. Consequently, it is crucial to attribute different emissivity values to each pipe and validate them by comparing them with actual design data. Through these endeavors, reliable analysis results were obtained.
Despite these efforts, discrepancies can be observed in the calculated values for the PlSH, RH, and FSH heating zones compared to the actual design values. This discrepancy is induced by variations in additional steam supply and recirculation for individual pipes in each zone during boiler operation. These steam mass flow factors were not fully considered in this analysis. The results align accurately only in the primary superheater (PrSH) zone, where there is no occurrence of additional steam supply or recirculation.

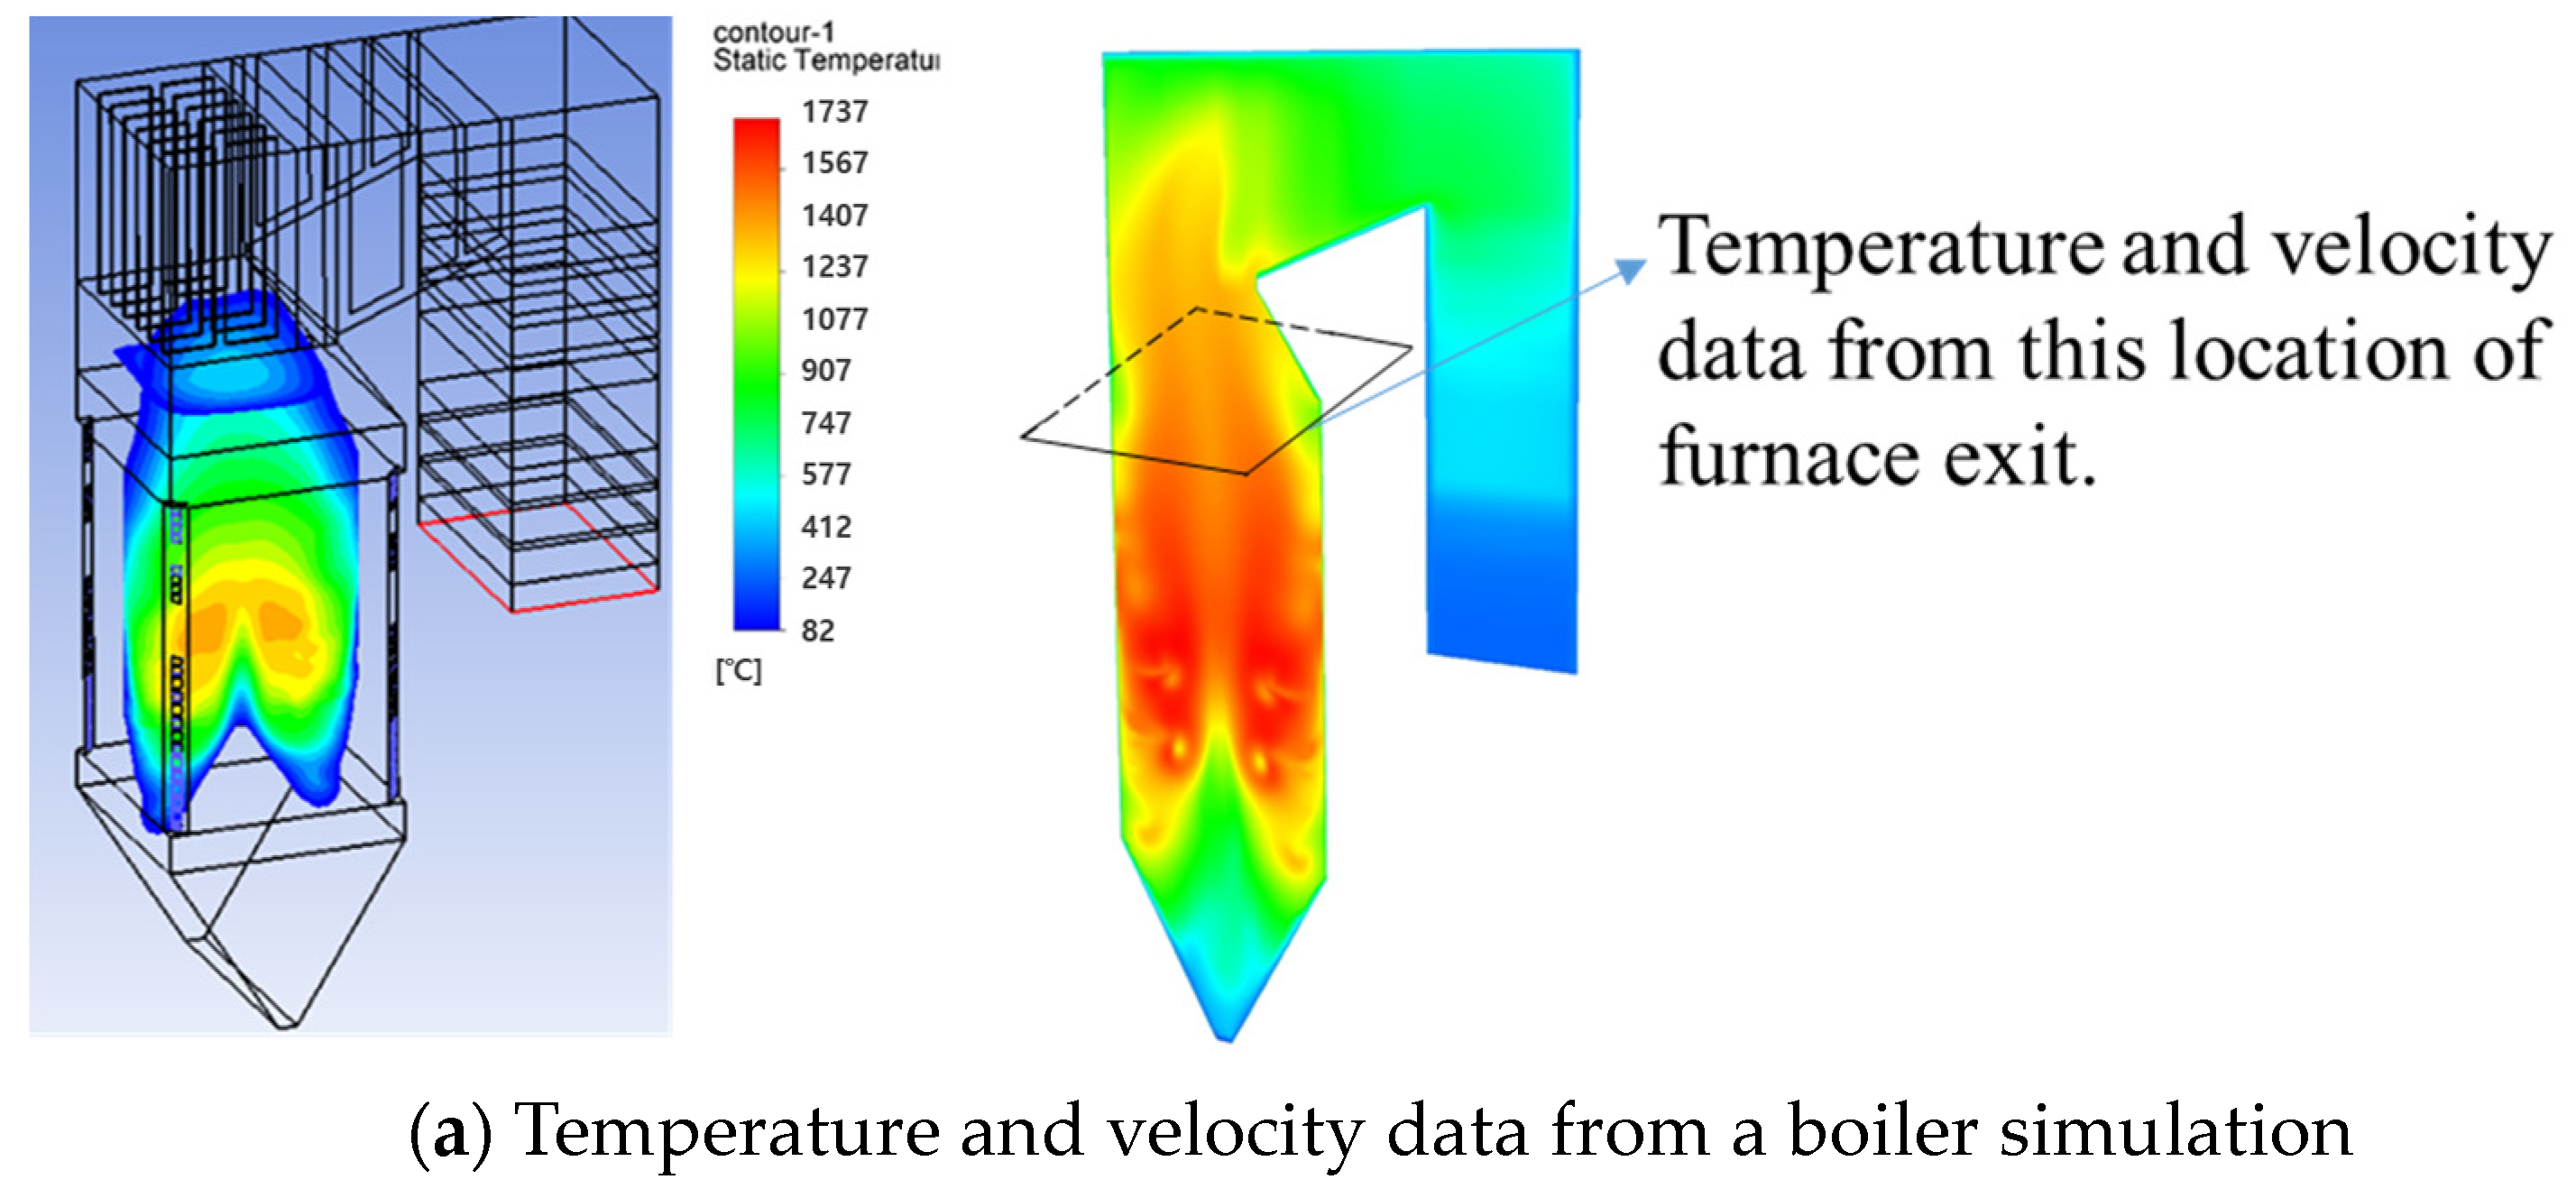
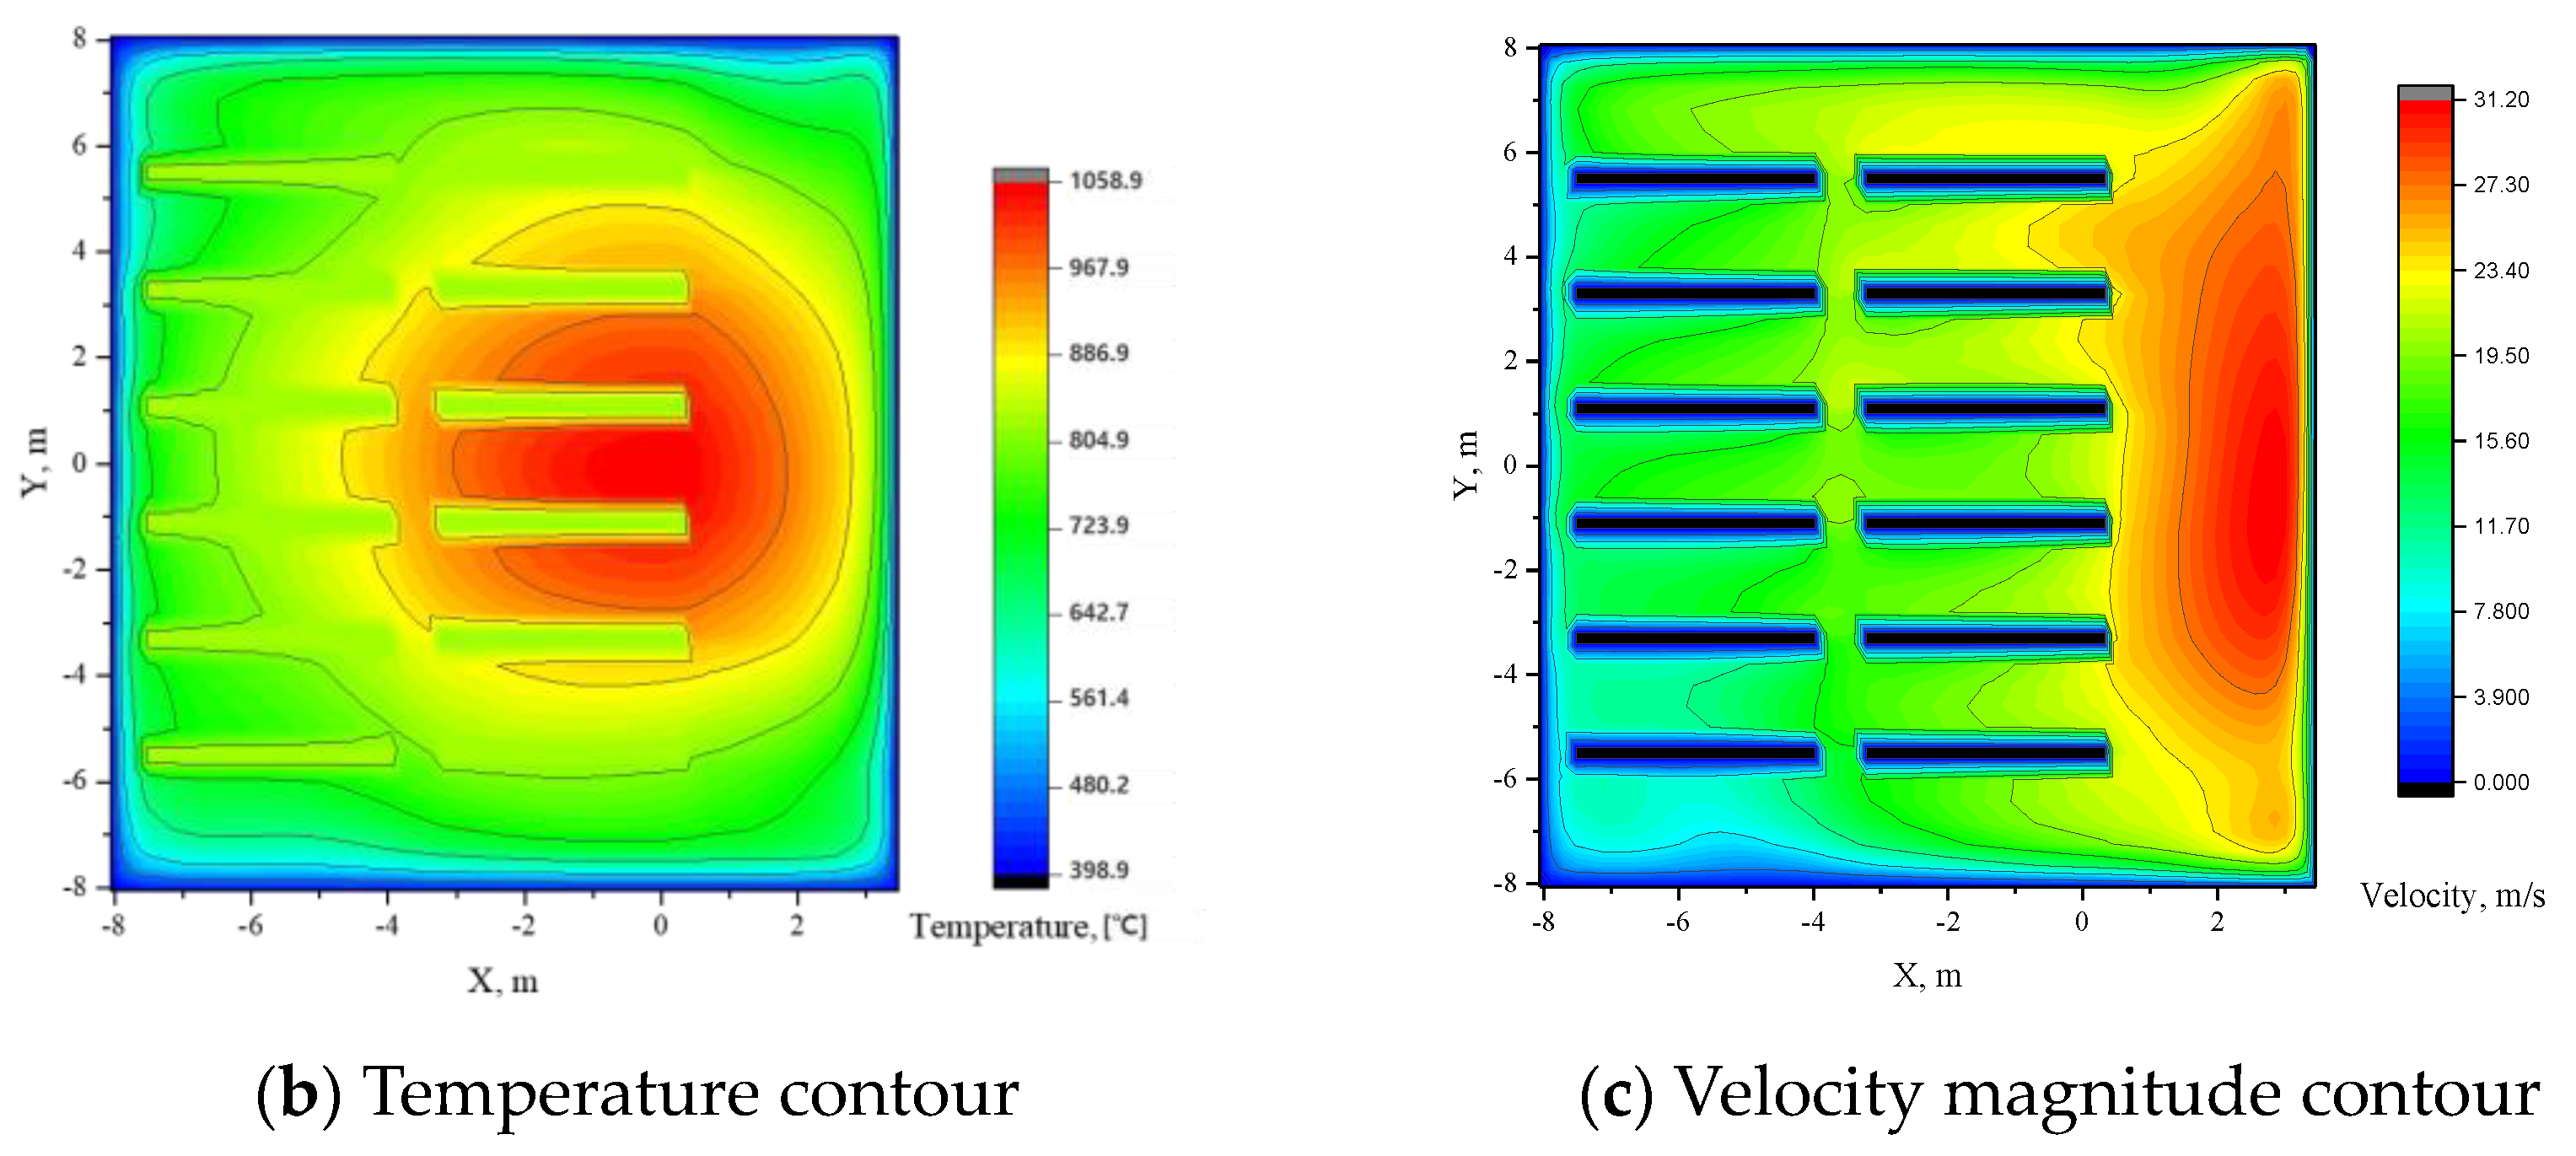
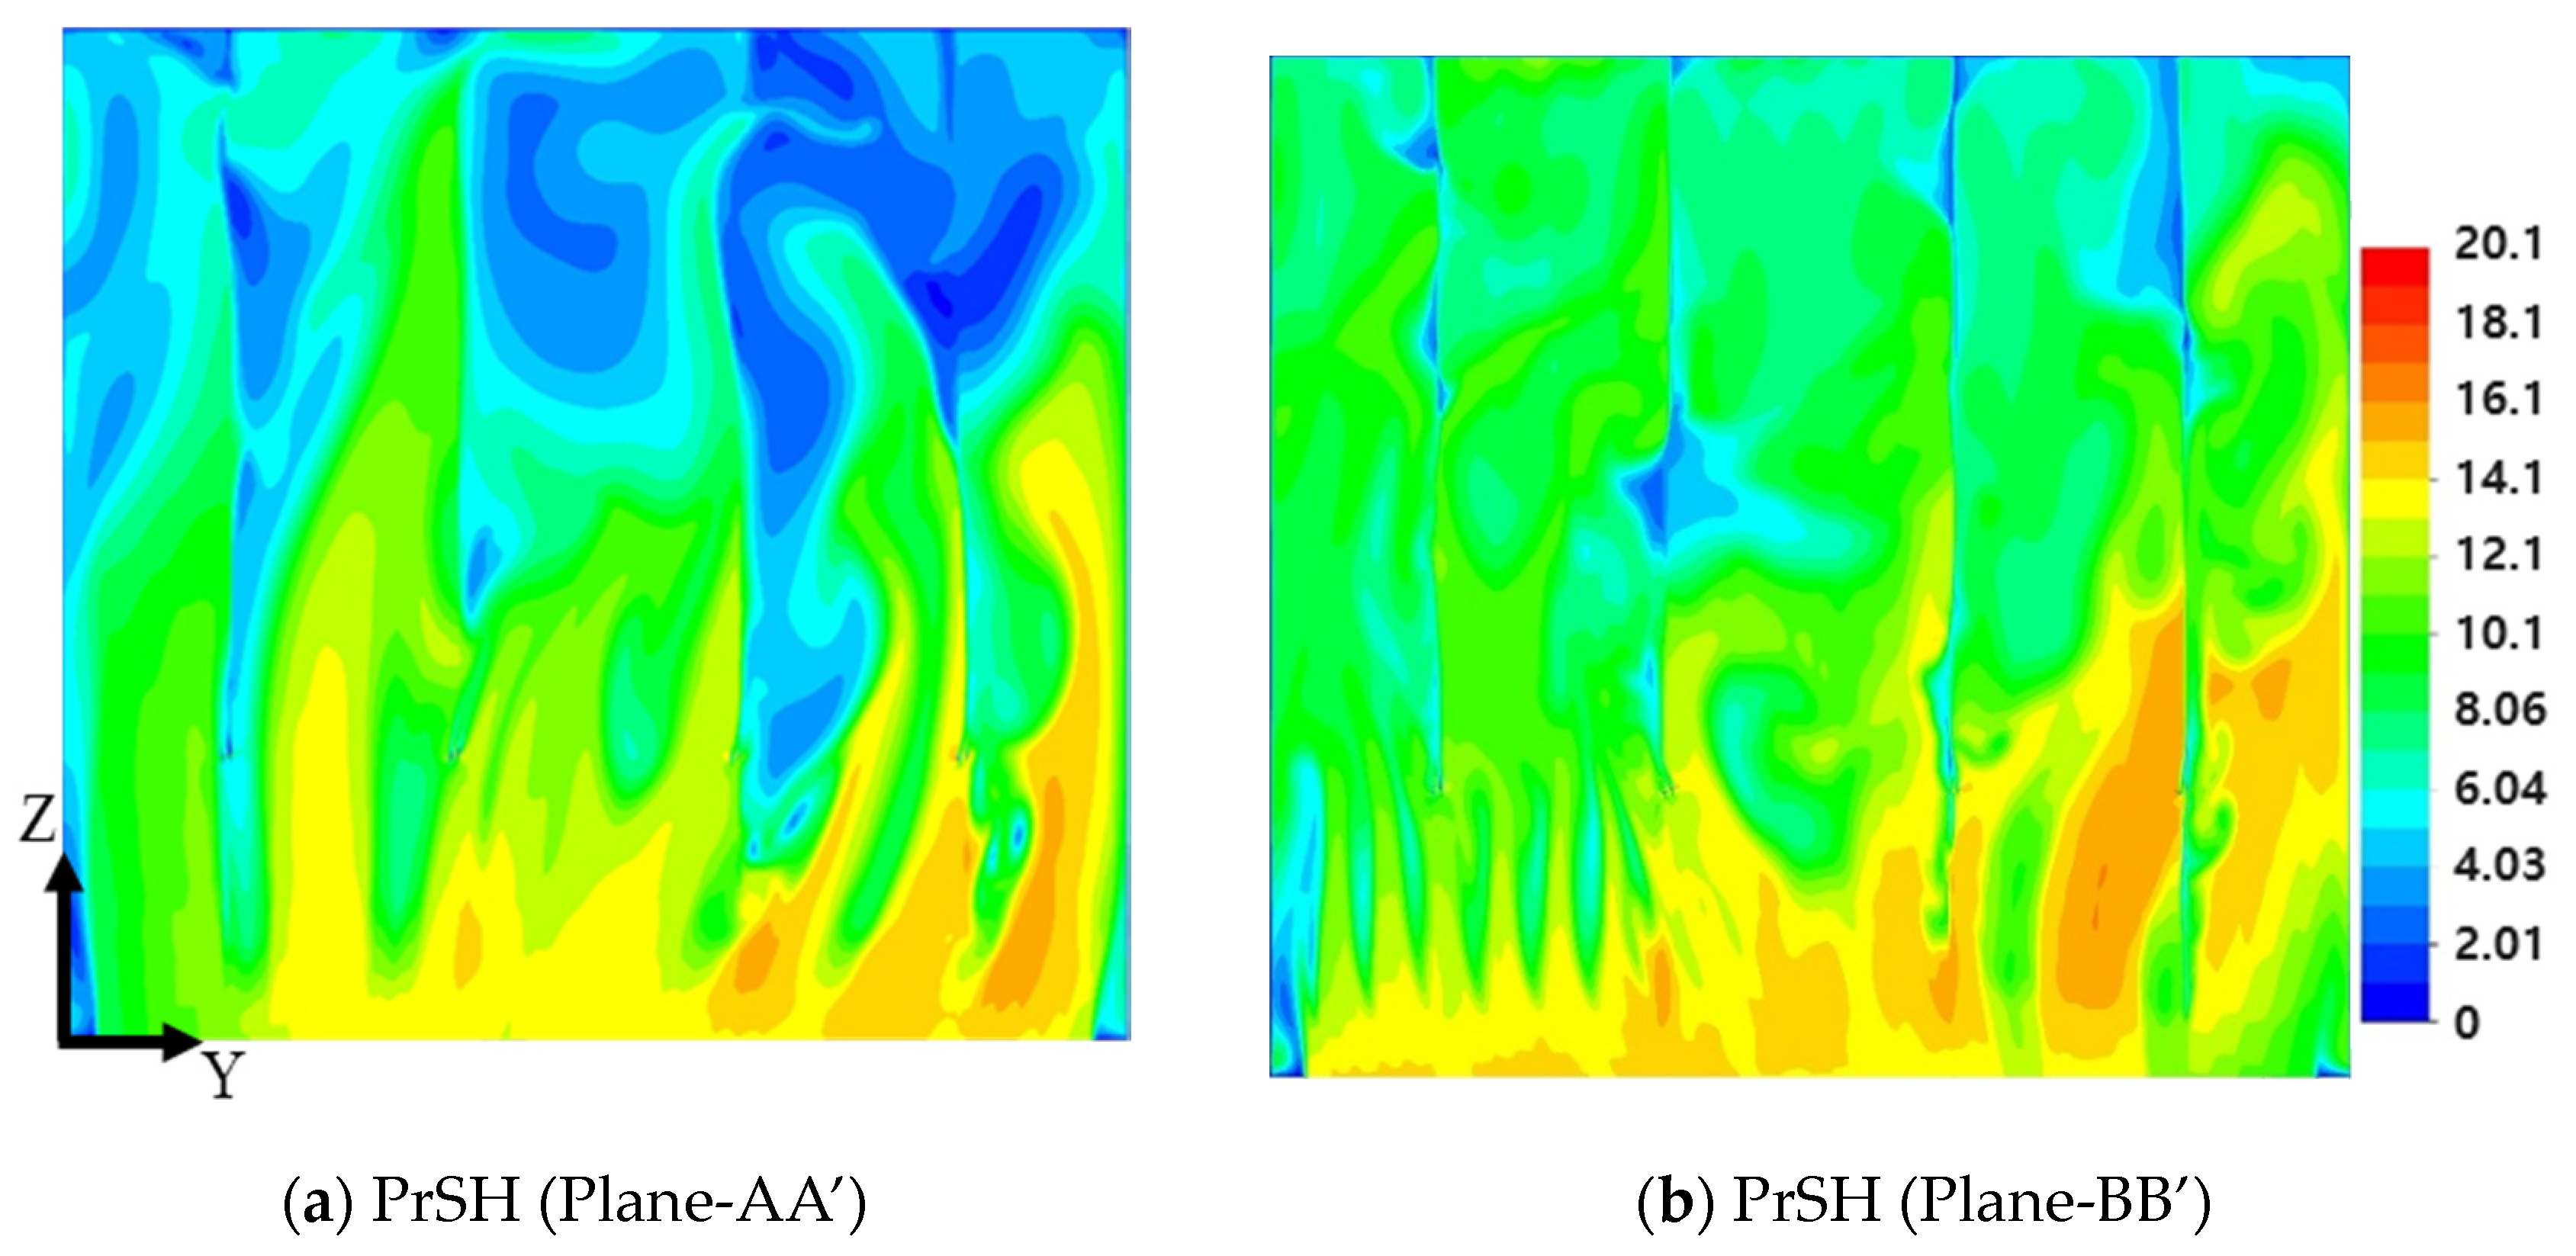
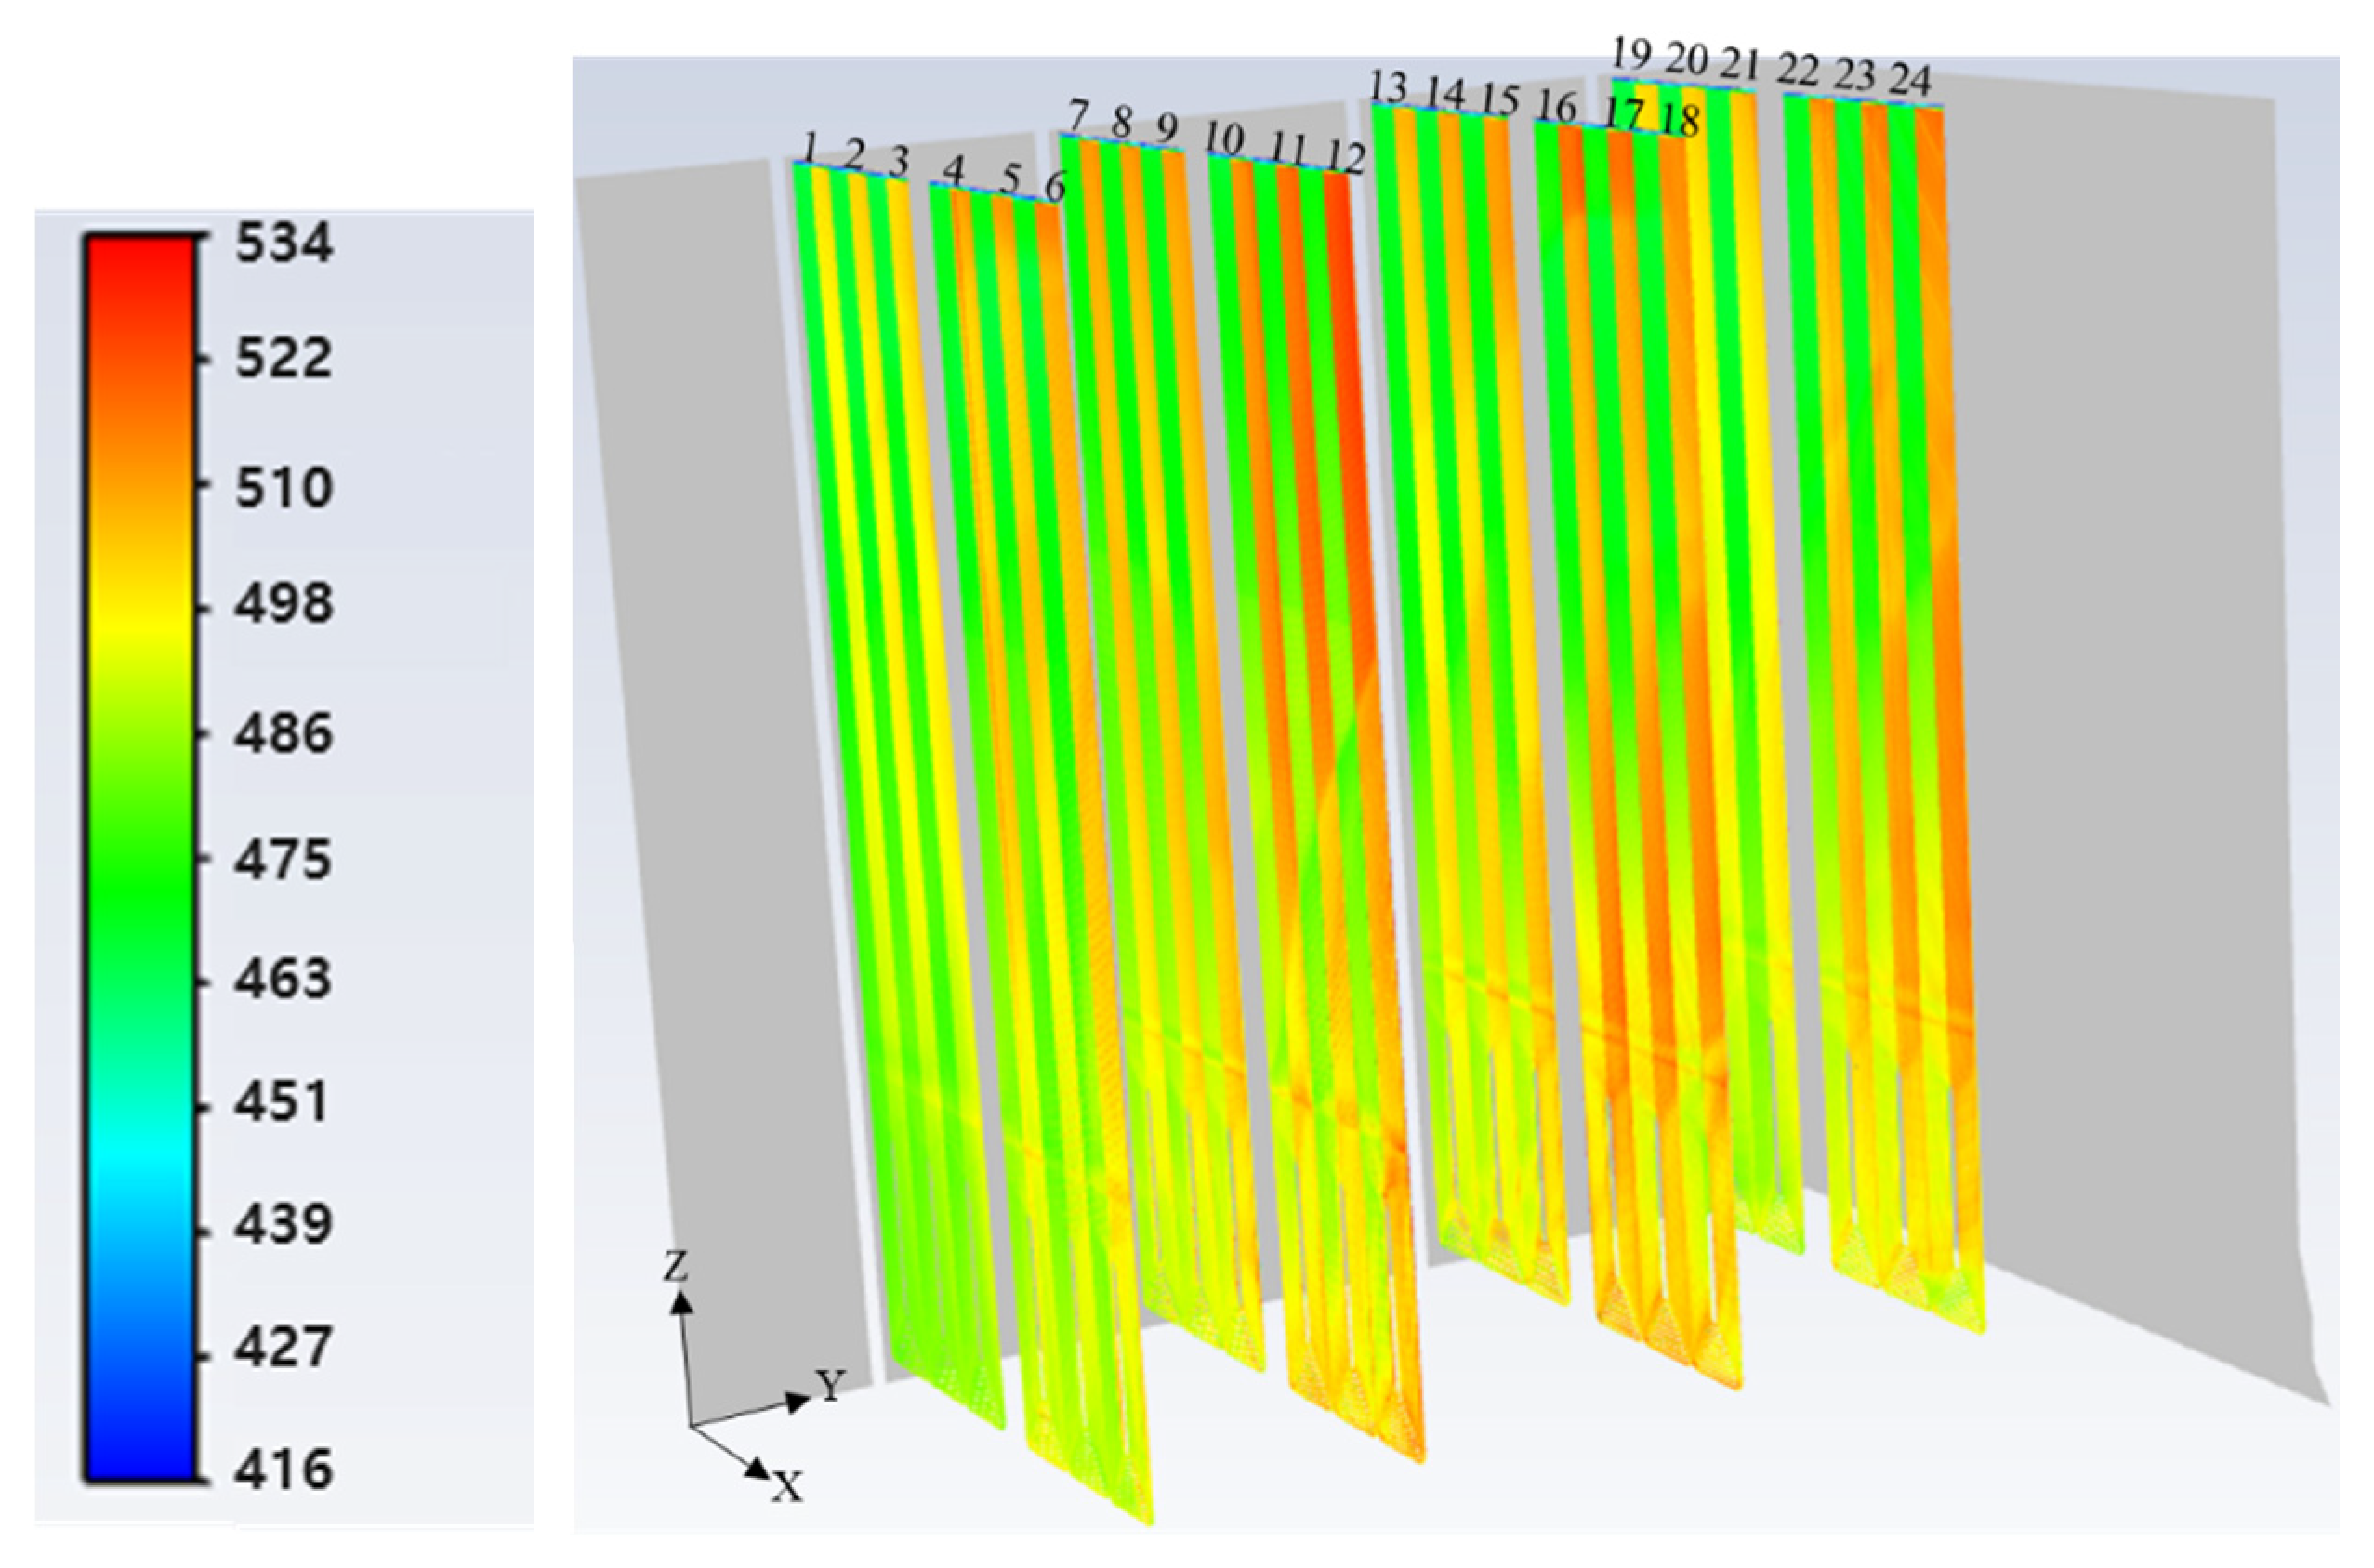
3.2. Hot Gas Flow Distribution in PrSH

The flow of hot gases in a boiler exhibits considerable variation across different heating zones. In the primary superheater (PrSH), the tubes are directly exposed to combustion gases and flames, which then divert and flow into the platen superheater (PlSH). This redirection results in significant changes in the temperature and velocity of the hot gas. The tubes in PrSH are notably impacted by radiant heat transfer compared to other heating zones.
Conversely, in the PlSH, reheater (RH), and final superheater (FSH) zones, the hot gas stream flows with acceleration in a straight line. Moreover, these zones are not directly exposed to the combustion flame, leading to lower radiant heat transfer compared to PrSH. Consequently, this paper places emphasis on analyzing the hot gas flow and temperature distribution in the PrSH.
To investigate the hot flow around the PrSH, the temperature contour at four different locations (Y = −5.1, −1.7, 1.7, 5.1) is considered to show the temperature distribution, as shown in Figure 11. As all the boiler tubes were modeled and simulated, the complex flow temperature distribution was observed, induced by the interaction between flow and tube. This flow temperature distribution cannot be seen when analyzing through porous media because porous media calculations remove pressure and heat from the flow simply.
In that, the temperature contours in Figure 11a,d are closer to the front and back side walls of the furnace, and the temperature contours in Figure 11b,c are at the center of the hot gas flow domain. The hot gas has a higher temperature at the center and a lower temperature at the outer of the inlet domain, as shown in Figure 6b. Therefore, the tube walls at the center have exposed high-temperature gas at Y = −1.7, 1.7 m in Figure 11b,c. The tube walls at the outer side near the furnace walls have exposed low-temperature gas at Y = −5.1, 5.1 m in Figure 11a,d. The designed hot gas temperature of the furnace exit was 1058.9 °C. In Figure 11, the maximum temperatures are in the ranges of 935.9–1026.9 °C. Compared with the designed furnace exit temperature, the simulation results agreed.
When analyzing the localized fluid dynamics, it can be observed that the high gas temperature region represents the main flow of combustion gases. This is a result that cannot be clearly analyzed in the conventional porous media format. The combustion gases at high temperatures flow along the furnace’s flow path, exposing PrSH and PlSH to the rising combustion gases. After passing PlSH, the flow changes direction toward the RH, causing a significant variation in the distribution of combustion gas temperatures at each tube location within PrSH.
In the case of the leading tubes in PrSH, relatively low-temperature combustion gases pass through, while the second bundle of PrSH experiences the highest combustion gas temperatures as the main flow passes through. The high-temperature combustion gas region passing through PrSH does not reach the upper wall of the furnace. As a result, the upper areas of PrSH tubes exhibit relatively low combustion gas temperatures.
On the other hand, the combustion gases passing through PlSH reach the upper wall of the furnace, leading to very high and relatively uniform temperatures near the PlSH tubes.
To analyze how hot gas flow velocity becomes affected by considering the PrSH tubes in the simulation, the velocity and temperature contours at the two different locations, such as middle (after bundle number 3, Plane-AA’) and exit of PrSH (after bundle number 6, Plane-BB’), as shown in Figure 1b are taken to show the velocity and temperature characteristics as in Figure 12 and Figure 13.
The distinctive characteristics of the high combustion gas temperature distribution, as described earlier, are more clearly evident in Figure 12 and Figure 13. The temperature and velocity of the flow passing through the tube bundles exhibit non-uniformity. In contrast to previous studies that use porous media and yield uniform velocity and temperature distributions as average values, this study provides important results that distinguish it from previous research. Due to the tubes’ consistent spacing, the temperature and velocity change markedly in a stepwise fashion at regular intervals. Notably, the velocity of the main flow rises from the bottom, reaching higher levels in the tube bundles at the rear than in those at the front. Consequently, there is a significant difference in the flow velocity near the upper wall, and some areas of the front tube bundles exhibit very low velocity values. This can be attributed to the hindrance of flow ascent due to the tight installation characteristics of the heat exchange tubes. Consequently, it can be inferred that in some regions, external combustion gases may not reach, hindering smooth heat exchange. In contrast to assumptions made in previous studies utilizing porous media, where uniform heat exchange occurs in all areas, the results of this study confirm otherwise.
Furthermore, as the combustion gas bends in the direction of PlSH, accelerating the flow, the convective heat transfer coefficient on the tube walls may increase. These flow characteristics indicate that higher heat exchange occurs in the rear heat exchange tube area of PrSH than in the front heat exchange tube area.
The temperature distribution in Figure 13 also confirms the characteristics of external combustion gases in each tube, as described earlier. The combustion gas temperature in the front heat exchange area of PrSH is relatively lower and exhibits a more uneven nature compared to the combustion gas temperature in the rear heat exchange area. Particularly, the upper region of the front heat exchange area reveals a significant temperature zone, more than 400 degrees lower than the central maximum temperature, due to insufficient ascent of the combustion gases.
When comparing the temperature distribution at the exit of the first heat exchange zone of PrSH with that of the second heat exchange zone, it is evident that the combustion gases rising from the lower inlet reach the upper regions in the second heat exchange zone. Then, it can be observed that the combustion gas flow, exhibiting a relatively uniform temperature distribution, enters the inlet flow of the PlSH. Thus, due to the distinct characteristics of external flow in each heat exchange zone, the maximum temperature and areas susceptible to damage for each tube vary. Therefore, to develop a digital twin model and analyze failure characteristics, such as in boilers, it is necessary to conduct individual heat exchange pipe simulations for accurate interpretation.

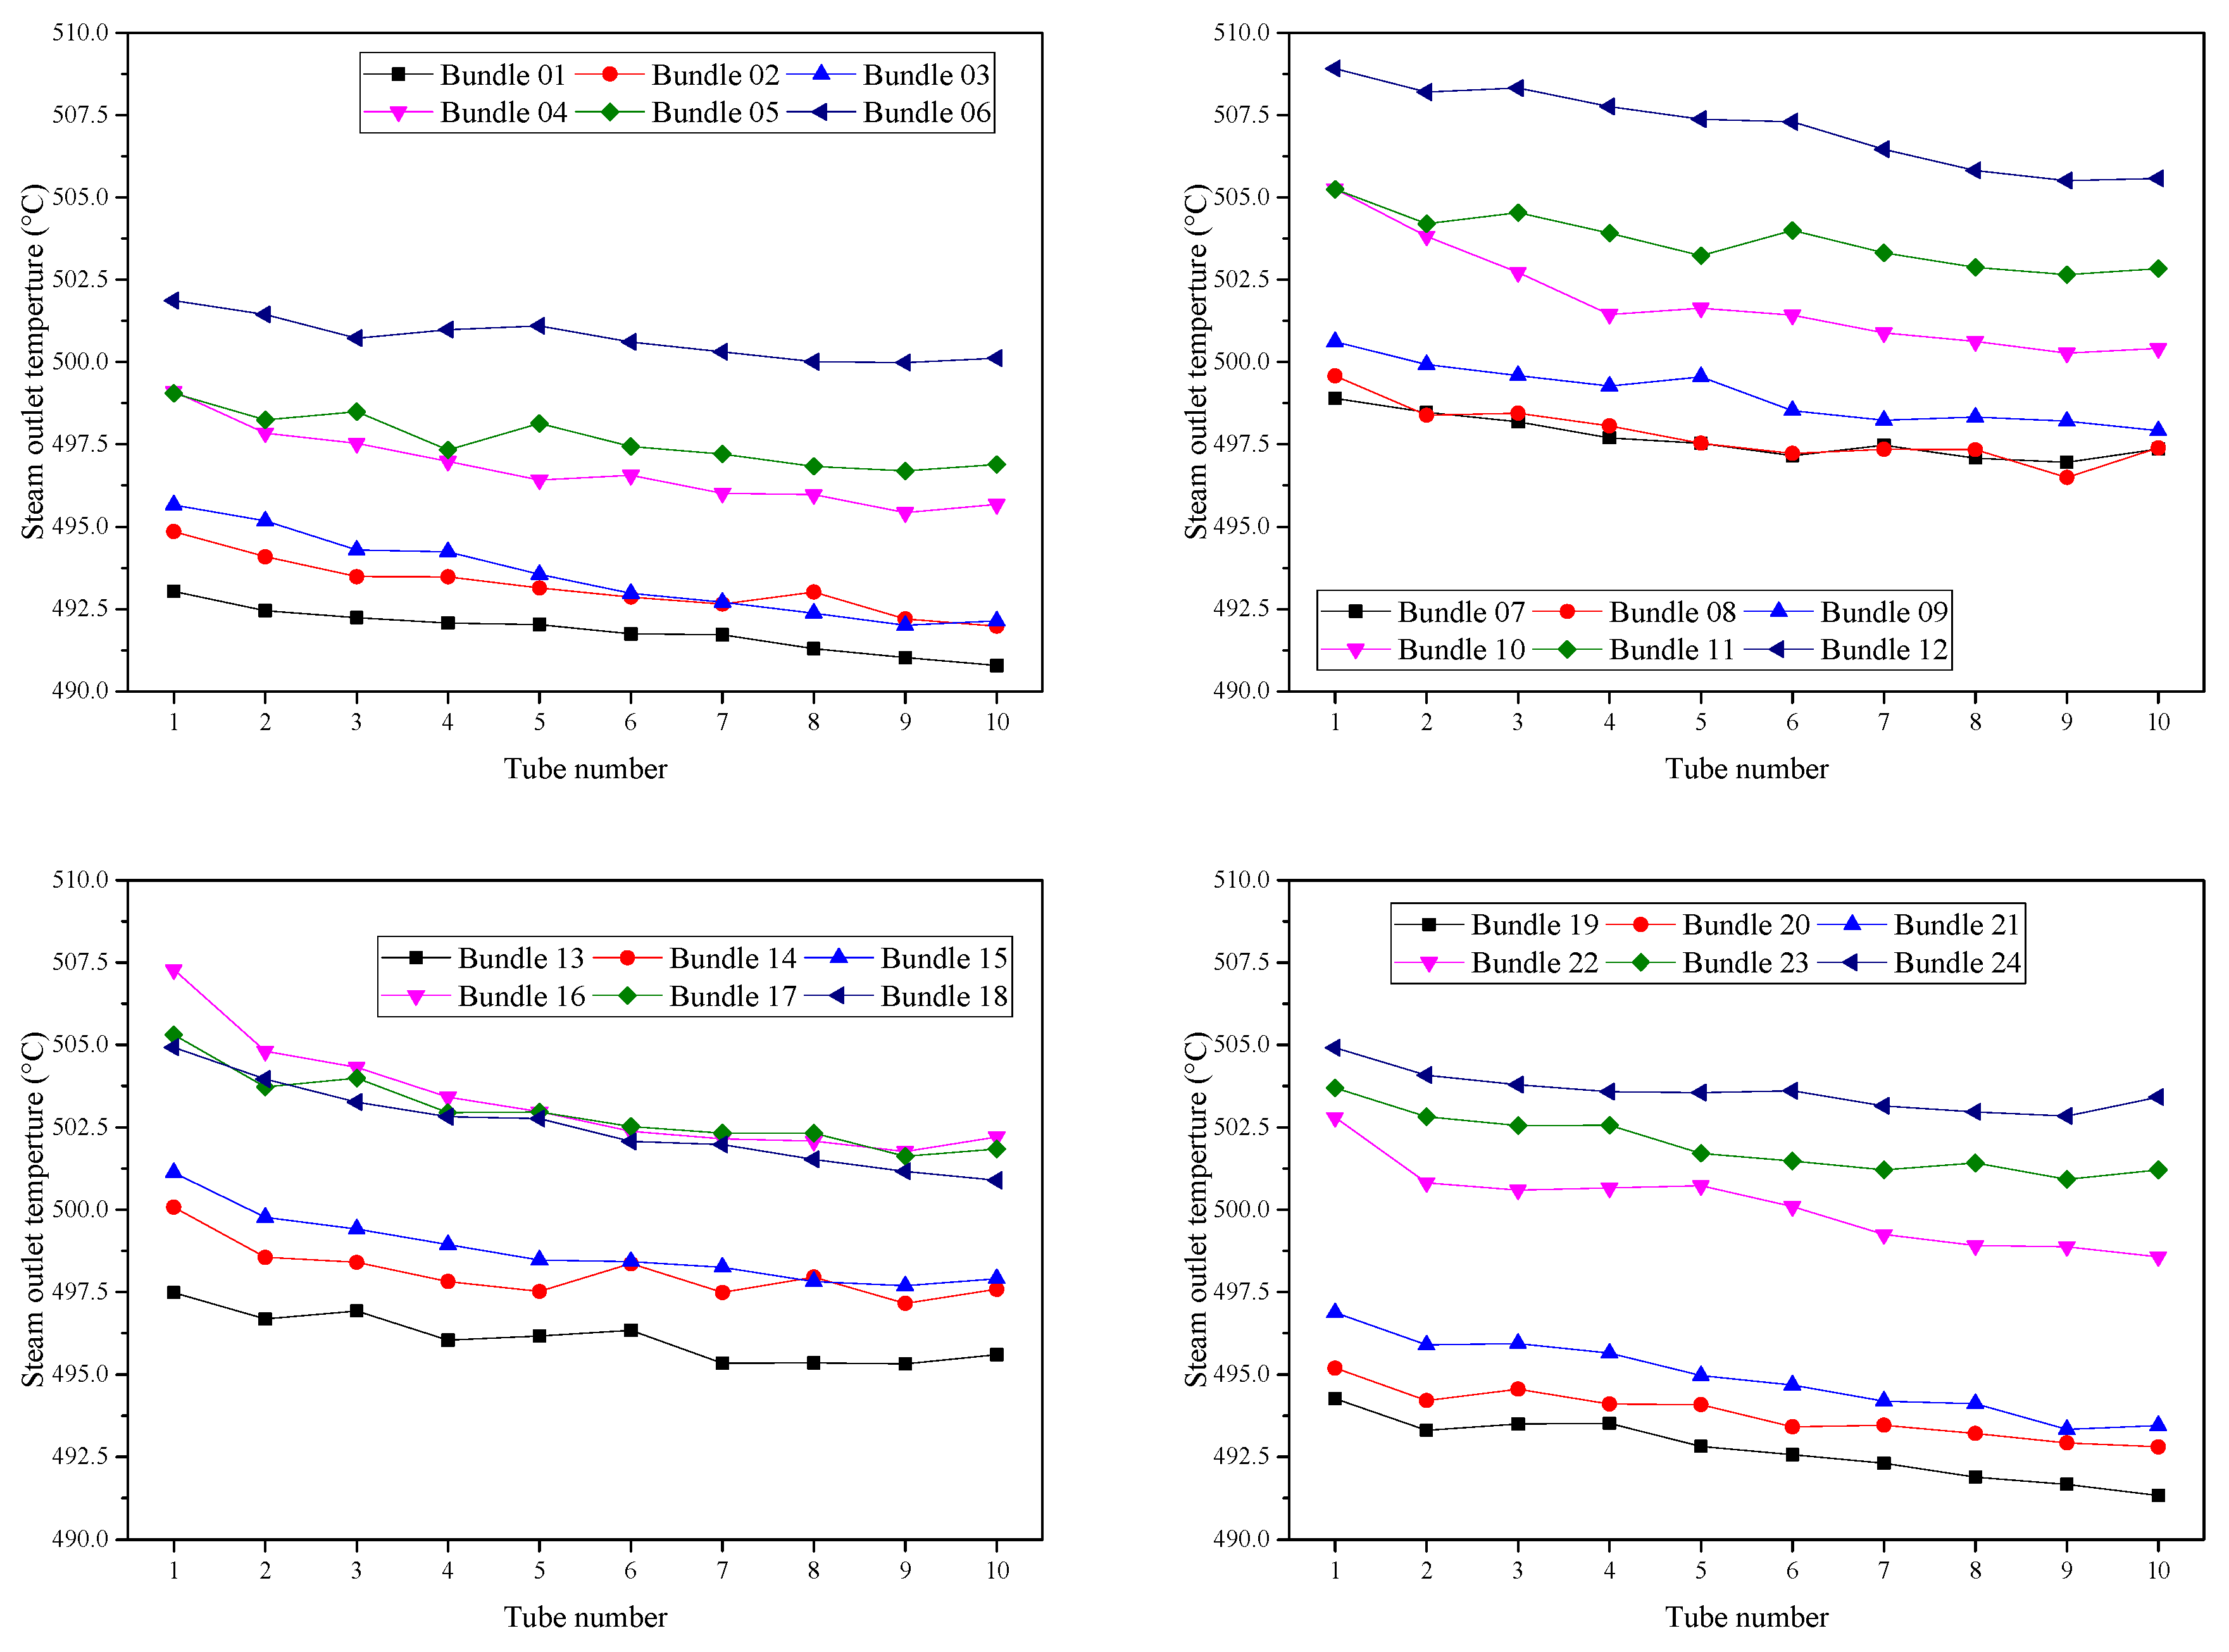
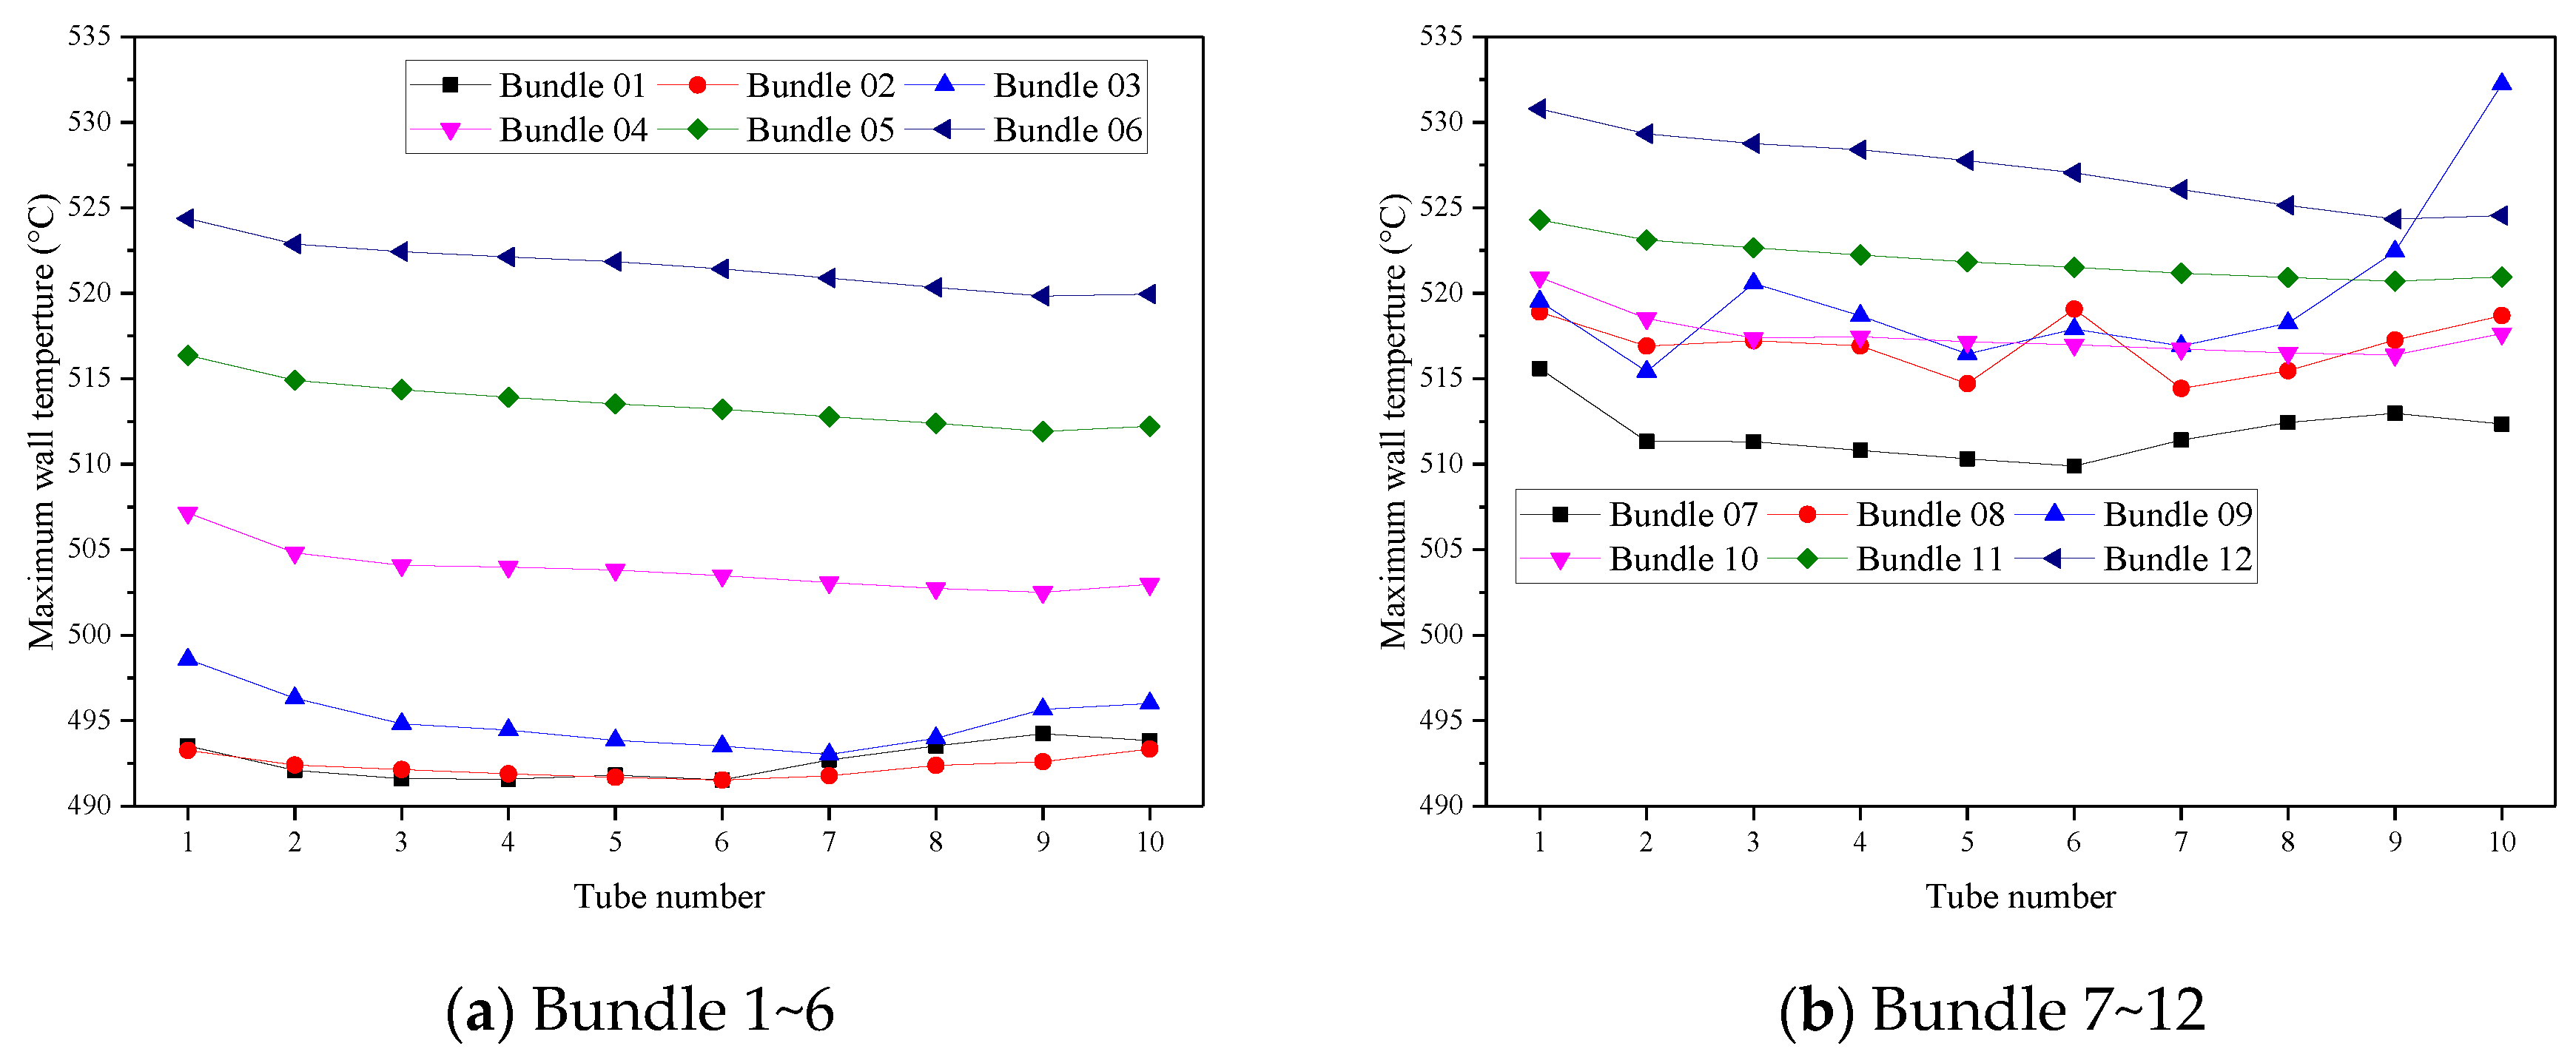
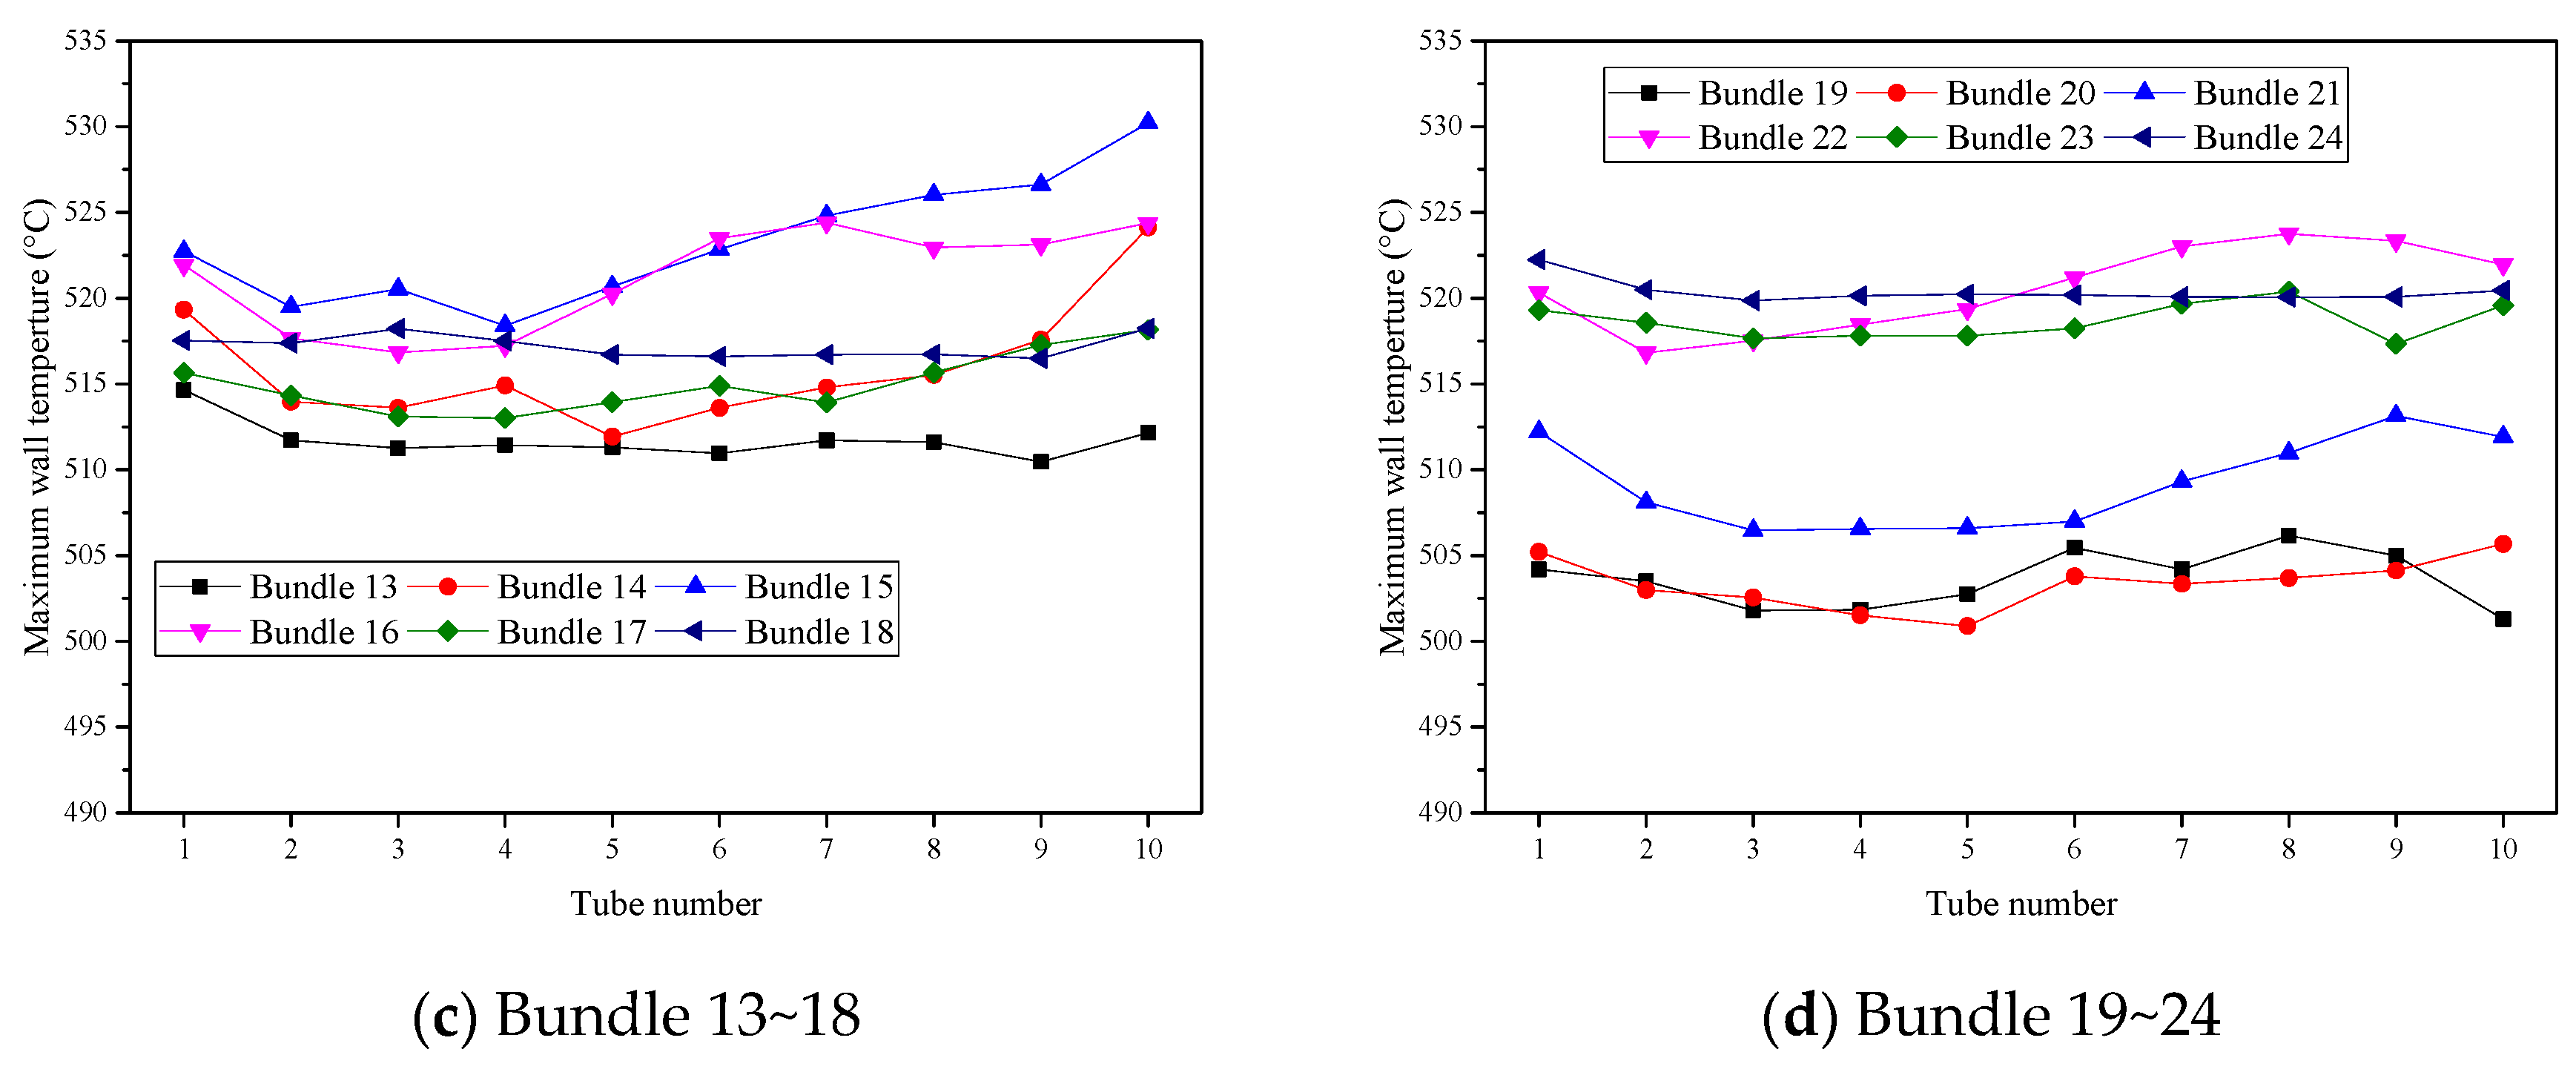
3.3. Wall Temperature and Steam Temperature of PrSH

The average steam outlet temperature ( T s , P r S H ) of all tubes in PrSH bundles is shown in Figure 14. It is observed that the steam outlet temperature ranges from 490 to 509 °C. As shown in Figure 2, the tube numbers from 1 to 10 are located from outer to inner in each bundle of PrSH. The T s , P r S H profile of each bundle in PrSH decreases from the outer to the inner tube in Figure 14. The reason for this is that the hot gas contact with the outer tube is much higher than the inner tube. In addition, the T s , P r S H of outer Bundles 1~3, 7, 8, 13, 19~21 is lower than that of remaining tubes in other bundles of PrSH. The reason is that the higher temperature hot gases are located at the center of the furnace outlet, which has more heat transfer from the hot gas to the steam tube of the center bundle than the outer bundle of PrSH. Through this CFD simulation, the hot flow characteristics around the PrSH have been shown with numerical data and contours, which can help in understanding the insight of flow physics and designing a high-efficiency thermal boiler.
Figure 15 illustrates the temperature on the external wall of the heat exchange tubes within PrSH. In traditional boiler heat exchanger analyses, assuming a porous media interpretation, uniform heat exchange and equal temperatures across all heat exchange tubes are often assumed. However, in studies such as this, where modeling and analysis are performed for each tube individually, it is confirmed that the flow field’s temperature is not uniform, and as a result, the temperatures of the tubes vary significantly. As previously explained, the combustion gases entering from the bottom of the furnace rise in the PrSH area, rotating towards the rear PlSH side, reflecting the characteristics of this flow field. Therefore, the surface temperature of the tubes in the first PrSH heat exchange area is relatively lower than that of the second PrSH heat exchange area. Additionally, as the main combustion gas flows toward the center of the furnace, the surface temperature of the tubes near the furnace wall is lower than those located in the center. Consequently, tube temperatures are primarily influenced by the temperature of the main flow.
However, it can be observed that the tube temperatures increase uniformly from the inlet to the outlet of the tubes. The inlet temperatures of most tubes are around 475 °C, while near the outlet, a temperature distribution ranging from 492 to 525 °C is observed. The reason for the increasing tube temperatures toward the outlet is attributed to the heat exchange between the internal steam and external combustion gas. As the temperature of the steam rises due to this heat exchange from the inlet to the outlet, the maximum tube temperature is observed in the outlet area. Thus, individual tube temperatures vary not only due to the temperature of external combustion gas but also due to the influence of the internal steam temperature. Therefore, conducting comprehensive analyses that include external combustion gas flow, complex heat transfer, and internal steam flow, as performed in this study, is essential for accurately predicting tube temperatures.
The maximum wall temperature of all tubes of PrSH is shown in Figure 16. In Figure 16a, the maximum wall temperature ( T w , m a x ) is slightly decreased as seen in the tube number from 1 to 10. And the T w , m a x range is 492~525 °C. The wall temperature of the tube in Bundles 1~3 is lower than the wall temperature of the tube in Bundles 4~6. The reason for this is that Bundle 1~3 is close to the left front side and Bundle 4~6 is far away from the left side, so the hot gas contact with Bundle 4~6 is higher, as shown in Figure 11a. The T w , m a x range of Bundle 7~18 in Figure 16b,c is 510~532 °C, which is higher than others. The reason for this is because of the high-temperature hot gases from the furnace outlet that flow around Bundles 9~12 and 16~18, as shown in Figure 11b,c. Similar to Bundle 1~6, the T w , m a x range of Bundle 19~24 is slightly decreased and is 501~523 °C, which is close to the left back side wall.
In Figure 15, it can be observed that the maximum temperature of the pipes varies depending on the tube’s position within each bundle. Generally, Tube 1, being the outermost tube in the bundle with the longest length, exhibits a higher tube temperature compared to other tubes within the same bundle. This is because Tube 1 has a larger heat exchange area, causing the steam temperature to rise, resulting in a higher tube temperature near the outlet. On the other hand, Tube 10, being the innermost tube with a shorter length, shows a relatively lower maximum tube temperature due to the influence of the downstream flow from the tubes located in the front.
The typical temperature distribution of each tube from Tube 1 to Tube 6 is well represented in Bundles 1 to 6. However, Bundles 9, 14–17 show a deviation where the temperature is higher at Tube 1 but increases from the middle tubes (5–6) towards Tube 10, reaching the highest temperature. This phenomenon is explained by the fact that the maximum tube temperature is not necessarily observed at the exit of the tube where the internal steam temperature is high, but rather occurs in the middle section of the tube due to the flow of external high-temperature combustion gas. As shown in Figure 14, Bundles 14–17 confirm the occurrence of the maximum tube temperature in the middle region of the tubes.
As seen in Figure 11, the flow of high-temperature combustion gas does not rise to the ceiling of the furnace but bends in the middle, flowing as backflow. Consequently, tubes that are more influenced by the flow of external combustion gas show the maximum temperature not at the tube exit but in the middle of the tube. The locations where the highest temperature is observed are deemed thermally vulnerable, particularly near the weld points of the tubes, as indicated in Figure 2. Although all tubes are currently welded at the same points, it is suggested, based on these findings, that the weld points for each tube should be adjusted differently according to the tube’s maximum temperature.
Analyzing the temperature of all tubes in the boiler through comprehensive heat transfer analysis reveals variations depending on the location. These valuable data, not visible when using traditional porous media interpretation, are considered significant for the design and failure analysis of boiler tubes. Especially, the confirmation that the tube’s maximum temperature does not necessarily occur near the tube exit, as commonly known, but varies according to the flow of combustion gas, suggests that adjusting the weld points of tubes according to the gas flow can enhance tube integrity and reduce boiler maintenance costs. Additionally, for tubes near the wall and outer edges showing relatively lower heat exchange and tube temperatures, adjusting the tube length in design and installation for efficiency improvement is suggested. The comprehensive modeling and analysis of all tubes in the boiler, demanding high computational capability, have provided localized data not previously available, which are expected to be widely utilized as fundamental data for future boiler design.

4. Conclusions

In order to accurately predict the temperature of the superheater tubes within the pulverized coal-fired boiler, all tubes were modeled and a complex heat transfer analysis was performed. To calculate the temperature of the superheater tubes, conjugate heat transfer analysis was performed, including convective heat transfer by combustion gas, radiative heat transfer by combustion gas, and conduction heat transfer within the tube. The temperature and heat exchange of individual tubes, which could not be derived using existing porous media techniques, were calculated in this study. As a result of the analysis, it can be seen that the combustion gas flow is not uniform within the boiler, and because of this, the temperature of the tube is different depending on the position of the tube. The tubes on the outside of the boiler have a deviation of about 20 degrees or more compared to the tubes located in the center due to the influence of the boiler’s outer wall and the passage of relatively low-temperature combustion gases. Since the tubes in the center are directly exposed to the combustion gas flame, not only is the radiative heat transfer high, but the temperature is also high as the main flow of high combustion gases passes through. As a result, it was confirmed that the highest temperature of the tube occurred in the center of the tube, not in the outlet area of the boiler tube, where the temperature of the steam in the tube was high. In this way, the tubes in the boiler show high temperatures in different parts, and accordingly, the damaged area is expected to be different depending on the installation location of the boiler tube. In order to increase the efficiency of coal-fired boilers and reduce maintenance costs, design, and maintenance must be performed using the local temperature information of individual tubes presented in this study.

Author Contributions

Conceptualization, J.S.P.; Methodology, K.R. and J.S.P.; Investigation, K.R and J.S.P.; Writing—original draft, K.R and J.S.P. All authors have read and agreed to the published version of the manuscript.

Funding

The research was supported by a grant from the 2023 program for visiting professors overseas in [Korea National University of Transportation].

Data Availability Statement

Dataset available on request from the authors.

Conflicts of Interest

The authors declare no conflict of interest.

References

  1. Cai, Y.; Tay, K.; Zheng, Z.; Yang, W.; Wang, H.; Zeng, G.; Li, Z.; Siah, K.B.; Subbaiah, P. Modeling of ash formation and deposition processes in coal and biomass fired boilers: A comprehensive review. Appl. Energy 2018, 230, 1447–1544. [Google Scholar] [CrossRef]
  2. Sankar, G.; Kumar, D.S.; Balasubramanian, K.R. Computational modeling of pulverized coal fired boilers–A review on the current position. Fuel 2019, 236, 643–665. [Google Scholar] [CrossRef]
  3. Świeboda, T.; Krzyżyńska, R.; Bryszewska-Mazurek, A.; Mazurek, W.; Czapliński, T.; Przygoda, A. Advanced approach to modeling of pulverized coal boilers for SNCR process optimization-review and recommendations. Int. J. Thermofluids 2020, 7, 100051. [Google Scholar] [CrossRef]
  4. Modliński, N.; Szczepanek, K.; Nabagło, D.; Madejski, P.; Modliński, Z. Mathematical procedure for predicting tube metal temperature in the second stage reheater of the operating flexibly steam boiler. Appl. Therm. Eng. 2019, 146, 854–865. [Google Scholar] [CrossRef]
  5. Park, H.Y.; Faulkner, M.; Turrell, M.D.; Stopford, P.J.; Kang, D.S. Coupled fluid dynamics and whole plant simulation of coal combustion in a tangentially-fired boiler. Fuel 2010, 89, 2001–2010. [Google Scholar] [CrossRef]
  6. Chen, T.; Zhang, Y.J.; Liao, M.R.; Wang, W.Z. Coupled modeling of combustion and hydrodynamics for a coal-fired supercritical boiler. Fuel 2019, 240, 49–56. [Google Scholar] [CrossRef]
  7. Schuhbauer, C.; Angerer, M.; Spliethoff, H.; Kluger, F.; Tschaffon, H. Coupled simulation of a tangentially hard coal fired 700 °C boiler. Fuel 2014, 122, 149–163. [Google Scholar] [CrossRef]
  8. Ranade, V.; Gupta, D. Computational Modeling of Pulverized Coal Fired Boilers, 1st ed.; Taylor & Francis: Boca Raton, FL, USA, 2015. [Google Scholar]
  9. Liu, Y.; Fan, W.; Li, Y. Numerical investigation of air-staged combustion emphasizing char gasification and gas temperature deviation in a large-scale, tangentially fired pulverized-coal boiler. Appl. Energy 2016, 177, 323–334. [Google Scholar] [CrossRef]
  10. Park, H.Y.; Baek, S.H.; Kim, Y.J.; Kim, T.H.; Kang, D.S.; Kim, D.W. Numerical and experimental investigations on the gas temperature deviation in a large scale, advanced low NOx, tangentially fired pulverized coal boiler. Fuel 2013, 104, 641–646. [Google Scholar] [CrossRef]
  11. Choi, C.R.; Kim, C.N. Numerical investigation on the flow, combustion and NOx emission characteristics in a 500 MWe tangentially fired pulverized-coal boiler. Fuel 2009, 88, 1720–1731. [Google Scholar] [CrossRef]
  12. Diez, L.I.; Cortes, C.; Pallares, J. Numerical investigation of NOx emissions from a tangentially-fired utility boiler under conventional and over fire air operation. Fuel 2008, 87, 1259–1269. [Google Scholar] [CrossRef]
  13. Viswanathan, R.; Bakker, W. Materials for ultrasupercritical coal power plants—Boiler materials: Part 1. J. Mater. Eng. Perform. 2001, 10, 81–95. [Google Scholar] [CrossRef]
  14. French, D. Metallurgical Failures in Fossil Fired Boilers; John Wiley & Sons: Hoboken, NJ, USA, 1993. [Google Scholar]
  15. Laubscher, R.; Rousseau, P. Coupled simulation and validation of a utility-scale pulverized coal-fired boiler radiant final-stage superheater. Therm. Sci. Eng. Prog. 2020, 18, 100512. [Google Scholar] [CrossRef]
  16. Modliński, N.; Madejski, P.; Janda, T.; Szczepanek, K.; Kordylewski, W. A validation of computational fluid dynamics temperature distribution prediction in a pulverized coal boiler with acoustic temperature measurement. Energy 2015, 92, 77–86. [Google Scholar] [CrossRef]
  17. Hottel, H.C.; Sarofim, A.F. Radiative Transfer; McGraw-Hill: New York, NY, USA, 1967. [Google Scholar]
  18. Smith, T.F.; Shen, Z.F.; Friedman, J.N. Evaluation of coefficients for the weighted sum of gray gases model. ASME J. Heat Transfer. 1982, 104, 602–608. [Google Scholar] [CrossRef]
  19. Laubscher, R.; Rousseau, P. CFD study of pulverized coal-fired boiler evaporator and radiant superheaters at varying loads. Appl. Therm. Eng. 2019, 160, 114057. [Google Scholar] [CrossRef]
  20. Vuthaluru, R.; Vuthaluru, H.B. Modelling of a wall fired furnace for different operating conditions using FLUENT. Fuel Process. Technol. 2006, 87, 633–639. [Google Scholar] [CrossRef]
  21. Liu, H.; Liu, Y.; Yi, G.; Nie, L.; Che, D. Effects of air staging conditions on the combustion and NOx emission characteristics in a 600 MW wall fired utility boiler using lean coal. Energy Fuels 2013, 27, 5831–5840. [Google Scholar] [CrossRef]
  22. Taler, D.; Taler, J. Simplified analysis of radiation heat exchange in boiler superheaters. Heat Transf. Eng. 2009, 30, 661–669. [Google Scholar] [CrossRef]
  23. ANSYS, Inc. Fluent 2019 R3 Theory Guide; ANSYS Inc.: Canonsburg, PA, USA, 2019. [Google Scholar]
  24. Gandhi, M.B.; Vuthaluru, R.; Vuthaluru, H.; French, D.; Shah, K. CFD based prediction of erosion rate in large scale wall-fired boiler. Appl. Therm. Eng. 2012, 42, 90–100. [Google Scholar] [CrossRef]
  25. Chen, K.; Liu, X.; Qin, Y. Numerical study on the influence of platen super-heater on combustion characteristics in a 600 MW tangentially fired pulverized-coal boiler. Therm. Sci. 2021, 25, 833–843. [Google Scholar] [CrossRef]
  26. Maakala, V.; Järvinen, M.; Vuorinen, V. Computational fluid dynamics modeling and experimental validation of heat transfer and fluid flow in the recovery boiler superheater region. Appl. Therm. Eng. 2018, 139, 222–238. [Google Scholar] [CrossRef]
  27. Wang, H.; Zhang, C.; Liu, X. Heat transfer calculation methods in three-dimensional CFD model for pulverized coal-fired boilers. Appl. Therm. Eng. 2020, 166, 114633. [Google Scholar] [CrossRef]
  28. Graeser, P.; Schiemann, M. Investigations on the emissivity of burning coal char particles: Influence of particle temperature and composition of reaction atmosphere. Fuel 2020, 263, 116714. [Google Scholar] [CrossRef]
Figure 1. Schematic sketch of the outer furnace wall (a) and inner sections (b) of a pulverized coal boiler.
Energies 17 01161 g001
Figure 2. A detailed sketch to show the tube arrangement in each bundle of all superheaters.
Energies 17 01161 g002aEnergies 17 01161 g002b
Figure 3. Thermophysical properties of steel grade with the variable temperature.
Energies 17 01161 g003
Figure 4. Thermophysical properties of steam with the variable temperature for a given pressure.
Energies 17 01161 g004
Figure 5. Schematic of superheater tube wall heat transfer process without ash deposit and scale formation.
Energies 17 01161 g005
Figure 6. Temperature and velocity contour at the furnace gas exit given as inlet conditions in the present simulation.
Energies 17 01161 g006aEnergies 17 01161 g006b
Figure 7. Three different numbers of meshes on a tube of FSH.
Energies 17 01161 g007
Figure 8. Outlet velocity contour based on three different meshes.
Energies 17 01161 g008
Figure 9. Outlet velocity profile of three different grids along the radial direction.
Energies 17 01161 g009
Figure 10. Comparison of averaged steam outlet temperatures of the superheaters from simulations based on different wall emissivity values against design data.
Energies 17 01161 g010
Figure 11. Hot gas temperature (°C) contour of four locations at Y = −5.1, −1.7, 1.7, 5.1 m in XZ-plane.
Energies 17 01161 g011aEnergies 17 01161 g011b
Figure 12. Velocity magnitude (m/s) contour at middle and exit of PrSH on YZ-plane.
Energies 17 01161 g012
Figure 13. Temperature (°C) of hot gas flow at middle and exit of PrSH on YZ-plane.
Energies 17 01161 g013
Figure 14. Steam outlet temperature of all tubes of PrSH.
Energies 17 01161 g014
Figure 15. Wall temperature (°C) of PrSH.
Energies 17 01161 g015
Figure 16. Maximum wall temperature of the tube in the bundle of the PrSH.
Energies 17 01161 g016aEnergies 17 01161 g016b
Table 1. A summary of numerical methods in the literature studies.
Turbulence ModelRadiation ModelEmissivityReferences
Flue GasWall
Realizable k-epsilonDiscrete ordinates0.9 in WSGGM0.85[15]
Realizable k-epsilonDiscrete ordinatesNot considered0.5, 0.7, 0.7[16]
Realizable k-epsilonDiscrete ordinates0.9 in WSGGM-[19]
Realizable k-epsilonP-1Not considered0.8[20]
Standard k-epsilonP-1WSGGM0.8[21]
Not mentionedP-1, DTRM, DO0.2855, 0.1195, 0.2950.8[22]
Standard k-epsilonP-1WSGGMNot mentioned[24]
Table 2. Material type and sectional length of each tube in the superheater.
Superheater Tube No.Inlet to Outlet
PrSH Section-1Section-2Section-3Section-4
Material type1~6A213-T12A213-T23A213-T91A213-T23
Length, m4.47.82.911.9
Material type7~10A213-T12A213-T23--
Length, m4.421.3--
PlSHMaterial type1A213-T91SUPER304HA213-T91
Length, m10.36.311.7
Material type2~3A213-T23A213-T91
Length, m10.317.8
Material type4~6A213-T23A213-T91A213-T23
Length, m10.35.311.7
Material type7~9A213-T23
Length, m26.5
Material type10~17A213-T23
Length, m25.5
RHMaterial type1SUPER304H
Length, m23.3
Material type2SUPER304H
Length, m23
Material type3~5SUPER304H
Length, m21.8
Material type6~8A213-T92
Length, m21.4
Material type9A213-T23A213-T92
Length, m2.517.6
Material type10~15A213-T23A213-T92
Length, m4.614.5
FSHMaterial type1~49A213-T91
Length, m30~35
Table 3. Dimensions of each tube in the superheaters.
SuperheaterUnit: mmTube No.Inlet to Outlet
PrSH Section-1Section-2Section-3Section-4
Inner diameter1~635.336.836.836.8
Thickness7.757.07.07.0
Inner diameter7~1035.336.8--
Thickness7.757.0--
PlSHInner diameter13536.635
Thickness7.97.17.9-
Inner diameter2~33535--
Thickness7.97.9--
Inner diameter4~635.93535-
Thickness7.457.97.9-
Inner diameter7~935.9---
Thickness7.45---
Inner diameter10~1735.9---
Thickness7.45---
RHInner diameter160.8---
Thickness4.6---
Inner diameter2~1554.5---
Thickness4.5---
FSHInner diameter1~4929.3---
Thickness6.45---
Table 4. Boundary conditions for superheater tubes.
SuperheaterSteam InletSteam Outlet
P (atm)T (℃) m ˙ (kg/s)
PrSH2764591.8
PlSH2704811.5
RH605170.9
FSH2665140.6
Disclaimer/Publisher’s Note: The statements, opinions and data contained in all publications are solely those of the individual author(s) and contributor(s) and not of MDPI and/or the editor(s). MDPI and/or the editor(s) disclaim responsibility for any injury to people or property resulting from any ideas, methods, instructions or products referred to in the content.

