Abstract
Achieving the necessary energy balance entails the capacity to adapt both power supply and demand, which is known as flexible operation. At present, the Ghana National Commission on Culture depends on a combination of well-coordinated measures designed to uphold the system’s integrity when confronted with abnormal system conditions stemming from significant disturbances within the system. The set of coordinated measures comprises manual (controlled load shedding) and automatic (Special Protection Schemes, Under-Frequency Load Shedding, Over-Frequency Control Scheme, scheme against voltage collapse, etc.) steps to control important system parameters to keep the power system stable and cascading effects leading to major blackouts. Ghana’s system suffers from voltage and frequency degradation as a result of a mismatch of power supply and demand; to maintain grid stability and avoid power outages, a flexible operation is required for real-time supply and demand balancing. SMRs, with their load-following capability, can adjust their output to match the change in demand. This research proposes a microgrid-based design for a high-renewable-energy penetration grid in Ghana with the inclusion of an SMR for voltage stability.
1. Introduction
The flexible operation of a power plant is defined by the ability to adjust power supply to match demand, with the objective of achieving the required energy balance [1]. Ghana’s electric power grid suffers from a great mismatch between supply and demand due to the infiltration of renewable energy sources (RES) and unpredictable generation from hydroelectric power plants that are supported by costly thermal power plants [2]. For this reason, the grid frequency is largely affected and often requires mitigation measures to curtail the fluctuating frequency in the grid. Ghana’s grid code [3] provides a set of coordinated measures, which aim to maintain the integrity of the system.
The code provides the operational procedures to be taken in case of abnormal system conditions resulting from large system disturbances affecting system frequency. These coordinated measures include manual (controlled load shedding) and automatic (Special Protection Schemes, Under-Frequency Load Shedding, Over-Frequency Control Scheme, scheme against voltage collapse, etc.) steps to control important system parameters in order to keep the power system stable and cascading effects leading to major system outages.
Previous studies show that SMRs which are characterized by small electrical capacity modules have the ability to operate flexibly in grids for voltage and frequency stabilization [4]. This is because of their load-following capability whereby they can adjust their output to match the change in demand [5,6]. This study proposes a microgrid-based SMR design for voltage stabilization of a high renewable energy penetration grid in Ghana. Ghana’s grid requirements will be analysed using data from the grid operator and design for the appropriate placement of the SMRs in the grid to mitigate the current challenges. The designed SMR’s electrical operations will evaluate the impact on the grid will be demonstrated in this study. The study findings will be discussed and conclusions will be drawn with the purpose of addressing the various challenges posed by the increasing penetration of RES in the Ghana grid and the lack of flexibility of baseload power plants.
The following sections detail our study comprehensively. Section 2 elucidates the outcomes of the requirements’ review pertaining to the research topic, encompassing the requisites for Ghana’s power grid control, the load-following of SMRs, SMRs’ reactive power control capability, and the microgrid concept. Section 3 outlines the study methodology. Section 4 presents simulation results and corresponding discussions. Finally, Section 5 summarizes the study’s findings and implications.
2. Literature Review
2.1. Requirements for the Electric Power System’s Stable Operation
Voltage and frequency are the two significant parameters of the electric power system. This study focuses on the frequency component in the electric power system. In order for a power system to operate in a stable manner, frequency control is fundamental in the supply and demand matching operations.
In order to keep the expected operating conditions and supply energy to all the users (loads) connected, it is important to control these two parameters within predefined limits, to avoid unexpected disturbances that can create problems to the connected loads or even cause system failure [7]. The most commonly used nominal frequency (Fn) in power systems is 50 Hz (Europe, Africa, and most parts of Asia) and 60 Hz (North America). In line with the above, historical circumstances and technological constraints were the factors that influenced this decision. Ghana’s grid code sets the required grid frequency at 49.8–50.2 Hz [3]. But in general, when the frequency ranges from 47.5 Hz to 51.5 Hz, it is called an emergency condition, while as soon as the system operates in a range of frequency Fn ± 0.1 Hz, it is in the standard conditions. In general, the acceptable voltage margin is +/− 5 ranges from 95 to 105% as the allowable range. For grid control stability, it is necessary to adjust the voltage levels at the generator terminal with the acceptable limit, and this can be achieved through primary and secondary voltage control.
2.2. Primary Voltage Control
When there are changes in load or disturbances, the generator’s automatic voltage regulator (AVR) immediately modifies the primary voltage. In order to keep the generator’s terminal voltage within allowable bounds, this control mechanism works quickly by modulating the excitation current or field voltage using the AVR. It guarantees the system’s stability in the event of unexpected changes in load or malfunctions.
The generator responds more quickly to variations in demand and preserves system stability in real time when the primary control loop keeps voltage within a predetermined range. This is essential for maintaining transient stability and averting voltage collapse in the event of abrupt disruptions or variations in load [8].
2.3. Secondary Voltage Control
Compared to primary control, secondary voltage control operates on a longer timescale. It entails coordinating several generators or control systems inside the power network and using more complex control procedures. Secondary control, as opposed to primary control, is concerned with preserving long-term voltage stability and returning the system voltage to its nominal value following large disruptions. Primary control reacts to changes instantly.
Power system stabilizers (PSSs), additional control devices, and automatic voltage regulator (AVR) set-point modifications are examples of secondary voltage control techniques. By modifying the generators’ set-points or control settings, these systems, which usually work in tandem with automated generation control (AGC), attempt to bring the system back to a steady state and guarantee long-term stability [8].
2.4. SMR Reactive Power Compensation
The reactive power flow to and from the SMR plays a pivotal role in voltage stability. According to the IEEE C57.116™-2022 standard, the main generator (MG) should have the capability of providing reactive power to the grid as well as absorb any reactive power from the power system in order to maintain the grid voltages within the acceptable limits [9]. The generator mostly supplies both active and reactive power to the grid by operating at a lagging power factor (PF).
In a highly penetrated RES grid, the SMR performs reactive power compensation within the generator’s reactive power capability from 0.95 pf leading to 0.85 pf lagging. Figure 1 shows the generator operation thermal limits under which it operates [9]. The three limits are the stator heating, the overexcited, and the under-excited limits. The turbine capability limits the generator megawatt (MW) output. The voltage magnitude difference between generator voltage and system voltage determines the reactive power flow. The generator is rated at 13.8 kV, with an allowable variation of ±5% of the rated voltage. Therefore, the reactive power range was primarily considered in the selection of the impedance and turns ratio of the MT. This study assumes that the SMR is installed in a finite grid with high RES and is therefore capable of influencing the grid voltage on a need basis.
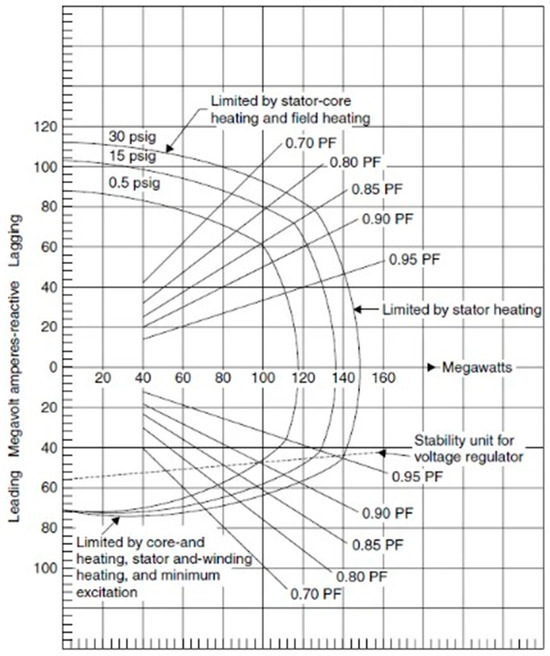
Figure 1.
Capability curves of synchronous generator.
2.5. Requirements for the Load-Following Operation of SMRs
In essence, load-following means modifying power generation such that it matches the predicted power demand as precisely as possible. By adjusting output in accordance with a predefined plan or in response to commands or signals from the grid control centre, this kind of generation can synchronize with demand [10]. Based on the assessment above, the following are typical requirements for each SMR load-following mode.
- (a)
- Scheduled Operation
This has to do with consciously controlling power plant production, which can be anywhere between 20% and 80%, in line with the power supply and demand plan. Output control has a timescale of hours or even days. Reactor maintenance or recuperation may occasionally need the reactor’s output to be fine-tuned to the 20% to 80% range; in these cases, the timescale is usually expressed in hours. Over time, the output power manoeuvring range varies. The power can be changed between 100% of the nominal output and about 25% of the nominal power during the first 65% of the fuel cycle. But as the fuel cycle goes on, rising excess reactivity and falling boron concentrations cause the power control range to gradually shrink from 25% to 80% of nominal power. Although nuclear power plants can operate at a minimum power level of 10%, the realistic minimum output usually falls between 20% and 25%, similar to many conventional power plants [11].
- (b) Unforeseen Operation
This refers to a scenario where the output of the power plant is modified in response to grid conditions rather than being preplanned. Load-following operates by controlling the nuclear reactor’s output between 20% and 80% of its total output. The Transmission System Operator (TSO) instruction process takes place in a matter of minutes [12].
2.6. Power Change Dependent on Grid Plans
This is typically some percentage of the rated thermal power. The power changes can be obtained through Automatic Generation Control (AGC) and Governor-Free Control (GF) [5].
- Automatic Generation Control (AGC)
It involves the automatic modulation of plant output within a restricted range based on signals from the TSO. This mode of operation is commonly known as AGC. Power adjustments typically fall within a range of 20~40% of the rated thermal power (RTP), with timescales measured in minutes [13].
- 2.
- Governor-Free (GF) Control
This entails controlling frequencies that go outside a set frequency range. When the system frequency rises over the higher limit, it involves utilizing the turbine governor to decrease the generator output; when the system frequency falls below the lower limit, it involves increasing the output. The plant operator has the option to manually or automatically initiate frequency control in response to frequency variations. Most of the time, the power adjustment is made in seconds and typically occurs in the range of 20–40% of the RTP or ±10% of the RTP [13], and the timescale is in seconds.
2.7. Power Change Dependent on Active and Reactive Power
It is necessary to control the SMR’s output before it may perform load-following activity. SMRs are able to regulate their output by varying the reactor power level; this can be achieved using a variety of systems and mechanisms, as shown in Figure 2 [14].
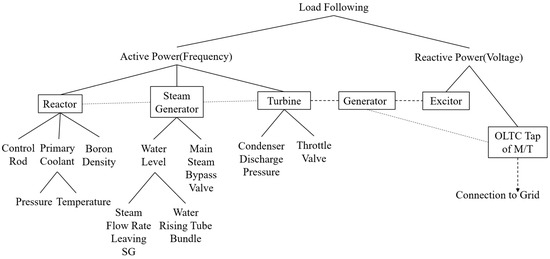
Figure 2.
Control hierarchy for the load-following of PWR nuclear power plants.
- (a)
- Control Rods
To obtain the required output power level of the SMR, the control rods can be removed from the core as needed. Inside the reactor, the control rods are used to regulate the nuclear chain reaction. The reactor’s power output decreases when the control rods are placed into the reactor core. By removing the control rods, we boost power output by allowing more neutrons to engage in fission [15].
- (b)
- Coolant Flow Control
An SMR has the ability to regulate the flow rate, which affects how quickly heat is evacuated from the reactor core, by changing the flow rate of the coolant circulating through the reactor core [16]. The reactor will heat up and produce more power if the coolant is slowed down. An increase in the temperature of the reactor coolant introduces feedback and reduces reactor power [1].
- (c)
- Turbine and Generator Control
The power output to the grid can be changed by varying the load on the generator. Through the use of a steam turbine and generator, the power from the reactor can be transformed into electricity. By doing so, the SMR is able to change the load on the turbine to correspond with the demand for electricity [17].
2.8. Microgrid
Microgrids are classified based on their mode of connectivity to the main grid, their intended application, and the source of energy they are providing to support the power system they are connected to. Different types of microgrids have different designs based on their application, the energy demand, and their mode of operation. In this research, the focus is on the grid-connected microgrid.
Grid-connected microgrid: The grid-connected microgrid maintains a connection to the main electrical grid, but can function independently as needed. Its main goal is to make the electrical grid overall more dependable, efficient, and sustainable [18]. The microgrid with grid connectivity exhibits significant characteristics, such as its responsiveness to demand, enhanced frequency and voltage stability, bidirectional energy flow, improved grid resilience, and the integration of renewable sources [19]. Figure 3 shows a typical scheme of the grid-connected microgrid [20].
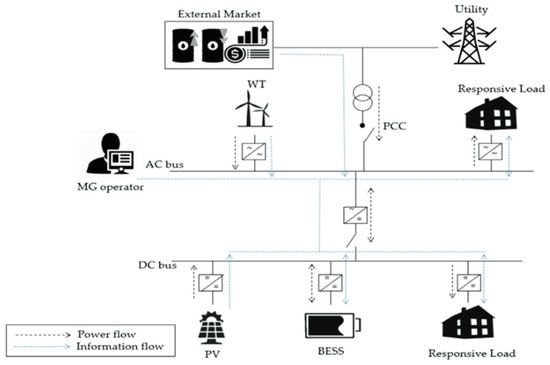
Figure 3.
Typical scheme of the grid-connected microgrid.
3. Methodology
This research proposes the installation of an SMR power plant in Sekondi Takoradi district, Ghana. Sekondi Takoradi is a densely populated urban area with high commercial and industrial loads. It is located 318 km from Akosombo power station, which has an installed capacity of 1033 MW.
The area often suffers from frequent load management by load shedding due to voltage stability issues. The area is also supplied with grid-connected renewable energy from small-scale RES power stations. The power generation and consumption data for the area of study were obtained from Ghana’s electrical grid operator. The map of the area under study, which was derived from the Political Map of Ghana on the One World-Nations’ website, is shown in Figure 4 [4].
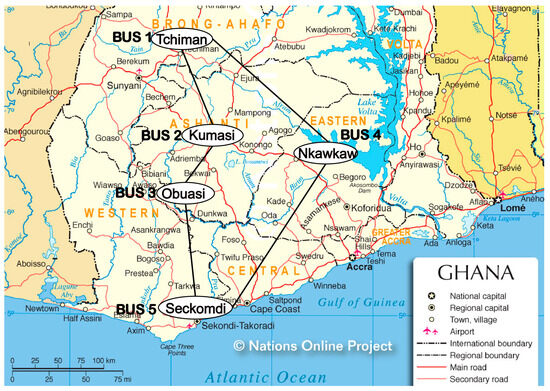
Figure 4.
The map of the area under study in Ghana.
The energy demand (energy mix) for Ghana by 2040 is estimated to grow to 13,100 MW according to the Ghana Energy Transitions and Investment Report. The share of renewable energy is estimated at 10% (1310 MW). The region is modelled with 3% RE penetration at 39.3 MW.
3.1. Configuration of IEEE 5-Bus System in ETAP
In this research, this area is modelled by lumping the generating stations and load centre into the IEEE 5 bus system, as illustrated in Figure 5. The average demand and supply data for the buses in the model were obtained from Ghana’s transmission and generating station databases. Bus 1 is considered as the slack bus where the area network links to the national grid at the Techiman capital where the transmission substation is located. The Sekondi Takoradi capital often suffers from voltage-stability-related outages whenever system disturbances occur. The adjacent load centres have additional grid-tied renewable energy generations, with the most significant RES being the solar power plants. For this reason, the inclusion of an SMR that is capable of varying its power output to match the demand is projected to be capable of mitigating this challenge and consequently ensure that the system retains its stability.
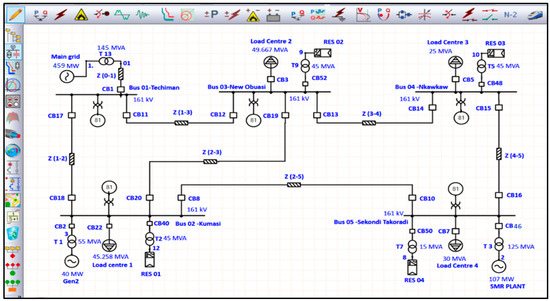
Figure 5.
IEEE 5-Bus system model built on ETAP.
The network is modelled at 161 kV as the transmission voltage, at a frequency of 50 Hz, according to Ghana’s grid code, and the voltage margin is set to +/− 10%. The transmission line distance and impedance were also modelled according to the data provided by the grid operator.
3.2. Evaluation of Grids with a High Penetration of RES
For the purpose of the analysis, it was assumed that switching power electronic devices were used by RES, namely, Solar Photovoltaic (PV) systems, to convert DC to AC voltage. This presumption created questions regarding grid synchronization, possibly making it challenging to keep the RES and the grid’s synchronous generators (SGs) in sync during disruptions. Figure 6 illustrated the contribution of generation sources matching the daily demand of the area under study.
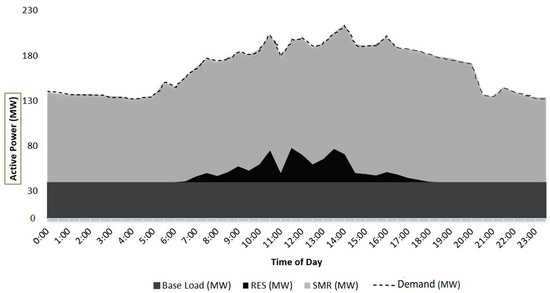
Figure 6.
Contribution of generation sources to meet daily demand.
Figure 6 illustrates the daily demand profile of the study area for 24 h of a day and the contributions of various energy sources. Figure 7 provides an overview of the centralized generation setup featuring high renewable energy sources (RES) in the study. The RES data are obtained from a 39.3 MW solar power plant (see Table 1), while the fixed power supply is sourced from a 40 MW Combined Cycle Plant (CCP) from Kumasi, operating at half capacity when the small modular reactor (SMR) is installed to reduce operational costs. The specific SMR model used in this context is the 107 MW System-Integrated Advanced Modular Reactor (SMART) from Republic of Korea. The small modular reactor (SMR) is engineered to modulate its power output, ranging from 50% to 100% of its rated power (Pr), with a change rate of 3–5% per minute in response to fluctuations in power demand, as detailed in reference [6]. Certain SMRs are even capable of operating at as low as 20% of their rated capacity in load-following mode. The combined load consists of various components, including sensitive, switchable, and controllable loads, all designed to align with the typical dynamic load requirements of the area under study.
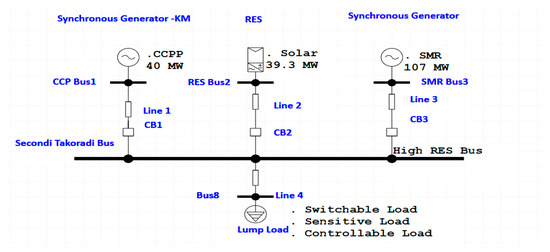
Figure 7.
3% High-RES-integrated generation.

Table 1.
The average supply and demand data for Sekondi Takoradi and adjacent buses.
3.3. Addressing SMR Delays Respond in Output Power Stabilization
From Figure 6, the illustration of the daily demand profile of the study area with the contributions of various energy sources, it was observed that from 11:30 in the morning, the output power of the SMR falls to a low level. SMRs are known for their load-following abilities by changing their output power level to match up with demand, and these changes can be affected once or twice in a day, in a range between 100% or 50%. An SMR can also reduce its power output level below 50%. Controlling the output power level can be achieved by controlling the reactor system, and especially for the PWR reactor, by using the control rod to regulate the nuclear chain reaction. By placing the control rod in the reactor core, the output power level decreases, and by removing the control rod, the output power increases, allowing more neutrons to engage in fission. In this case, the ramping up of the SMR output power will take a long time due to its ramping ratio of 10% per minute. In the event of a situation like this, the Energy Storage System (ESS) would play a vital role in responding to the delay and stabilizing the output power to ensure optimum energy flow in the system, as illustrated in Figure 8.
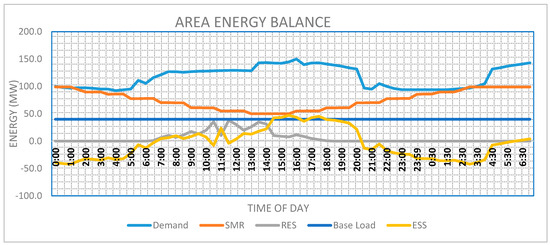
Figure 8.
ESS response to SMR delay in output stabilization.
3.4. Modelling Case Study for Analysis in ETAP
The selected area is modelled in ETAP to analyse the system response when disturbances occur. The disturbances under study are limited to intermittent supply from RES, a sudden ramp in load, and the sudden loading of the network with a large capacity load. The two cases to be analysed for system stability are as follows:
Case-1: Network with RES minimum and maximum contributions.
Case-2: Network with SMR minimum and maximum contributions.
The model is generated in 3 steps before running the simulations for the two cases. The ultimate goal is to demonstrate the contribution of the SMR to voltage stabilization and to establish the power response in the SMR power plant. The steps are as detailed below:
Step 1: Equipment Sizing and Placement on the ETAP Model Editor
The major equipment in the model are the generators, transformers, transmission lines, solar power plants, and frequency relay modules. All other protective and control devices are assumed to be operational according to Ghana’s grid code and IEC standards.
Step 2: Modelling SMR Generator in ETAP for Simulation
An assumption was made that the RES (Solar Photovoltaic) uses switched power electronic devices for the conversion of DC to AC voltage. Switched power electronic devices take time to synchronize with the grid such that it would be impossible to keep the source in step with the synchronous generators (SGs) in the grid whenever disturbances occurred.
An assumption was made that the SMR performs reactive power compensation within the generators’ reactive power capability from 0.95 pf leading to 0.85 pf lagging, according to the IEEE Guide for Transformers Directly Connected to Generators, IEEE Std C57.116-2022 [9]. Figure 1 shows the generator operation thermal limits under which it was set to operate. The stator heating, the overexcited, and the under-excited limits were considered as the three thermal limits in which the generators will operate.
Step 3: Modelling Transmission Lines in ETAP Simulation
The transmission line parameters were obtained from Ghana’s grid operator and are summarized in Table 2.

Table 2.
Transmission line impedance values between the load centres.
The configuration of the area power distribution was performed as shown in Figure 5. The ETAP software (etap 21, Enterprise Solution for Power Systems) model edit menu was used. Typical commercial load centres, typical solar power plants, a typical generator, and the SMR were used to mimic the actual system.
3.5. Load Flow Analysis Simulation for Voltage Stabilization
To conduct large-scale interactive simulations for assessing voltage stabilization in high-renewable-energy-source (RES) grids with SMR support, it is essential to compare the load variation with the bus voltage. By selecting a particular time of the day, simulation can be performed for the case scenarios of RES minimum and maximum and SMR minimum and maximum. The voltage margin is +/− 10%, which means that the bus voltage must be maintained at a minimum of 90% and a maximum of 110% of the rated voltage.
4. Results and Discussion
In this article, it was projected that the voltage stability will probably be significantly impacted by the reactive power flow to and from the SMR. The SMR’s role is to match the deficit power supply arising from the mismatch between demand and supply provided by the RES, small-capacity synchronous-based generator, and the grid. The model used in this study was built based on Ghana’s transmission network in the selected areas which have frequently experienced loss of power supply due to system instability. In most cases, the voltage falls below the acceptable threshold and therefore mitigation is required to keep the system stable. With the presence of RES using switched power electronic devices for the conversion of direct current to alternating current in these areas, these devices take a longer time to synchronize with other generators in the grid [21]. For this reason, a nuclear power plant that can be located near load centres and with load-following capability is recommended to support the grid. A load flow study was carried out, which involves establishing the power system network’s steady-state operational parameters by the application of numerical techniques. Transmission line and bus data were provided to serve as the basis for this investigation. The model’s load flow analysis results are shown in Table 3. The focus is on the contribution of the SMR power plant to the selected power system network. This was undertaken to evaluate the stability of the designed grid in the event that the intermittent RES grid operates at full capacity or loses generation completely.

Table 3.
Load flow analysis report on load centres.
Frequency Response for RE’s Disturbance without Inclusion of SMR to the Power System
As illustrated in Figure 9, Figure 10, Figure 11 and Figure 12 for the voltage stabilization cases, in general, the operating voltage margin is +/−5%. But in this study, the voltage margin is limited to +/−10%. If the voltage present in the buses is less than the system voltage margin, the system will collapse, leading to blackouts in the region under study. It means that the bus voltage must be maintained at a minimum of 90% and a maximum of 110% of the rated voltage. As illustrated in the graphical figures for all four case scenarios, it was established that the voltage present at various buses was operating above the 95% margin and other buses were recording voltage margin of about 100.5%. This shows that the power system is stable and will not need another generator or import power from the grid to support this region, and load shading will not be required. The inclusion of the SMR in this region has also played a vital role in maintaining its operating voltage at above 99.9%, as illustrated in the graphical figure.
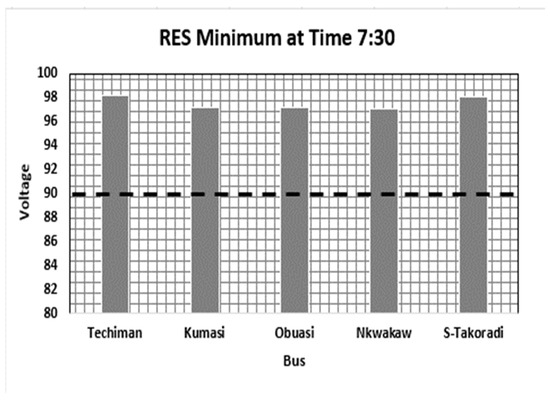
Figure 9.
Case-1. RES minimum at 7:30.
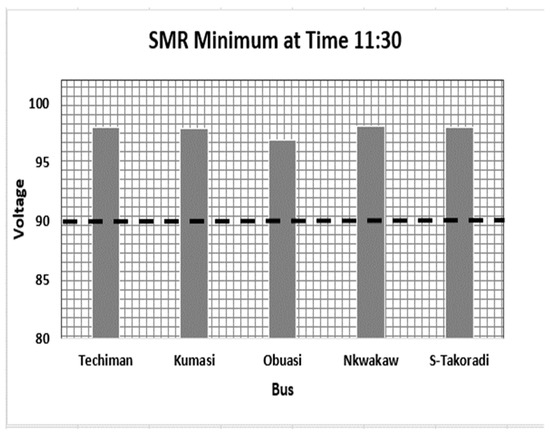
Figure 10.
Case-2. SMR minimum at 11:30.
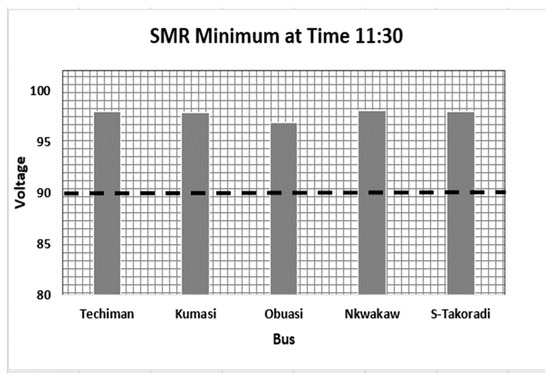
Figure 11.
Case-3. RES maximum at 13:30.
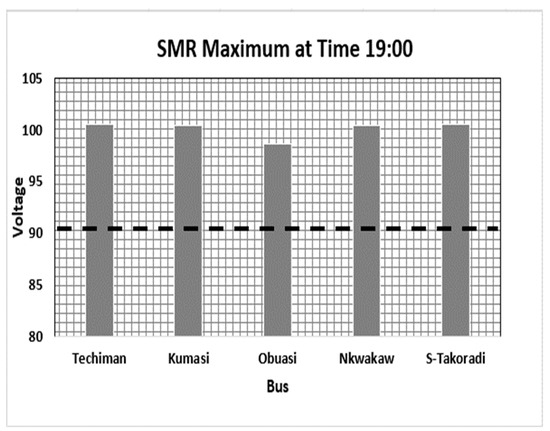
Figure 12.
Case-4. SMR maximum at 19:00.
In addition, a review was carried out on the interaction between an SMR power plant and the RES power grid during load-following operation. Most SMRs with following capability are suitable for use in grids with RES due to their ability to mitigate voltage stability challenges. Voltage stabilization is conventionally achieved through reactor control, turbine control, and generator excitation control. The load flow analysis report obtained from the ETAP software (etap 21, Enterprise Solution for Power Systems) demonstrated conclusively the magnitude of the role played by the SMR in voltage stabilization. Voltages were kept within a stable operating limit despite the changes in system power demand introduced by the intermittent RES and dynamic system load demand.
5. Conclusions
In the quest to achieve electrical power system stability in Ghana, voltage stability is key. In addition, Ghana is keen to meet the net global carbon neutrality target by 2050. For these reasons, generation from renewable energy sources together with nuclear power plants is emerging as a game-changer. In this study, voltage instability was outlined as an existing challenge in high-renewable-energy-penetrated grids that are far away from the main synchronous generator-based power supply. The inclusion of a load-following SMR for active power control was used as a solution to voltage stability in high-RES grids. The standard functional requirements for load-following SMR integration in high-renewable-energy grids and the pitfalls in the integration of SMR to renewable energy grids for the purpose of load-following and voltage stability were outlined and discussed. The proposed methodology for the power system design is feasible since it was able to produce the desired results. From the results of the study, it was deduced that the flexible operations of SMRs in Ghana through electrical power control while maintaining the mechanical power constant mitigate voltage stability issues. Therefore, this study met its objectives.
Author Contributions
G.L.A. wrote the paper and C.-k.C. provided technical review and performed editorial reviews and update. All authors have read and agreed to the published version of the manuscript.
Funding
This research received no external funding.
Data Availability Statement
Data are unavailable due to ethical restrictions.
Acknowledgments
This research was supported by the 2023 Research Fund of the KEPCO International Nuclear Graduate School (KINGS), Ulsan, Republic of Korea.
Conflicts of Interest
The authors declare no conflicts of interest.
References
- Wenisch, A.; Becker, O. NPP Output Flexibility Expectations in the Light of Reality. 2010. Available online: https://pv-magazine-usa.com/wp-content/uploads/sites/2/2017/09/Oko-Institut-flexibility-nuclearpower_final-copy.pdf (accessed on 7 February 2024).
- Akom, K.; Joseph, M.K.; Shongwe, T. Renewable energy sources and grid integration in Ghana: Issues, challenges and solutions. In Proceedings of the 2018 International Conference on Intelligent and Innovative Computing Applications (ICONIC), Mon Tresor, Mauritius, 6–7 December 2018. [Google Scholar] [CrossRef]
- National Electricity Grin Code. 2009. Available online: https://www.energycom.gov.gh/files/National%20Electricity%20Grid%20Code.pdf (accessed on 7 February 2024).
- Oyando, H.C.; Kanyolo, T.N.; Chang, C.K. RNN-Based Main Transformer OLTC Control for SMR Integration into a High Renewable Energy Penetrated Grid. J. Electr. Eng. Technol. 2023, 18, 0123456789. [Google Scholar] [CrossRef]
- Locatelli, G.; Boarin, S.; Pellegrino, F.; Ricotti, M.E. Load following with Small Modular Reactors (SMR): A real options analysis. Energy 2015, 80, 41–54. [Google Scholar] [CrossRef]
- Chang, C.K.; Oyando, H.C. Review of the Requirements for Load Following of Small Modular Reactors. Energies 2022, 15, 6327. [Google Scholar] [CrossRef]
- Meng, L.; Zafar, J.; Khadem, S.K.; Collinson, A.; Murchie, K.C.; Coffele, F.; Burt, G. Fast Frequency Response from Energy Storage Systems—A Review of Grid Standards, Projects and Technical Issues. Available online: https://pureportal.strath.ac.uk/files/100773736/Meng_etal_ IEEE_TSG_2019_Fast_frequency_response_from_energy_storage_systems.pdf (accessed on 9 February 2024).
- Anderson, G. Dynamics and Control of Electric Power Systems. Lecture 227-0528-00, ITET ETH. 2012, pp. 36–46. Available online: https://citeseerx.ist.psu.edu/document?repid=rep1&type=pdf&doi=4e667f31c50bc898e49d553e2fe7f596523bf40d (accessed on 9 February 2024).
- IEEE Std C57.116-2022; IEEE Guide for Transformers Directly Connected to Generators. IEEE Power and Energy Society: Piscataway, NJ, USA, 2022.
- Nations Online Project. Political Map of Ghana. One World-Nations. 2021. Available online: https://www.nationsonline.org/oneworld/map/ghana_map.htm (accessed on 6 February 2024).
- Karampelas, P.; Ekonomou, L. (Eds.) Electricity Distribution; Intelligent Solutions for Electricity Transmission and Distribution Networks; Springer: Berlin/Heidelberg, Germany, 2016; Available online: http://www.springer.com/us/book/9783662494325 (accessed on 3 December 2023).
- IAEA. System-Integrated Modular Advanced Reactor (SMART). 2011, pp. 1–36. Available online: https://aris.iaea.org/PDF/SMART.pdf (accessed on 6 February 2024).
- IAEA (International Atomic Energy Agency). Non-Baseload Operation in Nuclear Power Plants: Load Following and Frequency Control Modes of Flexible Operation; IAEA Nuclear Energy Series; IAEA: Vienna, Austria, 2018; pp. 1–190. [Google Scholar]
- Chang, C.-K.; Lord, A.G. Flexible Operation of Nuclear Power Plants from the Perspective of Electric Power Systems. In Proceedings of the ICAPP 2023, Gyeongju, Republic of Korea, 23–27 April 2023. Paper 2023185. [Google Scholar]
- Lamarsh, J.R.; Baratta, A.J. Introduction to Nuclear Engineering, 3rd ed.; Prentice-Hall, Inc.: Hoboken, NJ, USA, 2001; p. 327. [Google Scholar]
- The Sustainable Nuclear Energy Technology Platform, Nuclear Energy Factsheets Load Following Capabilities of Nuclear Power Plants. Available online: https://snetp.eu/wp-content/uploads/2020/05/SNETP-Factsheet-7-Load-following-capabilities-of-nuclear-power-plants.pdf (accessed on 6 February 2024).
- IAEA. Introduction Nuclear Power Systems of Limited Capacity: Problem and Remedial Measures No 217. 1987. Available online: https://www.iaea.org/publications/1374/introducing-nuclear-power-plants-into-electrical-power-systems-of-limited-capacityz (accessed on 7 February 2024).
- Fan, H.; Yuan, Q.; Cheng, H. Multi-objective stochastic optimal operation of a grid-connected microgrid considering an energy storage system. Appl. Sci. 2018, 8, 2560. [Google Scholar] [CrossRef]
- Bruynooghe, C.; Eriksson, A.; Fulli, G. Load-Following Operating Mode at Nuclear Power Plants (NPPs) and Incidence on Operation and Maintenance (O&M) Costs. Compatibility with Wind Power Variability; European Commission: Brussels, Belgium, 2010. [Google Scholar]
- Lee, J.-W.; Kim, M.-K.; Kim, H.-J. A Multi-Agent Based Optimization Model for Microgrid Operation with Hybrid Method Using Game Theory Strategy. Energies 2021, 14, 603. [Google Scholar] [CrossRef]
- Maza-Ortega, J.M.; Acha, E.; Garcia, S.; Gomez-Exposito, A. Overview of power electronics technology and applications in power generation transmission and distribution. J. Mod. Power Syst. Energy 2017, 5, 499–514. Available online: https://ieeexplore.ieee.org/stamp/stamp.jsp?tp=&arnumber=8940984 (accessed on 7 February 2024). [CrossRef]
Disclaimer/Publisher’s Note: The statements, opinions and data contained in all publications are solely those of the individual author(s) and contributor(s) and not of MDPI and/or the editor(s). MDPI and/or the editor(s) disclaim responsibility for any injury to people or property resulting from any ideas, methods, instructions or products referred to in the content. |
© 2024 by the authors. Licensee MDPI, Basel, Switzerland. This article is an open access article distributed under the terms and conditions of the Creative Commons Attribution (CC BY) license (https://creativecommons.org/licenses/by/4.0/).